Submitted:
27 May 2024
Posted:
28 May 2024
You are already at the latest version
Abstract
Acute lower respiratory tract infection is a major health problem that affects more than 15% of the total population of Saudi Arabia each year. Epidemiological studies conducted over the last three decades have indicated that viruses are responsible for the majority of these infections. The epidemiology of respiratory viruses in Saudi Arabia is believed to be affected mainly by the presence and mobility of large numbers of foreign workers and the gathering of millions of Muslims in Mecca during the Hajj and Umrah seasons. Knowledge concerning the epidemiology, circulation pattern, and evolutionary kinetics of respiratory viruses in Saudi Arabia are scant, with the available literature being inconsistent. After reviewing the available data on epidemiology and evolution of respiratory viruses, this study examines the effect of varying vaccination rates across different age groups during the 2019/2020 influenza season in Saudi Arabia. Utilizing an age-structured SEIR (Susceptible–Exposed–Infectious–Recovered) model, it develops customized vaccination policies by considering age-specific incidence rates. This pioneering research segments the population into five age groups—infants and school-aged children, junior and older youth, young adults and adults, middle-aged, and seniors—across five regional areas in Saudi Arabis: Eastern, Central, Northern, Western, and Southern. A contact matrix, compiled from multiple sources, is used to delineate the dynamics of influenza transmission. The study undertakes a thorough comparison of three distinct vaccination scenarios: no vaccination, national vaccination, and optimized vaccine allocation policy, under various potential pandemic situations. It examines their impact on vaccination campaigns in terms of the total number of infections, mortality, and morbidity rates. The results emphasize the crucial impact of population demographics on disease transmission and vaccine distribution. According to the findings, the optimized vaccination scenario proved to be the most effective strategy in all scenarios.
Keywords:
Controlled Elitism Non-Dominated Sorting Genetic Algorithm
; CENSGA
; MOSA
; Multi-Objective Simulated Annealing
; metaheuristic
; multi-objective optimization
; Pulse vaccination
; allocation
; scheduling
; Saudi Arabia
; SEIR
1. Introduction
Saudi Arabia, formally recognized as the Kingdom of Saudi Arabia (KSA), is located in the Middle East, occupying most of the Arabian Peninsula. With an area of approximately 2,150,000 square kilometers (830,000 square miles), it ranks as the fifth-largest nation in Asia and the biggest in the Middle East. The country shares its borders with the Red Sea to the west; Jordan, Iraq, and Kuwait to the north; the Persian Gulf, Qatar, and the United Arab Emirates to the east; Oman to the southeast; and Yemen to the south, with Bahrain lying as an island nation off its eastern shore. The Gulf of Aqaba to the northwest separates it from Egypt. Notably, Saudi Arabia is the sole nation featuring coastlines along both the Red Sea and the Arabian Gulf. The landscape predominantly comprises arid deserts, lowlands, steppes, and mountainous areas. Riyadh serves as its capital and largest city, and it is home to Mecca and Medina, the two most sacred cities in Islam.
Influenza represents a significant concern worldwide, highlighted by the World Health Organization's (WHO) Global Influenza Strategy for the years 2019 to 2030 [1], which identifies it as a worldwide hazard. The strategy emphasizes the critical role of national prevention and control efforts in meeting its objectives. A key aspect of these efforts includes the enhancement of Influenza surveillance as a fundamental activity for control and preparedness against future pandemics. The Kingdom of Saudi Arabia (KSA) pays particular attention to the surveillance of such diseases prone to outbreaks [2], especially considering the mass convergence of Muslims from across the globe for the annual Hajj and Umrah pilgrimages. Consequently, the Saudi Public Health Authority has set up a National Influenza Surveillance System. The ongoing assessment and initial review of these programs are crucial for enhancing their effectiveness and quality.
Saudi Arabia reported cases of Acute Lower Respiratory Tract Infection (ALRTI) affecting more than 5 million people, or 15.4% of its population in 2013. The spread, development, and patterns of respiratory virus transmission in the country are influenced by two primary factors. Firstly, the influx of over 11.9 million international workers from more than 100 countries, attracted by the Saudi's stable economic and welfare system; the frequent travel of such a large workforce between Saudi Arabia and their home countries potentially facilitates the introduction of new viral strains. Secondly, the annual convergence of over 10 million Muslims from around 184 countries to the holy cities of Mecca and Medina for the Hajj and Umrah pilgrimages is another critical factor. This gathering significantly impacts the epidemiology of respiratory viruses within the region [3]. Further, Saudi Arabia belongs to Gulf Cooperation Council (GCC) countries, Gulf countries are centers for expatriates, who make up over half of the population, with a significant number coming from East and South-East Asia [4].
A comprehensive study covers Middle East and North Africa (MENA) countries with cases reported from sixteen counties since April 2009 to December 2017 (total of 563,087 cases) indicated that the overall influenza positive cases accounted for 23% of all respiratory infections, with A/H1N1pdm09 being the dominant virus (50.8%) . The MENA region falls within West Asia and North Africa influenza transmission zones. Based on this classification, countries within the same geographical group show similar influenza transmission patterns ([5], pp. 2009–2017).
Respiratory diseases linked to seasonal influenza are responsible for approximately 290,000 to 650,000 deaths worldwide each year [6]. The rapid evolution of influenza viruses, due to mutations, enables them to evade the immune system's natural or vaccine-induced defenses. This process, known as antigenic drift, is a leading cause of the annual influenza outbreaks that significantly contribute to human morbidity and mortality, thus overwhelming healthcare services. Besides antigenic drift, influenza viruses also undergo genetic reassortment, which has led to the emergence of life-threatening pandemics on several occasions [7]. The last century witnessed three pandemics caused by influenza A: the 1918 H1N1, 1957 H2N2, and 1968 H3N2. In June 2009, the WHO declared the first pandemic of the twenty-first century, triggered by a swine-origin H1N1 (A/H1N1pdm09) virus, accounting for over 250,000 deaths globally ([5], pp. 2009–2017), [7]. Since then, the A/H1N1pdm09 virus has supplanted the seasonal H1N1 virus and now circulates alongside H3N2 and influenza B viruses. Only influenza type A viruses are known to have caused pandemics [6].
Every year, the World Health Organization (WHO) selects virus strains that are most likely to ensure the effectiveness of vaccines, announcing its recommendations for the northern hemisphere in February and for the southern hemisphere in September [8]. In the wake of the 2009 pandemic, unparalleled surveillance initiatives were initiated to track influenza viruses from both a molecular and epidemiological standpoint. Since 2012, the Ministry of Health initiated the Health Electronic Surveillance Network (HESN), an online surveillance system that links together all healthcare facilities across the Kingdom [2]. In 2017, Saudi Arabia expanded its surveillance program for influenza and other respiratory pathogens by lunching Sentinel Surveillance Program to monitor the influenza activities both locally and internationally, then planned its national influenza control strategies [9]. This helped to enhance the healthcare system's readiness to combat seasonal, zoonotic, and pandemic influenza risks to both communities and individuals. Saudi Arabia implemented a number of vaccination policies.
Current seasonal influenza vaccines, depend largely on the WHO's annual forecasts and advice, formulated by influenza specialists. These predictions are grounded on the identification of circulating influenza strains worldwide, 6 to 9 months prior to the intended season. However, this approach has limitations, such as the potential for strain mismatches, which can significantly compromise the vaccine's effectiveness [10]. A recently conducted research revealed that there were vaccine mismatches in approximately half of the influenza seasons from 2010 to 2020 [11]. Differences in antibody specificity related to age are frequently observed among humans of various ages, who have unique immune system histories [10].
The national influenza vaccination programs in Saudi Arabia recommend mass vaccination for all age groups. Saudi’s Health Minister lunched the influenza vaccination campaign in September until the ends of March of the following year. The season of 2019/2020 was among the critical and devastating seasons that witnessed the early stages of the COVID-19 pandemic, with uncertainty in influenza vaccine effectiveness (VE).
In this study, we investigate the impact of applying vaccination rate differently on the age groups. To the best of knowledge, this is the first study to propose the best vaccination policies for age groups based on the 2019/2020 influenza cases in the Kingdom of Saudi Arabia. We develop an age-structured SEIR model of the 2019/2020 influenza season based on published settings. Then, we divide the entire population into five age groups considering the age-specific incidence rate and life pattern. The age-dependent transmission rates are estimated using the epidemic data reported in a collection of published works covering the five main regions of Saudi Arabia. The contact matrix between age groups, describing the main characteristics of the influenza transmission, was projected from multiple contact matrices. The study conducts an in-depth analysis of three different vaccination scenarios: no vaccination, national vaccination, and an optimized vaccine allocation policy designed to minimize both the number of infections and the costs associated with a vaccination campaign. It explores how increasing vaccination coverage can help curb the spread of infection within the target population across various potential pandemic scenarios. The impact of these strategies is examined on different age groups and at both national and regional levels.
This paper is structured into several key sections to comprehensively present the research. Following this introduction, the Literature Review section reviews prior studies and sets the theoretical foundation for the current research. The Problem Statement section delves into the specifics of planning and allocating the seasonal influenza vaccine. The Materials and Methods section details the comparative analysis of three vaccination scenarios: no vaccination, national vaccination, and optimized vaccine allocation. Results and Discussion are combined to highlight the impacts of these strategies on various age groups and on both national and regional scales, while also interpreting these findings and discussing their implications for public health policy and pandemic management. Finally, the Conclusion summarizes the key findings and proposes directions for future research.
2. Literature Review
The distribution of vaccines, particularly influenza vaccines, based on age group population is a critical aspect of public health planning. Studies have shown that age-specific factors play a significant role in vaccine uptake and effectiveness. For instance, Galarce et al. [12] found that A(H1N1) vaccination rates were strongly associated with age, urbanicity, and perceptions of vaccine safety. The literature on vaccination rates in Saudi Arabia spans various infectious diseases and age groups. Herzallah et al. [13] found that influenza A H1N1 infection was more common in younger age groups and more severe among pregnant women in Eastern Saudi Arabian hospitals. Multiple studies analyzed the prevalence of A(H1N1) infection [17,18,19] and vaccination coverage [24,25,26] in different regions of Saudi Arabia, showing various infection characteristics and uptake rates among different age groups.
Prioritizing vaccine allocation among different age groups is addressed in the work of Galvani et al. [30], who developed an optimization model for influenza vaccine distribution based on age groups. They stratified the population into 16 age groups and prioritized vaccine allocation accordingly. Enayati et al. [31] contributed to optimizing vaccine distribution by proposing an equity constraint to ensure fairness in vaccine allocation decisions among heterogeneous populations. This approach is supported by the findings of Shim [32], who emphasized the importance of considering age-specific factors such as contact rates and vaccine efficacy to minimize infections, deaths, and years of life lost in vaccine allocation strategies. Aro et al. [33] observed age-specific HPV type distribution in cervical disease, highlighting the need for tailored vaccination strategies based on age groups. Worsham and Jena [34] focused on optimizing vaccine allocation at different points in time, studying the optimal timing of influenza vaccination in young children to determine the most effective strategies for vaccine distribution. Additionally, Han et al. [35] proposed time-varying optimization models for vaccine prioritization, where vaccines are allocated proportionally to the unvaccinated susceptible population in each age group to maximize the impact of vaccination efforts.
Various studies have explored the use of multi-objective optimization techniques to enhance vaccine distribution and allocation. Minoza et al. [36] developed a multi-objective linear programming model to optimize vaccine distribution in an age-stratified population. Alkhamis and Hosny [37] introduced a Controlled Elitism Non-Dominated Sorting Genetic Algorithm model in the context of influenza vaccination policies to optimize vaccine allocation. Additionally, Alkhamis and Hosny [38] continued their research by using a Multi-objective simulated annealing algorithm to tackle the design of optimal vaccination sequences and distribution plans, aiming to improve overall vaccine effectiveness. In the context of COVID-19 vaccines, Briffoteaux et al. [39] used multi-objective optimization approaches to distribute vaccines among age categories of the population, emphasizing the importance of equitable distribution based on age. Moreover, Mohammadi et al. [40] developed mixed integer programming modelling to prioritize the population for vaccination based on limited vaccine supply.
Overall, optimizing flu vaccine distribution based on age group population requires a comprehensive understanding of age-specific factors, vaccine efficacy, and perceptions to maximize population benefits and ensure equitable access to vaccines. Utilizing advanced modelling techniques, such as multi-objective optimization can maximize the impact of vaccination campaigns and reduce the burden of influenza-related illnesses.
3. Problem Statement
The problem this research seeks to address is vaccination strategy planning and allocation for the seasonal influenza vaccine. The research follows the duration of influenza in the northern hemisphere, which commonly starts at the beginning of October and lasts until the end of May. The period of the influenza season lasts 30-35 weeks in total. In epidemiology, it corresponds to week 40 of the year, which roughly refers to the start of October as week 1 (t = 1) [41]. Usually, vaccines are ready for distribution in July or August. However, the US Centre for Disease Control and Prevention (CDC) recommends that vaccination campaigns should begin early in the autumn (i.e., September, October, and November), before the flu season begins, which starts in October and peaks between December and February. As such, vaccination campaigns should begin in anticipation of waning immunity before the end of the flu season (i.e., as late as May).1
Vaccination serves as the primary preventive strategy against seasonal influenza, aiding in curbing its spread. In Saudi Arabia, health authorities provide seasonal influenza vaccines (SIV) to all residents, including non-citizens, at no cost. Due to a significant rise in influenza cases and influenza-like illnesses (ILIs), the Ministry of Health (MOH) has encouraged the public to get vaccinated at primary healthcare centers (PHCs) [22]. The MOH has noted a substantial increase in the number of influenza cases and ILIs in the 2022 flu season compared to previous years, suggesting an increased strain on the Kingdom's healthcare system [42]. World Health Organization (WHO) surveillance reports show a dramatic increase in the percentage of positive influenza cases, and the numbers of ILIs and severe acute respiratory infections (SARIs) rose from 3.75%, 45, and 82 in 2021 to 25.11%, 344, and 303 in 2022, respectively [43]. The decrease in ILI and SARI cases in 2021 is credited to successful campaigns for the simultaneous COVID-19 and seasonal influenza vaccinations during the pandemic. Conversely, the spike in ILI and SARI cases in 2022 is likely due to reduced adherence to preventive measures after COVID-19, and potentially, to an increased reluctance to receive the seasonal influenza vaccine (SIV) [22].
Saudi Arabia initiated a large-scale vaccination drive, distributing 4.5 million doses during the 2019/2020 season. This period saw a notable rise in influenza activity from October to January in various Western Asian countries, including Saudi Arabia, primarily due to the widespread presence of the A(H1N1)pdm09 strain [44]. Given that the A(H1N1)pdm09 strain was the cause of a global pandemic a decade ago, the possibility of a pandemic or outbreak remains significant. Since that time, the A(H1N1)pdm09 strain has been included in the Seasonal Influenza Vaccine (SIV) [45]. The government's strategy ensures uniform vaccination coverage across all age groups and regions, with particular emphasis on high-risk populations such as children, pregnant women, the elderly over 65, and those with chronic conditions. However, this approach does not account for regional disparities, including areas recognized as holy, densely populated, hubs, and rural. Variations in climate and geographical landscape across regions influence social behaviors, people's interactions, the influx of international visitors or residents, and crucially the types of viruses circulating and the transmissibility of infections.
This research aims to investigate the impact of various vaccination campaigns on the total number of infections, as well as mortality and morbidity rates. It considers three different vaccination approaches: no vaccination, a government-led campaign, and an optimized campaign, across several basic reproduction number (R0) scenarios. The study is designed to address critical questions regarding the efficiency of optimal vaccination policies, including: (1) The effectiveness of the national influenza vaccination campaign, (2) The appropriate amount of vaccine distribution among different groups and the temporal adjustments required for vaccination rates, and (3) The efficacy of an optimal vaccination strategy across diverse geographical areas, or whether there is a necessity to tailor prioritization of age groups specifically for each region.
4. Materials and Methodology
4.1. Mathematical Model
The traditional SEIR framework was adapted to create an age-specific model for the 2009 A/H1N1 influenza outbreak [38]. The population was segmented into five distinct age categories, with each category, denoted as i ∈ {1, 2, 3, 4, 5}, comprising six segments: Susceptible (Si), Vaccinated (Vi), Exposed (Ei), Infectious (Ii), Hospitalized (Hi), and Recovered (Ri). Susceptible (Si) are at risk of exposure to the virus through direct interaction with infectious persons (Ii where i = 1, ..., 5) or via respiratory droplets from an infected person's cough [46]. The transmission rate from an infectious individual in group j to a susceptible individual in group i is symbolized by βij. Once exposed, individuals enter an infectious phase following an incubation period, with a transition rate denoted by k, where 1/k signifies the average incubation duration. Exposed individuals progress to the symptomatic infectious state (Ii) at a rate of kEi. Recovery from the infectious stage occurs at a rate of γ1, though there is a chance for serious health complications to arise at a certain rate a. Hospitalized individuals are anticipated to recover at a rate of γ2. The model includes parameters for birth/death rate μ, vaccination and immunity rates (e and n, respectively), and the efficacy of the vaccine VE. Thus, this age-based model for the A/H1N1 influenza epidemic is represented through a set of 30 nonlinear differential equations in equation (1).
The subscript for each category denotes a specific age group, with the total population Ni being represented by the sum of Si(t), Vi(t), Ei(t), Ii(t), Hi(t), and Ri(t), distributed across five distinct age groups. Define G as {G1, G2, G3, G4, G5}, where G1 encompasses infants and school-aged children (0–14 years), G2 includes junior and older youth (15–19 years), G3 covers young adults and adults (20–54 years), G4 pertains to middle-aged individuals (55–64 years), and G5 refers to seniors (over 65 years). For any given time t = 1, …, 21, let N(Gi,t) represent the aggregate population within age group Gi during the specific time interval (e.g., week) t.
Saudi Arabia is divided into five main geographical regions: Eastern, Central, Northern, Western, and Southern, which collectively encompass 13 emirates [47], refer to Figure 1.
Given that allocating vaccinations falls into the NP-hard problem category [48], employing metaheuristics offers a viable alternative to the traditional, more time-intensive exhaustive search techniques. The adoption of metaheuristics for this issue is considered an advanced approach for addressing the problem, despite its relatively rare application in this area [37,38,49]. Therefore, we to demonstrate our innovative contribution in this interdisciplinary field by utilizing a specific metaheuristic algorithm, known as CENSGA—MOSA [38], as our proposed approach for problem resolution. The solution optimizer CENSGA—MOSA is derived from the distinguished CENSGA [50,51,52] as a bio-inspired metaheuristic method chosen for its proficiency in navigating the problem space through stochastic processes, facilitated by a selection mechanism that probes the surrounding search area. Moreover, it possesses an intensification feature that identifies and explores the most promising solutions via a crossover mechanism, enabling the algorithm to quickly focus on the optimal solutions. CENSGA incorporates MOSA [38], or Multi-Objective Simulated Annealing, as a local search mechanism. MOSA is renowned for its strong capacity to traverse complicated solution landscapes and uncover a wide array of optimal solutions that span multiple objectives. Its principal strength is its ability to conduct a global search, effectively avoiding local optima to consider a wider array of possible solutions. This attribute is especially beneficial in the context of multi-objective challenges, where it is essential to strike a balance among conflicting objectives.
4.2. Generalized Multi-Objective Formulation
Multi-objective optimization techniques generate a collection of solutions that are equally optimal, known as the Pareto-optimal set or nondominated points. These solutions are crucial when aiming to minimize both the number of infections and the costs associated with a vaccination campaign. Increasing vaccination coverage generally aids in reducing the spread of infection within the target population. Moreover, it is observed that various vaccination strategies can achieve comparable effectiveness in controlling infections. Thus, exploring different vaccination rate combinations to minimize costs while ensuring effective infection control becomes beneficial, particularly when facing vaccine shortages. Providing a spectrum of optimal solutions aids in multi-objective decision-making (MODM), enabling policymakers to choose from multiple effective strategies based on current needs and conditions.
The proposed model in this research generalized the two-phased optimization approach in [37], where:
Phase I: Guardian static control involves static control measures, aimed at keeping the infection rate within acceptable limits over a defined period following Phase II, ensuring the infection volume does not exceed a specified tolerance ratio from an infection-free baseline.
Phase II: Contingent variable control focuses on dynamic variable control, assessing different susceptible ratios for vaccination and the timing between successive policy implementations to halt an outbreak.
The control strategies identified in Phase II are integrated with the optimal policy from Phase I, creating a comprehensive vaccination campaign strategy.
4.2.1. Generalized Formulation of the Guardian Static Control (gc)
The optimal vaccination allocation is defined as a multi-objective optimization problem aimed at minimizing two objective functions:
- F1— cumulative infection;
- F2— vaccination expenses.
The model mainly is constrained by the following conditions:
- ,
- ,
for given values of vmin, vmax, tmin, and tmax.
The guardian static control is expressed through equation (2) and equation (3):
subject to
4.2.2. Generalized Formulation of the Contingent Variable Control (cc)
The optimization model's variables include:
- Ncc indicates number of policies, where Ncc may range from ⌊Ttmp/∆tmax⌋ to ⌊Ttmp/∆tmin⌋;
- The proportions of people susceptible are designated for vaccination in each campaign is: vj, j ∈ {1, 2, …, N}, such that vj = v(τj) for each age group i ∈ {1, 2, …, 5} in τj in Γ = {τ0, …, τN};
- The duration between successive campaigns is: ∆τj;
The constraints are outlined as follows:
- All vaccination rate, vj, is bounded by: for the given vmin and vmax values.
- All time interval between successive campaigns, ∆τj, is limited by: for the provided tmin and tmax values.
The vaccination allocation problem is characterized by two objectives aimed at minimization, which are:
- F1— total infection;
- F2— cumulative cost of vaccination.
The full optimization problem is then presented in the equation (4) and equation (5):
subject to
The cost of vaccination in equation (3) and equation (5) is calculated as the cost of vaccines administered in primary care units, since it does not incur additional costs; thus c1 is set to 1. The second part signifies the per-person economic expense of vaccination that’s estimated by c2 equivalent to USD 8.88 [53]. The latter component denotes the financial expenditure per-person which is calculated by c3, corresponding to USD 3.29 [53].
4.3. Chromosome Representation
For the CENSGA—MOSA [38], a vaccination chromosome is a 1 × |Tcntrl| vector, where each gene in the chromosome shows the proportion of the vaccine allocated to an age group on a specified time interval . In this case, Tcntrl is the upper duration limit of the vaccination campaign. Each gene is a vector of size |G|, t = {, , , , }, where G is the group of ages (recall that there are five age groups) and is the vaccination ratio allocated to the ith group, 0 ≤ vt,i ≤ 1. For the general case, the chromosome representation is illustrated in Figure 2.A. Contrastingly, for the case of spatial (regional) allocation, the chromosome is represented as a |Reg|×|G| matrix containing both vaccination ratio and allocation to regions. In other words, it is the same as the vaccination chromosome of the general case, while an allocation to Reg ∈{ East, Center, North, West, South} regions is also represented. Each gene shows the proportion of vaccines allocated to the ith age group that is located at the Regth region. The regional chromosome representation is illustrated in Figure 2.B.
4.4. Epidemic Data
The population demographics for Saudi Arabia were sourced from the General Authority of Statistics in Saudi Arabia [54], refer to Table 1. The distribution of population across various age groups is represented in Figure 3. The initial conditions for Vi , Ii, Hi, and Ri are set to be zero. The number of infected individuals in each group are set to the actual infected individuals, see Table 3. The total of susceptible individuals within each group is calculated as Si =Ni −Ei where Ni is the number of total population in Group i. Vaccine uptake, mortality (i.e., hospitalization rate and hospital stay), and morbidity rate reflecting actual situation are provided in Table 2 and Table 3. To simulate the initial transmission of Influenza A H1N1 dynamically, the values of 1/γ1 and 1/γ2 are set to 3.38, while k is assigned to 1/2.62 [55]. In general, epidemic parameters were sourced from previous research studies.
Mathematical models are vital for understanding the spread of infectious diseases like Seasonal Influenza and evaluating public health strategies. These models use contact matrices, detailing interactions between individuals, to forecast disease spread. Due to a lack of empirical contact studies in many regions including Saudi Arabia, we designed a diary like survey following the leading work of Hens and Wallinga [56]. The survey was distributed online via email, and Whatsapp under King Saud university ethical approval No: KSU-HU-21-693. Data were collected starting from 19/12/2021 until 19/4/2022. The number of responses was 263. In fact, this research encountered numerous challenges and complexities, particularly because it was conducted after the partial easing of COVID-19 restrictions. At this time, measures such as social distancing, mandatory mask-wearing, and the partial closure of schools were still in place. These factors contributed to uncertainties in the data collected, affecting its reliability. The same conclusion was drawn by Koltai et al [57] were they noted that despite the benefits of online diary/surveys, their reliance on voluntary participation can result in a sample that does not accurately represent the observed population. This can lead to incorrect conclusions about the dynamics of the epidemic.
Therefore, due to timing constraint we employed a synthetic contact matrix found in [58], where the contact matrix of Saudi Arabia and other 177 countries were projected using survey data on the composition of households, schools, and workplaces, and European contact patterns. The study expands a significant compilation of matrices for 152 locations released in 2017 [59]. The work in 2021 [58] expands the matrices for 177 locations and assesses contact patterns in both rural and urban settings. It also compares the updated synthetic matrices with those constructed empirically in 2017 [59] and 2020 [58]. The study finds that the synthetic matrices closely resemble the empirical ones, particularly in predicting outcomes in age groups with insufficient empirical data. This indicates that synthetic matrices are a useful resource for modelling disease outbreaks in regions lacking empirical studies. The transmission rate of Saudi Arabia βij is created from the work of [58]. The subsequent sections thoroughly delve into the discussion of estimating transmission rates.
4.5. Construction of Social Contact Matrix
Prior to exploring the vaccination strategy, we first outline the development of the social contact matrix for all regions. Accurately estimating parameters is crucial for mirroring the spread dynamics of an epidemic. We recognize that variations in incidence rates across age groups stem from differing transmission rates specific to each group. Other factors, like progression and recovery rates, are considered uniform across the board. Furthermore, by presuming equal transmission rates from the rth group to the cth group and vice versa, we establish that the transmission matrix is symmetric.
This work adapts the Saudi’s contact matrix Mrc found in [58], where, the projected contact matrix is based on UN Census with 16 age groups, while the proposed model has 5 age groups and following Saudi Arabia Census. Typically, the contact matrix calls for reconstruction to meet the suggested requirements. The first step is merging the age groups. Then, projecting M’rc from Mrc by transforming Mrc that has been weighted with UN demographic structure NUN with Saudi demographic NS. The process of transformation is called Density correction [60]. The method employed involves adjusting contact matrix Mrc to suit varying demographic structures. This is achieved by modifying the density of potential contacts, a process we articulate through the subsequent equation:
Therefore, the interpretation of the matrix Mrc is:
- The fundamental connection matrix:
- The proportion of people in group c:
It is presumed that an individual's fundamental preference over certain age groups is determined by their own age as reflected in , so the rate of contact is modified based on the contactees in those age groups. The matrix , aside from a universal scaling factor, represents the contact pattern in a "rectangular" demographic setup (a population structure where each age group is equally represented). These country-specific matrices can be derived from survey data through a specific process or from existing social contact matrix using:
Now, equation (6) is rewritten as:
In that way, Saudi’s M’rc were projected from Mrc as follows:
Similarly, from Saudi’s M’rc the symmetric transmission matries is then estimated for Eastern, Central, Northern, Western, and Southern as:
In Figure 4. we represent the contact patterns obtained with Density correction approch for Saudi Arabia, Eastern, Central, Northern, Western, and Southern regions. There is a noticeable huge interaction among individuals within the same age, indicated by the dark color in the main diagonal, espicially for children, youth, and adult groups (i.e., age of school and work). In contarast, the color fades away on the lower half of the main diagonal, indicating fewer interaction within middle-ages and seniors groups. Commonly, interactions within similar age groups tend to be more frequent compared to those with larger age gaps, for instance, interaction between parents and their children or youth, or intaction between siblings. Our projected transmission matrix effectively encapsulates the key characteristics of the transmission dynamics.
5. Results and Discussion
This section addresses the results of the application of SIV, were vaccination campaign starts on October till February of next year (i.e., ≅ 150 days or 21 weeks). The number of distributed doses in 2019/2020 season was 4,500,000 [61] with estimated vaccine efficacy (VE) up to 80.04% [62]. The estimated R0 was between 1.2–3.1 [63]. The nation vaccination policy is compared with two scenarios: no vaccination and the optimized vaccine allocation policy under three values of R0 ∈ {1.2, 2.15, 3.1} on country (a.k.a. Saudi’s) level and provincial/emariats level. The comparison covers three important epidemical factors: infection, morbidity, and mortality rates. In this study we interchangeably use the terms morbidity and hospitalization, mortality and death, and no vaccination and unvaccinated besides flu and Influenza.
5.1. Saudi’s Vaccination Approach
Vaccination campaigns under the currently applied policy (i.e., national policy) and optimized policy illustrated across various R0 values in Figure 5. The curves of vaccination represent the cumulative vaccinations across different age groups. The figures illustrate the national policy’s gradual behavior, characterized by steady steps with a slight decline over time to maintain the necessary vaccination ratio. This ratio, presented in Table 2, is used due to the lack of official data on the actual distribution of vaccine doses after the end of the vaccination campaign. The observations on the optimized policy reflect the optimizer’s tendency towards greediness when dealing with a potential pandemic or outbreak. This is characterized by allocating a large number of vaccines at the beginning, followed by a moderate number of doses, and ending with a low number of doses. A remarkable indication of the two-phased optimization is evident, where the first part of the curves (i.e., 0-50 t.u.) represents the cc phase, while the remaining portion illustrates the gc phase. The optimizer suggests varying numbers of campaigns in cc phase for each R0 value: specifically, 5 campaigns for 1.2 R0 value, 3 for 2.15 R0 value, and 4 for 3.1 R0 value, while it recommends an identical number of campaigns in the gc phase for all R0 value. The change in the optimizer’s behavior is quite clear, shifting from controlling the transmission of the flu infection to maintaining the status quo.
In the case of Saudi Arabia vaccination strategies, a comparative analysis of vaccine ratios on infection, hospitalization, and death numbers over the vaccination period reveals interesting correlations. The data in Table 4, Table 5 and Table 6 show three vaccination scenarios, where the data present numbers in each factor (i.e., infection, hospitalization, and death) and the ratio of these factors to the population, while vaccination ratio is calculated in relation to the total number of allocated vaccine doses.
No vaccination scenario demonstrates growth in all factors by 0.37%, 0.12%, and 0.07% for infection, hospitalized, and death percentages respectively for low pandemic value R0 =1.2. The gap between numbers of infected, hospitalized, and dead individuals continues to rise by 0.67%, 0.21%, and 0.15% for the moderate pandemic value R0 =2.15 and 0.94%, 0.29%, and 0.19% for high pandemic value R0 =3.1. As the severity of the pandemic intensifies, no vaccination strategy significantly outperforms the national policy. This underscores the importance of vaccination as a crucial defense mechanism against the transmission of the flu. However, national policy slightly lags behind optimized policy by 0.02%, 0.03%, and 0.05% for infection, hospitalized, and dead ratios respectively for minimal pandemic number R0 =1.2. In addition, the factors increased by 0.03%, 0.03%, and 0.06% for the moderate pandemic value R0 =2.15 and high pandemic value R0 =3.1 respectively which may indicate a potential area for improvement.
The allocation quota for each group remains unchanged across all R0 values for the national policy. In contrast, the optimized policy adapts different allocation quotas as R0 values increase, refer to Table 4, Table 5 and Table 6. For instance, G1 vaccination ratio varies between 23.01%, 16.02%, and 25.63% respectively for the different R0 values; while G3 ratios range between 51.63%, 65.43%, and 55% based on R0 values. G2, G4, and G5 exhibit the same behavior as well. Overall, the tables reveal a diverse set of priorities among the age groups, with each excelling in different R0 values.
The data from Table 4, Table 5 and Table 6 are visualized as charts in Figure 6, Figure 7 and Figure 8. The analysis of Figure 6, Figure 7 and Figure 8 across the three factors (i.e., infection, hospitalization, and death) reveals a recurring pattern: the unvaccinated scenario represented by the magenta bar consistently stands out as the highest within each group, suggesting that the unvaccinated scenario is the most prevalent on all factors. This trend is observed across all groups, underscoring the unvaccinated scenario’s significance. Conversely, the national and optimized policies (i.e., yellow, and gray bars) depict lower counts and exhibit variability in their relative magnitudes, indicating a diversity in the distribution and impact of the flu transmission among different scenarios within each group. The consistently lower stature of the optimized policy (i.e., gray bar) within each group, especially for the hospitalized and morbidity factors, may indicate a prominent positive trend when compared with other scenarios. This pattern suggests that whatever condition or characteristic the optimized policy represents, it is playing a vital role in maintaining an effective containment of the flu and its impact.
5.1.1. Statistical Analysis
According to the statistical test results reported in Table 7, Table 8 and Table 9, the p-value of the Wilcoxon Rank Sum non-parametric test for all factors is less than 0.05; thus, H0 is rejected for all factors. In this experiment, for each factor, three values of R0 were compared using the nonparametric Wilcoxon Rank Sum test. For each factor, the range of values are presented in Figure 9. Statistical differences were detected in all mean cases according to the p-values presented in Table 7, Table 8 and Table 9. Therefore, it can be concluded that the national policy and the optimized vaccination policy were both proven to be statically better than the no vaccination scenario. The pivotal finding of the study was the outstanding performance of the optimized vaccination policy in all mean factors for different flu transmissions.
It should be noted that Wilcoxon Rank Sum produce Identical p-values when there is a limited number of observations, and all values of the first argument are uniformly less than those of the second argument. Recall, Wilcoxon Rank Sum Test is a non-parametric method that involves merging data from two groups into a single array and then ordering them from the lowest to the highest value. Each data point receives a specific rank, and in cases of ties, an average rank is allocated. After ranking, a sum of ranks for each group is calculated.
5.2. Spatial Vaccination Approach
To evaluate region-specific vaccination scenarios, we calculate the transmission matrix in subsection 4.5 and analyze the efficacy of diverse vaccination strategies in each region. This section focuses on exploring the impact of augmenting vaccine doses. Given the lack of comprehensive data on vaccine distribution, our study investigates the implications of distributing 4,500,000 vaccine doses among populations differing in size and characteristics. The specific parameters guiding this analysis are detailed in Table 2 and Table 3.
5.2.1. Eastern Region
The Eastern Region, or Eastern Province, is situated easternmost among Saudi Arabia’s 13 provinces. It ranks as the largest province by area and the third highest in population, following the Central and Western regions. The population, as reported by Saudi’s census, stood at 5,125,254, comprising 57.6% Saudi citizens and 42.4% foreign nationals.
This study exhibits a parallel approach in vaccine allocation across proposed scenarios as demonstrated by Figure 10, mirroring the methodologies and objectives of the Saudi’s case in its overarching strategy for both scenarios. The optimizer recommends a different number of campaigns for each R0 value in cc phase: 3 campaigns for the initial R0 value, followed by 4 campaigns each for the second and third R0 values. While it advises the same number of campaigns in the gc phase for every R0 value.
The data in Table 10, Table 11 and Table 12, showing a comparative analysis of vaccine ratios on infection, hospitalization, and death numbers over the vaccination period, uncovers notable correlations. No vaccination scenario exhibits an increase across all factors by 0.03%, 0.09%, and 0.06% for infection, hospitalized, and death ratios respectively for low pandemic value R0=1.2. While there is noticeable increase in infection by 0.24%, and 0.42% for the moderate pandemic value R0=2.15 and high pandemic value R0=3.1. The other factors demonstrate stability for the moderate pandemic value R0=2.15, showing no significant changes. In contrast, the high pandemic value R0=3.1 experience a resurgence with hospitalized, and death factors, increasing by 0.36%, and 0.17%, respectively. As the pandemic’s severity escalates, the strategy employed in the first policy significantly surpasses that of the national policy, emphasizing again the vital importance of vaccination in controlling flu spread. Nevertheless, the national policy is significantly less effective than the optimized policy for infection factor showing incline by 0.25%, 0.26%, and 0.27% for the minimal, moderate, and high pandemic values, respectively. The discrepancy between the national and optimized policies is marginally smaller for the other factors. Where, the hospitalized, and dead ratios increased by 0.03%, and 0.04% for the high pandemic value R0=3.1 only.
The national policy maintains a consistent allocation quota for each group regardless of R0 values, while the optimized policy varies its allocation quotas, refer to Table 10, Table 11 and Table 12. For example, the vaccination ratio of G1 changes between 24.83%, 23.87%, to 24.02%, while G3 ratios spectrum between 61.28%, 62.36%, and 63.28% based on R0 values. Similarly, G2, G4, and G5 demonstrate a similar pattern. In summary, the tables display a variety of priorities across age groups, each excelling at different R0 values.
Examining Figure 11, Figure 12 and Figure 13 in relation to the three factors unveils a consistent trend: the optimized scenario, depicted by the gray bars, consistently emerges as the top performer in G1, G2, G3, G4, and G5, indicating its dominance across all factors. This pattern is evident in every group, highlighting the optimized scenario’s prominence. Conversely, the national and optimized policies (i.e., yellow, and gray bars) depict equal count and exhibit similarities in their relative magnitudes for hospitalization, and death factors with low pandemic value R0=1.2, indicating a less sensitivity of all age groups towards these factors with low flu transmission. The persistent superiority of the unvaccinated policy (represented by the magenta bar) in each group, particularly in the hospitalization, and death factors, indicates a less desired and less notable trend compared to scenarios involving the allocation of vaccines. This unequivocally highlights the significance of vaccination, irrespective of the allocation approach.
Statistical Analysis
Again, the statistical analysis on the Eastern region results demonstrates that the optimized policy’s performance is statistically significant, where the p-value of the Wilcoxon Rank Sum non-parametric test for all factors is less than 0.05. Hence, it is evident that the national and optimized vaccination policies were statistically superior to the no vaccination scenario. A key discovery of this research is the remarkable performance of the optimized vaccination policy, which excelled in all average factors across various flu transmission scenarios.
5.2.2. Central Region
The Central Region of Saudi Arabia, commonly known as Najd, is anchored by the capital city of Riyadh. This expansive plateau is marked by its desert landscapes and arid climate. According to the 2022 census, the Central Region is the second most populous in Saudi Arabia, with a total population of approximately 8,217,936, of which 39.5% are foreign citizens. Riyadh, the largest city in the region and the national capital, has a population of about 7,009,120, with 47.8% being Saudi citizens. The Central Region is economically pivotal, encompassing major urban developments and cultural landmarks. Despite its desert setting, it serves as an essential political and administrative hub, playing a significant role in the country's governance. The region consists of two provinces: Riyadh and Al- Qassim.
This section illustrates a consistent vaccine distribution approach in the proposed vaccination policies, as depicted in Figure 14. Notably, both scenarios exhibit similar patterns, especially at low and moderate R0 values. The national scenario includes 15 campaigns, while the optimized scenario consists of 17, 17, and 18 campaigns for low, moderate, and high R0 values respectively. For the cc phase, the optimized policy recommends a variable number of campaigns based on the R0 value: 3 campaigns for low and moderate R0 values, and 4 campaigns for high R0 values. Conversely, in the gc phase, the system advises a uniform number of campaigns across all R0 values.
The results presented in Table 13, Table 14 and Table 15 offer a comparative study assessing the effects of vaccine distribution ratios on the factors of infection, hospitalization, and death throughout the vaccination timeline, uncovering intriguing outcome. The no vaccination policy shows a notable increase of the infection factor by 0.31%, 0.36%, and 0.4% for low, moderate, and high R0 values. The hospitalization factor, on the other hand, exhibits modest changes for low and moderate R0 values by 0.03%, and by 0.05% for high R0 value. While, there is a marginally rise in the morbidity factor by 0.01% for all R0 values. As the pandemic worsens, the no vaccination policy markedly surpasses the national one, providing an intriguing insight into the relationship between flu spread and population numbers. Counterintuitive, the national policy performs less effectively than the optimized policy in the infection factor by 0.04%, 0.03, and 0.01% for low, moderate, and high pandemic values. This pattern is also seen in hospitalization, and morbidity factors by 0.03, 0.02, and 0.0% across all levels of pandemic severity. This observed behavior may be due to the influence of population dynamics as reflected in the social contact matrix. Conversely, the resemblance in vaccine ratios between the national and optimized policies played a role in shaping the outcomes, particularly in the high pandemic case, where it was observed that the national policy allocated more vaccine doses in the cc phase compared to the optimized policy.
The national policy upholds a uniform allocation quota for each group, independent of R0 values, whereas the optimized policy implements minor adjustments in its allocation. As a result, this appropriate variation contributes fractionally to the control of flu transmission.
Upon analyzing Figure 15 and Figure 16 with respect to the three factors, a clear pattern emerges: the optimized scenario, represented by gray bars, consistently stands out as the most effective across all age groups, especially in hospitalization, and death factors. In contrast, Figure 17’s national and optimized policies, symbolized by yellow and gray bars respectively, demonstrate similar ratios and parallel magnitudes in infection, and hospitalization factors under high pandemic conditions, suggesting lower sensitivity among all age groups. Across these figures, the unvaccinated policy, marked by the magenta bar, often shows a greater magnitude than the other scenarios in numerous cases. This consistently underscores the vital importance of a well-planned vaccination strategy in health crisis management.
Statistical Analysis
The examination indicates that the performance of the optimized policy is statistically noteworthy, as evidenced by the p-value from the Wilcoxon Rank Sum non-parametric test for all factors falling below 0.05. This firmly establishes that the national and optimized vaccination policies are statistically more advantageous than the no vaccination scenario. An important discovery of this study is the outstanding effectiveness of the optimized vaccination policy, which consistently outperforms in all average factors across various flu transmission scenarios.
5.2.3. Northern Region
The Northern region of Saudi Arabia, situated in the north of the country and bordering Iraq and Jordan, is among the least populated regions in Saudi Arabia. As of the 2022 census, it has a population of 2,601,841, comprising 72.3% Saudi citizens and 27.7% foreign nationals. The region is composed of four provinces: Al Jouf, Northern Border, Hai’al, and Tabouk.
This part demonstrates a similar strategy in distributing vaccines through suggested campaigns, as illustrated in Figure 18, reflecting the methods and goals of earlier cases in its comprehensive approach for both scenarios. For the cc phase, the system proposes varying numbers of campaigns depending on the R0 value: 4 campaigns for the low R0 value, then 3 for both the moderate and high R0 values. In contrast, it suggests an identical number of campaigns in the gc phase for each R0 value.
The data outlined in Table 16, Table 17 and Table 18 provides a comparative analysis of the impact of vaccine distribution ratios on infection, hospitalization, and death factors over the course of the vaccination period, revealing interested findings. No vaccination scenario displays a minimal rise on infection factors by 0.01%, 0.04%, and 0.05% for low, moderate, and high R0 values. The other factors demonstrate stability for the low pandemic value R0=1.2, showing no significant changes. While there is a modest rise in hospitalization, and death numbers by 0.02%, and 0.01% for both moderate, and high pandemic values. As the severity of the pandemic intensifies, the approach of the no vaccination policy marginally outperforms that of the national, offering a significant perspective on the correlation between flu proliferation and population size. Remarkably, the national policy is slightly less effective than the optimized policy by 0.01% across all factors on low and moderate pandemic values. Intriguingly, the national policy is as significant as the optimized policy for all factor under high pandemic value R0=3.1. Owing to its smaller population size and specific demographic characteristics, the region primarily comprises local citizens.
The national policy adheres to a uniform allocation quota for each group irrespective of R0 values, whereas the optimized policy adjusts its allocation quotas slightly, see Table 16, Table 17 and Table 18. Nonetheless, this subtle variation results in only a minor impact on flu control.
Analyzing Figure 19 and Figure 20 concerning the three factors reveals a recurrent pattern: the optimized scenario, represented by the gray bars, consistently stands out as the leading performer in all age groups. On the other hand, the national and optimized policies in Figure 21 (represented by yellow and gray bars, respectively) show relatively equivalent ratio and demonstrate parallelism in their respective magnitudes across all factors on high pandemic value R0=3.1, suggesting a lower sensitivity of all age groups. Across all figures, the unvaccinated policy, symbolized by the magenta bar, exhibited a greater magnitude compared to other scenarios in most instances. However, an exception was observed in the most populated age groups, G1, and G3, under factors infection and hospitalization at low pandemic value, where the bar heights appeared nearly identical for unvaccinated and national scenarios. This decisively underscores the paramount importance of optimized vaccination over other approaches.
Statistical Analysis
The analysis confirms the statistical significance of the optimized policy performance, as evidenced by the p-values in Table 19, Table 20 and Table 21 computed by the Wilcoxon Rank Sum non-parametric test for each factor falling below 0.05. This underscores that the national and optimized vaccination approaches are statistically more effective compared to the no vaccination scenario. Notably, the optimized vaccination policy stands out for its superior performance, consistently excelling in all average factors across various flu transmission scenarios. An exception was observed in the low pandemic value scenario, where the unvaccinated and national policies were found to be comparable in effectiveness. The same trend was observed between the national and optimized policies at a moderate pandemic level.
5.2.4. Western Region
The Western Region of Saudi Arabia, often referred to as the Hejaz, is one of the most significant regions in the country, both historically and culturally. It is home to Islam's two holiest cities, Mecca and Medina, making it a central religious destination for Muslims worldwide, with an estimated pilgrimages of 9,153,838 in 2022 [64]. The region is bordered by the Red Sea to the west, providing it with a long coastline that includes the city of Jeddah, a major urban center and the country's commercial hub.
The population of the Western Region is diverse, approximately half of the population consists of Saudi citizens with a significant number of residents and visitors from various cultural and ethnic backgrounds, particularly in the cosmopolitan city of Jeddah. The region's economy is heavily influenced by religious tourism, primarily due to the Hajj and Umrah pilgrimages to Mecca and Medina.
This segment displays a strategy akin to previous cases in vaccine allocation across suggested scenarios, as depicted in Figure 22. It aligns with the methodologies and aims of the study, applying a holistic approach for each scenario. In contrast, the optimized scenario begins with a high distribution of doses, followed by a sharp decline in the allocation rate, falling even below the allocation rate of the national scenario. For the cc phase, the system varies the campaign count in the optimized scenario according to the R0 value: assigning 4 campaigns for both low and moderate R0 values, and then reducing to 3 for high R0 values. Typically, in the gc phase, it opts for a uniform number of campaigns regardless of the R0 values.
The findings displayed in Table 22, Table 23 and Table 24 present a comparative examination of the impact of vaccine distribution ratios on factors infection, hospitalization, and death over the course of the vaccination period, revealing compelling outcomes. No vaccination indicates an increase in the infection factor by 0.06%, 0.1%, and 0.12% for low, moderate, and high R0 values. Hospitalization factor shows slight variations at low R0 values, increasing by 0.01, and moderate and high R0 values, it increases by 0.02%. Meanwhile, there is a small increase in morbidity factor, by 0.0033%, 0.0063%, and 0.0043% across all R0 values. As the pandemic intensifies, the no vaccination policy significantly outperforms the national, offering valuable insight into the connection between flu transmission and population characteristics. Unexpectedly, in infection factor, the national policy proves less effective than the optimized, even with intensified vaccination during the cc phase. The difference between the two scenarios is 0.27% for both low and moderate pandemic values, and a mere 0.26% for high pandemic values. This observation is attributed to the initial campaigns of both scenarios, where the optimized scenario allocated larger vaccine doses compared to the national. This led to the subsequent efforts of the national scenario being overshadowed. This trend is similarly observed in factor hospitalization with increases of 0.02%, 0.02%, and 0.01%, and in factor morbidity with 0.01%, 0.0057%, and 0.01% across varying pandemic severity levels.
The national policy maintains a consistent allocation quota for every group, regardless of R0 values, while the optimized policy makes slight modifications in its allocation. Consequently, this small degree of variation plays a part in the management of flu transmission.
Examining Figure 23, Figure 24 and Figure 25 with respect to the three factors reveals a steady pattern: the optimized scenario, marked by gray bars, consistently ranks as the highest performer among all age groups considering that this is a minimization problem. In these figures, the no vaccination policy, represented by the magenta bar, frequently displays a greater magnitude compared to the others in many instances. In terms of their significance and effectiveness, the scenarios are ranked from most to least impactful as optimized, national, and no vaccination.
Statistical Analysis
The analysis confirms the statistical significance of the optimized policy’s effectiveness, as indicated by the p-values from the Wilcoxon Rank Sum non-parametric test for all factors, which are below 0.05. This solidly establishes the statistical superiority of both the national and optimized vaccination strategies over the no vaccination scenario. A notable outcome of this study is the remarkable efficacy of the optimized vaccination policy, which consistently surpasses others in all average factors throughout various flu transmission scenarios.
5.2.5. Southern Region
The Southern Region of Saudi Arabia, encompassing the provinces of Al-Baha, Asir, Najran, and Jizan, is distinguished by its diverse geography and culture. Bordered by Yemen to the south and the Red Sea to the west, the region includes significant portions of the Sarawat Mountains and the historic Tihamah region. This topography contributes to a cooler, more tropical climate with greater greenery than is typically found in the rest of Saudi Arabia. In recent years, the Southern Region has experienced a surge in tourism, drawn by its picturesque natural beauty, alluring beaches and islands like Farasan, rich cultural heritage, and milder climate.
This section presents a different approach to vaccine distribution as illustrated in Figure 26. The national scenario adheres to a uniform distribution of vaccine throughout the vaccination period. Meanwhile, the optimized scenario adopts two strategies, for the cc phase, the system adjusts the number of campaigns according to the R0 value, suggesting 3 campaigns for both the low and moderate R0 values, and maintaining 4 campaigns for high R0 values. In contrast, during the gc phase, the system advises a uniform number of campaigns across all R0 values.
The outcomes displayed in Table 25, Table 26 and Table 27 offer a comparative analysis of the effects of vaccine distribution ratios on infection, hospitalization, and death factors over the course of the vaccination period, showcasing significant observations. The no vaccination scenario shows a steady increase across all factors at a low R0 value, with rises of 0.08%, 0.03%, and 0.02% in infection, hospitalization, and death factors, respectively. This trend continues at moderate and high R0 values, as evidenced by an increases of 0.16%, 0.06%, and 0.04% for moderate R0 values, and 0.25%, 0%, and 0.06% for high R0 values. The influence of pandemic waves is distinctly evident in the comparison between the no vaccination and national scenarios. On the other hand, the comparison between the national and optimized scenarios reveals a modest positive impact resulting from the optimized scenario's allocation strategy. In this case, factors infection, hospitalization, and death exhibited decreases ranging from 0.01% to 0.02% for the infection and death factors, and between 0.004% and 0.01% for the hospitalization factor across all R0 values.
The national policy upholds a uniform allocation quota for each group, independent of R0 values, whereas the optimized policy implements minor adjustments in its distribution. Therefore, this minimal variation contributes to the control of flu transmission.
Analyzing Figure 27, Figure 28 and Figure 29 in relation to the three factors uncovers a consistent trend: the optimized scenario, indicated by gray bars, emerges as the top performer (taking into account that this is a problem of minimization) across all age groups, especially evident in factors hospitalized and morbidity. However, in factor infection, the discrepancy between the national and optimized scenarios, represented by yellow and gray bars, is hardly noticeable. Across all figures, the unvaccinated policy, depicted by the magenta bar, often shows a larger magnitude than the others. Overall, the scenarios are ordered in terms of their impact and efficacy from most to least as optimized, national, and unvaccinated.
Statistical Analysis
The study demonstrates that the optimized policy's effectiveness is statistically significant, with p-values from the Wilcoxon Rank Sum non-parametric test for all factors being under 0.05. This strongly validates the statistical advantage of both the national and optimized vaccination strategies compared to the no vaccination scenario. Again, an important finding of this research is the exceptional performance of the optimized vaccination policy, which consistently outperforms the others in all mean factors across different flu transmission scenarios.
5.3. Discussion
Overall, the findings reveal an intriguing correlation between vaccine allocation and population demographics. Notably, the national and optimized scenarios concur on the same prioritization of age groups, arranging them as G3, G1, G2, G4, and G5 for the general case and all regions except for the Central region, where the order is reversed to G3, G2, G1,G4, and G5. The primary contribution of optimized policy lies in its slight to moderate adjustments in allocation. Consequently, these levels of modification assist in more effectively managing flu transmission across various degrees of pandemic severity. An additional intriguing observation was made in the Northern region, the least populated area, where a single instance revealed no significant differences between the no vaccination and optimized scenarios, nor between the national and optimized scenarios. This highlights a robust connection between the transmission of infection and demographic factors, suggesting that demographics can act as a natural countermeasure against the spread of infection.
One research goal aimed to explore the impact of an increased number of vaccine doses. For this purpose, we maintained the national vaccine dose allocations across regions to ascertain if augmenting the allocation of doses — which in certain instances matched the population size, as in the Southern region, or was nearly double in the Northern region — significantly aids in disease mitigation. Our findings indicate a substantial reduction in all factors for the Saudi Arabia's case compared to others. This outcome is attributed to the vaccine's efficacy, which remains constant regardless of the number of doses received by an individual, and the additional influence of herd immunity, suggesting that even a smaller quantity of vaccine doses can have a greater effect when distributed strategically.
6. Conclusions
Acute lower respiratory tract infections pose a significant health challenge in Saudi Arabia, impacting more than 15% of the population each year. Studies spanning the last three decades have identified viruses as the main agents of these infections. The transmission of respiratory viruses in Saudi Arabia is thought to be primarily driven by the significant presence and mobility of foreign workers, as well as the mass gathering of millions of Muslims in Mecca for Hajj and Umrah annually. Utilizing available flu-related data, simulations of three vaccination scenarios were carried out at three different pandemic intensities, both nationally and regionally.
The findings highlight the significant influence of population demographics on disease spread and vaccine allocation, alongside the pivotal role of vaccine efficacy in disease control, which proves to be more critical than merely increasing dose allocations. The optimized vaccination scenario emerged as the most effective strategy based on the results, paving the way for further research into developing personalized vaccination strategies. These strategies would consider individual risk factors, such as age, health status, and exposure risk, necessitating advanced models to manage and analyze vast amounts of personal data for precise vaccine allocation. Moreover, there is an essential need for robust post-vaccination monitoring systems. Such systems would assess the efficacy of vaccine allocation strategies and guide modifications for future vaccine distribution efforts by gathering detailed data on vaccine efficacy, breakthrough infections, and population immunity levels. Collectively, these approaches offer a comprehensive strategy for enhancing vaccine distribution efficiency and assessing its long-term effectiveness.
Author Contributions
Conceptualization, A.K.A. and M.H.; Methodology, A.K.A.; Software, A.K.A.; Validation, A.K.A.; Formal analysis, A.K.A.; Investigation, A.K.A.; Resources, A.K.A.; Writing—original draft, A.K.A.; Writing—review & editing, A.K.A. and M.H.; Supervision, M.H.; Project administration, M.H. All authors have read and agreed to the published version of the manuscript.
Funding
This research received no external funding.
Institutional Review Board Statement
Not applicable.
Informed Consent Statement
Not applicable.
Data Availability Statement
Not applicable.
Conflicts of Interest
The authors declare no conflict of interest.
References
- World Health Organization, Global influenza strategy 2019-2030. Geneva: World Health Organization, 2019. Accessed: Feb. 02, 2024. [Online]. Available: https://iris.who.int/handle/10665/311184.
- World Health Organization, “A Saudi Arabian journey in influenza surveillance.” Accessed: Feb. 02, 2024. [Online]. Available: https://www.who.int/news/item/13-12-2022-a-saudi-arabian-journey-in-influenza-surveillance.
- M. A. Farrag, M. E. Hamed, H. M. Amer, and F. N. Almajhdi, “Epidemiology of respiratory viruses in Saudi Arabia: toward a complete picture,” Arch Virol, vol. 164, no. 8, pp. 1981–1996, Aug. 2019. [CrossRef]
- S. V. Aarthi and M. Sahu, “Migration Policy in the Gulf Cooperation Council (GCC) States: A Critical Analysis,” Contemporary Review of the Middle East, vol. 8, no. 4, pp. 410–434, Dec. 2021. [CrossRef]
- H. A. Al Khatib, A. A. Al Thani, I. Gallouzi, and H. M. Yassine, “Epidemiological and genetic characterization of pH1N1 and H3N2 influenza viruses circulated in MENA region during 2009–2017,” BMC Infect Dis, vol. 19, no. 1, p. 314, Dec. 2019. [CrossRef]
- World Health Organization (WHO), “Influenza (Seasonal).” Accessed: Feb. 03, 2024. [Online]. Available: https://www.who.int/news-room/fact-sheets/detail/influenza-(seasonal).
- Z. Chen, C. Bancej, L. Lee, and D. Champredon, “Antigenic drift and epidemiological severity of seasonal influenza in Canada,” Sci Rep, vol. 12, no. 1, p. 15625, Sep. 2022. [CrossRef]
- World Health Organization (WHO), “Recommended composition of influenza virus vaccines for use in the 2024 southern hemisphere influenza season,” Sep. 2023. Accessed: Feb. 03, 2024. [Online]. Available: https://cdn.who.int/media/docs/default-source/influenza/who-influenza-recommendations/vcm-southern-hemisphere-recommendation-2024/202309_recommendation.pdf?sfvrsn=2c2cbebd_7&download=true.
- “Influenza Surveillance in Saudi Arabia.” 2017. [Online]. Available: https://www.moh.gov.sa/CCC/healthp/regulations/Documents/ISSA%20Protocol.pdf.
- S. Gouma, E. M. Anderson, and S. E. Hensley, “Challenges of Making Effective Influenza Vaccines,” Annu. Rev. Virol., vol. 7, no. 1, pp. 495–512, Sep. 2020. [CrossRef]
- J. C. D. Costa et al., “Vaccine Mismatches, Viral Circulation, and Clinical Severity Patterns of Influenza B Victoria and Yamagata Infections in Brazil over the Decade 2010–2020: A Statistical and Phylogeny–Trait Analyses,” Viruses, vol. 14, no. 7, p. 1477, Jul. 2022. [CrossRef]
- E. M. Galarce, S. Minsky, and K. Viswanath, “Socioeconomic status, demographics, beliefs and A(H1N1) vaccine uptake in the United States,” Vaccine, vol. 29, no. 32, pp. 5284–5289, Jul. 2011. [CrossRef]
- H. K. Herzallah, S. A. Bubshait, A. K. Antony, and S. T. Al-Otaibi, “Incidence of influenza A H1N1 2009 infection in Eastern Saudi Arabian hospitals,” Saudi Med J, vol. 32, no. 6, pp. 598–602, Jun. 2011.
- R. Almaghrabi, “Sustained Emergence of Influenza A H1N1 and epidemiologic aspects of H1N1 in Saudi Arabia,” IJPN, vol. 1, no. 4, pp. 96–101, 2017. [CrossRef]
- A. A. Rabaan, S. A. Alshaikh, and A. M. Bazzi, “Influenza A(H1N1)pdm09 epidemiology in the Eastern Province of Saudi Arabia,” Journal of Infection and Public Health, vol. 11, no. 5, pp. 636–639, Sep. 2018. [CrossRef]
- A. Khan et al., “Atypical influenza A(H1N1)pdm09 strains caused an influenza virus outbreak in Saudi Arabia during the 2009–2011 pandemic season,” Journal of Infection and Public Health, vol. 12, no. 4, pp. 557–567, Jul. 2019. [CrossRef]
- A. G. Mohamed, A. A. BinSaeed, H. Al-Habib, and H. Al-Saif, “Communicability of H1N1 and seasonal influenza among household contacts of cases in large families,” Influenza Resp Viruses, vol. 6, no. 3, May 2012. [CrossRef]
- K. M. Altayep, H. G. Ahmed, A. T. A. Tallaa, A. S. Alzayed, A. J. Alshammari, and A. T. A. Talla, “Epidemiology and Clinical Complication Patterns of Influenza A (H1N1 Virus) in Northern Saudi Arabia,” Infectious Disease Reports, vol. 9, no. 2, p. 6930, Jun. 2017. [CrossRef]
- A. Althaqafi et al., “Molecular Detection of Influenza A and B Viruses in Four Consecutive Influenza Seasons 2015–16 to 2018–19 in a Tertiary Center in Western Saudi Arabia:,” JEGH, vol. 11, no. 2, p. 208, 2021. [CrossRef]
- A. M. Alshahrani et al., “Trends of Seasonal Influenza Incidence among the Population of Abha, Saudi Arabia During 2019,” JPRI, pp. 1311–1317, Dec. 2021. [CrossRef]
- N. B. Javed and M. AL-Mohaithef, “Socio-demographic determinants of influenza vaccination uptake behavior: A nationwide cross-sectional study in Saudi Arabia,” SMJ, vol. 44, no. 11, pp. 1132–1138, Nov. 2023. [CrossRef]
- S. M. Alshahrani and Y. Zahrani, “Prevalence and Predictors of Seasonal Influenza Vaccine Uptake in Saudi Arabia Post COVID-19: A Web-Based Online Cross-Sectional Study,” Vaccines, vol. 11, no. 2, p. 353, Feb. 2023. [CrossRef]
- Z. Al Nufaiei et al., “Assessment of the Knowledge and Opinions of Undergraduate Health Care Students Concerning Influenza Vaccination in Saudi Arabia: A Cross-Sectional Study,” JMDH, vol. Volume 16, pp. 2681–2690, Sep. 2023. [CrossRef]
- F. Masoud et al., “Awareness and attitude regarding influenza vaccine among public and health care providers in the eastern region of Saudi Arabia,” IJMDC, pp. 793–799, 2020. [CrossRef]
- K. A. Alenazi, “Parents’ knowledge, attitude and practice towards seasonal influenza vaccination in Riyadh region, Saudi Arabia,” J Infect Dev Ctries, vol. 16, no. 10, pp. 1623–1629, Oct. 2022. [CrossRef]
- T. H. Mallhi et al., “Evaluation of knowledge and barriers of influenza vaccine uptake among university students in Saudi Arabia; a cross-sectional analysis,” PeerJ, vol. 10, p. e13959, Sep. 2022. [CrossRef]
- R. M. A. Mohamad et al., “Acceptability of The Flu Vaccine among The General Population in Tabuk, Saudi Arabia, 2021-2022,” The Egyptian Journal of Hospital Medicine, vol. 90, no. 1, pp. 610–620, Jan. 2023. [CrossRef]
- A. Almotairy, W. Sheikh, A. A. Joraid, A. Bajwi, M. F. Alharbi, and S. R. Al-Dubai, “Association between knowledge of influenza vaccine and vaccination status among general population attending primary health care centers in Al-Madinah, Saudi Arabia,” J Family Med Prim Care, vol. 8, no. 9, p. 2971, 2019. [CrossRef]
- I. Alharbi, R. Alharthi, S. Aljabri, R. Alzhrani, L. Alzahrani, and S. Albagami, “Seasonal Influenza Vaccination Among Saudi Children: Parental Barriers and Willingness to Vaccinate Their Children in the Makkah Region,” Cureus, May 2023. [CrossRef]
- E. Shim, L. Meyers, and A. P. Galvani, “Optimal H1N1 vaccination strategies based on self-interest versus group interest,” BMC Public Health, vol. 11, no. Suppl 1, p. S4, 2011. [CrossRef]
- S. Enayati and O. Y. Özaltın, “Optimal influenza vaccine distribution with equity,” European Journal of Operational Research, vol. 283, no. 2, pp. 714–725, Jun. 2020. [CrossRef]
- E. Shim, “Optimal Allocation of the Limited COVID-19 Vaccine Supply in South Korea,” JCM, vol. 10, no. 4, p. 591, Feb. 2021. [CrossRef]
- K. Aro et al., “Age-specific HPV type distribution in high-grade cervical disease in screened and unvaccinated women,” Gynecologic Oncology, vol. 154, no. 2, pp. 354–359, Aug. 2019. [CrossRef]
- C. M. Worsham, C. F. Bray, and A. B. Jena, “Optimal timing of influenza vaccination in young children: population based cohort study,” BMJ, p. e077076, Feb. 2024. [CrossRef]
- S. Han et al., “Time-varying optimization of COVID-19 vaccine prioritization in the context of limited vaccination capacity,” Nat Commun, vol. 12, no. 1, p. 4673, Aug. 2021. [CrossRef]
- J. M. A. Minoza, V. P. Bongolan, and J. F. Rayo, “COVID-19 Agent-Based Model with Multi-objective Optimization for Vaccine Distribution,” 2021. [CrossRef]
- A. K. Alkhamis and M. Hosny, “A Synthesis of Pulse Influenza Vaccination Policies Using an Efficient Controlled Elitism Non-Dominated Sorting Genetic Algorithm (CENSGA),” Electronics, vol. 11, no. 22, p. 3711, Nov. 2022. [CrossRef]
- A. K. Alkhamis and M. Hosny, “A Multi-Objective Simulated Annealing Local Search Algorithm in Memetic CENSGA: Application to Vaccination Allocation for Influenza,” Sustainability, vol. 15, no. 21, p. 15347, Oct. 2023. [CrossRef]
- G. Briffoteaux, R. Ragonnet, P. Tomenko, M. Mezmaz, N. Melab, and D. Tuyttens, “Comparing Parallel Surrogate-Based and Surrogate-Free Multi-objective Optimization of COVID-19 Vaccines Allocation,” in Optimization and Learning, vol. 1684, B. Dorronsoro, M. Pavone, A. Nakib, and E.-G. Talbi, Eds., in Communications in Computer and Information Science, vol. 1684. , Cham: Springer International Publishing, 2022, pp. 201–212. [CrossRef]
- M. Mohammadi, M. Dehghan, A. Pirayesh, and A. Dolgui, “Bi-objective optimization of a stochastic resilient vaccine distribution network in the context of the COVID-19 pandemic,” Omega, vol. 113, p. 102725, Dec. 2022. [CrossRef]
- D. Osthus, K. S. Hickmann, P. C. Caragea, D. Higdon, and S. Y. Del Valle, “Forecasting seasonal influenza with a state-space SIR model,” Ann. Appl. Stat., vol. 11, no. 1, pp. 202–224, Mar. 2017. [CrossRef]
- Saudi Press Agency, “Health Spokesperson: Avoid Rumors Claiming That Influenza May Take Lives, Urging All to Take the Vaccine,” Oct. 12, 2022. Accessed: Apr. 21, 2024. [Online]. Available: https://www.spa.gov.sa/w1824989.
- World Health Organization, “Integrated sentinel surveillance of influenza and SARS-CoV-2 and the development of the Global Influenza Surveillance and Response System Plus: virtual meeting, 12 – 14 October 2021.” Accessed: Dec. 02, 2024. [Online]. Available: https://apps.who.int/iris/bitstream/handle/10665/356310/9789240050228-eng.pdf?sequence=1.
- World Health Organization, “Recommended composition of influenza virus vaccines for use in the 2019- 2020 northern hemisphere influenza season.” Accessed: Dec. 04, 2024. [Online]. Available: https://cdn.who.int/media/docs/default-source/influenza/who-influenza-recommendations/vcm-northern-hemisphere-recommendation-2019-2020/201902-recommendation.pdf?sfvrsn=7aa5b685_13.
- M.-C. Trieu et al., “Antibody Responses to Influenza A/H1N1pdm09 Virus After Pandemic and Seasonal Influenza Vaccination in Healthcare Workers: A 5-Year Follow-up Study,” Clinical Infectious Diseases, vol. 68, no. 3, pp. 382–392, Jan. 2019. [CrossRef]
- S. Kim and E. Jung, “Prioritization of vaccine strategy using an age-dependent mathematical model for 2009 A/H1N1 influenza in the Republic of Korea,” Journal of Theoretical Biology, vol. 479, pp. 97–105, Oct. 2019. [CrossRef]
- M. E. Hamad, H. M. Amer, M. A. Farrag, A. H. Osman, and F. N. Almajhdi, “Naked DNA immunization with full-length attachment gene of human respiratory syncytial virus induces safe and protective immune response,” av, vol. 62, no. 02, pp. 137–146, 2018. [CrossRef]
- L. E. Duijzer, W. L. van Jaarsveld, J. Wallinga, and R. Dekker, “Dose-Optimal Vaccine Allocation over Multiple Populations,” Prod Oper Manag, vol. 27, no. 1, pp. 143–159, Jan. 2018. [CrossRef]
- A. R. da Cruz, R. T. N. Cardoso, and R. H. C. Takahashi, “Multiobjective synthesis of robust vaccination policies,” Applied Soft Computing, vol. 50, pp. 34–47, Jan. 2017. [CrossRef]
- K. Deb, A. Pratap, S. Agarwal, and T. Meyarivan, “A fast and elitist multiobjective genetic algorithm: NSGA-II,” IEEE Transactions on Evolutionary Computation, Evolutionary Computation, IEEE Transactions on, IEEE Trans. Evol. Computat., vol. 6, no. 2, pp. 182–197, Apr. 2002. [CrossRef]
- A. R. Abul’Wafa, “Optimization of economic/emission load dispatch for hybrid generating systems using controlled Elitist NSGA-II,” Electric Power Systems Research, vol. 105, pp. 142–151, Dec. 2013. [CrossRef]
- V. Hajipour, M. Tavana, F. J. Santos-Arteaga, A. Alinezhad, and D. Di Caprio, “An efficient controlled elitism non-dominated sorting genetic algorithm for multi-objective supplier selection under fuzziness,” Journal of Computational Design and Engineering, vol. 7, no. 4, pp. 469–488, Apr. 2020. [CrossRef]
- H. Fraser et al., “Costs of seasonal influenza vaccination in South Africa,” Influenza Resp Viruses, vol. 16, no. 5, pp. 873–880, Sep. 2022. [CrossRef]
- Saudi census 2022, “Population by broad age groups.” Accessed: Jan. 12, 2023. [Online]. Available: https://portal.saudicensus.sa/portal/public/1/15/101463?type=TABLE.
- X. Tan, L. Yuan, J. Zhou, Y. Zheng, and F. Yang, “Modeling the initial transmission dynamics of influenza A H1N1 in Guangdong Province, China,” International Journal of Infectious Diseases, vol. 17, no. 7, pp. e479–e484, Jul. 2013. [CrossRef]
- N. Hens and J. Wallinga, “Design and Analysis of Social Contact Surveys Relevant for the Spread of Infectious Diseases,” in Wiley StatsRef: Statistics Reference Online, 1st ed., R. S. Kenett, N. T. Longford, W. W. Piegorsch, and F. Ruggeri, Eds., Wiley, 2019, pp. 1–15. [CrossRef]
- J. Koltai, O. Vásárhelyi, G. Röst, and M. Karsai, “Reconstructing social mixing patterns via weighted contact matrices from online and representative surveys,” Sci Rep, vol. 12, no. 1, p. 4690, Mar. 2022. [CrossRef]
- K. Prem et al., “Projecting contact matrices in 177 geographical regions: An update and comparison with empirical data for the COVID-19 era,” PLoS Comput Biol, vol. 17, no. 7, p. e1009098, Jul. 2021. [CrossRef]
- K. Prem, A. R. Cook, and M. Jit, “Projecting social contact matrices in 152 countries using contact surveys and demographic data,” PLoS Comput Biol, vol. 13, no. 9, p. e1005697, Sep. 2017. [CrossRef]
- S. Arregui, A. Aleta, J. Sanz, and Y. Moreno, “Projecting social contact matrices to different demographic structures,” PLoS Comput Biol, vol. 14, no. 12, p. e1006638, Dec. 2018. [CrossRef]
- World Health Organization, “Influenza vaccination policy.” Accessed: Oct. 12, 2023. [Online]. Available: https://immunizationdata.who.int/pages/indicators-by-category/influenza.html?ISO_3_CODE=SAU&YEAR=].
- A. Sominina et al., “Assessing the Intense Influenza A(H1N1)pdm09 Epidemic and Vaccine Effectiveness in the Post-COVID Season in the Russian Federation,” Viruses, vol. 15, no. 8, p. 1780, Aug. 2023. [CrossRef]
- Z. Wu, D. Harrich, Z. Li, D. Hu, and D. Li, “The unique features of SARS-CoV-2 transmission: Comparison with SARS-CoV, MERS-CoV and 2009 H1N1 pandemic influenza virus,” Reviews in Medical Virology, vol. 31, no. 2, p. e2171, Mar. 2021. [CrossRef]
- General Authority for Statistics, “GASTAT announces total number of Umrah performers and pilgrims for 1443 /2022.” Accessed: Feb. 28, 2024. [Online]. Available: https://www.stats.gov.sa/en/news/463.
| 1 | https://www.cdc.gov/flu/about/season/flu-season.htm |
Figure 1.
Map of Saudi Arabia showing (a) Different regions and (b) Emirates.
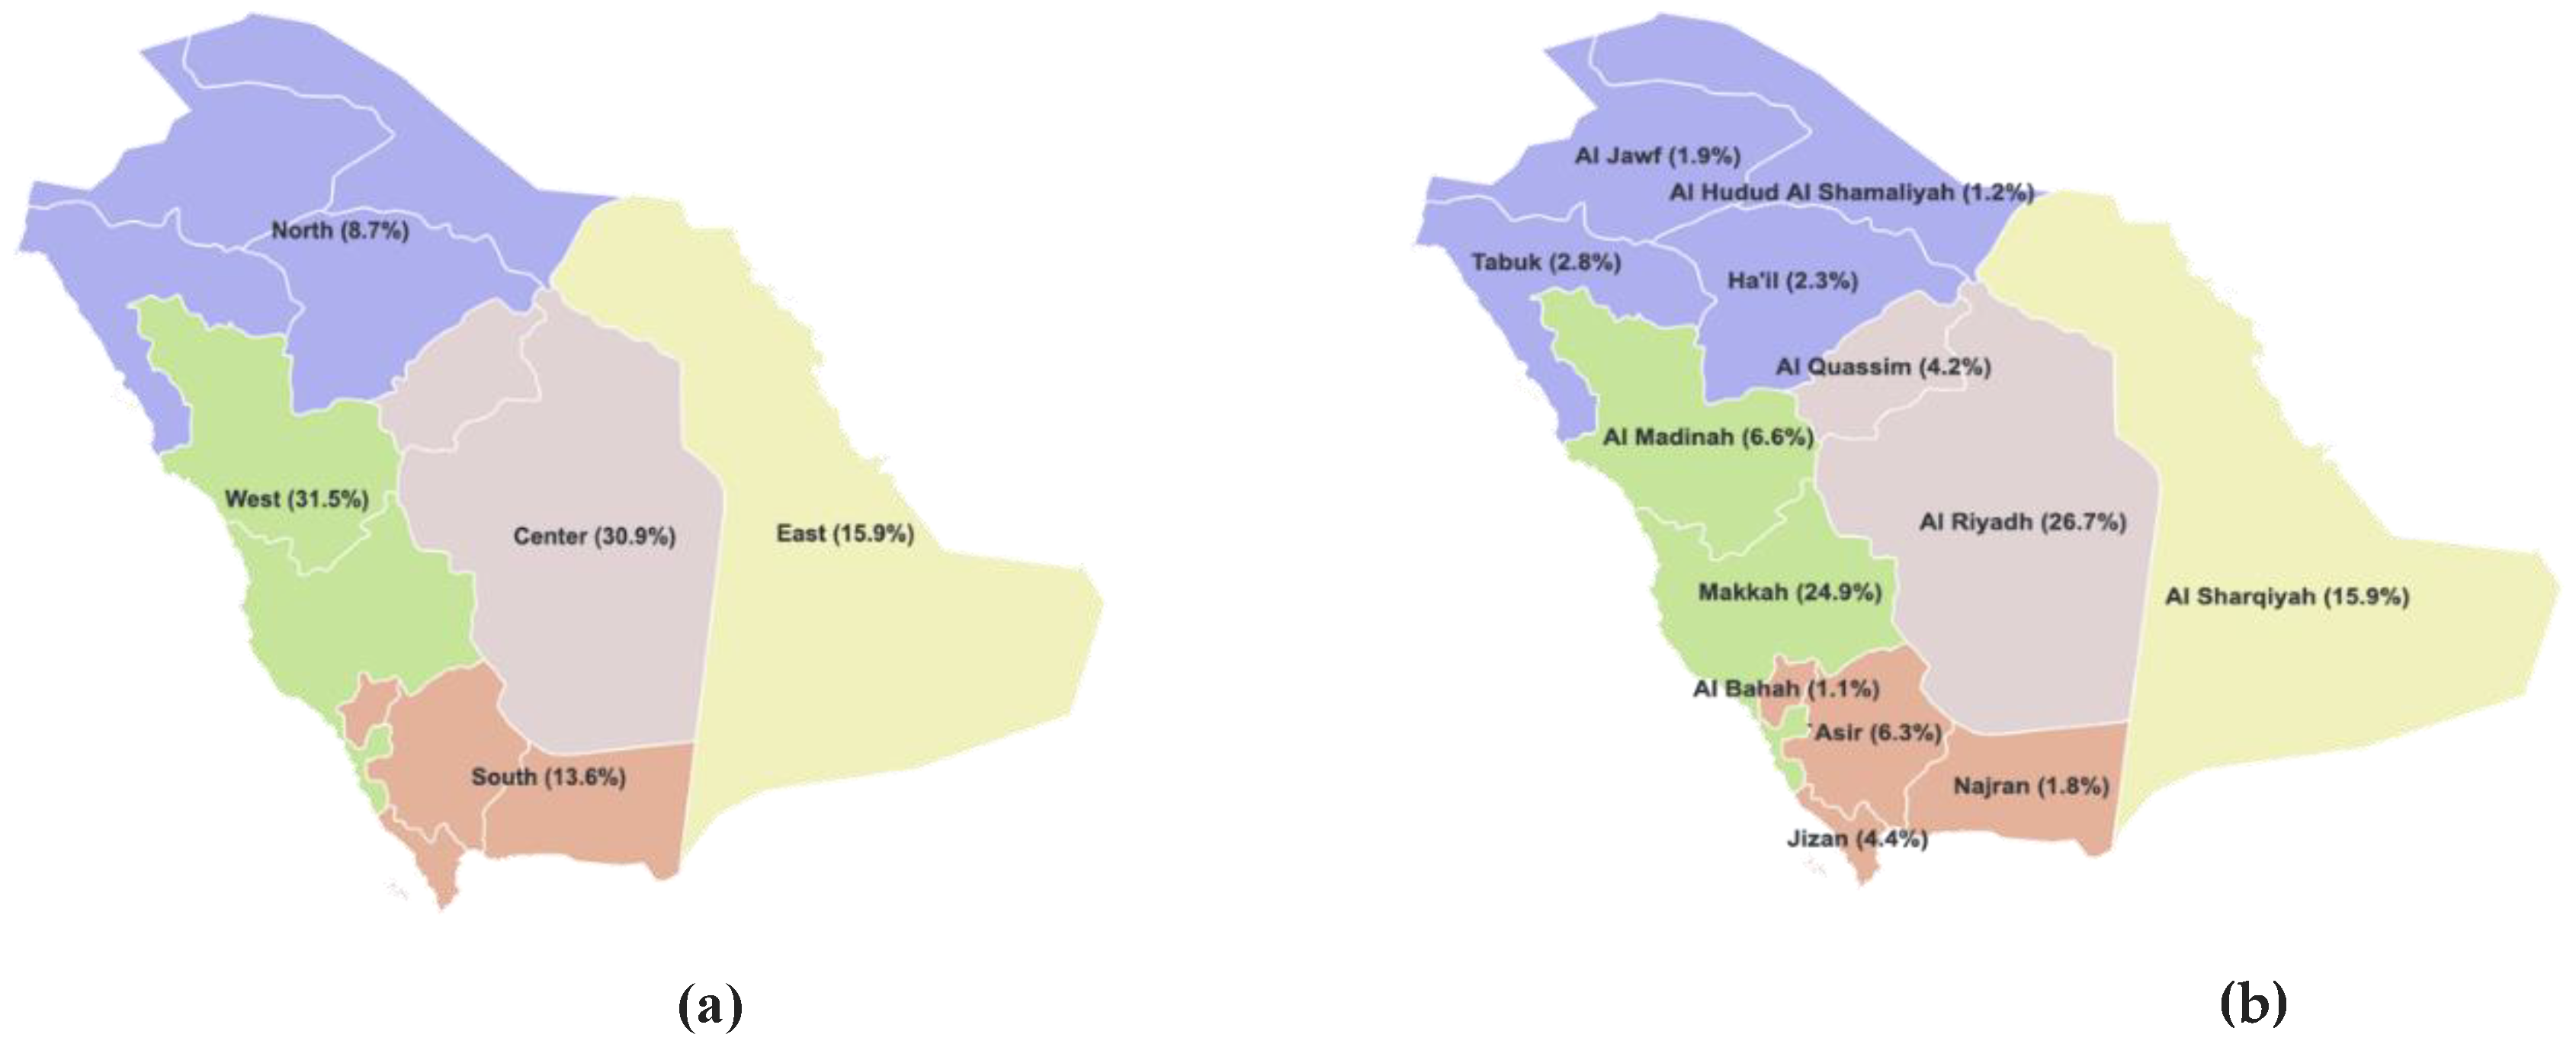
Figure 2.
Chromosome representation in general case (a) and regional cases (b).
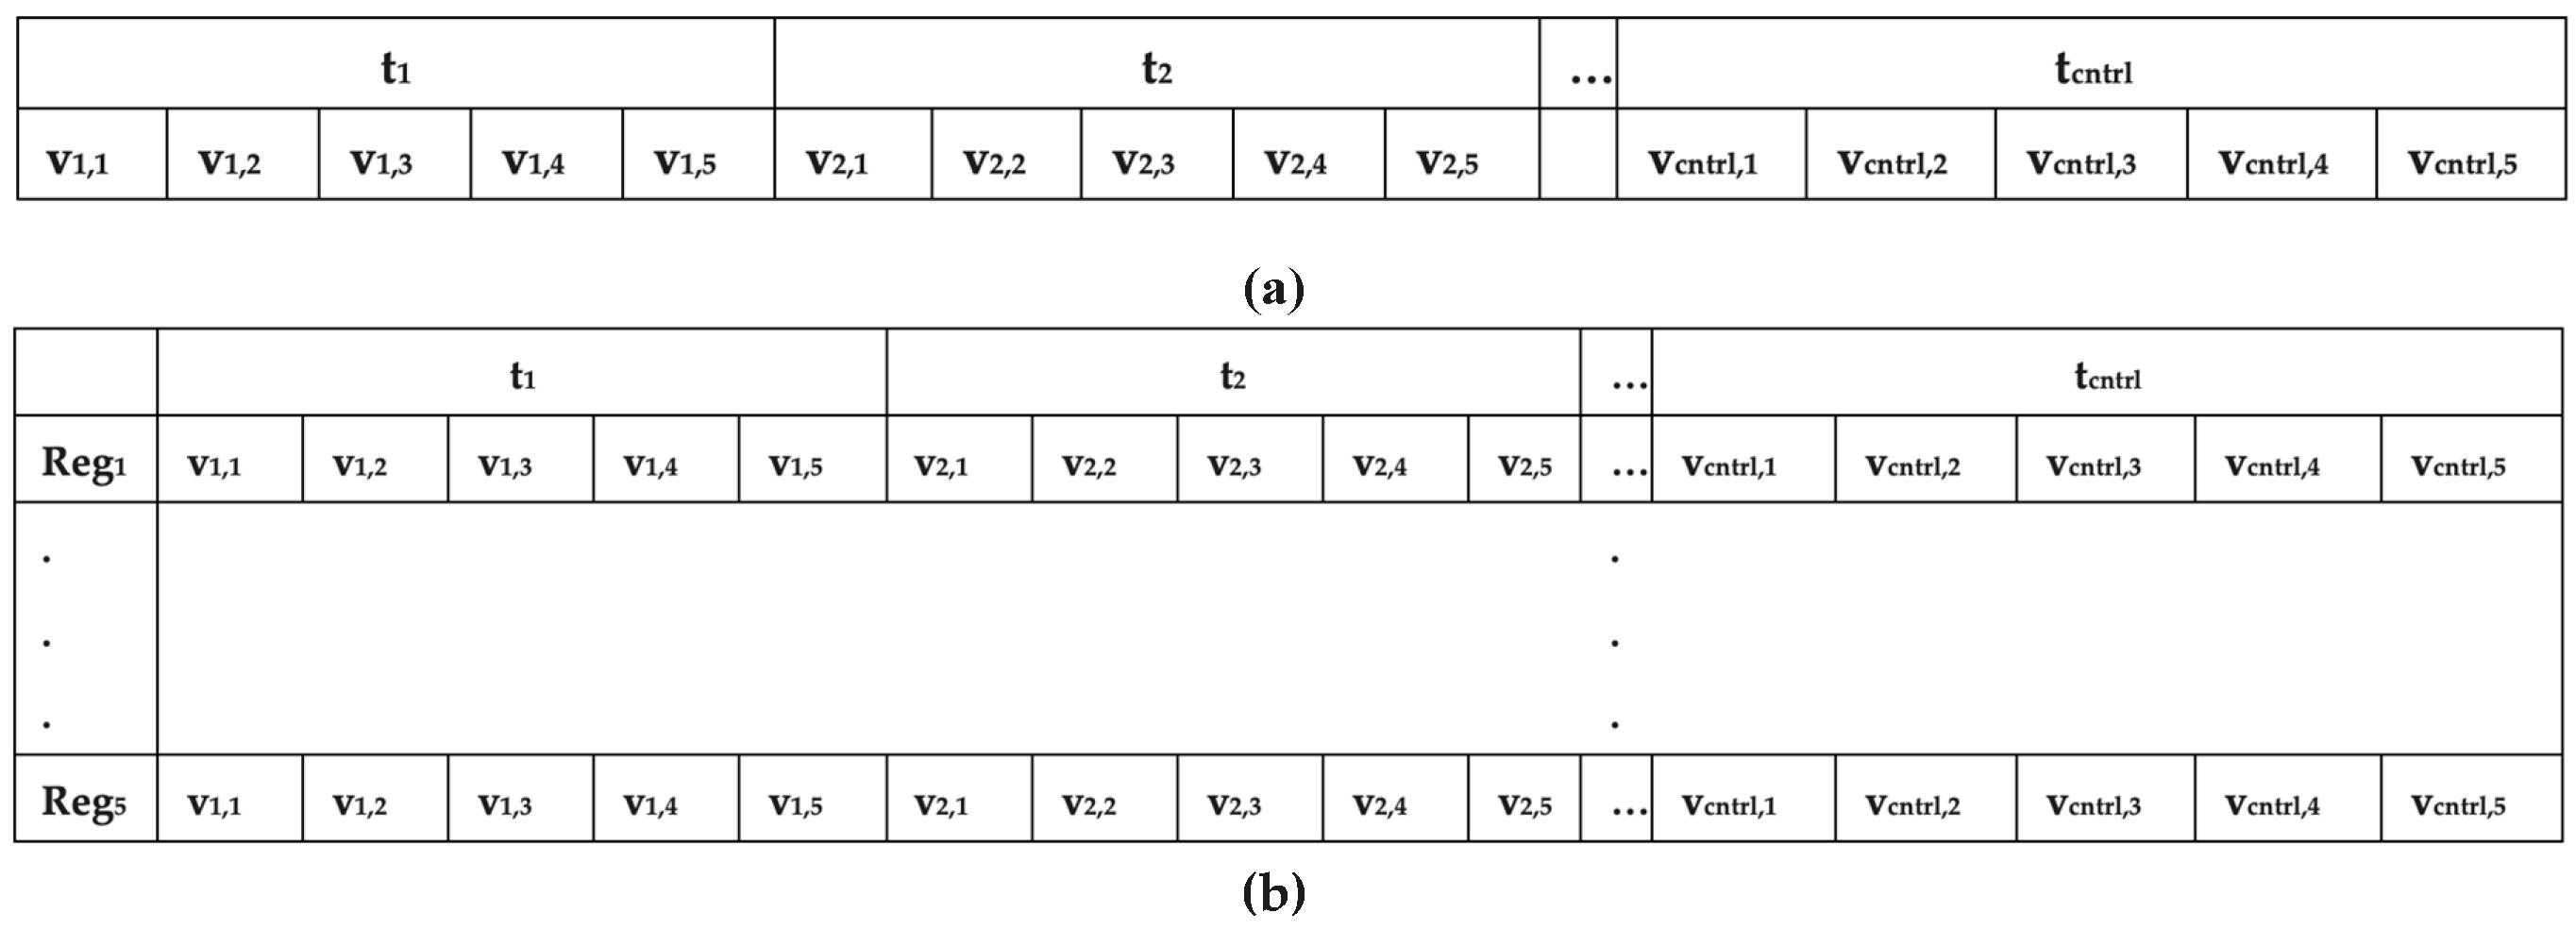
Figure 3.
Distribution of population among different age groups.
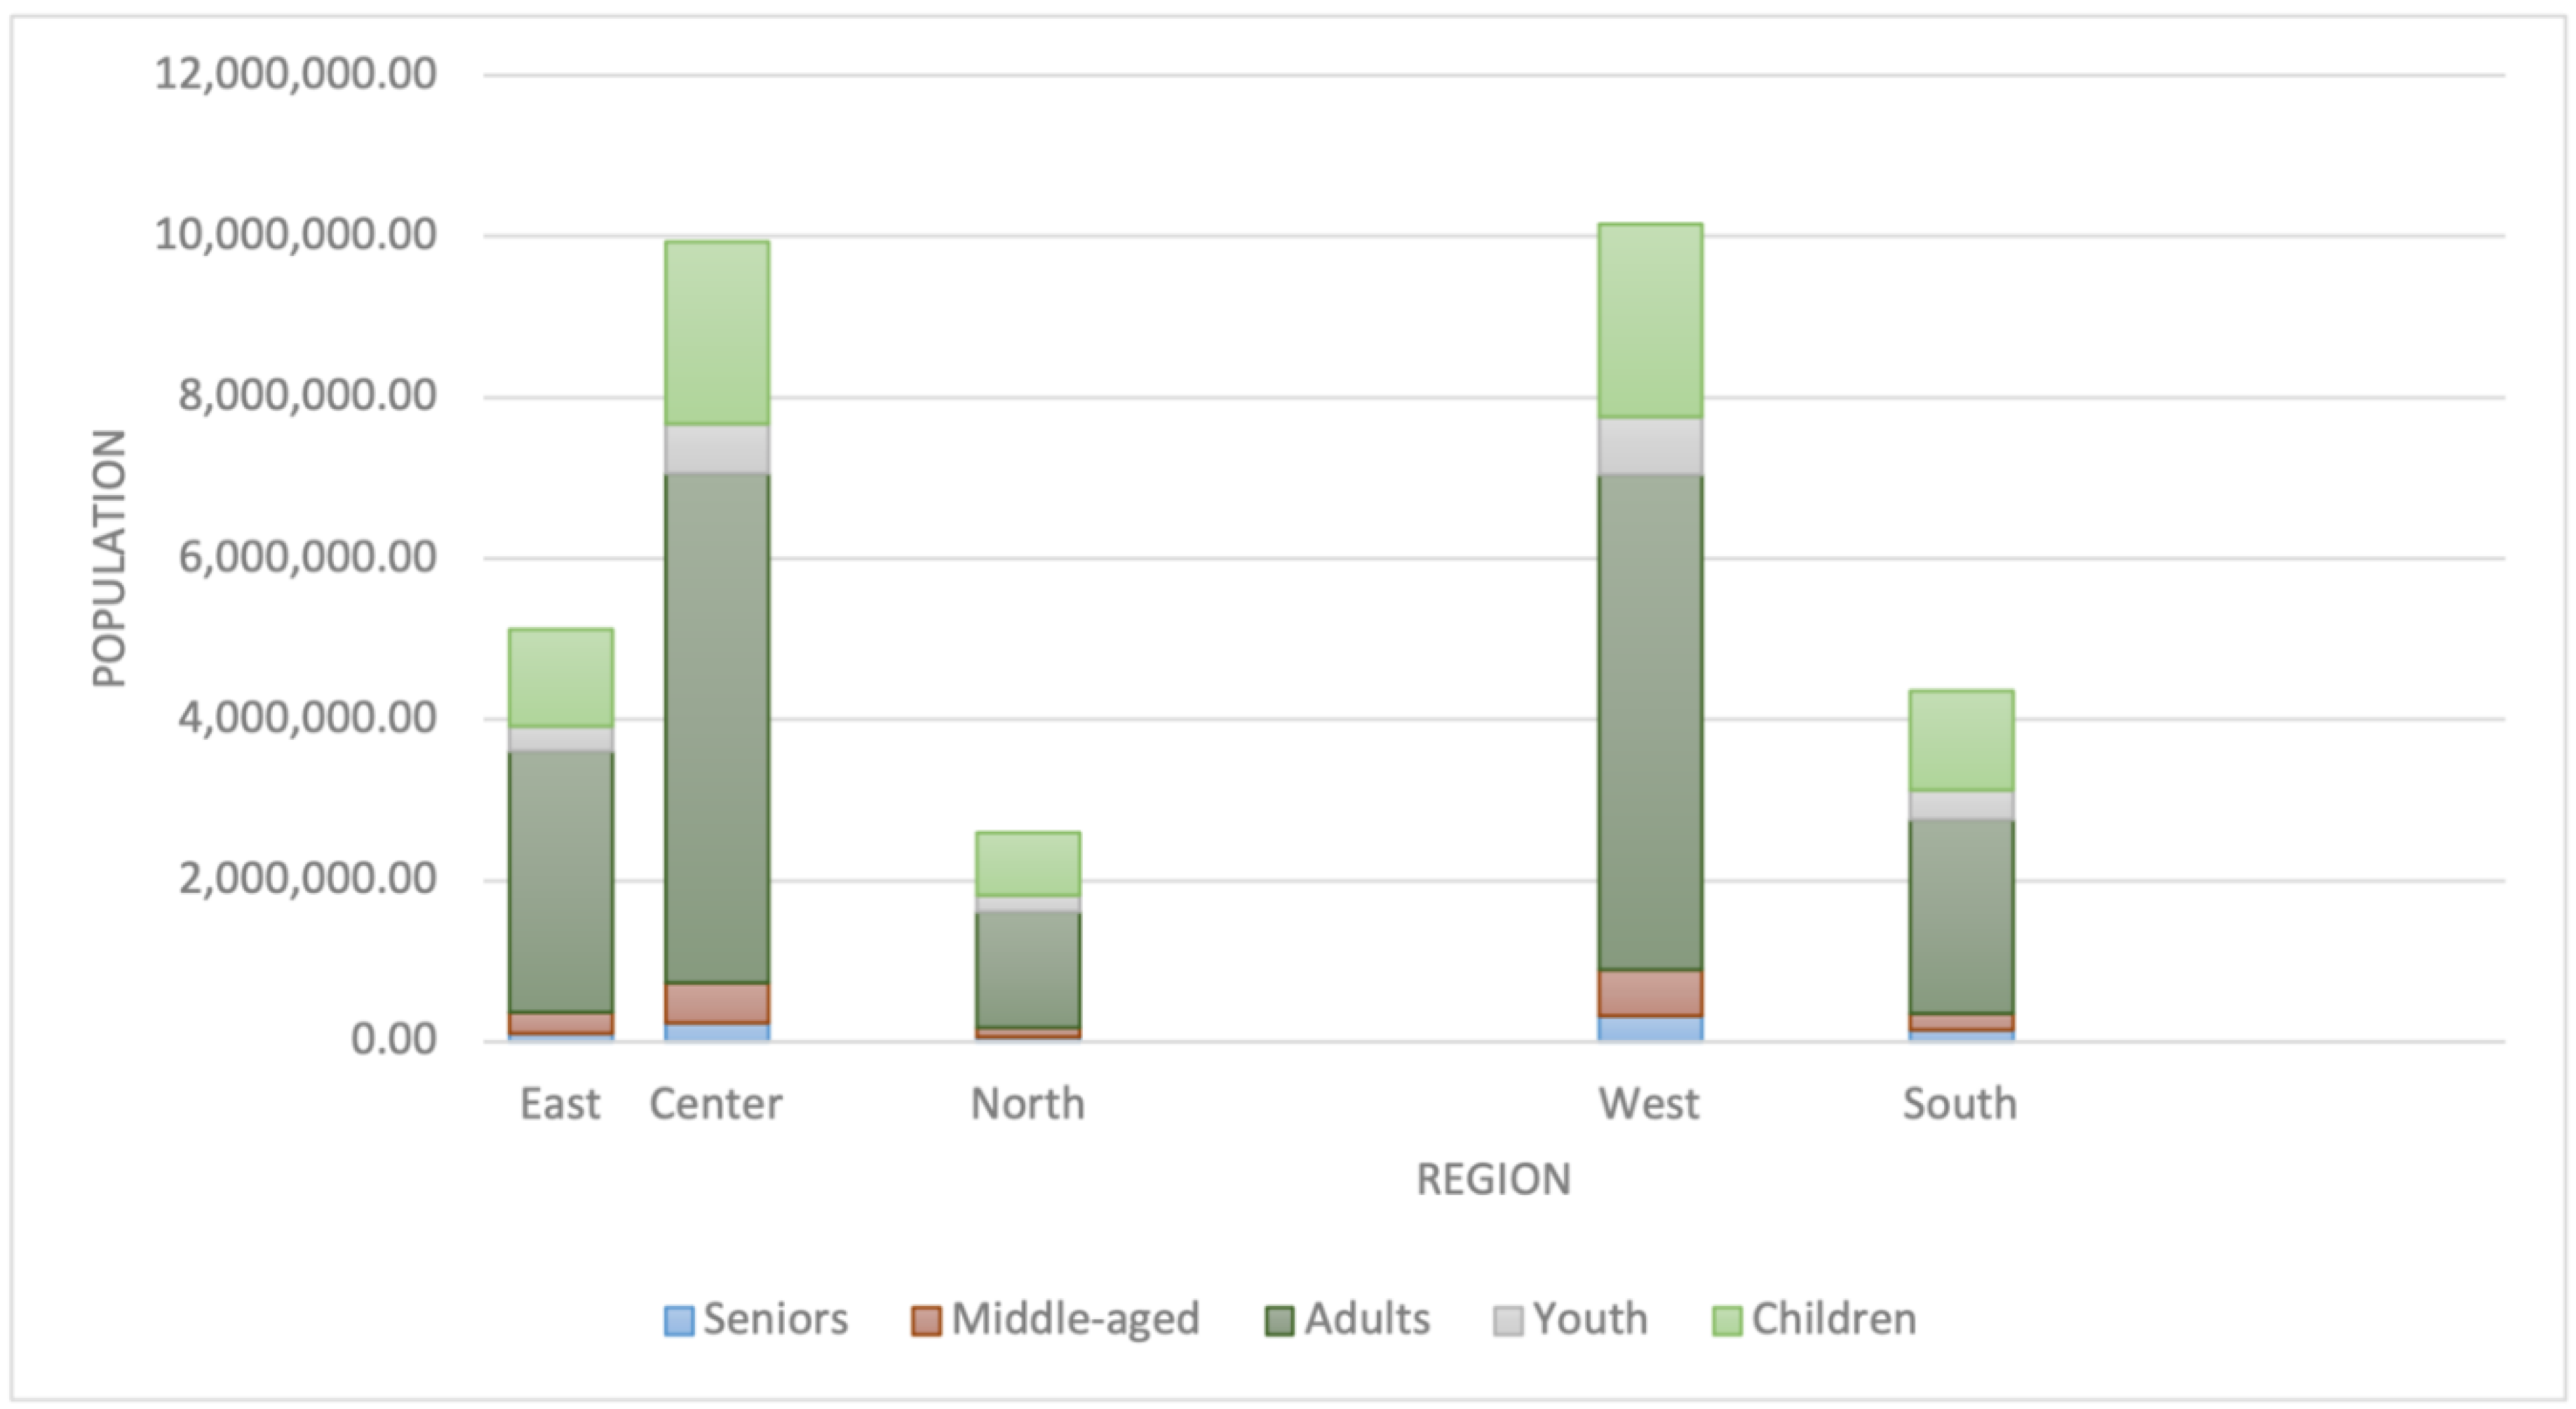
Figure 4.
Heatmaps representing reciporical contact patterns of all regions; (a) Saudi Arabia, (b) Eastren region, (c) entral region, (d) Northren region, I Westren region, and (f) Southren region.
Figure 4.
Heatmaps representing reciporical contact patterns of all regions; (a) Saudi Arabia, (b) Eastren region, (c) entral region, (d) Northren region, I Westren region, and (f) Southren region.
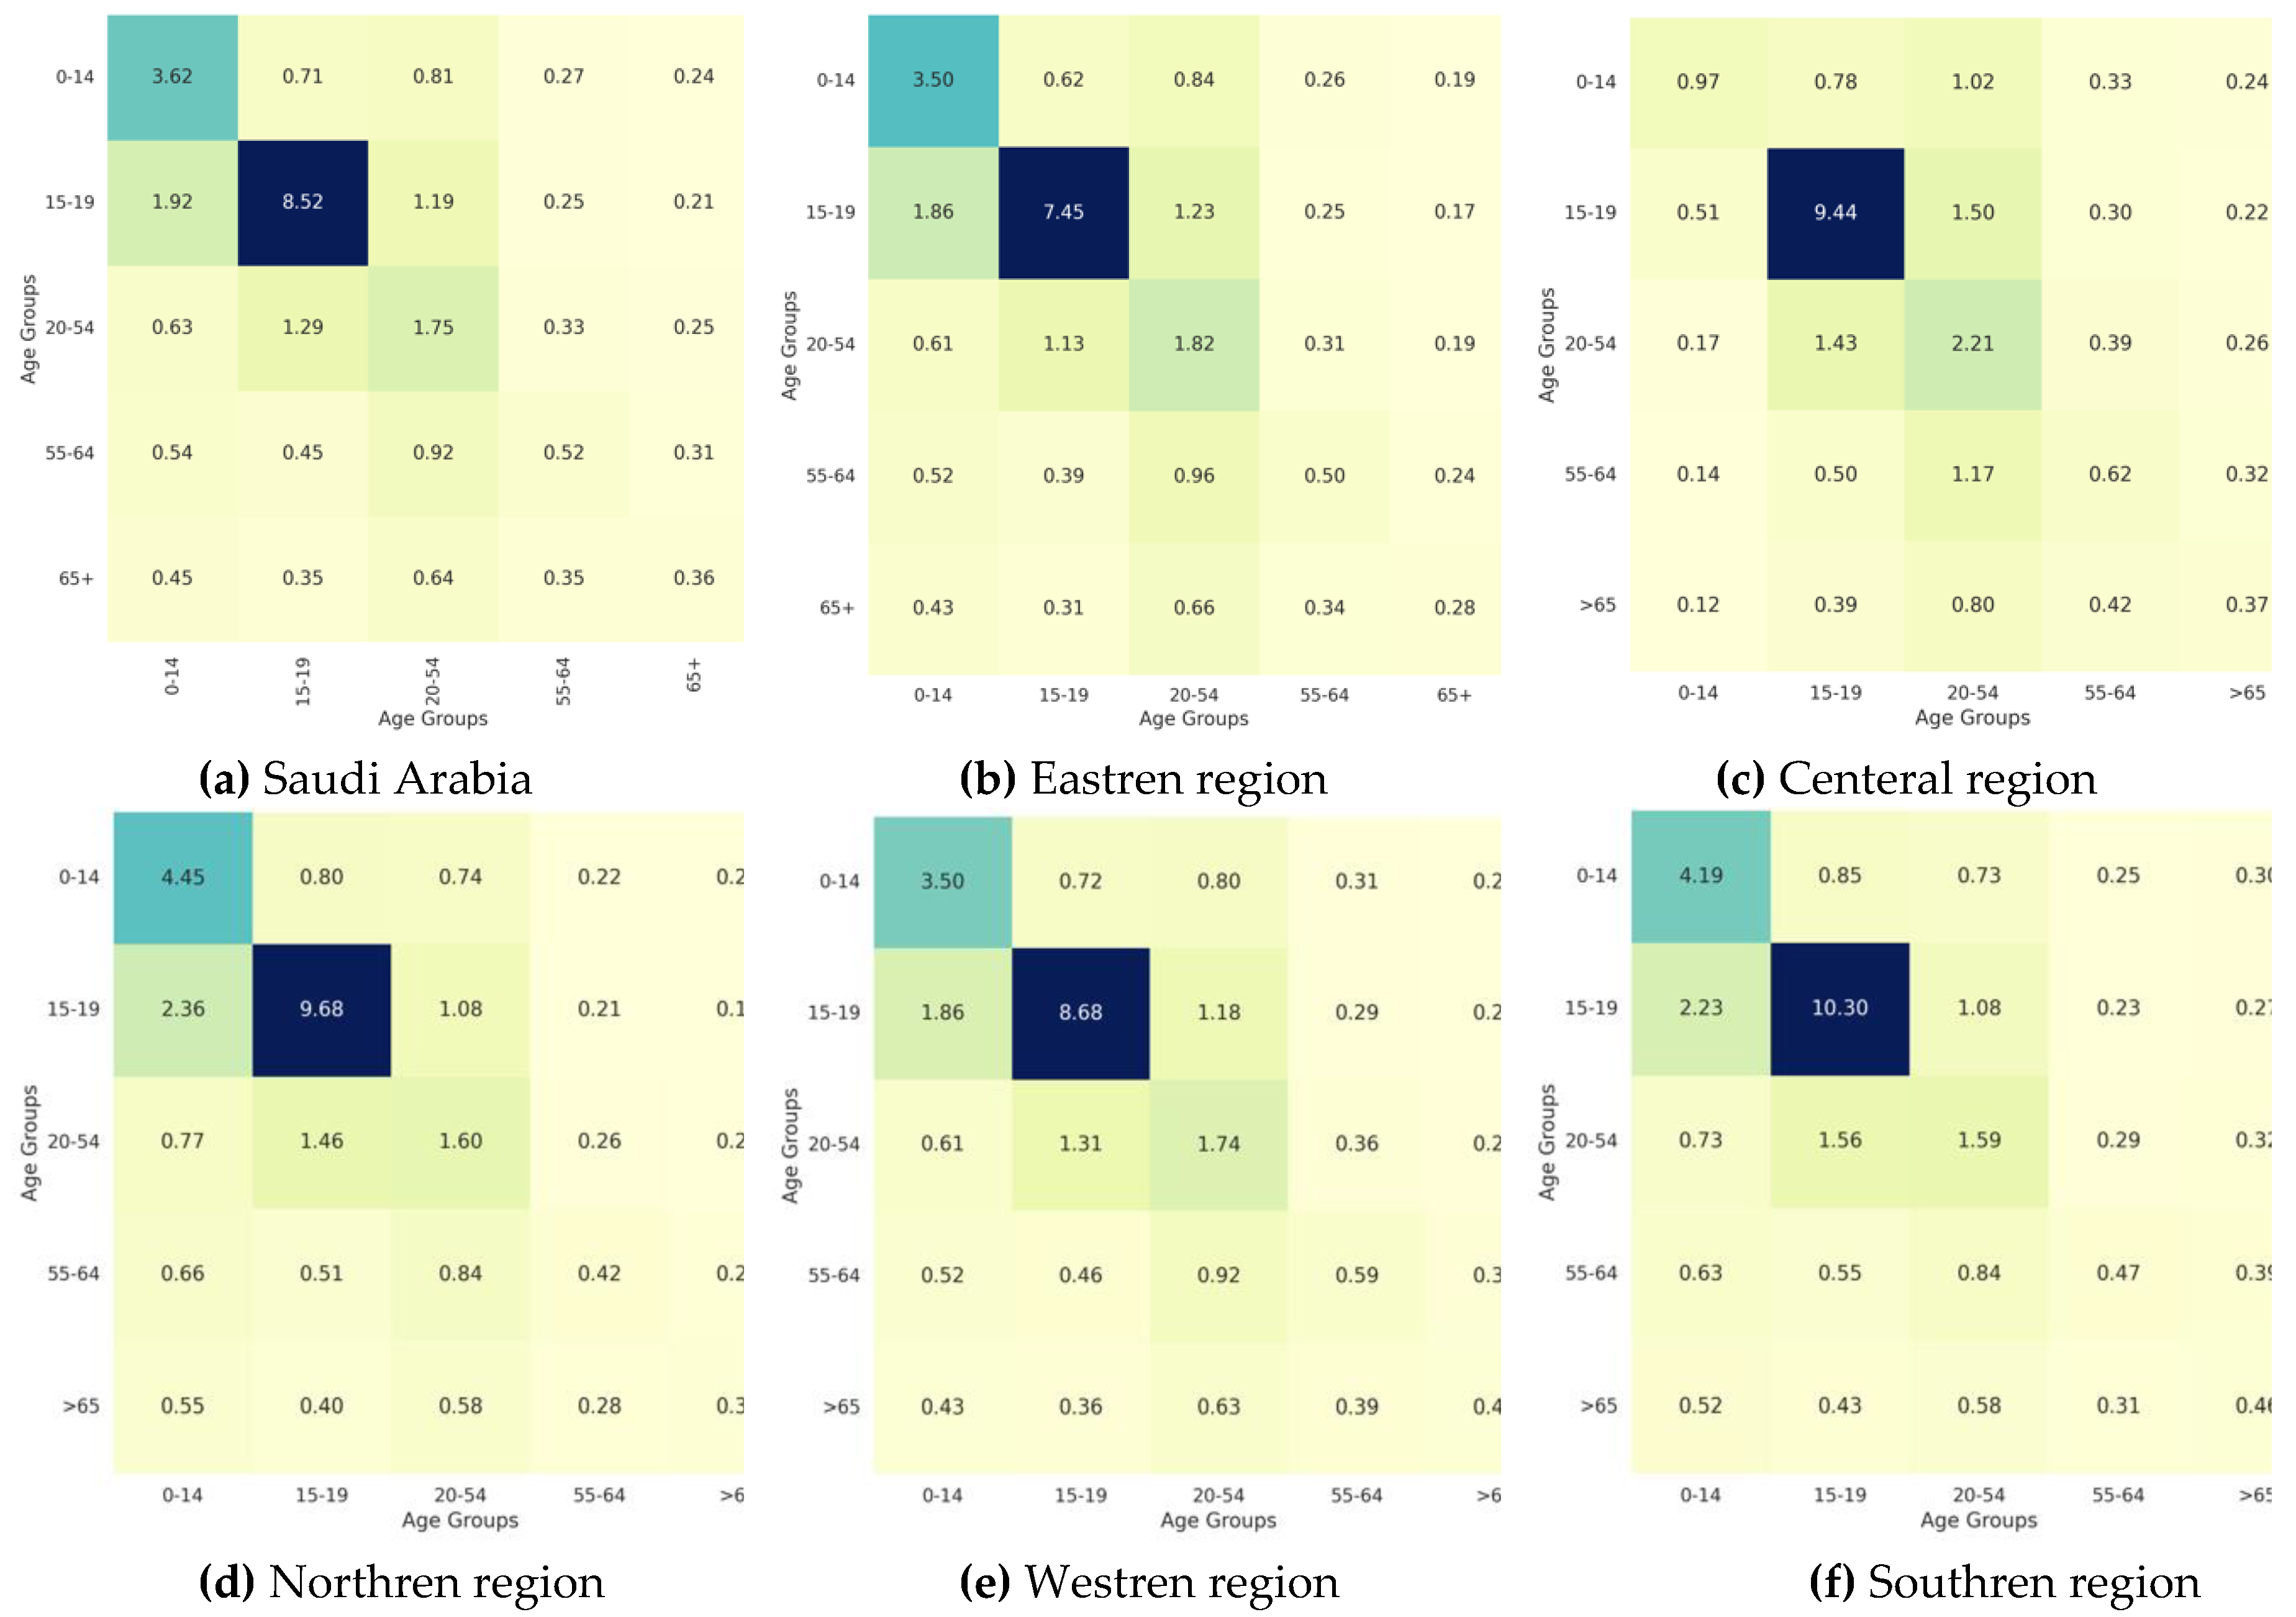
Figure 5.
Vaccination Strategy for the Case of Saudi Arabia.
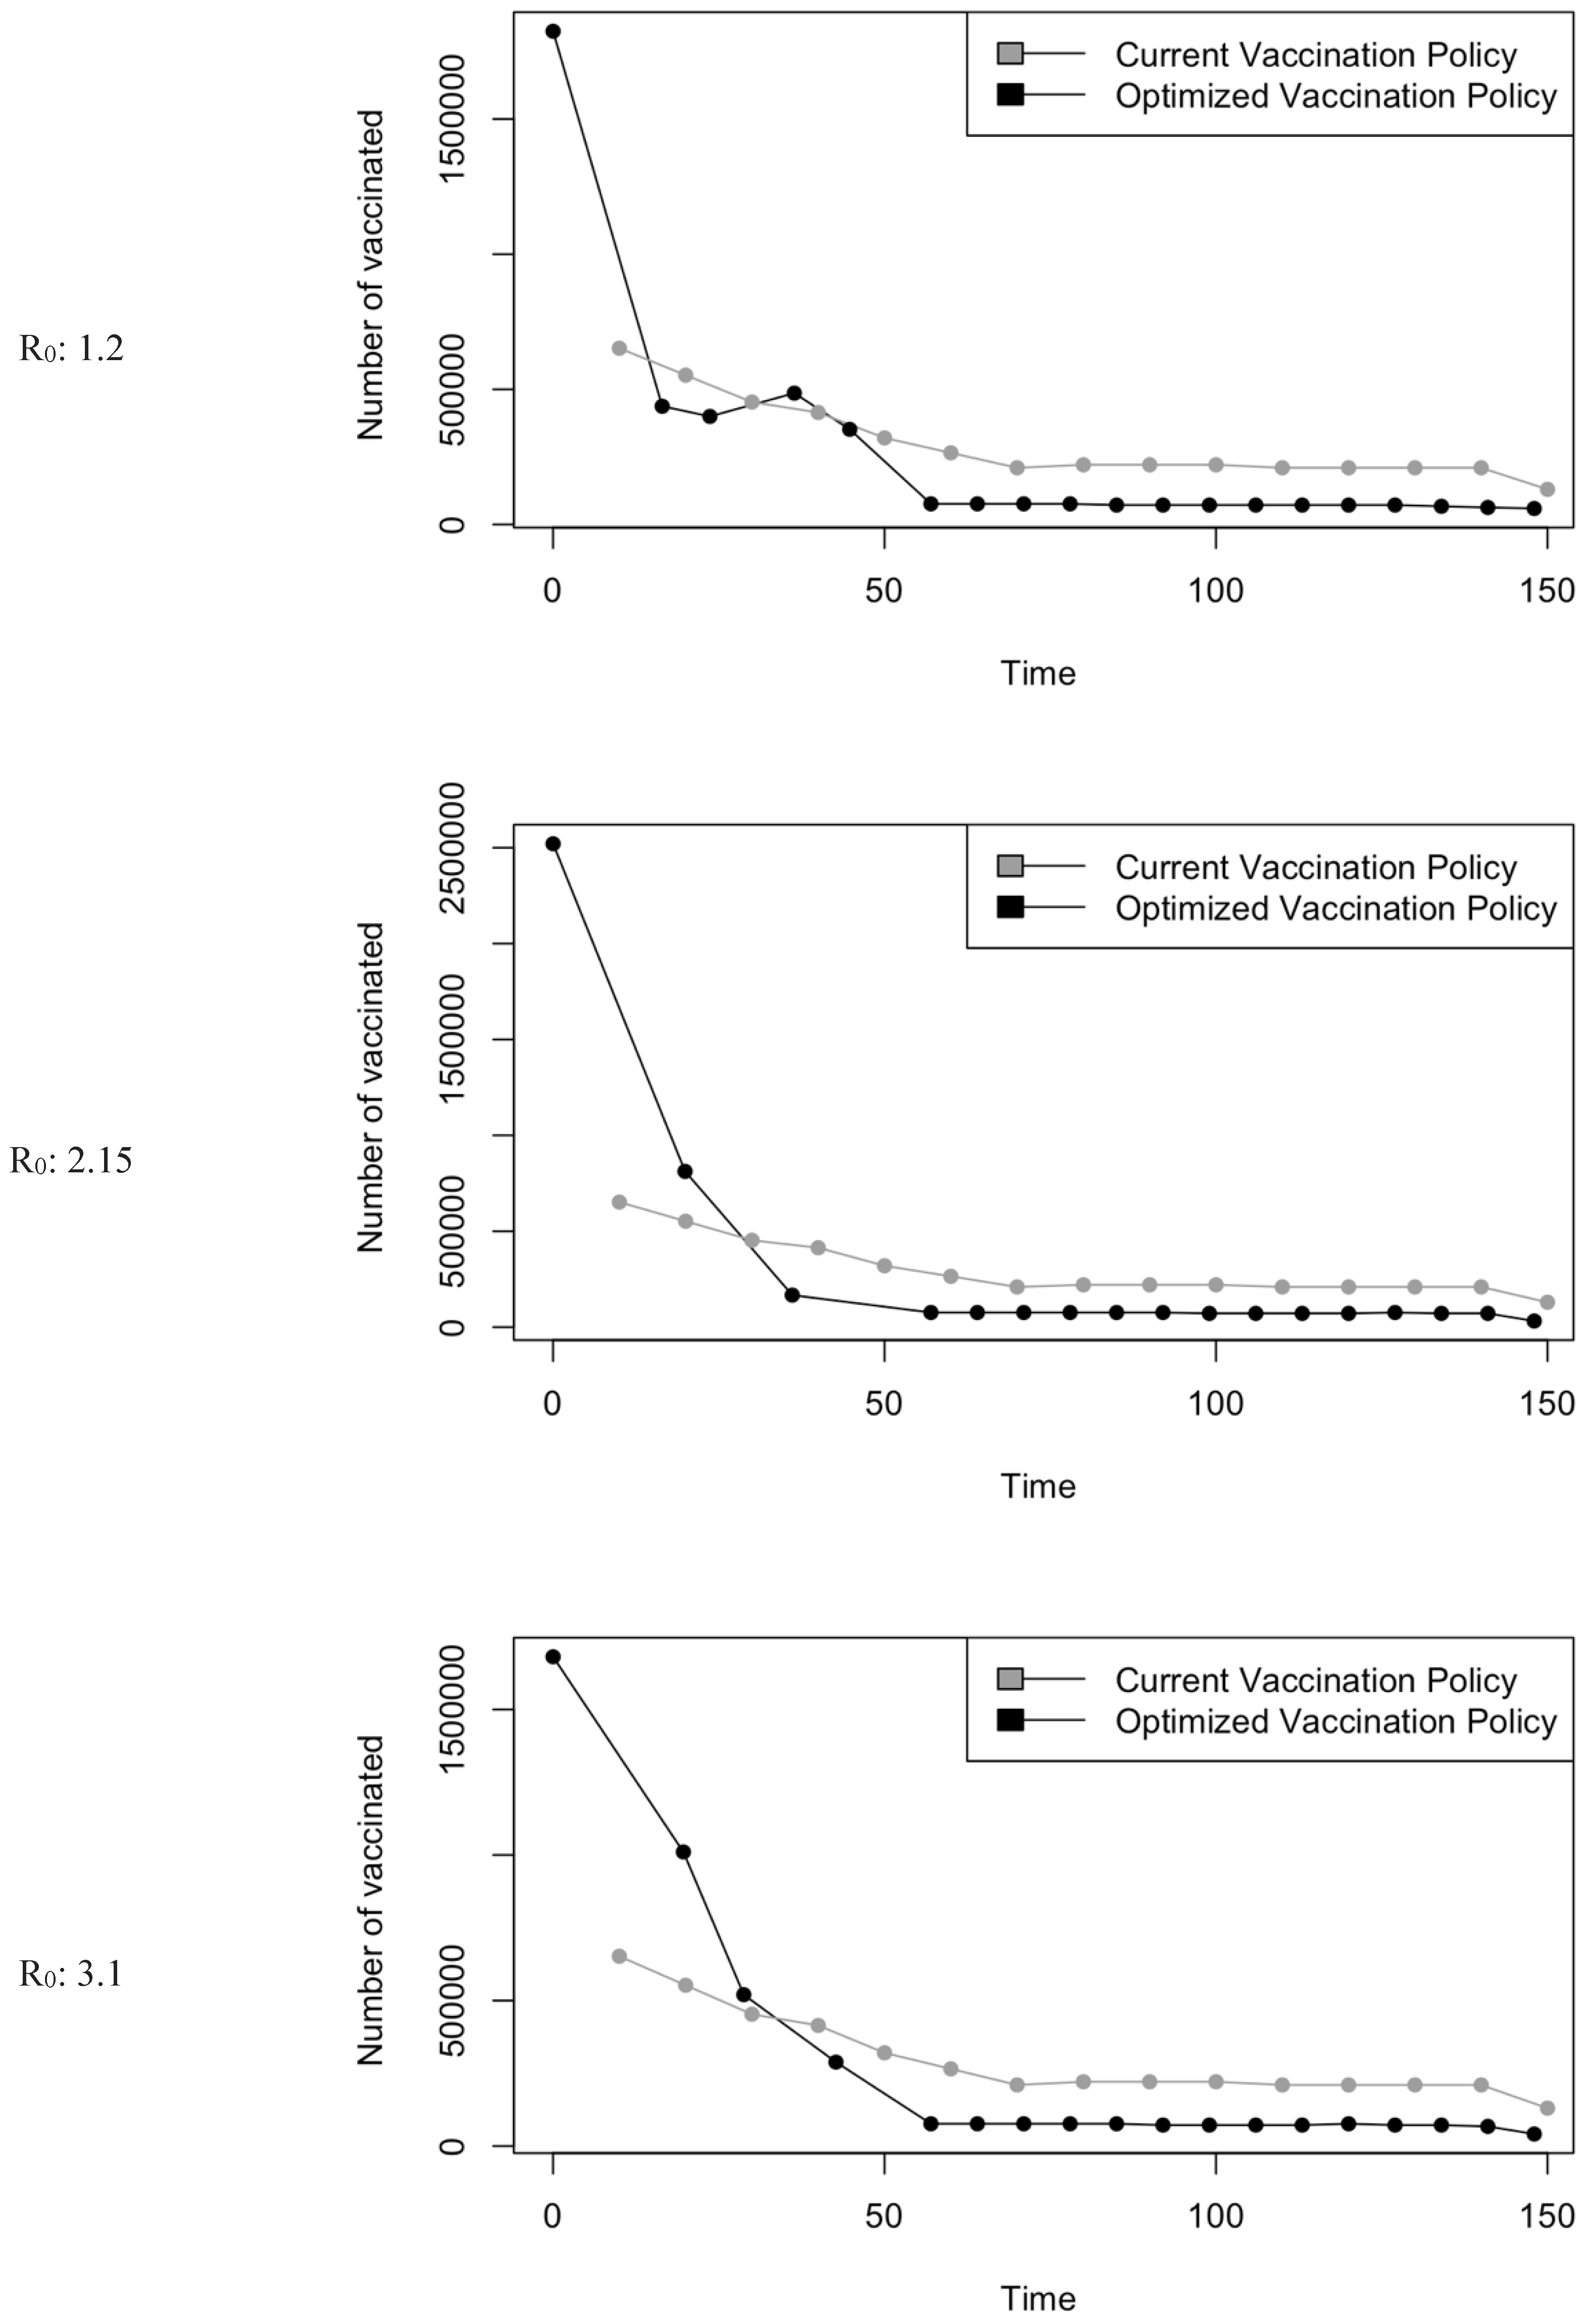
Figure 6.
Bar charts showing the number of (A) Infection (B) Hospitalizations, and (C) Mortality over a given period for R0: 1.2.
Figure 6.
Bar charts showing the number of (A) Infection (B) Hospitalizations, and (C) Mortality over a given period for R0: 1.2.
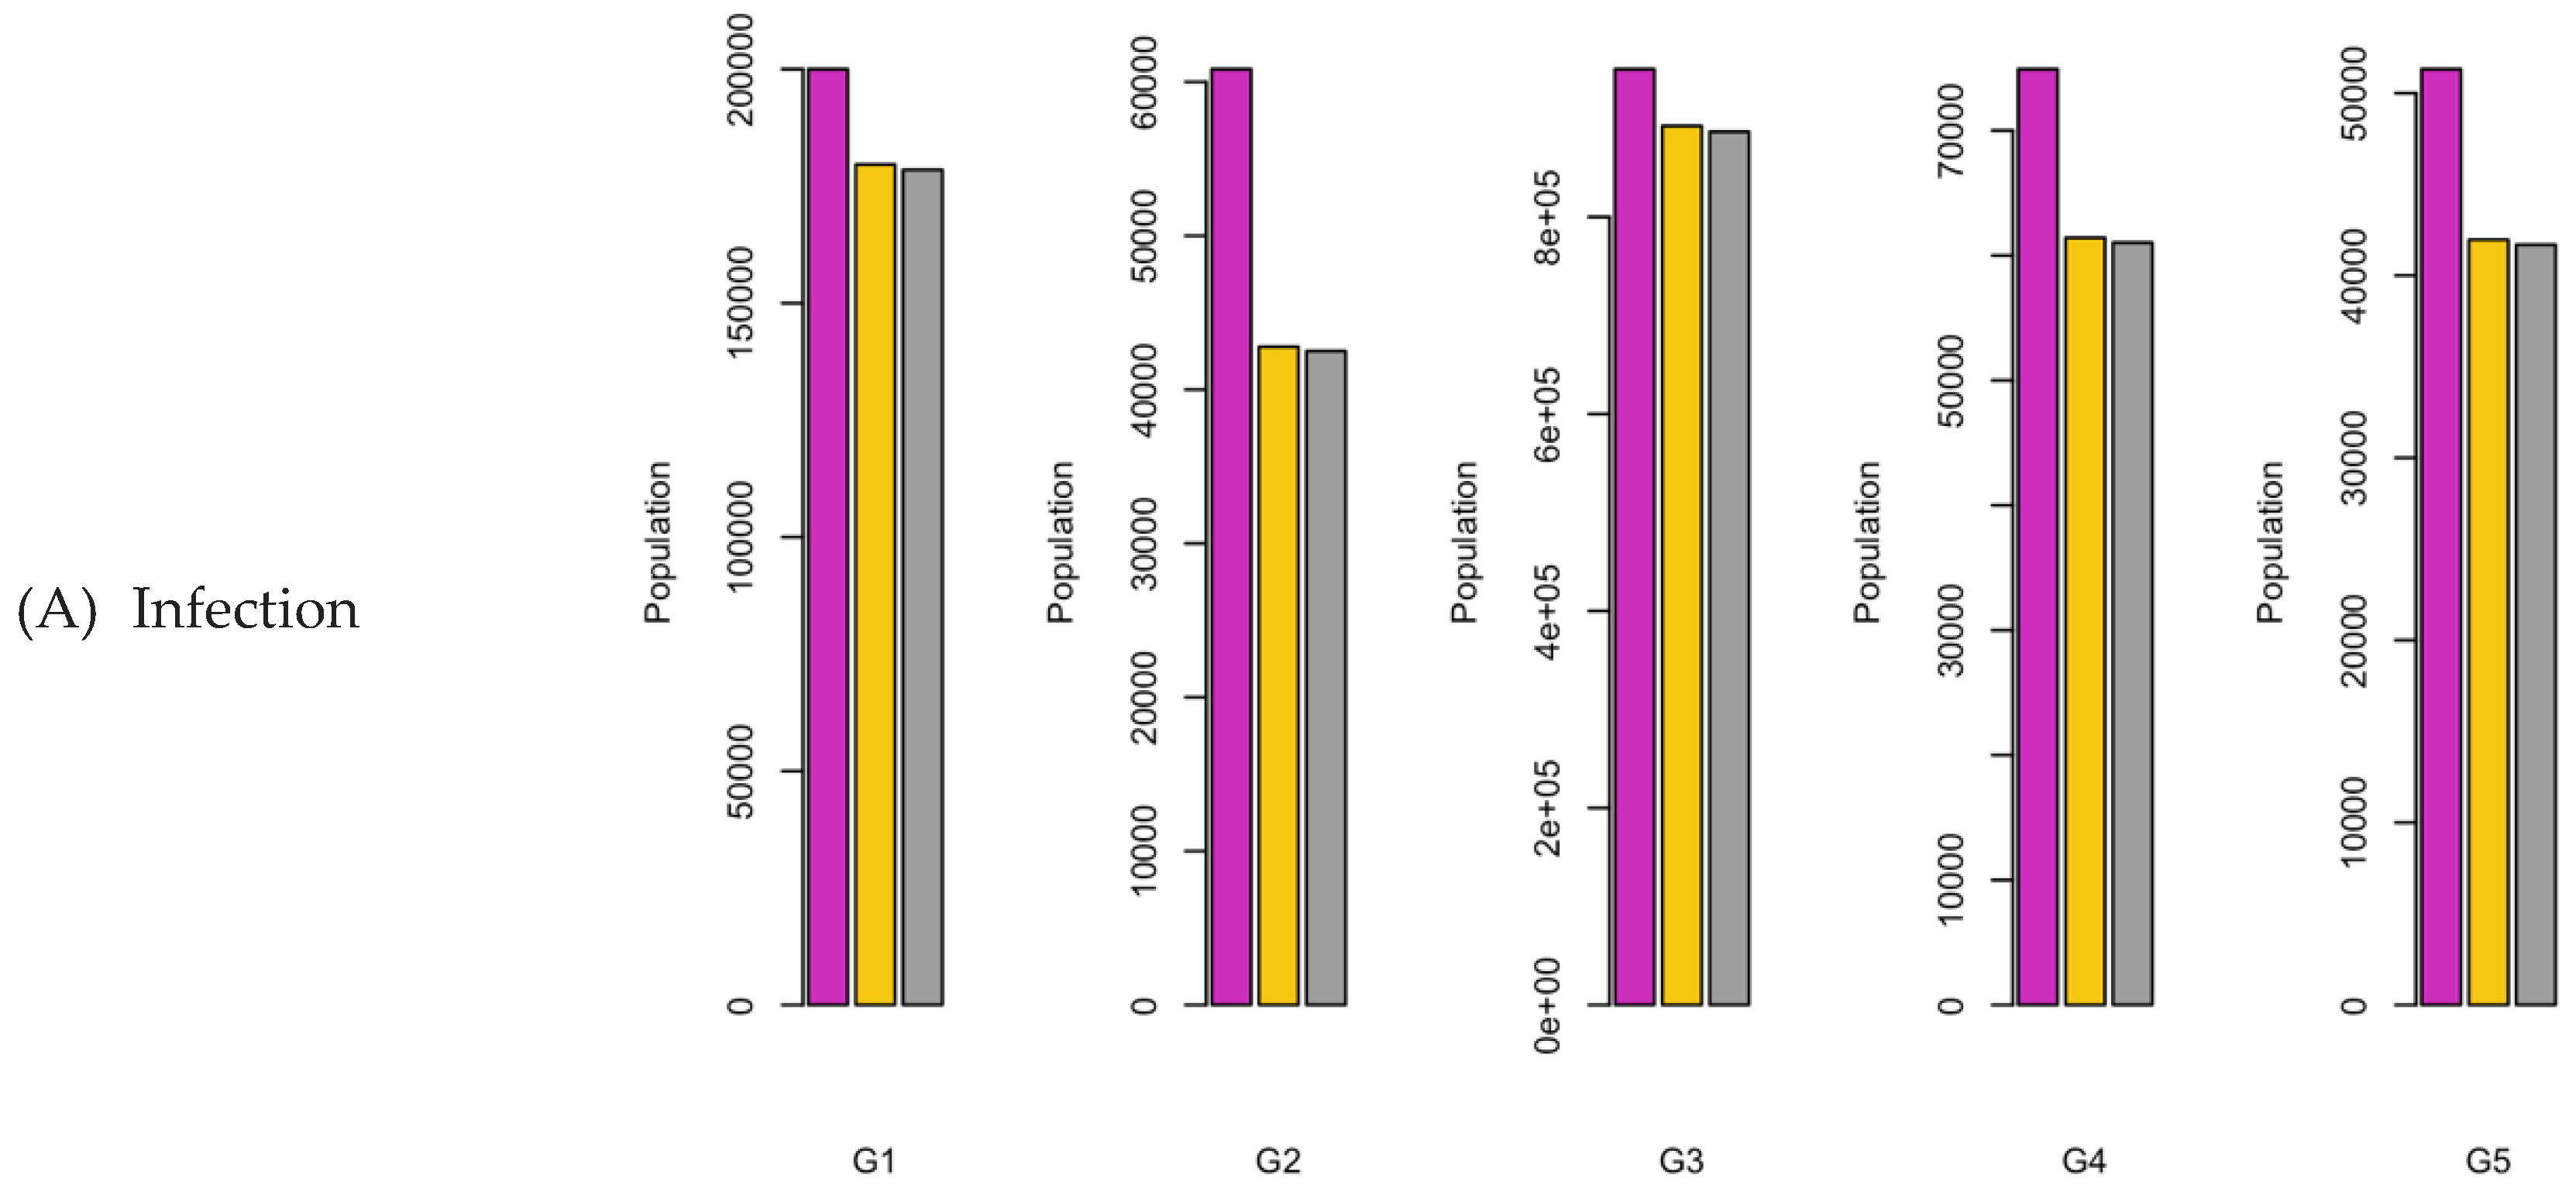
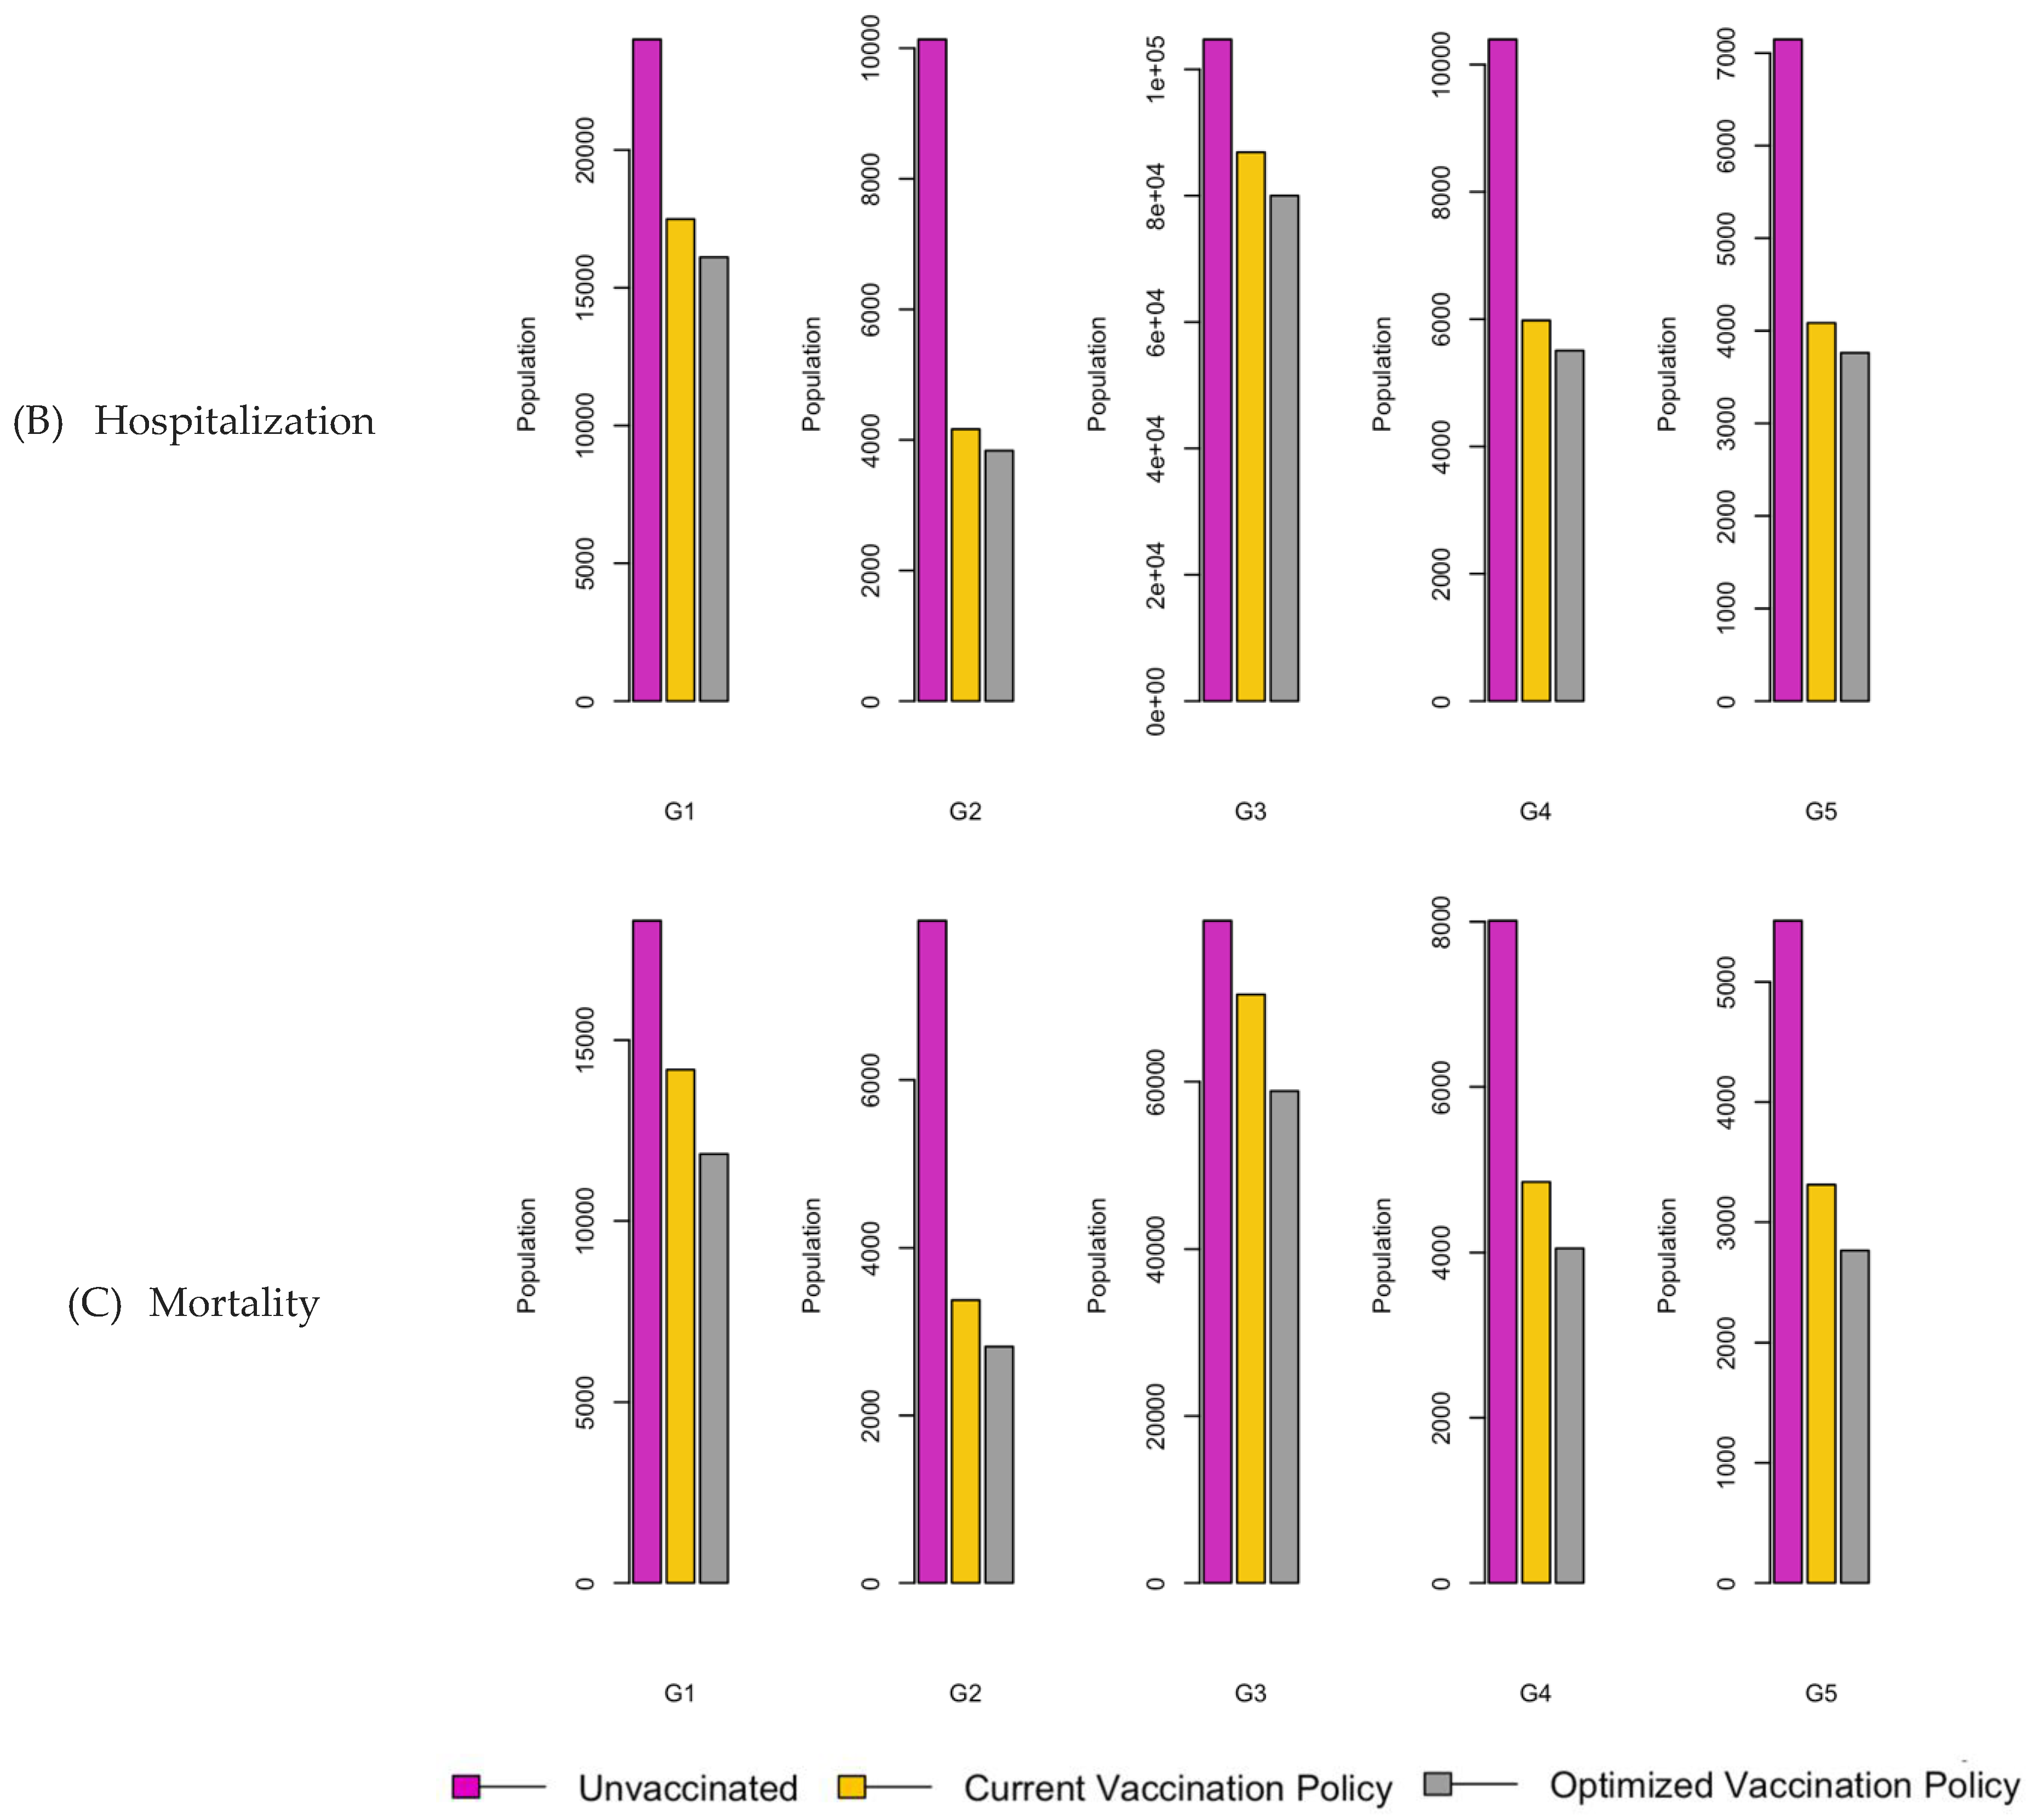
Figure 7.
Bar charts showing the number of (A) Infection (B) Hospitalizations, and (C) Mortality over a given period for R0: 2.15.
Figure 7.
Bar charts showing the number of (A) Infection (B) Hospitalizations, and (C) Mortality over a given period for R0: 2.15.
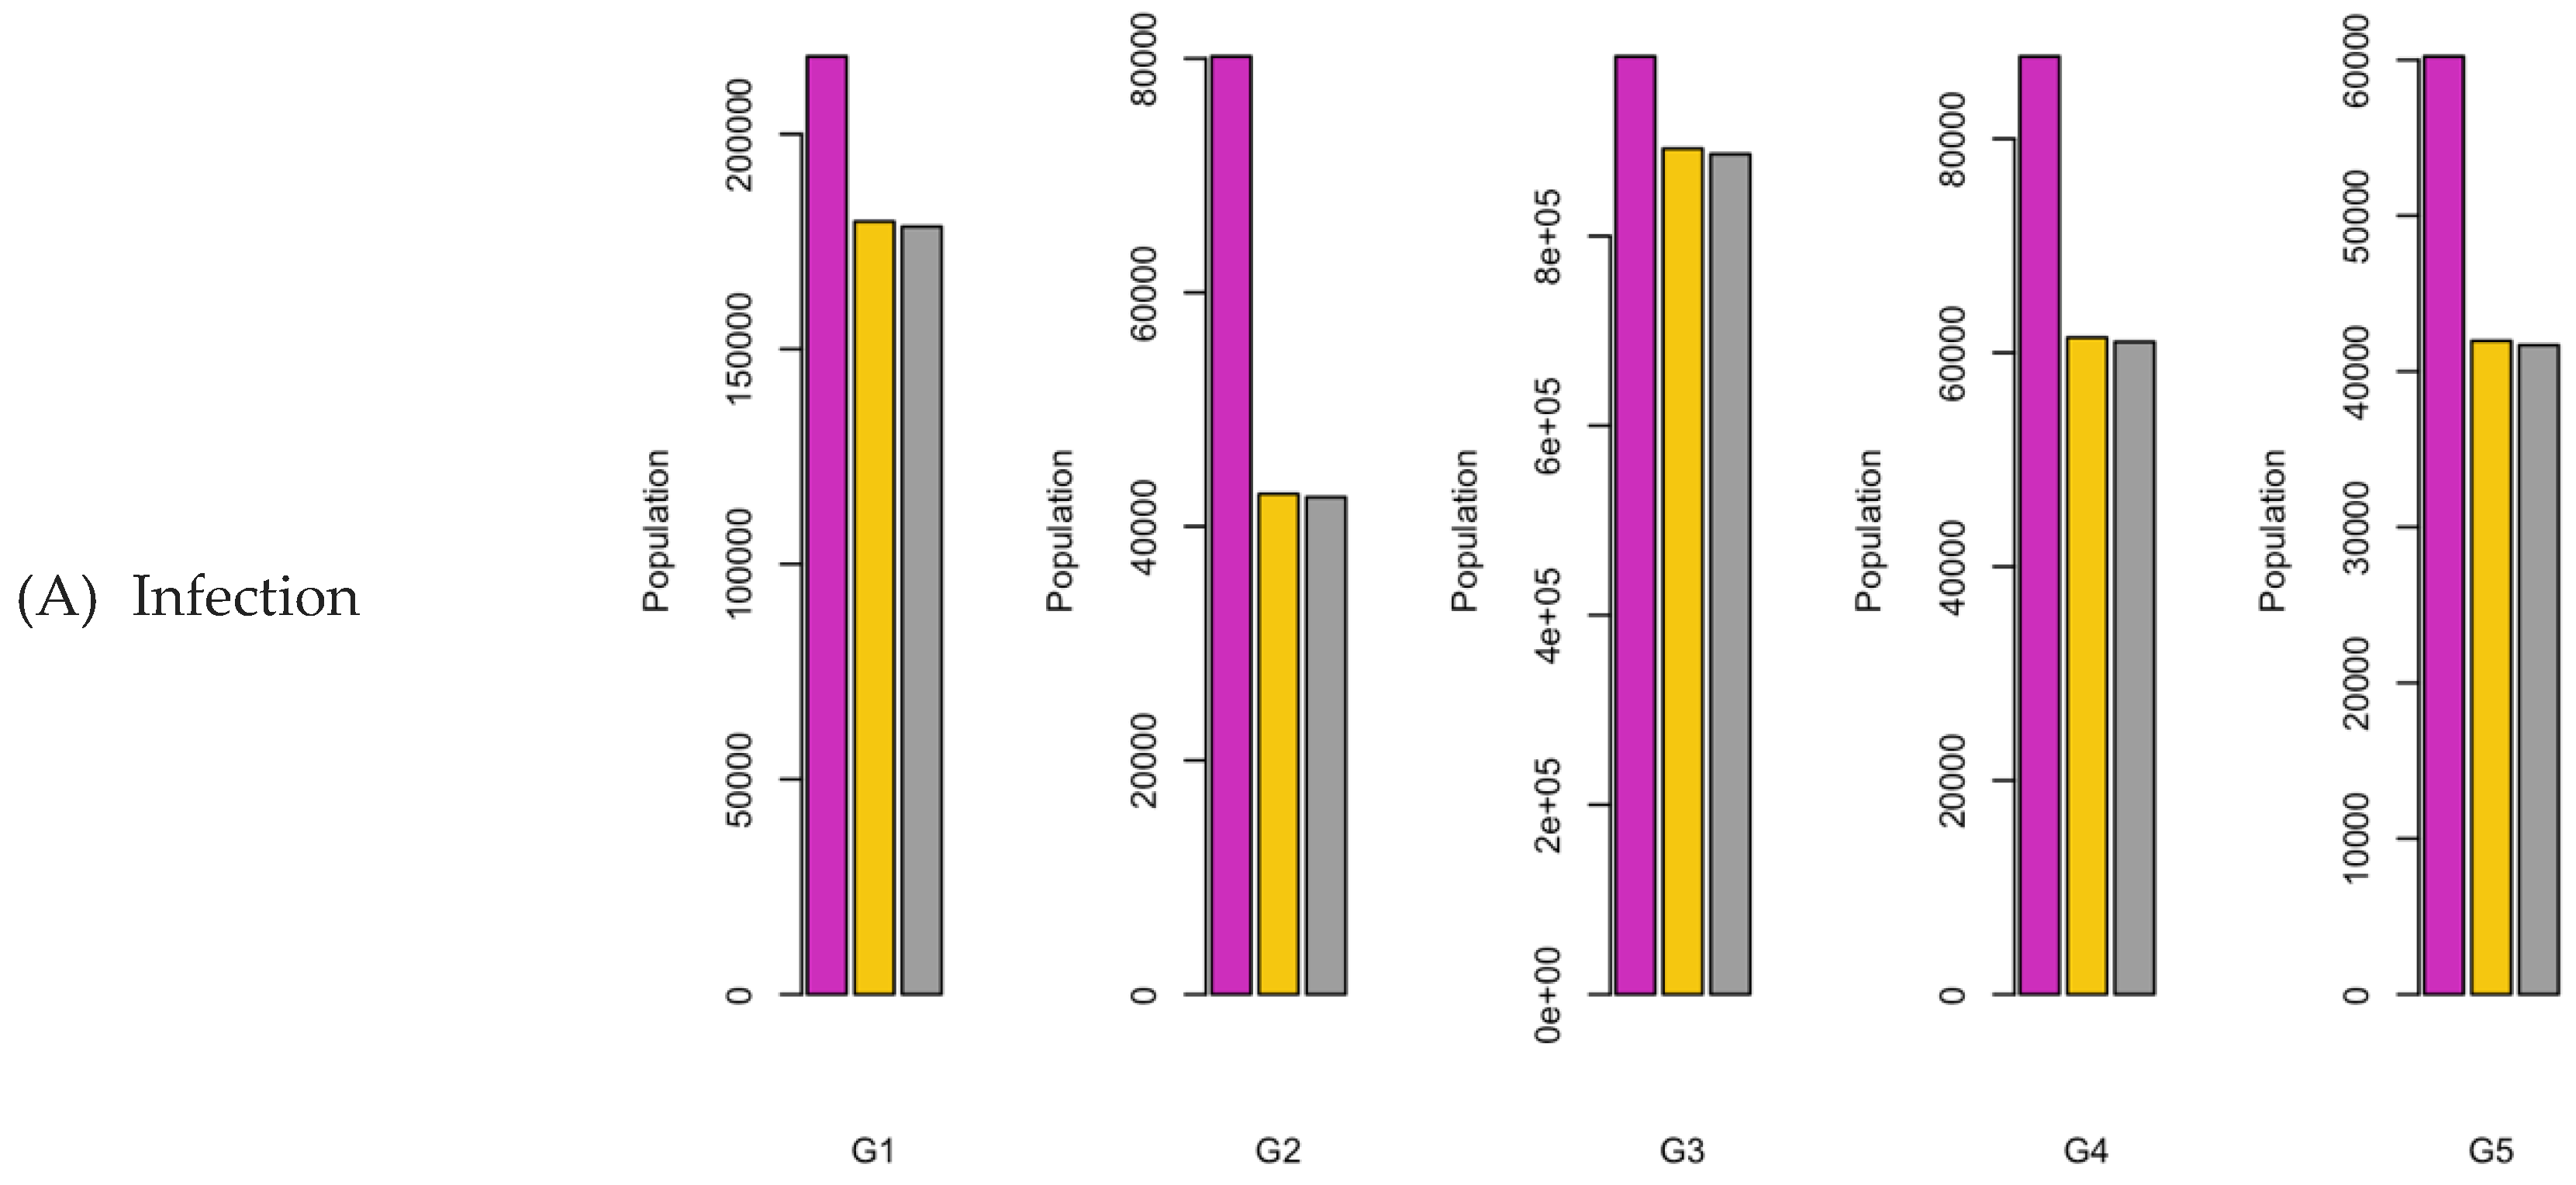
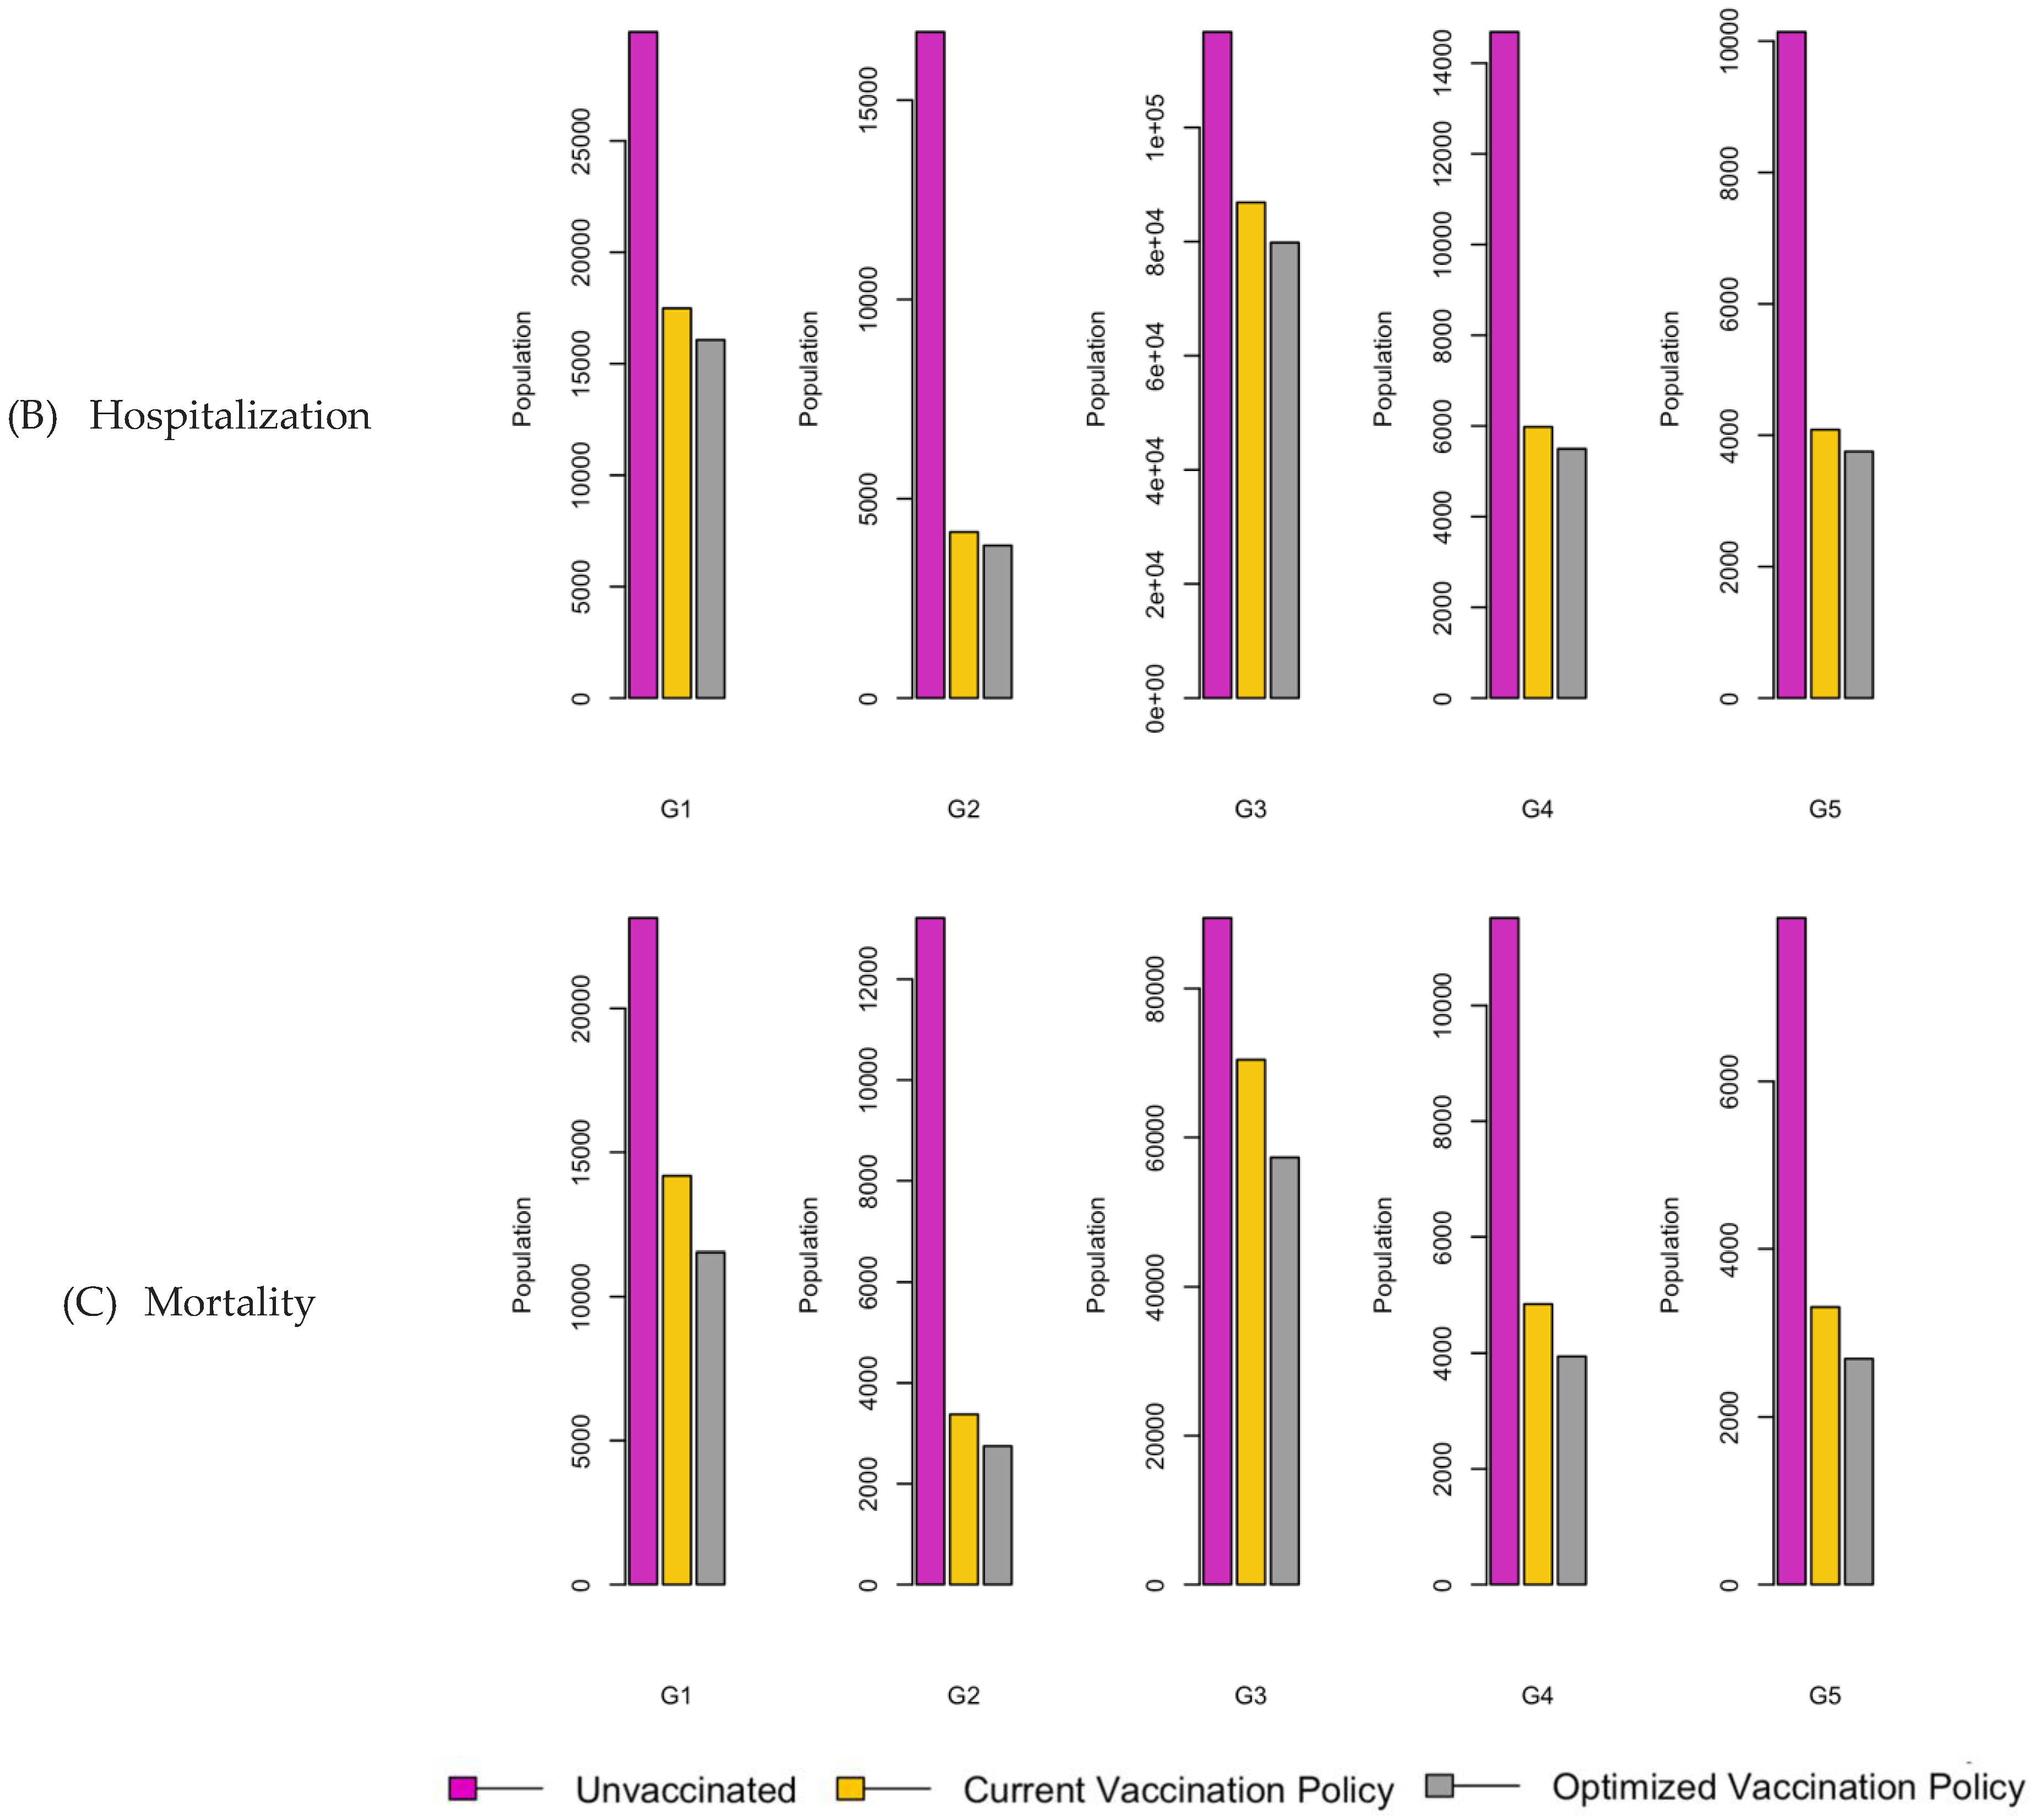
Figure 8.
Bar charts showing the number of (A) Infection (B) Hospitalizations, and (C) Mortality over a given period for R0: 3.1.
Figure 8.
Bar charts showing the number of (A) Infection (B) Hospitalizations, and (C) Mortality over a given period for R0: 3.1.
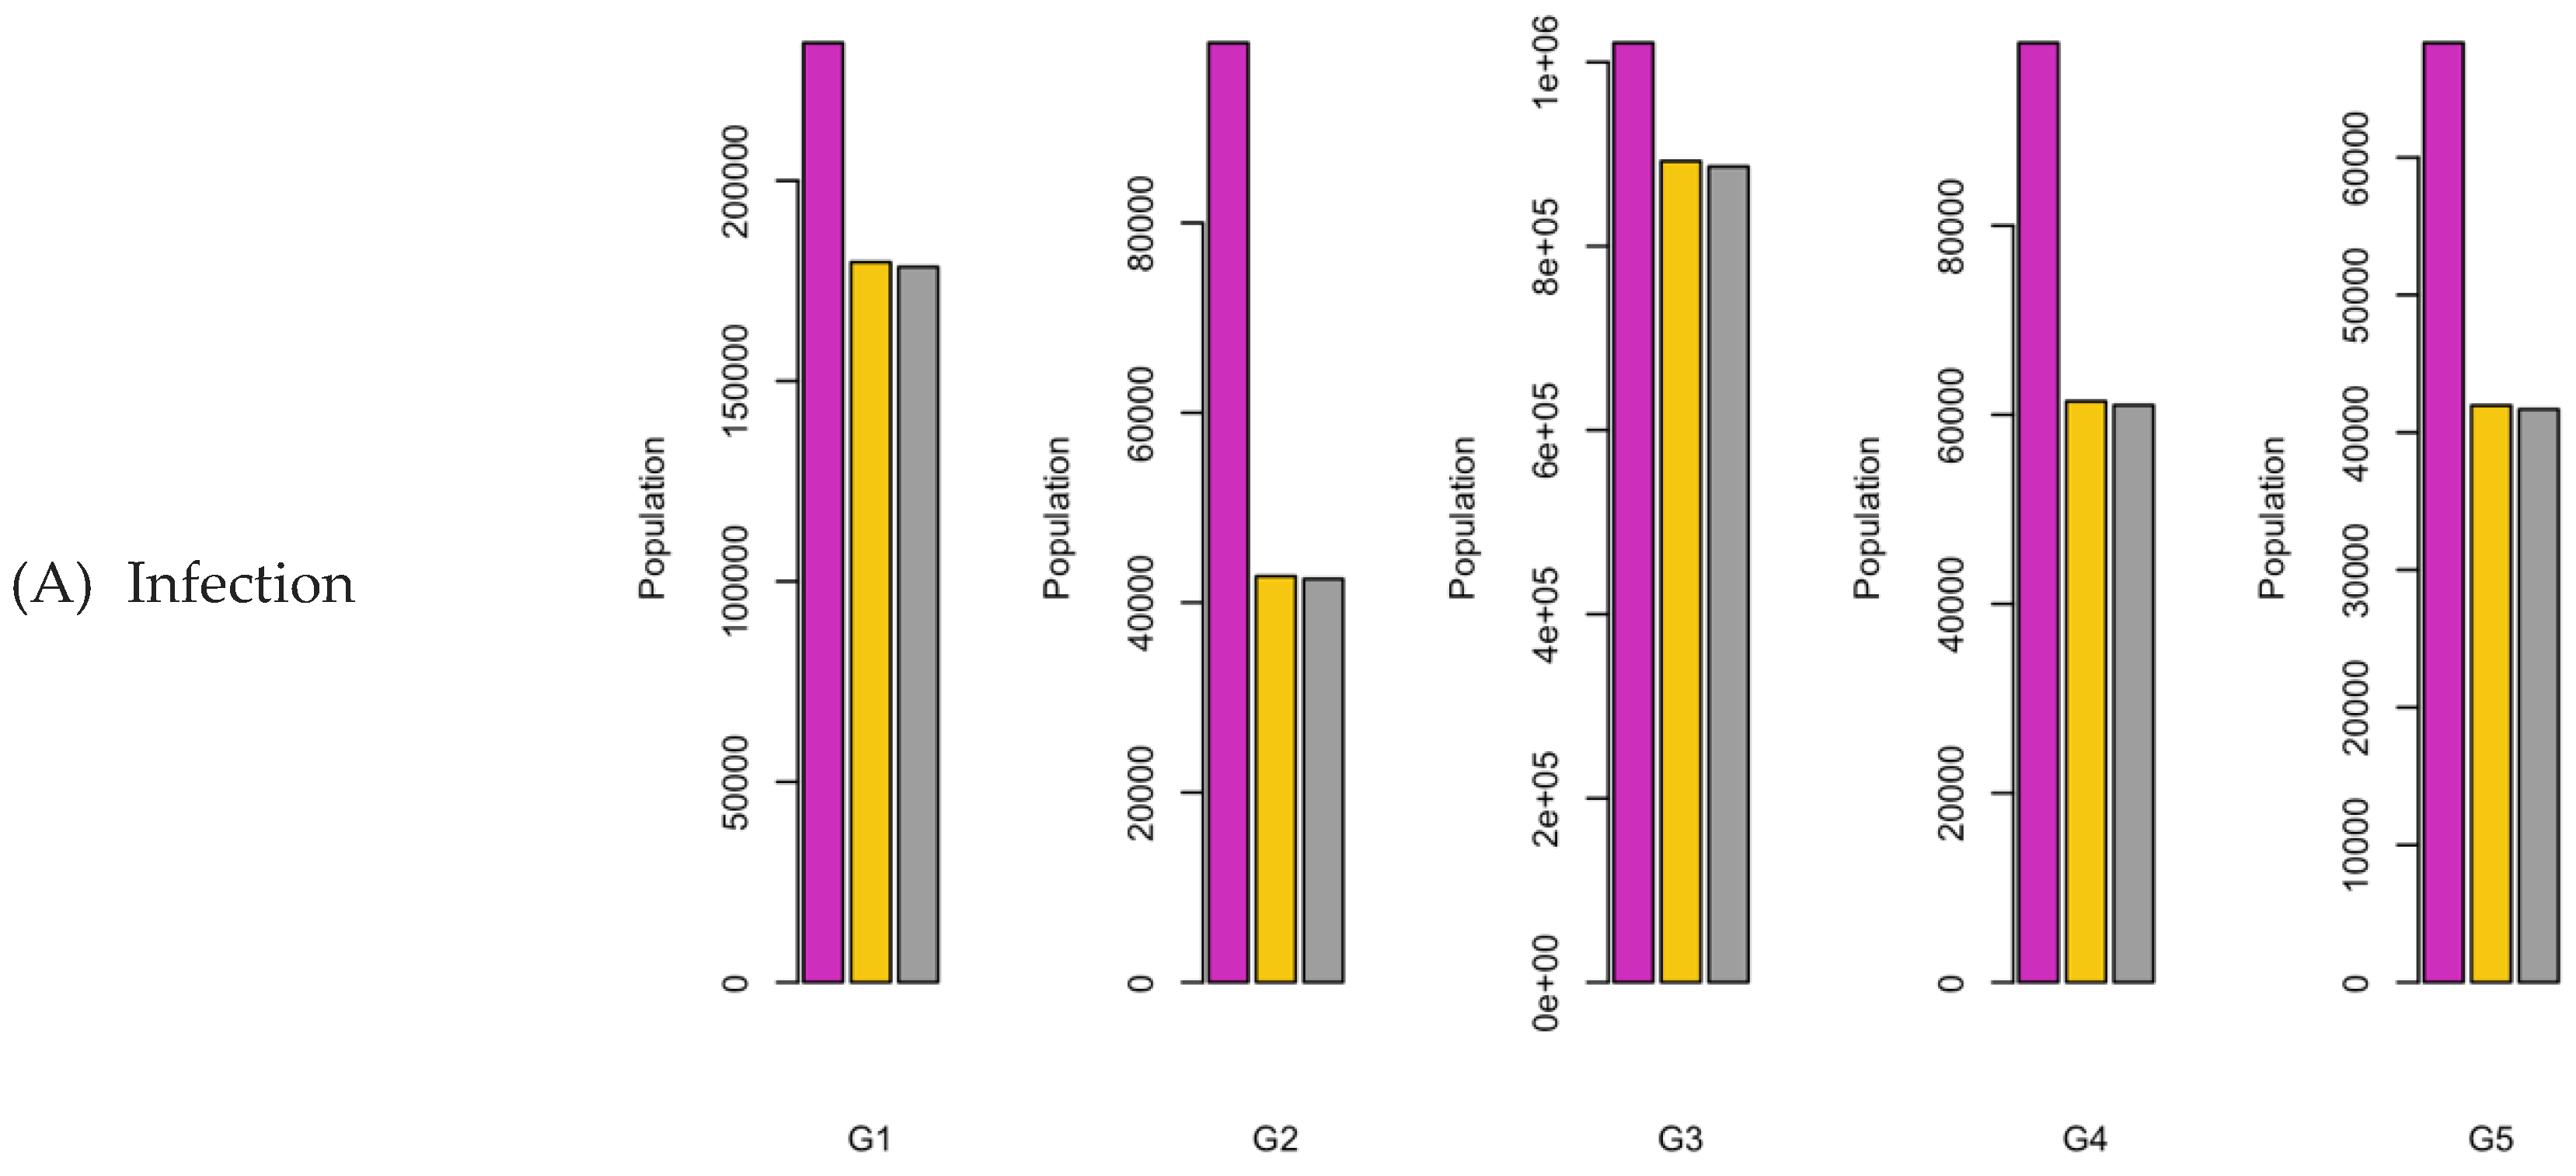
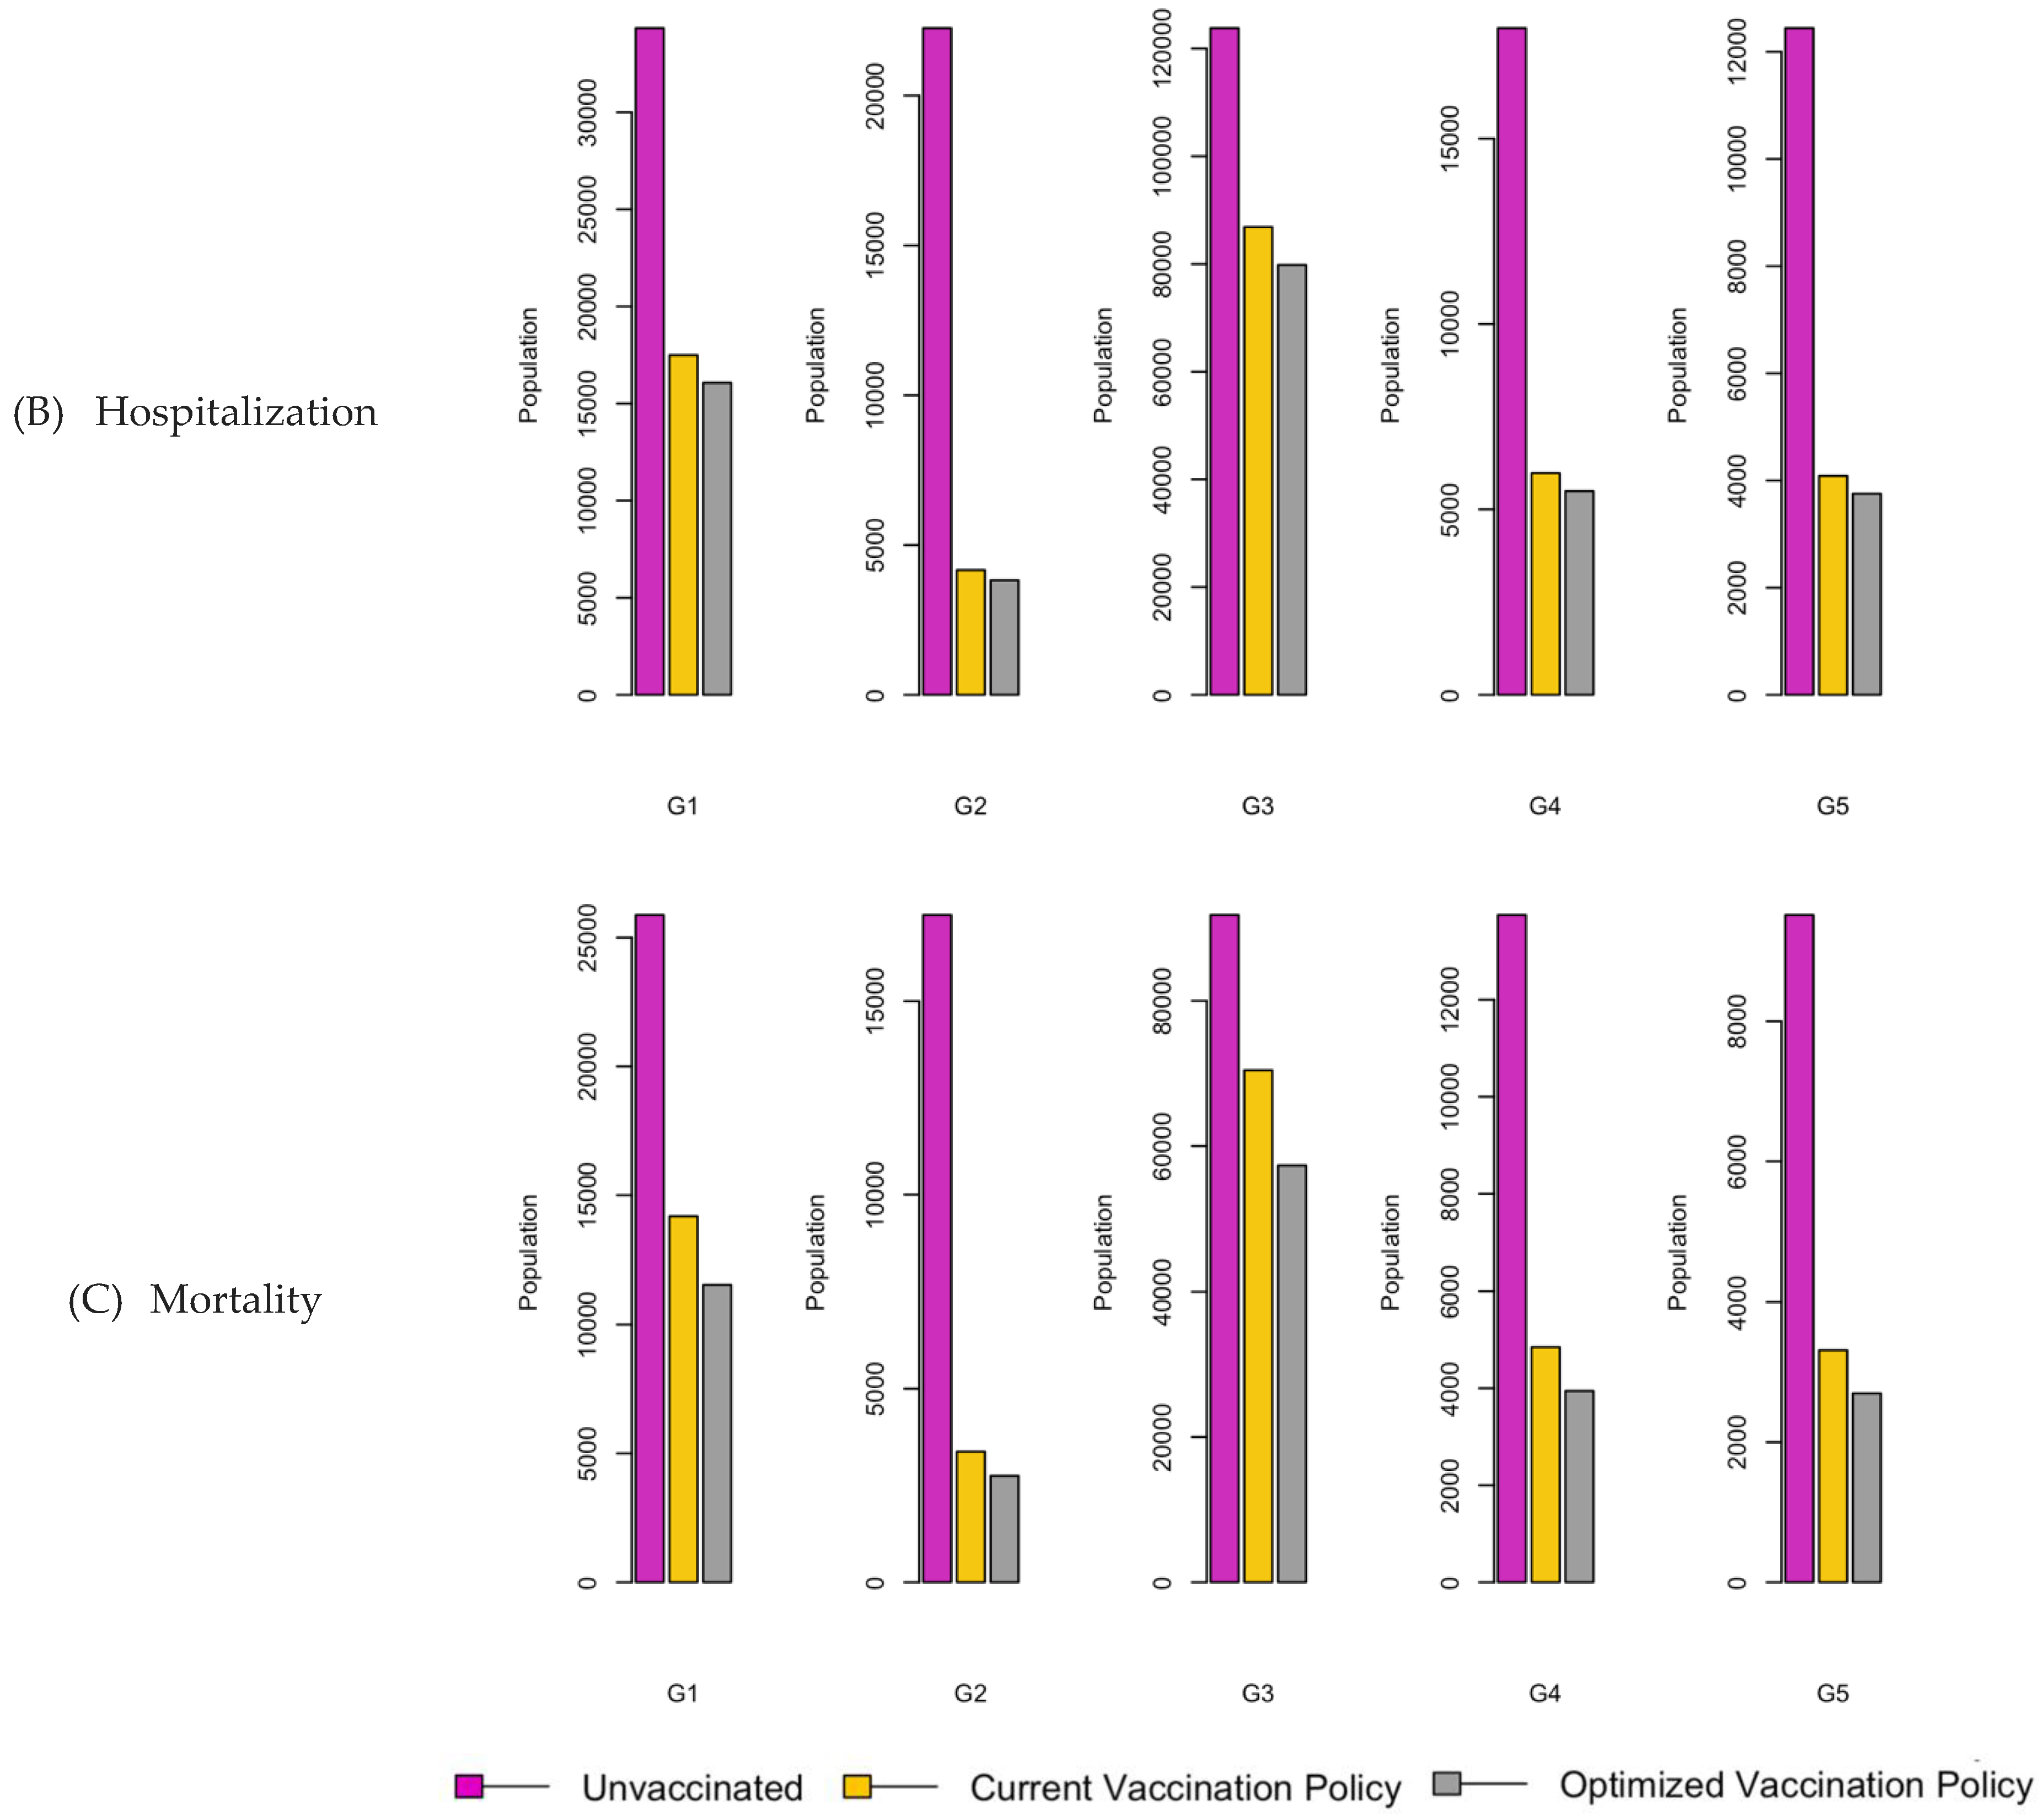
Figure 9.
Boxplot representing mean values of the three factors.
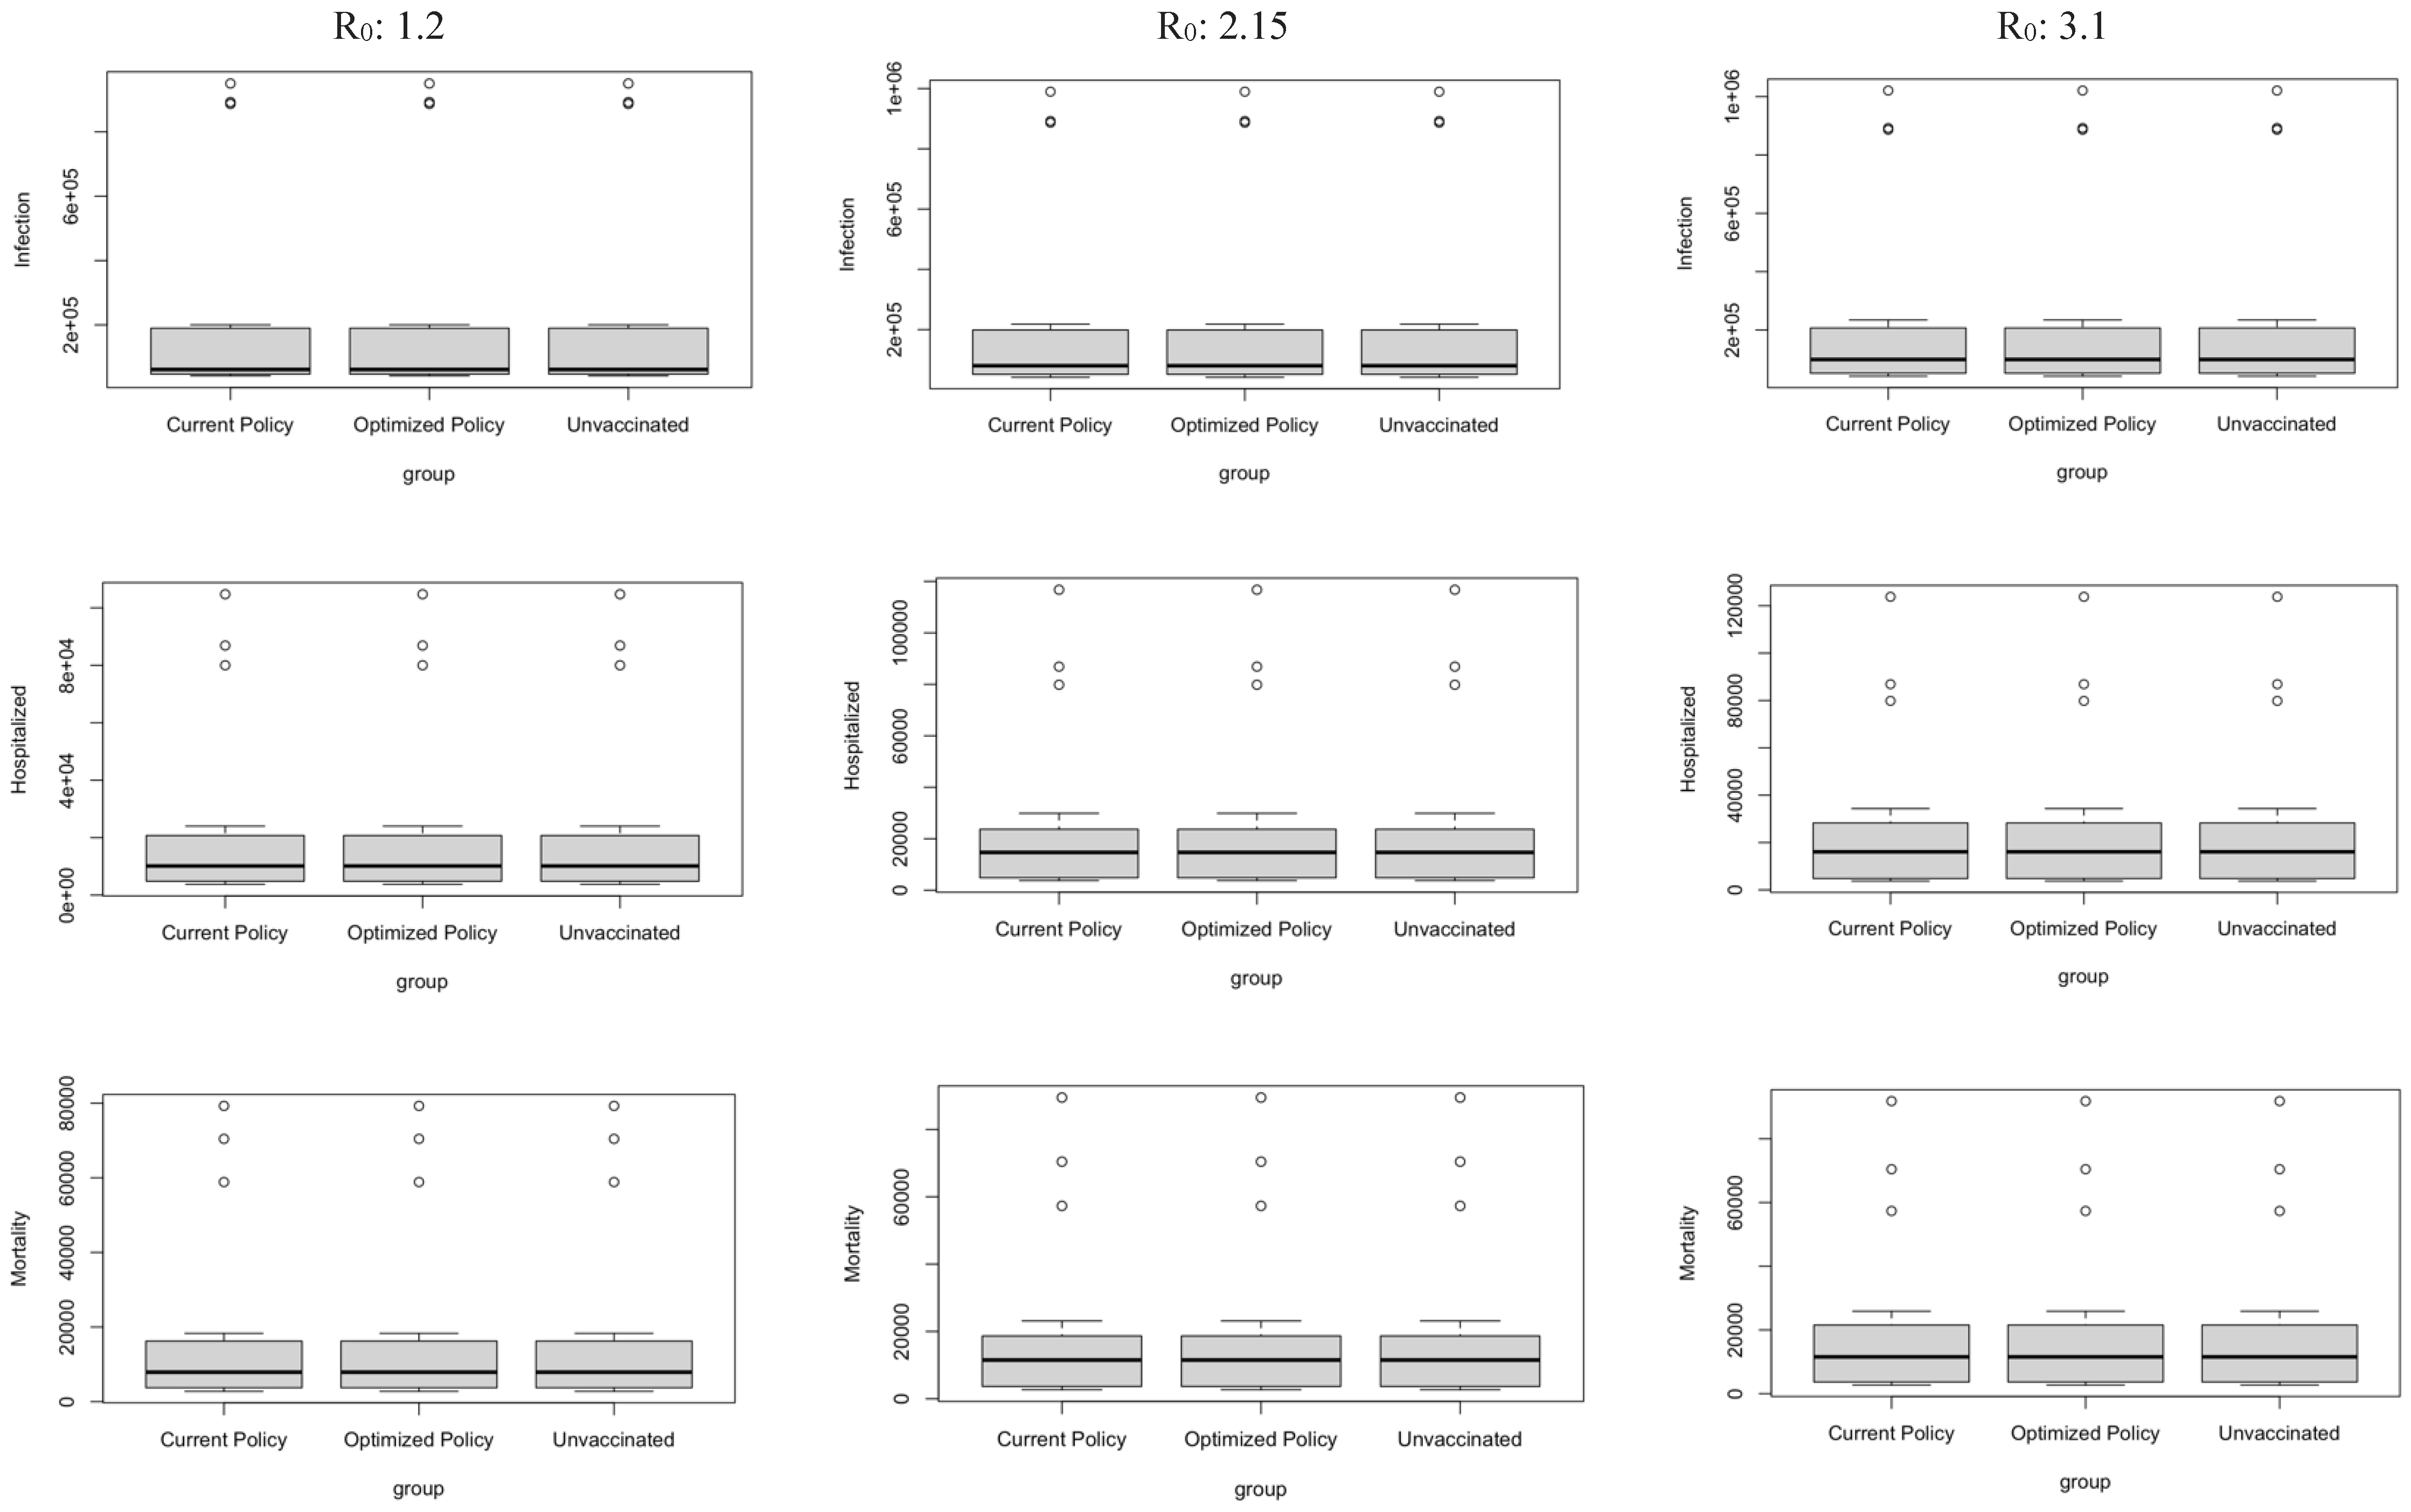
Figure 10.
Vaccination Strategy for the Case of Eastern region.
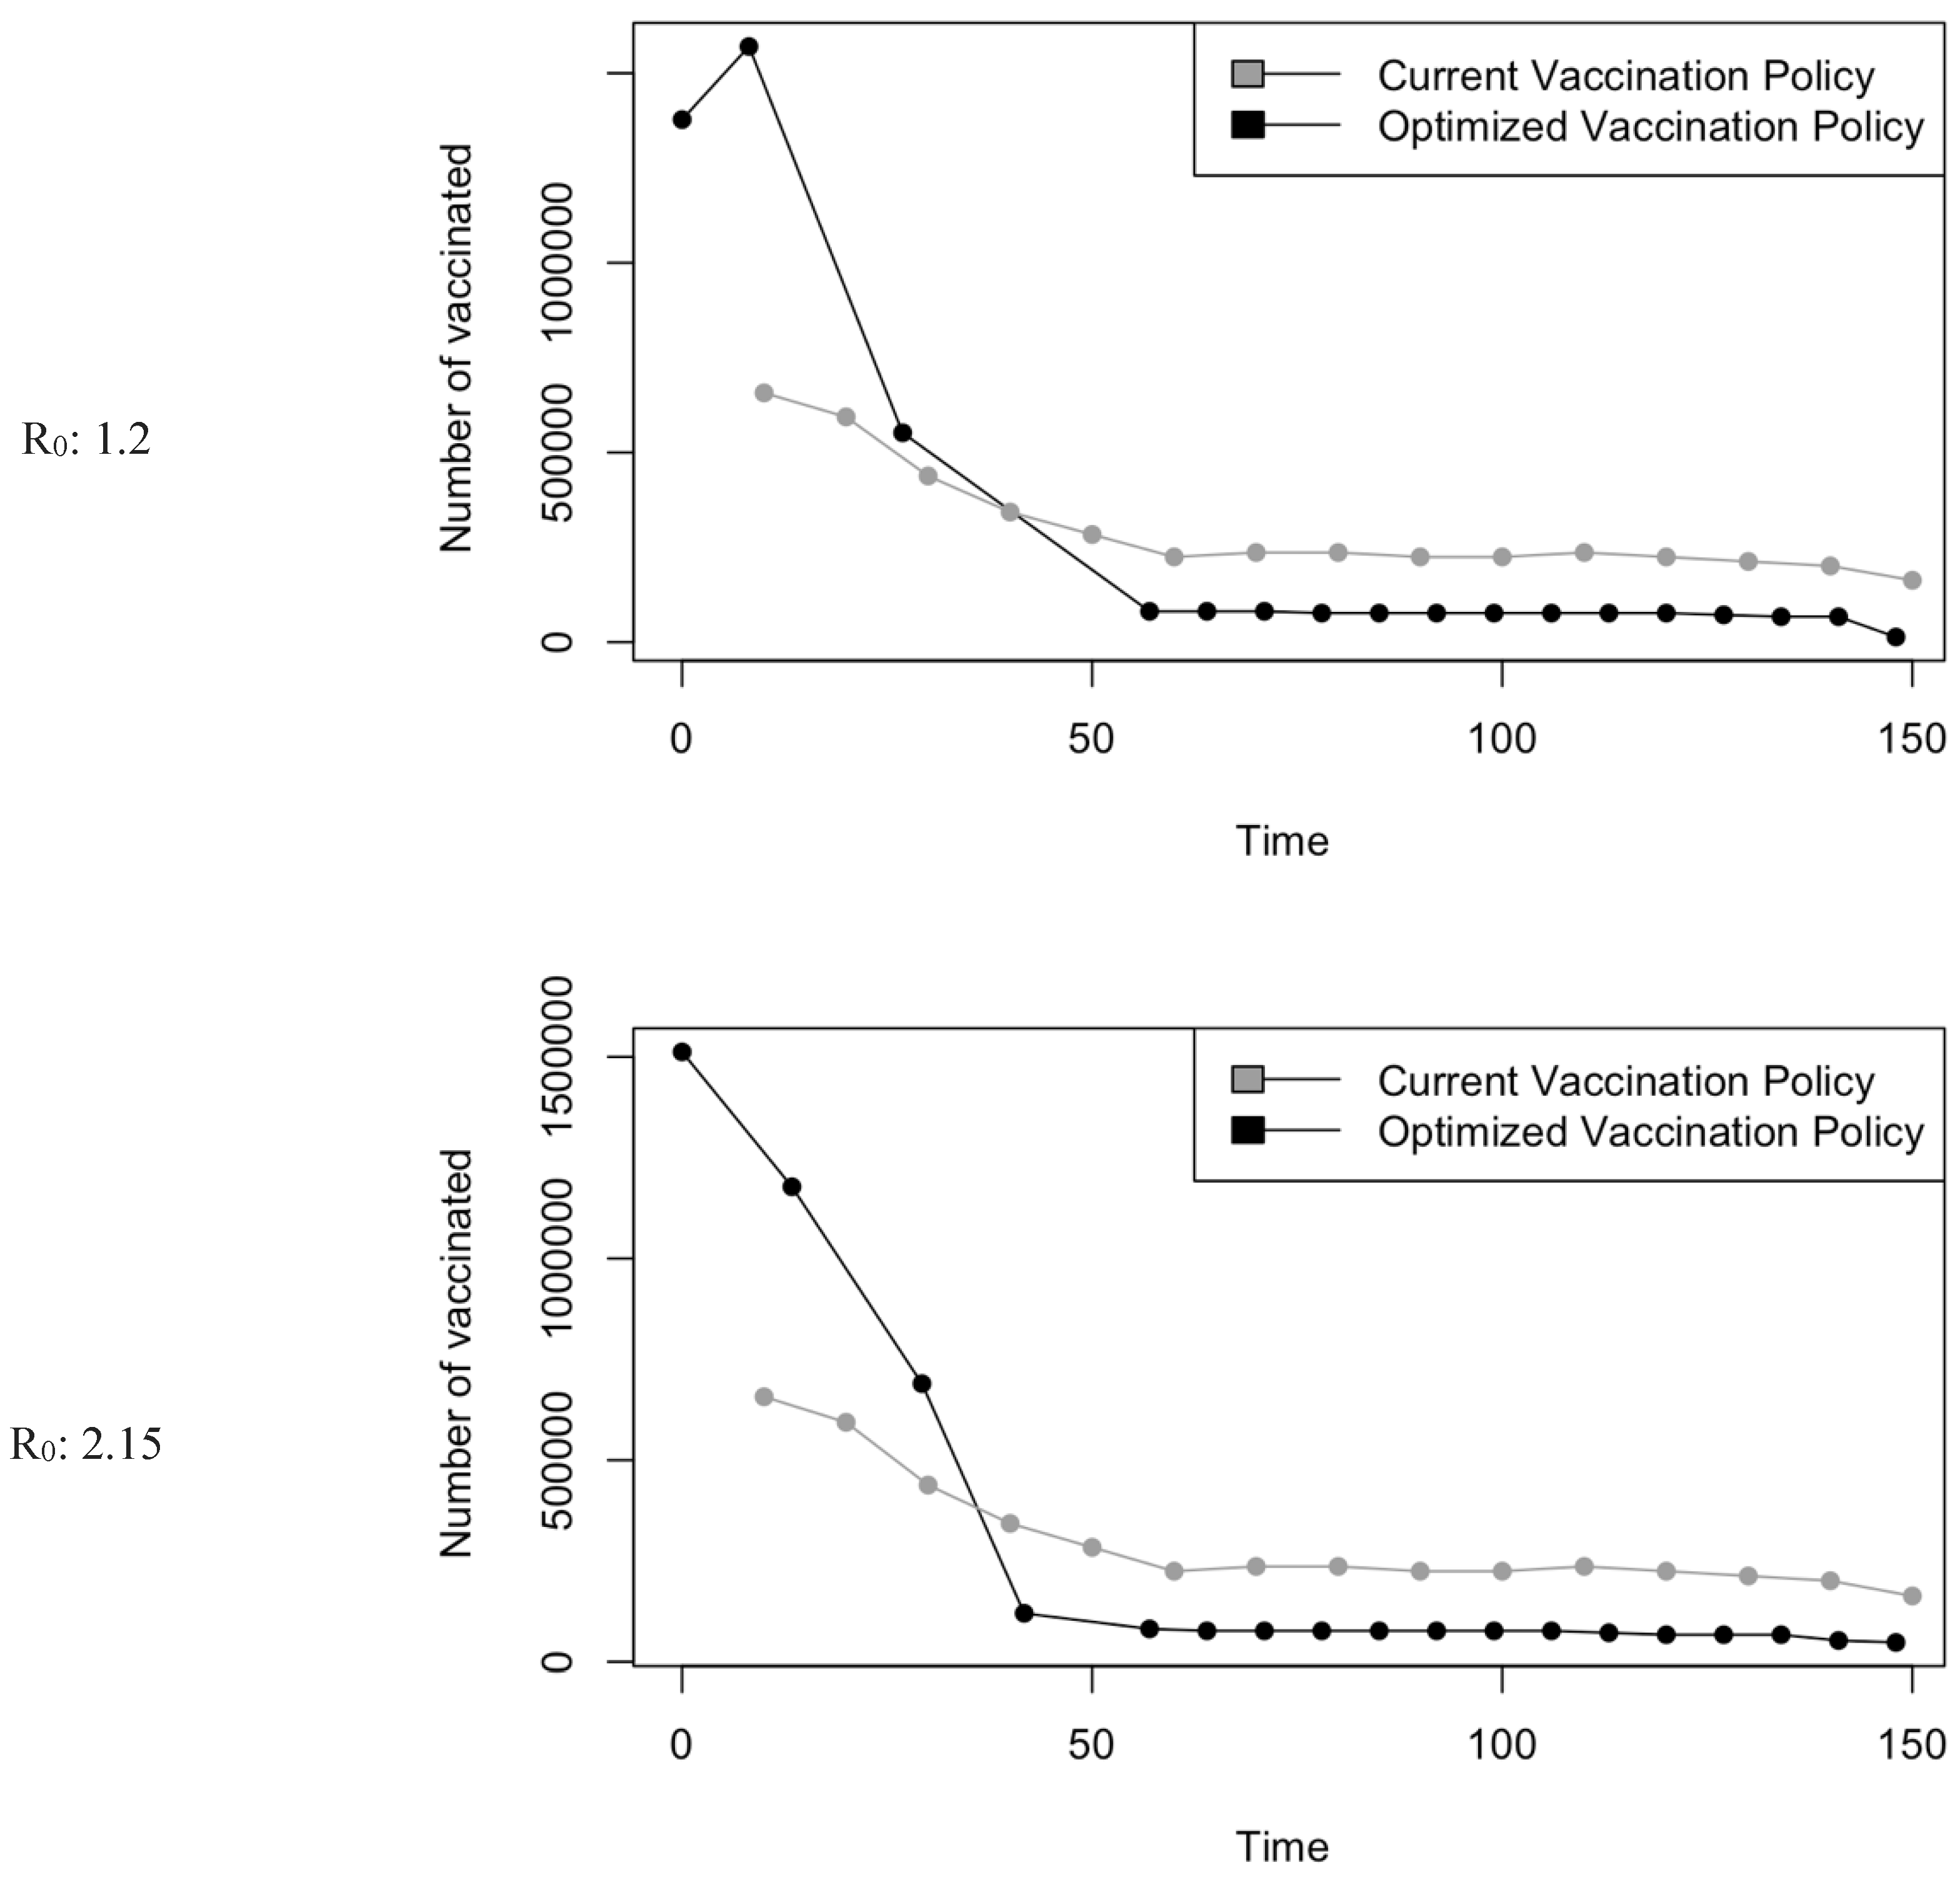
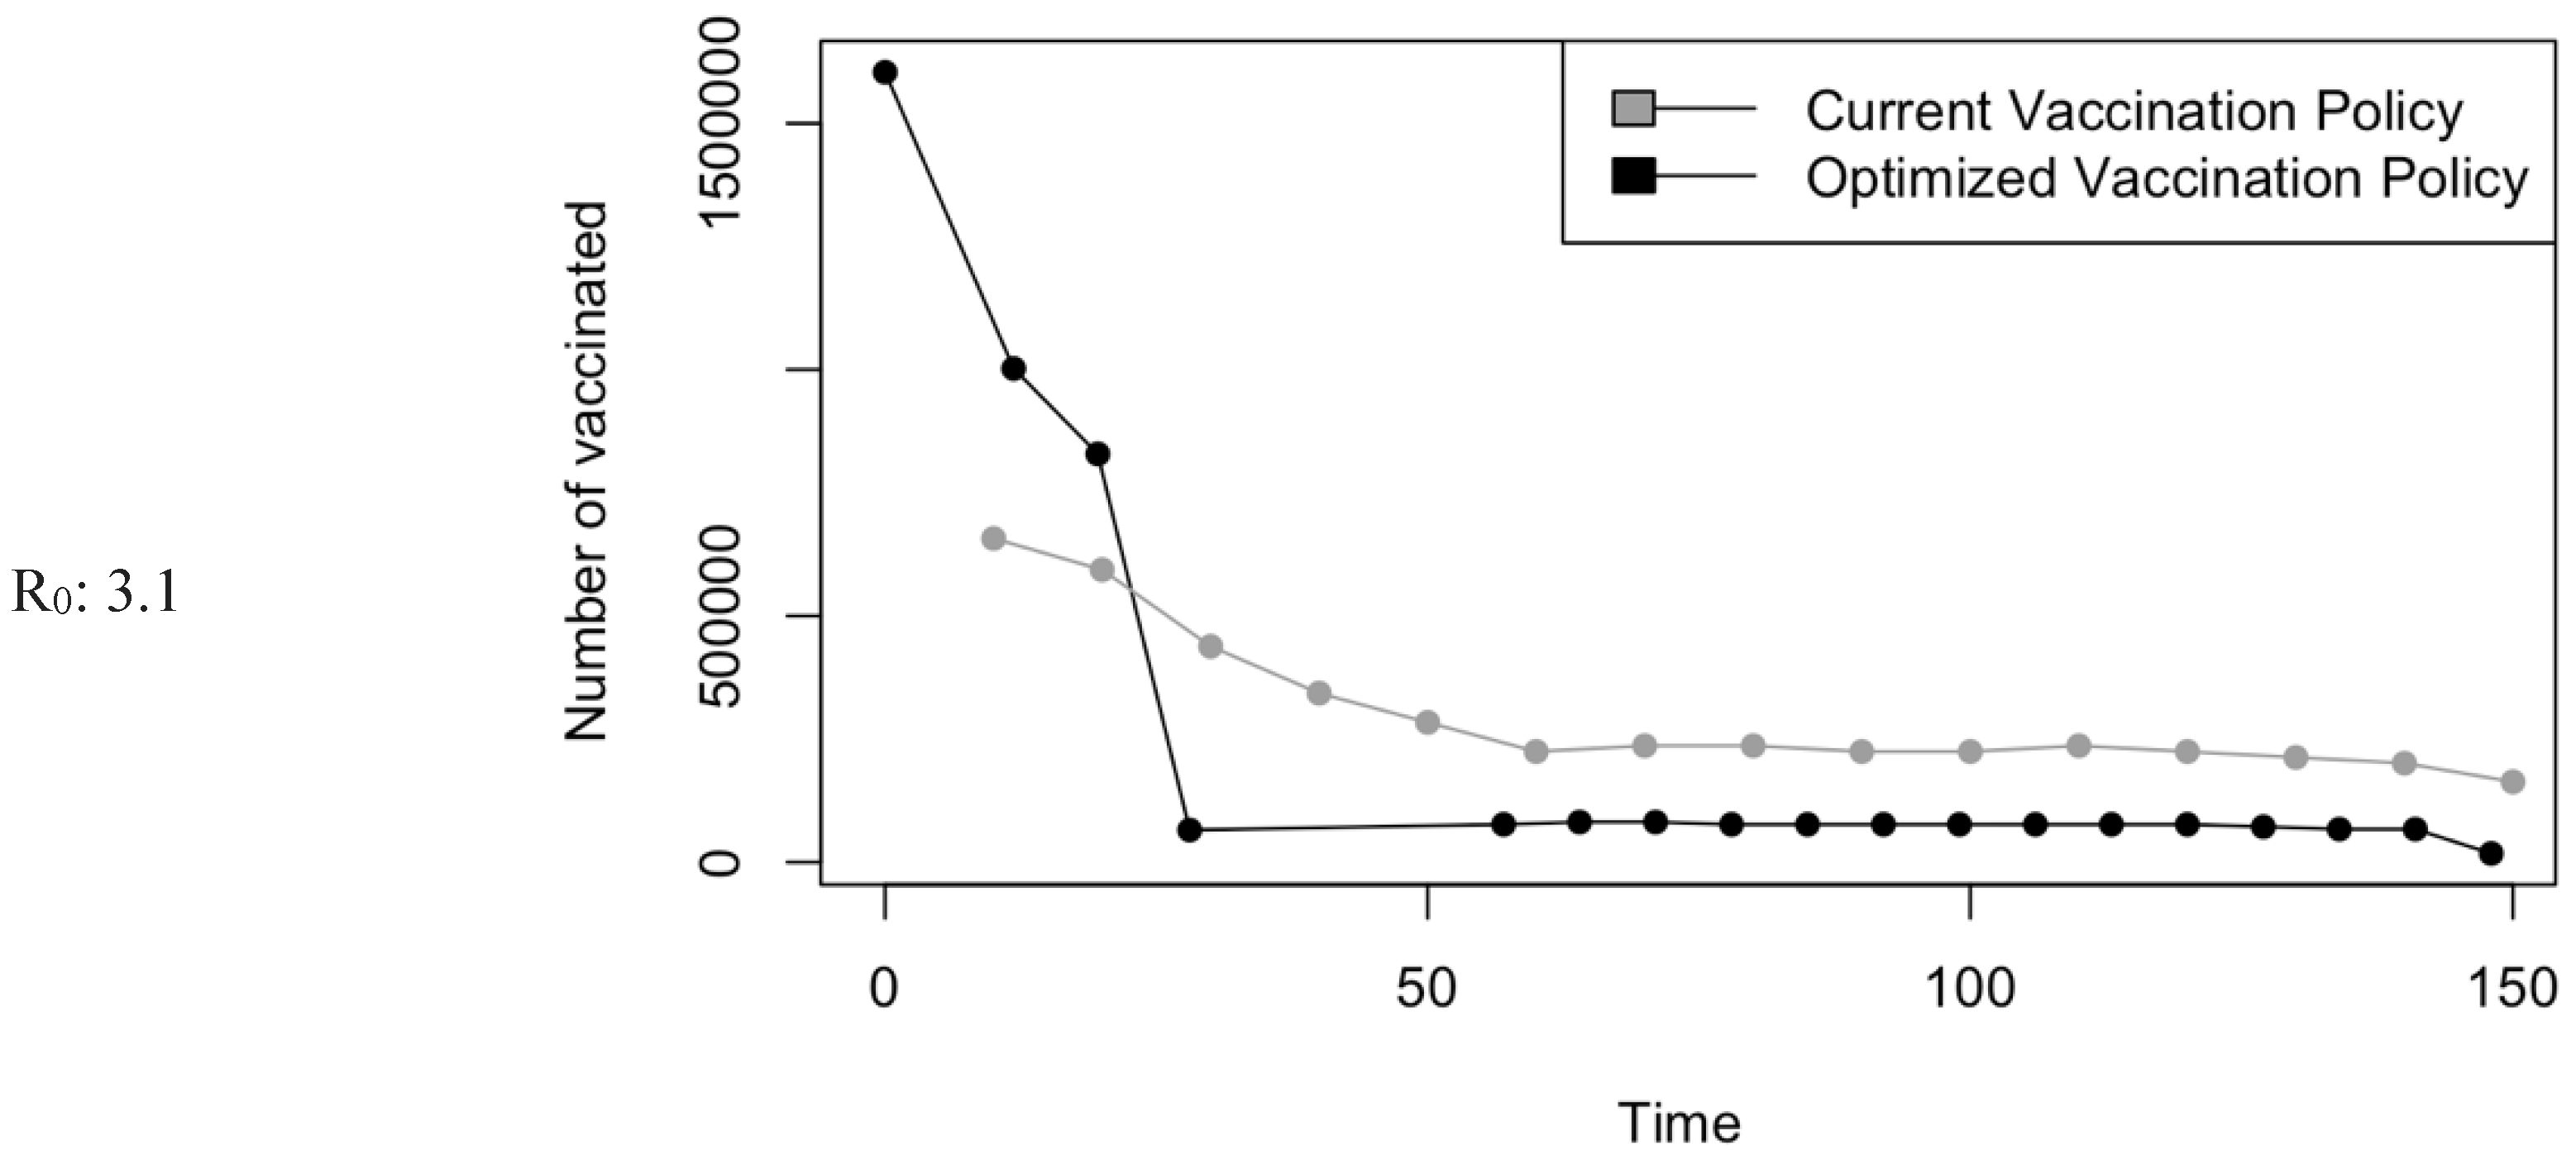
Figure 11.
Bar charts showing the number of (A) Infection (B) Hospitalizations, and (C) Mortality over a given period for R0: 1.2.
Figure 11.
Bar charts showing the number of (A) Infection (B) Hospitalizations, and (C) Mortality over a given period for R0: 1.2.
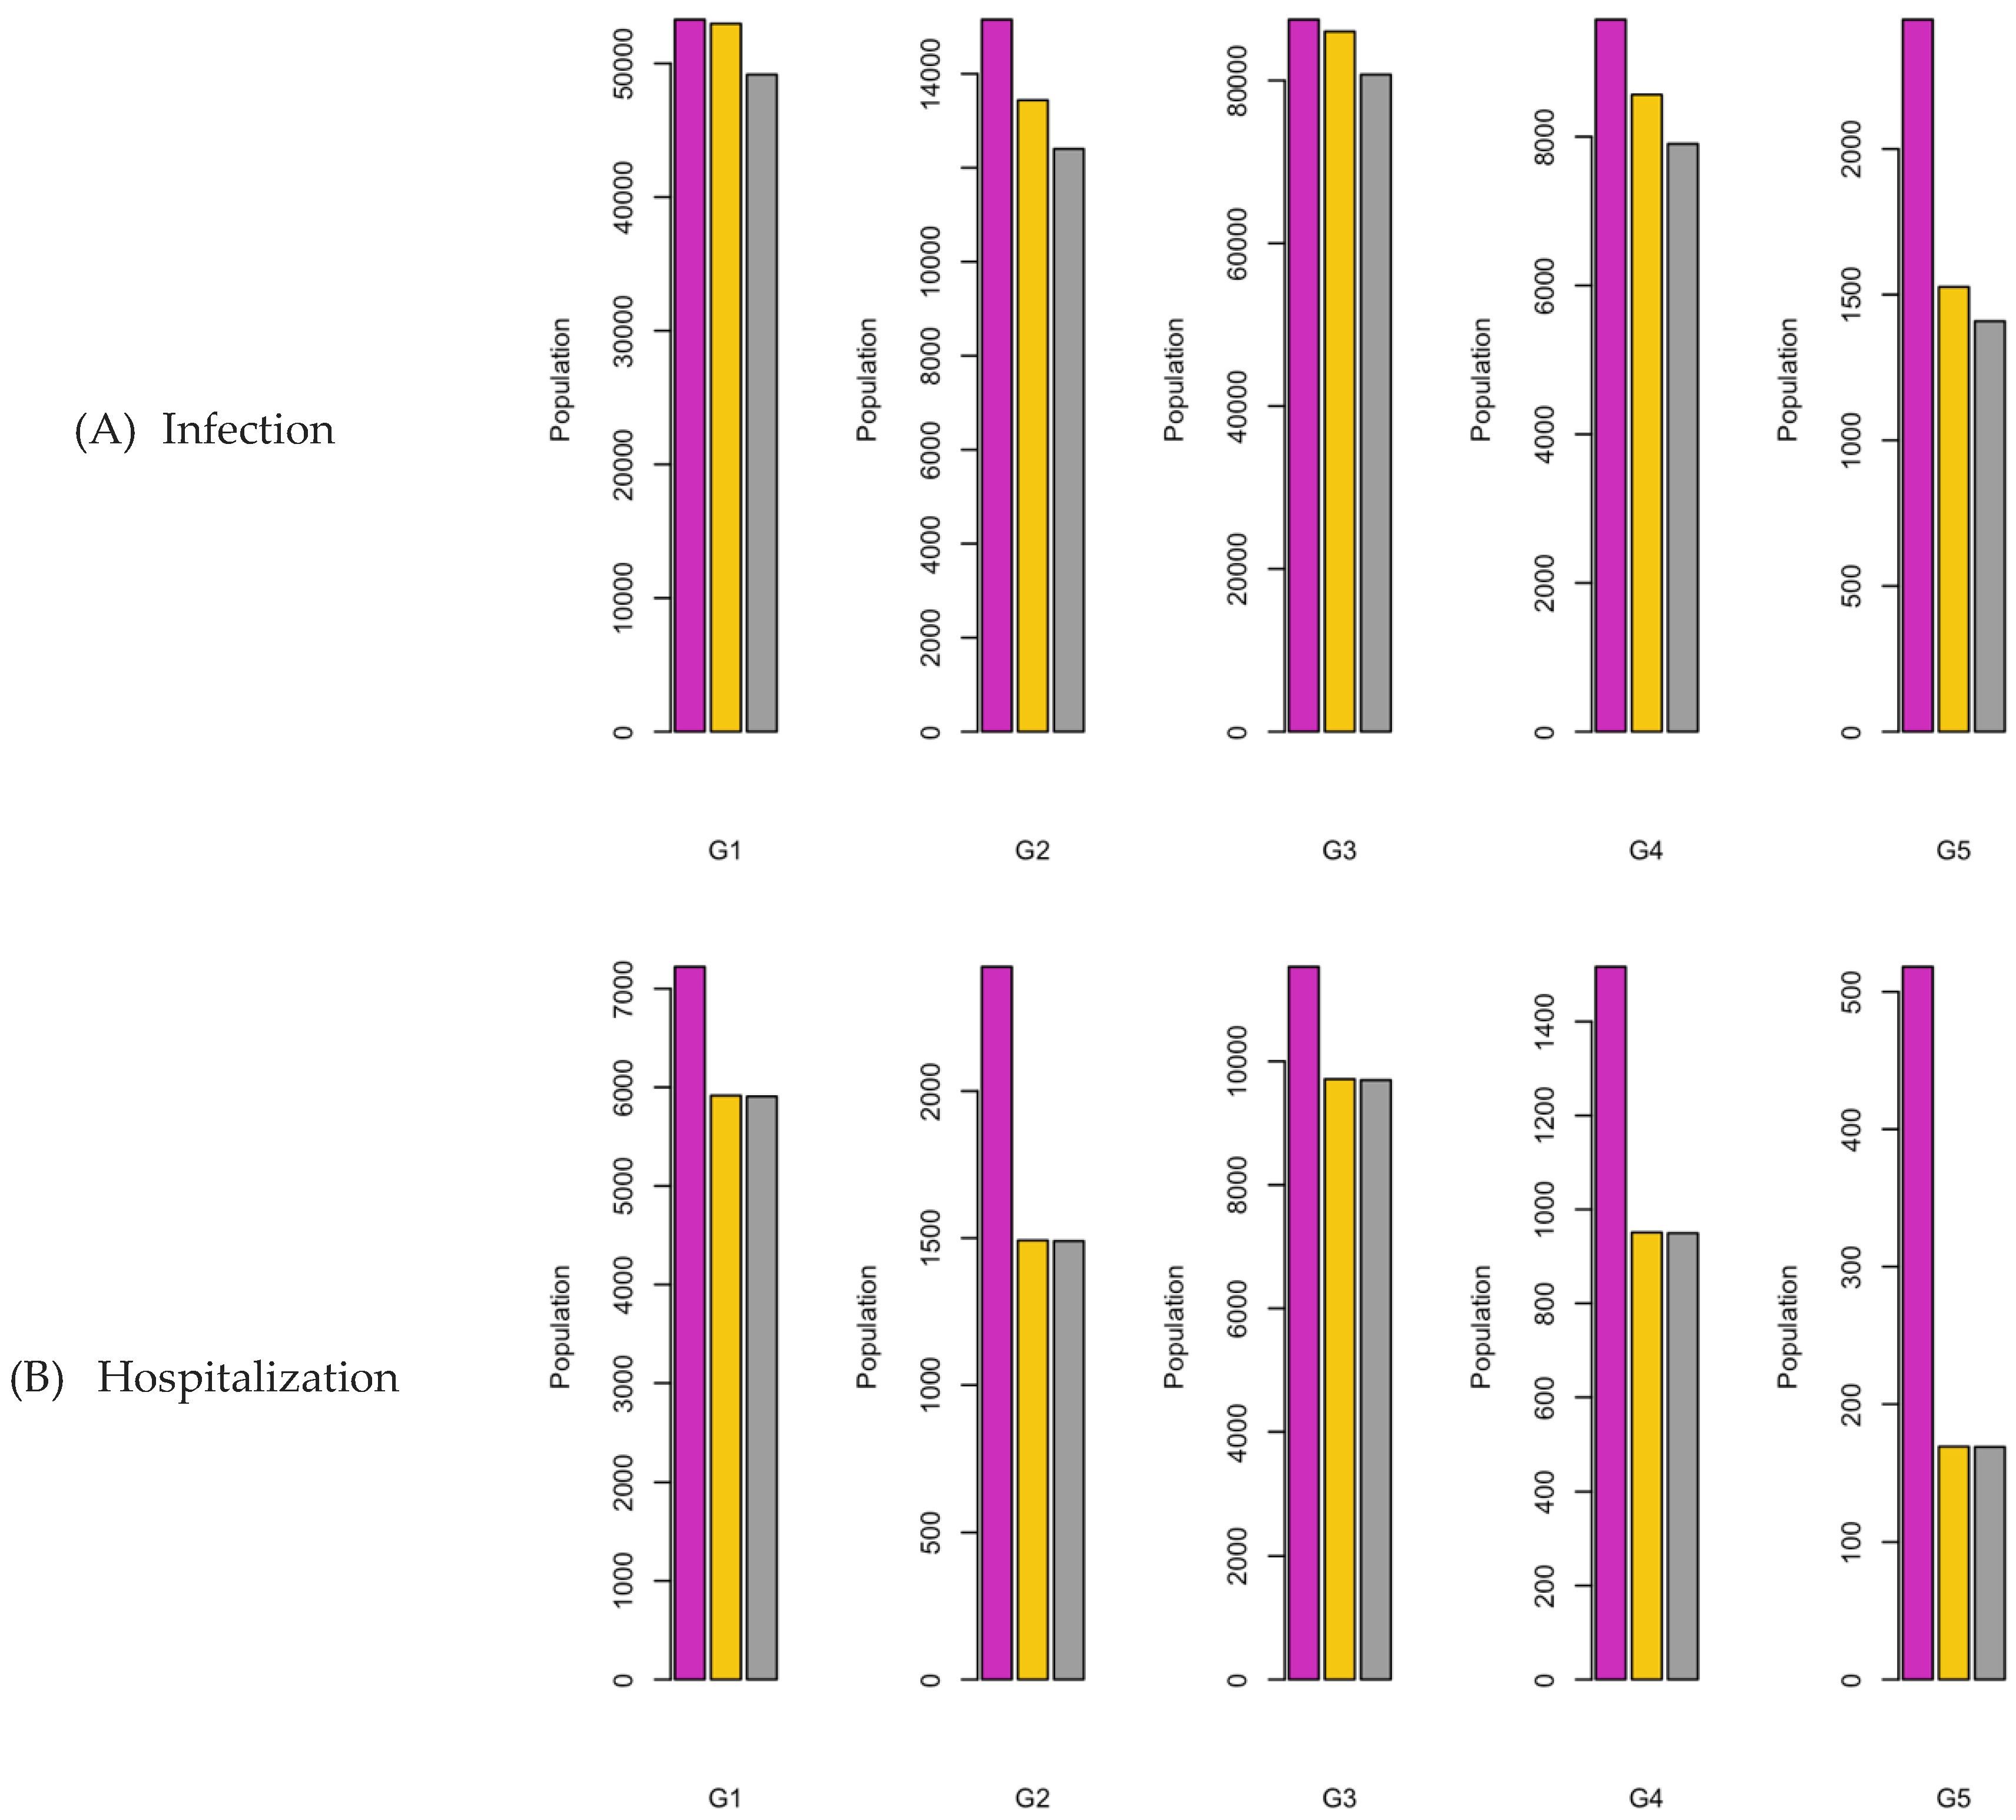
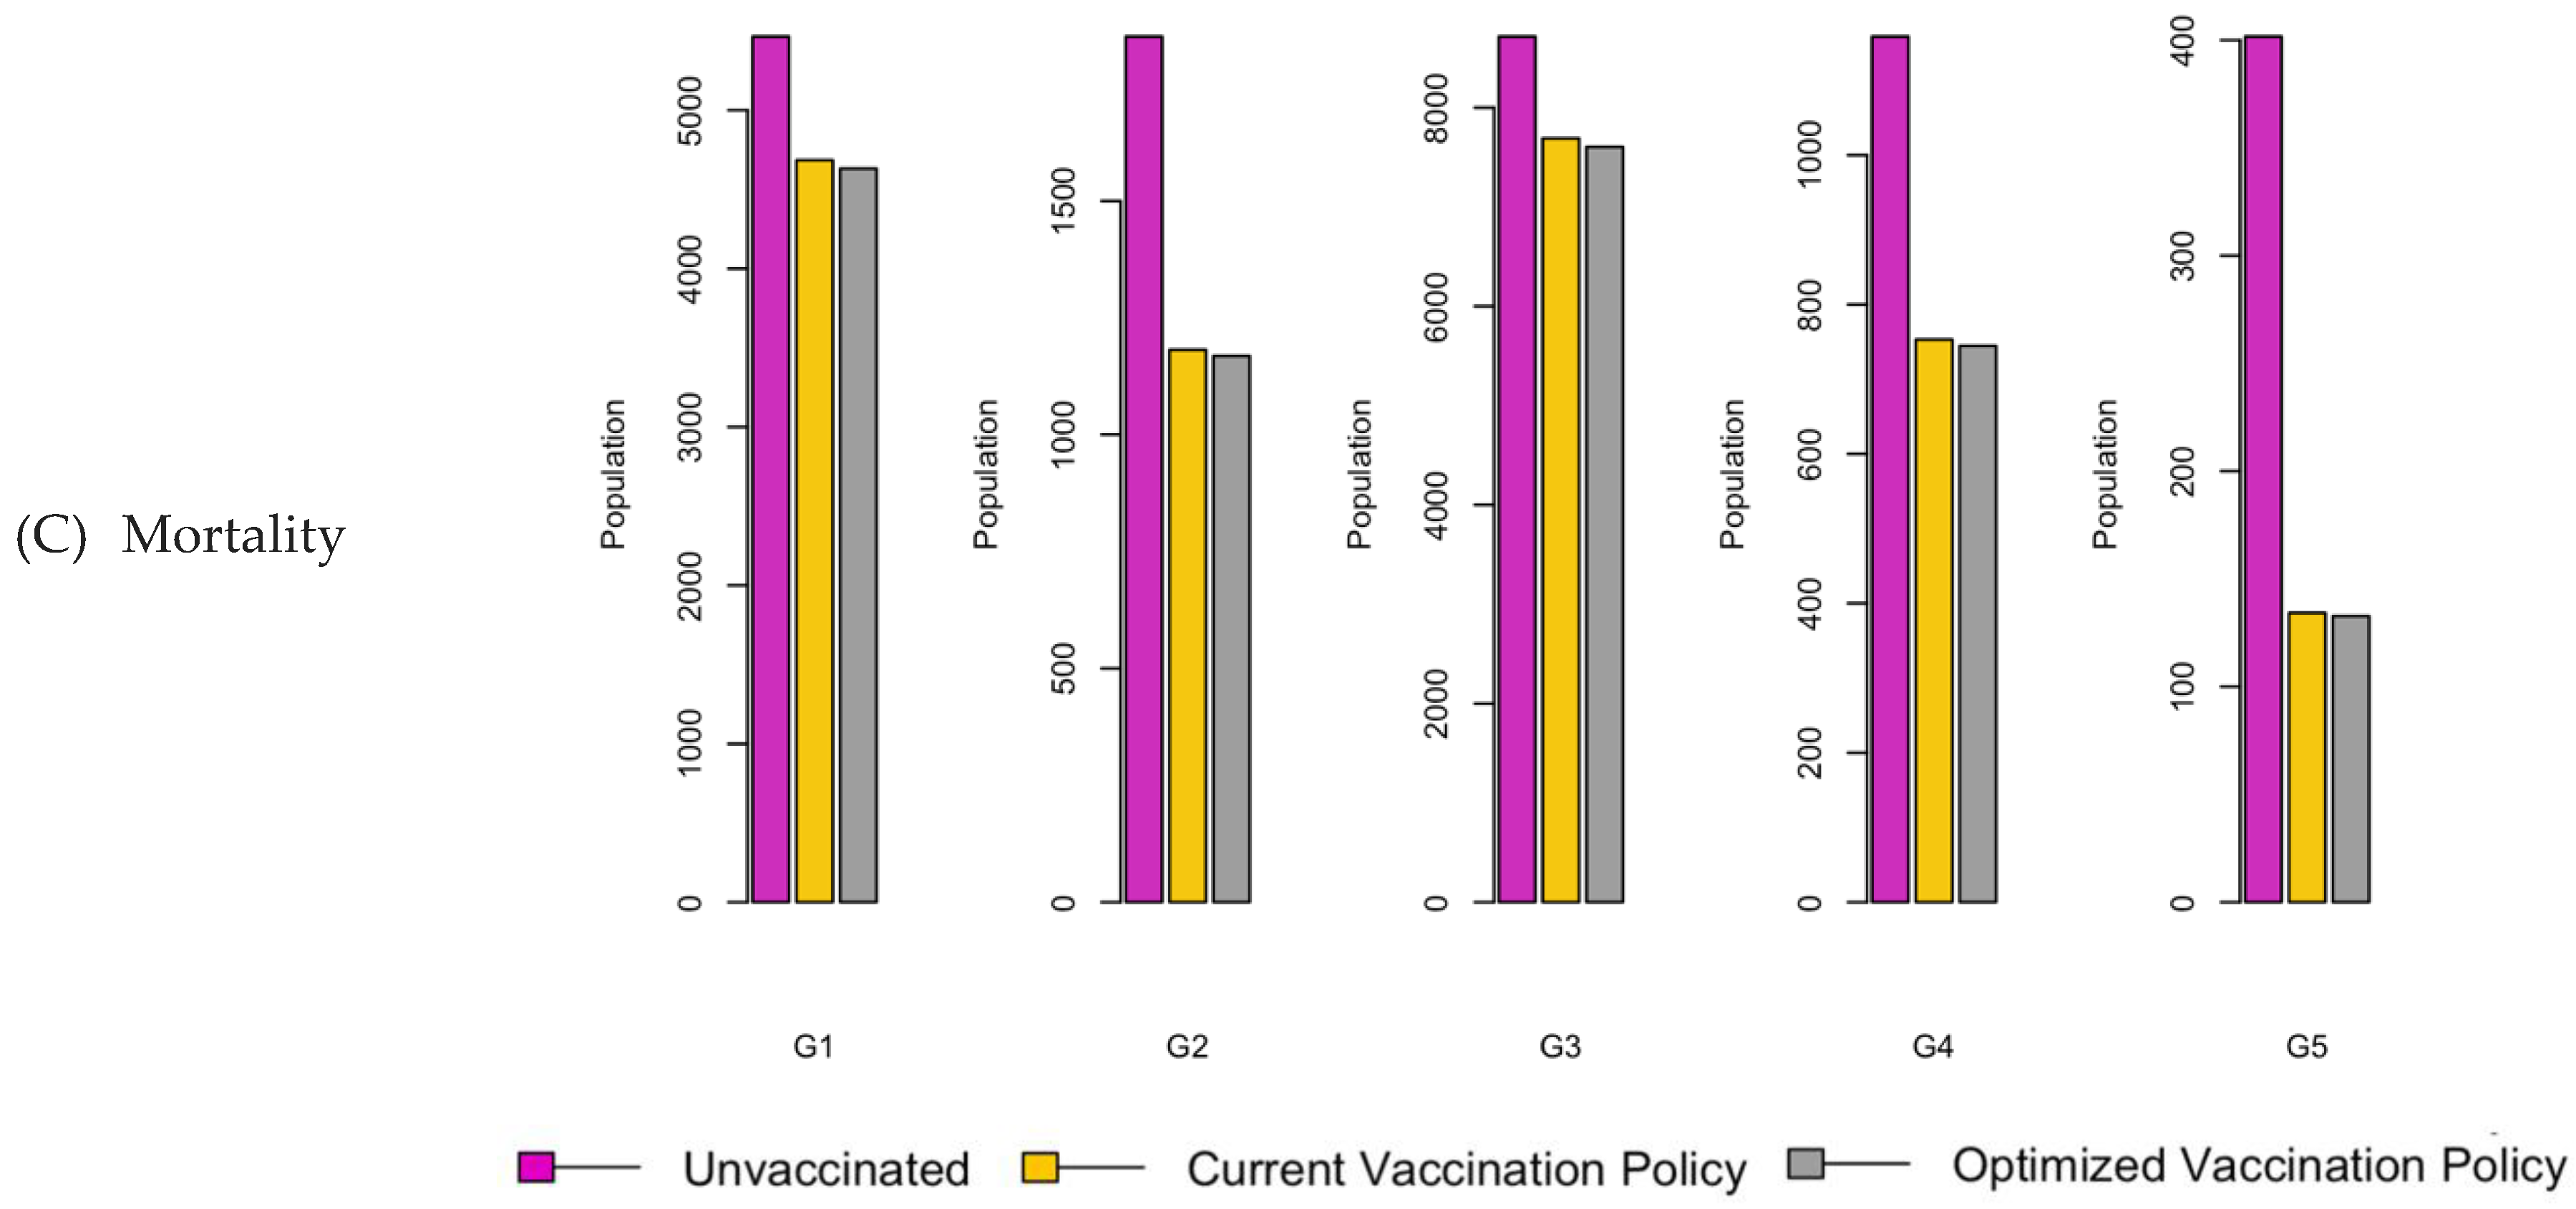
Figure 12.
Bar charts showing the number of (A) Infection (B) Hospitalizations, and (C) Mortality over a given period for R0: 2.15.
Figure 12.
Bar charts showing the number of (A) Infection (B) Hospitalizations, and (C) Mortality over a given period for R0: 2.15.
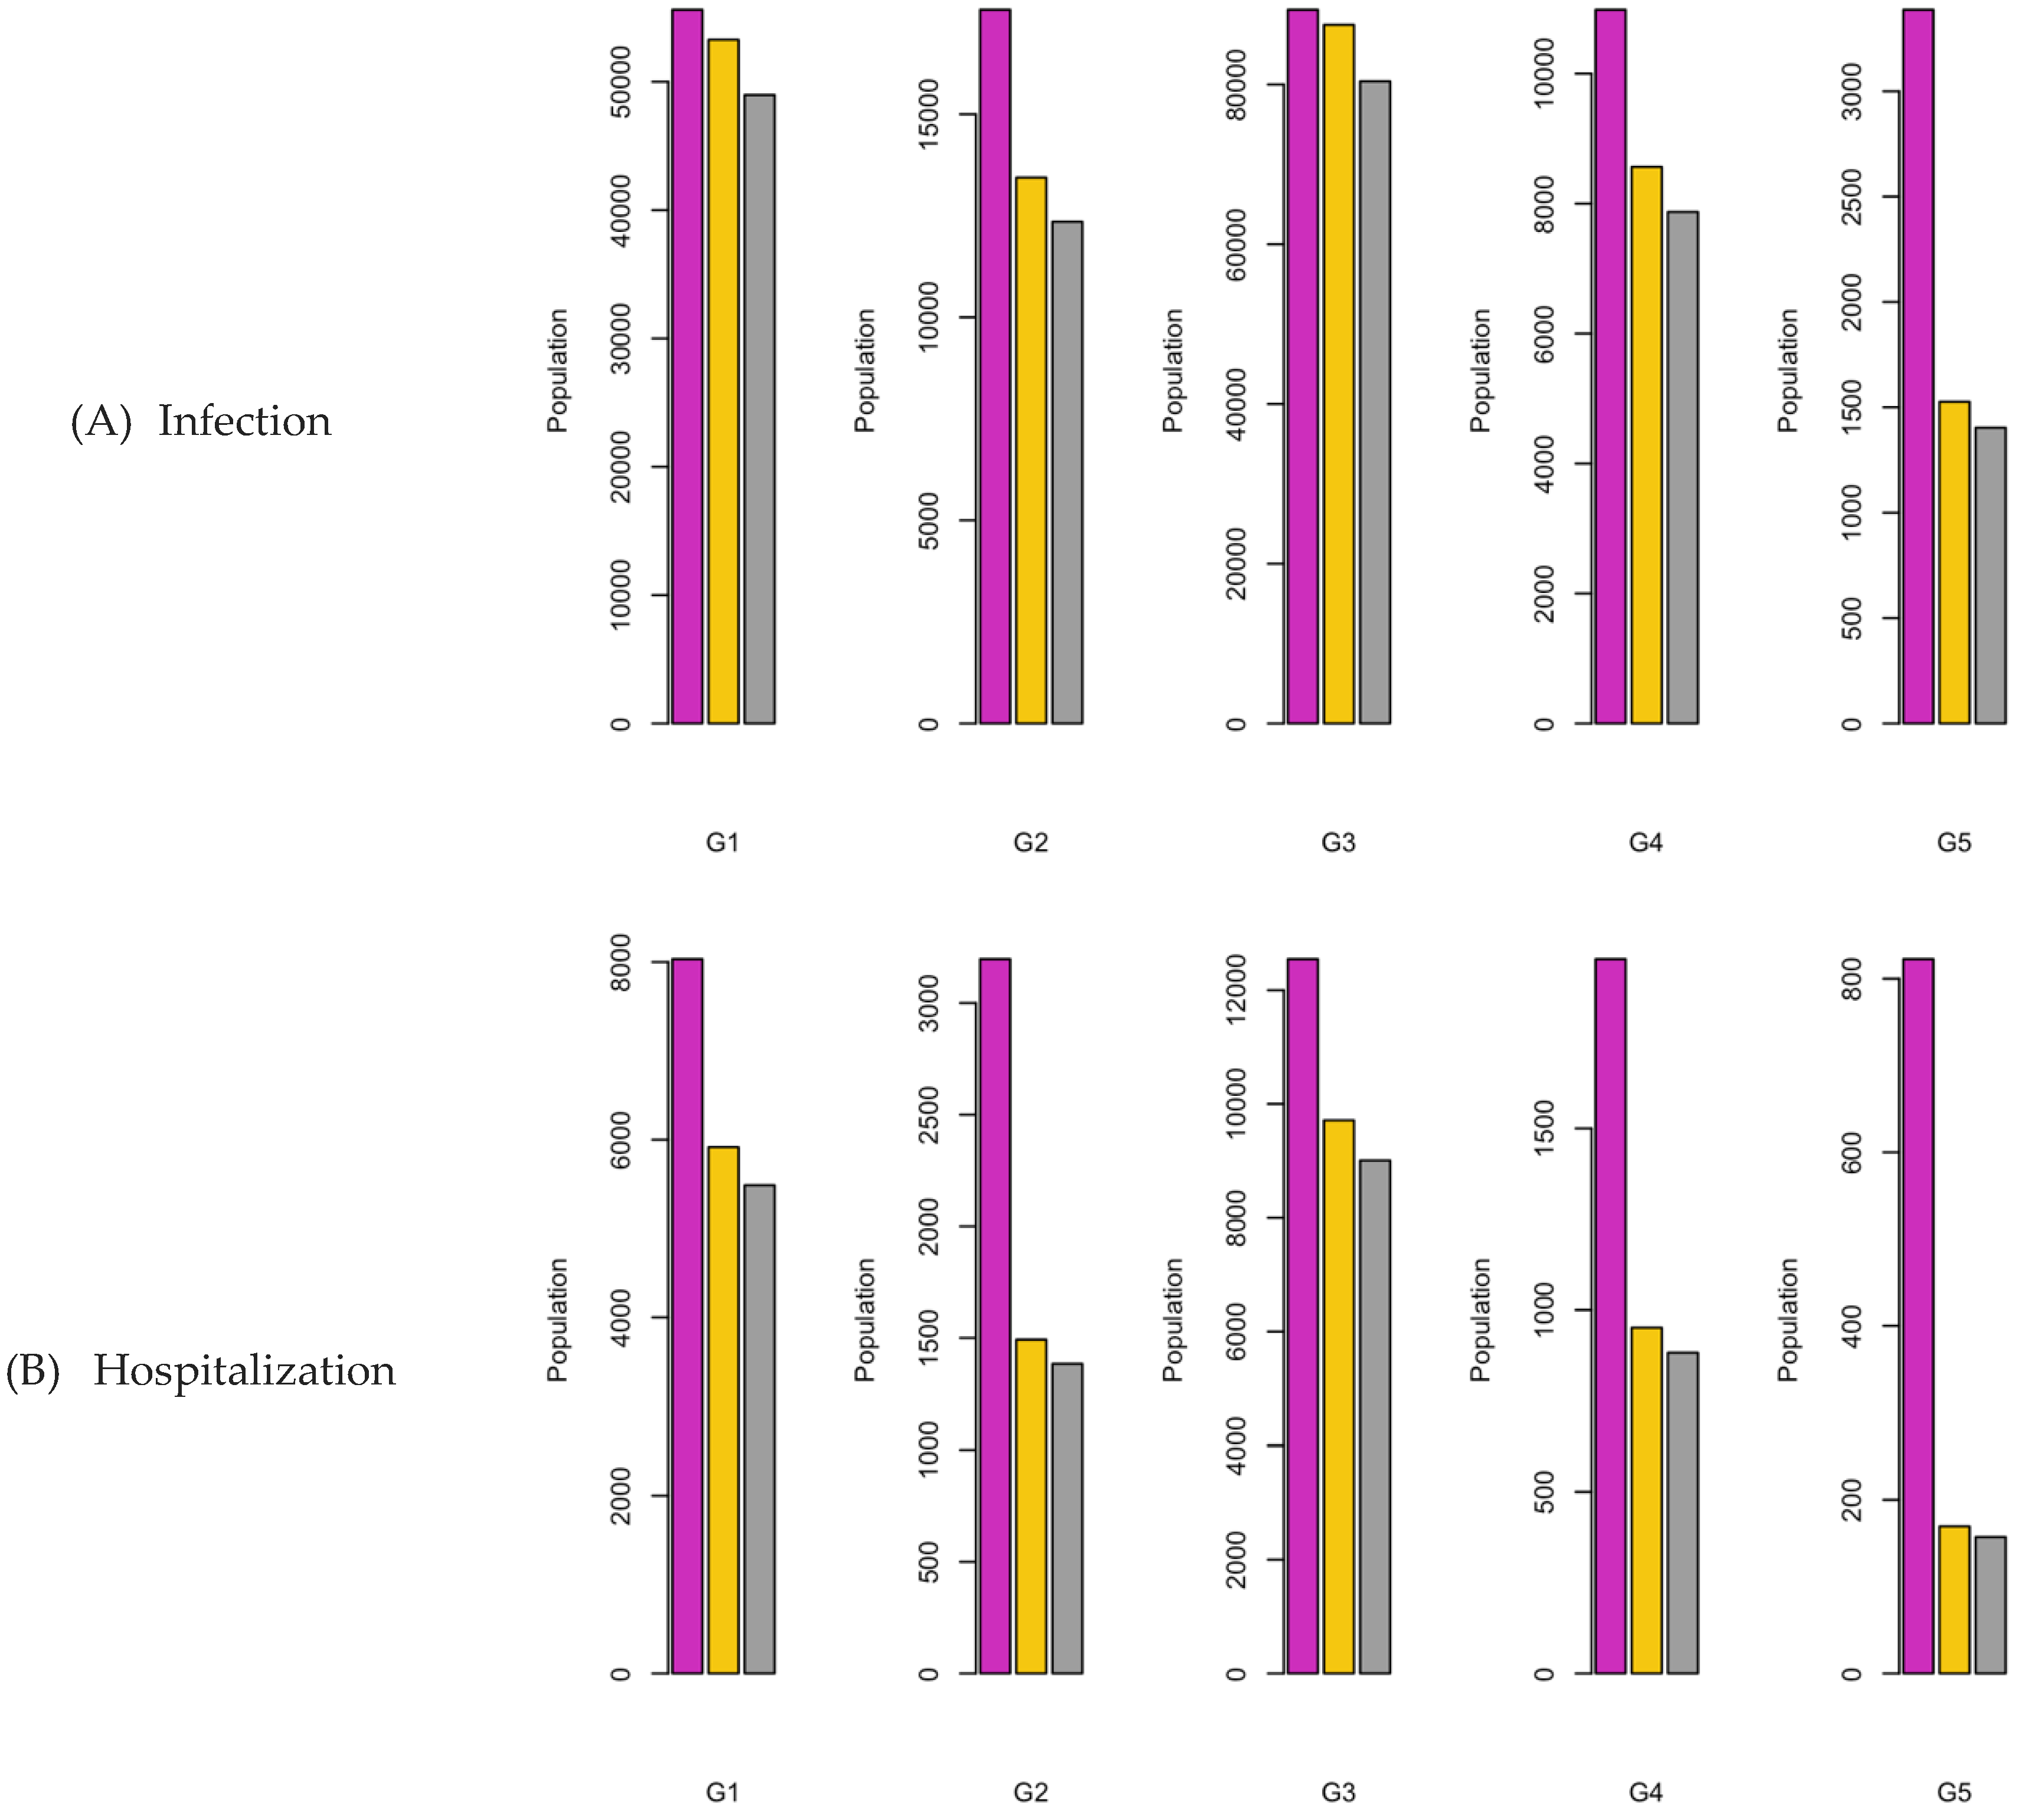
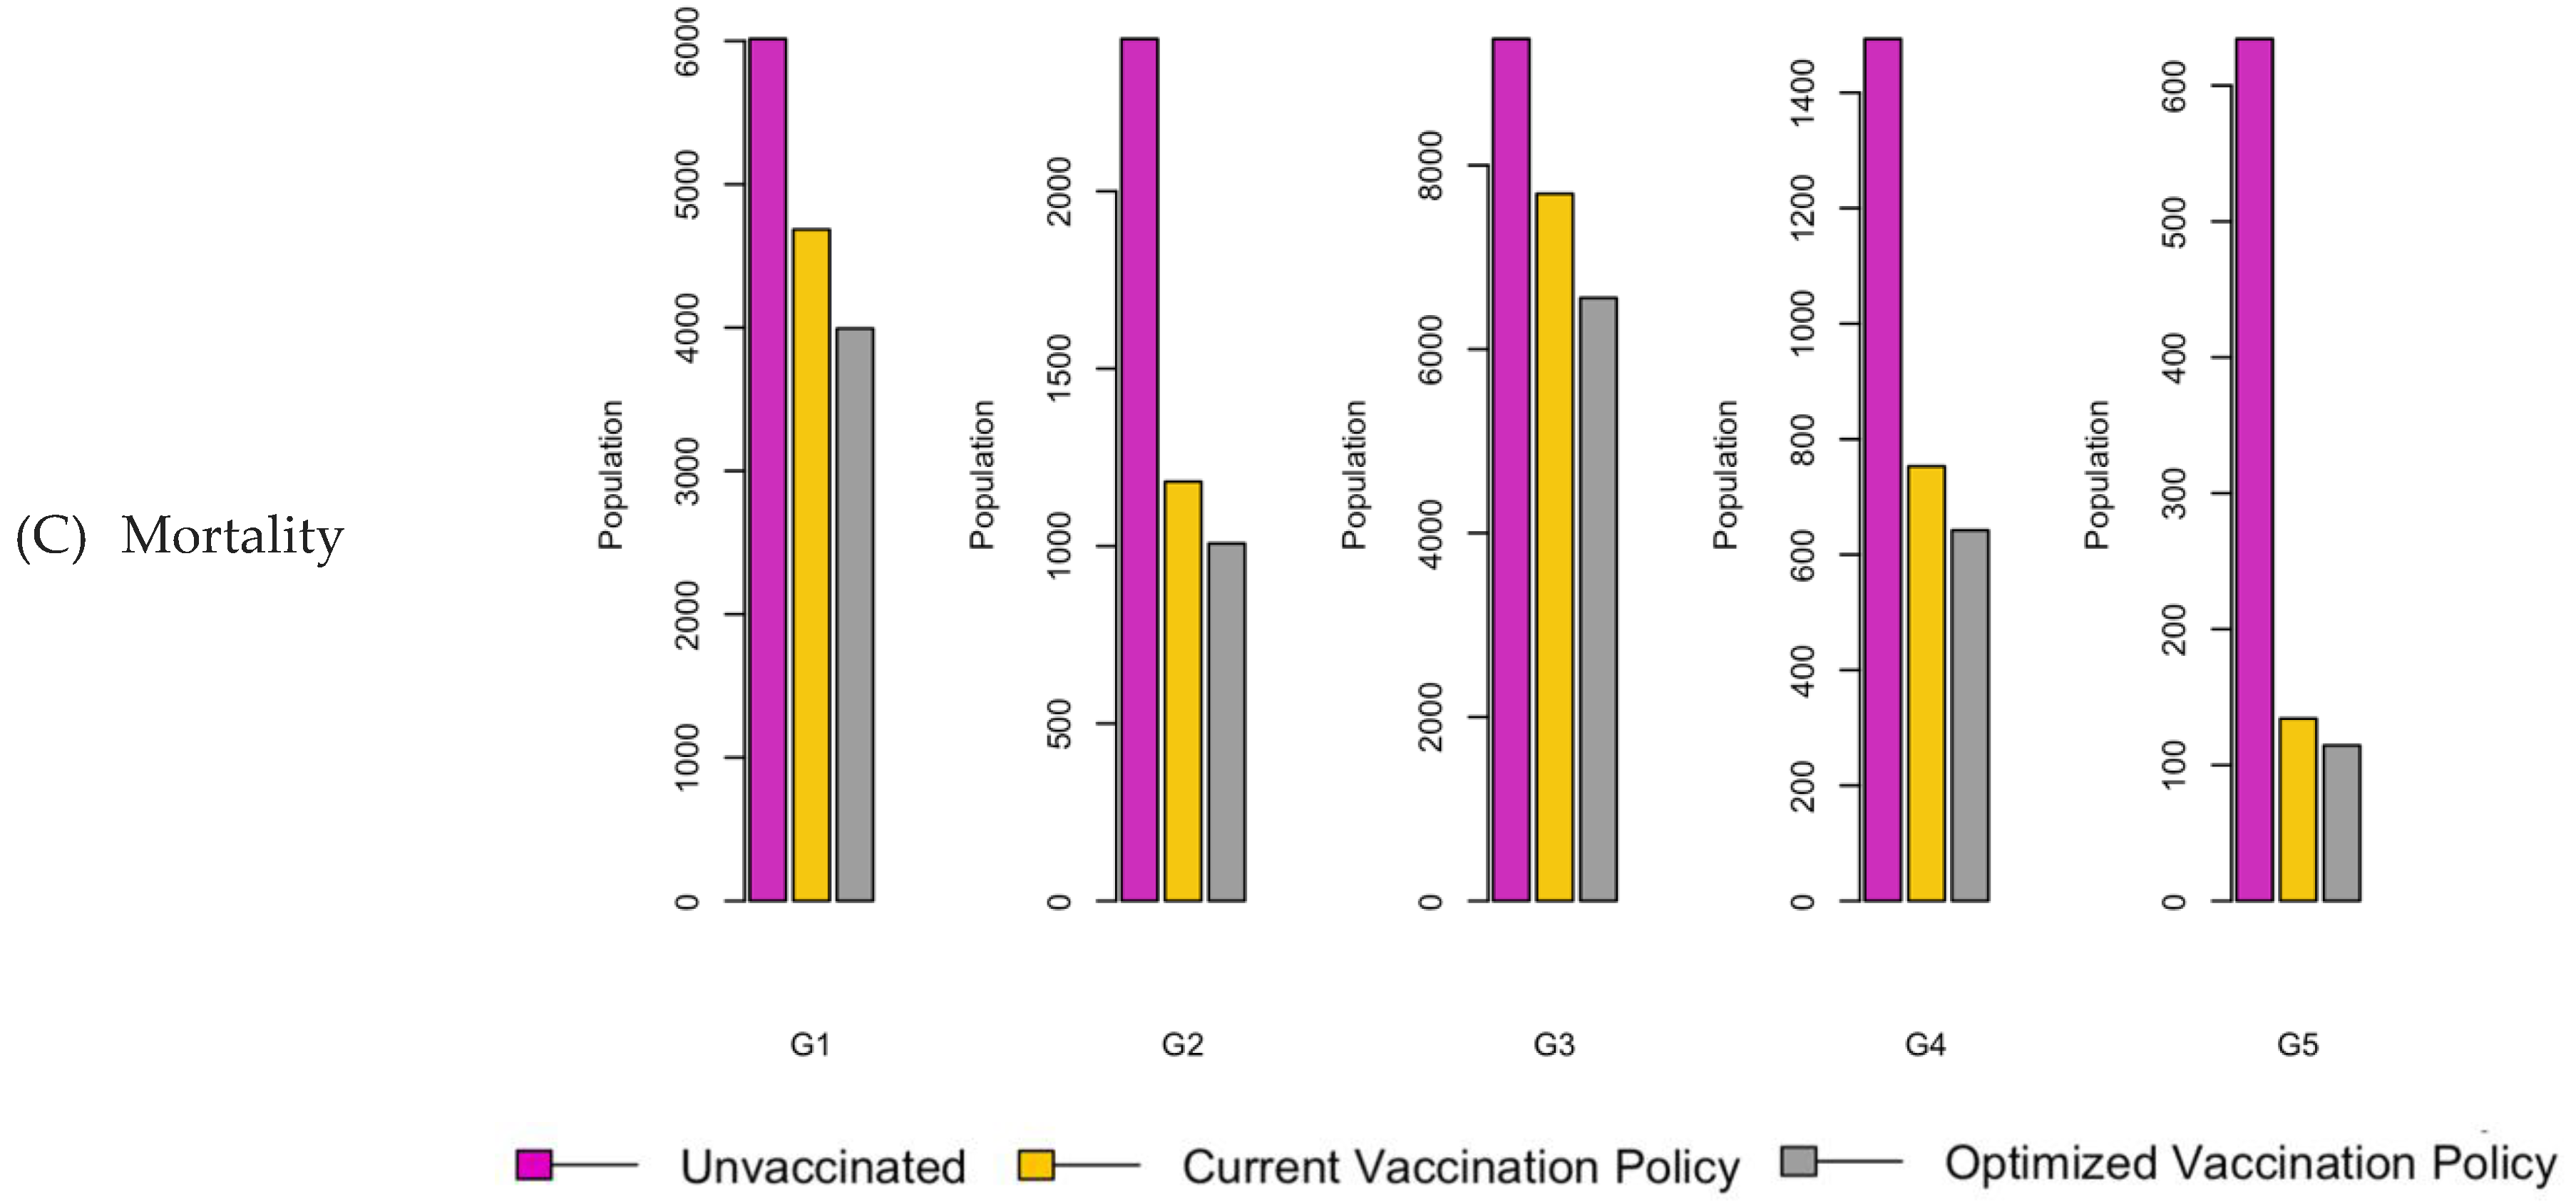
Figure 13.
Bar charts showing the number of (A) Infection (B) Hospitalizations, and (C) Mortality over a given period for R0: 3.1.
Figure 13.
Bar charts showing the number of (A) Infection (B) Hospitalizations, and (C) Mortality over a given period for R0: 3.1.
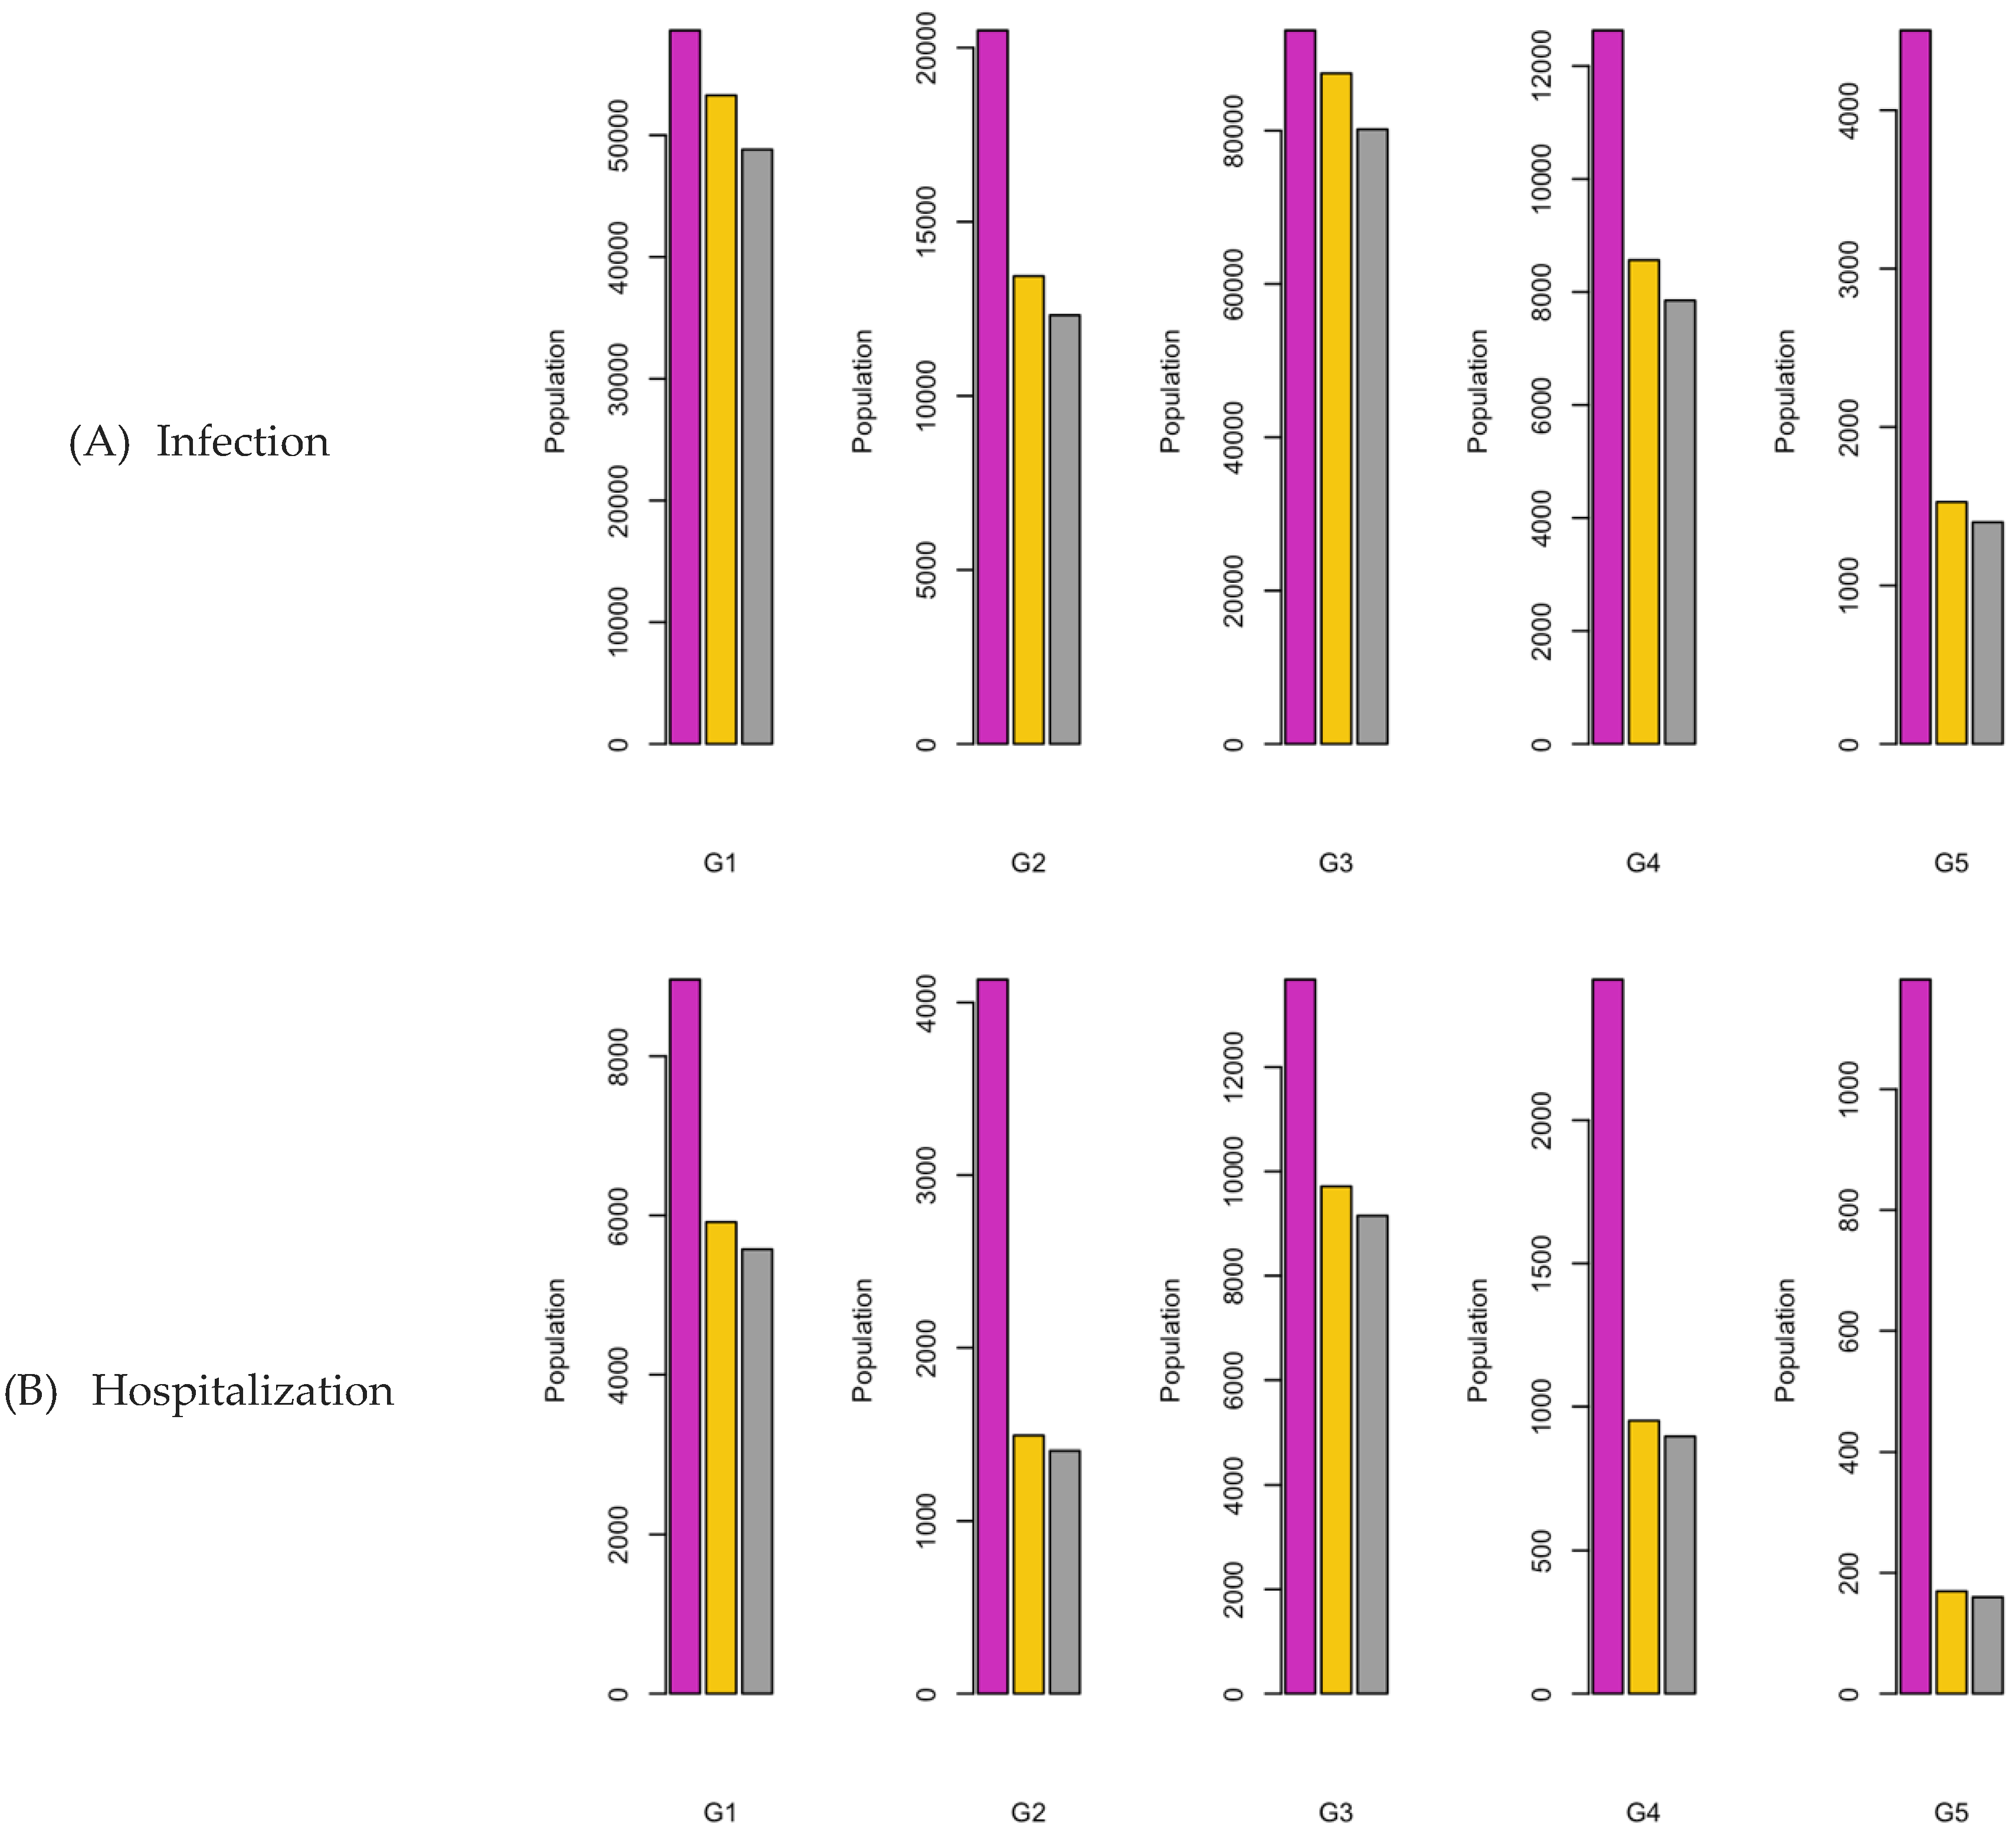
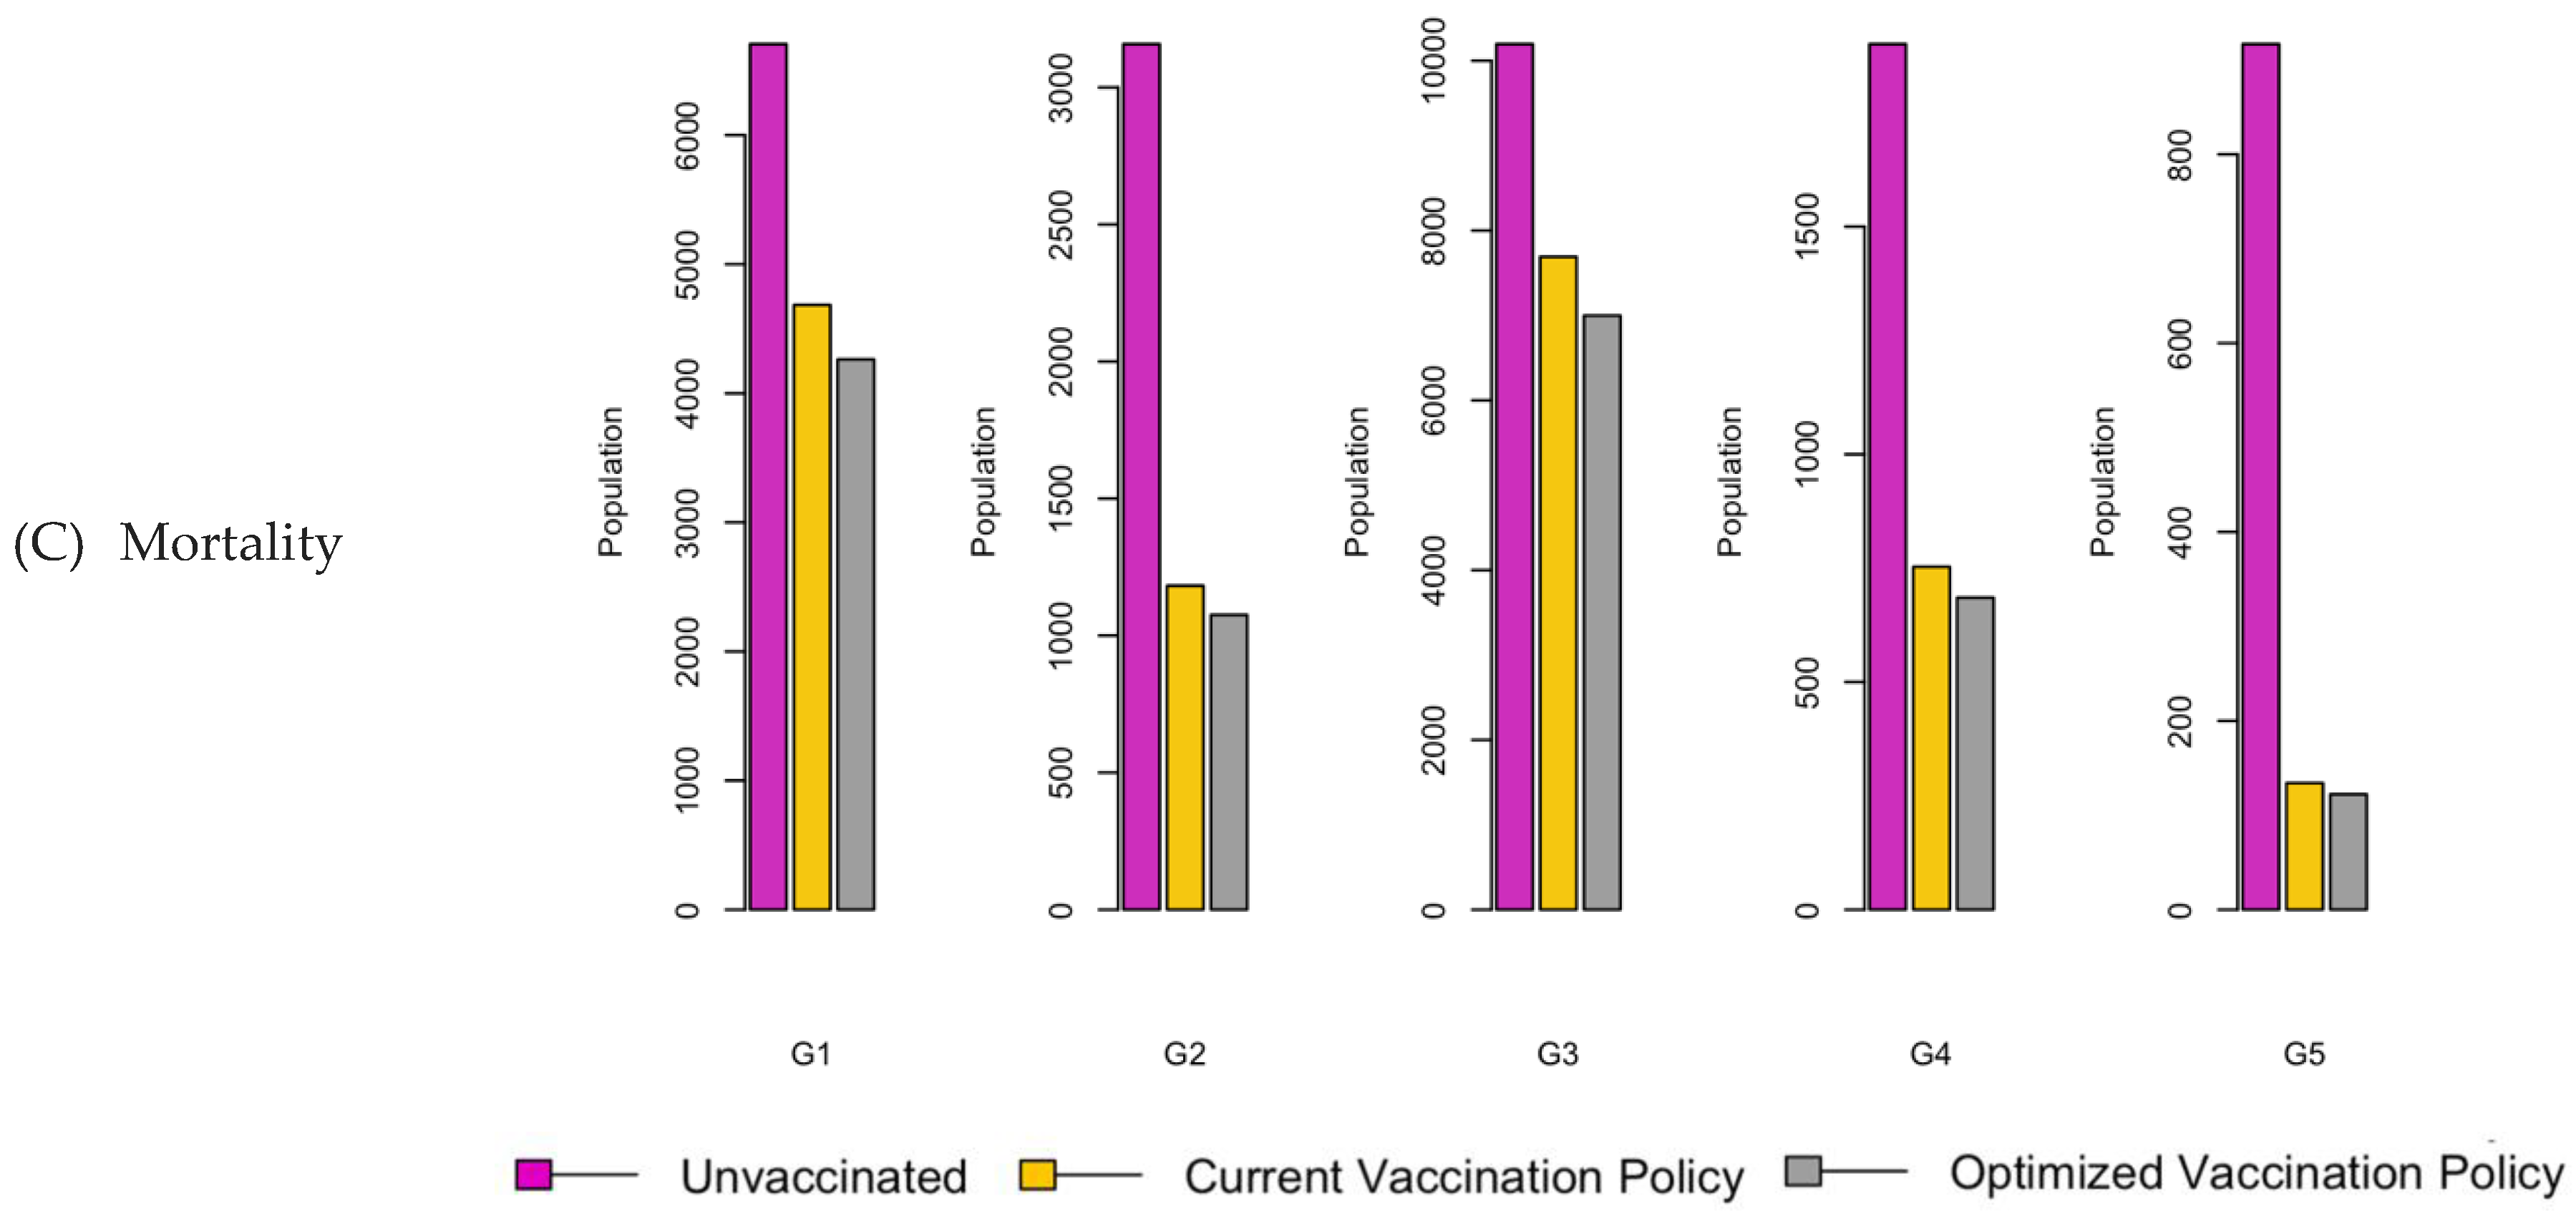
Figure 14.
Vaccination Strategy for the Case of Central region.
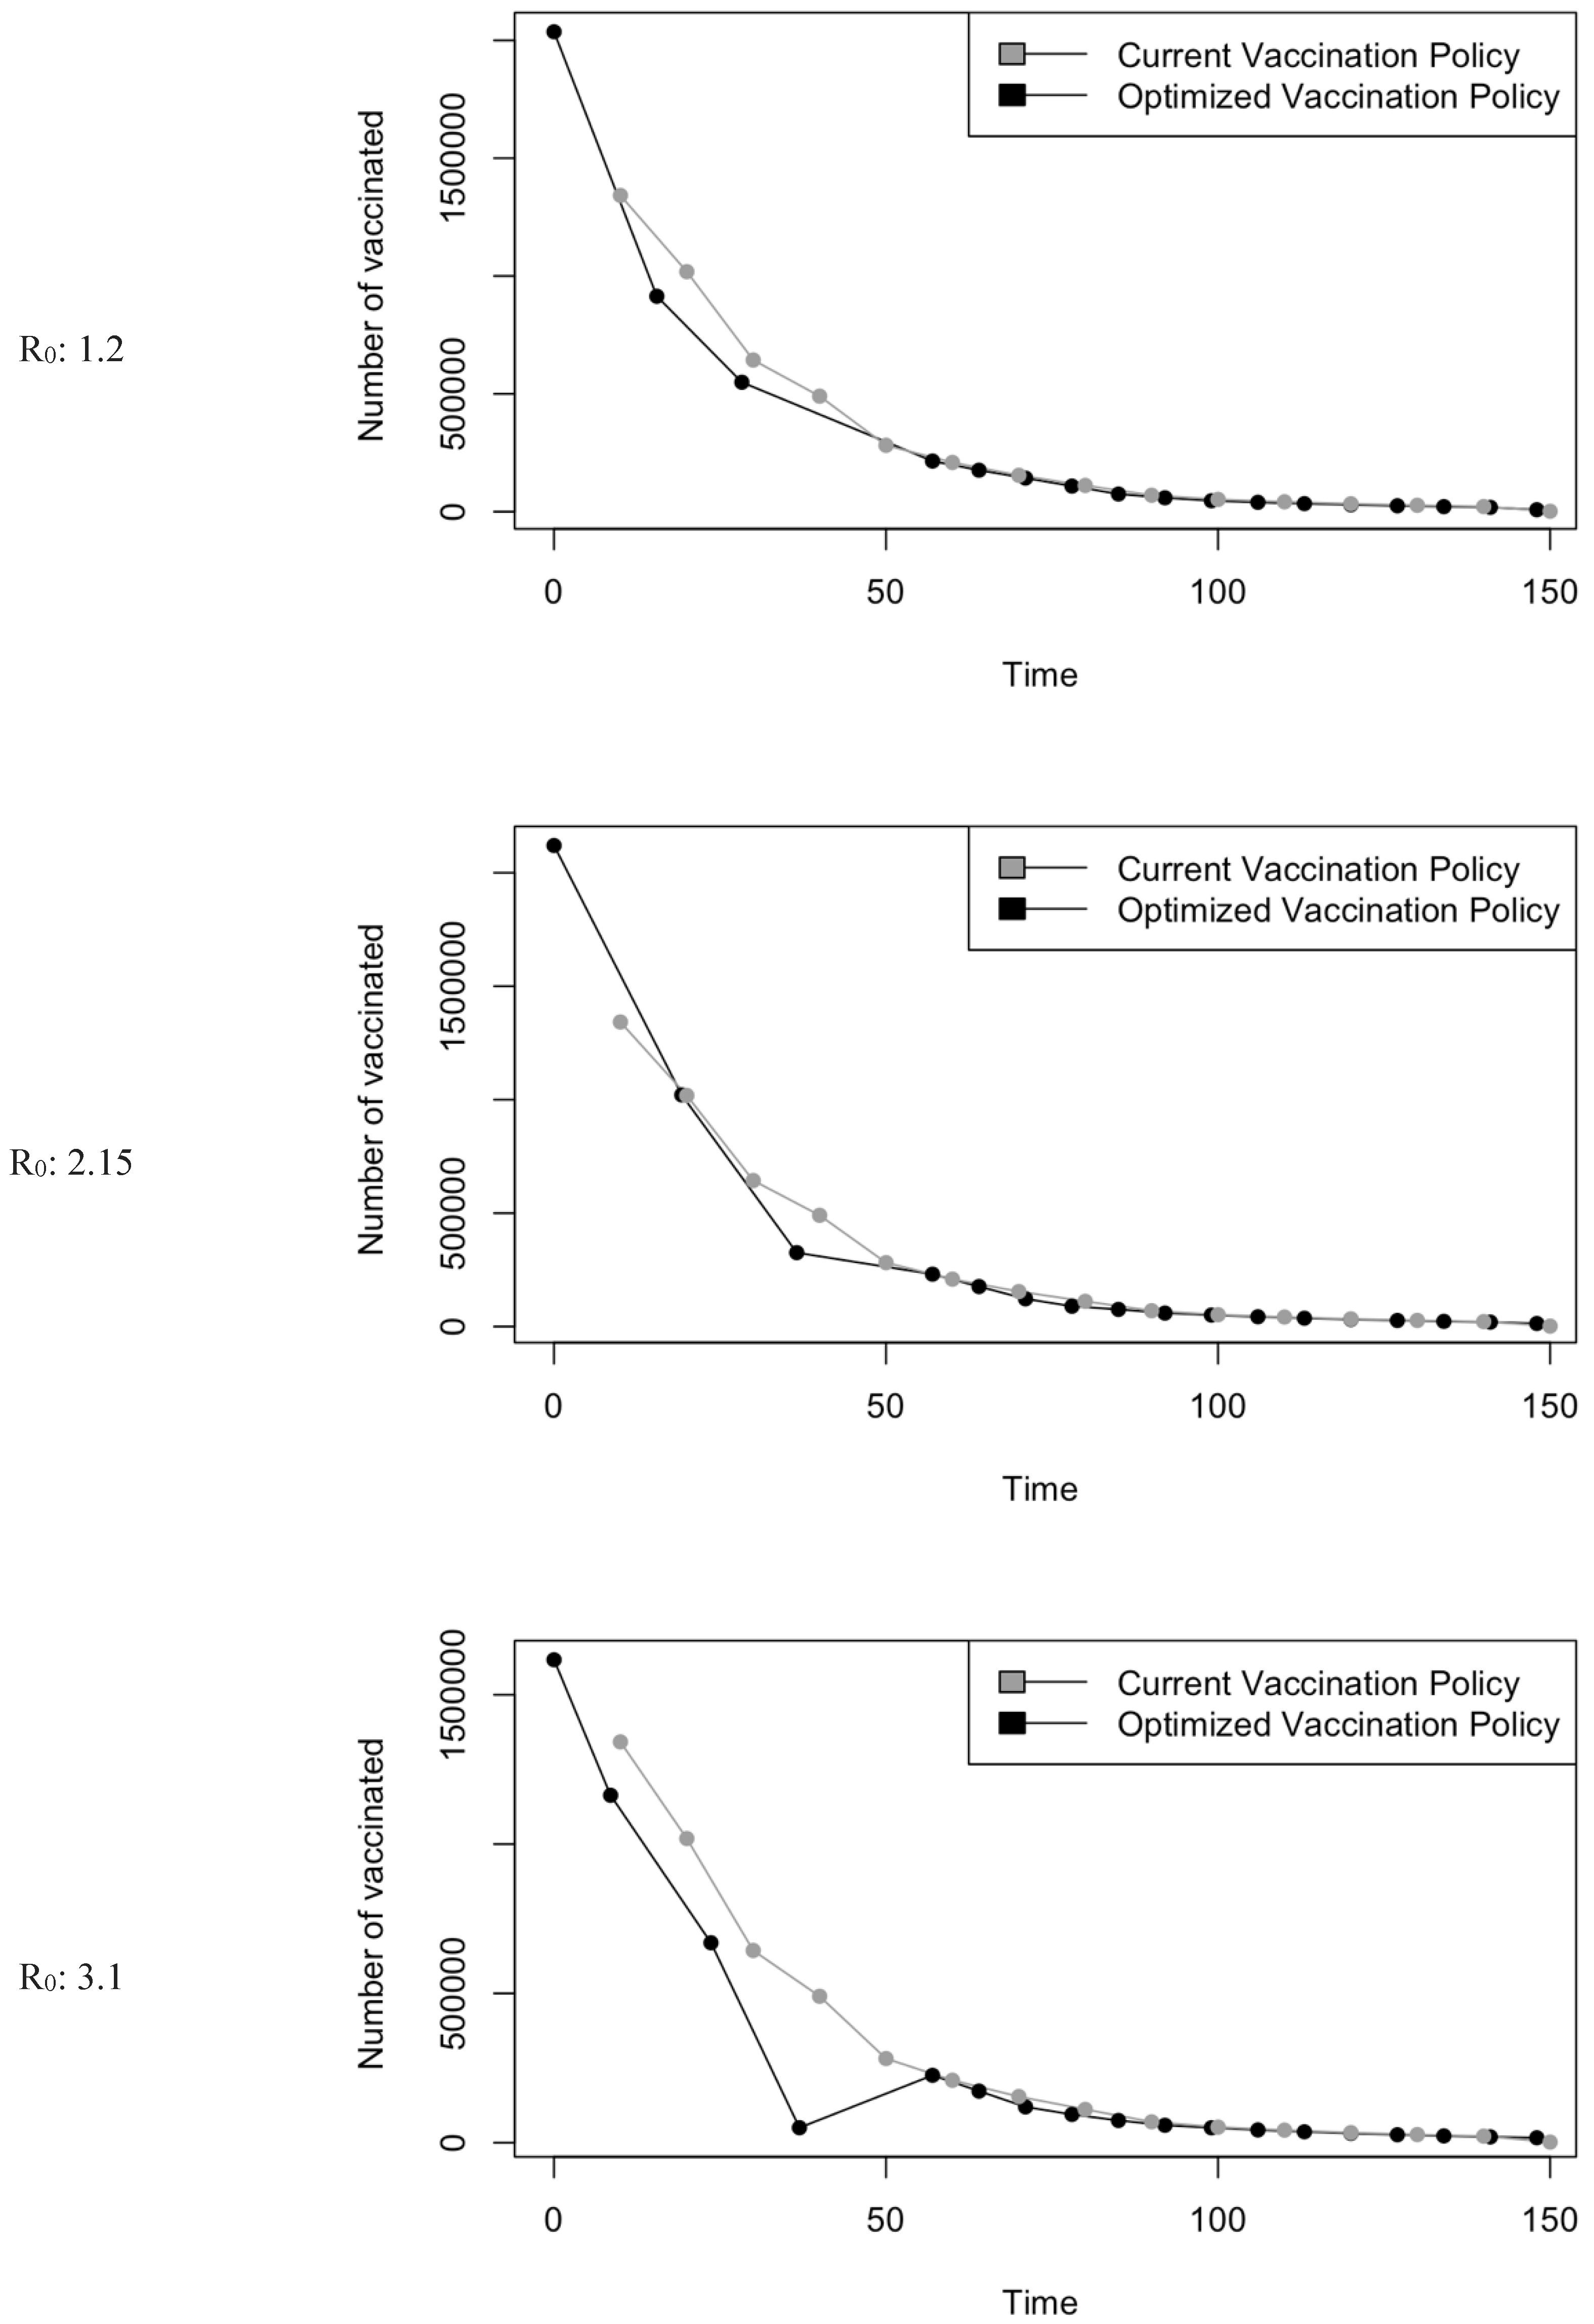
Figure 15.
Bar charts showing the number of (A) Infection (B) Hospitalizations, and (C) Mortality over a given period for R0: 1.2.
Figure 15.
Bar charts showing the number of (A) Infection (B) Hospitalizations, and (C) Mortality over a given period for R0: 1.2.
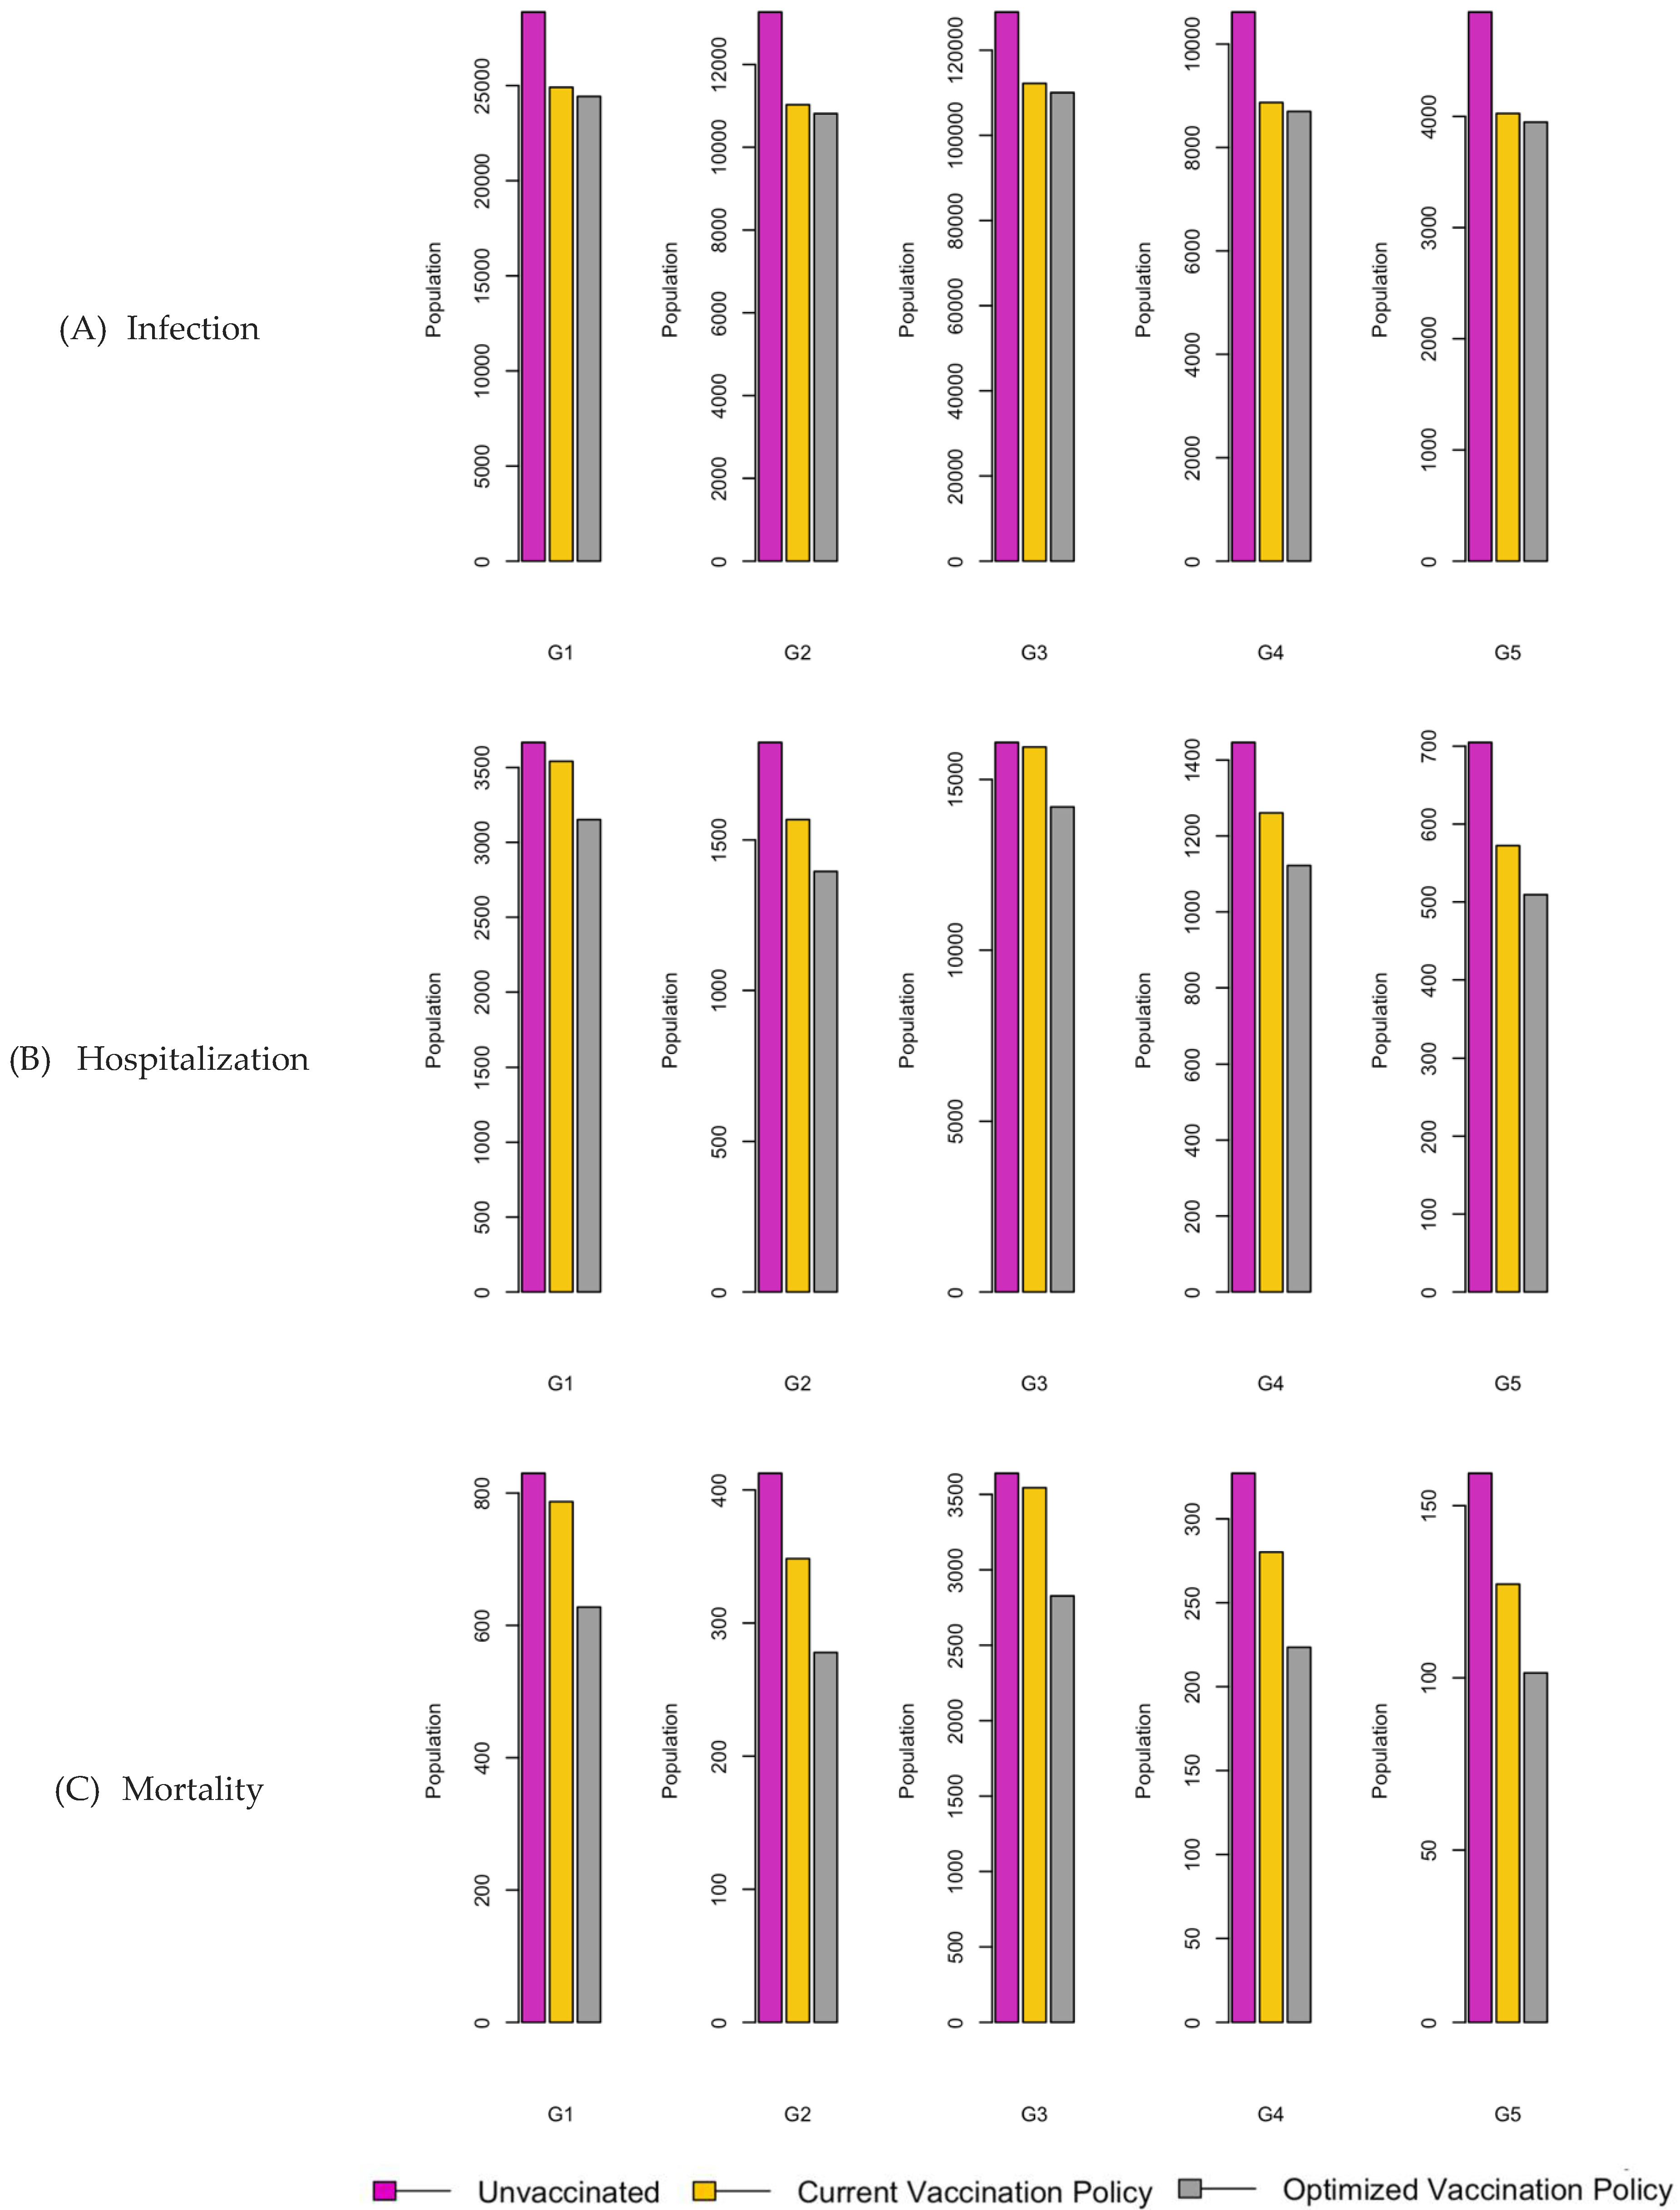
Figure 16.
Bar charts showing the number of (A) Infection (B) Hospitalizations, and (C) Mortality over a given period for R0: 2.15.
Figure 16.
Bar charts showing the number of (A) Infection (B) Hospitalizations, and (C) Mortality over a given period for R0: 2.15.
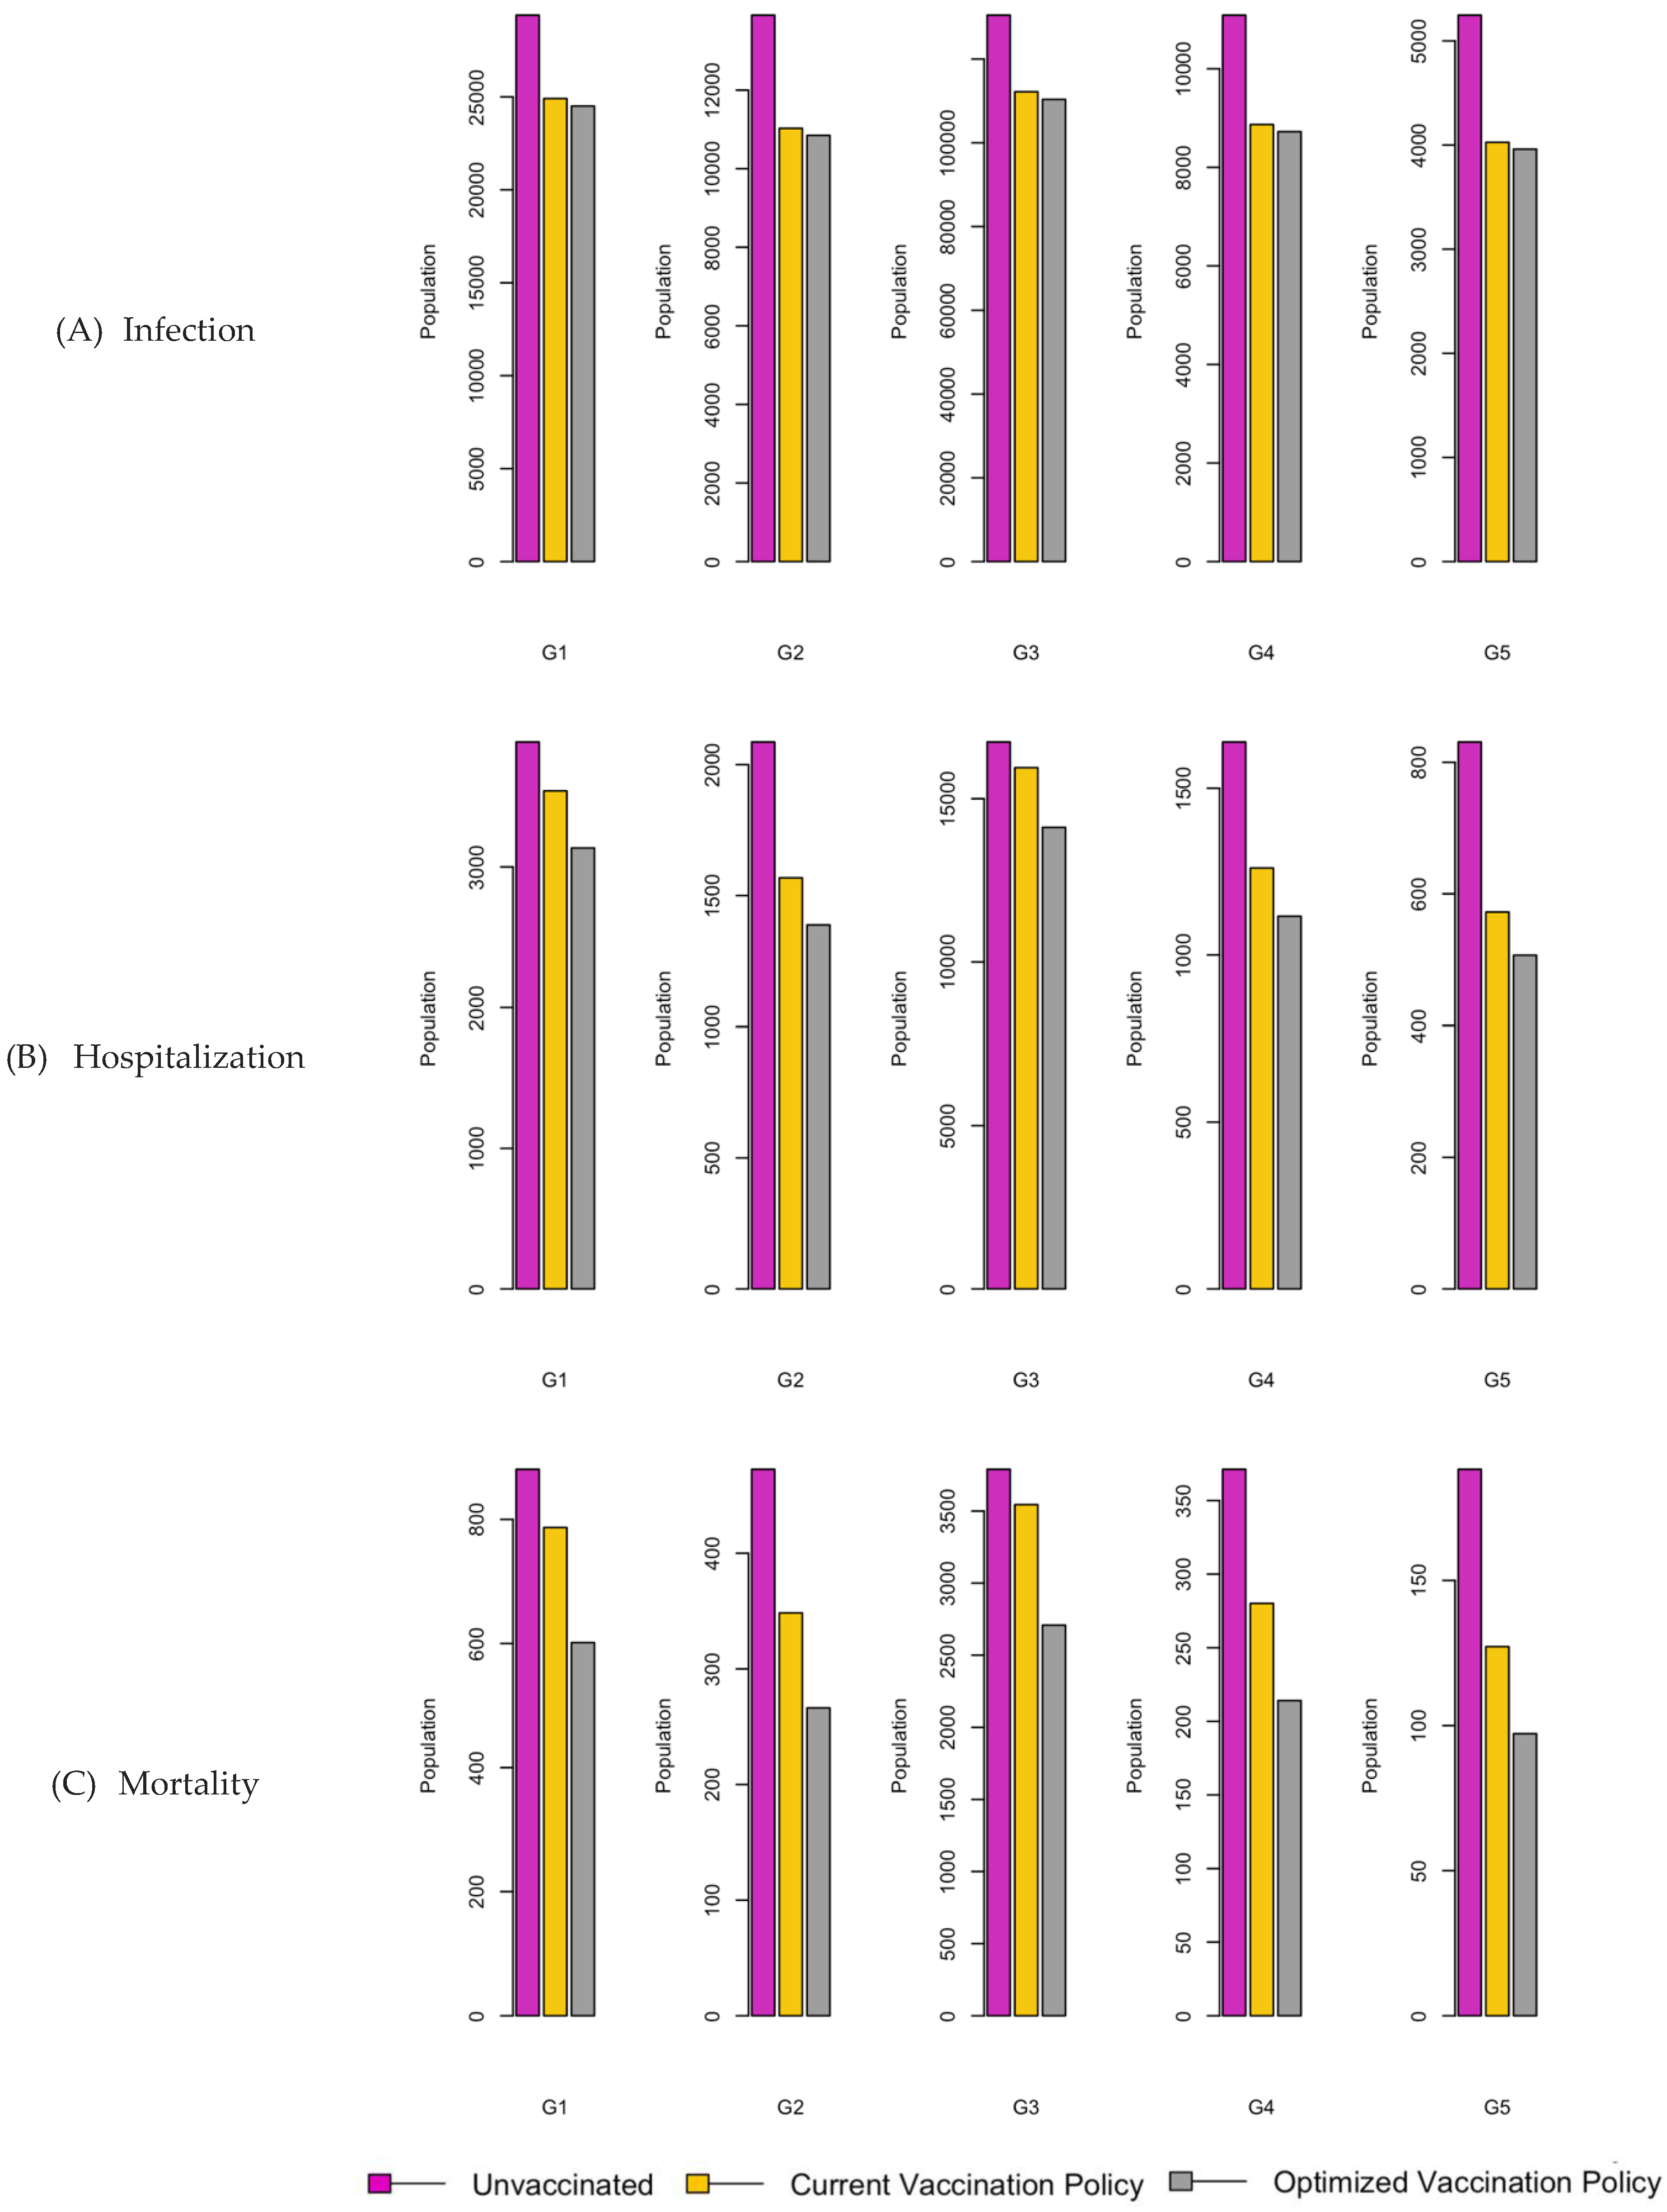
Figure 17.
Bar charts showing the number of (A) Infection (B) Hospitalizations, and (C) Mortality over a given period for R0: 3.1.
Figure 17.
Bar charts showing the number of (A) Infection (B) Hospitalizations, and (C) Mortality over a given period for R0: 3.1.
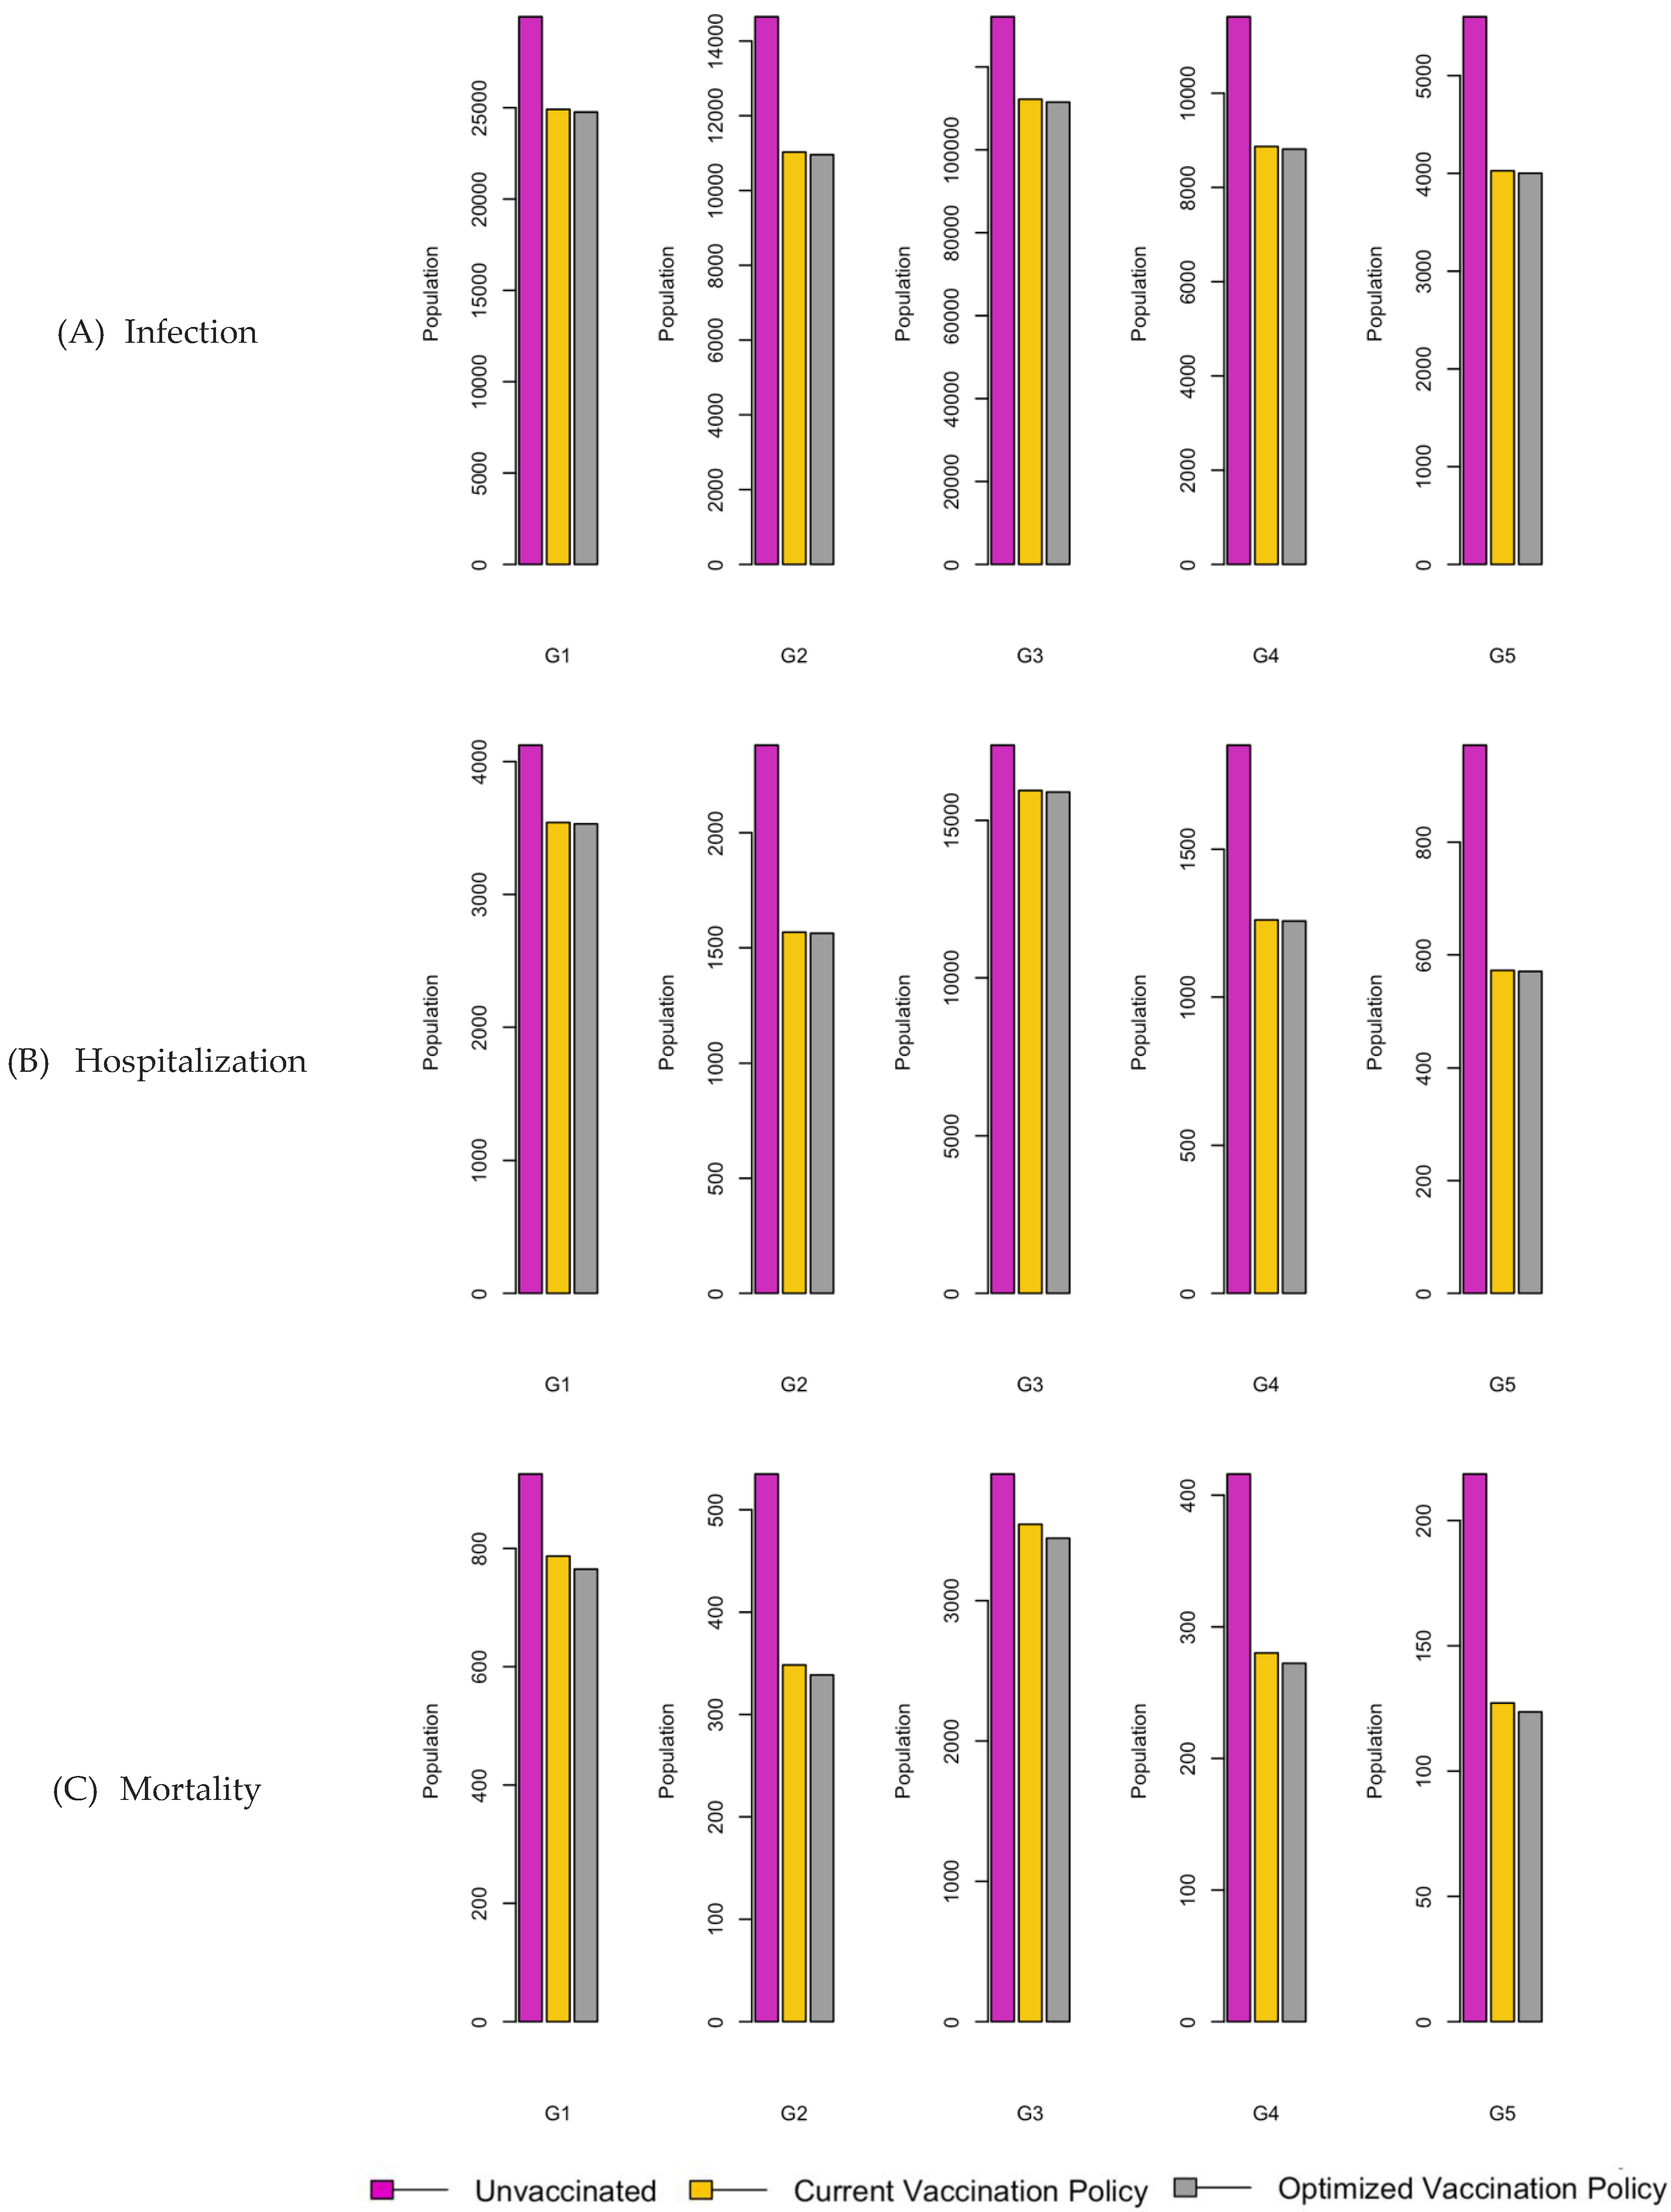
Figure 18.
Vaccination Strategy for the Case of Northern region.
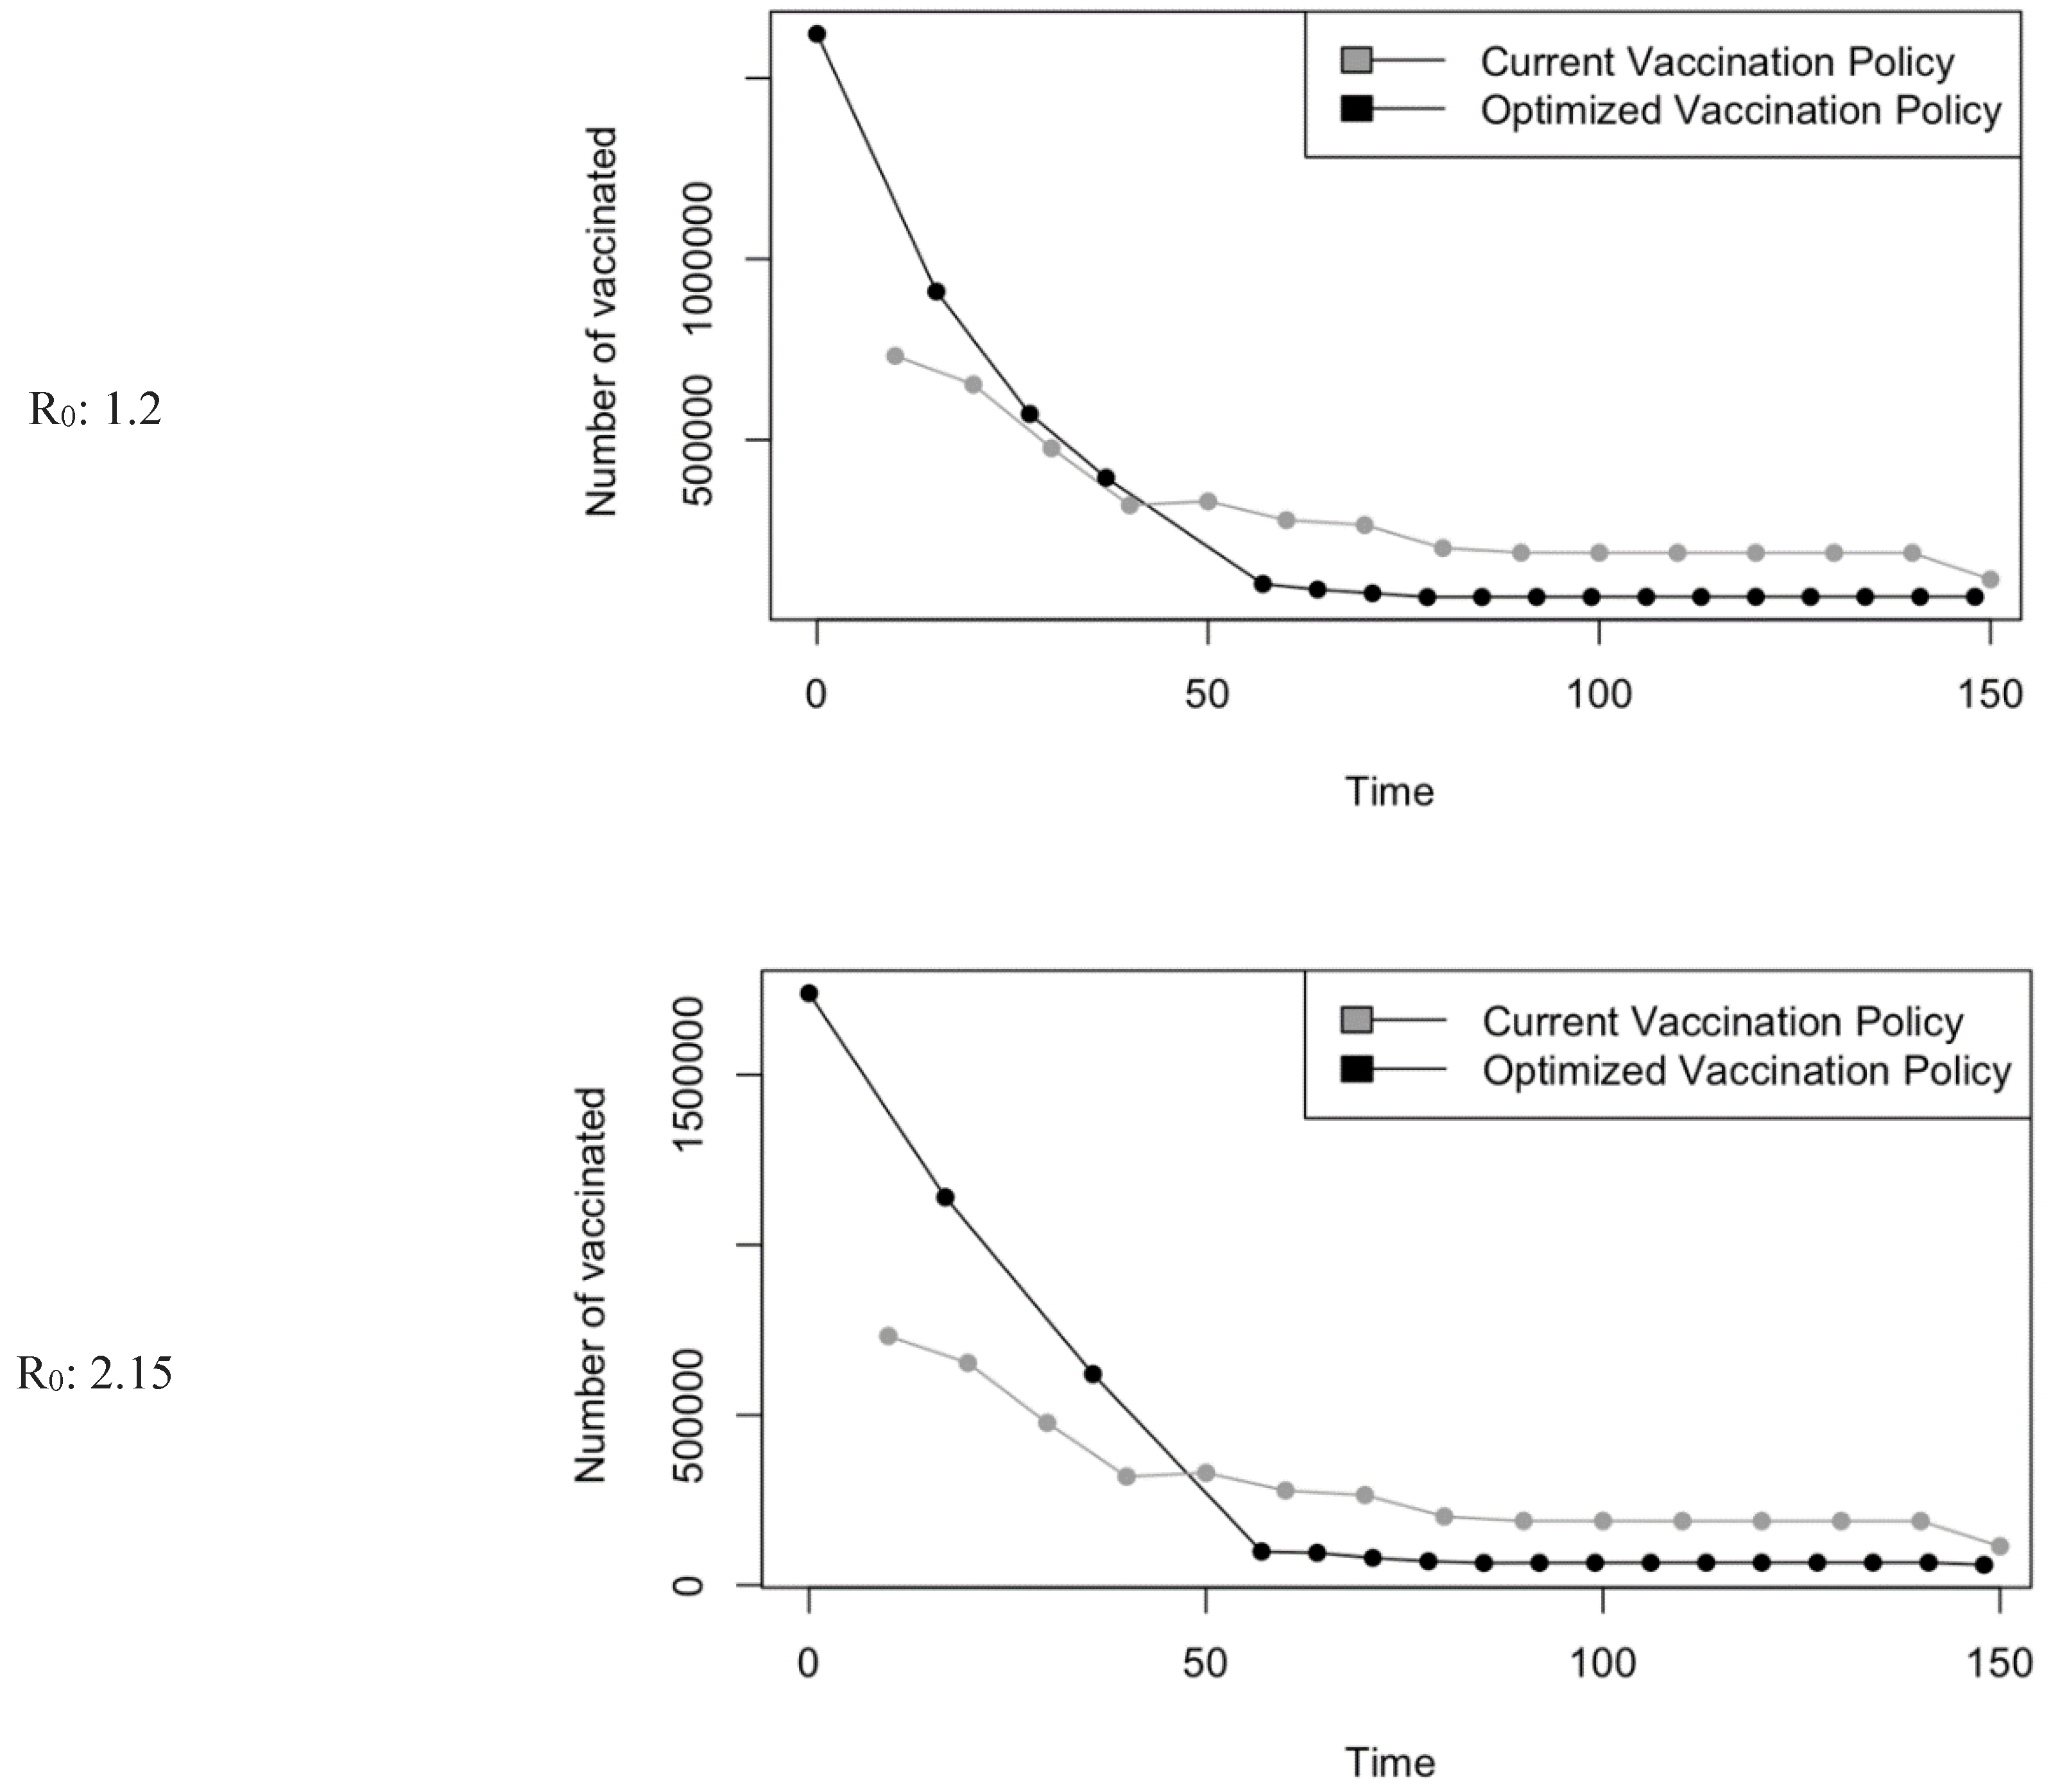
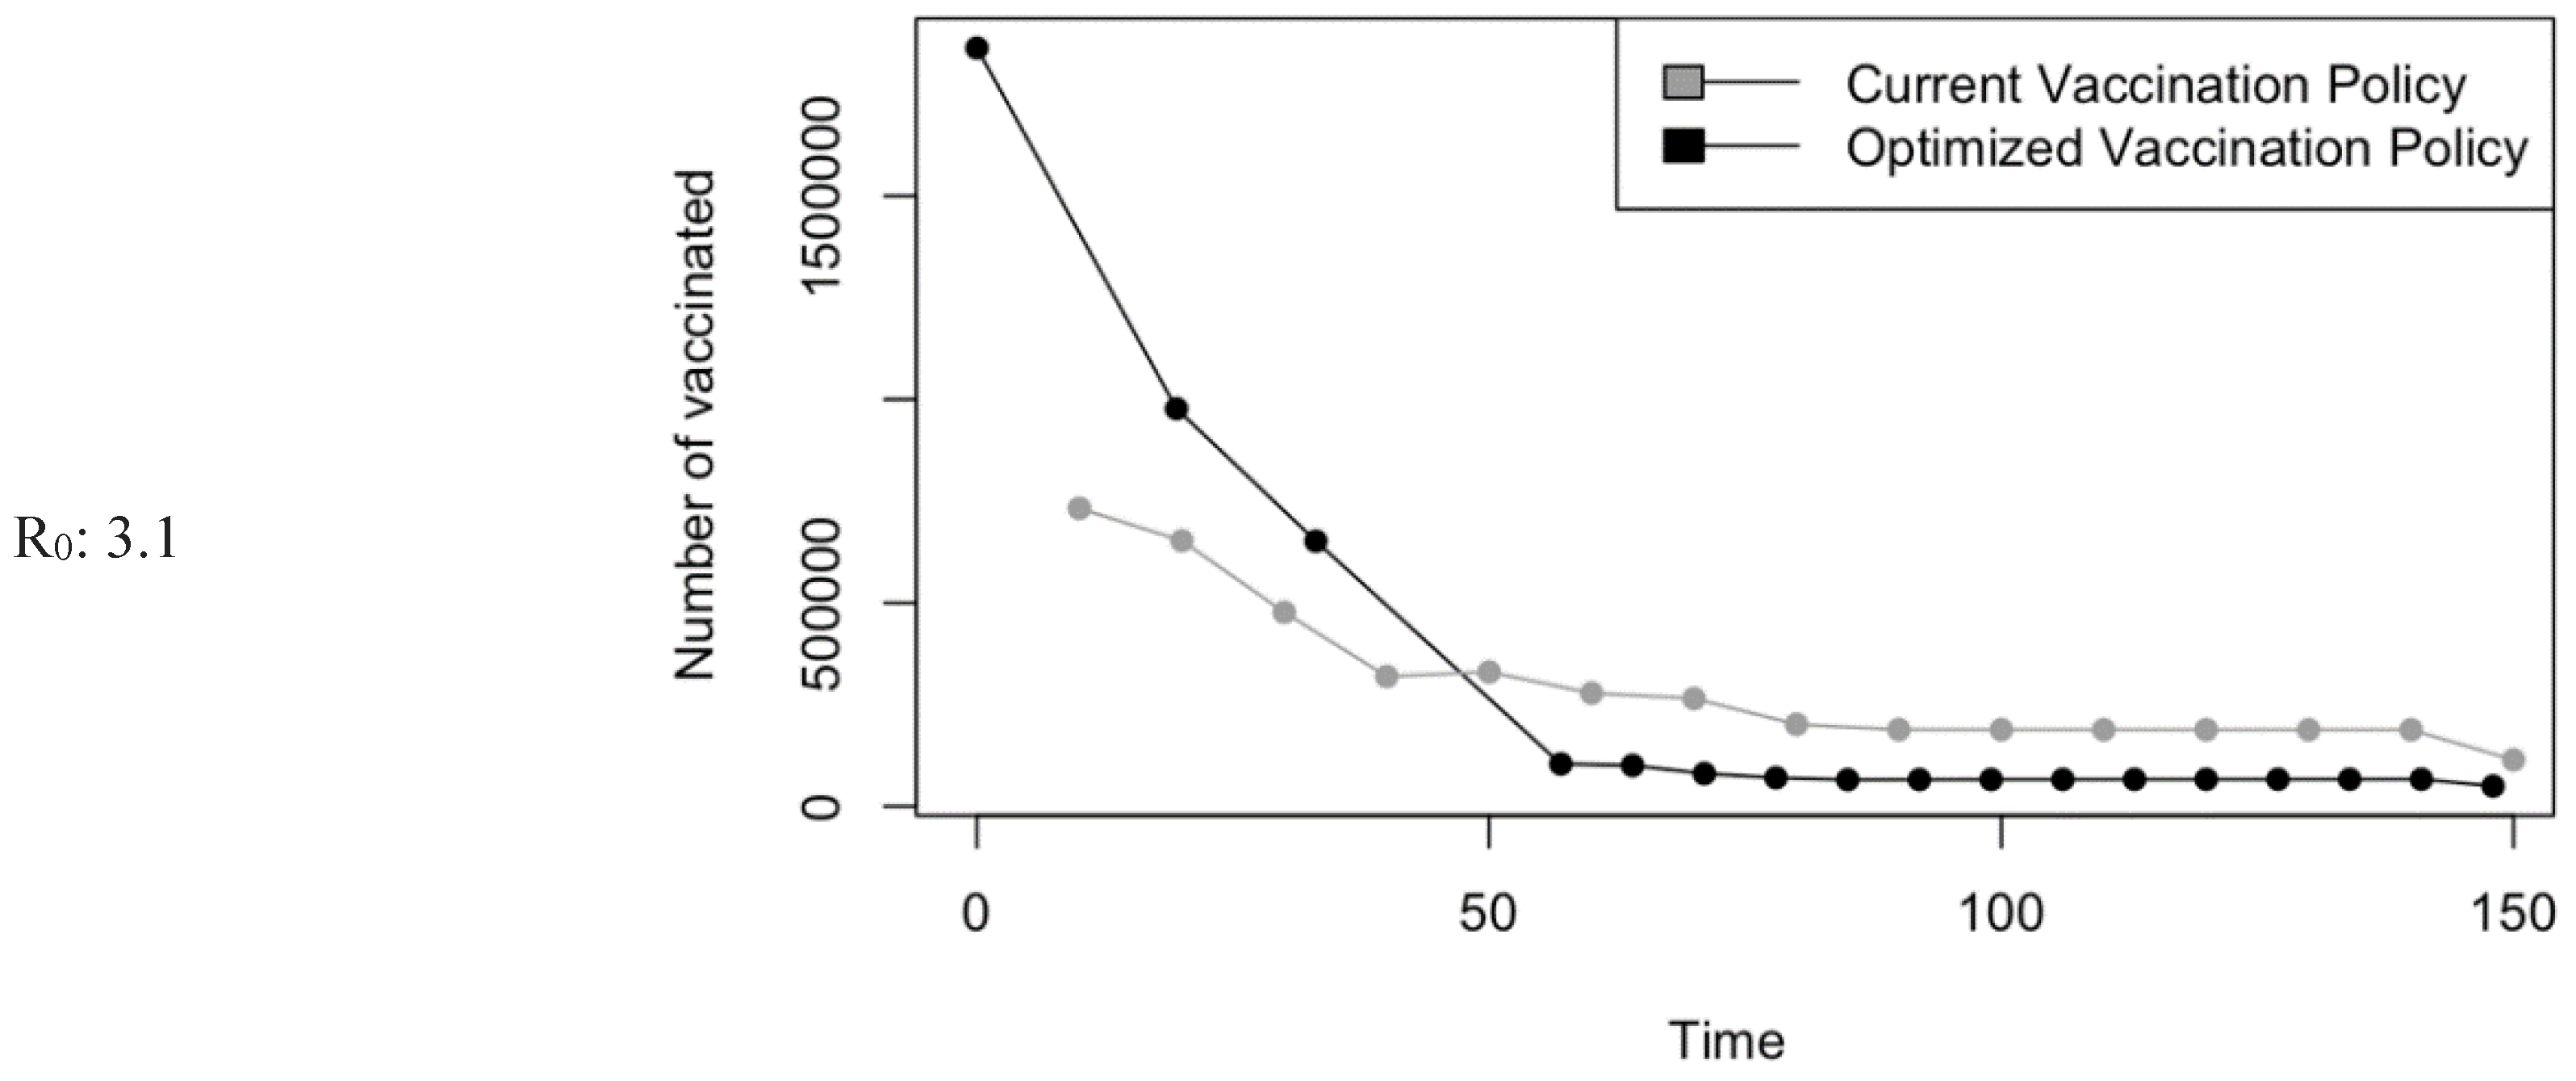
Figure 19.
Bar charts showing the number of (A) Infection (B) Hospitalizations, and (C) Mortality over a given period for R0: 1.2.
Figure 19.
Bar charts showing the number of (A) Infection (B) Hospitalizations, and (C) Mortality over a given period for R0: 1.2.
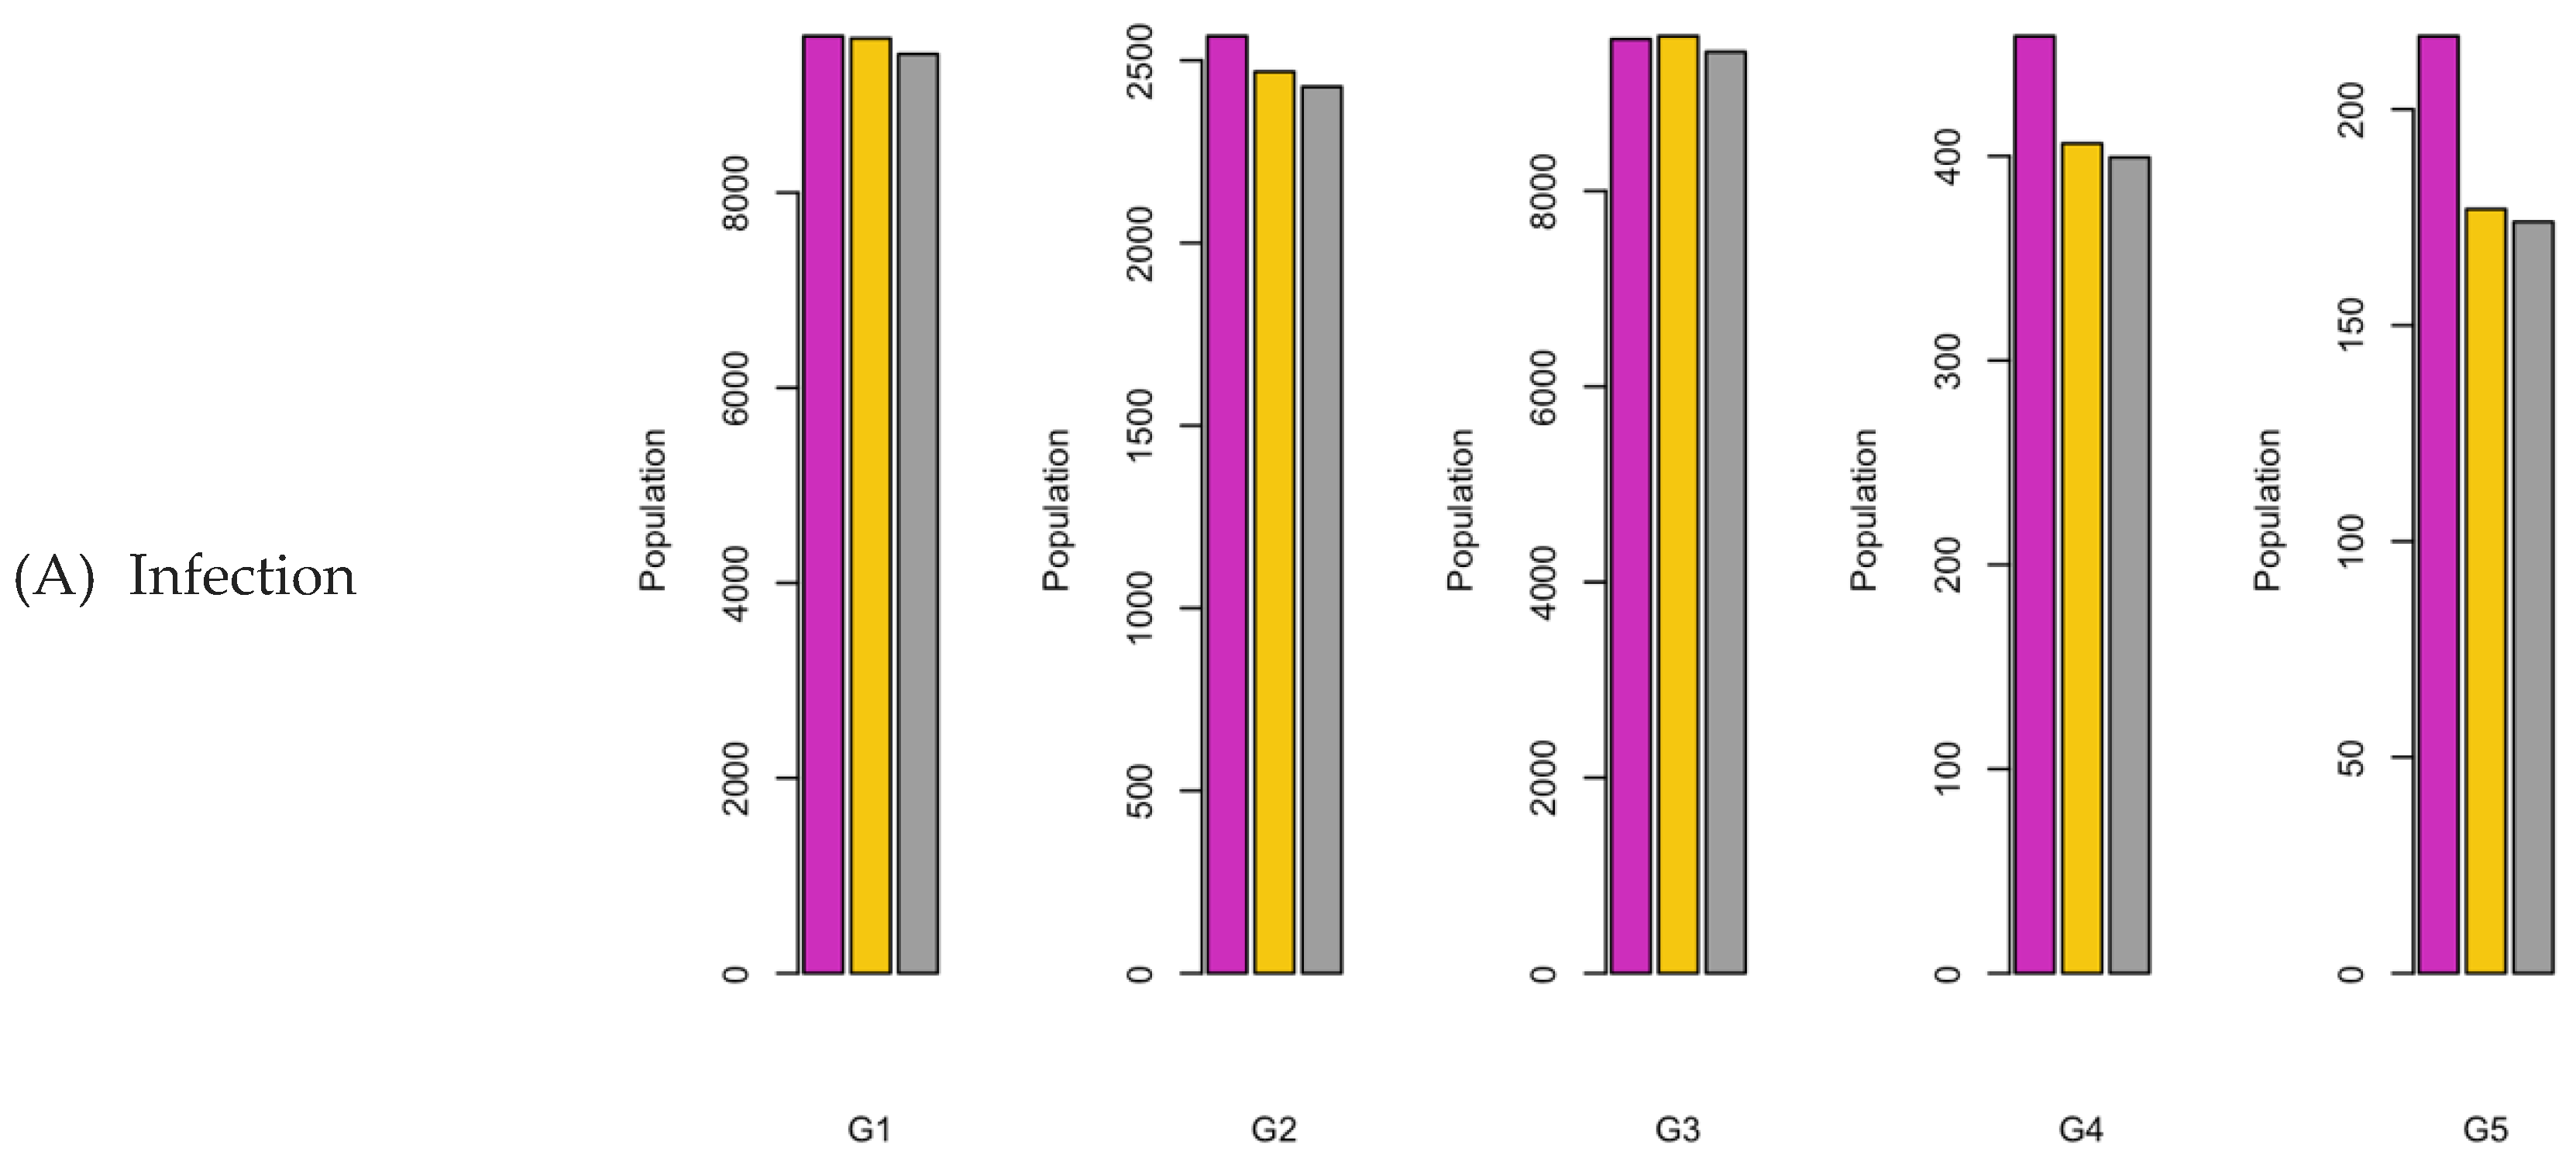
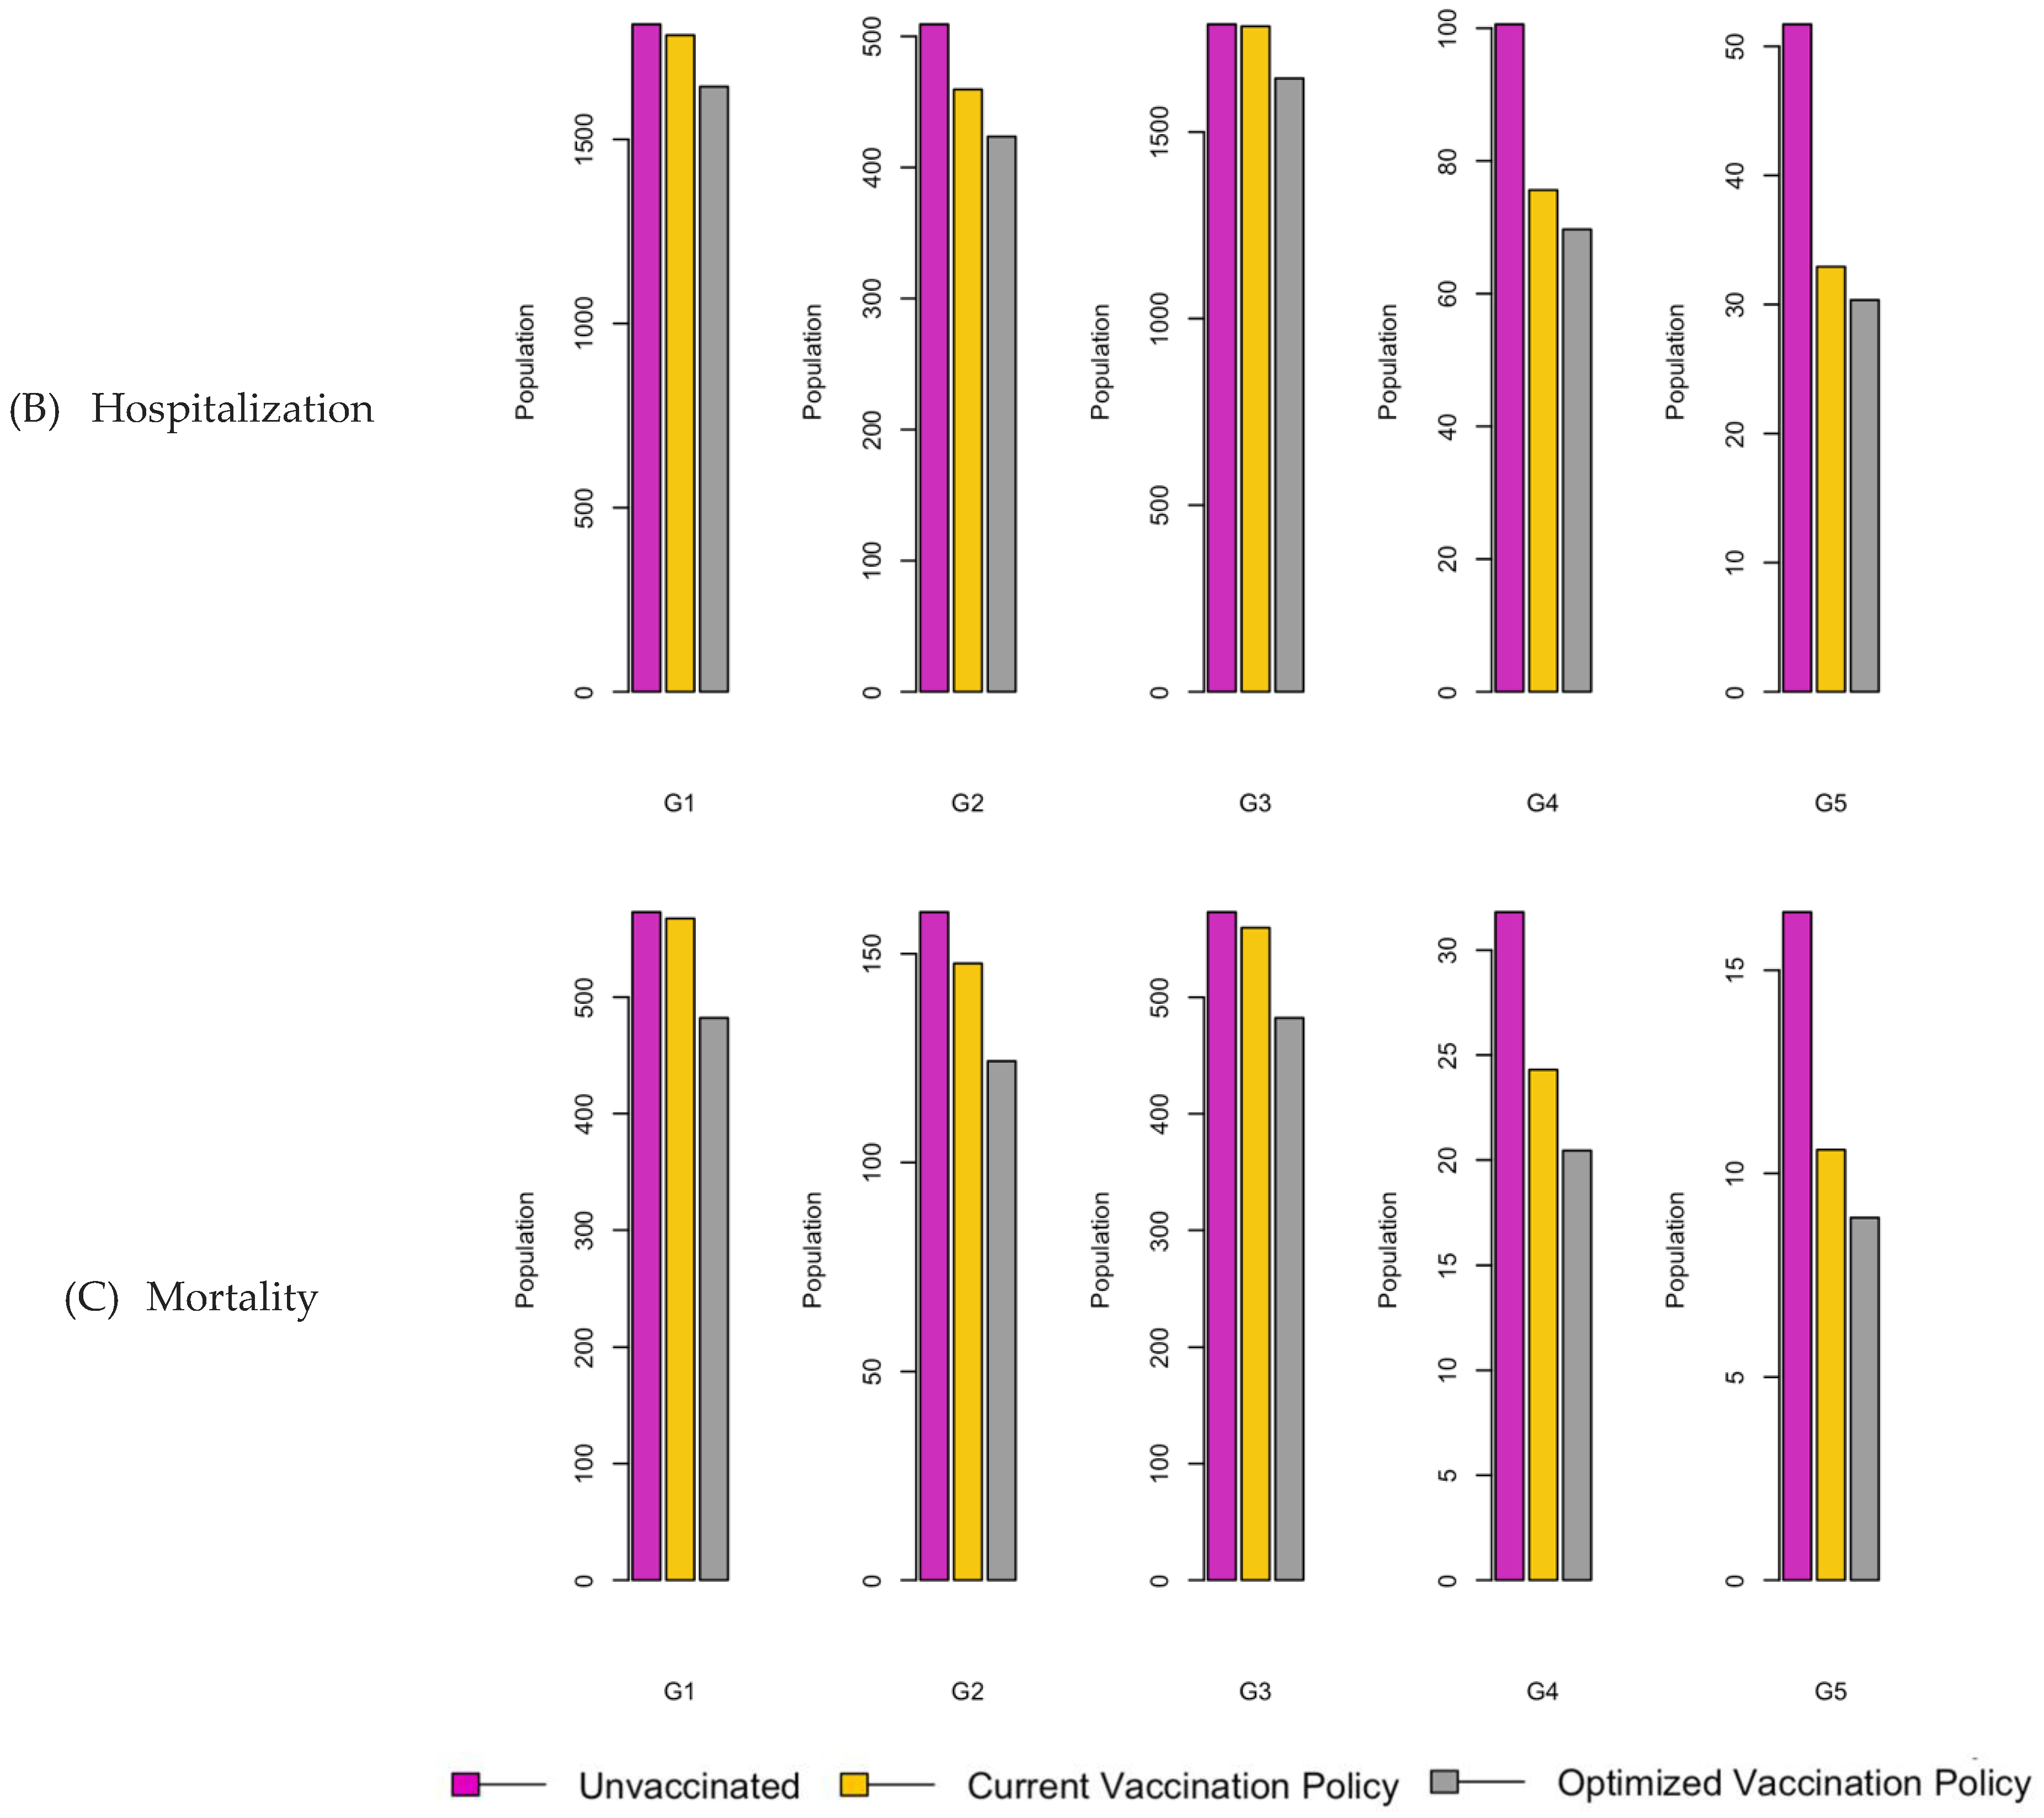
Figure 20.
Bar charts showing the number of (A) Infection (B) Hospitalizations, and (C) Mortality over a given period for R0: 2.15.
Figure 20.
Bar charts showing the number of (A) Infection (B) Hospitalizations, and (C) Mortality over a given period for R0: 2.15.
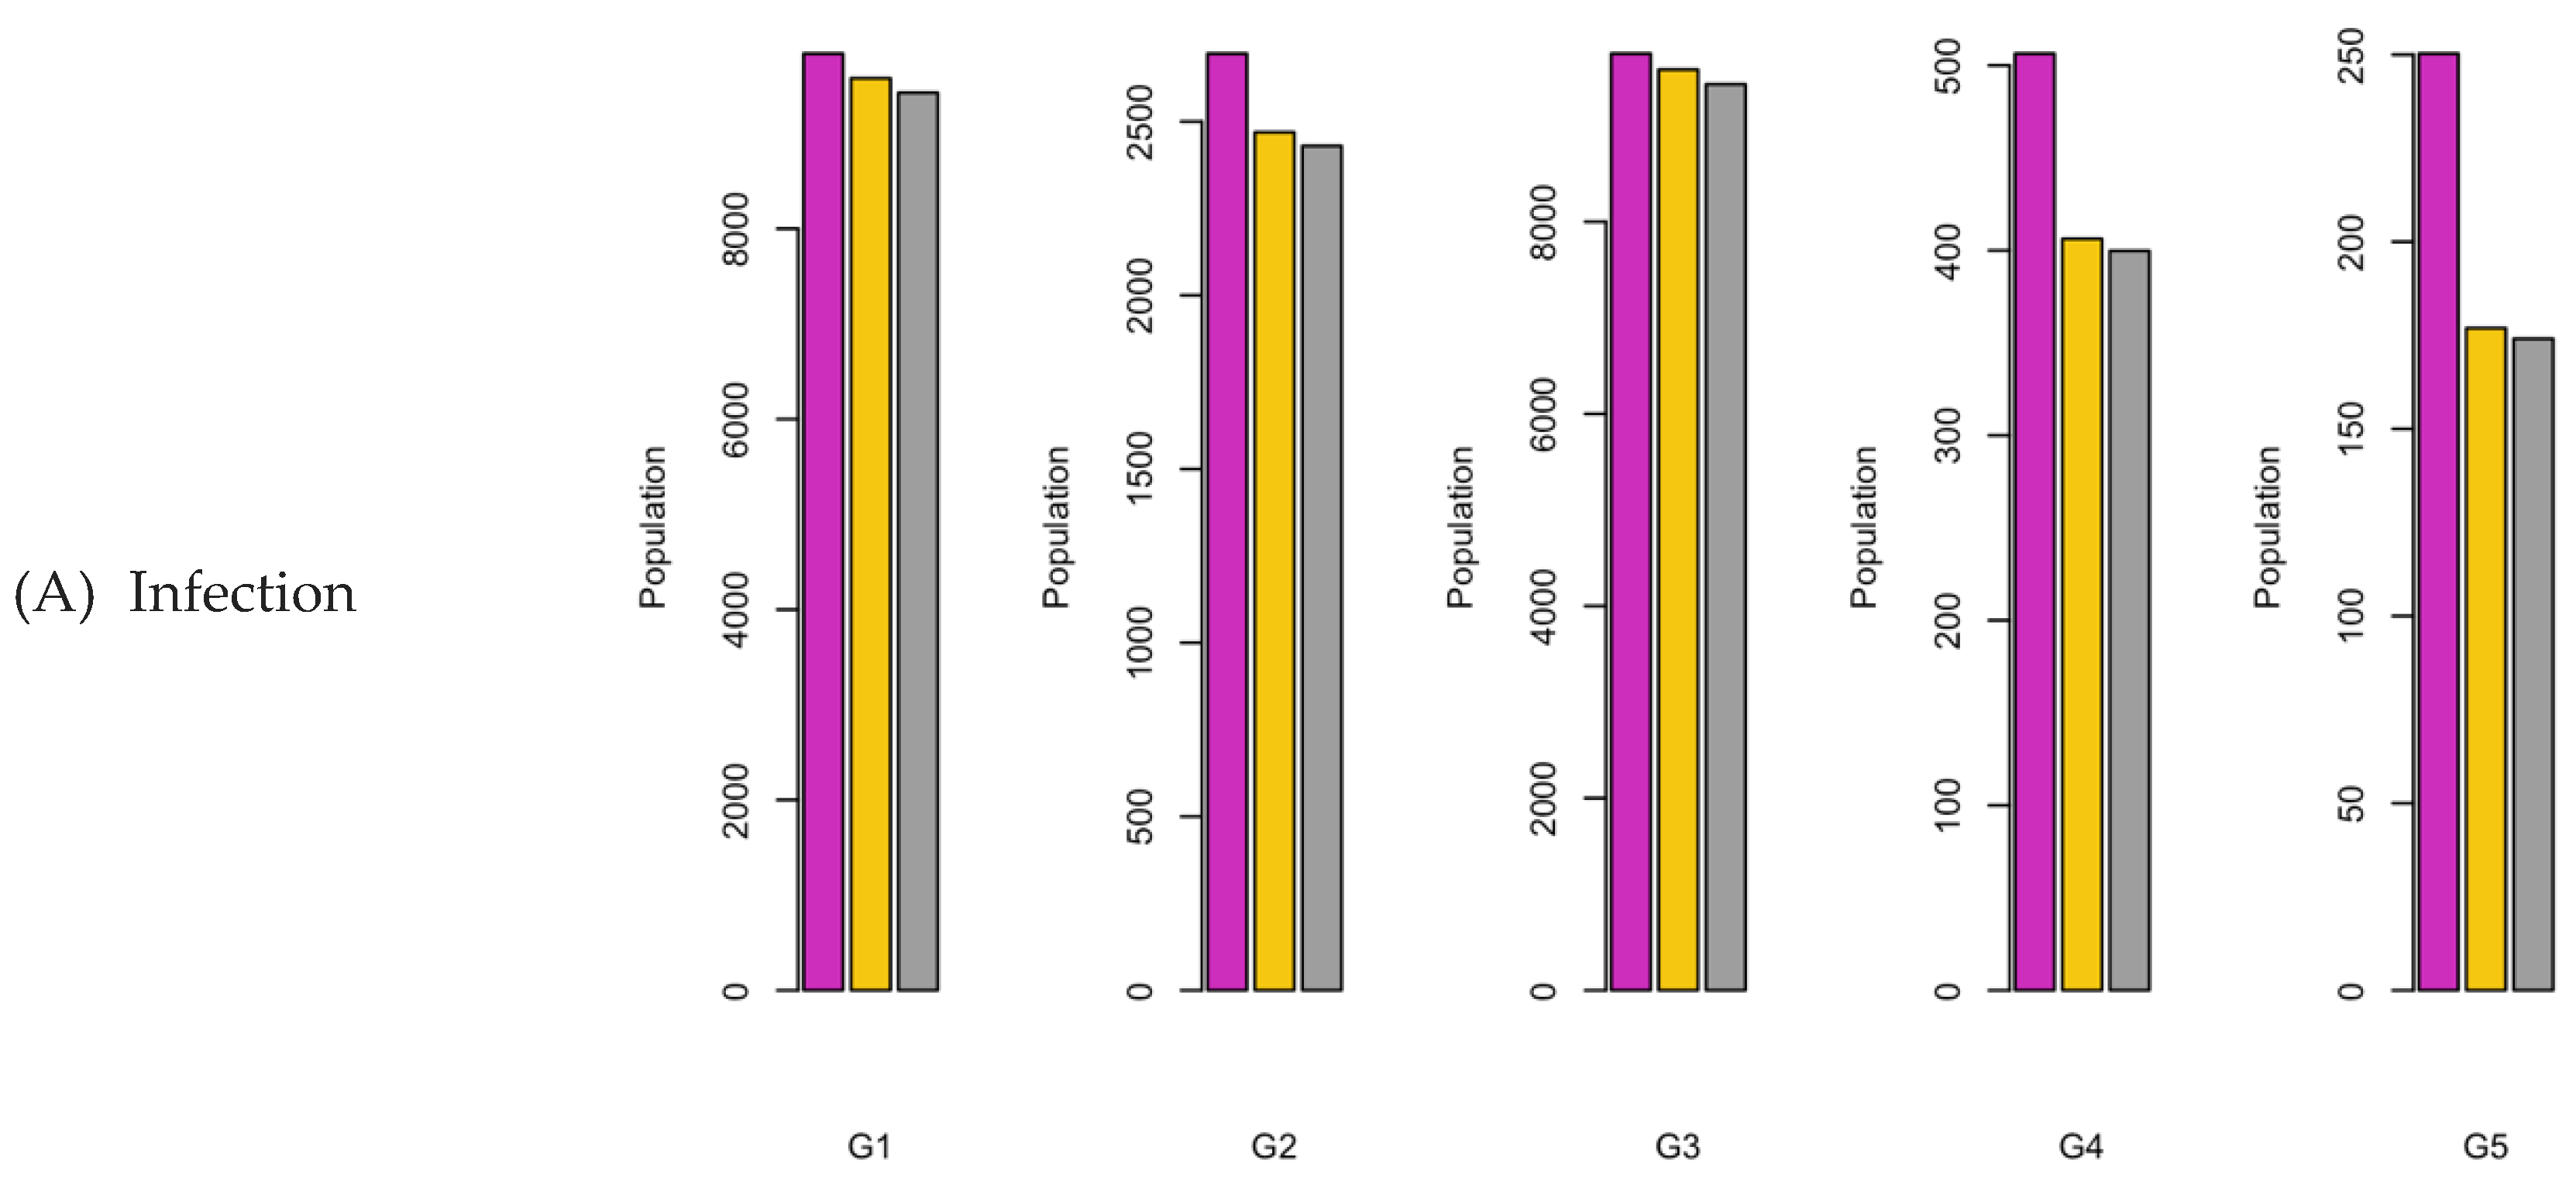
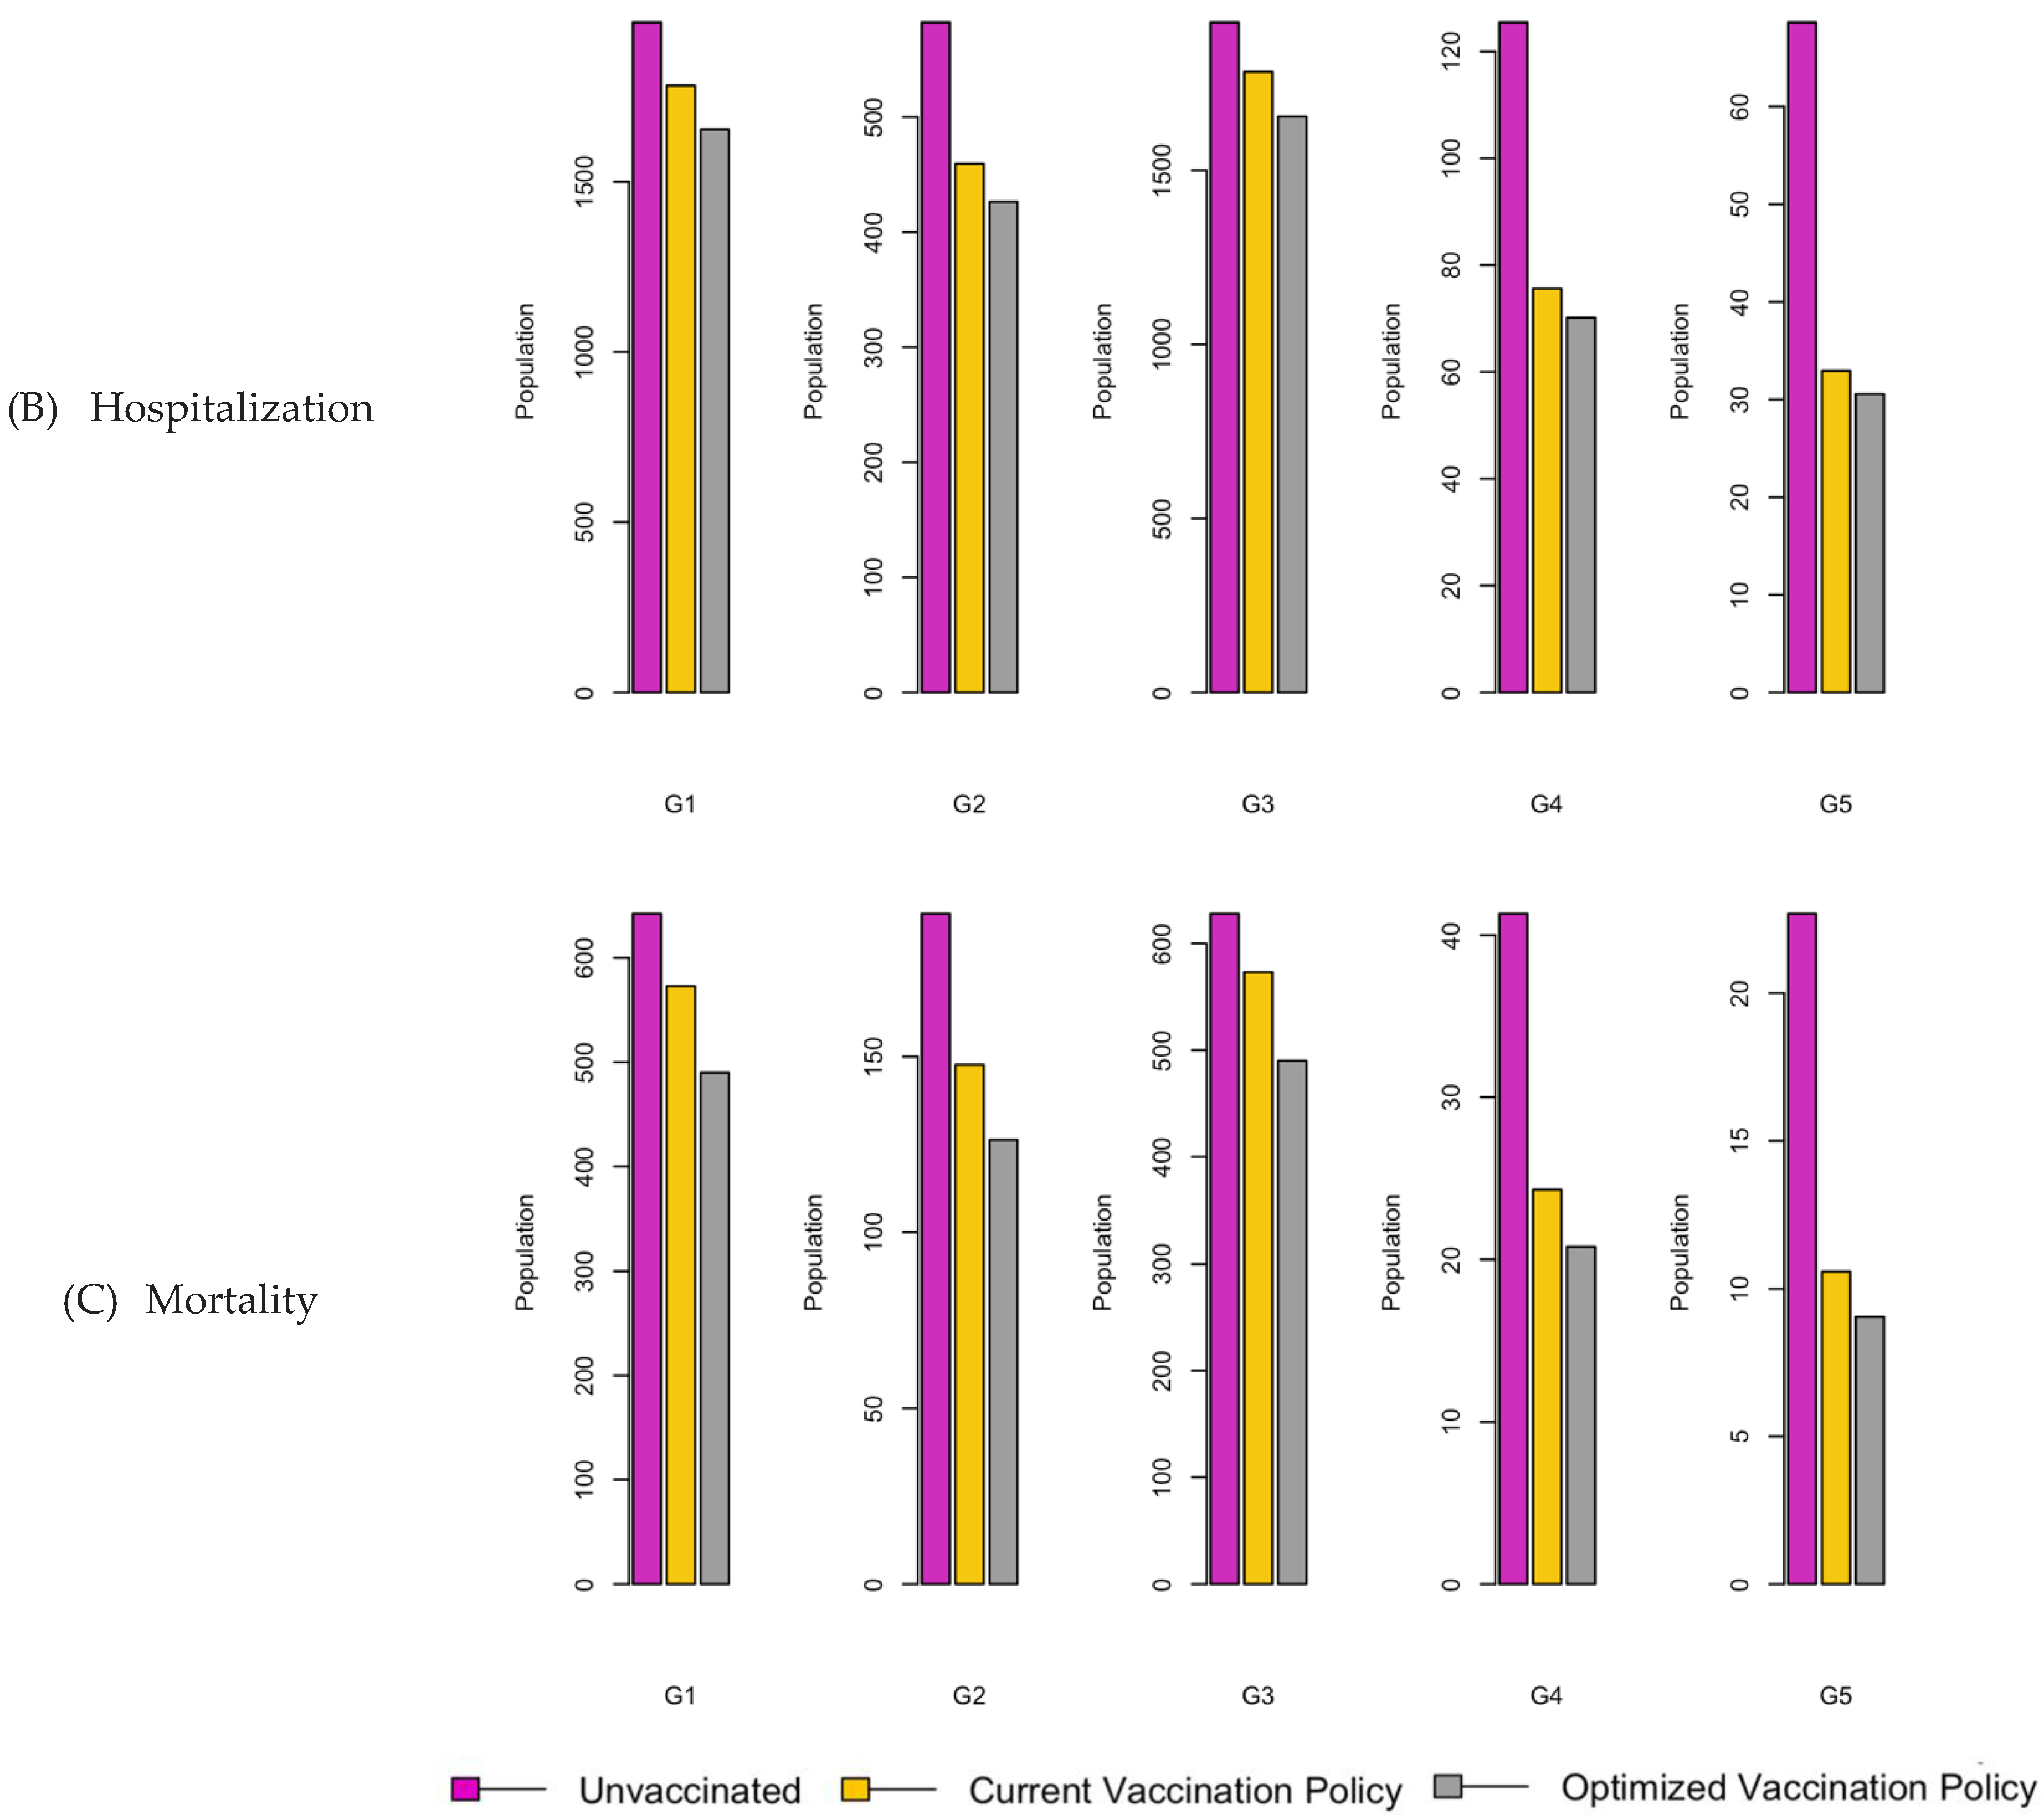
Figure 21.
Bar charts showing the number of (A) Infection (B) Hospitalizations, and (C) Mortality over a given period for R0: 3.1.
Figure 21.
Bar charts showing the number of (A) Infection (B) Hospitalizations, and (C) Mortality over a given period for R0: 3.1.
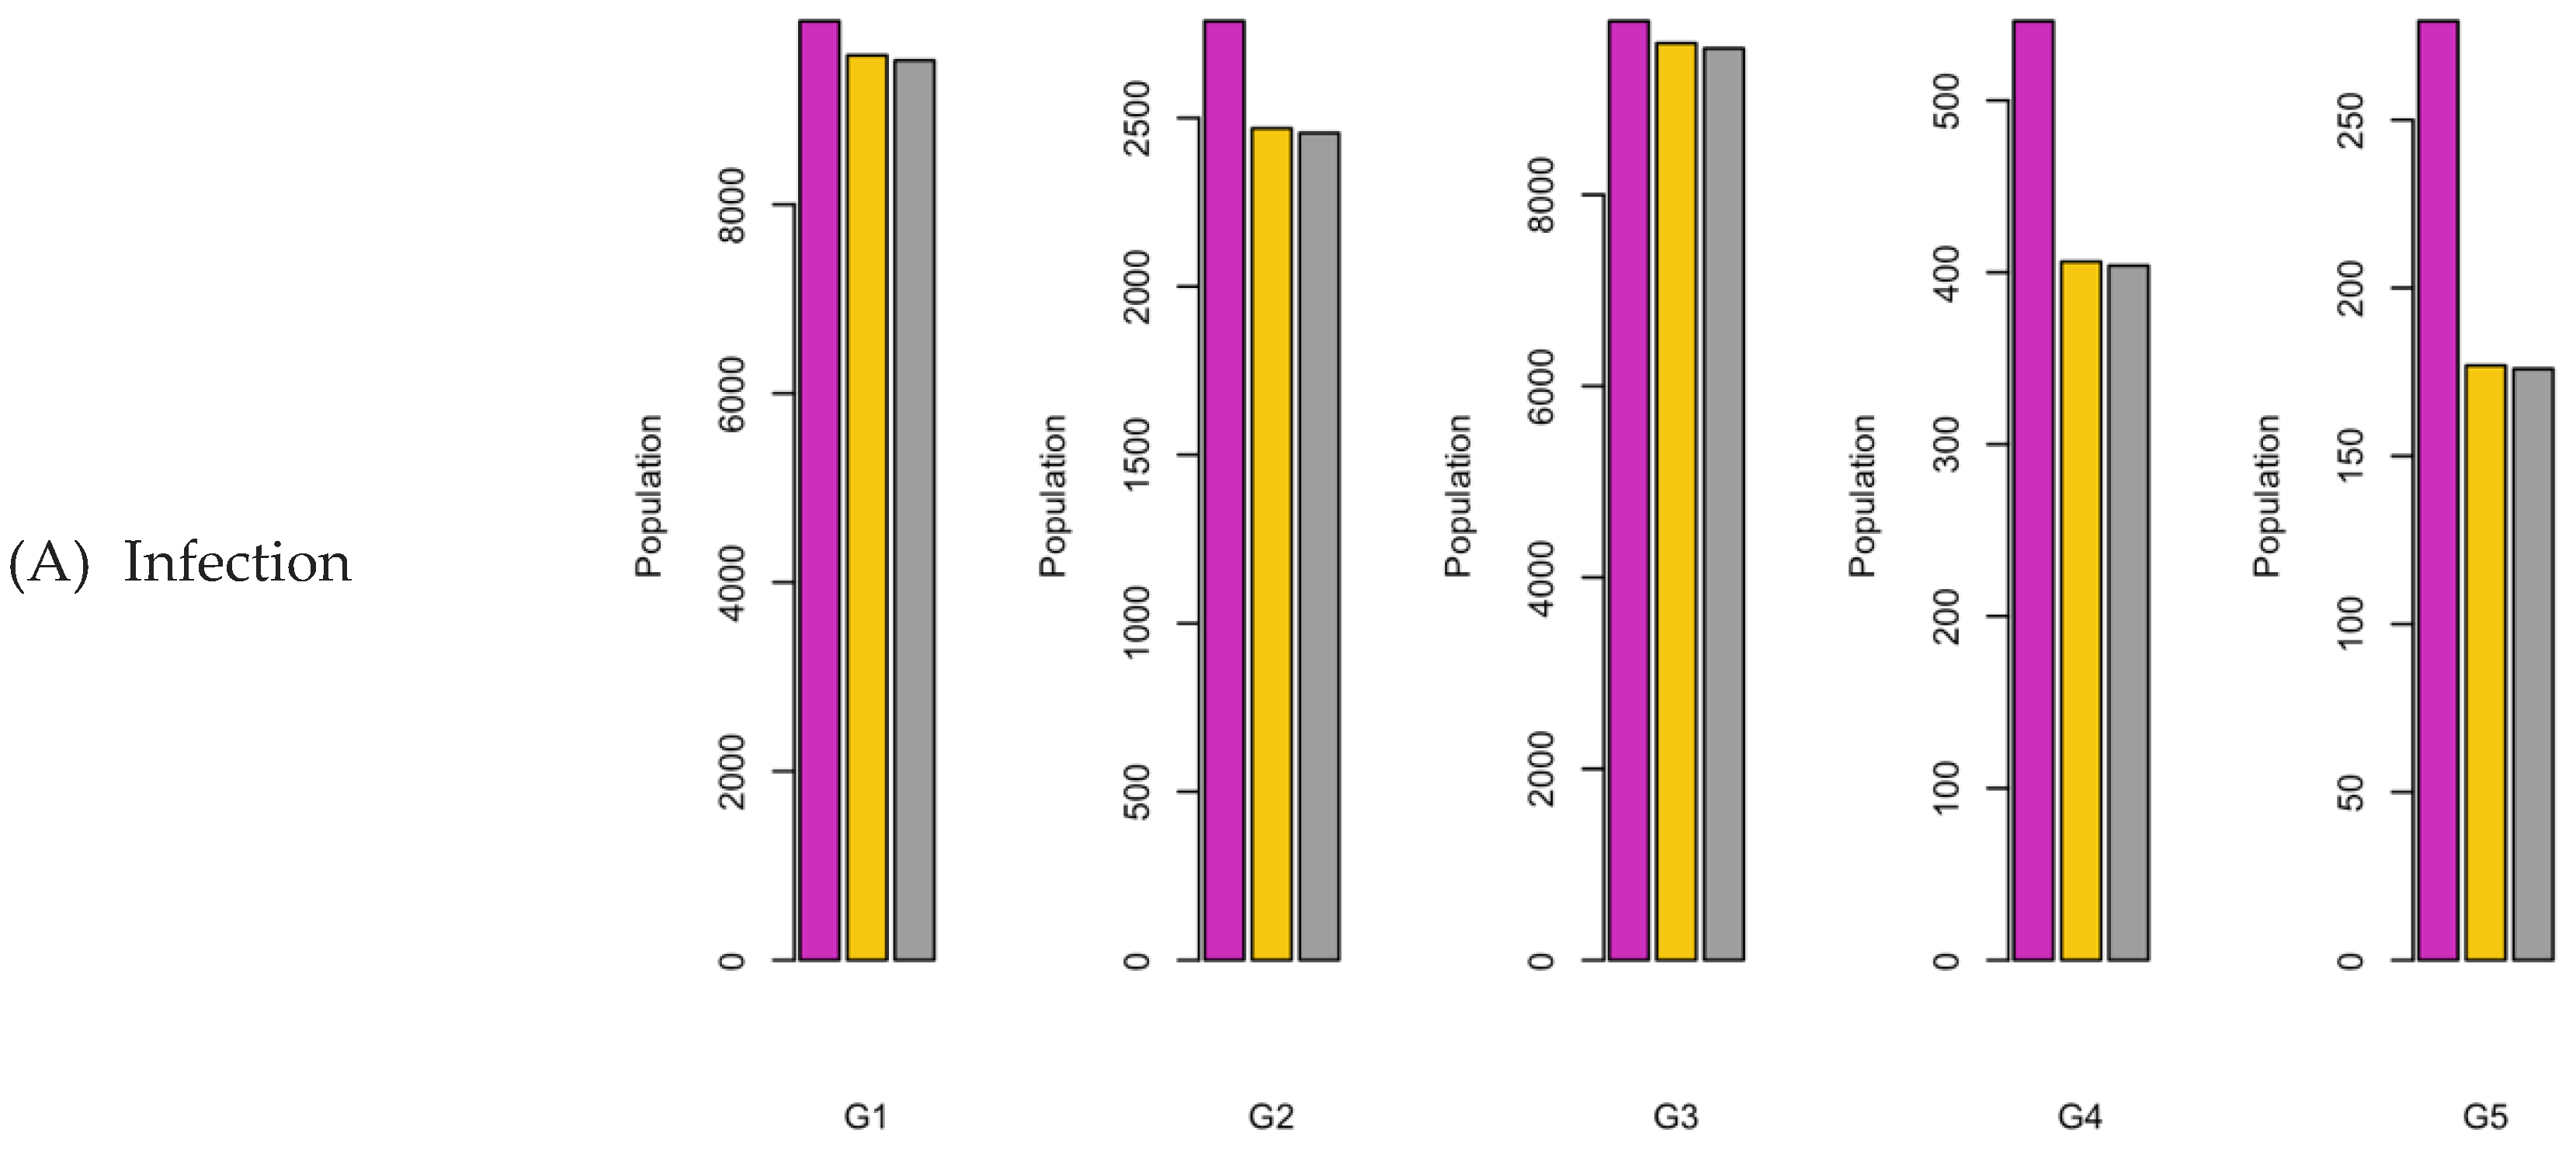
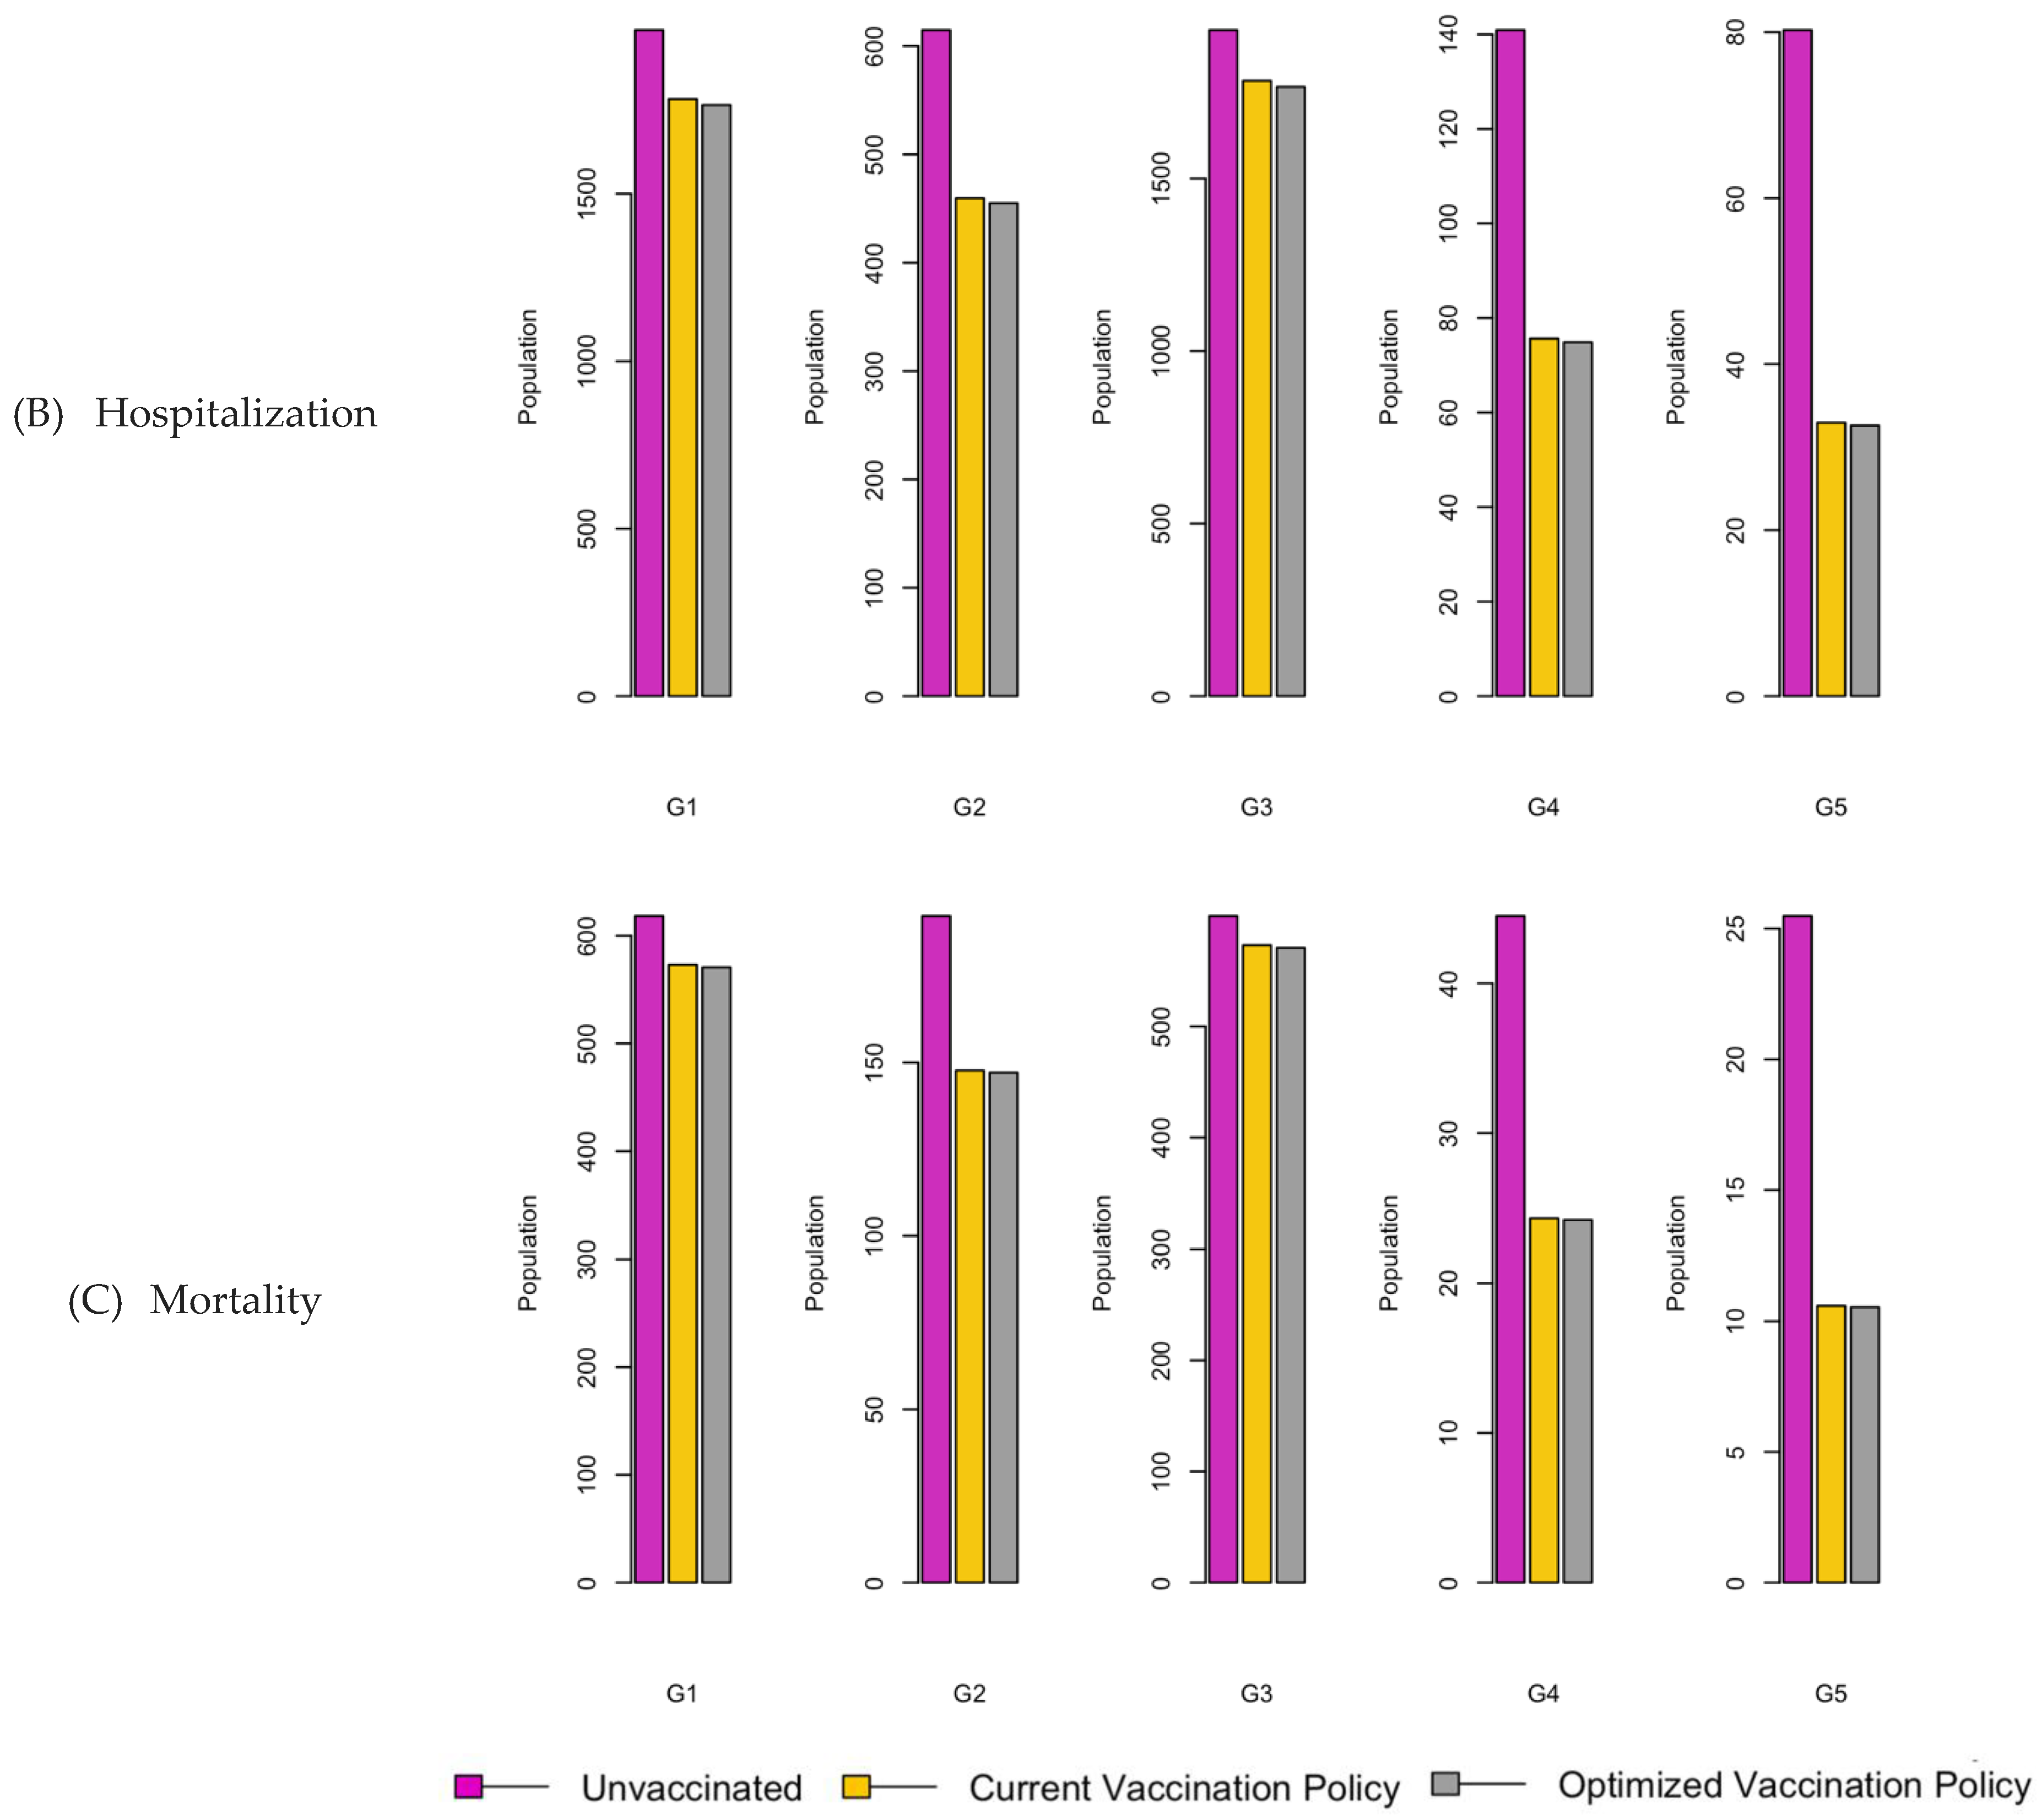
Figure 22.
Vaccination Strategy for the Case of Western region.
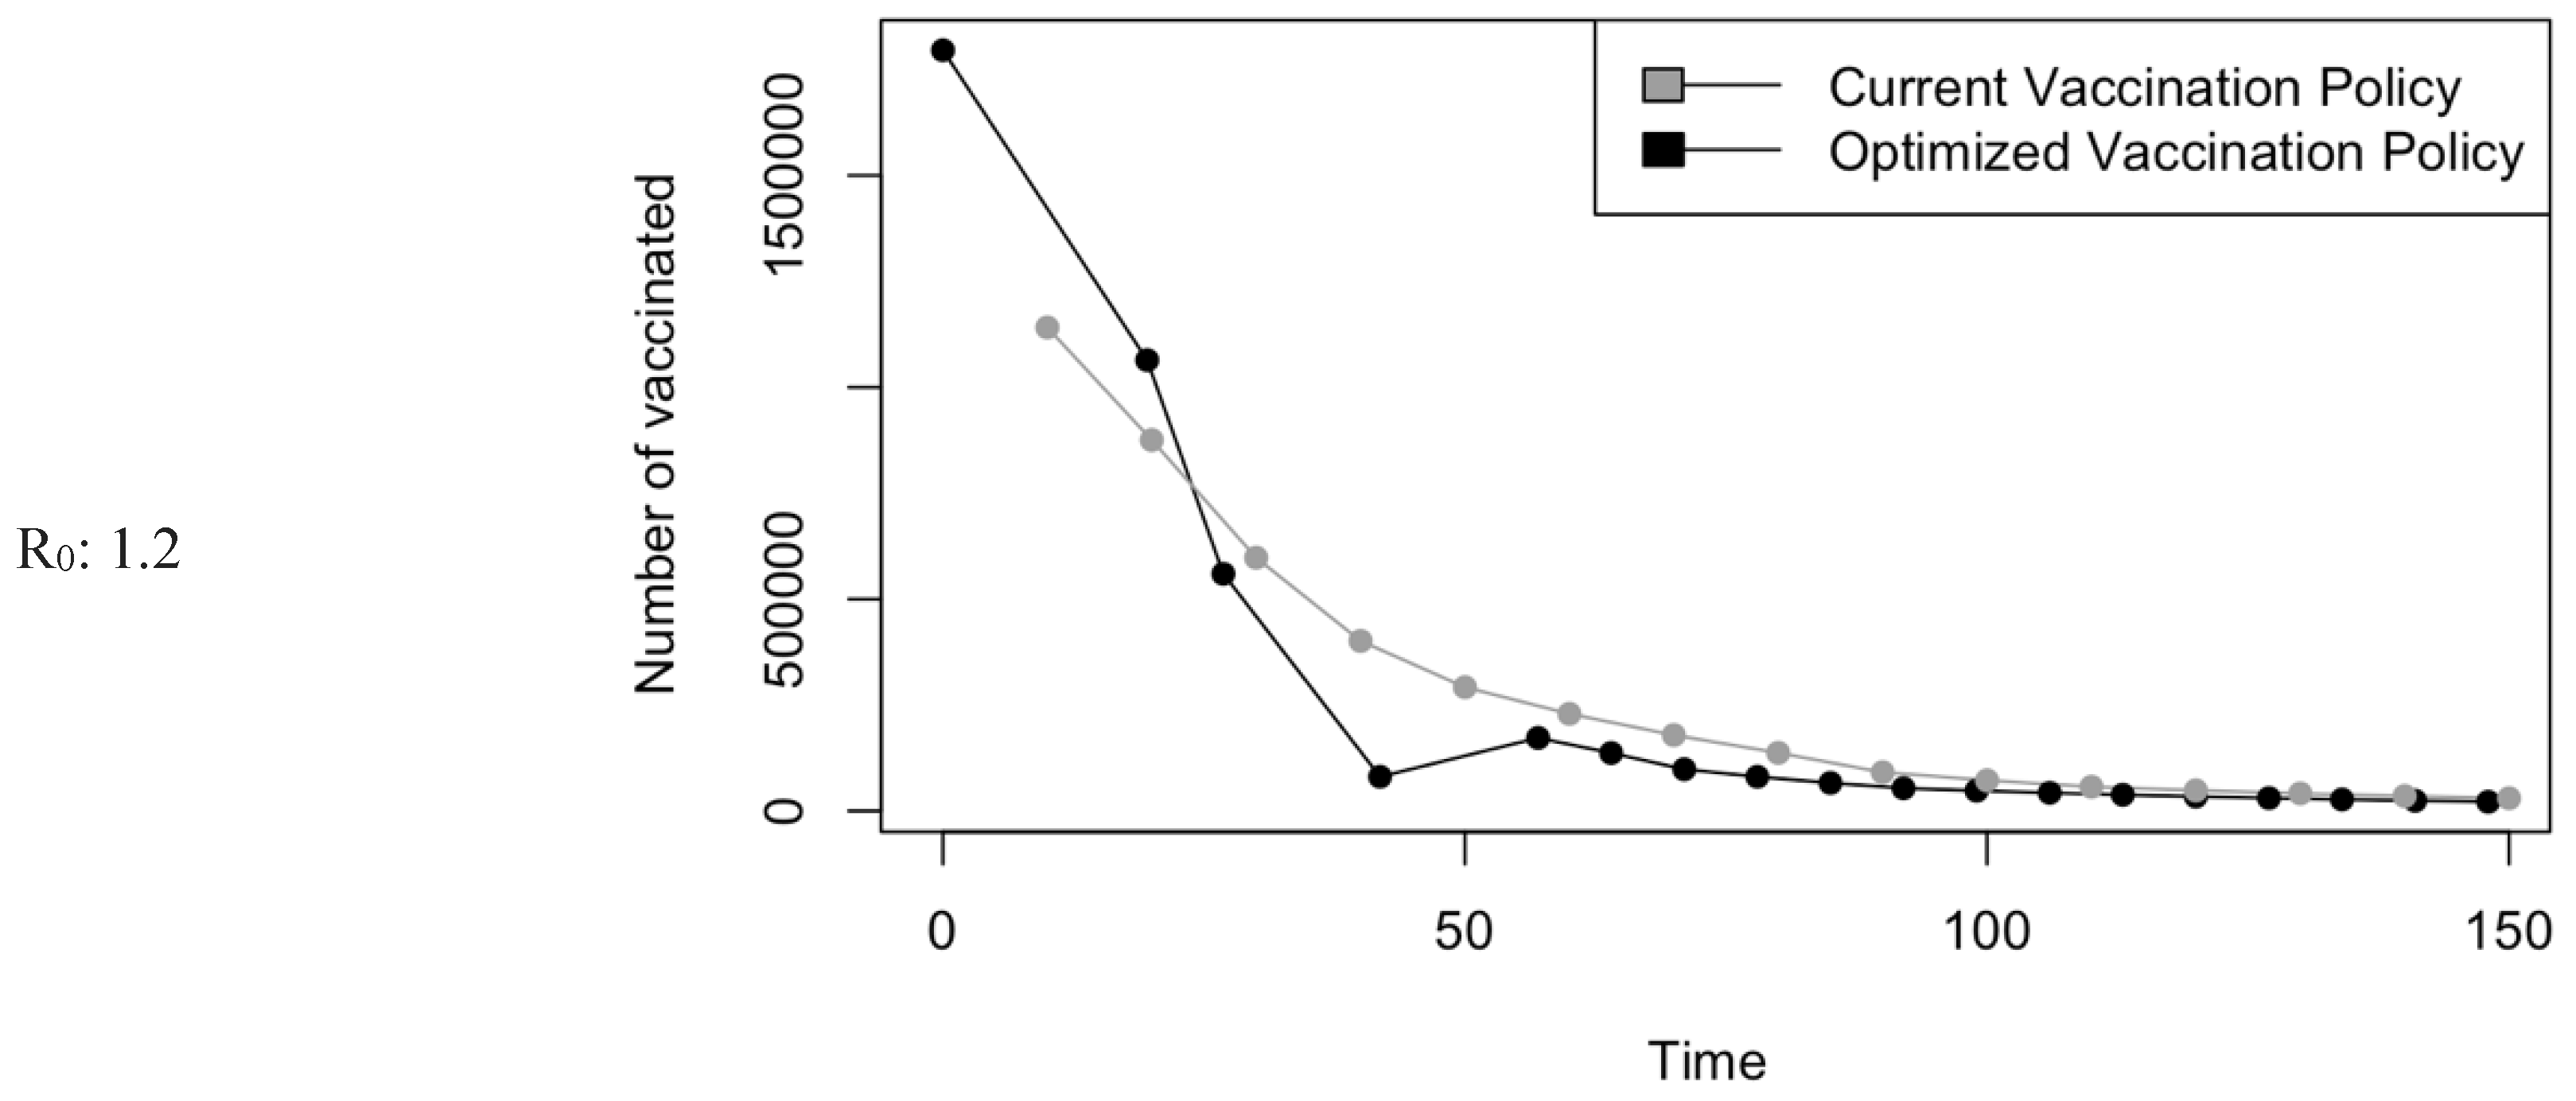
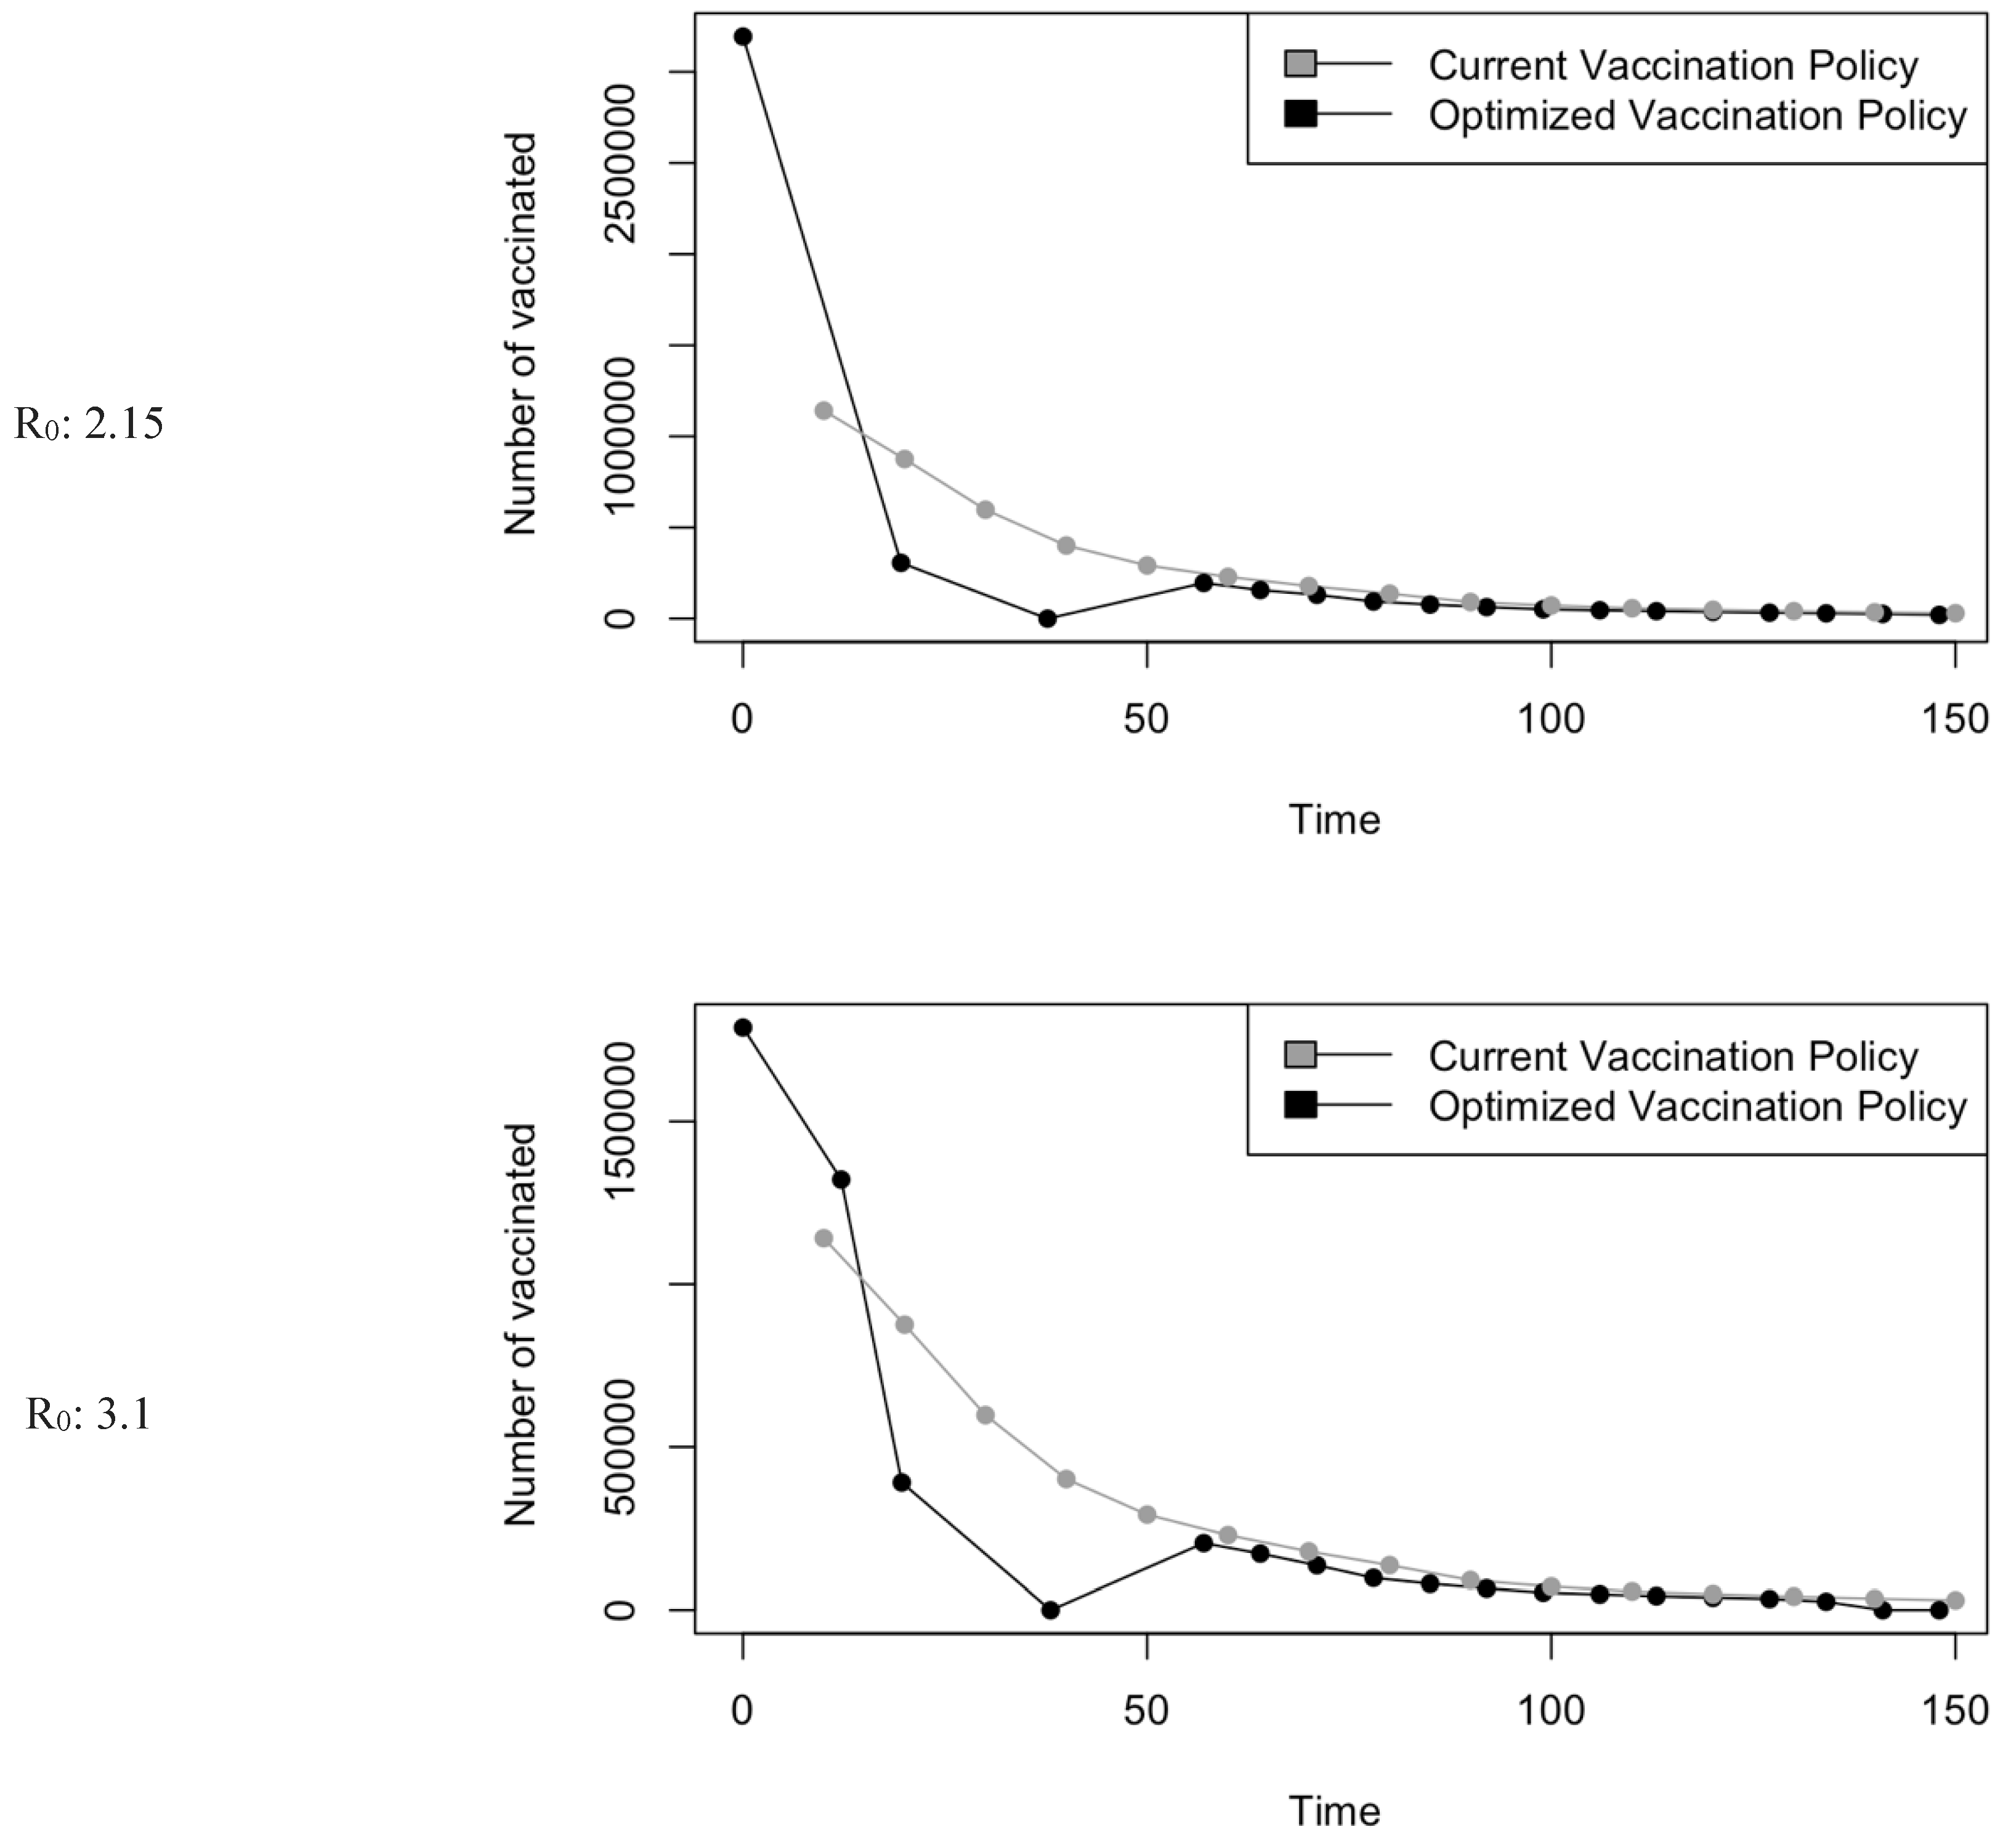
Figure 23.
Bar charts showing the number of (A) Infection (B) Hospitalizations, and (C) Mortality over a given period for R0: 1.2.
Figure 23.
Bar charts showing the number of (A) Infection (B) Hospitalizations, and (C) Mortality over a given period for R0: 1.2.
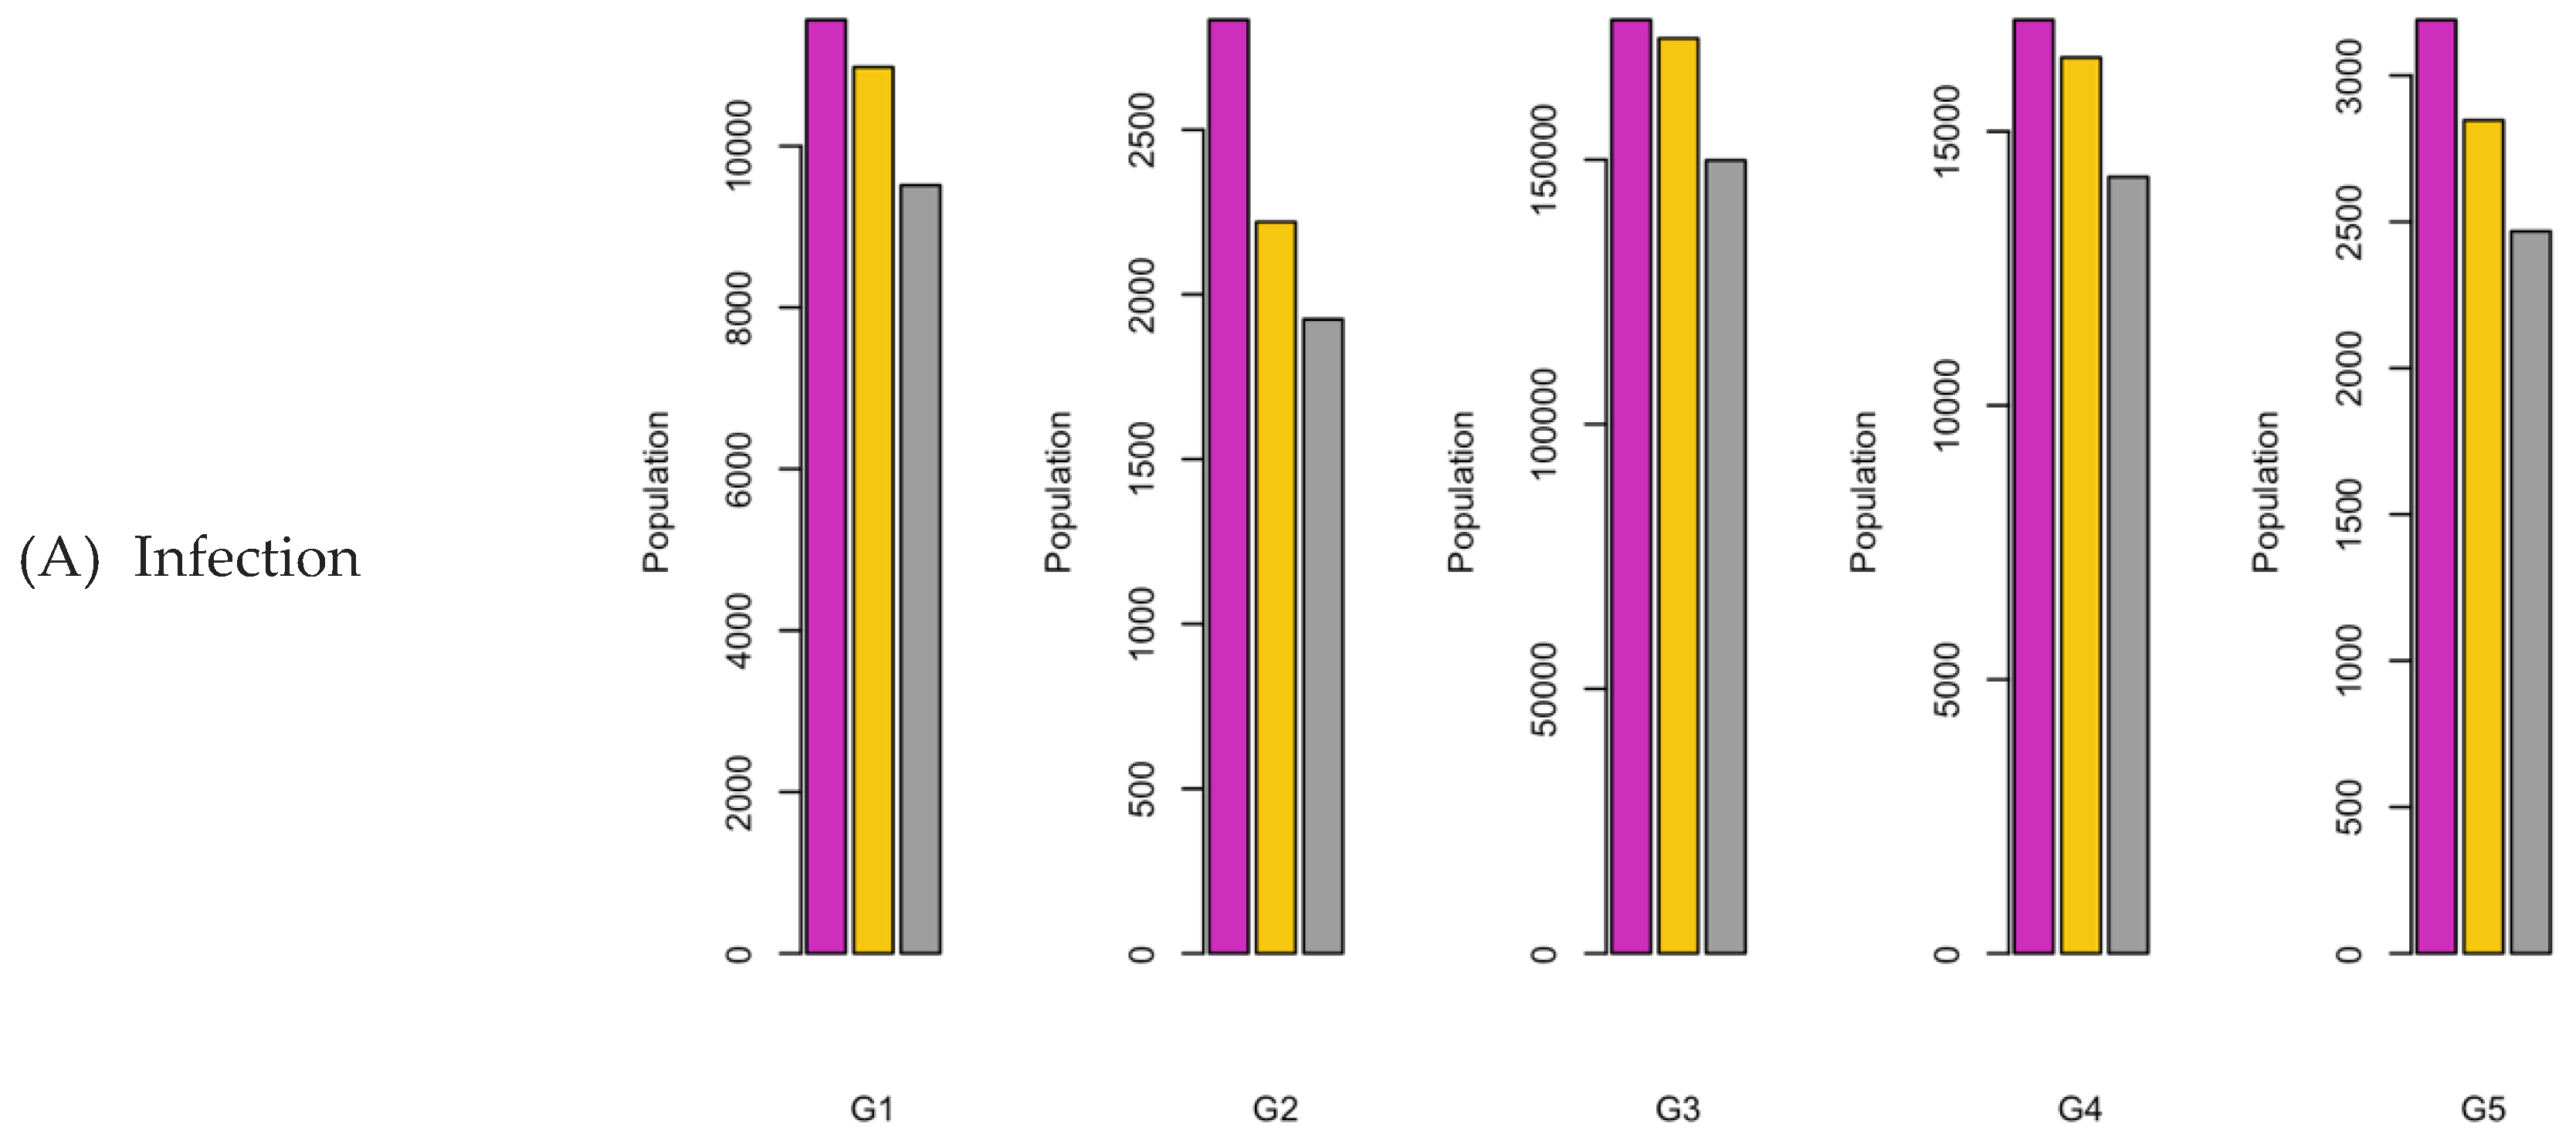
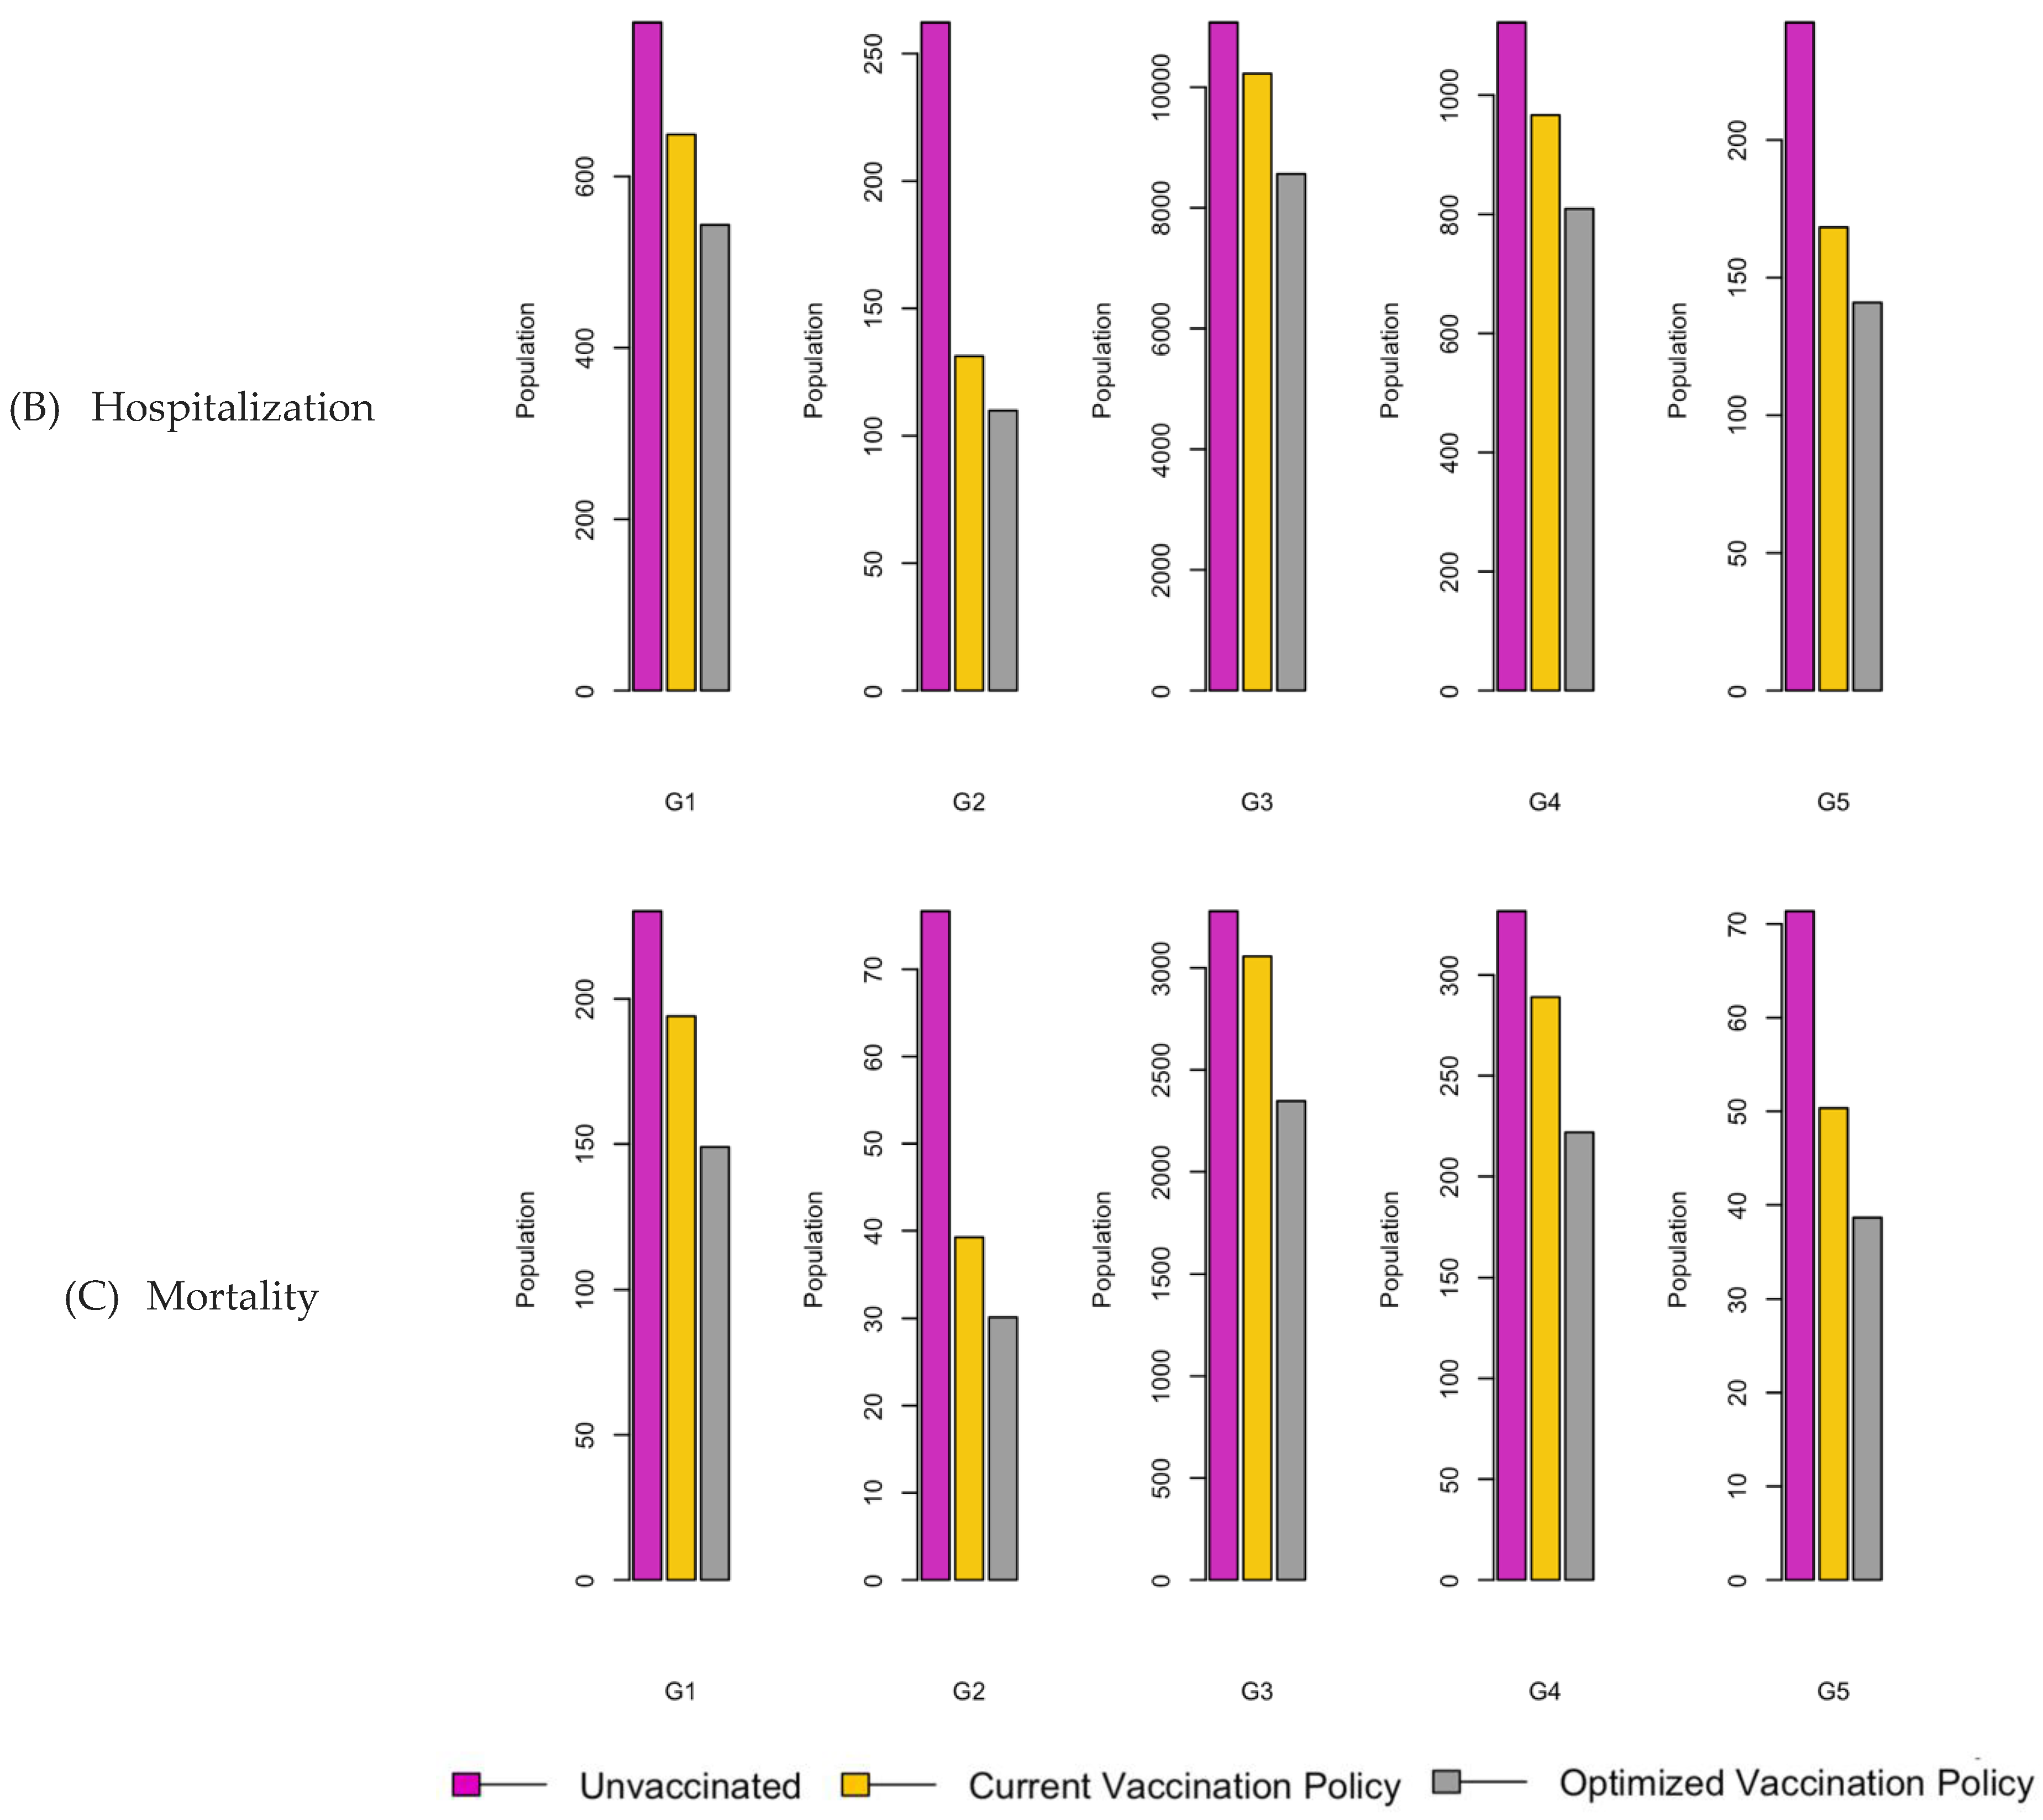
Figure 24.
Bar charts showing the number of (A) Infection (B) Hospitalizations, and (C) Mortality over a given period for R0: 2.15.
Figure 24.
Bar charts showing the number of (A) Infection (B) Hospitalizations, and (C) Mortality over a given period for R0: 2.15.
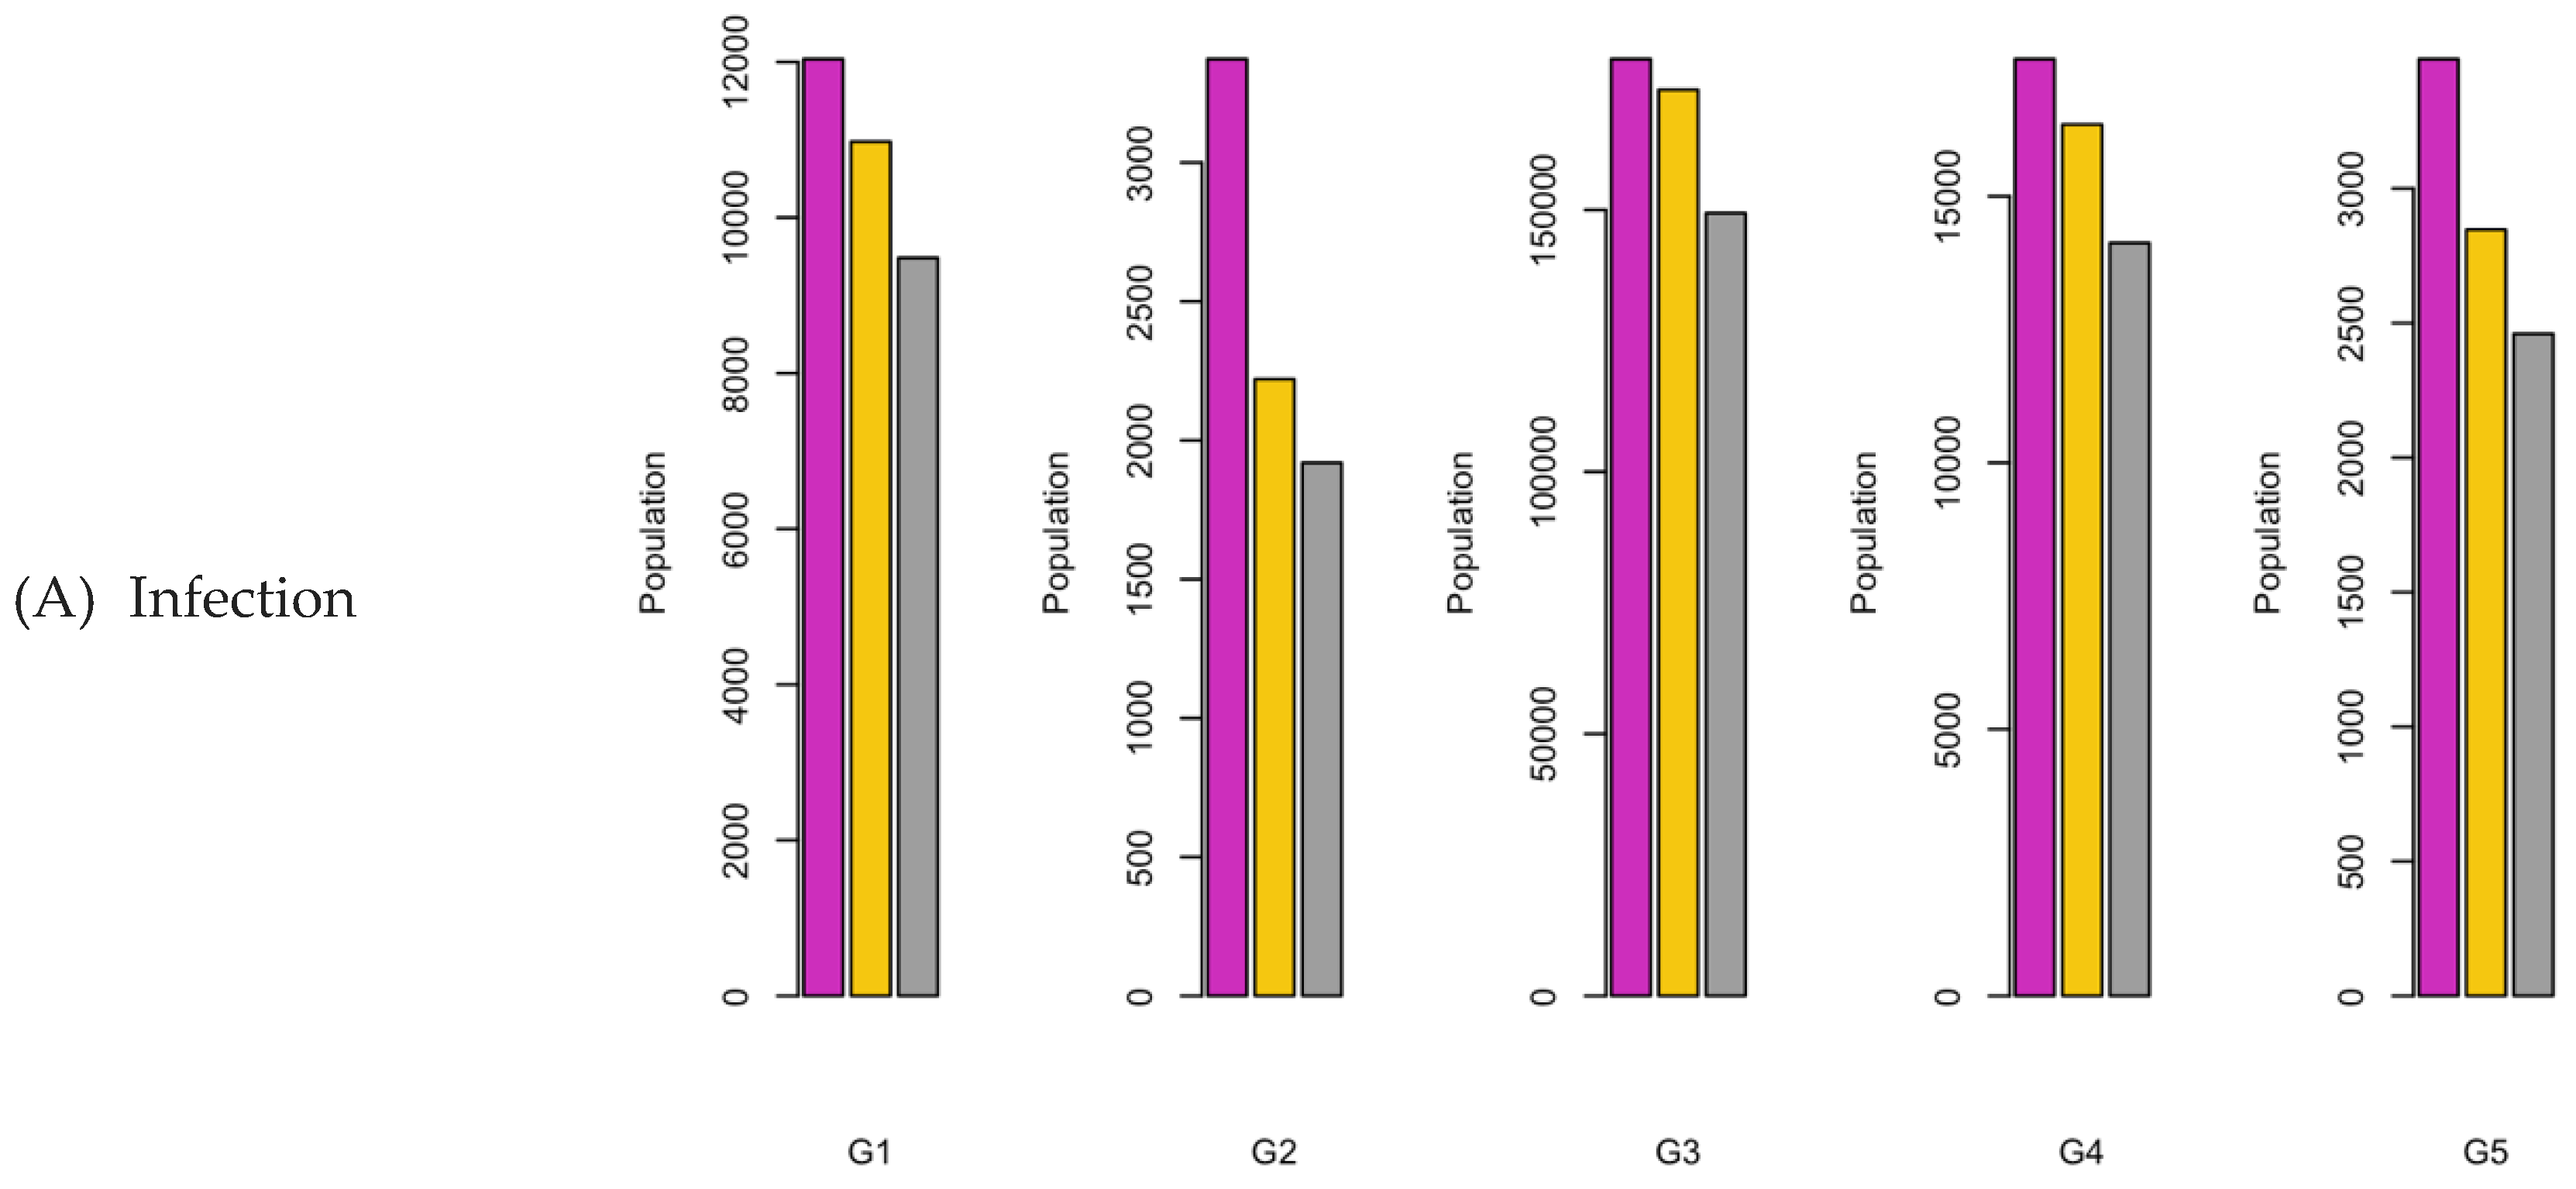
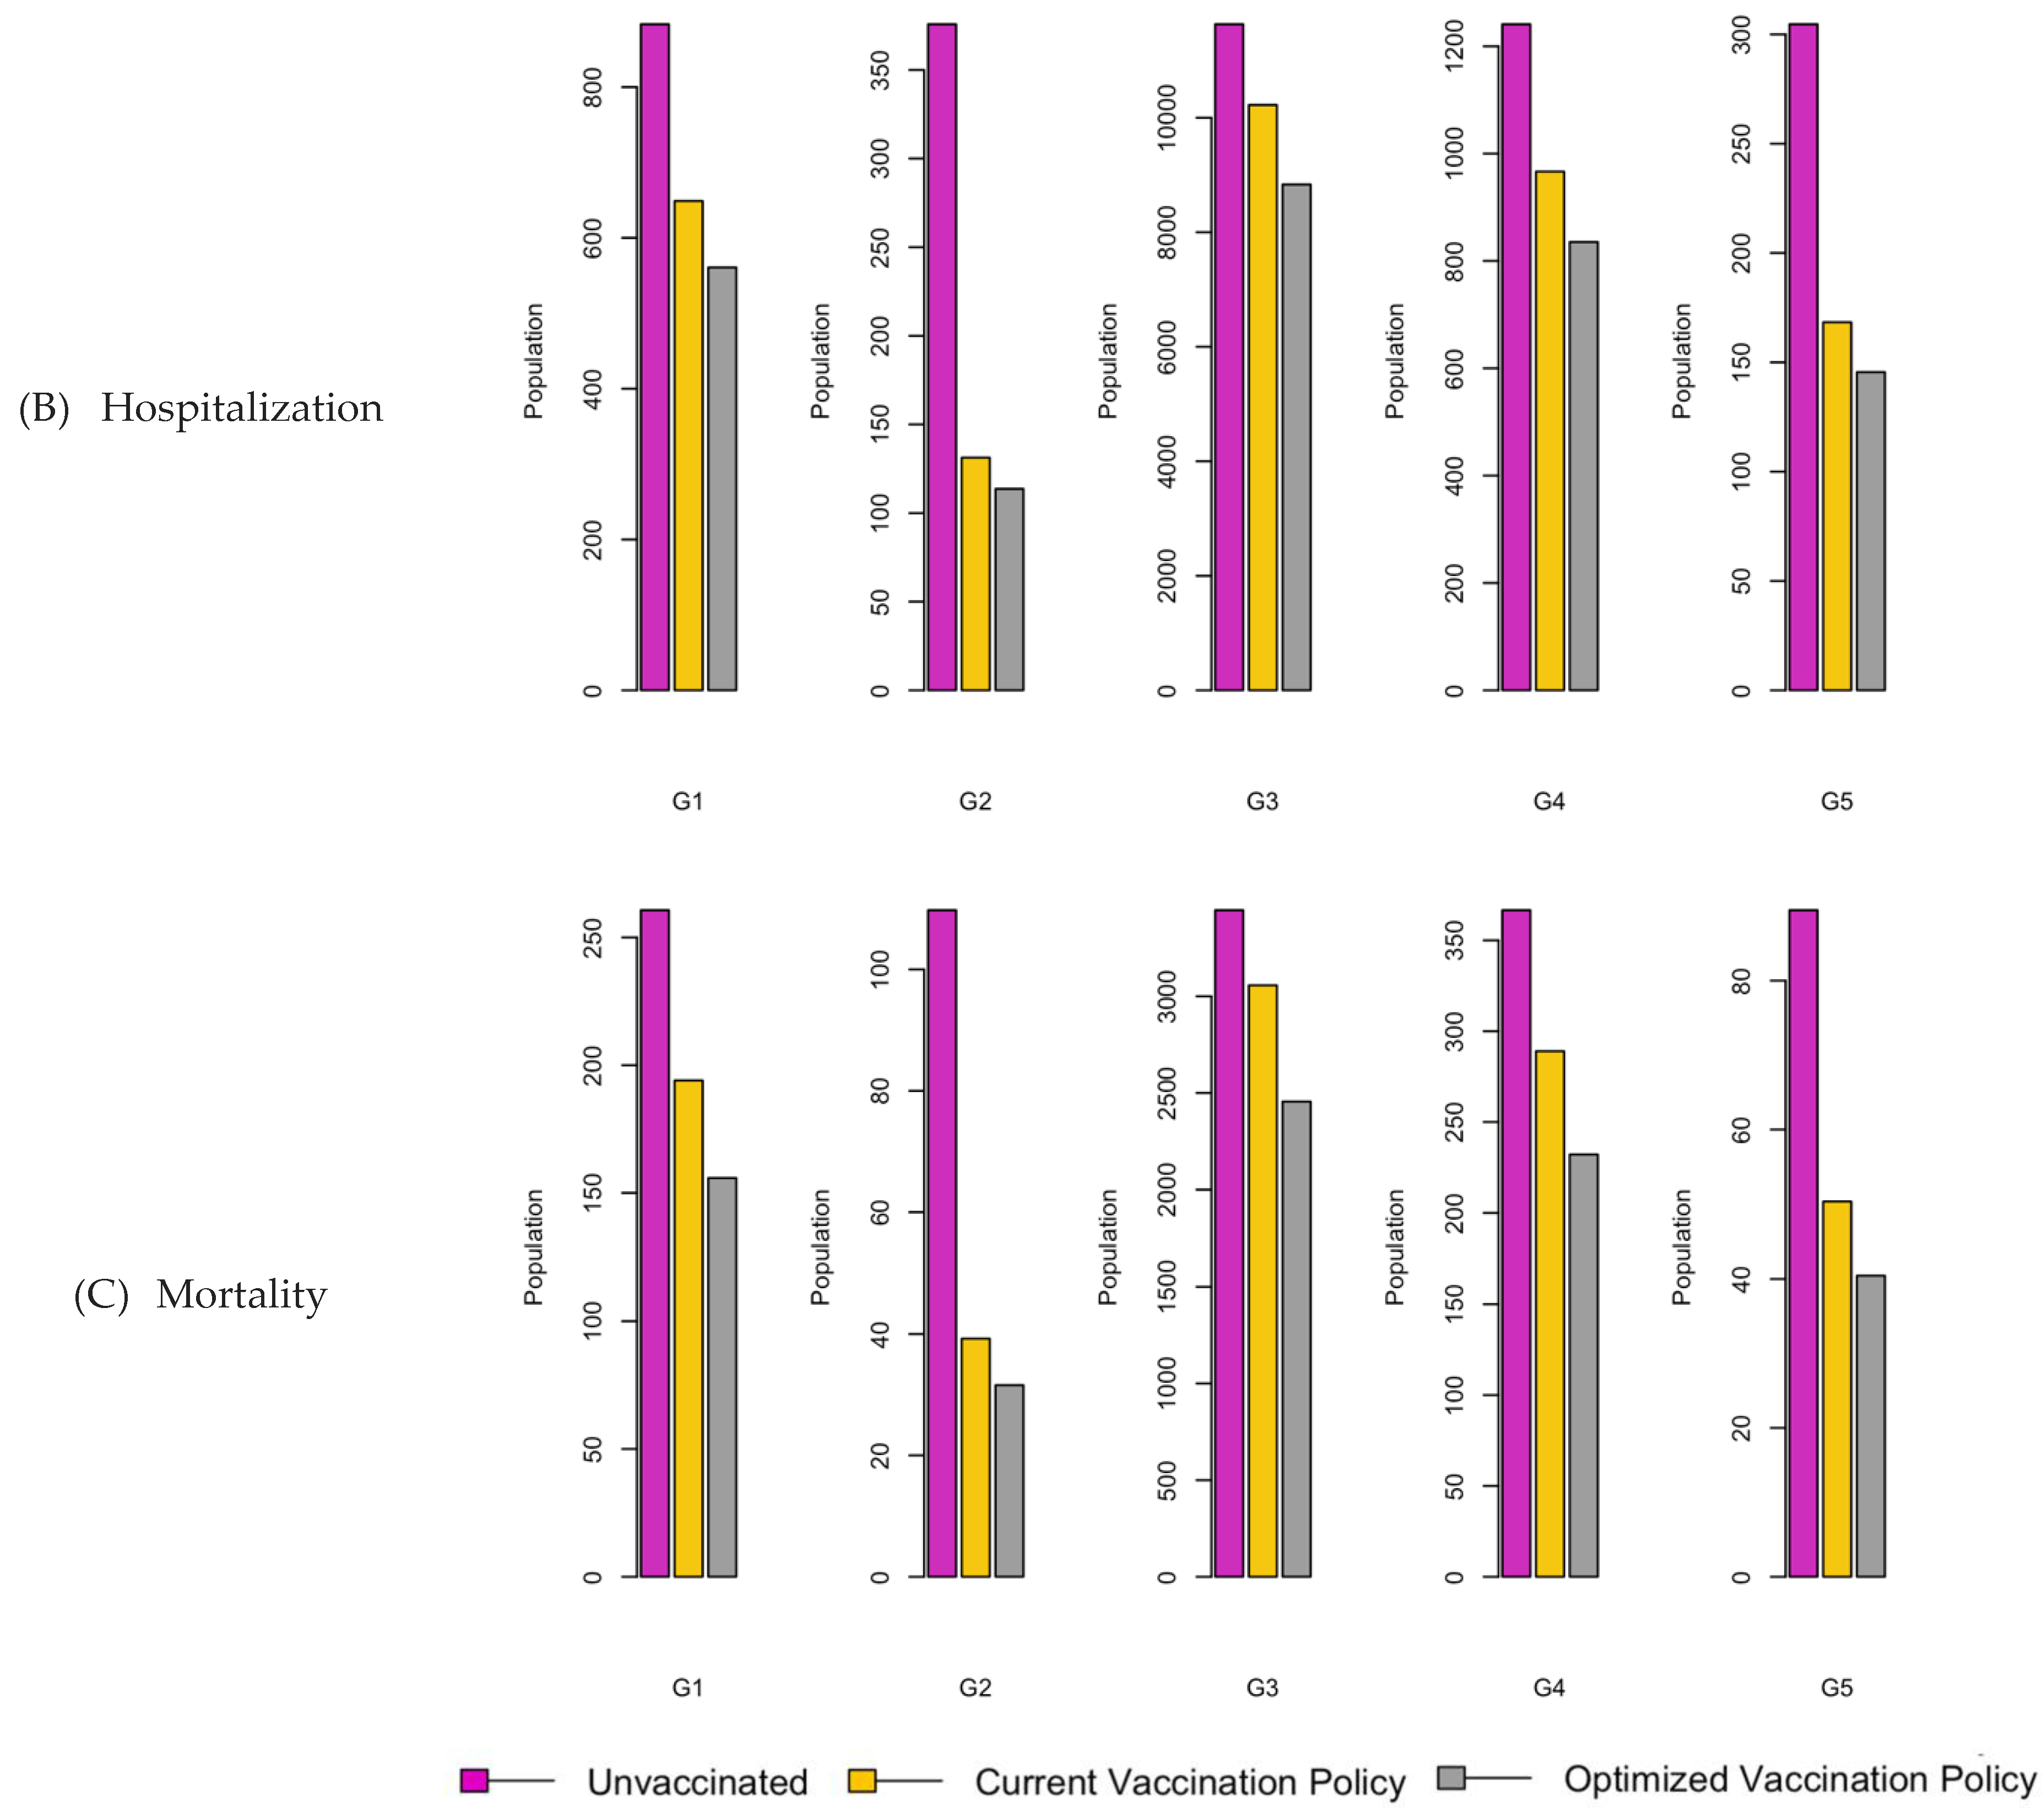
Figure 25.
Bar charts showing the number of (A) Infection (B) Hospitalizations, and (C) Mortality over a given period for R0: 3.1.
Figure 25.
Bar charts showing the number of (A) Infection (B) Hospitalizations, and (C) Mortality over a given period for R0: 3.1.
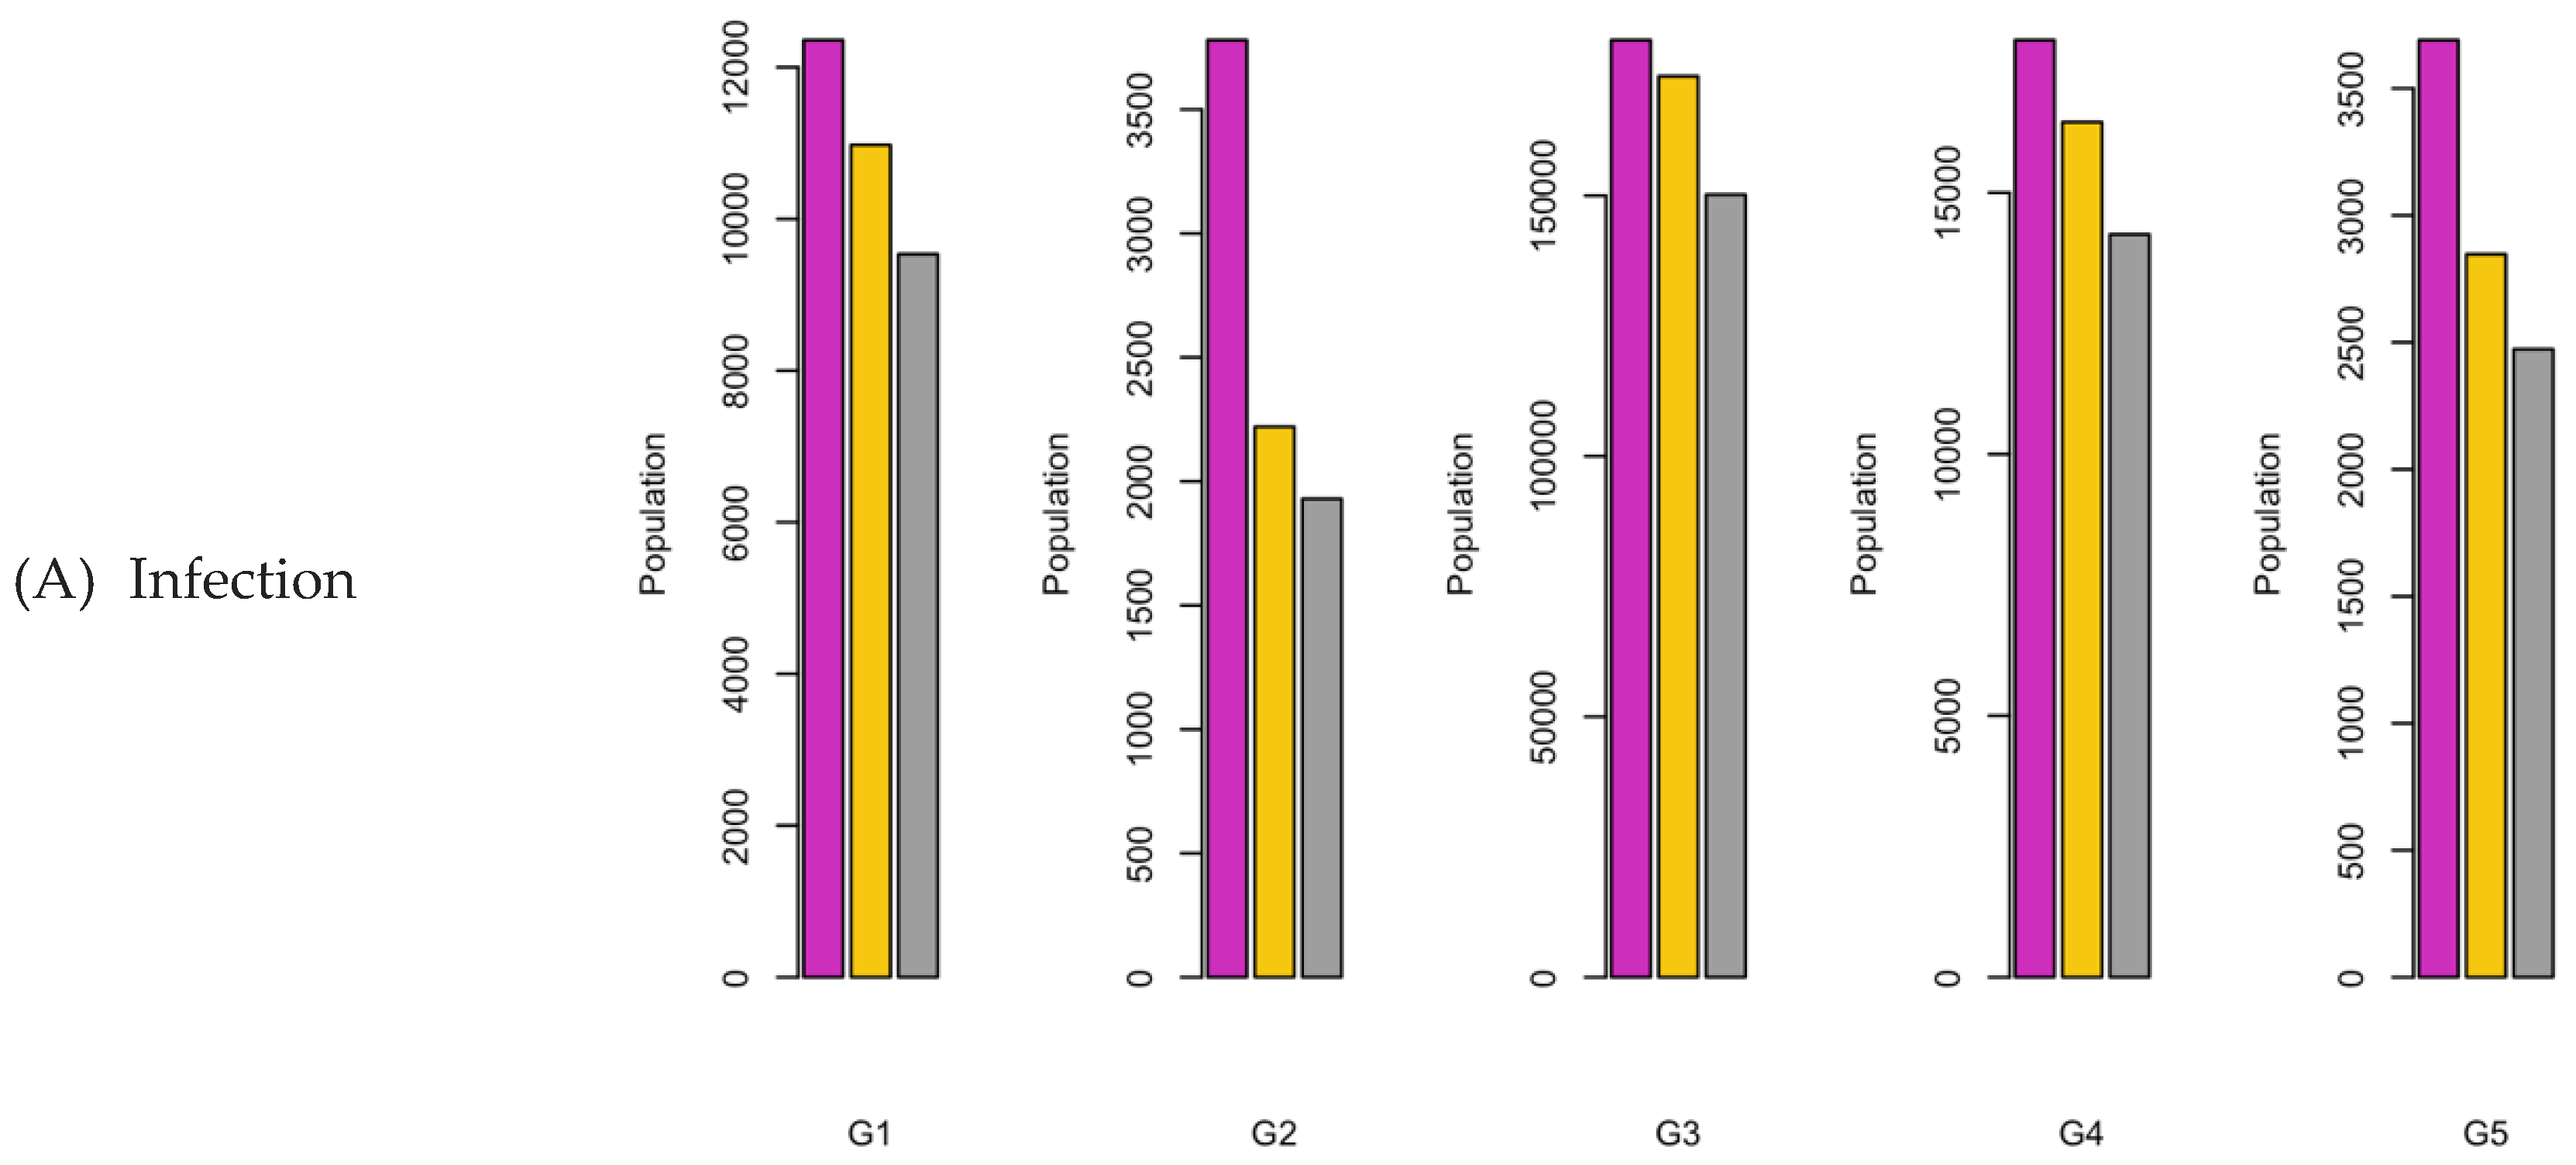
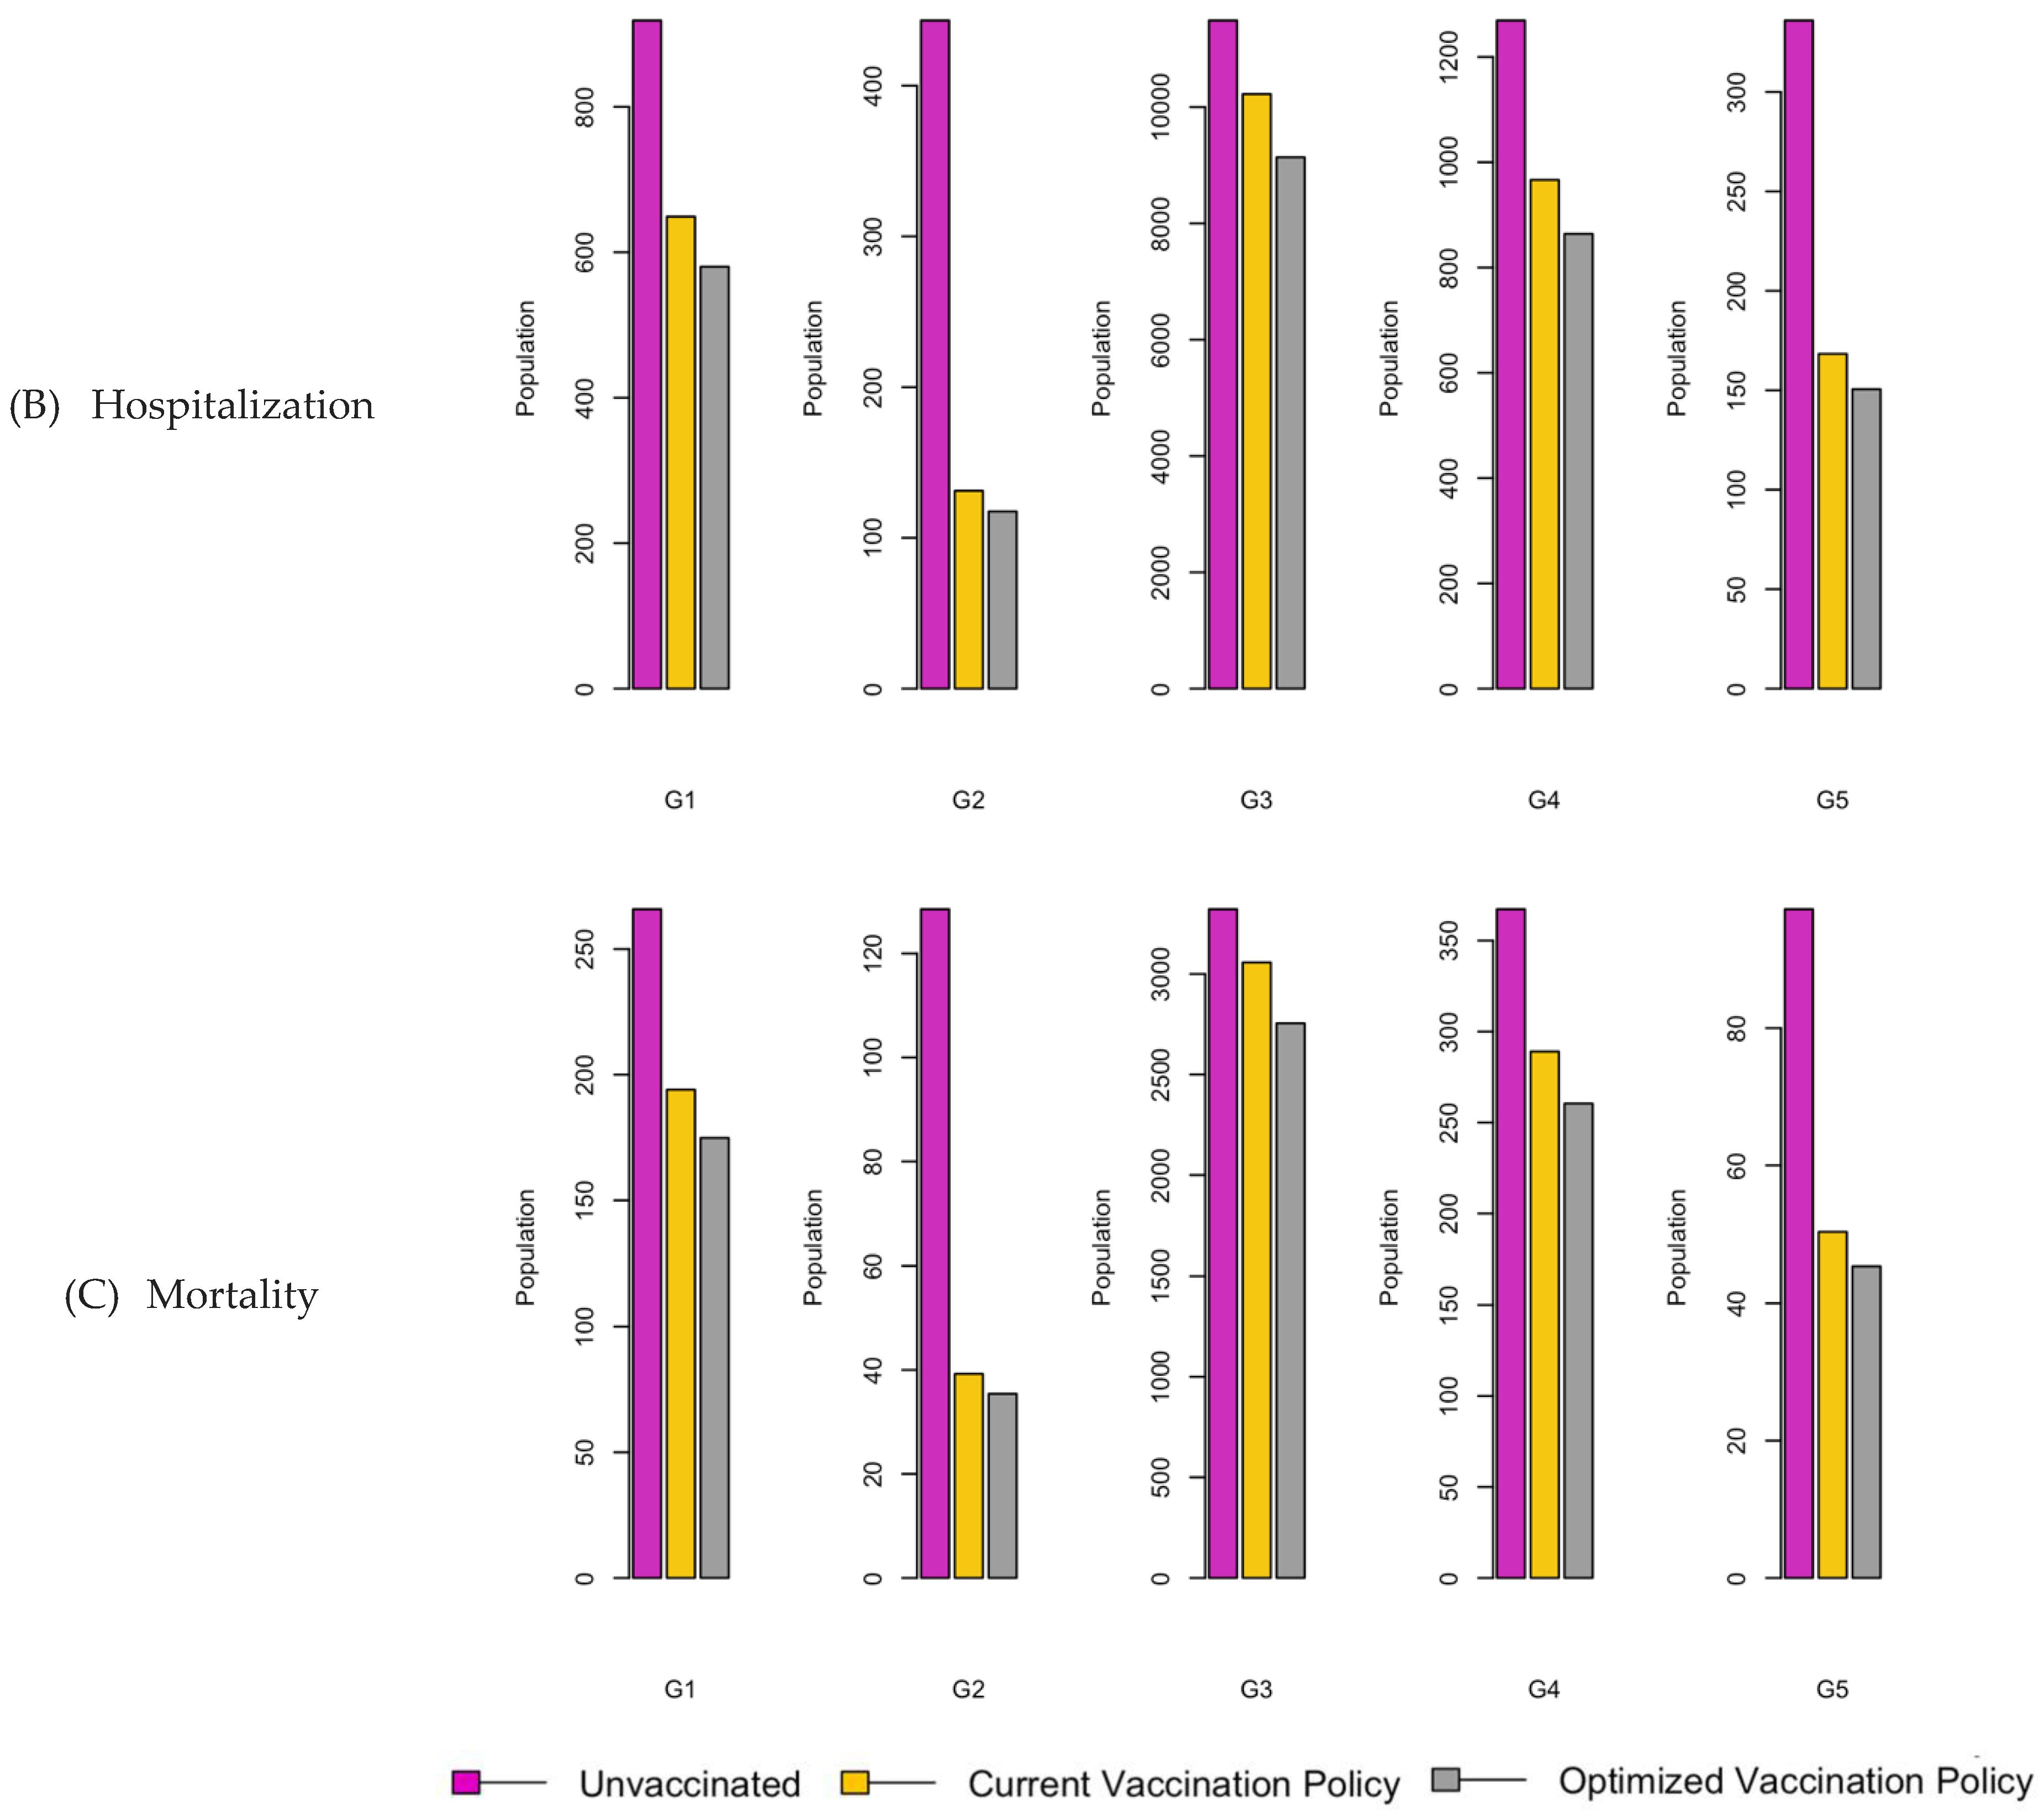
Figure 26.
Vaccination Strategy for the Case of Southern region.
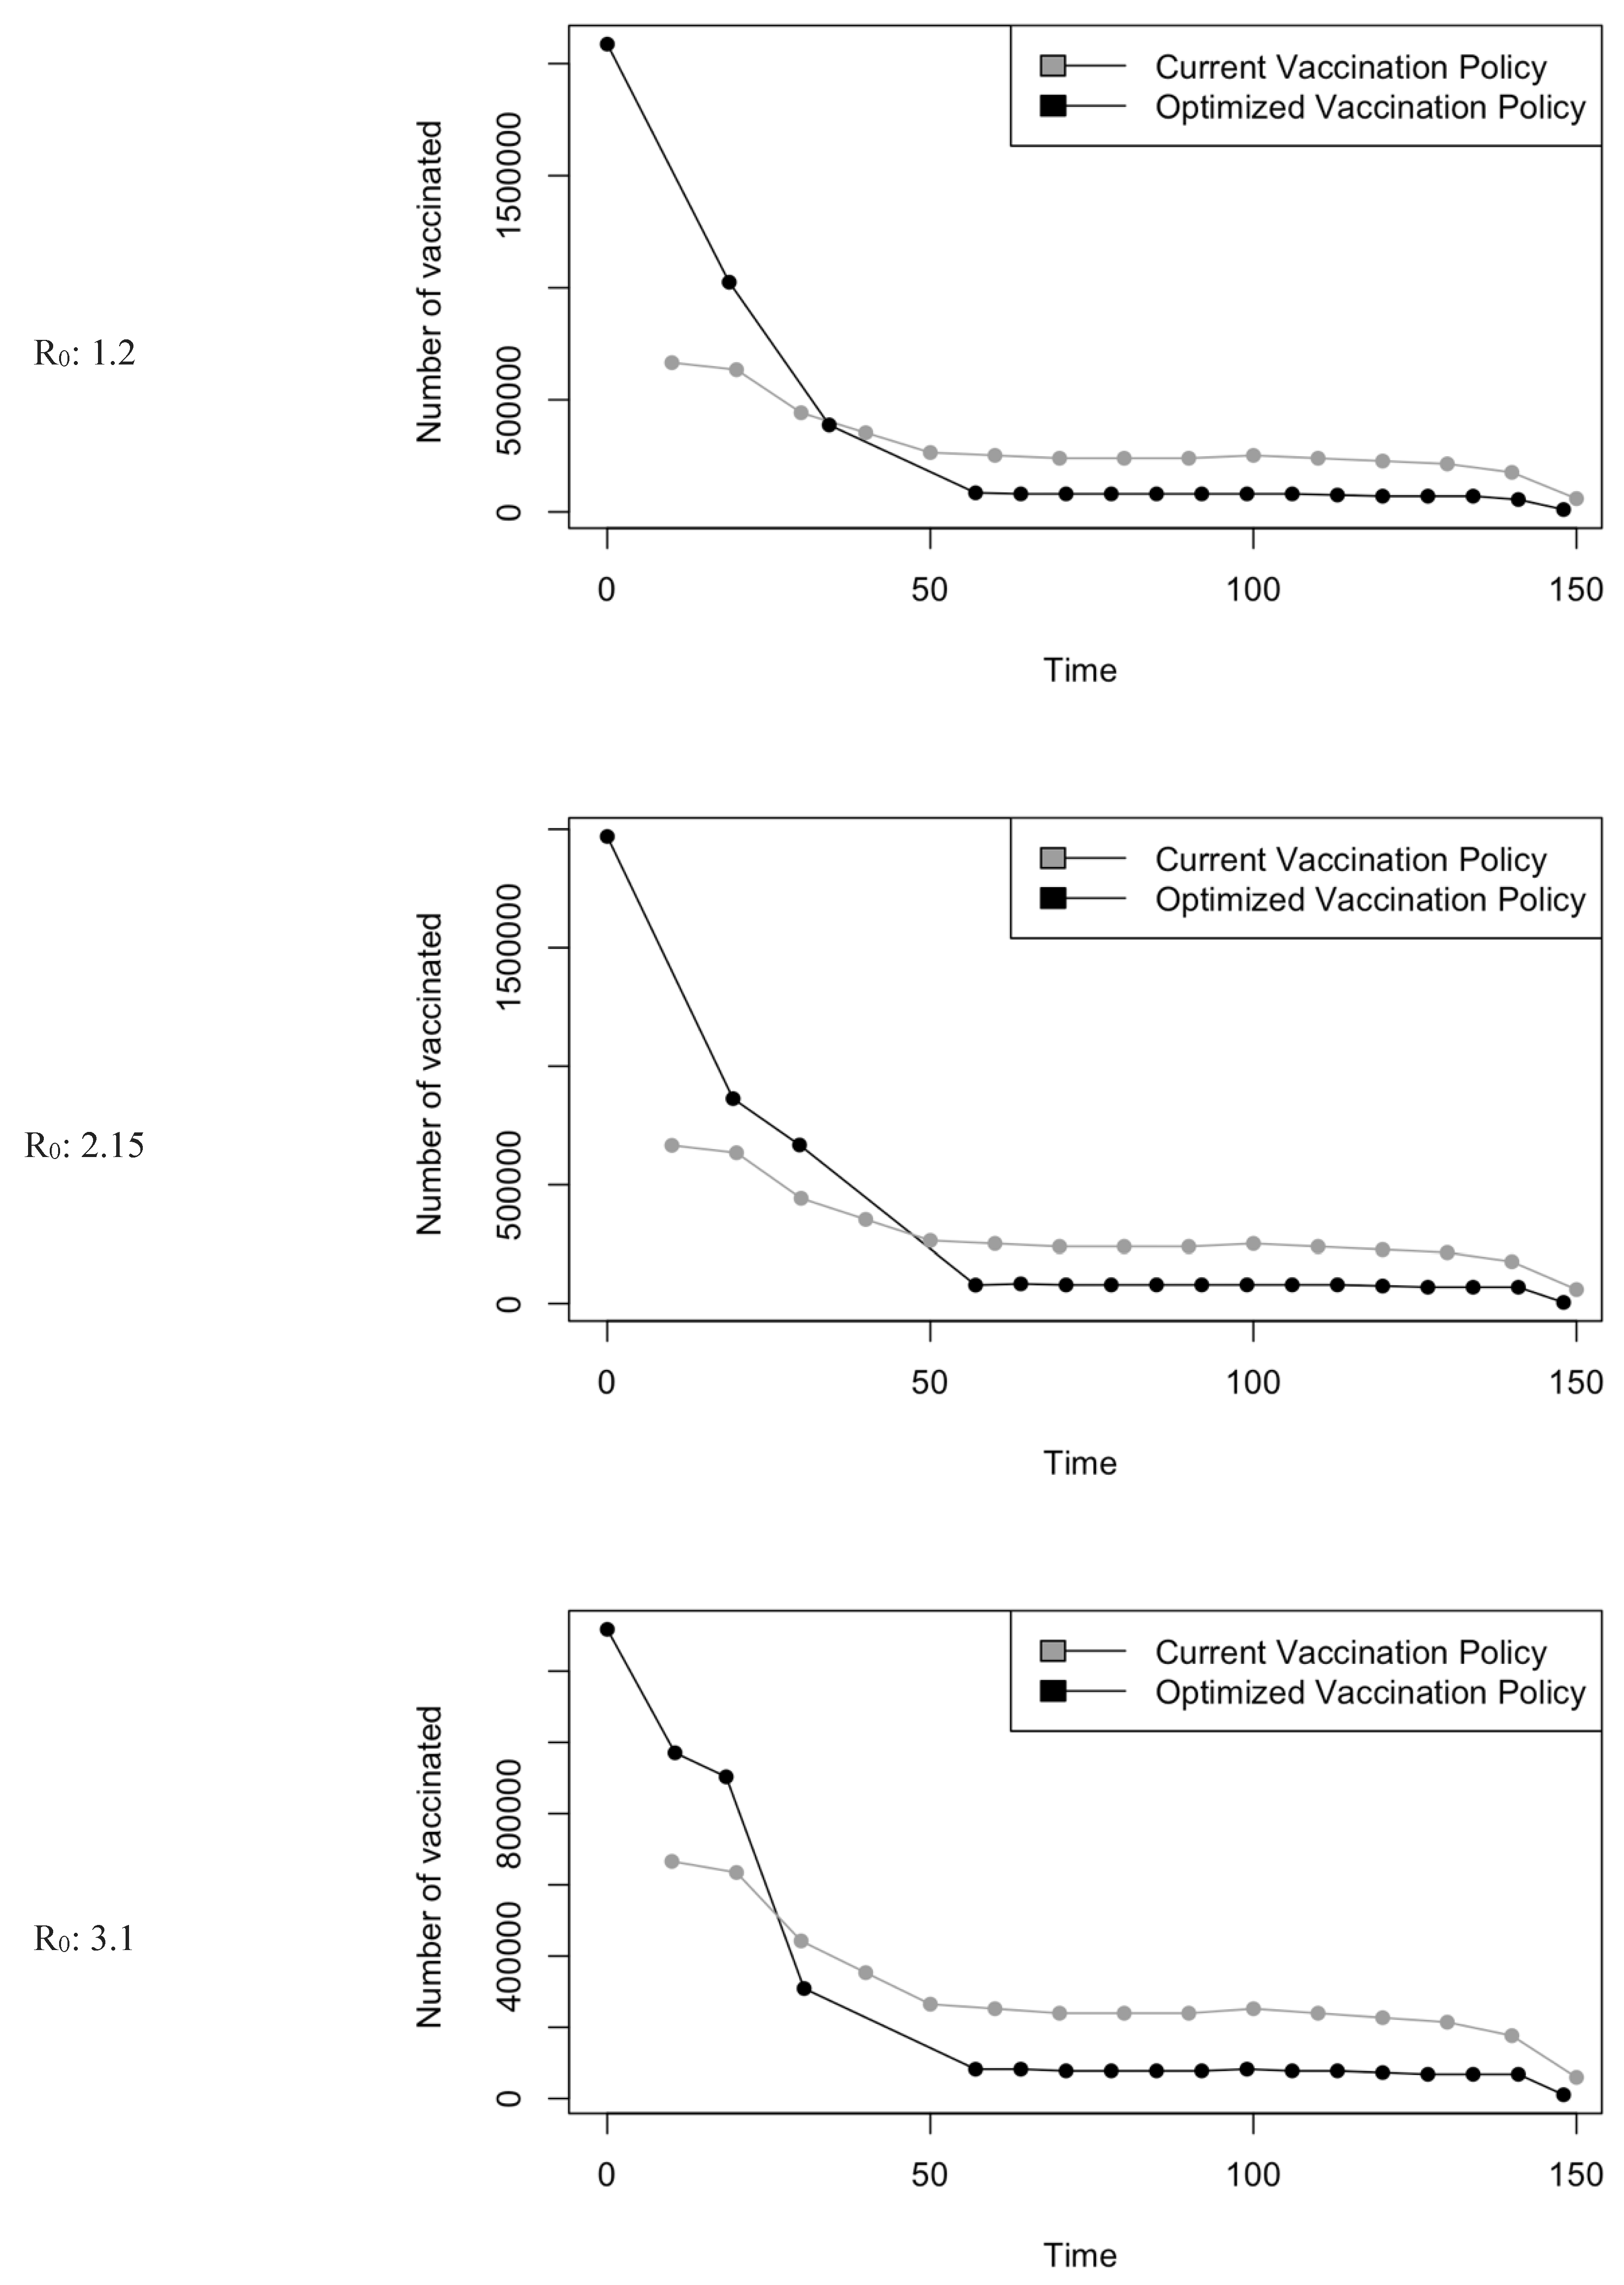
Figure 27.
Bar charts showing the number of (A) Infection (B) Hospitalizations, and (C) Mortality over a given period for R0: 1.2.
Figure 27.
Bar charts showing the number of (A) Infection (B) Hospitalizations, and (C) Mortality over a given period for R0: 1.2.
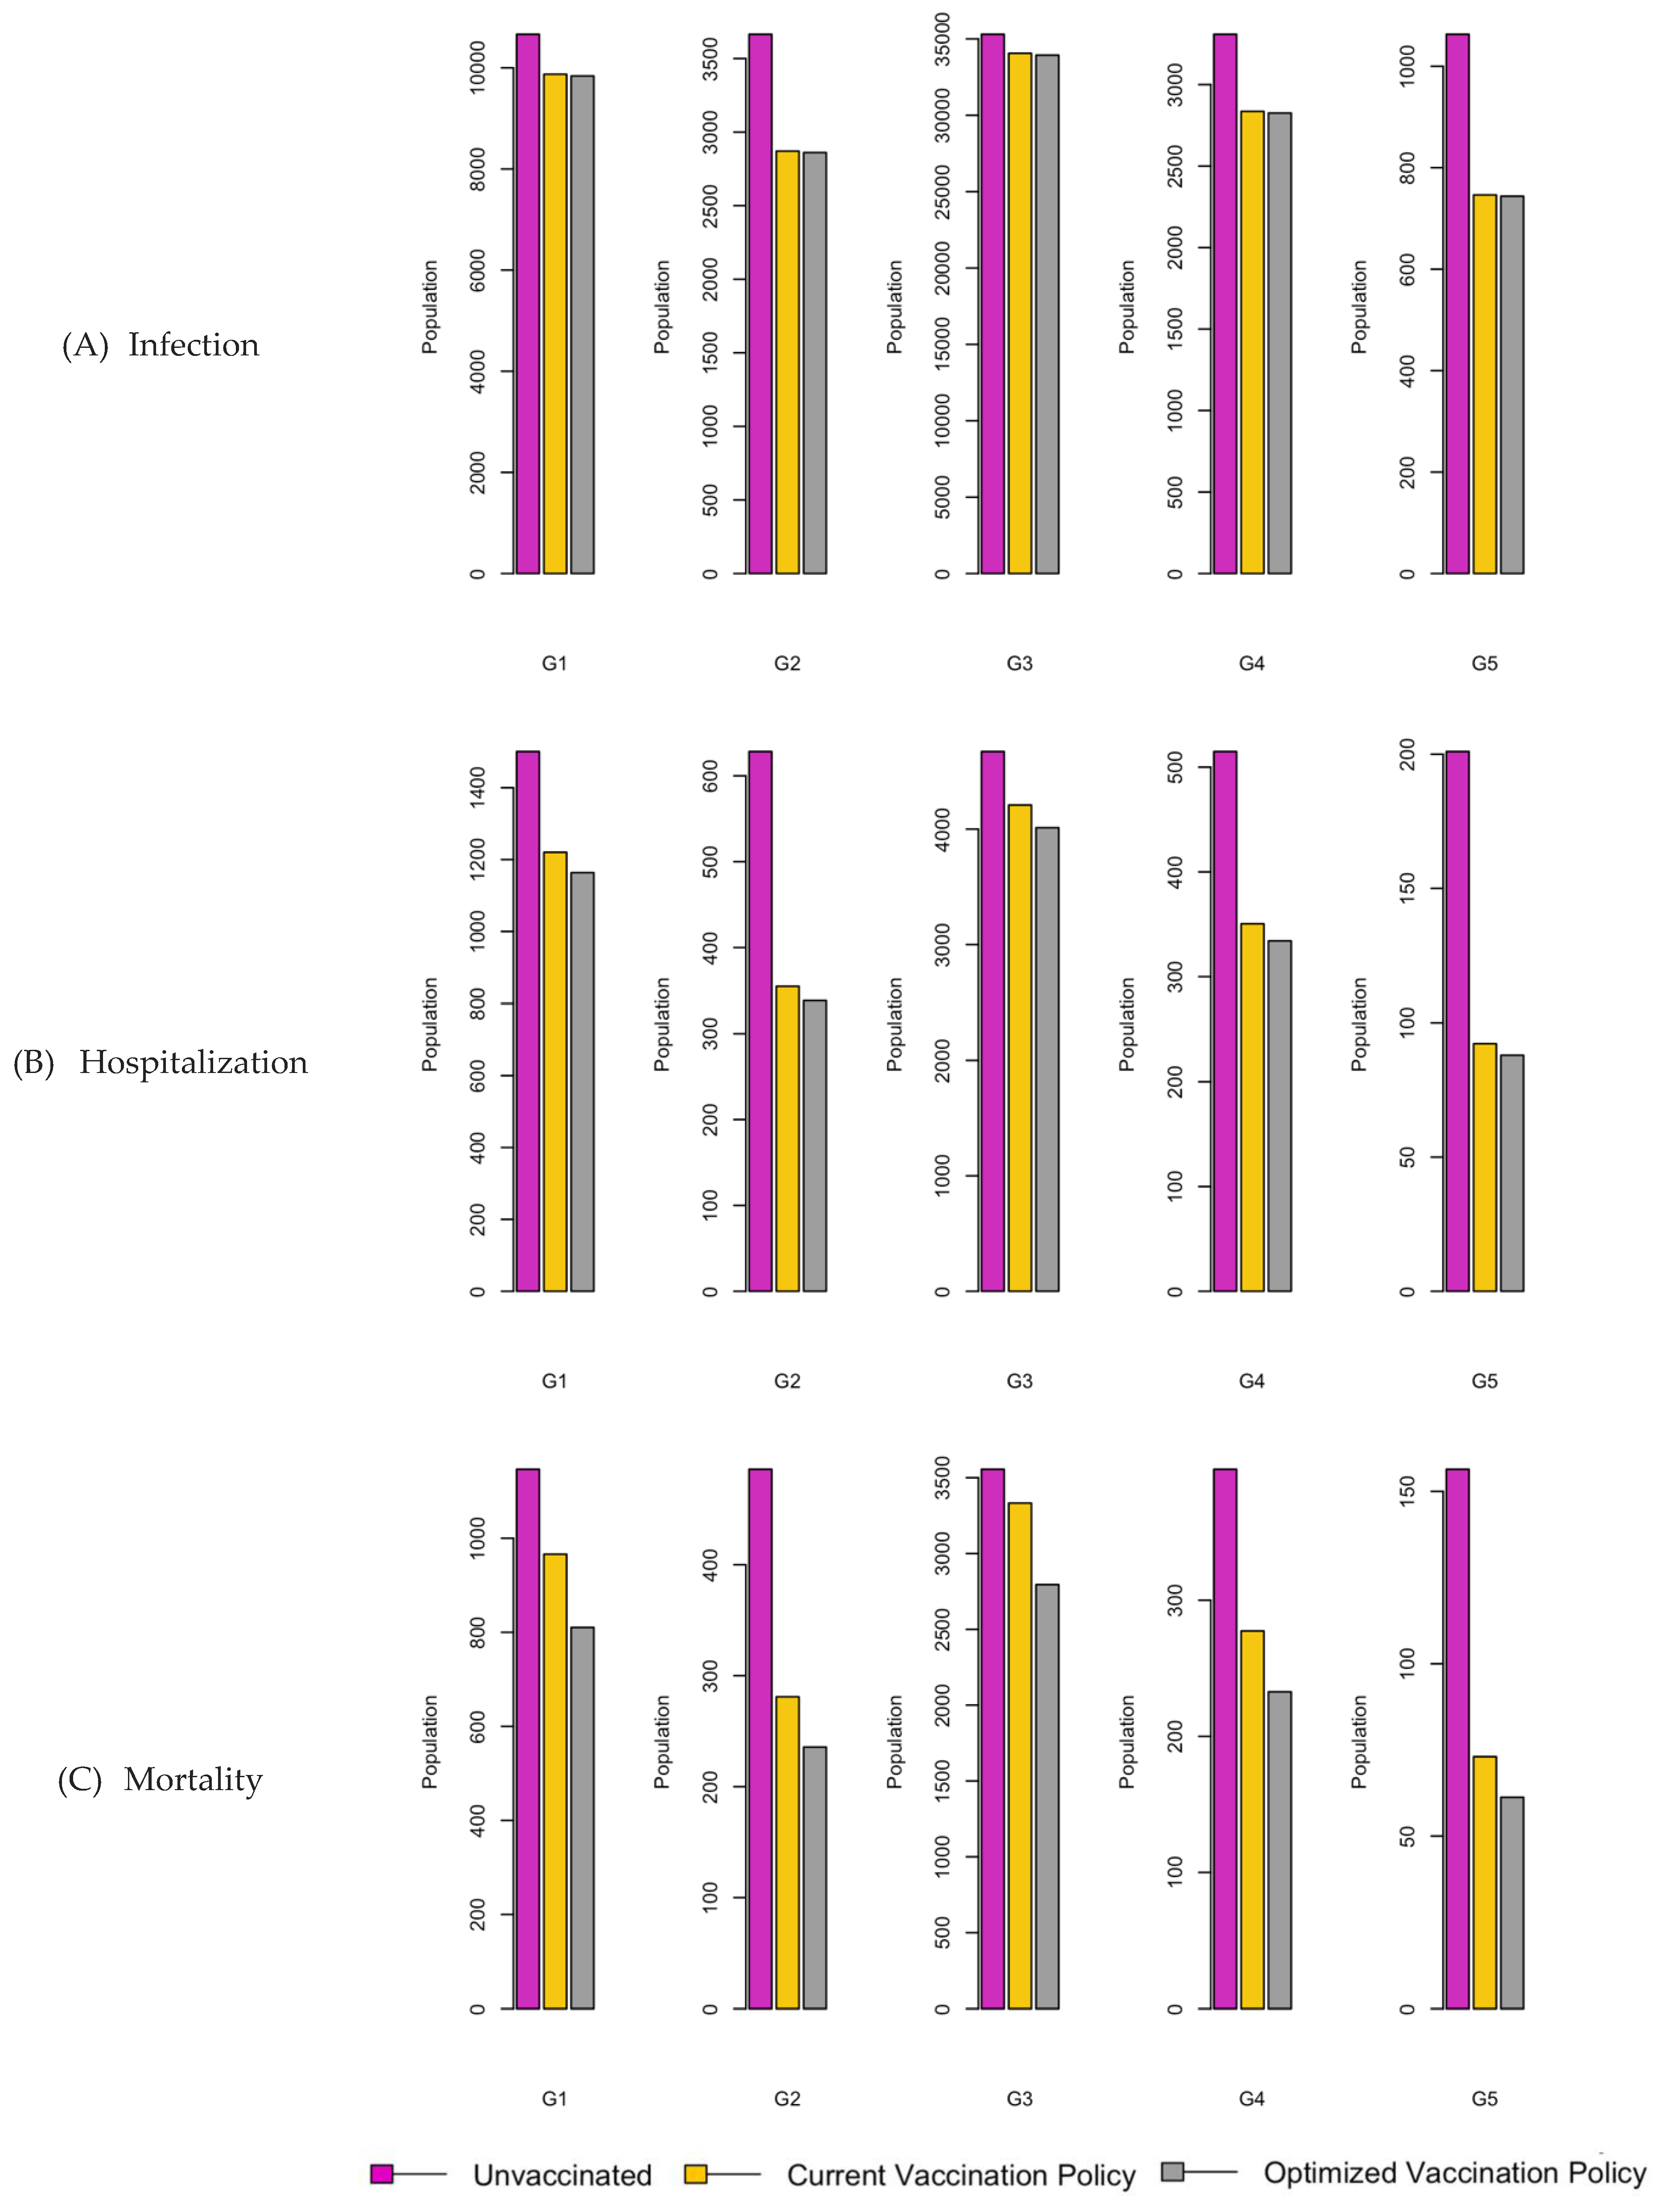
Figure 28.
Bar charts showing the number of (A) Infection (B) Hospitalizations, and (C) Mortality over a given period for R0: 2.15.
Figure 28.
Bar charts showing the number of (A) Infection (B) Hospitalizations, and (C) Mortality over a given period for R0: 2.15.
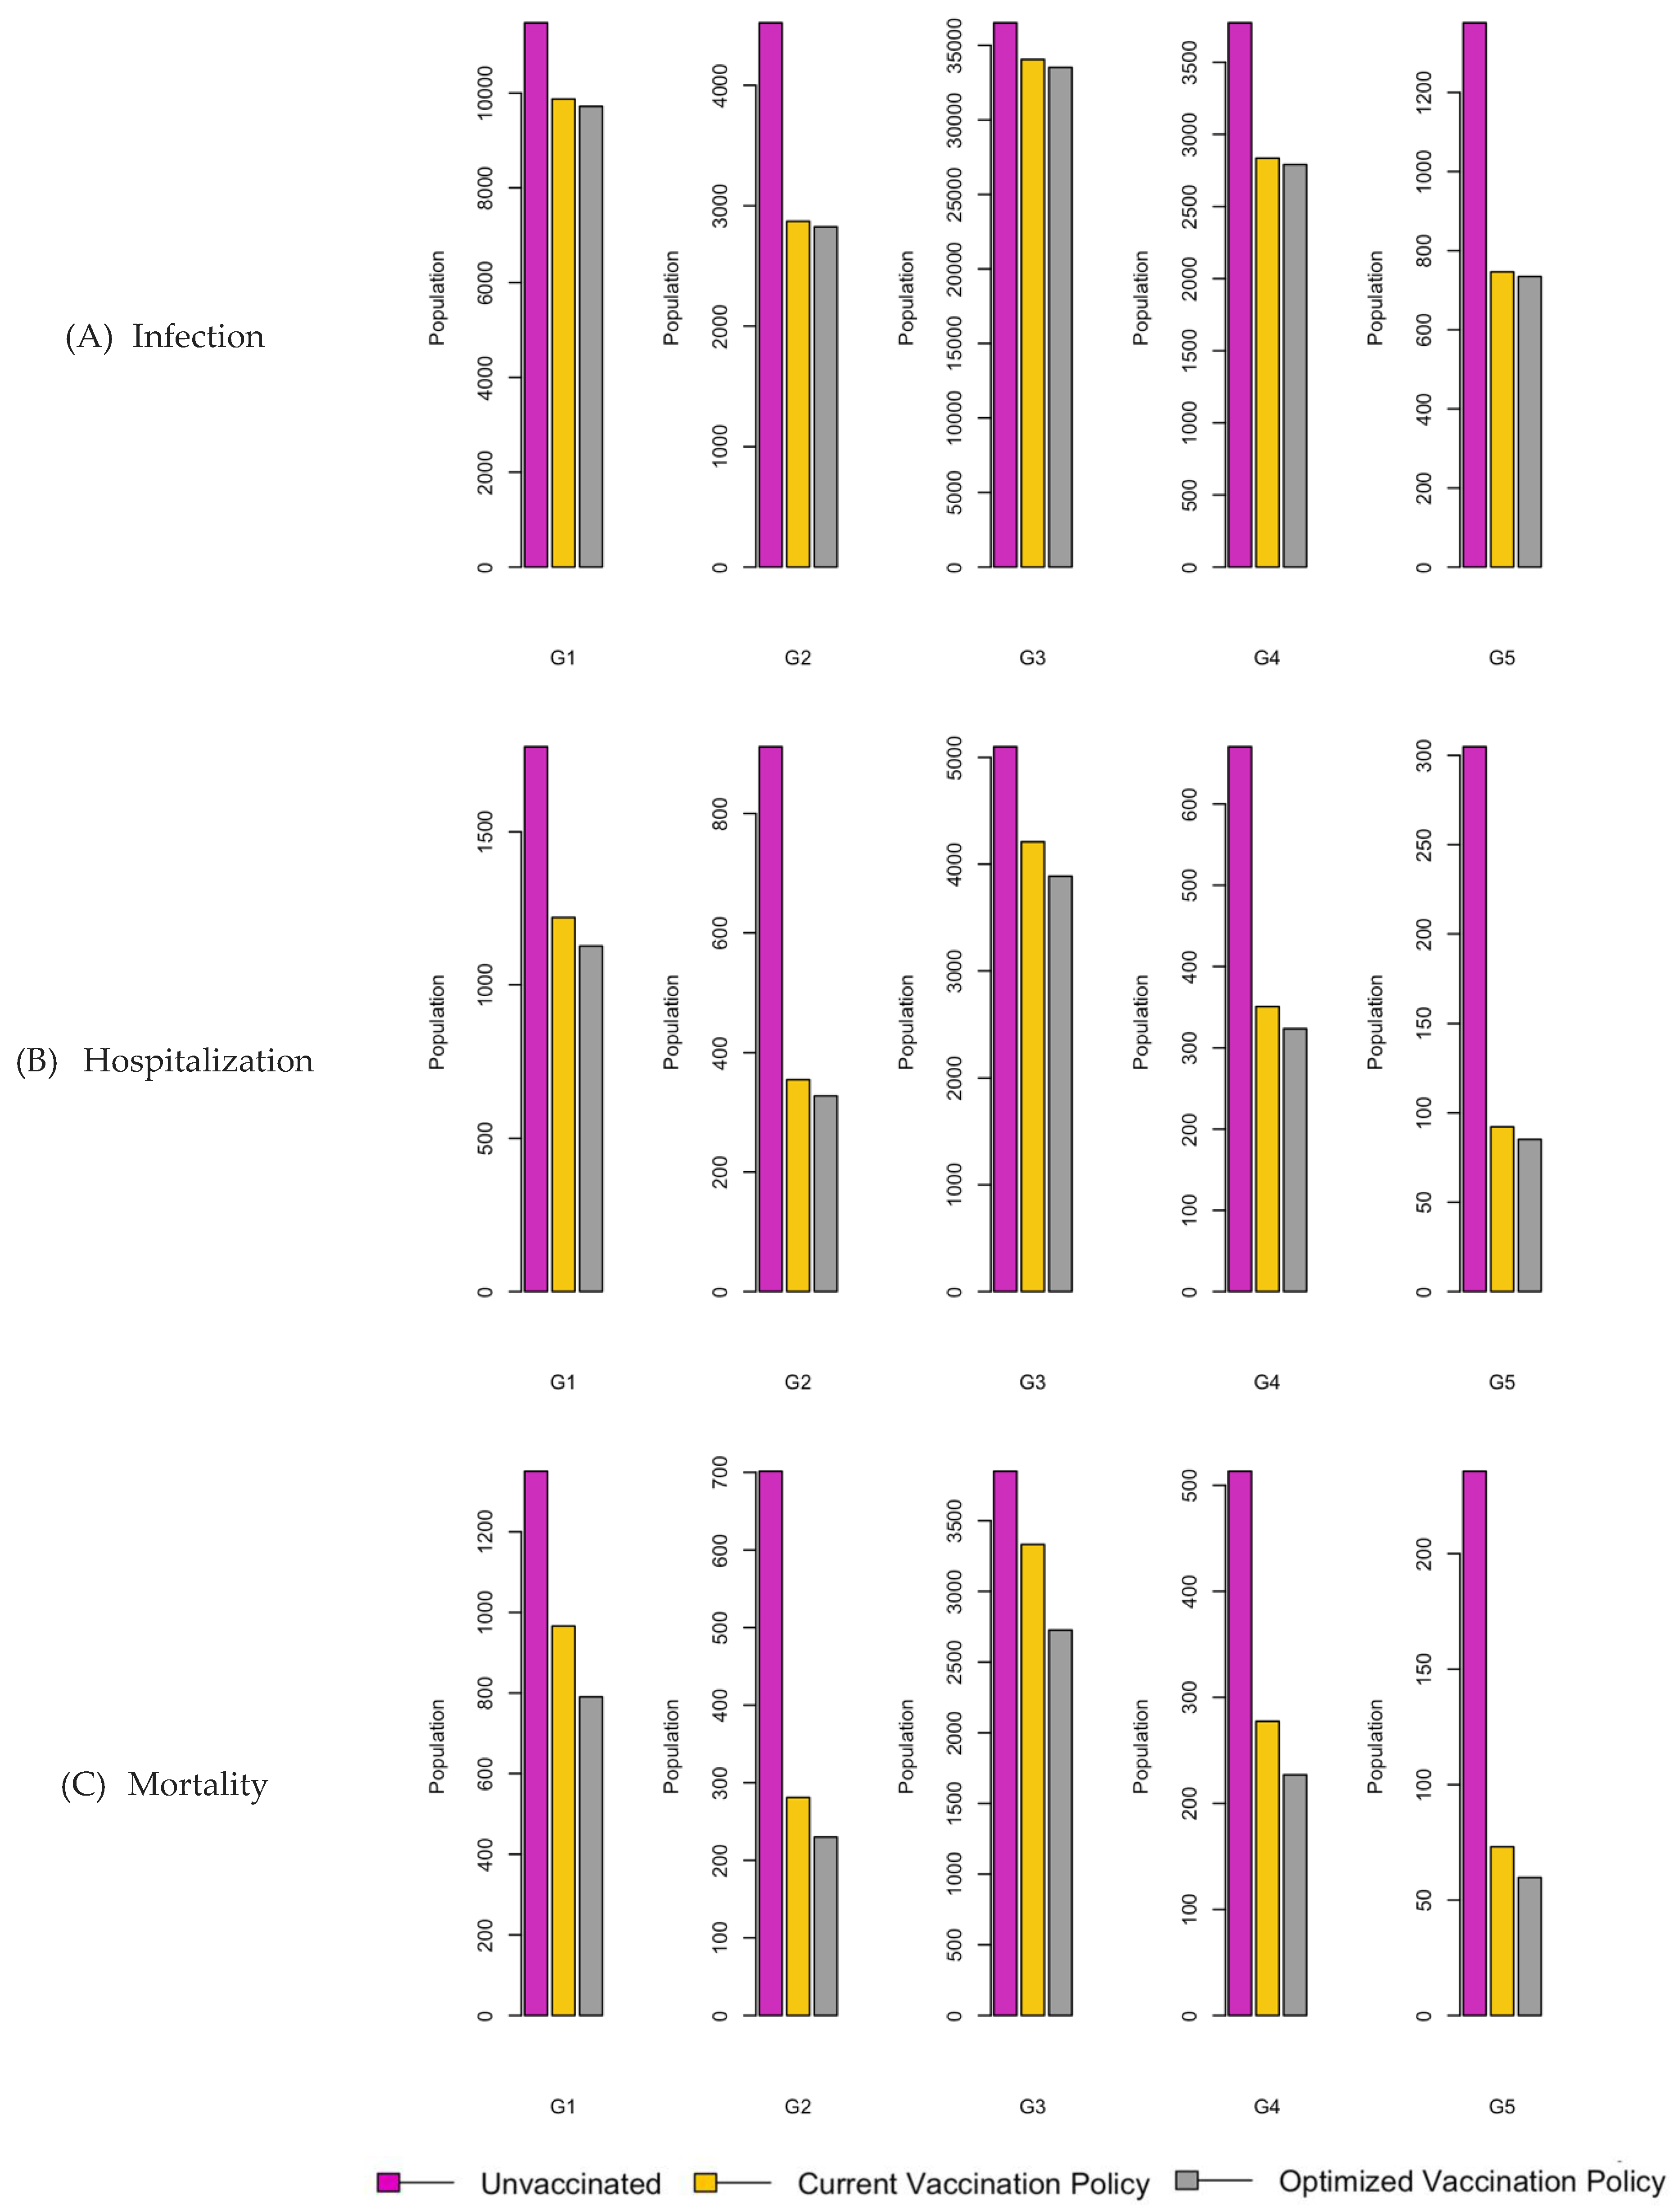
Figure 29.
Bar charts showing the number of (A) Infection (B) Hospitalizations, and (C) Mortality over a given period for R0: 3.1.
Figure 29.
Bar charts showing the number of (A) Infection (B) Hospitalizations, and (C) Mortality over a given period for R0: 3.1.
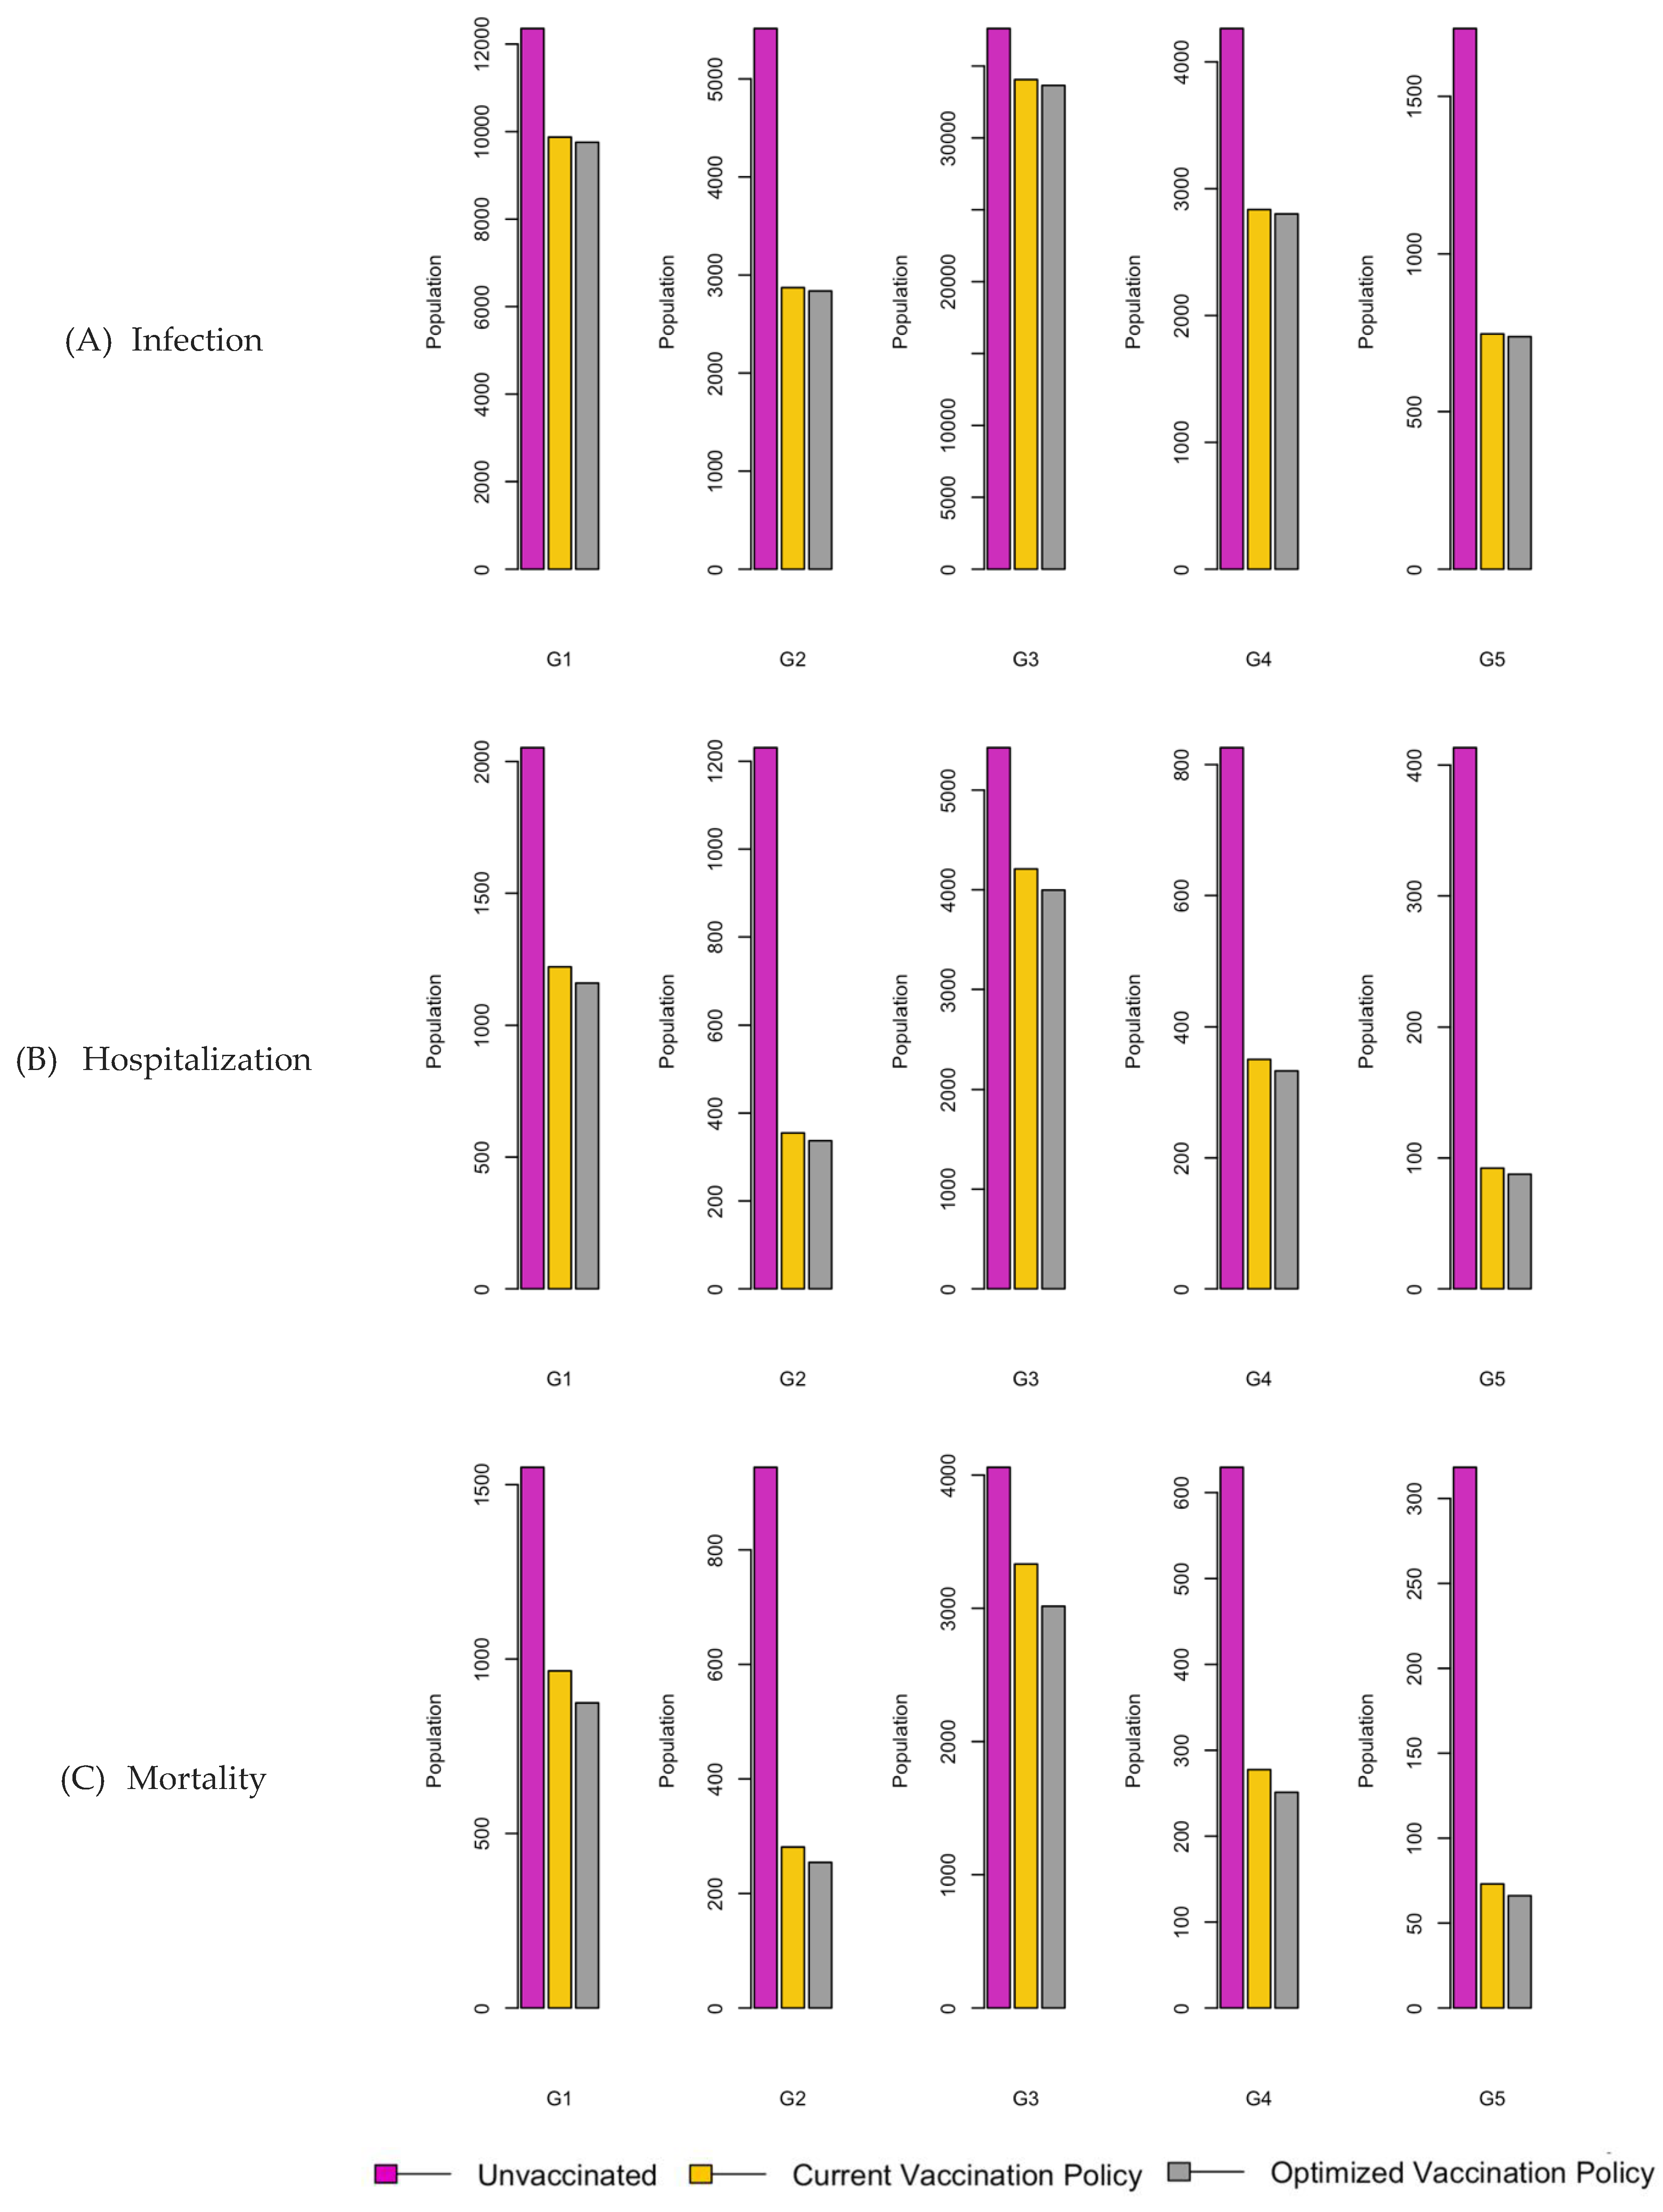

Table 1.
Population characteristics of Saudi Arabia.
| Region | Children (G1) | Youth (G2) | Adults (G3) | Middle-aged (G4) | Seniors (G5) |
| Saudi | 7886890 | 2196700 | 19586914 | 1642871 | 861849 |
| East | 1213128 | 305980 | 3246567 | 252256 | 107323 |
| Center | 537799 | 622192 | 6330420 | 500358 | 227167 |
| North | 783017 | 201818 | 1446075 | 107843 | 63088 |
| West | 2404828 | 706681 | 6151106 | 581524 | 315307 |
| South | 1238127 | 360029 | 2412746 | 200890 | 148964 |
| West | 2404828 | 706681 | 6151106 | 581524 | 315307 |
Table 2.
Regional vaccine uptake by age groups.
| Region | Age groups | ||||
|---|---|---|---|---|---|
| 0-14 | 15-19 | 20-54 | 55-64 | <65 | |
| Saudi | 31.5% [21] | 31.5% [21] | 39.1% [23] | 31.5% [21] | 31.5% [21] |
| East | 22.9% [24] | 22.9% [24] | 16% [24] | 6.4% [24] | 6.4% [24] |
| Center | 18% [25] | 18% [25] | 28% [25] | 28% [25] | 28% [25] |
| North | 30.5% [26] | 30.5% [26] | 45% [27] | 45% [27] | 45% [27] |
| West | 48.8% [28] | 48.8% [28] | 52.2% [29] | 54.2% [58] | 54.2% [58] |
| South | 15.4% [22] | 15.4% [22] | 29.0% [22] | 2.5% [22] | 2.5% [22] |
Table 3.
Initial epidemic parameters categorized by age groups in various regions.
| Region | Age groups | Infection rate | Mortality | Morbidity rate | |
| Hospitalization rate | Hospital stay | ||||
| Saudi | 0-14 | 13.1% [14] | 19.6 % [14] | 7 [14] | 8.5% [14] |
| 15-19 | 11.2% [14] | ||||
| 20-54 | 26.2% [14] | ||||
| 55-64 | 21.5% [14] | ||||
| <65 | 28.0% [14] | ||||
| East | 0-14 | 27.94% [15] | 19.6 % [14] | 7 [14] | 8.5% [14] |
| 15-19 | 27.94% [15] | ||||
| 20-54 | 17.14% [15] | ||||
| 55-64 | 21.60% [15] | ||||
| <65 | 9.05% [15] | ||||
| Center | 0-14 | 31.1% [17] | 19.6 % [14] | 7 [16] | 2% [16] |
| 15-19 | 11.9% [17] | ||||
| 20-54 | 11.9% [17] | ||||
| 55-64 | 11.9% [17] | ||||
| <65 | 11.9% [17] | ||||
| North | 0-14 | 8.64% [18] | 27.8% [18] | 7 [18] | 3.7% [18] |
| 15-19 | 8.64% [18] | ||||
| 20-54 | 4.68% [18] | ||||
| 55-64 | 2.66% [18] | ||||
| <65 | 1.98% [18] | ||||
| West | 0-14 | 2.76% [19] | 7.6% [19] | 7 [14] | 1.5 [19] |
| 15-19 | 1.9% [19] | ||||
| 20-54 | 17% [19] | ||||
| 55-64 | 17% [19] | ||||
| <65 | 5.46% [19] | ||||
| South | 0-14 | 5.65% [20] | 19.6 % [14] | 7 [14] | 8.5% [14] |
| 15-19 | 5.65% [20] | ||||
| 20-54 | 10% [20] | ||||
| 55-64 | 10% [20] | ||||
| <65 | 3.55% [20] | ||||
Table 4.
Combination of number and ratio of infected, hospitalized, and dead individuals over a given period for R0= 1.2.
Table 4.
Combination of number and ratio of infected, hospitalized, and dead individuals over a given period for R0= 1.2.
| R0: 1.2 | ||||||
| Factors | Age group | #Infection (%) | #Vaccine (%) | #Hospitlized (%) | #Death (%) | |
| Scenarios | ||||||
| No vaccination | G1 | 200020.33 (2.53%) | 0.0 (0%) | 24010.208 (0.31%) | 18304.891 (0.23%) | |
| G2 | 60829.06 (2.77%) | 0.0 (0%) | 10134.604 (0.46%) | 7900.153 (0.36%) | ||
| G3 | 950114.20 (4.85%) | 0.0 (0%) | 104739.972 (0.54%) | 79281.039 (0.41%) | ||
| G4 | 74916.58 (4.56%) | 0.0 (0%) | 10394.412 (0.63%) | 8011.309 (0.49%) | ||
| G5 | 51319.10 (5.96%) | 0.0 (0%) | 7147.042 (0.83%) | 5509.852 (0.64%) | ||
| Total | 1337199 (4.16%) | 0.0 (0%) | 156426.2 (0.49%) | 119007.2 (0.37%) | ||
| Current Vaccination Policy | G1 | 179663.01 (2.28%) | 963817.5 (21.4%) | 17491.014 (0.22%) | 14181.890 (0.18%) | |
| G2 | 42782.94 (1.95%) | 268125.3 (5.96%) | 4165.121 (0.19%) | 3377.123 (0.15%) | ||
| G3 | 892377.70 (4.56%) | 2962333.5 (65.8%) | 86876.928 (0.44%) | 70440.685 (0.36%) | ||
| G4 | 61421.92 (3.74%) | 200499.7 (4.46%) | 5979.700 (0.36%) | 4848.401 (0.3%) | ||
| G5 | 41963.40 (4.87%) | 105173.3 (2.34%) | 4085.326 (0.47%) | 3312.424 (0.39%) | ||
| Total | 1218209 (3.79%) | 4499949 (99.99%) | 118598.1 (0.37%) | 96160.52 (0.3%) | ||
| Optimized Vaccination Policy | G1 | 178506.65 (2.26%) | 1440239 (23.01%) | 16107.914 (0.2%) | 11852.206 (0.15%) | |
| G2 | 42507.58 (1.94%) | 318928 (7.09%) | 3835.764 (0.18%) | 2822.357 (0.13%) | ||
| G3 | 886633.62 (4.53%) | 2323353 (51.63%) | 80006.993 (0.41%) | 58869.127 (0.3%) | ||
| G4 | 61026.58 (3.72%) | 312000 (6.93%) | 5506.852 (0.34%) | 4051.941 (0.25%) | ||
| G5 | 41693.30 (4.84%) | 105435 (2.34%) | 3762.275 (0.44%) | 2768.281 (0.32%) | ||
| Total | 1210368 (3.77%) | 4499955 (99.99%) | 109219.8 (0.34%) | 80363.91 (0.25%) | ||
Table 5.
Combination of number and ratio of infected, hospitalized, and dead individuals over a given period for R0= 2.15.
Table 5.
Combination of number and ratio of infected, hospitalized, and dead individuals over a given period for R0= 2.15.
| R0: 2.15 | |||||||
| Factors | Age group | #Infection (%) | #Vaccine (%) | #Hospitlized (%) | #Death (%) | ||
| Scenarios | |||||||
| No vaccination | G1 | 218029.46 (2.76%) | 0.0 (0%) | 29884.24 (0.38%) | 23139.691 (0.29%) | ||
| G2 | 80178.65 (3.65%) | 0.0 (0%) | 16708.75 (0.76%) | 13214.970 (0.6%) | |||
| G3 | 989569.50 (5.05%) | 0.0 (0%) | 116740.76 (0.6%) | 89484.770 (0.46%) | |||
| G4 | 87702.74 (5.34%) | 0.0 (0%) | 14687.06 (0.89%) | 11513.624 (0.7%) | |||
| G5 | 60225.81 (6.99%) | 0.0 (0%) | 10138.49 (1.18%) | 7949.642 (0.92%) | |||
| Total | 1435706 (4.46%) | 0.0 (0%) | 188159.3 (0.58%) | 145302.7 (0.45%) | |||
| Current Vaccination Policy | G1 | 179663.67 (2.28%) | 963817.5 (21.42%) | 17491.052 (0.22%) | 14181.904 (0.18%) | ||
| G2 | 42783.12 (1.95%) | 268125.3 (5.96%) | 4165.138 (0.19%) | 3377.132 (0.15%) | |||
| G3 | 892380.64 (4.56%) | 2962333.5 (65.83%) | 86876.995(0.44%) | 70440.651 (0.36%) | |||
| G4 | 61422.13 (3.74%) | 200499.7 (4.46%) | 5979.708 (0.36%) | 4848.401 (0.3%) | |||
| G5 | 41963.55 (4.87%) | 105173.3 (2.34%) | 4085.332 (0.47%) | 3312.424 (0.38%) | |||
| Total | 1218213 (3.79%) | 4499949 (99.99%) | 118598.2 (0.37%) | 96160.51 (0.3%) | |||
| Optimized Vaccination Policy | G1 | 178482.96 (2.26%) | 720647.9 (16.02%) | 16071.225 (0.2%) | 11537.265 (0.15%) | ||
| G2 | 42502.16 (1.93%) | 374838.1 (8.33%) | 3827.098 (0.17%) | 2747.417 (0.13%) | |||
| G3 | 886516.55 (4.53%) | 2944185 (65.43%) | 79824.968 (0.41%) | 57305.009 (0.29%) | |||
| G4 | 61018.55(3.71%) | 318097.6 (7.07%) | 5494.331 (0.33%) | 3944.290 (0.24%) | |||
| G5 | 41687.84 (4.84%) | 142186.5 (3.16%) | 3753.728 (0.44%) | 2694.740 (0.31%) | |||
| Total | 1210208 (3.76%) | 4499955 (99.99%) | 108971.4 (0.34%) | 78228.72 (0.24%) | |||
Table 6.
Combination of number and ratio of infected, hospitalized, and dead individuals over a given period for R0= 3.1.
Table 6.
Combination of number and ratio of infected, hospitalized, and dead individuals over a given period for R0= 3.1.
| R0: 3.1 | ||||||
| Factors | Age group | #Infection (%) | #Vaccine (%) | #Hospitlized (%) | #Death (%) | |
| Scenarios | ||||||
| No vaccination | G1 | 234347.40 (2.97%) | 0.0 (0%) | 34327.51 (0.44%) | 25876.875 (0.33%) | |
| G2 | 98965.42 (4.51%) | 0.0 (0%) | 22251.18 (1.01%) | 17224.329 (0.78%) | ||
| G3 | 1020792.15 (5.21%) | 0.0 (0%) | 123787.03 (0.63%) | 91813.560 (0.47%) | ||
| G4 | 99308.18 (4.06%) | 0.0 (0%) | 17976.81 (1.09%) | 13745.990 (0.84%) | ||
| G5 | 68334.11 (7.93%) | 0.0 (0%) | 12440.87 (1.44%) | 9516.397 (1.1%) | ||
| Total | 1521747 (4.73%) | 0.0 (0%) | 210783.4 (0.66%) | 158177.2 (0.49%) | ||
| Current Vaccination Policy | G1 | 179661.18 (2.28%) | 963817.5 (21.42%) | 17491.024 (0.22%) | 14181.958 (0.18%) | |
| G2 | 42782.55 (1.95%) | 268125.3 (5.96%) | 4165.139 (0.19%) | 3377.151 (0.15%) | ||
| G3 | 892367.94 (4.56%) | 2962333.5 (65.83%) | 86876.734 (0.44%) | 70440.818 (0.36%) | ||
| G4 | 61421.27 (3.74%) | 200499.7 (4.46%) | 5979.693 (0.36%) | 4848.416 (0.3%) | ||
| G5 | 41962.96 (4.87%) | 105173.3 (2.34%) | 4085.323 (0.47%) | 3312.435 (0.38%) | ||
| Total | 1218196 (3.79%) | 4499949 (99.99%) | 118597.9 (0.37%) | 96160.78 (0.3%) | ||
| Optimized Vaccination Policy | G1 | 178481.68 (2.26%) | 1153255 (25.63%) | 16071.254 (0.2%) | 11543.032 (0.15%) | |
| G2 | 42501.90 (1.93%) | 415796.9 (9.24%) | 3827.118 (0.17%) | 2748.801 (0.13%) | ||
| G3 | 886510 (4.53%) | 2475082 (55%) | 79825.041 (0.41%) | 57333.597 (0.29%) | ||
| G4 | 61018.14 (3.71%) | 359804 (8%) | 5494.349 (0.33%) | 3946.268 (0.24%) | ||
| G5 | 41687.49 (4.84%) | 96039.44 (2.13%) | 3753.718 (0.44%) | 2696.074 (0.31%) | ||
| Total | 1210199 (3.76%) | 4499978 (99.99%) | 108971.5 (0.34%) | 78267.77 (0.24%) | ||
Table 7.
p-values returned by Wilcoxon Rank Sum test for Infection factor.
| Compared Scenario | Unvaccinated-National policy | National-Optimized policy | Unvaccinated-Optimized policy | |
| R0 | ||||
| 1.2 | 0.03125 | 0.03125 | 0.03125 | |
| 2.15 | 0.03125 | 0.03125 | 0.03125 | |
| 3.1 | 0.03125 | 0.03125 | 0.03125 | |
Table 8.
p-values returned by Wilcoxon Rank Sum test for Hospitalization factor.
| Compared Scenario | Unvaccinated-National policy | National-Optimized policy | Unvaccinated-Optimized policy | |
| R0 | ||||
| 1.2 | 0.03125 | 0.03125 | 0.03125 | |
| 2.15 | 0.03125 | 0.03125 | 0.03125 | |
| 3.1 | 0.03125 | 0.03125 | 0.03125 | |
Table 9.
p-values returned by Wilcoxon Rank Sum test for Mortality factor.
| Compared Scenario | Unvaccinated-National policy | National-Optimized policy | Unvaccinated-Optimized policy | |
| R0 | ||||
| 1.2 | 0.03125 | 0.03125 | 0.03125 | |
| 2.15 | 0.03125 | 0.03125 | 0.03125 | |
| 3.1 | 0.03125 | 0.03125 | 0.03125 | |
Table 10.
Combination of number and ratio of infected, hospitalized, and dead individuals over a given period for R0= 1.2.
Table 10.
Combination of number and ratio of infected, hospitalized, and dead individuals over a given period for R0= 1.2.
| R0: 1.2 | ||||||
| Factors | Age group | #Infection (%) | #Vaccine (%) | #Hospitlized (%) | #Death (%) | |
| Scenarios | ||||||
| No vaccination | G1 | 53283.93 (4.39%) | 0.0 (0%) | 7221.96 (0.6%) | 5464.93 (0.45%) | |
| G2 | 15153.23 (4.95%) | 0.0 (0%) | 2422.85 (0.79%) | 1851.51 (0.61%) | ||
| G3 | 87477.50 (2.69%) | 0.0 (0%) | 11530.38 (0.36%) | 8715.39 (0.27%) | ||
| G4 | 9575.49 (3.8%) | 0.0 (0%) | 1516.71 (0.6%) | 1158.60 (0.46%) | ||
| G5 | 2444.214(2.28%) | 0.0 (0%) | 518.20 (0.48%) | 401.64 (0.37%) | ||
| Total | 166167.8 (3.24%) | 0.0 (0%) | 23210.1 (0.45%) | 17592.07 (0.34%) | ||
| Current Vaccination Policy | G1 | 52982.59 (4.37%) | 1400730.96 (31.13%) | 5916.26 (0.49%) | 4684.70 (0.39%) | |
| G2 | 13439.56 (4.39%) | 354224.85 (7.87%) | 1492.25 (0.49%) | 1181.62 (0.39%) | ||
| G3 | 86012.29 (2.65%) | 2627482.73 (58.39%) | 9712.76 (0.3%) | 7690.90 (0.24%) | ||
| G4 | 8565.581 (3.4%) | 82480.83 (1.83%) | 951.05 (0.38%) | 753.08 (0.3%) | ||
| G5 | 1526.881 (1.42%) | 35051.28 (0.78%) | 169.53 (0.16%) | 134.24 (0.13%) | ||
| Total | 164293.5 (3.21%) | 4499971 (99.99%) | 18241.85 (0.36%) | 14444.53 (0.28%) | ||
| Optimized Vaccination Policy | G1 | 49170.152(4.05%) | 1117450 (24.83%) | 5906.90 (0.49%) | 4632.03 (0.38%) | |
| G2 | 12401.99 (4.05%) | 287582.1 (6.39%) | 1489.90 (0.49%) | 1168.34 (0.38%) | ||
| G3 | 80723.52 (2.49%) | 2757575 (61.28%) | 9697.30 (0.3%) | 7604.35 (0.23%) | ||
| G4 | 7904.31(3.13%) | 240228.5 (5.34%) | 949.56 (0.38%) | 744.62 (0.3%) | ||
| G5 | 1409.03 (1.31%) | 97070.76 (2.16%) | 169.28 (0.16%) | 132.74 (0.12%) | ||
| Total | 151609 (2.96%) | 4499907 (99.99%) | 18212.94 (0.36%) | 14282.08 (0.28%) | ||
Table 11.
Combination of number and ratio of infected, hospitalized, and dead individuals over a given period for R0= 2.15.
Table 11.
Combination of number and ratio of infected, hospitalized, and dead individuals over a given period for R0= 2.15.
| R0: 2.15 | ||||||
| Factors | Age group | #Infection (%) | #Vaccine (%) | #Hospitlized (%) | #Death (%) | |
| Scenarios | ||||||
| No vaccination | G1 | 55613.43 (4.58%) | 0.0 (0%) | 8032.06 (0.66%) | 6014.02 (0.5%) | |
| G2 | 17571.34 (5.74%) | 0.0 (0%) | 3196.47 (1.04%) | 2429.11 (0.79%) | ||
| G3 | 89360.95 (2.75%) | 0.0 (0%) | 12545.42 (0.39%) | 9373.93 (0.29%) | ||
| G4 | 10983.37 (4.35%) | 0.0 (0%) | 1966.32 (0.78%) | 1493.25 (0.59%) | ||
| G5 | 3386.74 (3.16%) | 0.0 (0%) | 822.60 (0.77%) | 634.29 (0.59%) | ||
| Total | 176915.8 (3.45%) | 0.0 (0%) | 26562.87 (0.52%) | 19944.59 (0.39%) | ||
| Current Vaccination Policy | G1 | 53284.14 (4.39%) | 1400730.95 (31.13%) | 5916.33 (0.49%) | 4684.76 (0.39%) | |
| G2 | 13439.68 (4.39%) | 354224.85 (7.87%) | 1492.29 (0.49%) | 1181.65 (0.39%) | ||
| G3 | 87477.53 (2.69%) | 2627482.73 (58.39%) | 9712.77 (0.3%) | 7690.90 (0.24%) | ||
| G4 | 8565.59 (3.4%) | 82480.83 (1.83%) | 951.05 (0.38%) | 753.08 (0.3%) | ||
| G5 | 1526.89 (1.42%) | 35051.28 (0.78%) | 169.54 (0.16%) | 134.25 (0.13%) | ||
| Total | 164293.8 (3.21%) | 4499971 (99.99%) | 18241.98 (0.36%) | 14444.64 (0.28%) | ||
| Optimized Vaccination Policy | G1 | 48977.32 (4.04%) | 1072186 (23.87%) | 5487.64 (0.45%) | 3994.24 (0.33%) | |
| G2 | 12353.42 (4.04%) | 277914.2 (6.19%) | 1384.17 (0.45%) | 1007.49 (0.33%) | ||
| G3 | 80406.72 (2.48%) | 2801081 (62.36%) | 9008.95 (0.28%) | 6557.23 (0.2%) | ||
| G4 | 7873.3 (3.12%) | 240345.6 (5.35%) | 882.16 (0.35%) | 642.09 (0.25%) | ||
| G5 | 1403.53 (1.31%) | 100297.6 (2.23%) | 157.27 (0.15%) | 114.47 (0.11%) | ||
| Total | 151014.3 (2.95%) | 4491824 (99.82%) | 16920.19 (0.33%) | 12315.52 (0.24%) | ||
Table 12.
Combination of number and ratio of infected, hospitalized, and dead individuals over a given period for R0= 3.1.
Table 12.
Combination of number and ratio of infected, hospitalized, and dead individuals over a given period for R0= 3.1.
| R0: 3.1 | ||||||
| Factors | Age group | #Infection (%) | #Vaccine (%) | #Hospitlized (%) | #Death (%) | |
| Scenarios | ||||||
| No vaccination | G1 | 58615.37 (4.83%) | 0.0 (0%) | 8963.14 (0.74%) | 6705.18 (0.55%) | |
| G2 | 20497.55 (6.7%) | 0.0 (0%) | 4132.80 (1.35%) | 3158.11 (1.03%) | ||
| G3 | 93068.53 (2.87%) | 0.0 (0%) | 13678.69 (0.42%) | 10195.92 (0.31%) | ||
| G4 | 12630.50 (5.01%) | 0.0 (0%) | 2491.36 (0.99%) | 1900.81 (0.75%) | ||
| G5 | 4503.86 (4.2%) | 0.0 (0%) | 1181.78 (1.1%) | 916.73 (0.85%) | ||
| Total | 189315.8 (3.69%) | 0.0 (0%) | 30447.78 (0.59%) | 22876.74 (0.45%) | ||
| Current Vaccination Policy | G1 | 53284.36 (4.39%) | 1400730.95 (31.13%) | 5916.41 (0.49%) | 4684.83 (0.39%) | |
| G2 | 13439.79 (4.39%) | 354224.84 (7.87%) | 1492.33 (0.49%) | 1181.69 (0.39%) | ||
| G3 | 87477.56 (2.69%) | 2627482.73 (58.39%) | 9712.77 (0.3%) | 7690.91 (0.24%) | ||
| G4 | 8565.60 (3.4%) | 82480.83 (1.83%) | 951.06 (0.38%) | 753.08 (0.3%) | ||
| G5 | 1526.9 (1.42%) | 35051.28 (0.78%) | 169.54 (0.16%) | 134.25 (0.13%) | ||
| Total | 164294.2 (3.21%) | 4499971 (99.99%) | 18242.11 (0.36%) | 14444.75 (0.28%) | ||
| Optimized Vaccination Policy | G1 | 48835.59 (4.03%) | 1080865 (24.02%) | 5574.91 (0.46%) | 4263.41 (0.35%) | |
| G2 | 12317.74 (4.03%) | 272526.6 (6.06%) | 1406.20 (0.46%) | 1075.40 (0.35%) | ||
| G3 | 80173.43 (2.47%) | 2847669 (63.28%) | 9151.9822 (0.28%) | 6998.91 (0.22%) | ||
| G4 | 7850.5 (3.11%) | 201331.2 (4.47%) | 896.18 (0.36%) | 685.35 (0.27%) | ||
| G5 | 1399.51 (1.3%) | 97462.32 (2.17%) | 159.79 (0.15%) | 122.20 (0.11%) | ||
| Total | 150576.8 (2.94%) | 4499854 (99.99%) | 17189.06 (0.34%) | 13145.27 (0.26%) | ||
Table 13.
Combination of number and ratio of infected, hospitalized, and dead individuals over a given period for R0= 1.2. .
Table 13.
Combination of number and ratio of infected, hospitalized, and dead individuals over a given period for R0= 1.2. .
| R0: 1.2 | ||||||
| Factors | Age group | #Infection (%) | #Vaccine (%) | #Hospitlized (%) | #Death (%) | |
| Scenarios | ||||||
| No vaccination | G1 | 28865.11 (5.37%) | 0.0 (0%) | 3667.51 (0.68%) | 832.21 (0.15%) | |
| G2 | 13266.38 (2.13%) | 0.0 (0%) | 1823.92 (0.29%) | 417.85 (0.07%) | ||
| G3 | 128954.14 (2.04%) | 0.0 (0%) | 16085.52 (0.25%) | 3641.51 (0.06%) | ||
| G4 | 10618.61 (2.12%) | 0.0 (0%) | 1446.34 (0.29%) | 330.96 (0.07%) | ||
| G5 | 4938.26 (2.17%) | 0.0 (0%) | 704.82 (0.31%) | 162.13 (0.07%) | ||
| Total | 186642.5 (2.27%) | 0.0 (0%) | 23728.11 (0.29%) | 5384.67 (0.07%) | ||
| Current Vaccination Policy | G1 | 24912.99 (4.63%) | 202049.3 (4.49%) | 3541.60 (0.66%) | 786.97 (0.15%) | |
| G2 | 11028.51 (1.77%) | 234055.3 (5.2%) | 1567.80 (0.25%) | 348.38 (0.06%) | ||
| G3 | 112208.32 (1.77%) | 3644996.7 (81.0%) | 15951.37 (0.25%) | 3544.50 (0.06%) | ||
| G4 | 8868.98 (1.77%) | 288101.5 (6.4%) | 1260.80 (0.25%) | 280.16 (0.06%) | ||
| G5 | 4026.59 (1.77%) | 130797.0 (2.91%) | 572.42 (0.25%) | 127.19 (0.06%) | ||
| Total | 161045.4 (1.96%) | 4500000 (100.0%) | 22893.98 (0.28%) | 5087.19 (0.06%) | ||
| Optimized Vaccination Policy | G1 | 24429.68 (4.54%) | 269717.2 (5.99%) | 3152.08 (0.59%) | 627.71 (0.12%) | |
| G2 | 10814.56 (1.74%) | 298404.2 (6.63%) | 1395.37 (0.22%) | 277.87 (0.04%) | ||
| G3 | 110031.46 (1.74%) | 3531334 (78.47%) | 14196.99 (0.22%) | 2827.19 (0.04%) | ||
| G4 | 8696.92 (1.74%) | 278184.2 (6.18%) | 1122.13 (0.22%) | 223.46 (0.04%) | ||
| G5 | 3948.48 (1.74%) | 122318.7 (2.72%) | 509.46 (0.22%) | 101.45 (0.04%) | ||
| Total | 157921.1 (1.92%) | 4499958 (99.99%) | 20376.03 (0.25%) | 4057.68 (0.04%) | ||
Table 14.
Combination of number and ratio of infected, hospitalized, and dead individuals over a given period for R0= 2.15.
Table 14.
Combination of number and ratio of infected, hospitalized, and dead individuals over a given period for R0= 2.15.
| R0: 2.15 | ||||||
| Factors | Age group | #Infection (%) | #Vaccine (%) | #Hospitlized (%) | #Death (%) | |
| Scenarios | ||||||
| No vaccination | G1 | 29423.38 (5.47%) | 0.0 (0%) | 3899.90 (0.73%) | 882.58 (0.16%) | |
| G2 | 13942.21 (2.24%) | 0.0 (0%) | 2099.82 (0.34%) | 475.43 (0.08%) | ||
| G3 | 130557.24 (2.06%) | 0.0 (0%) | 16764.04 (0.26%) | 3793.19 (0.06%) | ||
| G4 | 11112.68 (2.22%) | 0.0 (0%) | 1648.40 (0.33%) | 373.27 (0.07%) | ||
| G5 | 5263.90 (2.32%) | 0.0 (0%) | 837.46 (0.37%) | 189.70 (0.08%) | ||
| Total | 190299.3 (2.32%) | 0.0 (0%) | 25249.62 (0.31%) | 5714.18 (0.07%) | ||
| Current Vaccination Policy | G1 | 24912.99 (4.63%) | 202049.3 (4.49%) | 3541.60 (0.66%) | 786.97 (0.15%) | |
| G2 | 11028.52 (1.77%) | 234055.3 (5.2%) | 1567.80 (0.25%) | 348.38 (0.06%) | ||
| G3 | 112208.32 (1.77%) | 3644996.7 (81.0%) | 15951.37 (0.25%) | 3544.50 (0.06%) | ||
| G4 | 8868.98 (1.77%) | 288101.5 (6.4%) | 1260.80 (0.25%) | 280.16 (0.06%) | ||
| G5 | 4026.59 (1.77%) | 130797.0 (2.91%) | 572.42 (0.25%) | 127.19 (0.06%) | ||
| Total | 161045.4 (1.96%) | 4500000 (100.0%) | 22893.98 (0.28%) | 5087.19 (0.06%) | ||
| Optimized Vaccination Policy | G1 | 24505.97 (4.56%) | 263084.5 (5.89%) | 3135.50 (0.58%) | 601.40 (0.11%) | |
| G2 | 10848.33 (1.74%) | 301372.9 (6.75%) | 1388.03 (0.22%) | 266.23 (0.04%) | ||
| G3 | 110375.04 (1.74%) | 3486407 (78.06%) | 14122.31 (0.22%) | 2708.72 (0.04%) | ||
| G4 | 8724.07 (1.74%) | 287516.8 (6.44%) | 1116.23 (0.22%) | 214.10 (0.04%) | ||
| G5 | 3960.81 (1.74%) | 128070.8 (2.87%) | 506.78 (0.22%) | 97.20 (0.04%) | ||
| Total | 158414.2 (1.93%) | 4466452 (99.25%) | 20268.85 (0.25%) | 3887.66 (0.05%) | ||
Table 15.
Combination of number and ratio of infected, hospitalized, and dead individuals over a given period for R0= 3.1.
Table 15.
Combination of number and ratio of infected, hospitalized, and dead individuals over a given period for R0= 3.1.
| R0: 3.1 | ||||||
| Factors | Age group | #Infection (%) | #Vaccine (%) | #Hospitlized (%) | #Death (%) | |
| Scenarios | ||||||
| No vaccination | G1 | 29977.35 (5.57%) | 0.0 (0%) | 4123.36 (0.77%) | 925.60 (0.17%) | |
| G2 | 14646.94 (2.35%) | 0.0 (0%) | 2380.68 (0.38%) | 534.82 (0.09%) | ||
| G3 | 132087.81 (2.09%) | 0.0 (0%) | 17388.11 (0.27%) | 3902.06 (0.06%) | ||
| G4 | 11621.74 (2.32%) | 0.0 (0%) | 1851.62 (0.37%) | 416.05 (0.08%) | ||
| G5 | 5601.91 (2.47%) | 0.0 (0%) | 972.14 (0.43%) | 218.55 (0.1%) | ||
| Total | 193935.8 (2.36%) | 0.0 (0%) | 26715.91 (%0.33) | 5997.08 (0.07%) | ||
| Current Vaccination Policy | G1 | 24913.0 (4.63%) | 202049.3 (4.49%) | 3541.60 (0.66%) | 786.97 (0.15%) | |
| G2 | 11028.52 (1.77%) | 234055.3 (5.2%) | 1567.80 (0.25%) | 348.38 (0.06%) | ||
| G3 | 112208.32 (1.77%) | 3644996.7 (81.0%) | 15951.37 (0.25%) | 3544.50 (0.06%) | ||
| G4 | 8868.98 (1.77%) | 288101.5 (6.4%) | 1260.80 (0.25%) | 280.16 (0.06%) | ||
| G5 | 4026.59 (1.77%) | 130797.0 (2.91%) | 572.42 (0.25%) | 127.19 (0.06%) | ||
| Total | 161045.4 (1.96%) | 4500000 (100.0%) | 22893.98 (0.28%) | 5087.19 (0.06%) | ||
| Optimized Vaccination Policy | G1 | 24758.13 (4.6%) | 277026 (6.17%) | 3530.71 (0.66%) | 764.93 (0.14%) | |
| G2 | 10959.96 (1.76%) | 339439.9 (7.56%) | 1562.98 (0.25%) | 338.62 (0.05%) | ||
| G3 | 111510.76 (1.76%) | 3476166 (77.4%) | 15902.34 (0.25%) | 3445.23 (0.05%) | ||
| G4 | 8813.84 (1.76%) | 266114.4 (5.93%) | 1256.93 (0.25%) | 272.31 (0.05%) | ||
| G5 | 4001.56 (1.76%) | 132597.9 (2.95%) | 570.66 (0.25%) | 123.63 (0.05%) | ||
| Total | 160044.2 (1.95%) | 4491345 (99.81%) | 22823.61 (0.28%) | 4944.72 (0.06%) | ||
Table 16.
Combination of number and ratio of infected, hospitalized, and dead individuals over a given period for R0= 1.2.
Table 16.
Combination of number and ratio of infected, hospitalized, and dead individuals over a given period for R0= 1.2.
| R0: 1.2 | ||||||
| Factors | Age group | #Infection (%) | #Vaccine (%) | #Hospitlized (%) | #Death (%) | |
| Scenarios | ||||||
| No vaccination | G1 | 9603.08 (1.23%) | 0.0 (0%) | 1812.47 (0.23%) | 572.97 (0.07%) | |
| G2 | 2566.52 (1.27%) | 0.0 (0%) | 509.18 (0.25%) | 159.99 (0.08%) | ||
| G3 | 9553.16 (0.66%) | 0.0 (0%) | 1788.61 (0.12%) | 573.16 (0.04%) | ||
| G4 | 458.75 (0.43%) | 0.0 (0%) | 100.58 (0.09%) | 31.81 (0.03%) | ||
| G5 | 216.94 (0.34%) | 0.0 (0%) | 51.70 (0.08%) | 16.43 (0.03%) | ||
| Total | 22398.45 (0.86%) | 0.0 (0%) | 4262.54 (0.16%) | 1335.59 (0.05%) | ||
| Current Vaccination Policy | G1 | 9580.30 (1.22%) | 1057774.4 (23.93%) | 1782.90 (0.23%) | 567.58 (0.07%) | |
| G2 | 2469.30 (1.22%) | 272635.1 (6.17%) | 459.55 (0.23%) | 147.69 (0.07%) | ||
| G3 | 9583.55 (0.66%) | 2762477.1 (62.51%) | 1783.48 (0.12%) | 559.79 (0.04%) | ||
| G4 | 406.25 (0.38%) | 206043.2 (4.66%) | 75.61 (0.07%) | 24.30 (0.02%) | ||
| G5 | 176.91 (0.28%) | 120540.4 (2.73%) | 32.93 (0.05%) | 10.58 (0.02%) | ||
| Total | 22216.31 (0.85%) | 4419470 (98.21%) | 4134.46 (0.16%) | 1328.70 (0.05%) | ||
| Optimized Vaccination Policy | G1 | 9419.98 (1.2%) | 1314694 (29.26%) | 1643.38 (0.21%) | 482.19 (0.05%) | |
| G2 | 2427.97 (1.2%) | 356192.3 (7.93%) | 423.58 (0.21%) | 124.29 (0.06%) | ||
| G3 | 9423.20 (0.65%) | 2522905 (56.16%) | 1643.93 (0.11%) | 482.34 (0.03%) | ||
| G4 | 399.44 (0.37%) | 187757.9 (4.18%) | 69.69 (0.06%) | 20.45 (0.02%) | ||
| G5 | 173.94 (0.28%) | 111039.3 (2.47%) | 30.35 (0.05%) | 8.91 (0.01%) | ||
| Total | 21844.52 (0.84%) | 4492589 (99.84%) | 3810.93 (0.15%) | 1118.16 (0.04%) | ||
Table 17.
Combination of number and ratio of infected, hospitalized, and dead individuals over a given period for R0= 2.15.
Table 17.
Combination of number and ratio of infected, hospitalized, and dead individuals over a given period for R0= 2.15.
| R0: 2.15 | ||||||
| Factors | Age group | #Infection (%) | #Vaccine (%) | #Hospitlized (%) | #Death (%) | |
| Scenarios | ||||||
| No vaccination | G1 | 9838.75 (1.26%) | 0.0 (0%) | 1967.96 (0.25%) | 642.47 (0.08%) | |
| G2 | 2695.37 (1.34%) | 0.0 (0%) | 582.21 (0.29%) | 190.72 (0.9%) | ||
| G3 | 9749.28 (0.67%) | 0.0 (0%) | 1924.98 (0.13%) | 628.05 (0.04%) | ||
| G4 | 506.38 (0.47%) | 0.0 (0%) | 125.41 (0.12%) | 41.33 (0.4%) | ||
| G5 | 250.26 (0.4%) | 0.0 (0%) | 68.61 (0.11%) | 22.70 (0.04%) | ||
| Total | 23040.04 (0.89%) | 0.0 (0%) | 4669.17 (0.18%) | 1525.27 (0.06%) | ||
| Current Vaccination Policy | G1 | 9580.41 (1.22%) | 1057774.1 (23.93%) | 1782.95 (0.23%) | 572.99 (0.07%) | |
| G2 | 2469.36 (1.22%) | 272635.0 (6.17%) | 459.57 (0.23%) | 47.70 (0.02%) | ||
| G3 | 9583.58 (0.66%) | 2762476.3 (62.51%) | 1783.49 (0.12%) | 573.16 (0.04%) | ||
| G4 | 406.27 (0.38%) | 206043.2 (4.66%) | 75.62 (0.07%) | 24.30 (0.02%) | ||
| G5 | 176.93 (0.28%) | 120540.4 (2.73%) | 32.94 (0.05%) | 10.59 (0.02%) | ||
| Total | 22216.54 (0.85%) | 4419469 (98.21%) | 4134.57 (0.16%) | 1328.73 (0.05%) | ||
| Optimized Vaccination Policy | G1 | 9428.47 (1.2%) | 1349987 (30.0%) | 1654.30 (0.21%) | 490.07 (0.06%) | |
| G2 | 2430.18 (1.2%) | 358068.5 (7.96%) | 426.41 (0.21%) | 126.32 (0.06%) | ||
| G3 | 9431.63 (0.65%) | 2487839 (55.29%) | 1654.82 (0.11%) | 490.22 (0.03%) | ||
| G4 | 399.81 (0.37%) | 191728.1 (4.26%) | 70.15 (0.07%) | 20.78 (0.02%) | ||
| G5 | 174.11 (0.28%) | 112117.8 (2.49%) | 30.55 (0.05%) | 9.05 (0.01%) | ||
| Total | 21864.19 (0.84%) | 4499740 (99.99%) | 3836.24(0.15%) | 1136.44 (0.04%) | ||
Table 18.
Combination of number and ratio of infected, hospitalized, and dead individuals over a given period for R0= 3.1.
Table 18.
Combination of number and ratio of infected, hospitalized, and dead individuals over a given period for R0= 3.1.
| R0: 3.1 | ||||||
| Factors | Age group | #Infection (%) | #Vaccine (%) | #Hospitlized (%) | #Death (%) | |
| Scenarios | ||||||
| No vaccination | G1 | 9941.81 (1.27%) | 0.0 (0%) | 1989.03 (0.25%) | 618.27 (0.08%) | |
| G2 | 2787.42 (1.38%) | 0.0 (0%) | 614.74 (0.3%) | 192.30 (0.01%) | ||
| G3 | 9814.34 (0.68%) | 0.0 (0%) | 1930.30 (0.13%) | 599.31 (0.04%) | ||
| G4 | 546.14 (0.51%) | 0.0 (0%) | 140.91 (0.13%) | 44.50 (0.04%) | ||
| G5 | 279.42 (0.44%) | 0.0 (0%) | 80.25 (0.13%) | 25.48 (0.04%) | ||
| Total | 23369.13 (0.9%) | 0.0 (0%) | 4755.22 (0.18%) | 1479.86 (0.06%) | ||
| Current Vaccination Policy | G1 | 9580.51 (1.22%) | 1057773.9 (23.93%) | 1782.99 (0.23%) | 573.00 (0.07%) | |
| G2 | 2469.41 (1.22%) | 272634.9 (6.17%) | 459.60 (0.23%) | 147.70 (0.07%) | ||
| G3 | 9583.62 (0.66%) | 2762475.6 (62.51%) | 1783.50 (0.12%) | 573.17 (0.04%) | ||
| G4 | 406.29 (0.38%) | 206043.1 (4.66%) | 75.63 (0.07%) | 24.31 (0.02%) | ||
| G5 | 176.95 (0.28%) | 120540.4 (2.73%) | 32.95 (0.05%) | 10.59 (0.02%) | ||
| Total | 22216.78 (0.85%) | 4419468 (98.21%) | 4134.67 (0.16%) | 1328.77 (0.05%) | ||
| Optimized Vaccination Policy | G1 | 9526.33 (1.22%) | 1351268 (30.03%) | 1765.41 (0.23%) | 570.64 (0.07%) | |
| G2 | 2455.43 (1.22%) | 352741.4 (7.84%) | 455.06 (0.23%) | 147.09 (0.07%) | ||
| G3 | 9529.42 (0.66%) | 2492424 (55.39%) | 1765.92 (0.12%) | 570.80 (0.04%) | ||
| G4 | 403.97 (0.37%) | 191864 (4.26%) | 74.87 (0.07%) | 24.20 (0.02%) | ||
| G5 | 175.93 (0.28%) | 111569.1 (2.48%) | 32.61 (0.05%) | 10.54 (0.02%) | ||
| Total | 22091.08 (0.85%) | 4499867 (99.99%) | 4093.88 (0.16%) | 1323.27 (0.05%) | ||
Table 19.
p-values returned by Wilcoxon Rank Sum test for Infection factor.
| Compared Scenario | Unvaccinated-National policy | National-Optimized policy | Unvaccinated-Optimized policy | |
| R0 | ||||
| 1.2 | 0.09375 | 0.03125 | 0.03125 | |
| 2.15 | 0.03125 | 0.03125 | 0.03125 | |
| 3.1 | 0.03125 | 0.03125 | 0.03125 | |
Table 20.
p-values returned by Wilcoxon Rank Sum test for Hospitalization factor.
| Compared Scenario | Unvaccinated-National policy | National-Optimized policy | Unvaccinated-Optimized policy | |
| R0 | ||||
| 1.2 | 0.03125 | 0.03125 | 0.03125 | |
| 2.15 | 0.03125 | 0.03125 | 0.03125 | |
| 3.1 | 0.03125 | 0.02895363 | 0.03125 | |
Table 21.
p-values returned by Wilcoxon Rank Sum test for Mortality factor.
| Compared Scenario | Unvaccinated-National policy | National-Optimized policy | Unvaccinated-Optimized policy | |
| R0 | ||||
| 1.2 | 0.03125 | 0.03125 | 0.03125 | |
| 2.15 | 0.03125 | 0.15625 | 0.03125 | |
| 3.1 | 0.03125 | 0.03125 | 0.03125 | |
Table 22.
Combination of number and ratio of infected, hospitalized, and dead individuals over a given period for R0= 1.2.
Table 22.
Combination of number and ratio of infected, hospitalized, and dead individuals over a given period for R0= 1.2.
| R0: 1.2 | ||||||
| Factors | Age group | #Infection (%) | #Vaccine (%) | #Hospitlized (%) | #Death (%) | |
| Scenarios | ||||||
| No vaccination | G1 | 11561.46 (0.48%) | 0.0 (0%) | 779.71 (0.03%) | 230.21 (0.01%) | |
| G2 | 2833.37 (0.4%) | 0.0 (0%) | 262.26 (0.04%) | 76.67 (0.01%) | ||
| G3 | 176414.05 (2.87%) | 0.0 (0%) | 11072.32 (0.18%) | 3277.99 (0.05%) | ||
| G4 | 17034.80 (2.93%) | 0.0 (0%) | 1122.23 (0.19%) | 331.63 (0.06%) | ||
| G5 | 3189.99 (1.01%) | 0.0 (0%) | 242.71 (0.08%) | 71.37 (0.02%) | ||
| Total | 211033.7 (2.08%) | 0.0 (0%) | 13479.23 (0.13%) | 3987.87 (0.04%) | ||
| Current Vaccination Policy | G1 | 10976.25 (0.46%) | 953465.5 (22.55%) | 648.96 (0.03%) | 194.05 (0.01%) | |
| G2 | 2220.44 (0.31%) | 280200.7 (6.63%) | 131.28 (0.02%) | 39.26 (0.01%) | ||
| G3 | 172927.02 (2.81%) | 2600458.6 (61.51%) | 10224.13 (0.17%) | 3057.17 (0.05%) | ||
| G4 | 16348.48 (20.81%) | 254934.2 (6.03%) | 966.59 (0.17%) | 289.02 (0.05%) | ||
| G5 | 2846.99 (0.9%) | 138333.9 (3.27%) | 168.33 (0.05%) | 50.33 (0.02%) | ||
| Total | 205319.2 (2.02%) | 4227393 (93.94%) | 12139.29 (0.12%) | 3629.83 (0.04%) | ||
| Optimized Vaccination Policy | G1 | 9513.85 (0.4%) | 933013.6 (21.34%) | 543.46 (0.02%) | 148.97 (0.01%) | |
| G2 | 1924.60 (0.27%) | 366738.1 (8.39%) | 109.94 (0.02%) | 30.14 (0.004%) | ||
| G3 | 149887.35 (2.44%) | 2715520 (62.11%) | 8562.01 (0.14%) | 2346.96 (0.04%) | ||
| G4 | 14170.31 (2.44%) | 230222 (5.27%) | 809.45 (0.14%) | 221.88 (0.04%) | ||
| G5 | 2467.68 (0.78%) | 126331.6 (2.89%) | 140.96 (0.04%) | 38.64 (0.01%) | ||
| Total | 177963.8 (1.75%) | 4371825 (97.15%) | 10165.82 (0.1%) | 2786.58 (0.03%) | ||
Table 23.
Combination of number and ratio of infected, hospitalized, and dead individuals over a given period for R0= 2.15.
Table 23.
Combination of number and ratio of infected, hospitalized, and dead individuals over a given period for R0= 2.15.
| R0: 2.15 | ||||||
| Factors | Age group | #Infection (%) | #Vaccine (%) | #Hospitlized (%) | #Death (%) | |
| Scenarios | ||||||
| No vaccination | G1 | 12037.53 (0.5%) | 0.0 (0%) | 883.31 (0.04%) | 260.65 (0.01%) | |
| G2 | 3372.78 (0.48%) | 0.0 (0%) | 375.75 (0.05%) | 109.76 (0.02%) | ||
| G3 | 178776.36 (2.91%) | 0.0 (0%) | 11631.71 (0.19%) | 3445.27 (0.06%) | ||
| G4 | 17572.52 (3.02%) | 0.0 (0%) | 1240.90 (0.21%) | 366.61 (0.06%) | ||
| G5 | 3480.76 (1.1%) | 0.0 (0%) | 304.62 (0.1%) | 89.47 (0.03%) | ||
| Total | 215239.9 (2.12%) | 0.0 (0%) | 14436.3 (0.14%) | 4271.75 (0.042%) | ||
| Current Vaccination Policy | G1 | 10976.31 (0.46%) | 953465.5 (22.55%) | 648.96 (0.03%) | 194.05 (0.01%) | |
| G2 | 2220.45 (0.31%) | 280200.7 (6.63%) | 131.28 (0.02%) | 39.26 (0.01%) | ||
| G3 | 172927.74 (2.81%) | 2600458.6 (61.51%) | 10224.14 (0.17%) | 3057.17 (0.05%) | ||
| G4 | 16348.55 (2.81%) | 254934.2 (6.03%) | 966.59 (0.17%) | 289.02 (0.05%) | ||
| G5 | 2847.01 (0.9%) | 138333.9 (3.27%) | 168.33 (0.05%) | 50.33 (0.02%) | ||
| Total | 205320.1 (2.02%) | 4227393 (93.94%) | 12139.3 (0.12%) | 3629.83 (0.0357%) | ||
| Optimized Vaccination Policy | G1 | 9483.12 (0.39%) | 1058691 (23.53%) | 560.89 (0.02%) | 155.88 (0.01%) | |
| G2 | 1919.37 (0.27%) | 323928.8 (7.2%) | 113.63 (0.016%) | 31.58 (0.004%) | ||
| G3 | 149391.61 (2.43%) | 2805230 (62.34%) | 8834.66 (0.14%) | 2455.34 (0.04%) | ||
| G4 | 14124.16 (2.43%) | 193090.4 (4.29%) | 835.34 (0.14%) | 232.16 (0.04%) | ||
| G5 | 2460.09 (0.78%) | 118852.4 (2.64%) | 145.54 (0.05%) | 40.45 (0.01%) | ||
| Total | 177378.3 (1.75%) | 4499793 (99.99%) | 10490.06 (0.1%) | 2915.42 (0.03%) | ||
Table 24.
Combination of number and ratio of infected, hospitalized, and dead individuals over a given period for R0= 3.1.
Table 24.
Combination of number and ratio of infected, hospitalized, and dead individuals over a given period for R0= 3.1.
| R0: 3.1 | ||||||
| Factors | Age group | #Infection (%) | #Vaccine (%) | #Hospitlized (%) | #Death (%) | |
| Scenarios | ||||||
| No vaccination | G1 | 12358.58 (0.51%) | 0.0 (0%) | 918.67 (0.04%) | 265.83 (0.01%) | |
| G2 | 3779.85 (0.53%) | 0.0 (0%) | 443.21 (0.06%) | 128.51 (0.02%) | ||
| G3 | 179865.98 (2.92%) | 0.0 (0%) | 11489.15 (0.19%) | 3321.50 (0.05%) | ||
| G4 | 17914.70 (3.08%) | 0.0 (0%) | 1269.39 (0.22%) | 367.22 (0.06%) | ||
| G5 | 3690.42 (1.17%) | 0.0 (0%) | 335.92 (0.11%) | 97.31 (0.03%) | ||
| Total | 217609.5 (2.14%) | 0.0 (0%) | 14456.32 (0.14%) | 4180.37 (0.04%) | ||
| Current Vaccination Policy | G1 | 10976.29 (0.46%) | 953465.5 (22.55%) | 648.96 (0.03%) | 194.05 (0.01%) | |
| G2 | 2220.45 (0.31%) | 280200.7 (6.63%) | 131.28 (0.02%) | 39.26 (0.01%) | ||
| G3 | 172927.41 (2.81%) | 2600458.6 (61.51%) | 10224.14 (0.17%) | 3057.17 (0.05%) | ||
| G4 | 16348.52 (2.81%) | 254934.2 (6.03%) | 966.59 (0.17%) | 289.02 (0.05%) | ||
| G5 | 2847.01 (0.9%) | 138333.9 (3.27%) | 168.33 (0.05%) | 50.33 (0.02%) | ||
| Total | 205319.7 (2.02%) | 4227393 (93.94%) | 12139.3 (0.12%) | 3629.83 (0.04%) | ||
| Optimized Vaccination Policy | G1 | 9535.14 (0.4%) | 1053577 (23.41%) | 580.16 (0.02%) | 174.87 (0.01%) | |
| G2 | 1930.00 (0.27%) | 393842.1 (8.75%) | 117.55 (0.017%) | 35.43 (0.005%) | ||
| G3 | 150209.87 (2.44%) | 2700216 (60.01%) | 9137.94 (0.15%) | 2754.40 (0.04%) | ||
| G4 | 14201.58 (2.44%) | 213136.8 (4.74%) | 864.03 (0.15%) | 260.44 (0.04%) | ||
| G5 | 2473.62 (0.78%) | 139082.3 (3.09%) | 150.55 (0.05%) | 45.38 (0.01%) | ||
| Total | 178350.2 (1.76%) | 4499854 (99.99%) | 10850.23 (0.11%) | 3270.53 (0.03%) | ||
Table 25.
Combination of number and ratio of infected, hospitalized, and dead individuals over a given period for R0= 1.2.
Table 25.
Combination of number and ratio of infected, hospitalized, and dead individuals over a given period for R0= 1.2.
| R0: 1.2 | ||||||
| Factors | Age group | #Infection (%) | #Vaccine (%) | #Hospitlized (%) | #Death (%) | |
| Scenarios | ||||||
| No vaccination | G1 | 10663.39 (0.86%) | 0.0 (0%) | 1500.49 (0.12%) | 1146.72 (0.09%) | |
| G2 | 3664.84 (1.02%) | 0.0 (0%) | 628.28 (0.17%) | 486.01 (0.13%) | ||
| G3 | 35300.87 (1.46%) | 0.0 (0%) | 4672.37 (0.19%) | 3555.38 (0.15%) | ||
| G4 | 3308.55 (1.65%) | 0.0 (0%) | 514.88 (0.26%) | 396.23 (0.2%) | ||
| G5 | 1062.99 (0.71%) | 0.0 (0%) | 200.98 (0.13%) | 156.40 (0.1%) | ||
| Total | 54000.64 (1.24%) | 0.0 (0%) | 7516.99 (0.17%) | 5740.74 (0.13%) | ||
| Current Vaccination Policy | G1 | 9874.22 (0.8%) | 905235.36 (20.12%) | 1220.38 (0.1%) | 966.22 (0.08%) | |
| G2 | 2871.29 (0.8%) | 263966.77 (5.87%) | 354.87 (0.1%) | 280.97 (0.08%) | ||
| G3 | 34056.39 (1.41%) | 3288823.80 (73.09%) | 4209.06 (0.17%) | 3332.48 (0.14%) | ||
| G4 | 2835.60 (1.41%) | 24105.77 (0.54%) | 350.46 (0.17%) | 277.47 (0.14%) | ||
| G5 | 746.44 (0.5%) | 17851.38 (0.4%) | 92.25 (0.06%) | 73.04 (0.05%) | ||
| Total | 50383.94 (1.16%) | 4499983 (99.99%) | 6227.02 (0.14%) | 4930.18 (0.11%) | ||
| Optimized Vaccination Policy | G1 | 9839.29 (0.79%) | 1245020 (27.67%) | 1163.55 (0.09%) | 810.45 (0.07%) | |
| G2 | 2861.14 (0.79%) | 349387.8 (7.76%) | 338.35 (0.09%) | 235.67 (0.07%) | ||
| G3 | 33935.70 (1.41%) | 2547427 (56.61%) | 4012.99 (0.17%) | 2795.19 (0.12%) | ||
| G4 | 2825.57 (1.41%) | 211195.5 (4.69%) | 334.14 (0.17%) | 232.74 (0.12%) | ||
| G5 | 743.81 (0.5%) | 146577.9 (3.26%) | 87.96 (0.06%) | 61.27 (0.04%) | ||
| Total | 50205.51 (1.15%) | 4499608 (99.99%) | 5936.98 (0.136%) | 4135.32 (0.09%) | ||
Table 26.
Combination of number and ratio of infected, hospitalized, and dead individuals over a given period for R0= 2.15.
Table 26.
Combination of number and ratio of infected, hospitalized, and dead individuals over a given period for R0= 2.15.
| R0: 2.15 | ||||||
| Factors | Age group | #Infection (%) | #Vaccine (%) | #Hospitlized (%) | #Death (%) | |
| Scenarios | ||||||
| No vaccination | G1 | 11480.78 (0.93%) | 0.0 (0%) | 1777.79 (0.14%) | 1350.34 (0.11%) | |
| G2 | 4519.03 (1.26%) | 0.0 (0%) | 911.80 (0.25%) | 701.53 (0.19%) | ||
| G3 | 36512.79 (1.51%) | 0.0 (0%) | 5099.83 (0.21%) | 3850.17 (0.16%) | ||
| G4 | 3773.84 (1.88%) | 0.0 (0%) | 670.54 (0.33%) | 513.31 (0.26%) | ||
| G5 | 1376.31 (0.92%) | 0.0 (0%) | 304.82 (0.2%) | 235.67 (0.16%) | ||
| Total | 57662.75 (1.32%) | 0.0 (0%) | 8764.77 (0.2%) | 6651.01 (0.15%) | ||
| Current Vaccination Policy | G1 | 9874.26 (0.8%) | 905235.36 (20.12%) | 1220.39 (0.1%) | 966.23 (0.08%) | |
| G2 | 2871.31 (0.8%) | 263966.77 (5.87%) | 354.88 (0.1%) | 280.97 (0.08%) | ||
| G3 | 34056.40 (1.41%) | 3288823.80 (73.09%) | 4209.07 (0.17%) | 3332.49 (0.14%) | ||
| G4 | 2835.60 (1.41%) | 24105.77 (0.54%) | 350.46 (0.17%) | 277.47 (0.14%) | ||
| G5 | 746.45 (0.5%) | 17851.38 (0.4%) | 92.25 (0.06%) | 73.04 (0.05%) | ||
| Total | 50384.02 (1.16%) | 4499983 (99.99%) | 6227.05 (0.14%) | 4930.20 (0.11%) | ||
| Optimized Vaccination Policy | G1 | 9718.54 (0.78%) | 1268448 (28.19%) | 1127.01 (0.09%) | 790.52 (0.06%) | |
| G2 | 2826.07 (0.78%) | 378464.6 (8.41%) | 327.74 (0.09%) | 229.89 (0.06%) | ||
| G3 | 33518.95 (1.39%) | 2491082 (55.36%) | 3886.90 (0.16%) | 2726.37 (0.11%) | ||
| G4 | 2790.88 (1.39%) | 211532.8 (4.7%) | 323.64 (0.16%) | 227.01 (0.11%) | ||
| G5 | 734.69 (0.49%) | 150247.5 (3.34%) | 85.20 (0.06%) | 59.76 (0.04%) | ||
| Total | 49589.14 (1.14%) | 4499776 (99.99%) | 5750.50 (0.13%) | 4033.55 (0.09%) | ||
Table 27.
Combination of number and ratio of infected, hospitalized, and dead individuals over a given period for R0= 3.1.
Table 27.
Combination of number and ratio of infected, hospitalized, and dead individuals over a given period for R0= 3.1.
| R0: 3.1 | ||||||
| Factors | Age group | #Infection (%) | #Vaccine (%) | #Hospitlized (%) | #Death (%) | |
| Scenarios | ||||||
| No vaccination | G1 | 12355.65 (0.99%) | 0.0 (0%) | 2052.37 (0.166%) | 1549.57 (0.125%) | |
| G2 | 5514.14 (1.53%) | 0.0 (0%) | 1230.87 (0.34%) | 944.09 (0.26%) | ||
| G3 | 37607.99 (1.56%) | 0.0 (0%) | 5426.12 (0.22%) | 4058.25 (0.17%) | ||
| G4 | 4263.08 (2.12%) | 0.0 (0%) | 825.78 (0.41%) | 629.43 (0.31%) | ||
| G5 | 1715.03 (1.15%) | 0.0 (0%) | 413.26 (0.28%) | 318.36 (0.21%) | ||
| Total | 61455.89 (1.41%) | 0.0 (0%) | 9948.39 (0.23%) | 7499.69 (0.17%) | ||
| Current Vaccination Policy | G1 | 9874.31 (0.8%) | 905235.36 (20.12%) | 1220.41 (0.1%) | 966.25 (0.08%) | |
| G2 | 2871.34 (0.8%) | 263966.77 (5.87%) | 354.89 (0.1%) | 280.98 (0.08%) | ||
| G3 | 34056.42 (1.41%) | 3288823.80 (73.09%) | 4209.07 (0.17%) | 3332.49 (0.14%) | ||
| G4 | 2835.60 (1.41%) | 24105.77 (0.54%) | 350.46 (0.17%) | 277.47 (0.14%) | ||
| G5 | 746.45 (0.5%) | 17851.38 (0.4%) | 92.26 (0.06%) | 73.04 (0.05%) | ||
| Total | 50384.11 (1.16%) | 4499983 (99.99%) | 6227.08 (0.14%) | 4930.23 (0.11%) | ||
| Optimized Vaccination Policy | G1 | 9755.79 (0.79%) | 1272933 (28.29%) | 1158.94 (0.09%) | 874.41 (0.07%) | |
| G2 | 2836.91 (0.79%) | 370079.6 (8.22%) | 337.03 (0.09%) | 254.29 (0.07%) | ||
| G3 | 33647.09 (1.39%) | 2491113 (55.36%) | 3996.89 (0.17%) | 3015.58 (0.12%) | ||
| G4 | 2801.57 (1.39%) | 2491113 (55.36%) | 332.81 (0.17%) | 251.10 (0.12%) | ||
| G5 | 737.51 (0.5%) | 216707.5 (4.82%) | 87.62 (0.06%) | 66.11 (0.04%) | ||
| Total | 49778.86 (1.14%) | 4499843 (99.99%) | 5913.28 (0.136%) | 4461.47 (0.1%) | ||
Disclaimer/Publisher’s Note: The statements, opinions and data contained in all publications are solely those of the individual author(s) and contributor(s) and not of MDPI and/or the editor(s). MDPI and/or the editor(s) disclaim responsibility for any injury to people or property resulting from any ideas, methods, instructions or products referred to in the content. |
© 2024 by the authors. Licensee MDPI, Basel, Switzerland. This article is an open access article distributed under the terms and conditions of the Creative Commons Attribution (CC BY) license (http://creativecommons.org/licenses/by/4.0/).
Copyright: This open access article is published under a Creative Commons CC BY 4.0 license, which permit the free download, distribution, and reuse, provided that the author and preprint are cited in any reuse.


