Submitted:
26 May 2024
Posted:
27 May 2024
You are already at the latest version
Abstract
This study investigates the impact of fintech, particularly blockchain technology and non-fungible tokens (NFTs), on the art market. As fintech has been widely accepted, the art market has undergone transformations, including increased transaction transparency, enhanced liquidity, improved risk management capabilities, reduced entry barriers to the market, and more developed copyright protection. Using a Vector Autoregression (VAR) model, this paper clarifies the significant effects of fintech, especially the NFTs, on the size and profitability of the art market. The findings not only emphasize the importance of NFTs in developing the art market and increasing investment returns but also provide insights and constructive suggestions for the future growth and sustainable development of the art market. By fostering transparency, efficiency, and accessibility, fintech contributes to a more resilient and sustainable art market, ensuring its long-term prosperity and cultural enrichment.
Keywords:
Fintech
; Art Market
; Blockchain
; Non-Fungible Tokens (NFTs)
; Vector Autoregression (VAR)
; Sustainable Development
1. Introduction
With the rapid growth of fintech, innovative tools such as blockchain technology and non-fungible tokens (NFTs) have introduced revolutionary changes in the art market. These changes have considerably improved transaction transparency and security, facilitated the global flow and trading efficiency of artworks, and contributed to the sustainable development of the market. Currently, fintech is applied to sectors such as retail, healthcare, education, and agriculture, changing traditional business models and consumer behavior [1]. In the art market, fintech provides innovative solutions to issues such as information asymmetry, market opacity, and high entry barriers [2,11]. Art transactions have become more convenient and transparent through online auction platforms and digital currency payments. Blockchain technology, in particular, has shown great potential in rights confirmation and the protection of intellectual property rights for artworks.
This study aims to fill the research gap concerning the impact of fintech on the art market. Through theoretical discussion and empirical analysis, this paper examines the influence of fintech, especially NFTs, on the size, profitability, and sustainability of the art market. Based on the VAR model and variance decomposition techniques, we analyze the significant long-term impact of fintech on the art market, particularly its key contributions to market size, revenue growth, and the sustainable development of the art market. The findings not only offer practical guidance for policymakers and market participants but also encourage the deep integration of fintech with the cultural industry, introducing growth opportunities for the sustainable development of the art market. By reducing fraud, ensuring provenance, and facilitating more efficient transactions, fintech can enhance the longevity and ecological sustainability of art investments, providing a robust framework for the future growth and stability of the art market.
2. Materials and Methods
2.1. Data Sources and Collection Period
This study utilizes publicly available data to examine the influence of financial technology on the art market from September 2018 to December 2023. This period captures recent advancements in financial technologies and their impacts on market dynamics. The data sources include Art Basel for art market trends, UBS for financial insights, Bloomberg for comprehensive market analytics, Statista for detailed industry statistics, NFTGo for Non-Fungible Tokens information, ArtTactic for specialized art market reports, and the Observatory of Economic Complexity for global trade data. Access to these datasets is available via their respective websites under terms conducive to public use or open access, facilitating a thorough understanding of the ongoing changes within the art market.
2.2. Data Accessibility and Ethical Considerations
All data come from sources adhering to open access and public use standards. Researchers can access the data through the specified platforms, following their usage policies. This approach ensures rigorous analysis and provides valuable insights for art market stakeholders, supporting strategic decision-making in the face of emerging financial technologies.
2.3. Methodology
The study employs a Vector Autoregression (VAR) model to explore how blockchain and NFTs influence the art market. This model helps analyze the effects on transparency, liquidity, entry barriers, and risk management. Statistical analyses, including VAR parameter estimation and variance decomposition, were performed using STATA software to ensure the results’ reliability.
2.3.1. Model Construction
The model used in this study of a VAR model for the following purpose: (i) analyze the influence mechanisms of fintech, particularly NFTs, on the art market; and (ii) analyze the correlation among time-series variables and the influence of fintech on different aspects of the art market. In this model, the NFT trading volume (ntf) is the main explanatory variable, and the size of the art market (artmv) and return (artrt) are both dependent variables. the size of the art market is analyzed in Model 1 and the return of the art market (artrt) is assessed in Model 2. Macroeconomic indicators of global economic conditions, including the global MSCI index (msci) and the US dollar index (uindex) may influence the art market, so to ensure more accurate predictions, they are included in this model. Moreover, exogenous factors, such as NFT trading frequency (bir), turnover frequency (ptf), and the share of NFT sales related to art (artntf), capture the influence of NFTs in the art market, so they are also included in this model. The model not only builds up data support for hypothesis test but also introduces mathematical rigor to the entire analysis process. Therefore, it ensures the reliability and applicability of the empirical results. VAR model configuration is as follows:
where is a vector of intercepts, and to are matrices.
As for the analytical accuracy and reliability, this study introduces stationarity tests to assess data stability, cointegration tests to investigate long-term relationships between variables, and use impulse response and variance decomposition analysis to evaluate the dynamic interactions between variables, and their contributions to the art market. These statistical approaches contribute to in-depth understanding about the impacts of fintech on the structure and performance of the art market across different time horizons.
3. Results
3.1. Data Testing and VAR Model Regression Results
In this study, to ensure the accuracy of the analysis between variables, the original series of explanatory variables, dependent variables, and control variables were first differenced at the first order. After processing, the data achieved stationarity at the 5% significance level, becoming first-order integrated series, which is well-prepared for further time series analysis. To select an appropriate lag length for the model, the degrees of freedom loss and availability were considered, and the optimal lag length was chosen as lag six, based on the AIC and BIC. Further, the long-term equilibrium relationship between variables was explored through regression residual cointegration tests and Johansen cointegration tests. The results showed that at zero-order lag, the test statistics was significantly greater than the critical values at the 5% significance level, decisively rejecting the null hypothesis of no cointegration and confirming the existence of a long-term equilibrium relationship between the variables, which indicates that despite the possible short-run fluctuations, the variables maintain a stable relationship in the long term. The analysis results not only provide a solid statistical foundation for the establishment of the VAR model but also ensure the effectiveness and reliability of time series analysis, developing the foundation for the following impulse response and variance decomposition analysis.

Table 1.
VAR Model Results Table.
| Model 1 | Model 2 | ||
|---|---|---|---|
| D.artmv | D.artrt | ||
| Main | |||
| L3D.ntf | 0.000*** | 0.000** | |
| t-statistics | (4.64) | (2.61) | |
| L4D.ntf | 0.000*** | 0.000*** | |
| t-statistics | (3.93) | (5.11) |
Note: *** indicates significance at the 1% level; ** indicates significance at the 5% level.
The results of the VAR model analysis have presented profound insights for this study. Particularly, through the vector autoregression model analysis, we found that the third and fourth lags of D.ntf significantly positively affect D.artmv and D.artrt in the model. Specifically, the NFT trading volume at the third lag has a statistically significant impact on both the size of the art market and its return rate, with even stronger effects at the fourth lag, which suggests that the application of fintech, particularly in the art market, has a clear lag effect on enhancing market size and returns, which becomes significantly stronger about three to four periods later. The finding tells the significant impact of fintech, particularly the NFTs, on market dynamics and long-term growth. Moreover, a unit root test is conducted for the stability and reliability of the VAR model.
Figure 1.
Roots of the companion matrix(model1).
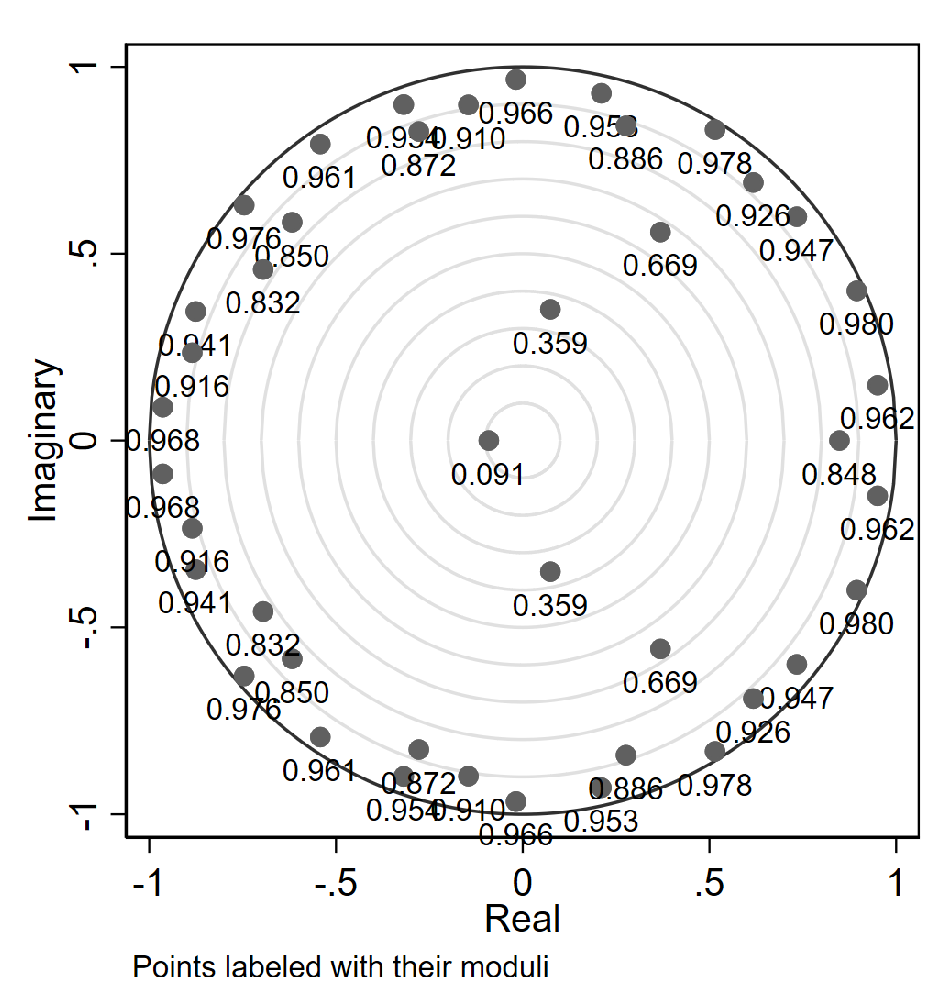
Figure 2.
roots of the companion matrix(model2).
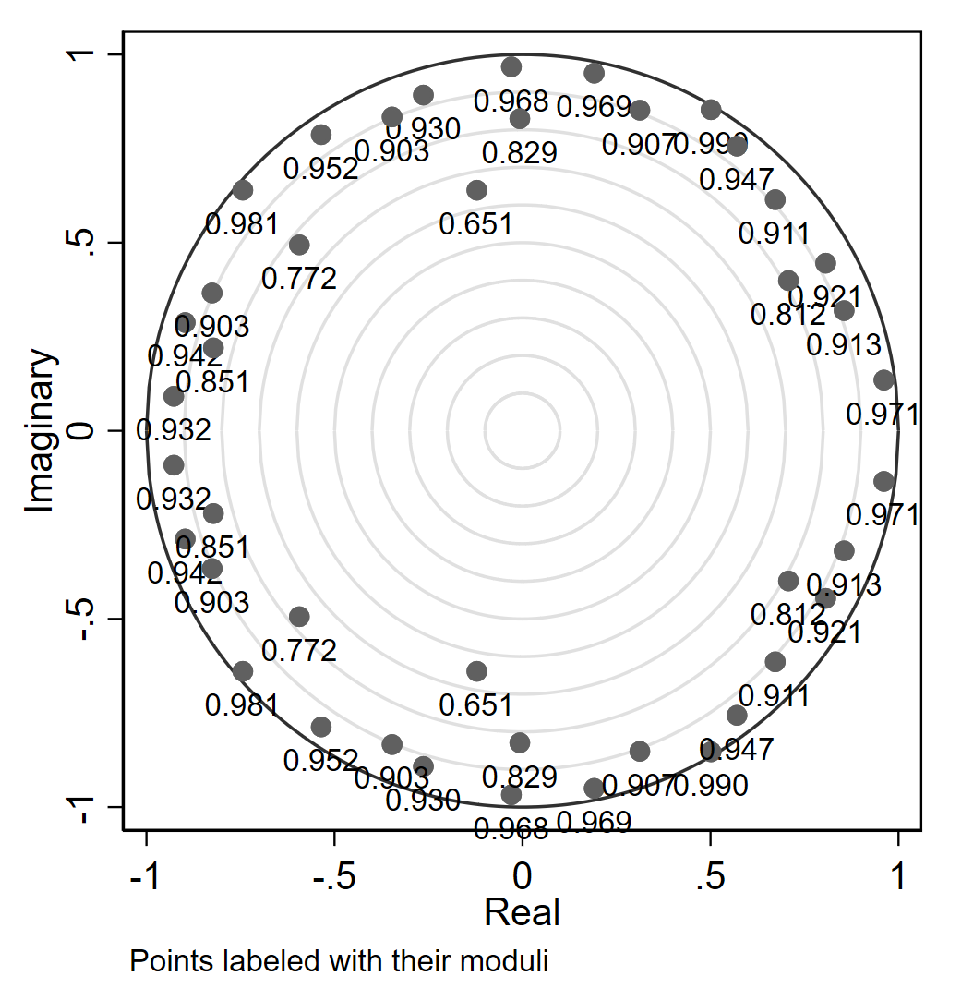
The unit circle test results indicate that all the roots of Model 1 and Model 2 are inside the unit circle, suggesting that the VAR models are stable in this study. Furthermore, the results also support the accuracy and robustness of empirical models and ensure the reliability and validity of analytical results. Therefore, it builds up a solid statistical foundation for further economic analysis and policy recommendations.
3.2. Granger Causality Test
The application of VAR model starts with Granger causality test to determine the presence of causal relationship beginning from NFT trading volume (D.ntf) to the size of the art market (D.artmv) and the art market returns (D.artrt). The aim of the Granger causality tests is to analyze whether one time series could provide valuable predictive information regarding the future values of another time series, conditional on the information set.
For the analysis of dynamic relationships on art market size (Table 2)and market return (Table 3), the Granger causality tests show that fintech () has significantly affected both indicators. In specific, the impact of fintech on art market size is both statistically significant in Model 1 and Model 2, which indicates that fintech (ntf) not only a Granger-causes art market size (artmv) but also has comparable driving force on art market returns (artrt). Therefore, the findings further verify that the fintech, especially the NFT technology, plays a significant role in increasing art market size and encouraging profitability level.
3.3. Impulse Response Analysis
Following the Granger causality tests, the study moves on to impulse response analysis. In this part, the differenced term of fintech (D.ntf) is considered as the source of the shock, while the differenced term of art market size (D.artmv) in Model 1 and differenced term of art market return (D.artrt) in Model 2 are the dependent variables.
In the study of the relationship between the application of fintech and the art market, impulse response analysis has revealed some key dynamics. Specifically, as shown in Figure 3, when fintech (such as NFTs) receives a one-time positive shock, the response of the art market size (D.artmv) is a rapid increase within the first month, peaking in the tenth month, showing the maximum positive impact during this period. Following fluctuations may reflect the market participants’ adaptation process to emerging technologies and the integration of these technologies in the art market. This result tells that the rise of fintech, especially NFTs, provides a new motivation for expanding the size of the art market, consistent with the hypothesis of this study. Figure 4 shows the impact of fintech shocks on art market returns (D.artrt). The initial decline in returns following the shock may reflect the market’s reaction to the uncertainty and risks of the initial application of fintech. However, the return rate shows a recovery trend over time, suggesting that the market gradually recognizes and absorbs the value of fintech. Particularly from the 15th period onwards, the steady increase in return rates may indicate increased market confidence in the long-term value and earnings potential of fintech, especially NFT technology. Taking into account the analysis of both figures, the conclusion can be drawn that the application of fintech, particularly NFTs, not only encourages the expansion of the art market size in the short-term but also positively influences market returns in the long run. The research findings are important, as they not only validate the contribution of fintech to driving market growth but also emphasize its potential to enhance market return. For policymakers, this finding is conducive to a deep understanding and utilization of fintech, particularly the long-term value of NFTs, in the sense of promotion and management of the art market.
3.4. Variance Decomposition
In the end, this study analyzes the relative contributions of fintech to the size and returns of the art market by forecast error variance decomposition. It facilitates the decomposition of the overall system’s mean squared error (MSE) into contributory components caused by shocks from other variables. Since the analysis includes a 20-period variance decomposition, therefore, it expresses the contributions of various factors to the forecast errors of art market size and returns over this period.
In this study, the results of the forecast error variance decomposition provide the quantitative evidence regarding the impact of fintech on the size and returns of the art market. To be specific, the results in the first three columns indicate that the impact of fintech on the art market size gradually increases and reaches the contribution rate of nearly 98% by the 20th period Table 4, which implies that the changes in art market size is increasingly driven by fintech over time. While the results in last three columns about art market returns also show a similar pattern, suggesting that the impact of fintech stays at a high level of approximately 93% after 20 periods Table 4. These results significantly support the main hypothesis that the fintech, especially NFT technology, has a decisive impact on the expansion of market size and the growth of market returns. These findings reveal that fintech not only takes the dominant position in the art market but also significantly promotes long-term growth in market size and returns. This further validates the importance of fintech in building the structure and operational models of the modern art market, providing crucial perspectives for market strategies and policy formulation, and facilitating the adaptation and development of the art market, given the emerging technological trends.
3.5. Empirical Summary
In this study, through empirical analysis using a VAR model, we confirmed the significant impact of fintech on both the size and return rates of the art market, particularly in terms of the lagged effects of variables. Preliminary impulse response analysis revealed a significantly positive initial impact of fintech on the size of the art market, while its influence on market returns demonstrated volatility in the short term. According to the results of variance decomposition, fintech contributes up to 98% and 93% to the size and returns of the art market in the long-term, respectively. The statistical results strongly support the importance of fintech in driving the expansion and profitability of the art market, favoring the main hypothesis that fintech significantly enhances both the size and profitability of the art market.
4. Discussion
The findings from this study provide compelling evidence on the profound impact of financial technologies, particularly blockchain and non-fungible tokens (NFTs), on the art market. These technologies significantly enhance market transparency and liquidity, reduce entry barriers, and improve risk management and copyright protection. Our results are consistent with existing literature, further substantiating the transformative potential of fintech in the art market.
Our findings align with previous studies, such as those by Korteweg, Kräussl, and Verwijmeren (2012), which highlighted the economic gains and risk reduction from long-term art investments[3]. Serota (2017) supported art pricing influenced by fintech[4], while Xiang (2018) and Zhukova et al. (2019) confirmed fintech’s role in market expansion and risk assessment[5,6]. Schwiderowski et al. (2023) and Fernandes and Afonso (2020) noted the transformative effects of NFTs on business models, which is consistent with our findings[7,8]. Additionally, Wieprow (2021) and Franceschet (2021) emphasized blockchain’s role in enhancing market efficiency and accessibility[8,9].
4.1. Interpretation of Results
Blockchain technology and smart contracts significantly enhance transparency and security, boosting investor confidence and market participation. The tokenization of artworks allows for the division of high-value assets into smaller, accessible shares, broadening the investor base and improving liquidity. Digital trading platforms streamline transactions, reduce manual interventions, and enhance global market access, leading to improved efficiency and activity. Furthermore, the application of big data and artificial intelligence enhances risk management by providing real-time market tracking and portfolio optimization. These technologies secure investments and attract growing capital inflows, fostering market growth. Improved copyright protection inspires creativity, increases market supply, and promotes professionalization and standardization within the market.
4.2. Sustainability in the Art Market through Fintech
The integration of fintech, particularly blockchain and smart contracts, contributes significantly to the sustainability of the art market. By ensuring transparent and secure transactions, these technologies reduce the risk of fraud and enhance the integrity of the market, which is crucial for long-term stability. Tokenization not only democratizes art investment by allowing fractional ownership but also promotes a more sustainable investment model by enabling a broader base of investors to participate in the market.
Digital trading platforms and blockchain-based verification systems minimize the need for physical documentation and reduce the carbon footprint associated with traditional art transactions. This shift towards digital processes supports ecological sustainability by lowering the environmental impact of the art market.
Additionally, big data and artificial intelligence facilitate more informed decision-making and efficient resource allocation, which are essential for sustainable growth. These technologies provide valuable insights into market trends and risks, enabling better management of art assets and reducing financial uncertainties. The enhanced risk management capabilities attract sustained investment, ensuring continuous market growth and stability.
Improved copyright protection not only safeguards the rights of artists but also encourages the creation of new artworks. This protection fosters a thriving art ecosystem by ensuring that artists receive fair compensation for their work, thereby sustaining the supply of high-quality art in the market. The professionalization and standardization promoted by fintech lead to a more organized and resilient market structure, capable of adapting to future challenges and opportunities.
To sum up, fintech enhances the sustainability of the art market by promoting transparency, reducing environmental impact, improving risk management, and supporting the rights of artists. These advancements ensure a more robust and enduring market, aligning with the broader goals of sustainable development.
4.3. Limitations and Future Research Directions
The implications of our findings are substantial. For policymakers, understanding the mechanisms through which fintech improves market operations can inform strategies to leverage these technologies for market growth and stability. Enhanced transparency and reduced entry barriers encourage a more diverse group of investors, potentially leading to increased market size and improved investment returns.
While our study provides significant insights, it is not without limitations. The data used were sourced from a specific segment of the global art market, which may limit the generalizability of our findings. Future research should aim to include a more diverse dataset covering different types of artworks and markets to validate and extend our conclusions.
Future studies could explore the impact of fintech on traditional financial topics such as consumer behavior and pricing strategies within the art market. Additionally, examining regulatory issues in cross-border art transactions, particularly technological compatibility and implementation obstacles, would provide valuable insights. Further analysis of the specific applications of fintech in different types of artworks or segments of the art market will deepen our understanding of its impact.
Moreover, investigating how fintech contributes to the sustainability of the art market is essential. Research should focus on how blockchain and NFTs can enhance the longevity and ecological sustainability of art investments by reducing fraud, ensuring provenance, and facilitating more efficient transactions. Understanding the environmental impacts of digital art transactions and the potential for reducing the carbon footprint through fintech innovations could also be valuable areas of study.
In summary, the broader context of fintech’s application in the art market points towards significant improvements in market operations, investor participation, and sustainability. Future research should continue to explore these dimensions to fully harness the potential of fintech in fostering a robust and sustainable art market.
5. Conclusions
In conclusion, this study highlights the significant revolution fintech, particularly blockchain and NFTs, has brought to the art market. These cutting-edge technologies have not only expanded the market size but also played a crucial role in enhancing investment returns. By providing digital ownership verification and innovative mechanisms for artwork circulation and valuation, fintech introduces new vitality into the art market.
Fintech’s role in promoting the sustainable development of the art market is particularly noteworthy. Blockchain and NFTs improve transparency, reduce fraud, and enhance the efficiency of transactions, which collectively contribute to a more sustainable market environment. These technologies support the long-term viability of art investments by ensuring the integrity and authenticity of artworks, thereby fostering trust and stability in the market.
Continued exploration and optimization of these technologies are essential for motivating sustainable development and fostering global art culture exchange. Future research should focus on addressing existing issues and exploring new applications to further encourage innovation and prosperity in the art market. Additionally, studying the environmental impacts and sustainability benefits of fintech in the art market will provide deeper insights into its long-term viability and ecological footprint.
Author Contributions
Conceptualization, methodology, software, validation, formal analysis, investigation, resources, data curation, writing—original draft preparation, writing—review and editing, visualization, supervision, project administration, and funding acquisition were all performed by [Yijun Sheng]. All authors have read and agreed to the published version of the manuscript.
Funding
This research received no external funding
Institutional Review Board Statement
Not applicable.
Informed Consent Statement
Not applicable.
Data Availability Statement
Data Availability Statement The data supporting the findings of this study are derived from publicly available sources. The sources and access details for the datasets are as follows: Art Basel: The data can be accessed directly through the Art Basel website at https://www.artbasel.com/. This platform provides comprehensive insights and statistics on global art market trends. UBS: Financial and market data related to the art industry can be accessed at https://www.ubs.com/cn/en.html, where UBS publishes detailed reports and analyses. Bloomberg: Market data and analytics are available via Bloomberg at https://www.bloomberg.com/. Bloomberg offers extensive financial, economic, and investment information. Statista: Statistical data and market research findings are available athttps://www.statista.com/ , which provides detailed statistics on various industries, including the art market. NFTGo: Data on Non-Fungible Tokens (NFTs) and related market dynamics can be accessed at https://nftgo.io/, which tracks and analyzes NFT market trends and prices. ArtTactic: In-depth analysis and data on contemporary art market trends are available at https://arttactic.com/. ArtTactic offers specialized reports and market insights. OEC - The Observatory of Economic Complexity: Data on global trade, including cultural goods, can be accessed at https://oec.world/en, providing detailed economic complexity indices and trade statistics. These datasets were used under open access or are available for public use, subject to the terms and conditions of the respective sources. Researchers interested in accessing the same data for their studies should contact the websites directly or adhere to the public and open data policies provided by these organizations.
Acknowledgments
I extend my sincere gratitude to the distinguished professors and fellow students at Zhejiang Sci-Tech University whose insights and expertise significantly contributed to this study. I am also thankful for the comprehensive support and the utilization of the university’s facilities which were instrumental in the conduct of this research. Additionally, I would like to acknowledge the assistance provided by ChatGPT in the writing and refinement of this paper.
Conflicts of Interest
The author declares no potential conflicts of interest with respect to the research, authorship, and/or publication of this article.
Abbreviations
The following abbreviations are used in this manuscript:
| MDPI | Multidisciplinary Digital Publishing Institute |
| DOAJ | Directory of open access journals |
| TLA | Three letter acronym |
| LD | Linear dichroism |
| NTF | Non-Fungible Token |
| artmv | Art Market Volume |
| artrt | Art Market Returns |
| msci | MSCI World Index |
| uindex | US Dollar Index |
| bir | NFT Transaction Frequency |
| ptf | NFT Rotation Frequency |
| artntf | Art-Related NFT Sales Share |
| VAR | Vector Autoregression |
References
- Anshari, M.; Almunawar, M.N.; Masri, M.; Hamdan, M. Digital Marketplace and FinTech to Support Agriculture Sustainability. In Energy Procedia, Bevrani, H., Ed.; Proceedings of the 5th International Conference on Power and Energy Systems Engineering (CPESE 2018), Elsevier: Vol. 156, 2019, pp. 234–238.
- Coslor, E. Transparency in an opaque market: Evaluative frictions between "thick" valuation and "thin" price data in the art market. Accounting, Organizations and Society 2016, 50, 13–26.
- Korteweg, A.; Kräussl, R.; Verwijmeren, P. Does it pay to invest in art? A selection-corrected returns perspective. The Review of Financial Studies 2015, 29, 1007–1038.
- Serota, K.L. Art & Cultural Capital: The Economics of Art Investment; Doctoral dissertation, University; ProQuest Dissertations Publishing: 2017, 59297345.
- Xiang, A. Unlocking the Potential of Art Investment Vehicles. Yale Law Journal 2018, 127, 1698–1741.
- Zhukova, A.; Lakshina, V.; Leonova, L. Empirical Analysis of Investments on the Fine Art Market. In Proceedings of the Fourth Workshop on Computer Modelling in Decision Making (CMDM 2019), Atlantis Press: 2019, pp. 67–72.
- Schwiderowski, J.; Pedersen, A.B.; Jensen, J.K.; Beck, R. Value creation and capture in decentralized finance markets: Non-fungible tokens as a class of digital assets. Electronic Markets 2023, 33, 45.
- Wieprow, J. The Importance of Tokenization for the Development of The Art Investment Market. In Proceedings of the 35th International Business Information Management Association Conference, Soliman, K.S., Ed.; IBIMA: Seville, Spain, 2020, pp. 8405–8415.
- Franceschet, M. HITS hits art. Blockchain: Research and Applications 2021, 2, 100038.
- Hu, N.J.; Xu, P.; Wang, Y.; Su, Y.; Hao, L. Construction of Financial Information Education Platform Based on Information Technology. In Advances in Applied Science and Industrial Technology, International Forum on Materials Science and Industrial Technology (IFMSIT 2013), Scientific.Net: 2013, Vol. 798-799, pp. 603–607.
- Coslor, E. Wall streeting art: The construction of artwork as an alternative investment and the strange rules of the art market; Doctoral dissertation, University; ProQuest Dissertations Publishing: 2011, 55754262.
- Garay, U. Determinants of art prices and performance by movements: Long-run evidence from an emerging market. Journal of Business Research 2021, 127, 413–426.
- Fedderke, J.W.; Chen, T. Generalizing the "Masterpiece Effect" in fine art pricing: Quantile Hedonic regression results for the South African fine art market. Economic Modelling 2023, 124, 106301.
- Spaenjers, C.; Goetzmann, W.N.; Mamonova, E. The economics of aesthetics and record prices for art since 1701. Explorations in Economic History 2015, 57, 79–94.
- Alsultan, S.; Kourtis, A.; Markellos, R.N. Can we price beauty? Aesthetics and digital art markets. Economics Letters 2024, 235, 111572.
Figure 3.
Impulse Response Analysis of D.ntf on D.artmv
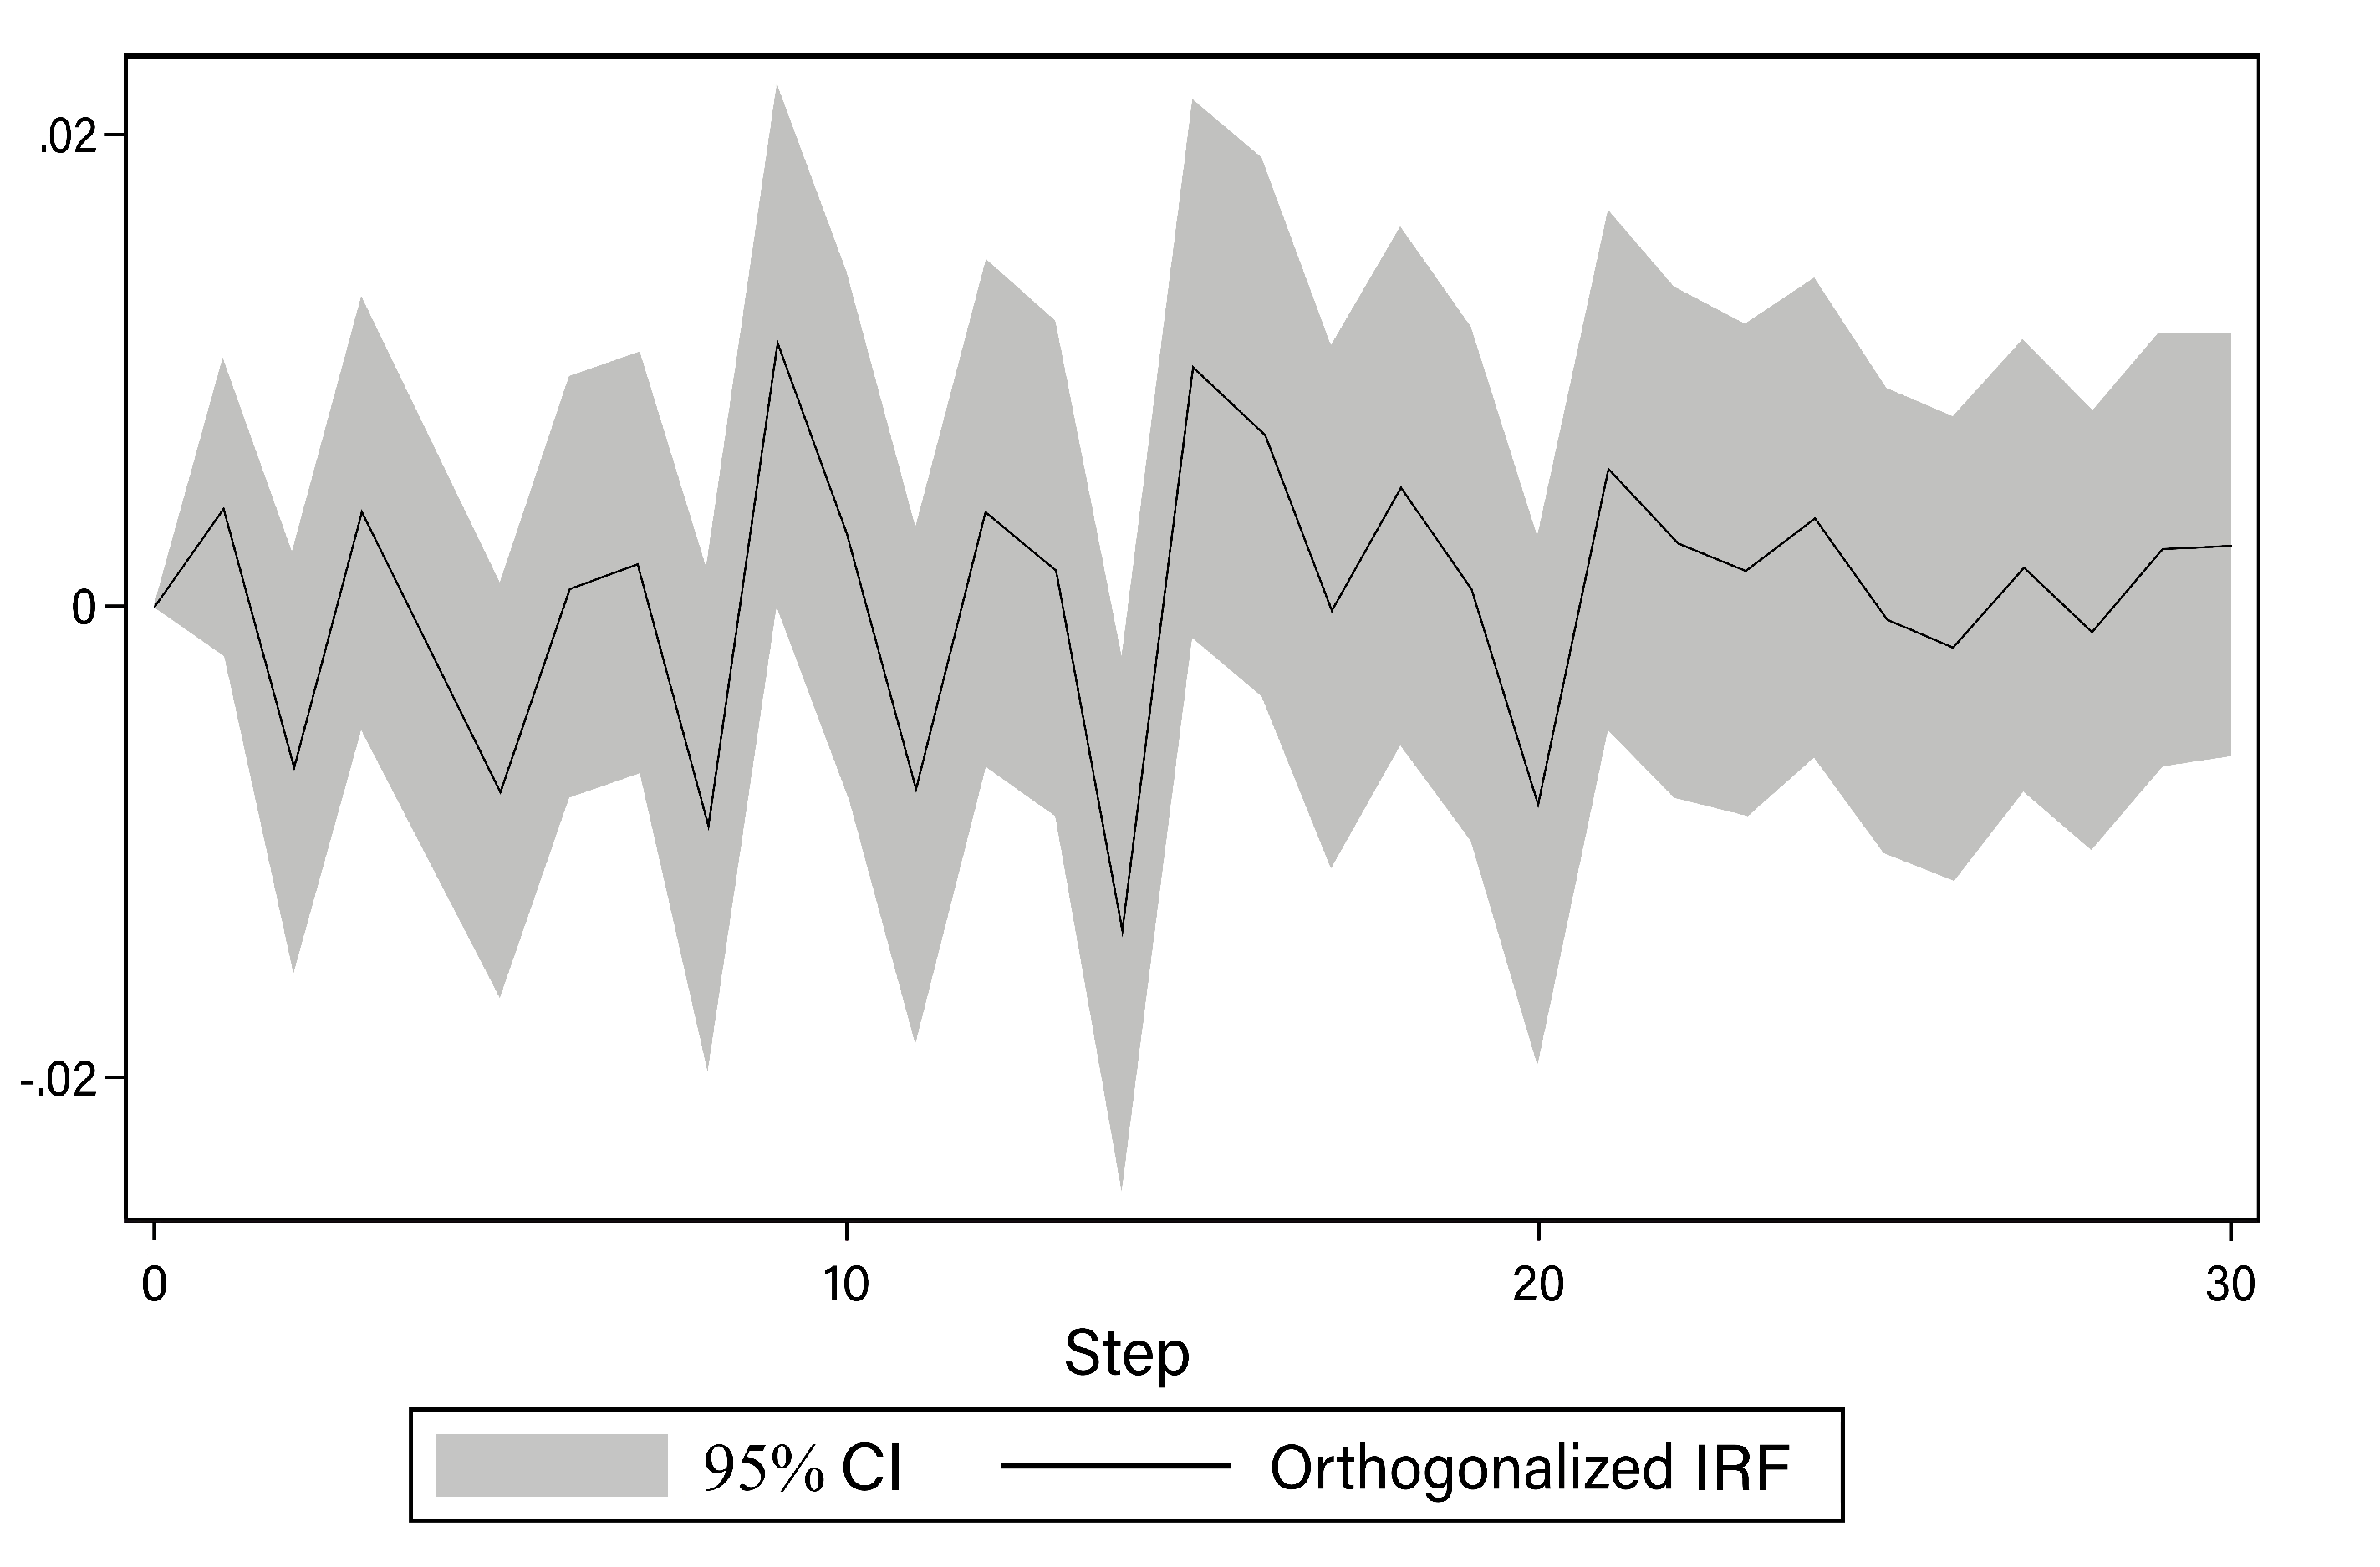
Figure 4.
Impulse Response Analysis of D.ntf on D.artrt
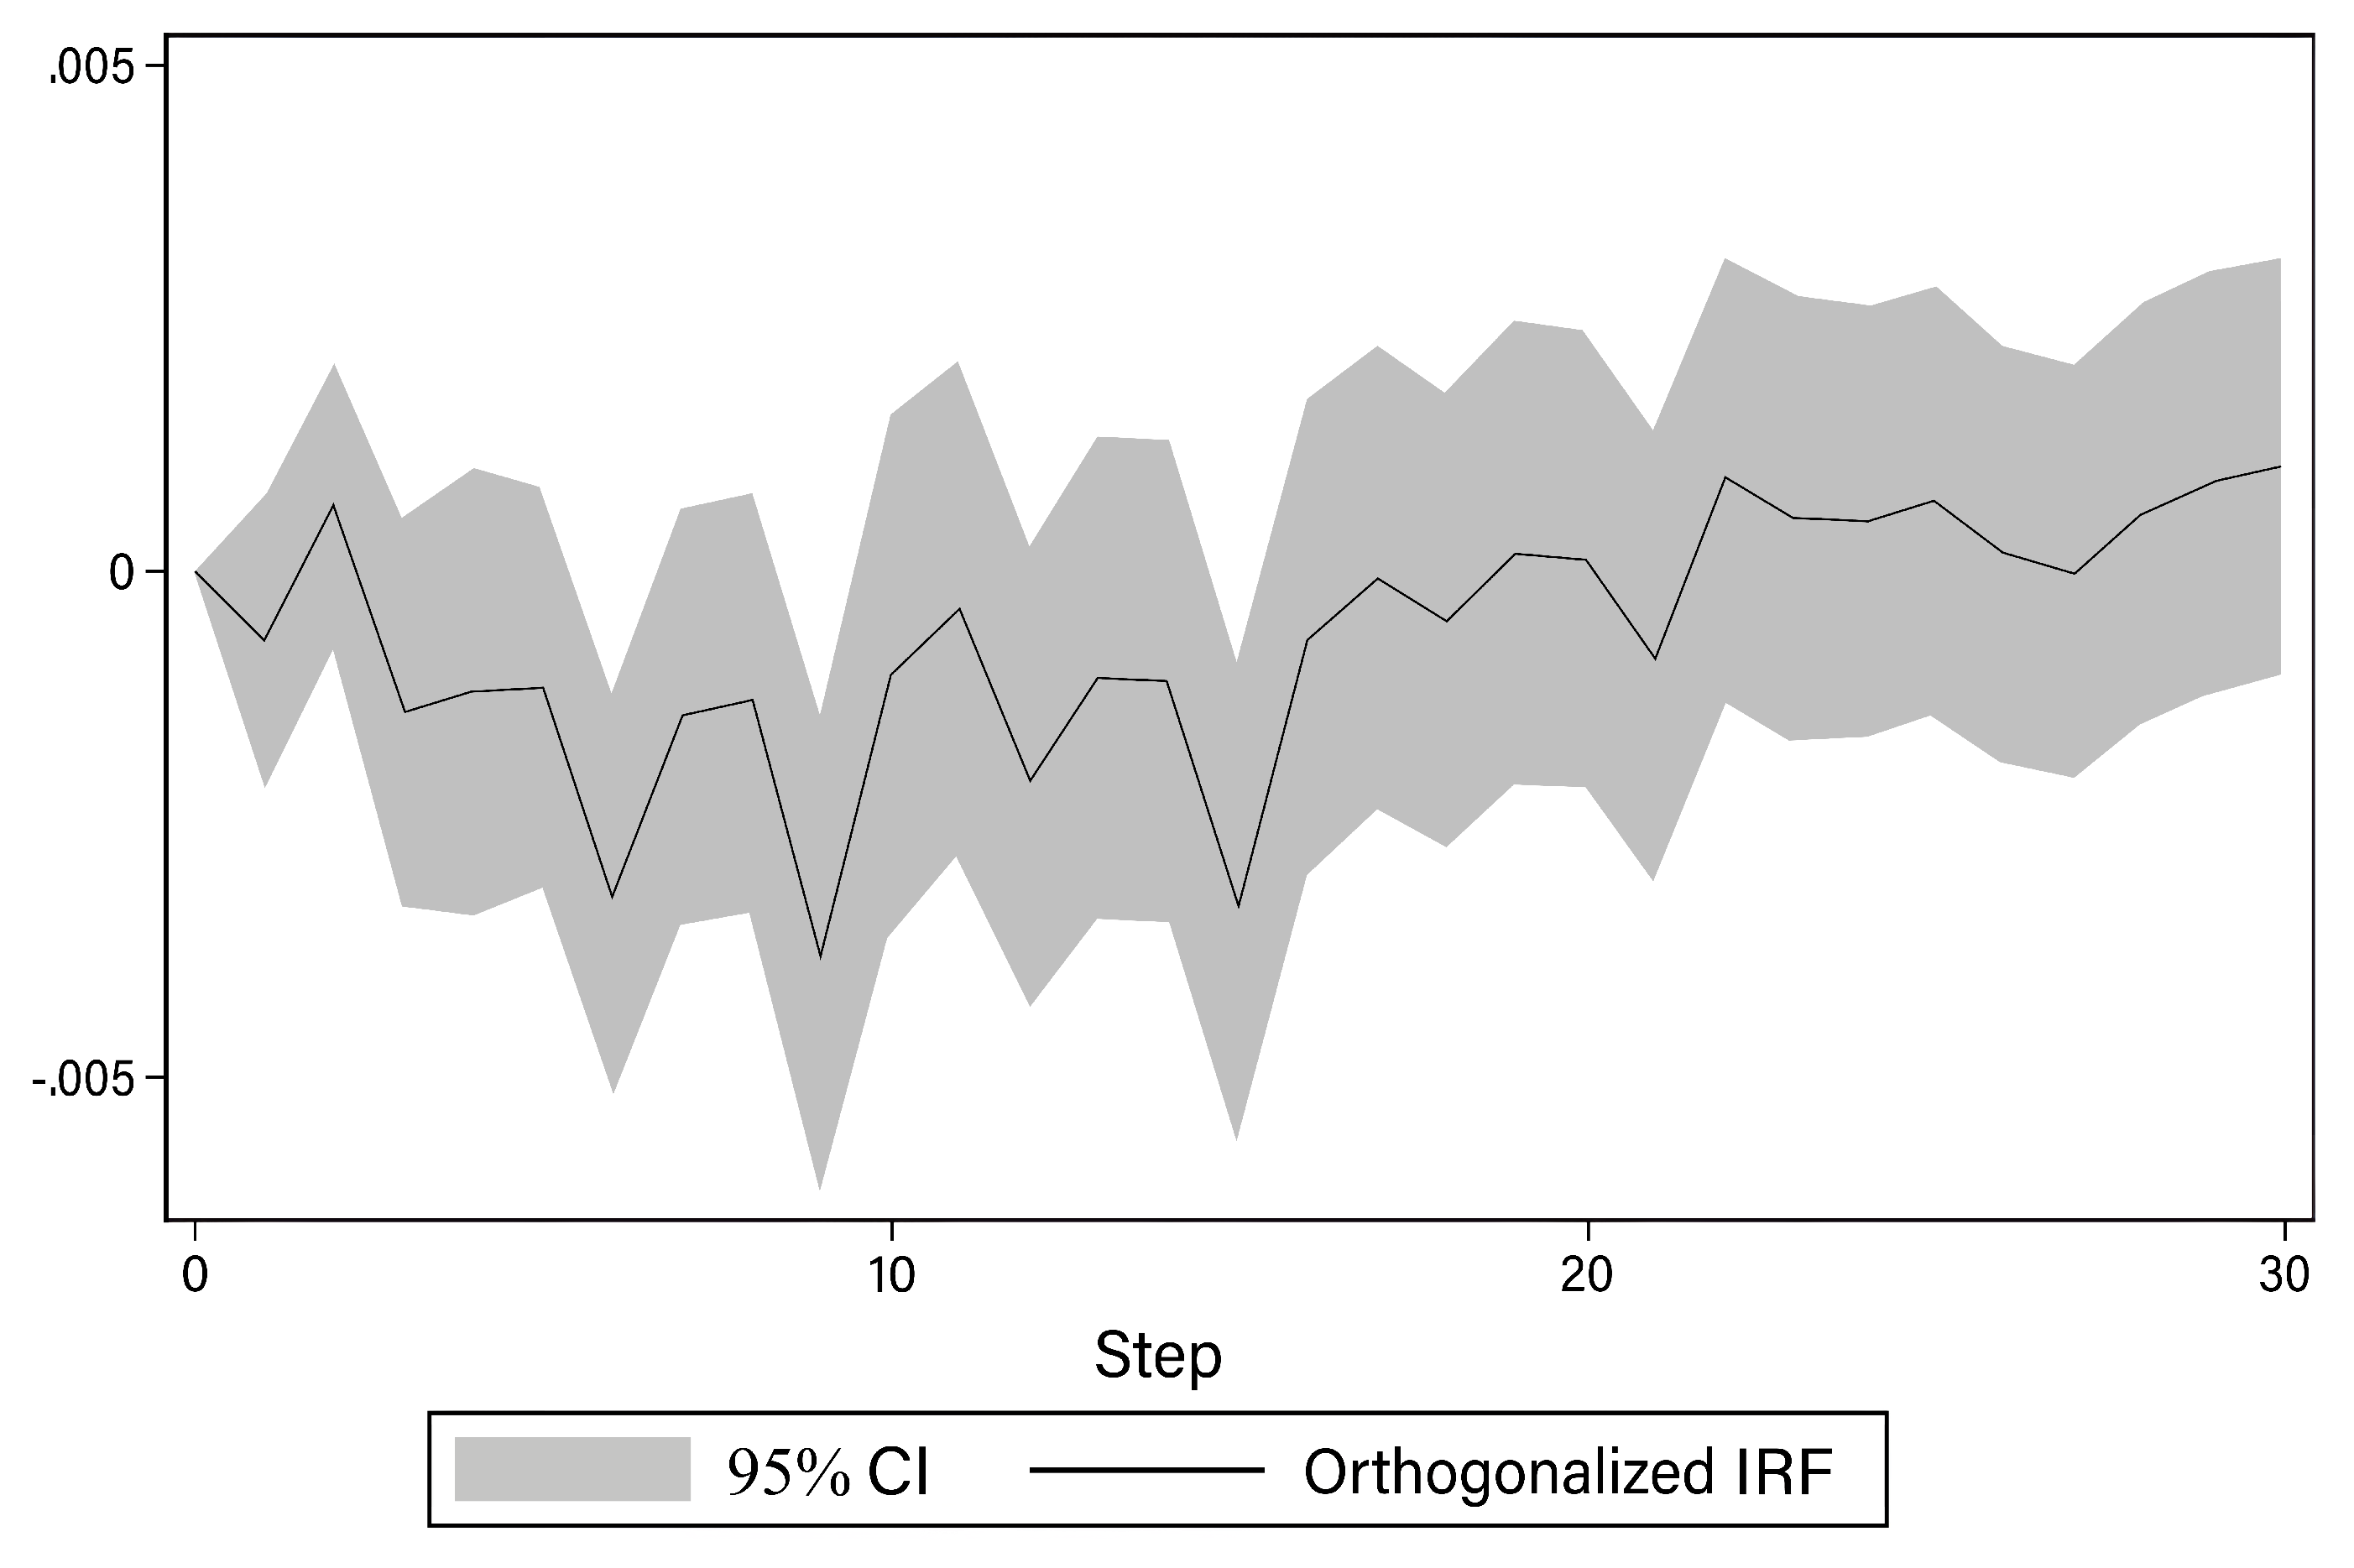
Table 2.
Granger Causality Test Table for Model 1
| Equation | Excluded | F | df | df_r | Prob > F |
|---|---|---|---|---|---|
| D_artmv | D_ntf | 11.514 | 6 | 8 | 0.0015 |
| D_ntf | D_artmv | 6.7734 | 6 | 8 | 0.0083 |
Table 3.
Granger Causality Test Table for Model 2
| Equation | Excluded | F | df | df_r | Prob > F |
|---|---|---|---|---|---|
| D_artrt | D_ntf | 12.782 | 6 | 8 | 0.001 |
| D_ntf | D_artrt | 15.838 | 6 | 8 | 0.0005 |
Table 4.
Results of Variance Decomposition
| Step | Model 1 fevd | Model 1 Lower | Model 1 Upper | Model 2 fevd | Model 2 Lower | Model 2 Upper |
|---|---|---|---|---|---|---|
| 0 | 0 | 0 | 0 | 0 | 0 | 0 |
| 1 | 0 | 0 | 0 | 0 | 0 | 0 |
| 2 | 0.008814 | -0.037122 | 0.054749 | 0.000284 | -0.007479 | 0.054749 |
| 3 | 0.013576 | -0.046155 | 0.073307 | 0.004914 | -0.025629 | 0.073307 |
| 4 | 0.701933 | 0.287456 | 1.11641 | 0.445293 | -0.340386 | 1.11641 |
| 5 | 0.760768 | 0.520256 | 1.00128 | 0.778304 | 0.497096 | 1.00128 |
| … | … | … | … | … | … | … |
| 17 | 0.941435 | 0.767872 | 1.115 | 0.934557 | 0.746682 | 1.115 |
| 18 | 0.936778 | 0.684227 | 1.18933 | 0.912319 | 0.716547 | 1.18933 |
| 19 | 0.966492 | 0.790863 | 1.14212 | 0.913593 | 0.735685 | 1.14212 |
| 20 | 0.981172 | 0.876006 | 1.08634 | 0.930141 | 0.73964 | 1.08634 |
Note: This table shows the results of variance decomposition for two models.
Disclaimer/Publisher’s Note: The statements, opinions and data contained in all publications are solely those of the individual author(s) and contributor(s) and not of MDPI and/or the editor(s). MDPI and/or the editor(s) disclaim responsibility for any injury to people or property resulting from any ideas, methods, instructions or products referred to in the content. |
© 2024 by the authors. Licensee MDPI, Basel, Switzerland. This article is an open access article distributed under the terms and conditions of the Creative Commons Attribution (CC BY) license (http://creativecommons.org/licenses/by/4.0/).
Copyright: This open access article is published under a Creative Commons CC BY 4.0 license, which permit the free download, distribution, and reuse, provided that the author and preprint are cited in any reuse.


