
Submitted:
24 May 2024
Posted:
27 May 2024
You are already at the latest version
Abstract
The application of the latest technological innovations has been promoted worldwide to increase farm productivity, including in salt farming. This research aims to determine the determinants of adoption decisions for salt production technology called geomembrane and estimate the adoption impact on technical efficiency. The data in this study is cross-sectional from 215 small-scale salt farmers on Madura Island, East Java, Indonesia. The data was analyzed using logistic regression to identify which factors influenced farmers’ decisions to use geomembrane. The influence of adoption on farmers' technical efficiency was then assessed using propensity score matching (PSM) and data envelopment analysis (DEA). The findings indicate that age and the dummy variables of gender, land ownership, profit-sharing involvement, and membership in the People's Salt Business Group (KUGAR) all had a significant impact on adoption rates. The findings of controlling matched samples using the PSM process reveal that geomembrane application improves and greatly increases farmers' technical efficiency. Those who used geomembranes displayed greater technical efficiency than those who did not. These findings imply that salt production technology should be promoted more to increase productivity, especially geomembrane adoption, through outreach and dissemination of information, including for landowners involved in the profit-sharing system.
Keywords:
geomembrane
; data envelopment analysis
; adoption of production technology
; propensity score matching
; small-scale solar saltworks
; Madurese coastal area
; Indonesia
1. Introduction
The chemical industry uses over 60% of the salt produced worldwide as a raw and auxiliary material [1]. In Indonesia, salt consumption by the industry constitutes 82.28% of the national salt production [2], whereas the remaining 11.72% is for household consumption.
Salt production through seawater evaporation produces low-quality salt that is impure and dirty and often contaminated with hazardous compounds to the chemical industry and foodstuffs. Sophisticated salt purification technology can remove impurities from salt crystals without losing a significant amount of salt in the process [1]. In any case, salt production using the evaporation method requires 100% sunlight intensity, low air humidity, low rainfall, a long dry season, and seawater that contains high salt content and is not mixed with water flow from fresh river estuaries [3,4,5]). According to Effendy et al. [6], traditional salt production directly on the ground requires 12-15 days, resulting in low-quality and opaque salt.
Sedivy [1] claims that with the aid of cutting-edge technologies in biological management, crystallization, harvesting, and salt processing, salt produced from evaporated saltwater can attain a 99.94% purity. However, the technology used in Madura is traditional (Figure 1). Smallholder farmers have different levels of access to agricultural resources and technological inputs [7,8,9,10]. Previous research results also show that farmers may not have the cash to finance technology adoption [11]. According to Mignouna et al. [12], the adoption process is also influenced by household size. When implementing modern technologies, households with larger family sizes can provide the labor needed at the beginning of the process. While Samiee et al. [13] found no significant or neutral association between farm size and adoption, Murage et al. [14] and Obiero et al. [15] found that farmers with larger acreage exhibit a beneficial influence on the adoption of new technology.
Geomembrane technology can improve the quantity and quality of salt produced by evaporation, as it redesigns salt ponds to become semi-intensive and waterproofs the crystallization ponds [16]. A geomembrane is an elastic and strong polymer sheet made of polyethylene with varying thicknesses that serves as a fluid barrier (Figure 2). Regular High-Density Polyethylene (HDPE) cannot be used as a geomembrane because it is too stiff and susceptible to cracking due to environmental stress. A better alternative is the lower-density version, namely Medium-Density Polyethylene (MDPE). The industry uses the term HDPE widely when, in fact, it is MDPE that has been used. MDPE offers various advantages, including being resistant to ultraviolet light and chemicals [17], preventing shrinkage of saltwater, which is the source material for salt, and speeding up the crystallization process, and making the resulting salt whiter and cleaner because it does not interact directly with the soil [6,18].
Susanto et al. [19] modified the conventional salt manufacturing method using a liner, increasing the quantity and quality of salt production in the Jepara Regency to 67% with the NaCl content from 90 to 98.4%. In several studies on the scale of demonstration plots in Sampang Regency, Madura, Arwiyah et al. [20] produced salt with a NaCl content of 88.96% in soil media. Meanwhile, geomembrane media produced a NaCl content of 95.72%, with land productivity increasing by 46%. Effendy et al. [6] stated that salt produced by geomembrane technology in Sumenep Regency was more coarse and translucently white, with a NaCl content of 94.72%, equivalent to first-quality salt. Meanwhile, salt produced using traditional methods is finer and more opaque-white, with a NaCl level of 81.78%, corresponding to the third grade of salt. Using a geomembrane will enhance this characteristic. as it prevents direct contact with the soil and prevents soil from reaching the surface of the crystallization pool during the salt collection process. In this case, salt that meets the national standard can be produced more, and dependence on imports can be reduced.
Besides the low production volumes, the low quality of products also drives salt imports in Indonesia. Technological interventions, such as using a geomembrane, can improve local salt quality produced traditionally by smallholder salt farmers. The expected outcome is better quality in terms of color (less opaque, equivalent to second and third quality) [3].
The application of geomembrane can boost production volumes and salt quality. Improving quality is essential as it will also result in higher profits. According to Balde et al. [21], high-quality salt has fewer impurities as they are prevented from accumulating during the crystallization process using lining. The price of high-quality salt per sack is higher, so salt farmers can earn a higher income. In fact, Susanto et al. [19] found that the price of salt produced with a geomembrane is higher by IDR 30 million per hectare than traditionally produced salt. The application of geomembrane increases the volumes and quality of salt, hence is expected to increase farmers’ income. Nonetheless, only approximately 50% of salt farmers in Madura have adopted geomembrane technology. Therefore, studying the factors influencing their decisions to adopt geomembranes is necessary. In several studies, salt farmers implementing geomembrane produce more than other production methods and may reduce production risks faced by salt farmers.
2. Materials and Methods
2.1. Research Data
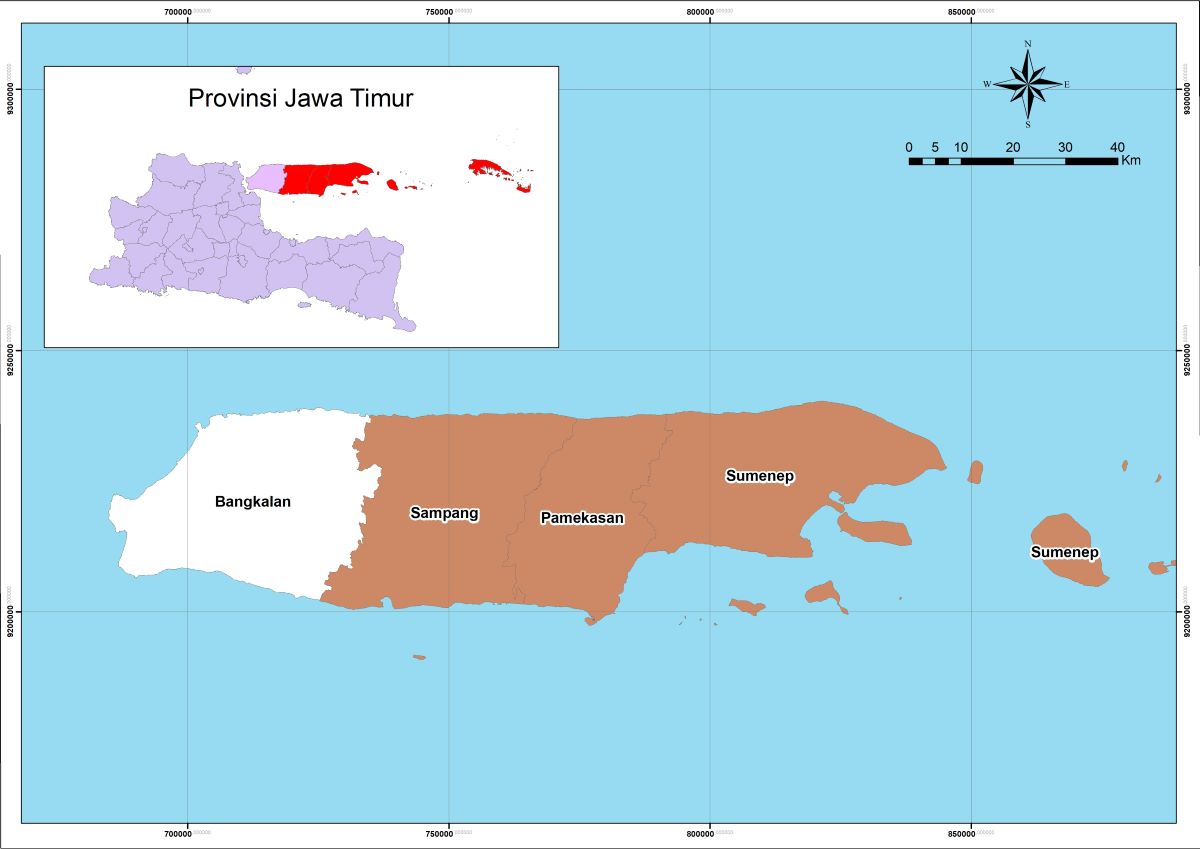
A multistage sampling procedure was used to determine the research locations. First, we purposefully selected East Java, Indonesia (Figure 3). Second, three districts were chosen depending on the quantity of salt produced: Sampang, Pamekasan, and Sumenep. Third, five districts were selected from the three regencies: Sreseh and Pangarengan in Sampang Regency, Pademawu and Galis in Pamekasan Regency, and Karanganyar in Sumenep Regency. These locations have the largest salt land area, production, and productivity, as well as the most salt business groups. Respondents included salt producers who used geomembrane as well as those who did not. Simple random sampling was used to determine the sample. In order to construct a sampling frame, we first compiled a list of all salt farmers. Next, 215 farmers were chosen at random from each of the five districts. The survey employed a structured questionnaire based on literature reviews and data from relevant institutions, such as government agencies and farmer groups. The questionnaire was tested in a trial with a group of farmers to ensure its understandability.
2.2. Data Analysis
Several efficiency measurements have been developed in Farrell’s [22] pioneering article. However, the Stochastic Frontier Analysis (SFA) and Data Envelopment Analysis (DEA) models have been shown to be useful in determining the technical efficiency of production units. The SFA model was developed by Aigner et al. [23] and Meeusen and Broeck [24], while Charnes et al. [25] proposed the DEA model. Since then, these two approaches have been widely used.
By calculating the leading production function of a group of decision-making units—in this case, salt farms—and assessing the technical efficiency of each farm individually, DEA is a linear programming technique that distinguishes between productive and inefficient farms. Farms categorized as "efficient" receive a score of zero. Next, using the Euclidian split between the input-output ratios of the frontier, the degree of technical inefficiency of the remaining farms is computed [26].
This study's efficiency analysis is restricted to technical efficiency. Efficiency measurements in the DEA model determine the relative efficiency of using production inputs rather than the average value. Land area, the number of harvests in a given season, land management, labour, water, and diesel fuel are the input variables. Meanwhile, the research output variable is the salt production volumes. The DEA efficiency approach is parametric and nonparametric. Inputs and outputs are collected linearly using weighting [27]. Therefore, the input that a farmer uses can be expressed as in Equations 1, 2, and 3 and is a linear sum of the weights of all inputs.
Version 2.1 of the Data Envelopment Analysis Programme (DEAP) was used to estimate the model. Equation 4 is used to compute the meta-frontier function derived from the DEA technique.
where bit is a vector of M x 1 outputs from the ith decision-making unit (DMU) in period t, and ait is a vector of N x 1 inputs from the ith UKE in period t. Bit is a vector of M x L outputs from the complete UKE. Ait is a vector with N x L inputs from the complete UKE, while λit is a weighting vector and Φit is a scalar.
This research also uses binary logistic and maximum likelihood estimator (MLE) methods [28]. Equation 5 captures the factors influencing the decision to adopt a geomembrane.
 where:
Li = Logarithmic equations
Pi = Possibility to adopt geomembrane
(1-Pi) = Possibility not to adopt geomembrane
Zi = Salt farmer’s decision
γ0 = Intercept
γi = Parameter variable Xi
X1 = Salt farmer’s age (years)
X2 = Salt farmer’s farming experience (years)
X3 = Salt farmer’s final education
X4 = Number of family members
X5 = Dummy gender
X6 = Dummy profit-sharing system
X7 = Dummy land ownership
X8 = Dummy mobile phone ownership
X9 = Dummy Internet access
X10 = Dummy participation in the people’s salt business group (KUGAR)
X11 = Dummy existence of demonstration plots
X12 = Dummy assistance
The elements that influence the decision to use a geomembrane are based on theory and empirical evidence from Prihantini et al. [29], Abdulai et al. [30], and Ariyani [31].
The interpretation commonly used in logistic regression models is the odds ratio, which describes the relationship between categorical variables. The odds ratio of salt farmers who did not adopt (y=0) is defined as π1/((1-π1)). Meanwhile, the odds value for salt farmers who adopt (y=1) is defined as π2/((1-π2)) . The odd ratio value is a comparison of the odd for y=0 and the odd for y=1. Prihantini et al. [5] shows the equality of the odd ratio value in Equation 6.
After calculating the propensity score matching, matching groups can be determined using matching techniques, which include nearest-neighbor, caliper, stratified, and kernel-based matching techniques. In this study, adopters and non-adopters are grouped using the nearest-neighbor method, which is based on research by Qu et al. [32]. The technical effectiveness of the adopter and non-adopter groups was then contrasted [33], [34], [35].
Furthermore, this study estimates the influence of geomembrane adoption using PSM. The PSM approach, in general, compares outcome variables from matching respondents in treatment and control groups to determine the assessment impact of a program. In this study, farmers who used geomembrane as a treatment group are compared to those who did not. Propensity scores, or farmers' likelihood of implementing geomembrane, are used in PSM to construct comparable respondents. The treatment effect is estimated by comparing outcomes between adopter and non-adopter farmers. It should be noted that outcome variables should only be compared between groups after matching and evaluating the balance quality between the two groups. To estimate the effect of adopting geomembranes on technical efficiency, the average treatment on the treated (ATT) can be calculated using Equation 7 [36].
where ATT is the impact difference calculated from the outcome variable (technical efficiency), estimated from the technical efficiency of salt farming households that adopted geomembranes, namely E [Y1i|Di = 1] minus traditional farming households (that did not adopt) E [Y0i|Di = 0]. The area where the distribution of trend values between the adopter and non-adopter farmers overlaps is called the common support area. The impact cannot be precisely calculated if farmers in the adapter group possess a mix of traits that differ from those in the non-adopter group.
ATT=E (Y1|D = 1) – E (Y0|D = 1)
Since there is evidence that smallholder salt businesses that applied geomembranes experienced increased production, quality, and welfare, this study examines the impact the technology adoption on salt farmers’ technical efficiency. The question is whether there is a fundamental difference in the efficiency of salt farmers who adopted and those who did not.
3. Results
3.1. Description of Research Variables
Research variables were described by looking at the mean value and standard deviation. Table 1 displays the outcomes of the variable description. The average age was 48.53, they had 19.17 years of experience, and they had three family members on average. Table 1 also shows that the farmer’s final education averages 1.58, indicating that most of them did not finish elementary school.
The average value of gender and the dummy variables of profit sharing, KUGAR participation, mobile phone ownership, and assistance > 0.5. This means that most salt farmers were male, participated in the profit-sharing system and KUGAR, had a mobile phone and never received assistance. The average dummy value for land ownership, Internet access, demonstration plot, and capital source is <0.5, indicating that most salt farmers owned their land, did not have access to the Internet, lacked a demonstration plot, and were self-funded.
Next, the average land area the farmers owned was 10,179.35 m2 (equal to 1.0179 Ha), with an average amount of salt production of 94.97 tons per season. The number of harvest frequencies in one season was 13.2 ≈ 13 times. The average volume of water was 4,282,842 m2. The percentage of bozem was 16.79%. The percentage of minihan was 54.98%. The percentage of table salt or table crystallization was 28.23%. The average number of workers during the farming season was 133.71. The average diesel fuel used was 306.48 liters in one salt season. The average value of geomembrane adoption was 0.827>0.5, indicating that most salt farmers decided to adopt geomembrane, with an average technical efficiency of 0.808.
3.2. Mean Differences of Research Variables
Table 2 summarizes the differences in mean variables in this study. The survey shows that 178 farmers adopted geomembrane, while 37 did not. The variable mean difference test estimates the propensity score in a sample, whether matching or not.
The descriptive analysis in Table 2 shows that the unmatched samples (the adopter and non-adopter groups) exhibit significant differences (at the 10% level) in the variables of age, experience running a salt farm, number of family members, and the dummy variables of participation in a profit-sharing system and KUGAR. Meanwhile, in the matched samples, all variables between adopter and non-adopter groups are significantly different (at the 1 and 5% real level).
Based on the descriptive analysis in Table 3, the unmatched samples show that the adopter and non-adopter groups exhibit significant differences in the use of water during salt production. Meanwhile, in the matched samples, the inputs with significant differences are harvest frequency, bozem percentage, and minian percentage.
3.3. Determinants of Adoption of Geomembrane as A Production Technology
The logistic regression analysis shows that seven of the twelve independent variables had a significant and positive influence on the adoption decision. First, regarding age, the older the salt farmer, the more likely they are to adopt the latest technology, with an OR value of 0.905. Thus, the likelihood of adoption is 0.905 times higher for older salt farmers compared to younger farmers. This might be explained by their experience, which has led them to alter their production techniques or patterns.
A farmer's likelihood of adopting is inversely correlated with the number of family members; that is, the more family members, the lower the probability of adoption. The probability of deploying geomembrane drops by 15.64% if the average number of family members increases by one, according to the OR value of 1.546. Therefore, farmers who have smaller families are more likely to adopt. These results are consistent with the research results of Ariyani et al. [37], which state that the number of family members has a negative effect on the decision to adopt geomembrane. Similarly, Rosanti et al.'s [38] research demonstrated that having a larger family had a negative impact, increasing the likelihood of adoption in households with fewer family members. Additionally, Fahad et al. [39] demonstrate that crop insurance is less likely to be purchased by households with a larger family size.
Gender also significantly influences this model. The OR value of 4.851 means that male salt farmers adopt 4.581 times more than female salt farmers. This may be attributable to the higher enthusiasm and curiosity among male farmers, which drives the willingness to adopt.
The dummy profit-sharing system also has an influence on adoption decisions. The OR value of 0.054 indicates that salt farmers involved in a profit-sharing system have a 5.4% higher chance of adoption than those not involved in a profit-sharing system. On average, salt land cultivated in Indonesia is tied to a profit-sharing system. As a result, the views and choices of the landowner also affect adoption decisions. The greater willingness and motivation to adopt geomembrane technology among farmers with a profit-sharing system may be due to the influence of the land owners who support geomembrane technology.
Additionally, Table 4 demonstrates that, at the 5% significance level, land ownership has a favorable and significant impact on farmers' decisions to use geomembrane technology. Salt farmers who rent their land and implement a profit-sharing plan are 3.745 times more likely to adopt than those who own their own land, according to the OR value of this variable, which stands at 3.745. According to Ramirez [40] and Nurwahyuni et al. [41], farmers' decisions to utilize technology are correlated with their land status since it facilitates simpler decision-making.
The dummy variable for participation in the People’s Salt Business Group (KUGAR) has a real and positive influence on salt farmers’ decisions to adopt geomembranes. The OR value of 9.846 means that salt farmers who are members of KUGAR have a 9.846 times greater chance to adopt than non-members. By participating in KUGAR, salt farmers can receive counseling and information regarding the latest, efficient, and profitable salt production technology. Salt farmers who are members of KUGAR tend to have a higher willingness to adopt, which suggests that the counseling provided by the Maritime and Fisheries Service Extension Service has a significant impact on salt farmers’ decision-making.
The dummy of whether there are demonstration plots inside and outside the village has a significant influence. This variable has an OR value of 1.818, indicating that the salt farmers who have seen geomembrane production practices on the demonstration plot have a 1.818 times greater chance of adoption than those who have not. Based on the interview results with respondents, they were initially reluctant to switch to a production method using geomembrane until the Department of Trade, the Department of Maritime Affairs and Fisheries, and PT Garam provided a demonstration plot. Initially, they insisted on the old production method, but because of the promising production results using geomembrane, the salt farmers were willing to adopt.
3.4. Distribution of Technical Efficiency Scores
The estimated technical efficiency for small-scale salt farmers ranges from 18.2 to 100%, with an average of 80.9%. This indicates there is a significant opportunity to enhance salt output by up to 19.1% without expanding the number of existing input variables. Apart from that, around 60.11% of salt farmers have a technical efficiency score above 0.70, while the remainder, 39.89% of respondents, have a score below 0.70. The research area's average technical efficiency falls into the same range of values as Ariyani's [31], showing an average technical efficiency of 77.22 and 93.10% for traditional (non-adopter) salt production and geomembrane (adopter) on Madura Island, measured using stochastics.
For adopter farmers and non-adopter farmers, the average technical efficiency estimates are 0.911 and 0.698, respectively. Table 5 shows that the research area's average technical efficiency for farmers is 0.809, with a standard deviation of 0.222. With a technical efficiency score above 0.70, the adopter group’s technical efficiency is high (89.33%) compared to the non-adopter group (43.24%). This indicates the need to increase efficiency among the non-adopters.
3.5. Impact of Adopting Geomembranes on Technical Efficiency
Table 6 shows that the adoption of geomembranes has affected pooled technical efficiency, with a difference of 0.301 observed before matching. After matching, there is a difference of 0.271. This shows that the adoption of geomembrane can increase technical efficiency. The asterisk shows the before and after matching, demonstrating a considerable variation in efficiency between those who adopted geomembranes and those who did not. Likewise, the impact of geomembrane adoption on separated technical efficiency is seen in a difference of 0.287 before matching. After matching, there is a difference of 0.269, which shows that the adoption of geomembrane can increase technical efficiency. The asterisk shows the before and after matching, indicating a considerable variation in efficiency between those who adopted geomembranes and those who did not.
The results of this study generally support those of earlier studies by Rahman et al. [42], Mwalupaso et al. [43] which examined the differences in technical efficiency scores between superior and conventional types. According to their research, superior cultivars outperformed traditional types in terms of technical efficiency scores. According to Abdul-Rahaman‘s research [44], farmers in Ghana who embraced high-yielding rice varieties had a 24% increase in technical efficiency compared to those who did not. Better varieties allow farmers to enhance agricultural inputs, like labour and management time [45]. They can thereby raise the effectiveness of farming activities. The results of this study confirm those of earlier studies that found improved varieties had a beneficial effect on food security [46,47], poverty reduction [48,49,50], and household income [51].
Bulleted lists look like this:
4. Conclusions
This study uses cross-sectional data from 215 individuals to evaluate the effect of implementing the newest technology for producing salt, specifically geomembranes, on the technical efficiency of small-scale salt producers in East Java, Indonesia. Two methods were used to determine factors influencing technology adoption decisions in the first part. Based on the logistic regression results, the variables age, gender, and the dummy variables of profit sharing, land ownership, and participation in the people’s salt business group (KUGAR) have a significant effect. Meanwhile, in the second method using probit regression analysis, the influencing factors are the dummy variables of the profit-sharing system and land ownership.
Next, we estimate the technical efficiency score for each farming unit using data envelopment analysis (DEA). Propensity score matching assesses how adopting geomembrane technology may affect salt farmers' technical efficiency. This study offers important insights into the effectiveness of geomembrane technology and how it affects smallholder salt enterprises in Indonesia.
An intriguing conclusion drawn from this study is that farmers' technical efficiency is positively and considerably impacted by the implementation of geomembrane technology. Geomembrane should continue to be adopted to increase productivity and support domestic salt demand. Policy steps that encourage salt farmers to adopt geomembranes are essential to fulfill national salt production. Farmers can receive training to broaden their understanding of the usage of geomembranes, especially from governments and extension agents. Furthermore, in light of the research findings, we recommend enhancing agricultural organizations to better serve farmers' requirements in their farming endeavors, particularly with regard to implementing geomembrane technology. Examples of these organizations include the People's Salt Business Group (KUGAR), salt cooperatives, and financial institutions. Based on the logistic regression analysis, seven variables significantly influence geomembrane adoption decisions. In particular, the dummy variables of profit sharing and land ownership also have a significant effect, which means that the existence of land owners greatly influences farmers’ decisions. As such, the government also needs to pay attention to this matter. Socialization regarding the adoption of geomembrane technology should not only focus on farmers but also land owners who are involved in the revenue-sharing system.
Author Contributions
Conceptualization, C.I.P. and N.H.; methodology, C.I.P. and SYA.; software, C.I.P. and R.A.; validation, N.H., R.A., and C.I.P..; formal analysis, C.I.P.; investigation, C.I.P.; resources, C.I.P. and R.A.; data curation, R.A.; writing—original draft preparation, C.I.P.; writing—review and editing, C.I.P. and SYA.; visualization, C.I.P. and R.A..; supervision, N.H., SYA., and R.A.; project administration, C.I.P.; funding acquisition, C.I.P. All authors have read and agreed to the published version of the manuscript.
Funding
Acknowledgments are expressed to the Centre for the Higher Education Funding (BPPT) and the Education Fund Management Agency (LPDP) through the Indonesia Education Scholarship (BPI) by the Ministry of Education, Culture, Research and Technology (Kemendikbudristek) with ID Awardee 202209091346.
Informed Consent Statement
Not applicable.
Data Availability Statement
Data will be made available on request.
Acknowledgments
Many thanks go to the participants for providing their written informed consent to participate in this study
Conflicts of Interest
The authors declare no conflicts of interest.
References
- Sedivy, V.M. Environmental balance of salt production speaks in favour of solar saltworks. Global NEST Journal. 2009, 11, 41–48. [Google Scholar] [CrossRef]
- Ministry of Industry of the Republic of Indonesia. Industrial Salt Needs Soared 76.19% in 2018. Ministry of Industry of the Republic of Indonesia, Indonesia, 2018. Retrieved from https://kemenperin.go.id/.
- Adi, T. R., Supangat, A., Sulistiyo, B., Muljo, B., Amarullah, H., Prihadi, T. H., … Rustam, A. Salt and Artemia Integrated Business Development Guidebook. Jakarta (ID): Center for Research on Marine Areas and Non-Biological Resources, Marine and Fisheries Research Agency, Department of Maritime Affairs and Fisheries, Indonesia, 2006.
- Ihsannudin, I. & Pinuji, S. Empowering Land for People's Salt Farmers. Bangkalan (ID): UTM Press, 2020.
- Prihantini, C.I., Hanani, N., Asmara, R., & Syafrial.. The Relationship between the Sharecropping System, Informal Credit, and Productivity: The Empirical Evidence from the Madurese Traditional Solar Salt Business. ECSOFiM: Economic and Social of Fisheries and Marine Journal. 2024, 11, 02, 277-291. http://ecsofim.ub.ac.id/.
- Effendy, M., Zainuri, M., & Hafiludin. Intensification of people's salt fields in Sumenep district. In Presentation of the Marine Science Study Program for Madura Maritime. Bangkalan (ID): UTM Press, 2014.
- Mather, D. , Boughton, D., & Jayne, T.S. Explaining smallholder maize marketing in southern and eastern Africa: The roles of market access, technology and household resource endowments. Food Policy, 2013; 43, 248–266. [Google Scholar] [CrossRef]
- Wani, S.P. , Chander, G., & Sahrawat, K.L. Science-led interventions in integrated watersheds to improve smallholders’ livelihoods. NJAS–Wageningen Journal of Life Sciences, 2014; 70, 71–77. [Google Scholar] [CrossRef]
- Prihantini, C.I. , Syaukat, Y., & Fariyanti, A. Comparison of Profit at Different Sharecropping System in Traditional Salt Production in Pamekasan Regency, East Java. Jurnal Sosial Ekonomi Kelautan dan Perikanan, 2017; 12, 63–76. [Google Scholar] [CrossRef]
- Prihantini, C.I. ., Syaukat, Y., & Fariyanti, A. Comparison of Sharecropping System Salt Production Busineess in Pamekasan Regency, East Java. Jurnal Kebijakan Sosial Ekonomi Kelautan Dan Perikanan, 2017; 7, 77–90. [Google Scholar] [CrossRef]
- Abdulai, A. & Huffman, W.E. The Diffusion of New Agricultural Technologies: The Case of Crossbred-Cow Technology in Tanzania. Agricultural & Applied Economics Association. 2019; 87, 3, 645–659. [Google Scholar] [CrossRef]
- Mignouna, D.B. , Manyong, V.M., Rusike, J., Mutabazi, K.D.S., & Senkondo, E.M. Determinants of adopting imazapyr-resistant maize technologies and its impact on household income in Western Kenya. AgBioForum, /: 3, 158–163. https, 4462; 3. [Google Scholar]
- Samiee, A. , Rezvanfar, A., & Faham, E. Factors influencing the adoption of integrated pest management (IPM) by wheat growers in Varamin county, Iran. African Journal of Agricultural Research. 2009; 4, 5, 491–497. [Google Scholar]
- Murage, F. , Mugwe, J., Ngetich, K., Mucheru-Muna, M., & Mugendi, D. Adoption of Soybean by Smallholder Farmers in the Central Highlands of Kenya. African Journal of Agricultural Economics and Rural Development. 2019, 7, 5, 1–12. [Google Scholar]
- Obiero, K.O. , Waidbacher, H., Nyawanda, B.O., Munguti, J.M., Manyala, J.O., KaundaArara, B. Predicting uptake of aquaculture technologies among smallholder fish farmers in Kenya. Aquaculture International. 2019, 27, 1689–1707. [Google Scholar] [CrossRef]
- 16. Tegal Regency Fisheries Training and Extension Center [BPPP]. Making People's Salt Using Geomembrane Technology, Tegal Regency Fisheries Training and Extension Center, Indonesia. 2017.
- Scheirs, J. A Guide to Polymeric Geomembranes. John Wiley & Sons, Ltd. 2009. [CrossRef]
- Suhendra, A. Increasing the Productivity of Salt through HDPE Geomembrane — Indonesian Case History in Salt Evaporation Pond. Electronic Journal of Geotechnical Engineering, 2016, 21, 4273-4280.
- Susanto, H. , Rokhati, N., & Santosa, G.W. Development of Traditional Salt Production Process for Improving Product Quantity and Quality in Jepara District, Central Java, Indonesia. Procedia Environmental Sciences. Elsevier B.V. 2015, 175-178. [CrossRef]
- 20. Arwiyah, Zainuri, M., & Efendy, M. Study of Nacl Content in Raw Water and Their Salt Production and Productivity Using Different Table Salt Land. Jurnal Kelautan: Indonesian Journal of Marine Science and Technology, 2015, 8, 1, 1-9. [CrossRef]
- Balde, B.S. , Kobayashi, H., Nohmi, M., Ishida, A., Matsumura, I., Esham, M., & Tolno, E. Socio-economic Analysis of Small-scale Salt Production Techniques in the Coastal Area of Guinea: as an Alternative for Improving Livelihood Status and Sustainable Mangrove Forest Management. International Journal of Research in Engineering, IT and Social Sciences, 2013, 3, 9.
- Farrell, M. The Measurement of Productive Efficiency. Journal of the Royal Statistical Society. 1957, 120, 253–290. [Google Scholar] [CrossRef]
- Aigner, D. , Lovell, C. A. K., & Schmidt, P. Formulation and estimation of stochastic frontier production function models. Journal of Econometrics, 1977, 6, 21-37. [CrossRef]
- Meeusen, W. , & Broeck, V. D. Efficiency estimation from Cobb-Douglas production functions with composed error. International Economic Review, 1977, 18, 2, 435-444. [CrossRef]
- Charnes, A. , Cooper, W.W., & Rhodes, E. Measuring the efficiency of decision making units. Eur. J. Oper. Res. 1978, 2, 429–444. [Google Scholar]
- Coelli, T., Rao, P. and Battese, G.E. An Introduction to Efficiency and Productivity analysis. Massachusetts: Kluwer Academic Publishers, 1998.
- Ramanathan, R. An Introduction to data envelopment analysis: A tool for performance measurement. SAGE Publications, New Delhi, 2003. [CrossRef]
- Gujarati, D. N. Basic Econometrics. 4th Edition. McGraw-Hill, 2003.
- Prihantini, C.I. Profit Sharing Pattern for People’s Salt Business in Pamekasan Regency, East Java. [Thesis]. IPB University, 2016.
- Abdulai, S. , Zakariah, A., & Donkoh, S. A. Adoption of rice cultivation technologies and its effect on technical efficiency in Sagnarigu District of Ghana. Cogent Food & Agriculture, 2018, 4, 1424296. [CrossRef]
- Ariyani, A.H.M. , Harianto, Suharno, & Syaukat, Y. Factors Affecting Technology Adoption of Geoisolator on Solar Saltworks in East Java Province. AGRIEKONOMIKA. 2021, 9, 1. [Google Scholar] [CrossRef]
- Qu, R. , Wu, Y., Chen, J., Jones, G. D., Li, W., Jin, S., & Li, Z. Effects of agricultural cooperative society on farmers’ technical efficiency: Evidence from stochastic frontier analysis. Sustainability, 2020, 12, 19, 1-13. [CrossRef]
- Ma, W. , Renwick, A., Yuan, P., & Ratna, N. Agricultural cooperative membership and technical efficiency of apple farmers in China: An analysis accounting for selectivity bias. Food Policy, 2018, 81, 122-132. [CrossRef]
- Rahman, M.S. , Toiba, H., & Huang, W.-C. The impact of climate change adaptation strategies on income and food security: Empirical evidence from small-scale fishers in Indonesia. Sustainability, 2021, 13, 1-16. [CrossRef]
- 35. Syafrial, Toiba, H., Rahman, M.S., & Retnoningsih, D. The Effects of Improved Cassava Variety Adoption on Farmers’ Technical Efficiency in Indonesia. Asian Journal of Agriculture and Rural Development, 2021, 11, 4, 269-278. [CrossRef]
- Nabasirye, M. , Kiiza, B., & Omiat, G. Evaluating the impact of adoption of improved maize varieties on yield in Uganda: A propensity score matching approach. Journal of Agricultural Science and Technology, 2012, B, 4, 368-377.
- Ariyani, A.H.M., Harianto, H., Suharno, S., & Syaukat, Y. Impact of Application of Geoisolator in Saltworks Business in East Java Province: A Propensity Score Matching Approach. International Journal of Progressive Sciences and Technologies (IJPSAT). 2020, 22, 1, 40–47.
- 38. Rosanti, N, Sinaga, BM, Daryanto, A, & Kariyasa, K. Determinants of Farmer’s Participation in Contract Farming: Case Study of Coffee Farmers in Lampung. Jurnal Ekonomi Pertanian dan Agribsinis (JEPA), 2019, 3, 4, 853-863. [CrossRef]
- Fahad, S. , Wang, J., Hu, G., Wang, H., Yang, X., Shah, A.A., Huong, N.T.L., & Bilal, A. Empirical analysis of factors influencing farmers crop insurance decisions in Pakistan: Evidence from Khyber Pakhtunkhwa province. Land Use Policy, 2018, 75, 459-467. [CrossRef]
- Ramirez, A. Ramirez, A. The influence of social networks on agricultural technology adoption. Procedia-Social and Behavioral Sciences. 2013, 79, 101-116. 2013, 79, 101-116. [CrossRef]
- Nurwahyuni, E., Arianti, F., & Hindarwati, Y. The farmer’s response to the improvement of cropping index through intercropping of maize–soybean and groundnut monoculture in Pemalang. Paper presented at the IOP Conference Series: Earth and Environmental Science, 2021.
- Rahman, S. , Matin, M., & Hasan, M. Joint determination of improved variety adoption, productivity and efficiency of pulse production in Bangladesh: A sample-selection stochastic frontier approach. Agriculture & Food Security, 2018, 8, 7, 1-18. [CrossRef]
- Mwalupaso, G. E. , Wang, S., Rahman, S., Alavo, E. J.-P., & Tian, X. Agricultural informatization and technical efficiency in maize production in Zambia. Sustainability. 2019, 11, 1–17. [Google Scholar] [CrossRef]
- Abdul-Rahaman, A. , Issahaku, G., & Zereyesus, Y. A. Improved rice variety adoption and farm production efficiency: Accounting for unobservable selection bias and technology gaps among smallholder farmers in Ghana. Technology in Society, 2014, 64, 101471. [CrossRef]
- Ghimire, R. , Wen-Chi, H., & Shrestha, R. B. Factors affecting the adoption of improved rice varieties among rural farm households in Central Nepal. Rice Science. 2015, 22, 35–43. [Google Scholar] [CrossRef]
- Jaleta, M. , Kassie, M., & Marenya, P. Impact of improved maize variety adoption on household food security in Ethiopia: An endogenous switching regression approach. International Association of Agricultural Economists, 2015, 29, 1-26. [CrossRef]
- Shiferaw, B. , Kassie, M., Jaleta, M., & Yirga, C. Adoption of improved wheat varieties and impacts on household food security in Ethiopia. Food Policy. 2014, 44, 272–284. [Google Scholar] [CrossRef]
- Manda, J. , Alene, A. D., Tufa, A. H., Abdoulaye, T., Wossen, T., Chikoye, D., & Manyong, V. The poverty impacts of improved cowpea varieties in Nigeria: A counterfactual analysis. World Development, 2019, 122, 261-271. [CrossRef]
- Wossen, T., Alene, A., Abdoulaye, T., Feleke, S., Rabbi, I. Y., & Manyong, V. Poverty reduction effects of agricultural technology adoption: The case of improved cassava varieties in Nigeria. Journal of Agricultural Economics. 2019, 70, 2, 392-407. [CrossRef]
- Wu, H. , Ding, S., Pandey, S., & Tao, D. Assessing the impact of agricultural technology adoption on farmers’ well-being using propensity-score matching analysis in rural China. Asian Economic Journal, 2010, 24, 141-160. [CrossRef]
- Wordofa, M. G. , Hassen, J. Y., Endris, G. S., Aweke, C. S., Moges, D. K., & Rorisa, D. T. Adoption of improved agricultural technology and its impact on household income: A propensity score matching estimation in eastern Ethiopia. Agriculture & Food Security, 2021, 10, 1-12. [CrossRef]
Figure 1.
The traditional Madurese salt farming.
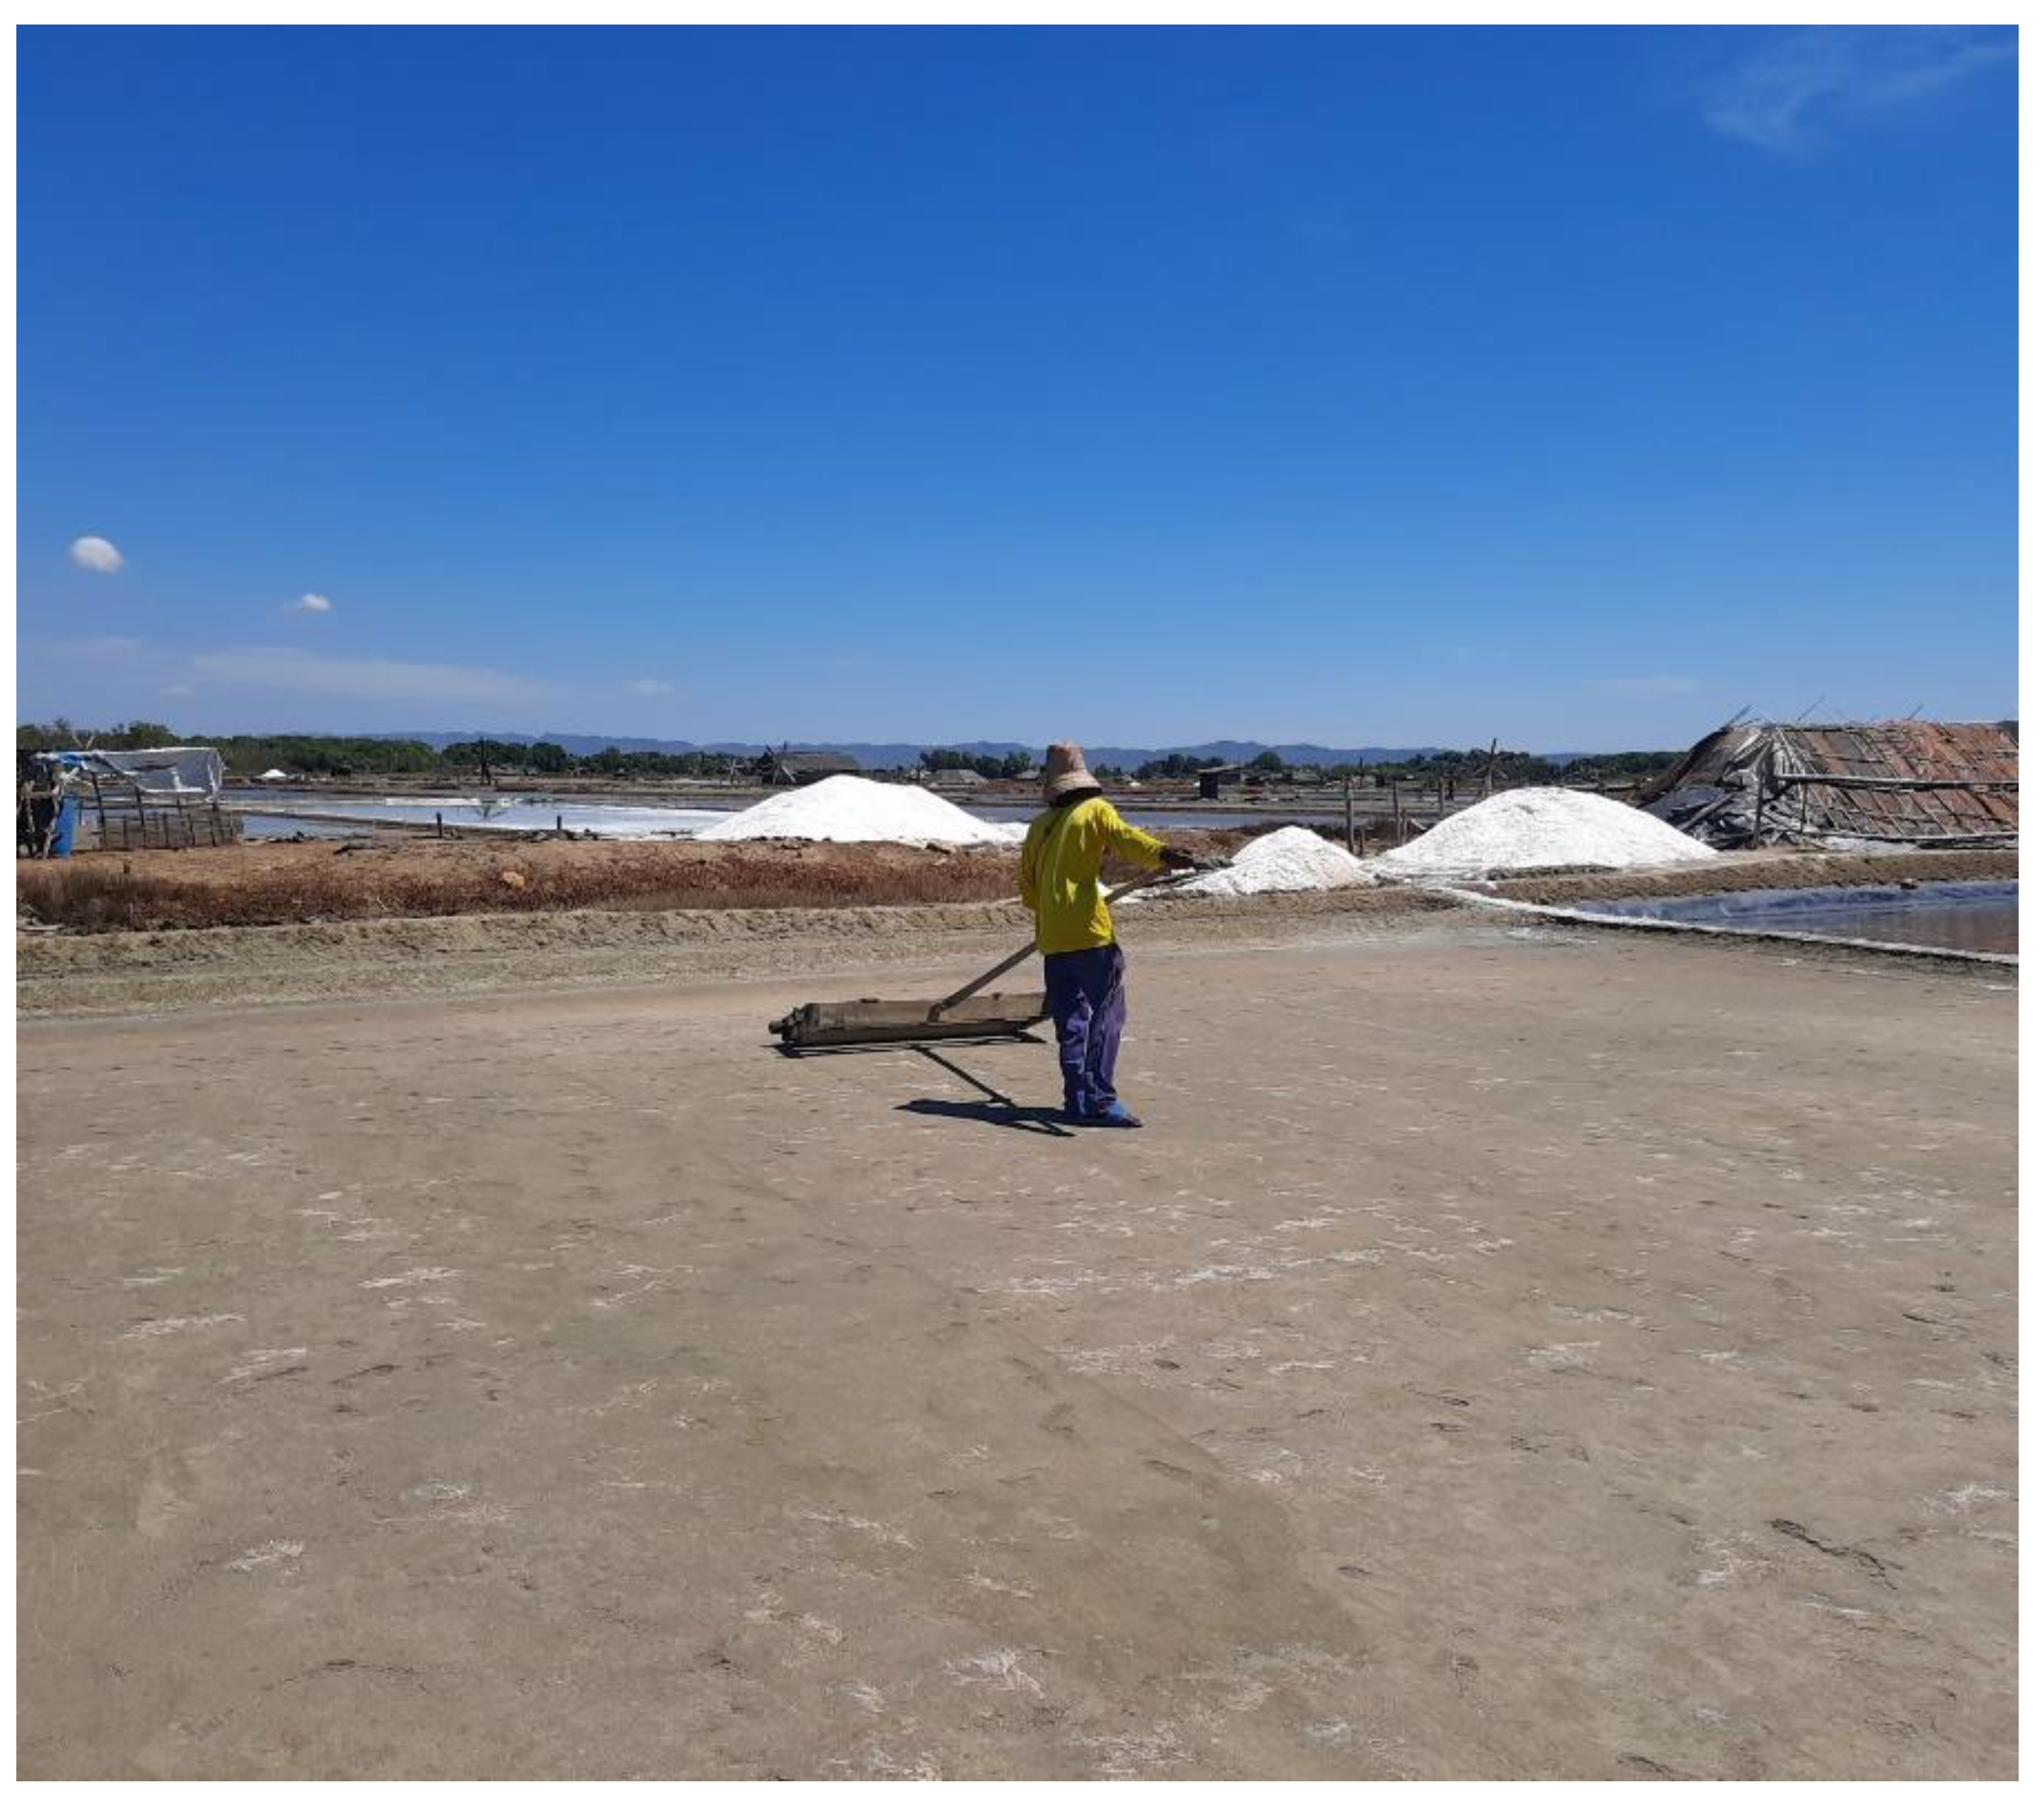
Figure 2.
The Madurese salt farming use geomembrane production technology.
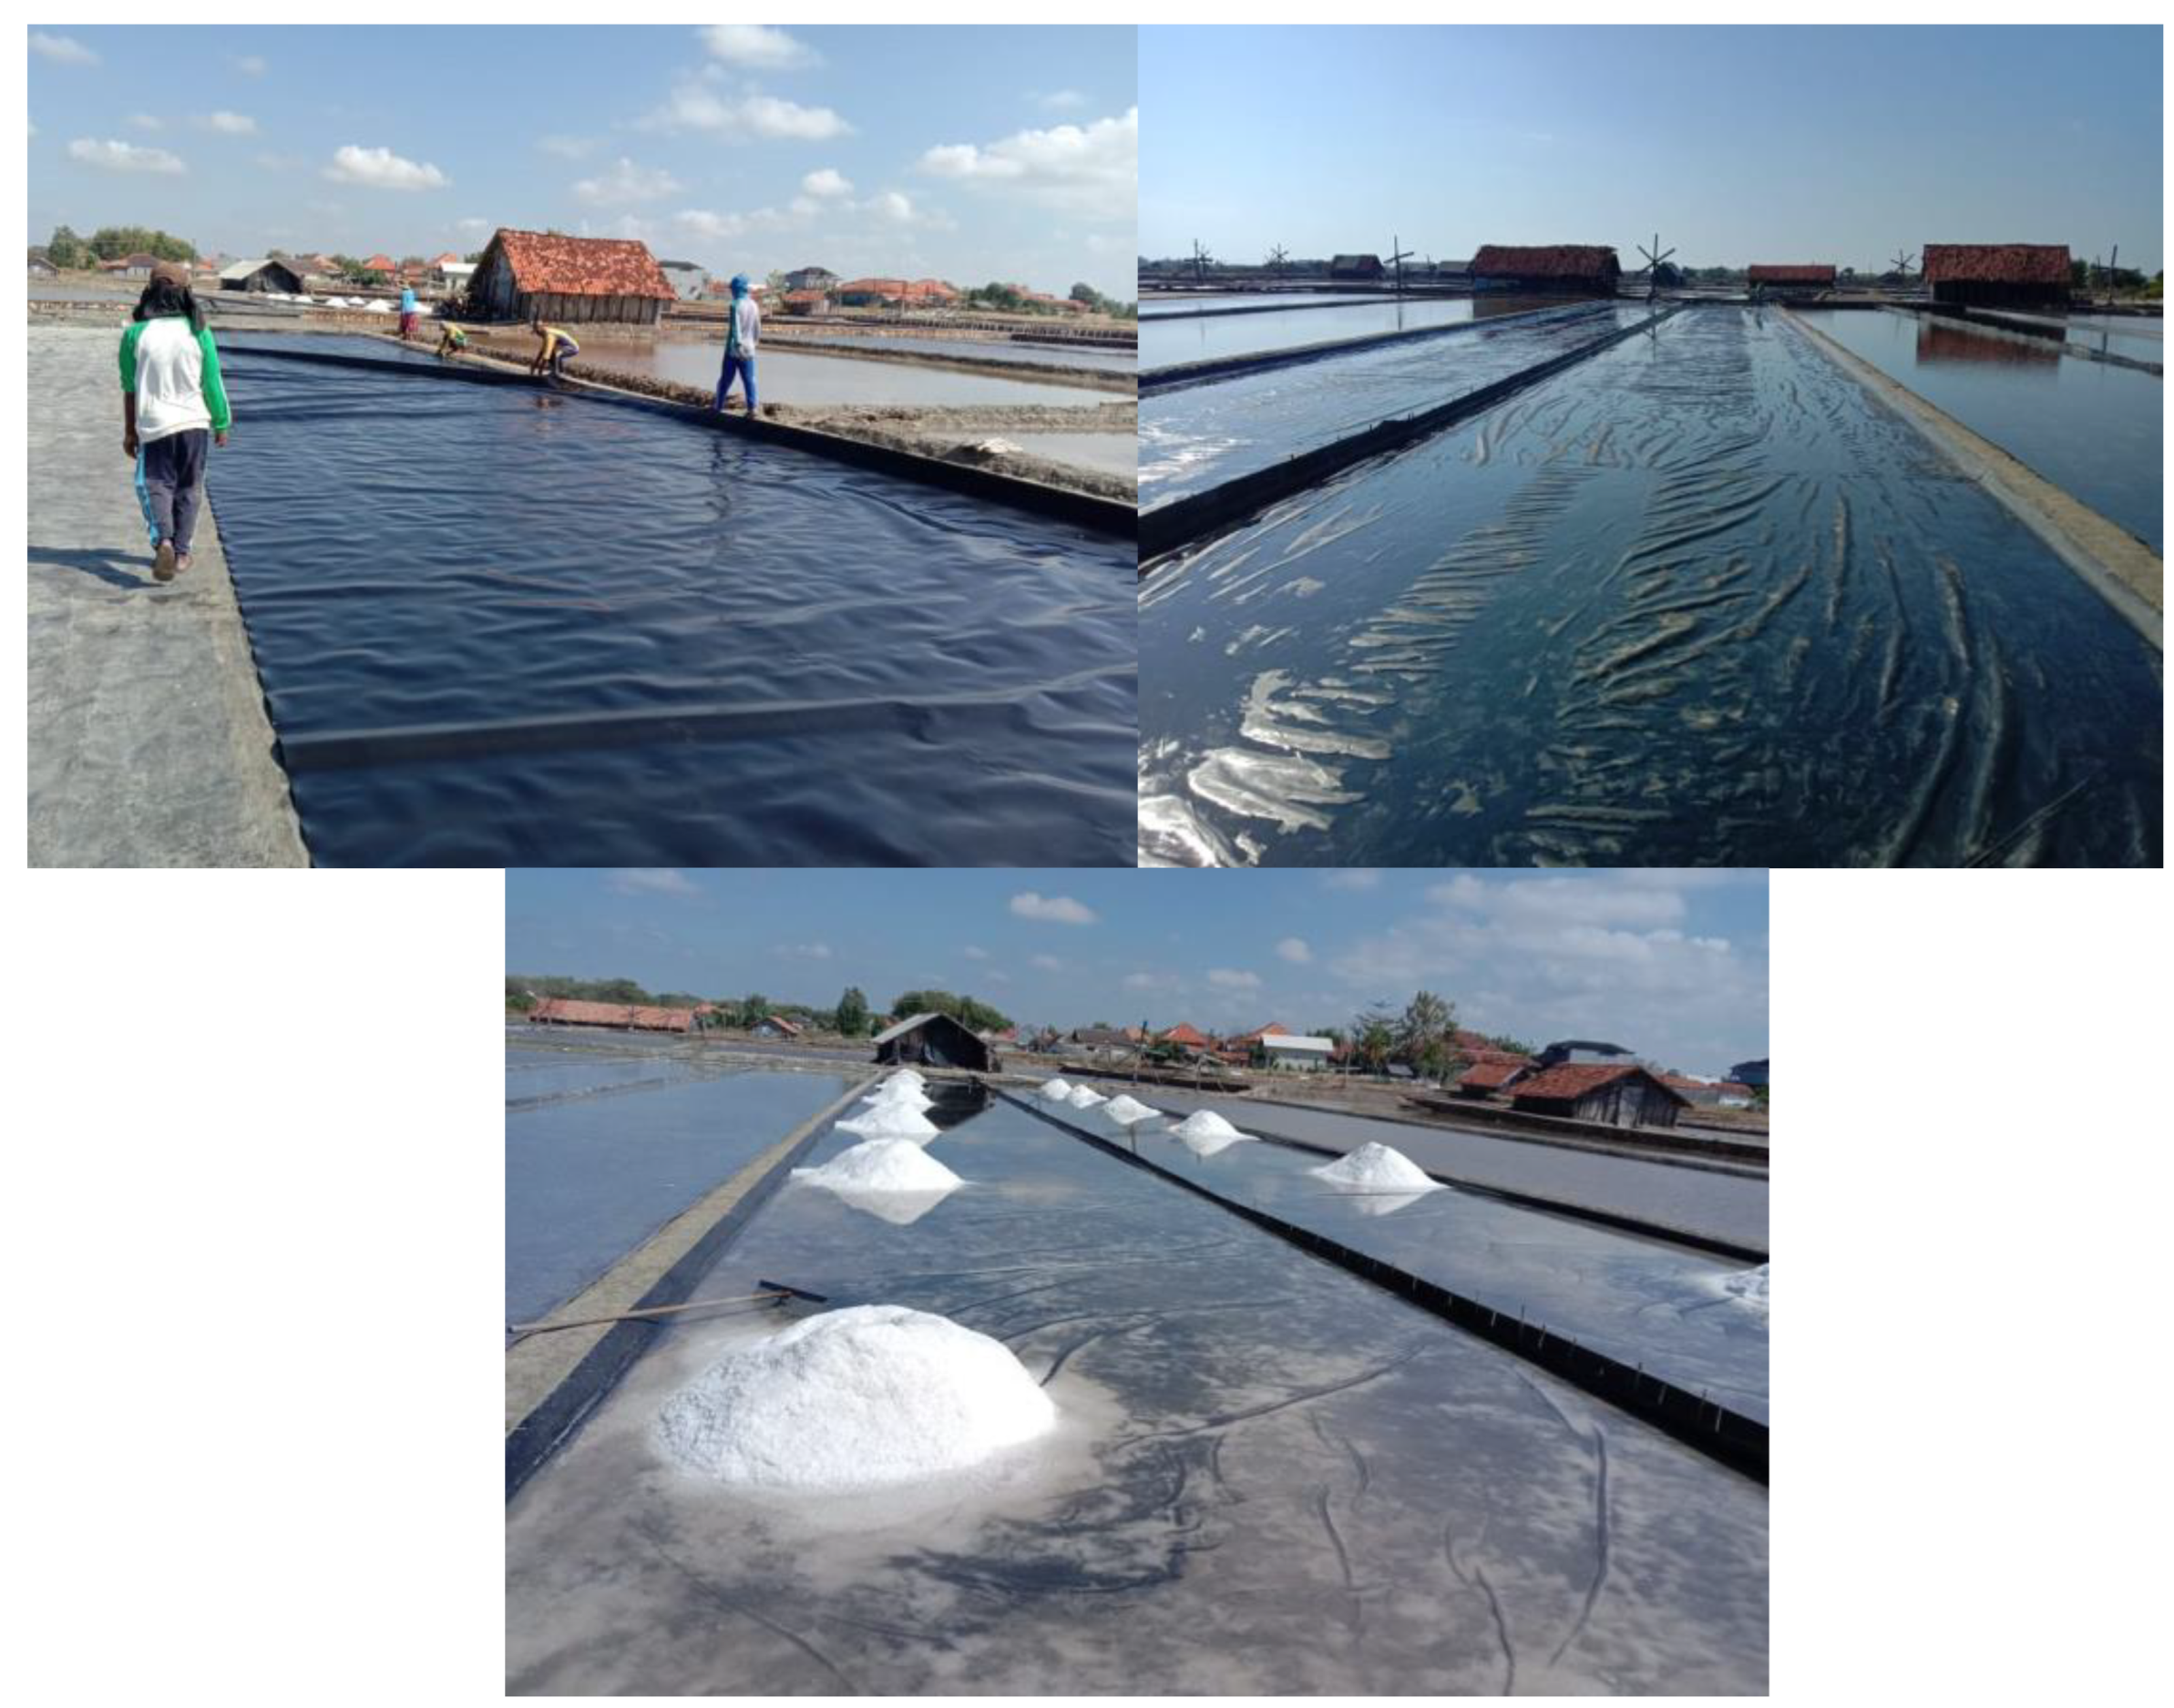
Figure 3.
Research Locations on Madura Island, East Java, Indonesia.
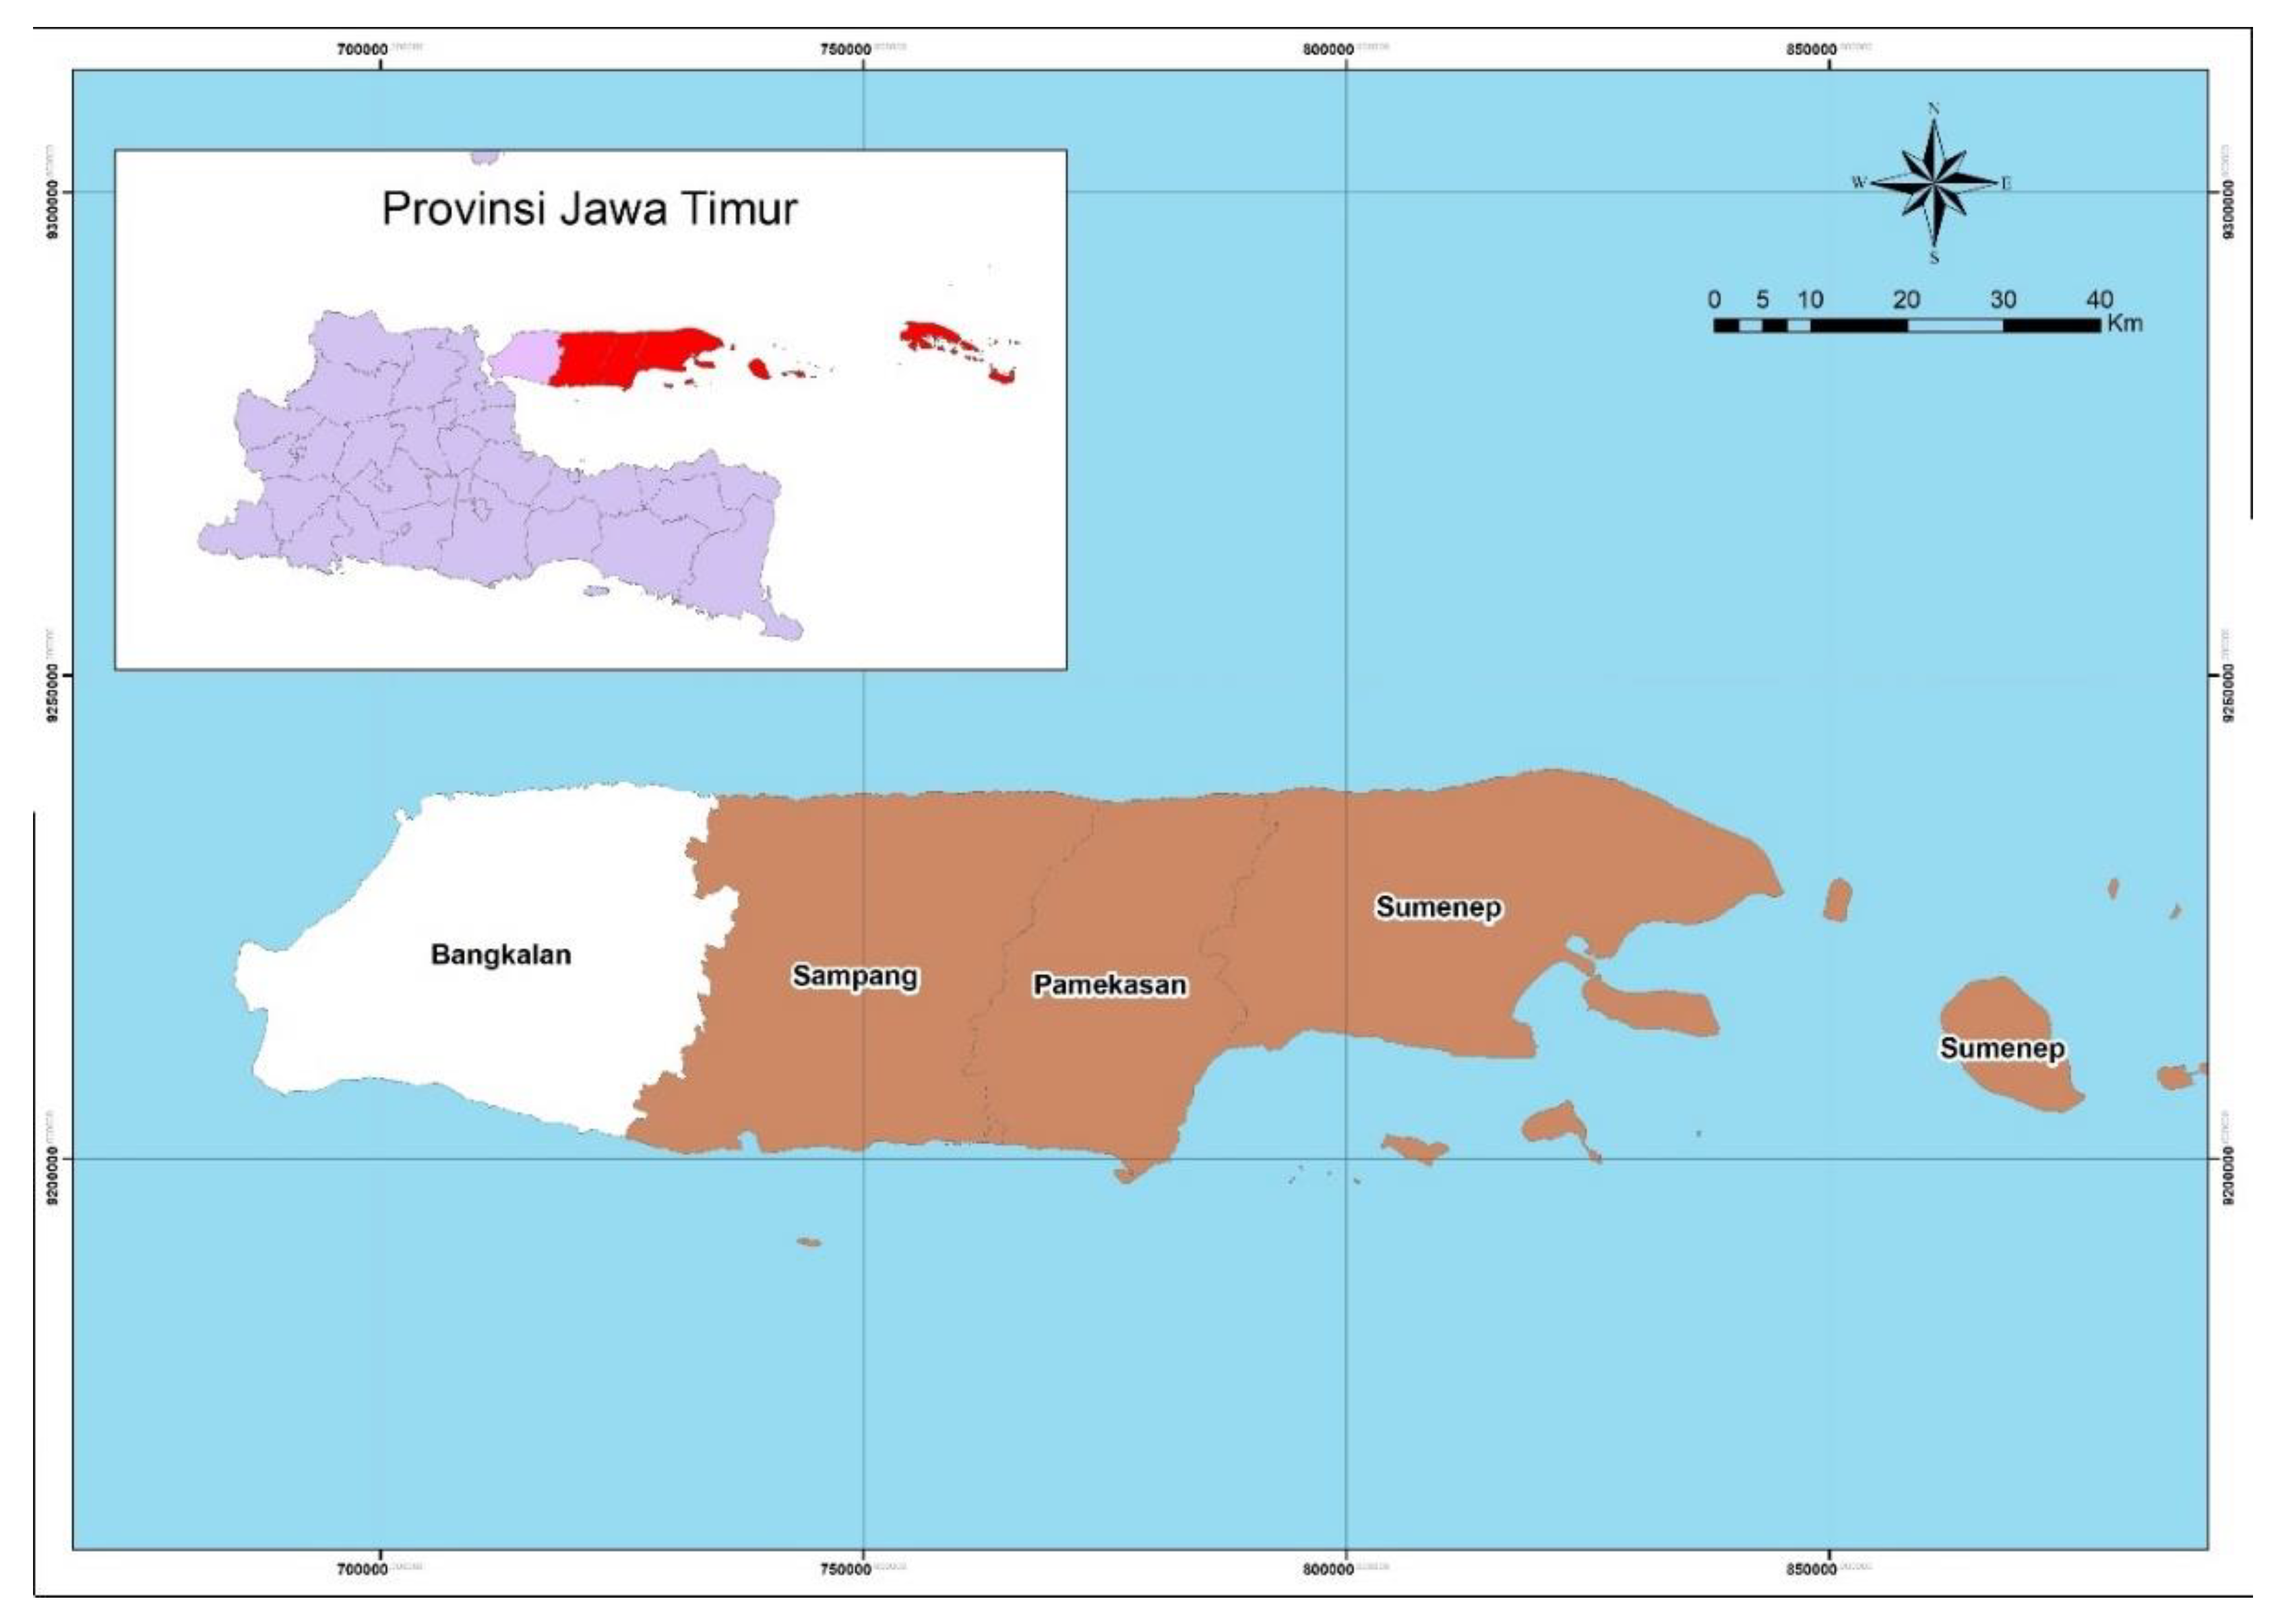

Table 1.
Variable Description.
| Variable | Description | Mean | Std. Deviation |
|---|---|---|---|
| Characteristics | |||
| Age | Age of salt farmer (years) | 48.53488 | 10.96671 |
| Experience | Salt business experience (years) | 19.17209 | 12.77641 |
| Education | Salt farmer’s last education (0 = not completed elementary school, 1 = elementary school, 2 = middle school, 3 = high school, 4 = Bachelor’s degree, 5 = postgraduate degree) | 1.581395 | 0.972341 |
| Gender | Salt farmer’s gender (1 = male, 0 = female) | 0.778689 | 0.416842 |
| Number of family members | Number of family members (people) | 3.269767 | 1.460306 |
| Profit sharing | Profit-sharing pattern (1= yes, 0= no) | 0.67757 | 0.468502 |
| Land ownership | Land ownership (1 = rented land/profit sharing, 0 = own land) | 0.409836 | 0.493831 |
| KUGAR | KUGAR participation (1= participate, 0= does not participate) | 0.697674 | 0.460337 |
| Mobile Phone Ownership | Mobile phone ownership (1 = yes, 0 = no) | 0.706977 | 0.456211 |
| Internet access | Access to the Internet (1=can or 0=cannot) | 0.427907 | 0.49593 |
| Assistance | Have you ever received assistance (1= yes, 0= no) | 0.688372 | 0.46424 |
| Demlot | Whether there is a demonstration plot (1 = exists, 0 = does not exist) | 0.297674 | 0.458303 |
| Capital Sources | Farming capital (1 = loan, 0 = own capital) | 0.27907 | 0.449589 |
| Geomembrane adoption | Geomembrane adoption decision (1 = geo, 0 = ground) | 0.827907 | 0.378342 |
| Inputs and outputs | |||
| Land area | Land area (M2) | 10179.35 | 4959.455 |
| Salt production | Total salt production (tons) | 94.96744 | 52.48145 |
| Harvest frequency | Number of harvests in 1 season | 13.2 | 3.305617 |
| Water volume | Water volume | 4282.842 | 2957.844 |
| Bozem percentage | Bozem percentage | 16.79401 | 12.09479 |
| Minian percentage | Minihan percentage | 54.98041 | 14.74632 |
| Salt table percentage | Percentage of salt table/crystallization | 28.22558 | 8.811714 |
| Number of workers (HOK) | Number of workers (HOK) | 133.7116 | 89.58418 |
| Amount of solar | Amount of diesel per day (litres) | 306.4791 | 214.9327 |
| MetaTE | Technical efficiency | 0.8085814 | 0.2220938 |
Table 2.
Average Differences in Research Variables for Farmer Characteristics.
| Variable | Unmatched | Matched | ||||
|---|---|---|---|---|---|---|
| Adopting | Not Adopting | Diff. | Adopting | Not adopting | Diff. | |
| Age | 48.764 | 56.364 | 7.600* | 49.447 | 36.500 | 12.947*** |
| Experience | 23.600 | 31.455 | 7.855* | 23.904 | 16.181 | 7.723*** |
| Education | 1.882 | 1.546 | 0.336 | 1.830 | 2.660 | 0.830*** |
| Gender | 0.791 | 0.727 | 0.064 | 0.755 | 0.915 | 0.160*** |
| Family members | 4.182 | 3.364 | 0.818* | 4.064 | 3.075 | 0.989*** |
| Ln Land area | 8.968 | 9.183 | 0.215 | 9.001 | 9.115 | 0.114** |
| Ln Salt production | 4.281 | 4.299 | 0.018 | 4.313 | 4.676 | 0.363*** |
| Profit sharing | 0.509 | 0.818 | 0.309* | 0.553 | 0.170 | 0.383*** |
| Land ownership | 0.400 | 0.455 | 0.055 | 0.404 | 0.128 | 0.277*** |
| KUGAR | 0.727 | 0.455 | 0.273* | 0.702 | 0.915 | 0.213*** |
| Mobile ownership | 0.709 | 0.636 | 0.073 | 0.691 | 0.947 | 0.255*** |
| Internet access | 0.391 | 0.273 | 0.118 | 0.372 | 0.851 | 0.479*** |
| Assistance | 0.691 | 0.636 | 0.055 | 0.660 | 0.309 | 0.351*** |
| Demlot | 0.309 | 0.182 | 0.127 | 0.277 | 0.032 | 0.245*** |
| Capital sources | 0.227 | 0.091 | 0.136 | 0.170 | 0.043 | 0.128*** |
Note: * significant 10%; ** significant 5%; *** significant 1%.
Table 3.
Average Differences in Input and Output Variables.
| Variable | Unmatched | Matched | ||||
|---|---|---|---|---|---|---|
| Adopting | Not Adopting | |Diff.| | Adopting | Not Adopting | |Diff.| | |
| ln Land area | 9.093 | 9.234 | 0.141* | 9.151 | 9.149 | 0.001 |
| Ln Harvest Frequency | 2.549 | 2.554 | 0.005 | 2.550 | 2.469 | 0.081*** |
| Ln Water volume | 8.098 | 8.416 | 0.318*** | 8.231 | 8.332 | 0.102 |
| Ln Percentage of Bozem | 2.503 | 2.693 | 0.189 | 2.605 | 2.435 | 0.170* |
| Ln Percentage of Minian | 3.969 | 3.940 | 0.028 | 3.943 | 4.000 | 0.056* |
| Ln Percentage of salt table | 3.292 | 3.272 | 0.020 | 3.298 | 3.301 | 0.003 |
| Ln Number of workers (HOK) | 4.677 | 4.611 | 0.066 | 4.658 | 4.627 | 0.032 |
| Ln Amount of diesel | 5.439 | 5.629 | 0.190 | 5.502 | 5.436 | 0.066 |
| Ln Salt production | 4.417 | 4.475 | 0.058 | 4.462 | 4.407 | 0.055 |
Note: * significant 10%; ** significant 5%; *** significant 1%.
Table 4.
Factors Influencing Farmers’ Decisions to Adopt Geomembranes.
| Variable | Coefficient | P-Value | Odds Ratio (OR) |
|---|---|---|---|
| Constant | 7,137 | 0,049 | |
| Salt Farmer’s Age | 0,100 | 0,056* | 0,905 |
| Salt Farmer’s Experience | -0,014 | 0,704 | 0,986 |
| Salt Farmer’s Education | -0,619 | 0,277 | 0,538 |
| Number of Family Members | -0,436 | 0,016** | 1,546 |
| Salt Farmer’s Gender Dummy | 1,579 | 0,092* | 4,851 |
| Profit Sharing Dummy | 2,920 | 0,016** | 0,054 |
| Land Ownership Dummy | 1,321 | 0,093* | 3,745 |
| Mobile Phone Ownership Dummy | -0,715 | 0,446 | 0,489 |
| Internet Access Dummy | -0,205 | 0,834 | 0,815 |
| KUGAR Opt-in Dummy | 2,287 | 0,000*** | 9,846 |
| Demonstration Plot Dummy | 0,598 | 0,061* | 1,818 |
| Assistance Dummy | -0,900 | 0,407 | 0,045 |
Note: * significant 10%, ** significant 5%, *** significant 1%.
Table 5.
Technical Efficiency Scores.
| Efficiency Range | Adopters | Non-Adopters | Pooled Data | |||
|---|---|---|---|---|---|---|
| Frequency | Percent | Frequency | Percent | Frequency | Percent | |
| ≤0,50 | 2 | 1,12 | 6 | 16,22 | 26 | 14,61 |
| 0,51-0,60 | 4 | 2,25 | 7 | 18,92 | 22 | 12,36 |
| 0,61-0,70 | 13 | 7,30 | 8 | 21,62 | 23 | 12,92 |
| 0,71-0,80 | 14 | 7,87 | 5 | 13,51 | 17 | 9,55 |
| 0,81-0,90 | 28 | 15,73 | 1 | 2,70 | 14 | 7,87 |
| 0,91-1,00 | 117 | 65,73 | 10 | 27,02 | 76 | 42,69 |
| Total | 178 | 100 | 37 | 100 | 215 | 100 |
| Mean TE | 0,911 | 0,698 | 0,809 | |||
| Min. | 0,415 | 0,223 | 0,182 | |||
| Max. | 1,000 | 1,000 | 1,000 | |||
| Std. Dev. | 0,134 | 0,214 | 0,222 | |||
Table 6.
Results of the Impact of Geomembrane Adoption on Technical Efficiency.
| Model | Not Adopting | Adopting | Diff. |
|---|---|---|---|
| Unmatched | |||
| Pooled | 0.607 | 0.908 | 0.301** |
| Separated | 0.668 | 0.955 | 0.287** |
| Matched | |||
| Pooled | 0.635 | 0.906 | 0.271* |
| Separated | 0.698 | 0.967 | 0.269** |
Note: * significant 10%; ** significant 5%; *** significant 1%.
Disclaimer/Publisher’s Note: The statements, opinions and data contained in all publications are solely those of the individual author(s) and contributor(s) and not of MDPI and/or the editor(s). MDPI and/or the editor(s) disclaim responsibility for any injury to people or property resulting from any ideas, methods, instructions or products referred to in the content. |
© 2024 by the authors. Licensee MDPI, Basel, Switzerland. This article is an open access article distributed under the terms and conditions of the Creative Commons Attribution (CC BY) license (http://creativecommons.org/licenses/by/4.0/).
Copyright: This open access article is published under a Creative Commons CC BY 4.0 license, which permit the free download, distribution, and reuse, provided that the author and preprint are cited in any reuse.


