Submitted:
22 May 2024
Posted:
23 May 2024
You are already at the latest version
Abstract
This study is the first to investigate the asymmetric effects of oil price volatility on stock returns for the Ho Chi Minh Stock Exchange (HOSE). We utilized weekly series of VN30-Index, WTI crude oil prices, geopolitical risks (GPR) index and gold prices spanning from 6 February 2012 to 31 December 2023 as data sources. Using a nonlinear Autoregressive Distributed Lag (NARDL) bounds testing approach, we found that in the short-term, oil price volatility has negative asymmetric effects on the market returns. Specifically, in the short-term, a one percent increase in oil price volatility immediately leads to a 2,6868 percent decrease in the market returns while a similar magnitude decrease in oil price volatility is associated with 6.3180 percent increase in the market returns. In addition, the results obtained from the NARDL model indicated that, in the long-term, the negative and positive changes of oil price volatility have significantly negative effects on the market returns. Finally, the findings derived from the error correction model (ECM) show that 98.21 percent of the disequilibria from the previous week are converged and corrected back to the long-term equilibrium in the current week.
Keywords:
HOSE
; market returns
; NARDL
; oil price volatility
1. Introduction
Since the dawn of the industrial age, hydrocarbons have played an ever more critical role in civilization’s development. In the 1800’s coal was the dominant source of energy for the propulsion of ships and trains as well as electricity generation for an ever more integrated global economy. In the early 1900’s following the introduction of the internal combustion engine, oil took over as the dominant energy source for the planet currently accounting for nearly one-third of the globes total energy consumption. This led for the greatest scramble for natural resources ever as countries and companies to acquire reliable supplies of the critical black gold that powers their economies. Oil is an essential life blood of our economic prosperity and wellbeing especially as the planet’s population has grown by wildly increasing food production, fueling global trade and transportation moving people and materials from one side of the planet to another often in a matter of days or even hours.
Clearly, people’s economic prosperity is directly tied to such a critical natural resource. Movements in prices tied to supply and demand dynamics ripples through economies substantially hurting the prospects of oil dependent economies while greatly enhancing the wealth of oil providing economies like those in the Middle East. Oil drives up the prices of all goods in the economy through production and transportation costs thus increasing inflation and in turn interest rates for oil dependent economies. These economic drags or windfalls related to oil price movements reverberate through economies and in turn their stock markets having both negative and positive benefits depending on a countries relative production and consumption.
The effects of oil price and oil price volatility on stock returns have attracted considerable attention from scholars for the last decades. However, the findings from these studies have not been consensus. Specifically, most of studies have reported negative effects of oil prices on stock returns (Jones and Kaul, 1996; Gjerde and Saettem, 1999; Sadorsky, 1999; Papapetrou, 2001; Basher and Sadorsky, 2006; Park and Ratti, 2008; Driesprong et al., 2008; Chen, 2009; Filis, 2010; Basher et al., 2012; Raza et al., 2016), while others have found positive influences of oil prices on stock market returns (Narayan and Narayan, 2010; Zhu et al., 2011; Zhu et al., 2014; Bouri, 2015; Raza et al., 2016; Silvapulle et al., 2017; Luo and Qin, 2017; de Jesus et al., 2020). In addition, many empirical studies documented that oil price volatility has negative effects on stock returns (Diaz et al., 2016; Raza et al., 2016; Joo and Park, 2017; Luo and Qin, 2017; Xiao et al., 2018; Joo and Park, 2021; Rahman, 2021). It is important to stress that the empirical studies have mostly focused on the US and other oil-importing developed countries and less on developing countries. In addition, most of these studies have assumed that the impact of oil price volatility on stock returns is symmetric. However, the impact of oil price volatility on stock returns could be asymmetric, meaning that an increase in oil price volatility has a different effect on stock returns compared to a decrease in oil price volatility with the same magnitude.
Vietnam, a transition economy well on the path to emerging market status, is critically dependent on oil imports to fuel their economic machine especially considering domestic production has fallen over the last decade. In 2023, Vietnam’s oil imports exceeded 75 million barrels, a 13% increase from the previous year (https://www.eia.gov/international/data/country/VNM”, accessed on 5 May, 2024). Therefore, oil price movements could impact on the Vietnam stock market. Although the effects of oil price changes and oil price volatility have substantially documented in the literature, to our best knowledge, no study on these effects has been found for Ho Chi Minh Stock Exchange (HOSE). To fill the gap in the literature, this study is devoted to investigate the effects of oil price volatility on stock returns for the HOSE. The contributions of the study to the literature are as follows. First, this study provides unique insights into the literature covering the effects of oil price volatility on stock returns in a transitional economy due to the fact the Vietnamese economy has been in a transitional period with a growing consumption of oil and deep integration into the world economy. Therefore, it is expected that the effect of oil price volatility on stock returns will be more pronounced in the Vietnam stock market. Second, while most studies in this topic investigate symmetric effects of oil price volatility on stock returns, this study focuses on the asymmetric effects of oil price volatility on stock returns by using the NARDL bounds testing approach. It is important to note that the HOSE is characterized by a large number of small individual investors (Truong et al., 2021). Therefore, the response of investors in the market to oil prices could be asymmetric. This paper is ordered as follows. Section 2 provides the theoretical background underpinning our analysis as well as a review of relevant literature on the topic. Section 3 contains a description of the data and the methodology employed in this analysis while Section 4 provides the empirical results. Conclusions are drawn in Section 5.
2. Theoretical Background and Empirical Literature Review
The cash-flow theory can be utilized as a theoretical framework to explain the impact of oil prices on returns of financial equities. Generally, according to the cash-flow theory, financial equities value is equal to the present value of anticipated cash flows. Based on this theory, oil prices could have negative or positive effects on stock returns (Smyth & Narayan, 2018). On the one hand, the negative effects of oil prices on stock returns could be justified in two ways. First, because oil is used as an essential input for most companies, an increase in oil prices leads to an increase in production costs, hence future cash flows decrease. Second, an increase in oil prices can result in an increase in expected inflation, thus nominal interest rates increase. Financial experts use interest rates as discount rates to determine the value of stocks. Therefore, higher interest rates lead to lower stock returns. On the other hand, oil prices could have the positive impact on stock returns. A possible reason to explain this effect is that investors could positively respond to increasing oil prices because higher oil prices are associated with greater economic growth and stronger performance of firms (Kollias et al., 2013). Furthermore, oil price volatility could have negative effects on stock returns because oil price volatility can positively influence on the risk premium component of the discount rate used in the equity pricing model. Therefore, higher oil price volatility is associated with higher discount rates and lower stock returns.
In earlier empirical studies in this field, researchers mainly investigated the effects of oil prices on stock returns for specific countries or groups of countries (Smyth and Narayan, 2018). The findings from these studies did not reach a consensus. Specifically, most of studies found negative effects of oil prices on stock returns (Jones and Kaul, 1996; Gjerde and Saettem, 1999; Sadorsky, 1999; Papapetrou, 2001; Basher and Sadorsky, 2006; Park and Ratti, 2008; Driesprong et al., 2008; Chen, 2009; Filis, 2010; Basher et al., 2012; Raza et al., 2016 ). In contrast, others reported positive influences of oil prices on stock returns (Narayan and Narayan, 2010; Zhu et al., 2011; Zhu et al., 2014; Bouri, 2015; Raza et al., 2016; Silvapulle et al., 2017; Luo and Qin, 2017; de Jesus et al., 2020). Some researchers documented that oil prices have asymmetric effects on stock returns (Bahmani-Oskooee et al., 2019, Jiang and Liu, 2021).
Recently, some researchers have conducted empirical studies focusing on the effects of oil price volatility on stock returns. Most of them have focused on developed countries. Specifically, Rahman (2021) investigated the impact of oil price volatility on U.S. stock market returns from 1973 to 2015. The researcher found that oil price volatility has a significantly negative effect on the market returns. In addition, Diaz et al. (2016) determined the relationship between oil price volatility and stock market returns in the G7 countries during the period from 1970 to 2014. Using a vector autoregressive model, they found a negative effect of oil price volatility on stock market returns. Similarly, Joo and Park (2017) estimated the effects of stock and oil prices uncertainty measured by conditional variance on oil returns and stock market returns for the United States, Japan, Korea, and Hong Kong during the period from 1996 to 2015. Using the VAR-DCC-BGARCH-in-Mean approach, they reported that oil price volatility has a significantly negative on the market returns for the United States, Japan and Hong Kong. In a later study, Joo and Park (2021) investigated the effects of oil price volatility on stock market returns for ten major oil-importing countries. In their analysis, they considered China, France, Germany, India, Italy, Japan, Korea, the Netherlands, Spain, and the United States from May 2001 to December 2019. They found that oil price volatility has asymmetric effects on stock returns. Specifically, oil price volatility has a negative effect on stock returns in the case both oil price volatility and stock returns are low. However, when oil price volatility is low and stock market returns are high, oil price volatility has a positive effect on stock returns. As the world’s largest importer of crude oil, Chinas has been the focus of investigations on the effects of oil price volatility on Chinese stock market returns. Specifically, Luo and Qin (2017) examined the effects of oil price volatility on Chinese stock market returns from May 10, 2007 to December 31, 2015. In this study, they used the crude oil volatility index (OVX) and realized a variance in the oil price volatility. In their findings, they confirmed that the oil price volatility has significantly negative effects on the market returns. In addition, Xiao et al. (2018) investigated asymmetric effects of oil price volatility, measured by the crude oil volatility index, on Chinese stock returns from May 10, 2007 to September 20, 2017. They found that the oil price volatility has significantly negative asymmetric impact on Chinese stock returns in the bearish market. Specifically, the effects of positive changes in the oil price volatility on the stock returns are larger than the effects of the negative changes. Moreover, Chen et al. (2017) examined the predictive ability of oil return and oil return volatility on stock market momentum in the same market. They found that oil price volatility and stock market momentum are positively correlated. Raza et al. (2016) also examined the long-term and short-term asymmetric effects of gold prices, oil prices, and gold and oil price volatilities on market returns. In their analysis, they considered emerging stock markets, such as China, India, Brazil, Russia, South Africa, Mexico, Malaysia, Thailand, Chile and Indonesia. Using monthly data from January 2008 to June 2015, the empirical findings derived from a nonlinear autoregressive distributed lag (NARDL) approach indicated several trends. In the short-run, negative changes in oil price volatility had negative impact on stock returns of India, South Africa, Malaysia, Thailand, Chile and Indonesian markets. At the same time, positive changes in oil price volatility had a positive effect on stock returns of Chinese and South African stock markets. In addition, the researchers documented that in the long-run, oil price volatility has a asymmetric negative impact on market returns of all emerging stock markets.
Recently, some researchers have investigated the relation between oil price volatility and stock return volatility. Specifically, Anand et al. (2014) explored the volatility spillover between oil prices and Indian stock market returns from January 2000 to December 2012. The researchers documented that oil price volatility has positive spillover effects on volatility of market returns, but the market return volatility did not impact on oil price volatility. In addition, Dutta et al. (2017) examined the effects of oil price volatility on stock return volatility of the Middle East and African stock markets from May 10, 2007 to December 31, 2014. Using an extended GARCH model, their empirical results revealed that the oil market volatility has significant positive effects on the market return volatility of most studied markets. Sarwar et al. (2020) also investigated the volatility spillover between oil prices and stock returns for Pakistan, China and India from 1997 to 2014. Using bivariate BEKK-GARCH model, they found that oil price volatility has negative spillover effects on volatility of market returns for all markets.
In summary, theoretically, oil price changes could have a negative or positive effects on stock returns, while oil price volatility could have negative effects on stock returns. In the last decades, researchers have extensively documented the effects of oil price changes and oil price volatility on stock returns. However, scholars have not come to a consensus. Specifically, most researchers have reported negative effects of oil prices on stock returns, while others have indicated positive influences of oil prices on stock market returns. In addition, using empirical research, most researchers have documented that oil price volatility has negative effects on stock returns. Especially, some provide evidence that oil price volatility has asymmetric effects of oil price volatility on stock returns. Based on the theoretical framework and empirical evidence, we hypothesized that oil price volatility has negative asymmetric effects on stock returns for the HOSE.
3. Data and Methodology
3.1. Data Sources
The data used in this study comprise the weekly series of VN30-Index, oil price (WTI crude oil), geopolitical risks (GPR) index and gold prices from 6 February 2012 to 31 December 2023. It is important to note that the VN30-Index, which was officially launched on 6 February 2012, is a market capitalization weighted index calculated from 30 big capitalization and high liquidity stocks traded on the HOSE. The GPR index is the Index developed by Caldara and Iacoviello (2022). These series are collected from the Wednesday. The choice of Wednesday aims to avoid weekend effects of stock trading and to minimize the number of holidays (Huber, 1997). Table 1 includes the specific data sources.
3.2. Research methodology
To investigate the asymmetric effects of oil price volatility on stock returns for the HOSE, we use the following baseline regression model:
where,
- -
- Rt: Market return of week t. The weekly market returns are calculated by the following equation:
where,
- -
- It: VN30-Index at week t;
- -
- It-1: VN30-Index at week t-1.
- -
- VOL: Oil price volatility generated from a GARCH(1,1) model. In this study, the GARCH(1,1) takes the following form:
where:
- LNOPt: Natural logarithm of oil price at week t.
- LNOPt-1: Natural logarithm of oil price at week t-1.
- -
- LNGPRt: Natural logarithm of the GPR Index at week t;
- -
- LNGt: Natural logarithm of gold price at week t.
We employ the NARDL bounds testing approach proposed by Shin et al. (2014) to investigate the short-term and long-term asymmetric effects of oil price volatility on the market returns. The approach is an extended model of the ARDL model by Pesaran et al. (2001). In this model, oil price volatility is decomposed in positive and negative partial sum series. It is important to note that the NARDL bound does not require all variables to be integrated of the same order. Instead, it only requires all variables to be integrated of purely order zero, purely order one, or a combination of both (Truong et al., 2024). Therefore, reseachers should examine the order of integration of all variables before conducting the bounds test. In this study, we employ the ADF (augmented Dickey–Fuller) test to determine the order of integration of the studied variables. The ADF test takes the form as follows:
where:
Δ is first-difference operator.
Because the ADF test results are sensitive to the selection of the lag length (k), the Akaike Information Criterion (AIC) is used for choosing the optimal k of the ADF regression. Moreover, the null hypothesis in the ADF test is the existence of a unit root (β=0), and it is rejected if the ADF test statistic is larger than the critical value.
Before estimating the short-term and long-term effects of oil price volatility on the market returns, the NARDL bound test is applied in order to determine the cointegration between variables in the model. Specifically, the NARDL bound test used in this study takes the following equation:
where:
- -
- Δ represents the first difference of the variables.
- -
- The null hypothesis (H0) of the NARDL bound test is λ1 = λ2 = λ3 = λ4 = λ5 = 0 (no co-integration in the long-term between variables).
If the F-statistic calculated from the bounds test is larger than the critical value of the selected significance level, the null hypothesis is rejected, meaning that a long-term relationship (co-integration) between the variables exists in the model. If the long-term equilibrium relationship is detected, the short-term and long-term effects of the oil price volatility on the market returns are estimated by equation (6) and (7), respectively.
4. Empirical Results
4.1. Oil Price Volatility and Market Returns of the HOSE for the Period from 2012 to 2023
Table 2 includes the descriptive statistics of oil prices volatility and market returns of the HOSE from 1986 to 2021 based on the obtained data. It shows that the oil price volatility measured by conditional variances of GARCH(1,1) model ranges from 0.0001 to 0.0103 with a mean of 0.0005. Specifically, Figure 1 shows oil price volatility from 2012 to 2023 with four periods, namely the post global financial crisis (2012-2015), the US-Saudi Arabian oil conflict and the US-China trade conflict (2016-2019), the COVID-19 crisis (2020-2021), the Russia-Ukraine war (2022-2023). In the post-financial crisis period from 2012 to 2015, oil price volatility showed a stable fluctuation amplitude due to post-crisis production. During the US-Saudi Arabian oil conflict and the U.S.-China trade conflict between 2016 and 2019, there was great volatility in oil prices with a severe decline and bottomed out at 40% in 2018 from 2012. The reason is because Saudi Arabia sharply increased production under pressure from US and the US-China trade conflict. The oil price volatility decreased by more than 10% in 2023 because of the COVID-19 pandemic from 2020-2021 that led to an oil demand decline. At the end of 2021, oil prices dropped because of the new variant of COVID-19 in South Africa with a high risk of infection.
Oil price volatility fluctuated strongly between 2022 and 2023 and reached the highest level of more than 45% in March 2022 from 2008. The Russia-Ukraine war and G7 and its allied countries imposing of sanctions on Russian sectors (banking, logistics, and energy) caused the volatility. After that, oil prices "slid" because of weak oil demand from China, central banks raising interest rates, and concerns about an economic recession. Towards the end of 2023, oil price volatility annual price slide since 2020, despite geopolitical risks and the ongoing Israel-Hamas conflict in the Middle East.
Regarding market returns, we observed that the mean weekly market return for the studied period was 0.0006 with a standard deviation of 0.0118 (see Table 2). Figure 2 includes the market returns from 2012 to 2023 with three similar periods like oil price volatility. First, market returns in the post-global financial crisis period fluctuated slightly and maintained positive low profits due to TPP, FTA, expanding room for foreign investors. Second, market returns from 2016 to 2019 significantly rebounded and declined from April 2016 to December 2018, respectively. The undesirable impact of negative events, such as the Chinese stock market interrupting trading, the UK leaving the EU, and the results of the U.S. Presidential election were cause. From January to August, 2019, market returns had a strong recovery due to comprehensive restructuring of the stock market and the passage of a new security law. Third, market returns recovered spectacularly from 2021-2022. Fourth, market returns experienced multiple negative changes in the period 2022-2023, declining more than 33.6% compared to the peak on January 10, 2022. The prolonged geopolitical tensions between Russia - Ukraine and Israel - Hamas, contributed to the negative effects.
In summary, in 2012-2023, notable changes, such as the post-global financial crisis, the US-Saudi Arabian oil conflict and the US-China trade conflict, the COVID-19 crisis, the Russia-Ukraine war significantly impacted oil price volatility and market returns. However, the oil price volatility and market yields change are reversing after 2023.
4.2. The Estimation of Oil Prices Volatility
In this study, oil prices volatility (conditional variance) is generated by using the GARCH(1,1) model. Table 3 includes a summary of results derived from the GARCH(1,1) model. The estimated values of the conditional variance equation (ht) provide a series of the real oil prices volatility. Specifically, the results of GARCH(1,1) reveal that the coefficients of ARCH (γ) and GARCH (δ) are significant at the one level and the sum of the two coefficients is less than one, indicating that the model is stationary.
4.3. Unit Root Tests
Before conducting the NARDL bound test for cointegration, we employed the ADF test to check whether the variables used in the model fulfil the stationary condition of the bound test. We performed for both cases of constant only and constant with time trend. Table 4 contains the results of the ADF test. The null hypothesis of a unit root is significantly rejected at the one percent level for R and LNGPR series, meaning that these series are integrated to the order zero. Besides, the results of the ADF test reveal that the null hypothesis of a unit root cannot be rejected at the significant level of five percent for , and LNG series. However, when the test is applied for the first differences of these variables, the null hypothesis is significantly rejected at the one percent level. According to these findings, , and LNG series are integrated of order 1. With the evidence, we concluded all the variables in the model fulfil the conditions of the NARDL bound test (the order of integration less than 2).
*** indicates significance at 1% level. The numbers in the parentheses represent the lag section based on AIC criteria.
4.4. ARDL Bound Test for Cointegration
As discussed above, We employ the NARDL bound test proposed by Shin et al. (2014) to determine the cointegration between variables in the model. Based on the Akaike Information Criterion, the best model for the bounds test is ARDL (1,0,2,0,1). Table 5 contains the results of the bounds reported. According to these results, the null hypothesis of no cointegration among variables can be rejected at the significant level of one percent. The rejection of the null hypothesis means that there is a long-term equilibrium relationship between the market returns and the independent variables in the model. Therefore, the NARDL model can be employed to estimate the short-term and long-term coefficients of the model.
4.5. Short Term and Long-Term Effects of Oil Price Volatility on the Market Returns
With the evidence of long-run equilibrium relationship between the market returns and the regressors, the short-term and long-term asymmetric effects of oil price volatility on the market returns are estimated by employing the NARDL (1,0,2,0,1) model. Table 6 has the summary of the estimated short-term and long-term coefficients of the NARDL model. In the short-term, the oil price volatility has significantly negative asymmetric effects on the market returns at the five percent level. It means that the positive and negative changes in oil price volatility have a different effect on the market returns. Specifically, a one percent increase in oil price volatility immediately leads to a 2.6868 percent decrease in the market returns while the same magnitude decrease in oil price volatility is associated with a 6.3180 percent increase in the market returns. In addition, the short-term results indicate that previous week’s negative shocks in oil price volatility have a significantly negative effect on the market returns at the one percent level significance. Specifically, one percent decrease in oil price volatility at the current week is associated with 11.6117 percent increase in the market returns at the next week. However, according to the results summarized in Table 6, in the short-term, the GPR and gold prices have no effects on the market returns. Moreover, the coefficient of error correction terms is -0.9821 and statistically significant at the one percent level, implying that 98.21 percent of the disequilibria from the previous week is converged and corrected back to the long-run equilibrium in the current week.
In the long-term, the estimated results confirm that both the negative and positive changes of the oil price volatility have significantly negative effects on the market returns at the one percent level. Specifically, in the long-term, a one percent increase in oil price volatility is associated with a 2.7358 percent decrease in the market returns, while a one percent decrease in the oil price volatility results in a 2.7298 percent increase in the market returns. In addition, the results of the NARDL model indicate that in the long-term, the GPR has a significantly negative effect on the market returns at the five percent level. Specifically, in the long-term, a one percent increase in the GPR index leads to 0.0077 percent decrease in the HOSE’ returns. However, in the long-term, gold prices have no significant effects on the market returns.
The overall finding of this study is that oil price volatility has negative asymmetric effects on market returns for the HOSE. This evidence is in line with previous findings by Diaz et al. (2016), Joo and Park (2017), Joo and Park (2021), Luo and Qin (2017), Rahman (2021), and Xiao et al. (2018). The negative effects of oil price volatility on market returns of the HOSE could be explained by other reasons. First, oil price volatility could deteriorate economic activities. Therefore, it has a negative effect on expected returns of stocks. In addition, oil price volatility can be seen as a systematic stocks risk. Therefore, a higher oil price volatility is associated with higher discount rates. According to the cash-flow theory, higher oil price volatility leads to lower stock returns. Moreover, according to results of the error correction model 98.21 percent of the disequilibria from the previous week is converged and corrected back to the long-run equilibrium in the current week. The adjustment speed in this case is very high, meaning that the system quickly reverts to the long-term equilibrium after a short-term shock.
4.6. Diagnostic Tests for the ARDL Model
We used the diagnostic tests of Breach-Godfrey for serial correlation and ARCH (autoregressive conditionally heteroscedastic) for heteroscedasticity to check the validity and reliability of the estimated results from the NARDL approach. Table 7 includes the results of Breusch-Godfrey and ARCH tests. According to these results, the null hypothesis of no serial correlation in the model at the significance level of five percent cannot be rejected, meaning that serial correlation is not present in the residuals. Moreover, according to the results of ARCH test we cannot reject the null hypothesis of no ARCH effects at the significance level of 5%. This evidence implies that the residuals of the model are homoscedasticity. These diagnostic tests ensure the reliability and validity of the estimated results.
4.7. Structural Stability Tests
We need to check the stability of the estimated coefficients because the NARDL approach is sensitive to structural breaks while the studied variables are sensitive to global events. In this study we used the cumulative sum of the recursive residuals (CUSUM) and the cumulative sum of squared recursive residuals (CUSUMSQ) tests proposed by Brown et al. (1975) to investigate the long-term stability of the coefficients in the model. Figure 3 and Figure 4 include the results of the tests. According to these findings, the plots of CUSUM and CUSUMSQ line are within the critical bounds at the five percent level of significance. These results indicate that the model is stable over the sample period.
5. Conclusion
We sought to investigate the asymmetric effects of oil price volatility on stock returns for the HOSE, a frontier stock market from 6 February 2012 to 31 December 2023. Using the NARDL bounds testing approach, the empirical results indicate that oil price volatility has negative asymmetric effects on the market returns in both the short-term and long-term. It means that positive and negative changes in oil price volatility have different impact on the market returns. Specifically, in the short-term, a one percent increase in oil price volatility immediately leads to a 2,6868 percent decrease in the market returns while a one percent decrease in oil price volatility is associated with 6.3180 percent increase in the market returns. In the long-term, a one percent increase in oil price volatility is associated with 2.7358 percent decrease in the market returns. Similarly, one percent decrease in oil price volatility leads to 2.7298 percent increase in the market returns. In addition, the results of the NARDL model indicate that the GPR has no effect on the market returns in the short-term, but has a significantly negative effect on the market returns in the long-term. Moreover, this study does not find any evidence for the relationship between gold prices and the market returns. Finally, the results of the error correction model confirm that 98.21 percent of the disequilibria from the previous week is converged and corrected back to the long-run equilibrium in the current week.
The findings of this study imply that the HOSE is capturing the effects of oil price volatility on various economic activities. Therefore, financial experts could use oil price fluctuation to forecast the future economics. Based on this implication, we propose that investors in frontier markets can utilize oil price volatility to predict stock returns and establish effective hedging strategies. In addition, because oil market volatility can cause economic depreciation, thus negatively impacting the stock market, we recommend that governments should have policies to reduce the oil price volatility. Specifically, they could increase strategic oil reserves as a means to protect their economies from the risk of oil price shocks. In addition, government leaders should appropriately use the oil price stabilization fund to restrain increases in oil prices to reduce the effects of oil price fluctuations on the economy in general and on the stock market in particular.
Although this study’s findings add and enhance people’s knowledge about the effects of oil price volatility on stock returns in a frontier stock market, it has limitations that researchers need to address in future empirical studies. First, we only examined the effects of oil price volatility on the aggregative stock market returns. However, the effects of oil price volatility on stock returns differ among industries. Therefore, researchers could focus on the effects of oil price volatility on stock returns at the industry level. Second, in this study we investigated the effects of oil price volatility on stock returns without considering the moderating effect of the COVID-19 pandemic. This limitation could be an interesting topic for further research.
References
- Anand B., Sunil Paul, and M. Ramachandran. 2014. Volatility spillover between oil and stock market returns. Indian Economic Review, 49(1): 37-56. http://www.jstor.org/stable/24583406.
- Bahmani-Oskooee, Mohsen, Seyed Hesam Ghodsi, and Muris Hadzic. 2019. Asymmetric causality between oil price and stock returns: A sectoral analysis. Economic Analysis and Policy, 63: 165-174. [CrossRef]
- Basher, Syed A., and Perry Sadorsky. 2006. Oil price risk and emerging stock markets. Global Finance Journal, 17(2): 224-251. [CrossRef]
- Basher, Syed Abul, Alfred A. Haug, and Perry Sadorsky. 2012. Oil prices, exchange rates and emerging stock markets. Energy Economics, 34(1): 227-240. [CrossRef]
- Bouri, Elie. 2015. Oil volatility shocks and the stock markets of oil-importing MENA economies: A tale from the financial crisis. Energy Economics, 51: 590-598. [CrossRef]
- Brown, Robert L., James Durbin, and James M. Evans. 1975. Techniques for testing the constancy of regression relationships over time. Journal of the Royal Statistical Society, 37(2): 149-163. [CrossRef]
- Caldara, Dario, and Matteo Iacoviello. 2022. Measuring geopolitical risk. American Economic Review, 112: 1194-1225. [CrossRef]
- Chen, Chun-Da, Chiao-Ming Cheng, and Riza Demirer. 2017. Oil and stock market momentum. Energy Economics, 68: 151-159. [CrossRef]
- Chen, Shiu-Sheng. 2009. Do higher oil prices push the stock market into bear territory? Energy Economics, 32(2): 490-495. [CrossRef]
- de Jesus, Diego Pitta, Bruno Felipe Lenin Souza Bezerra, and Cássio da Nóbrega Besarria. 2020. The non-linear relationship between oil prices and stock prices: Evidence from oil-importing and oil-exporting countries. Research in International Business and Finance, 54: 1-14. [CrossRef]
- Diaz, Elena Maria, Juan Carlos Molero, and Fernando Perez de Gracia. 2016. Oil price volatility and stock returns in the G7 economies. Energy Economics, 54: 417-430. [CrossRef]
- Driesprong, Gerben, Ben Jacobsen, and Benjamin Maat. 2008. Striking oil: Another puzzle? Journal of Financial Economics, 89(2): 307-327. [CrossRef]
- Dutta, Anupam, Jussi Nikkinen, Timo Rothovius. 2017. Impact of oil price uncertainty on Middle East and African stock markets. Energy, 123: 189-197. [CrossRef]
- Filis, George. 2010. Macro economy, stock market and oil prices: Do meaningful relationships exist among their cyclical fluctuations? Energy Economics, 32(4): 877-886. [CrossRef]
- Gjerde, Øystein, and Frode Sættem. 1999. Causal relations among stock returns and macroeconomic variables in a small, open economy. Journal of International Financial Markets, Institutions & Money, 9(1), 61-74. [CrossRef]
- Huber, Peter. 1997. Stock market returns in thin markets: Evidence from the Vienna Stock Exchange. Applied Financial Economics, 7: 493-498. [CrossRef]
- Jiang, Wei, and Yan Liu. 2021. The asymmetric effect of crude oil prices on stock prices in major international financial markets. North American Journal of Economics and Finance, 56: 1-15. [CrossRef]
- Jones, Charles M., and Gautam Kaul. 1996. Oil and the stock markets. Journal of Finance, 51: 463-491. [CrossRef]
- Joo, Young C., and Sung Y. Park. 2017. Oil prices and stock markets: Does the effect of uncertainty change over time? Energy Economics, 61: 42-51. [CrossRef]
- Joo, Young C., and Sung Y. Park. 2021. The impact of oil price volatility on stock markets: Evidences from oil-importing countries. Energy Economics, 101: 1-13. [CrossRef]
- Kollias, Christos, Catherine Kyrtsou, and Stephanos Papadamou. 2013. The effects of terrorism on the oil pricestock index relationship. Energy Economics, 40: 743-752. [CrossRef]
- Luo, Xingguo, and Shihua Qin. 2017. Oil price uncertainty and Chinese stock returns: New evidence from the oil volatility index. Finance Research Letters, 20: 29-34. [CrossRef]
- Narayan, Paresh Kumar, and Seema Narayan. 2010. Modelling the impact of oil prices on Vietnam’s stock prices. Applied Energy, 87(1): 356-361. [CrossRef]
- Papapetrou, Evangelia. 2001. Oil price shocks, stock market, economic activity and employment in Greece. Energy Economics, 23(5): 511-532. [CrossRef]
- Park, Jungwook, and Ronald A. Ratti. 2008. Oil price shocks and stock markets in the US and 13 European countries. Energy Economics, 30(5): 2587-2608. [CrossRef]
- Pesaran, M. Hashem, Yongcheol Shin, and Richard J. Smith. 2001. Bounds testing approaches to the analysis of level relationships. Journal of Applied Econometrics, 16: 289-326. [CrossRef]
- Rahman, Sajjadur. 2021. Oil price volatility and the US stock market. Empirical Economics, 61(3): 1461-1489. [CrossRef]
- Raza, Naveed, Syed Jawad Hussain Shahzad, Aviral Kumar Tiwari, and Muhammad Shahbaz. 2016. Asymmetric impact of gold, oil prices and their volatilities on stock prices of emerging markets. Resources Policy, 49: 290-301. [CrossRef]
- Sadorsky, Perry. 1999. Oil price shocks and stock market activity. Energy Economics, 21(5), 449–469. [CrossRef]
- Sarwar, Suleman, Aviral Kumar Tiwari, and Cao Tingqiu. 2020. Analyzing volatility spillovers between oil market and Asian stock markets. Resources Policy, 66: 2-12. [CrossRef]
- Shin, Yongcheol, Byungchul Yu, and Matthew Greenwood-Nimmo. (2014). Modelling asymmetric cointegration and dynamic multipliers in a nonlinear ARDL framework. In Festschrift in Honor of Peter Schmidt: Econometric methods and applications; Sickles, Robin C., and William C. Horrace, Eds; Springer: New York, NY, USA, 281-314.
- Silvapulle, Param Silvapulle, Russell Smyth, Xibin Zhang, Jean-Pierre Fenech. 2017. Nonparametric panel data model for crude oil and stock prices in net oil importing countries. Energy Economics, 67: 255-267. [CrossRef]
- Smyth, Russell, and Paresh Kumar Narayan. 2018. What do we know about oil prices and stock returns? International Review of Financial Analysis, 57: 148-156. [CrossRef]
- Truong, Loc Dong, H. Swint Friday, and Tan Duy Pham. 2024. The effects of geopolitical risk on foreign direct investment in a transition economy: Evidence from Vietnam. Journal of Risk and Financial Management, 17(3), 1-14. [CrossRef]
- Truong, Loc Dong, Anh Thi Kim Nguyen, and Dut Van Vo. 2021. Index future trading and spot market volatility in frontier markets: Evidence from Ho Chi Minh Stock Exchange. Asia-Pacific Financial Markets, 28(3): 353-366. [CrossRef]
- Xiao, Jihong, Min Zhou, Fengming Wen, and Fenghua Wen. 2018. Asymmetric impacts of oil price uncertainty on Chinese stock returns under different market conditions: Evidence from oil volatility index. Energy Economics, 74: 777-786. [CrossRef]
- Zhu, Hui-Ming, Rong Li, and Sufang Li. 2014. Modelling dynamic dependence between crude oil prices and Asia Pacific stock returns. International Review of Economics and Finance, 29, 208-223. [CrossRef]
- Zhu, Hui-Ming, Su-Fang Li, and Keming Yu. 2011. Crude oil shocks and stock markets: A panel threshold cointegration approach. Energy Economics, 33(5): 987-994. [CrossRef]
Figure 1.
Oil prices volatility during the period 2012–2023.
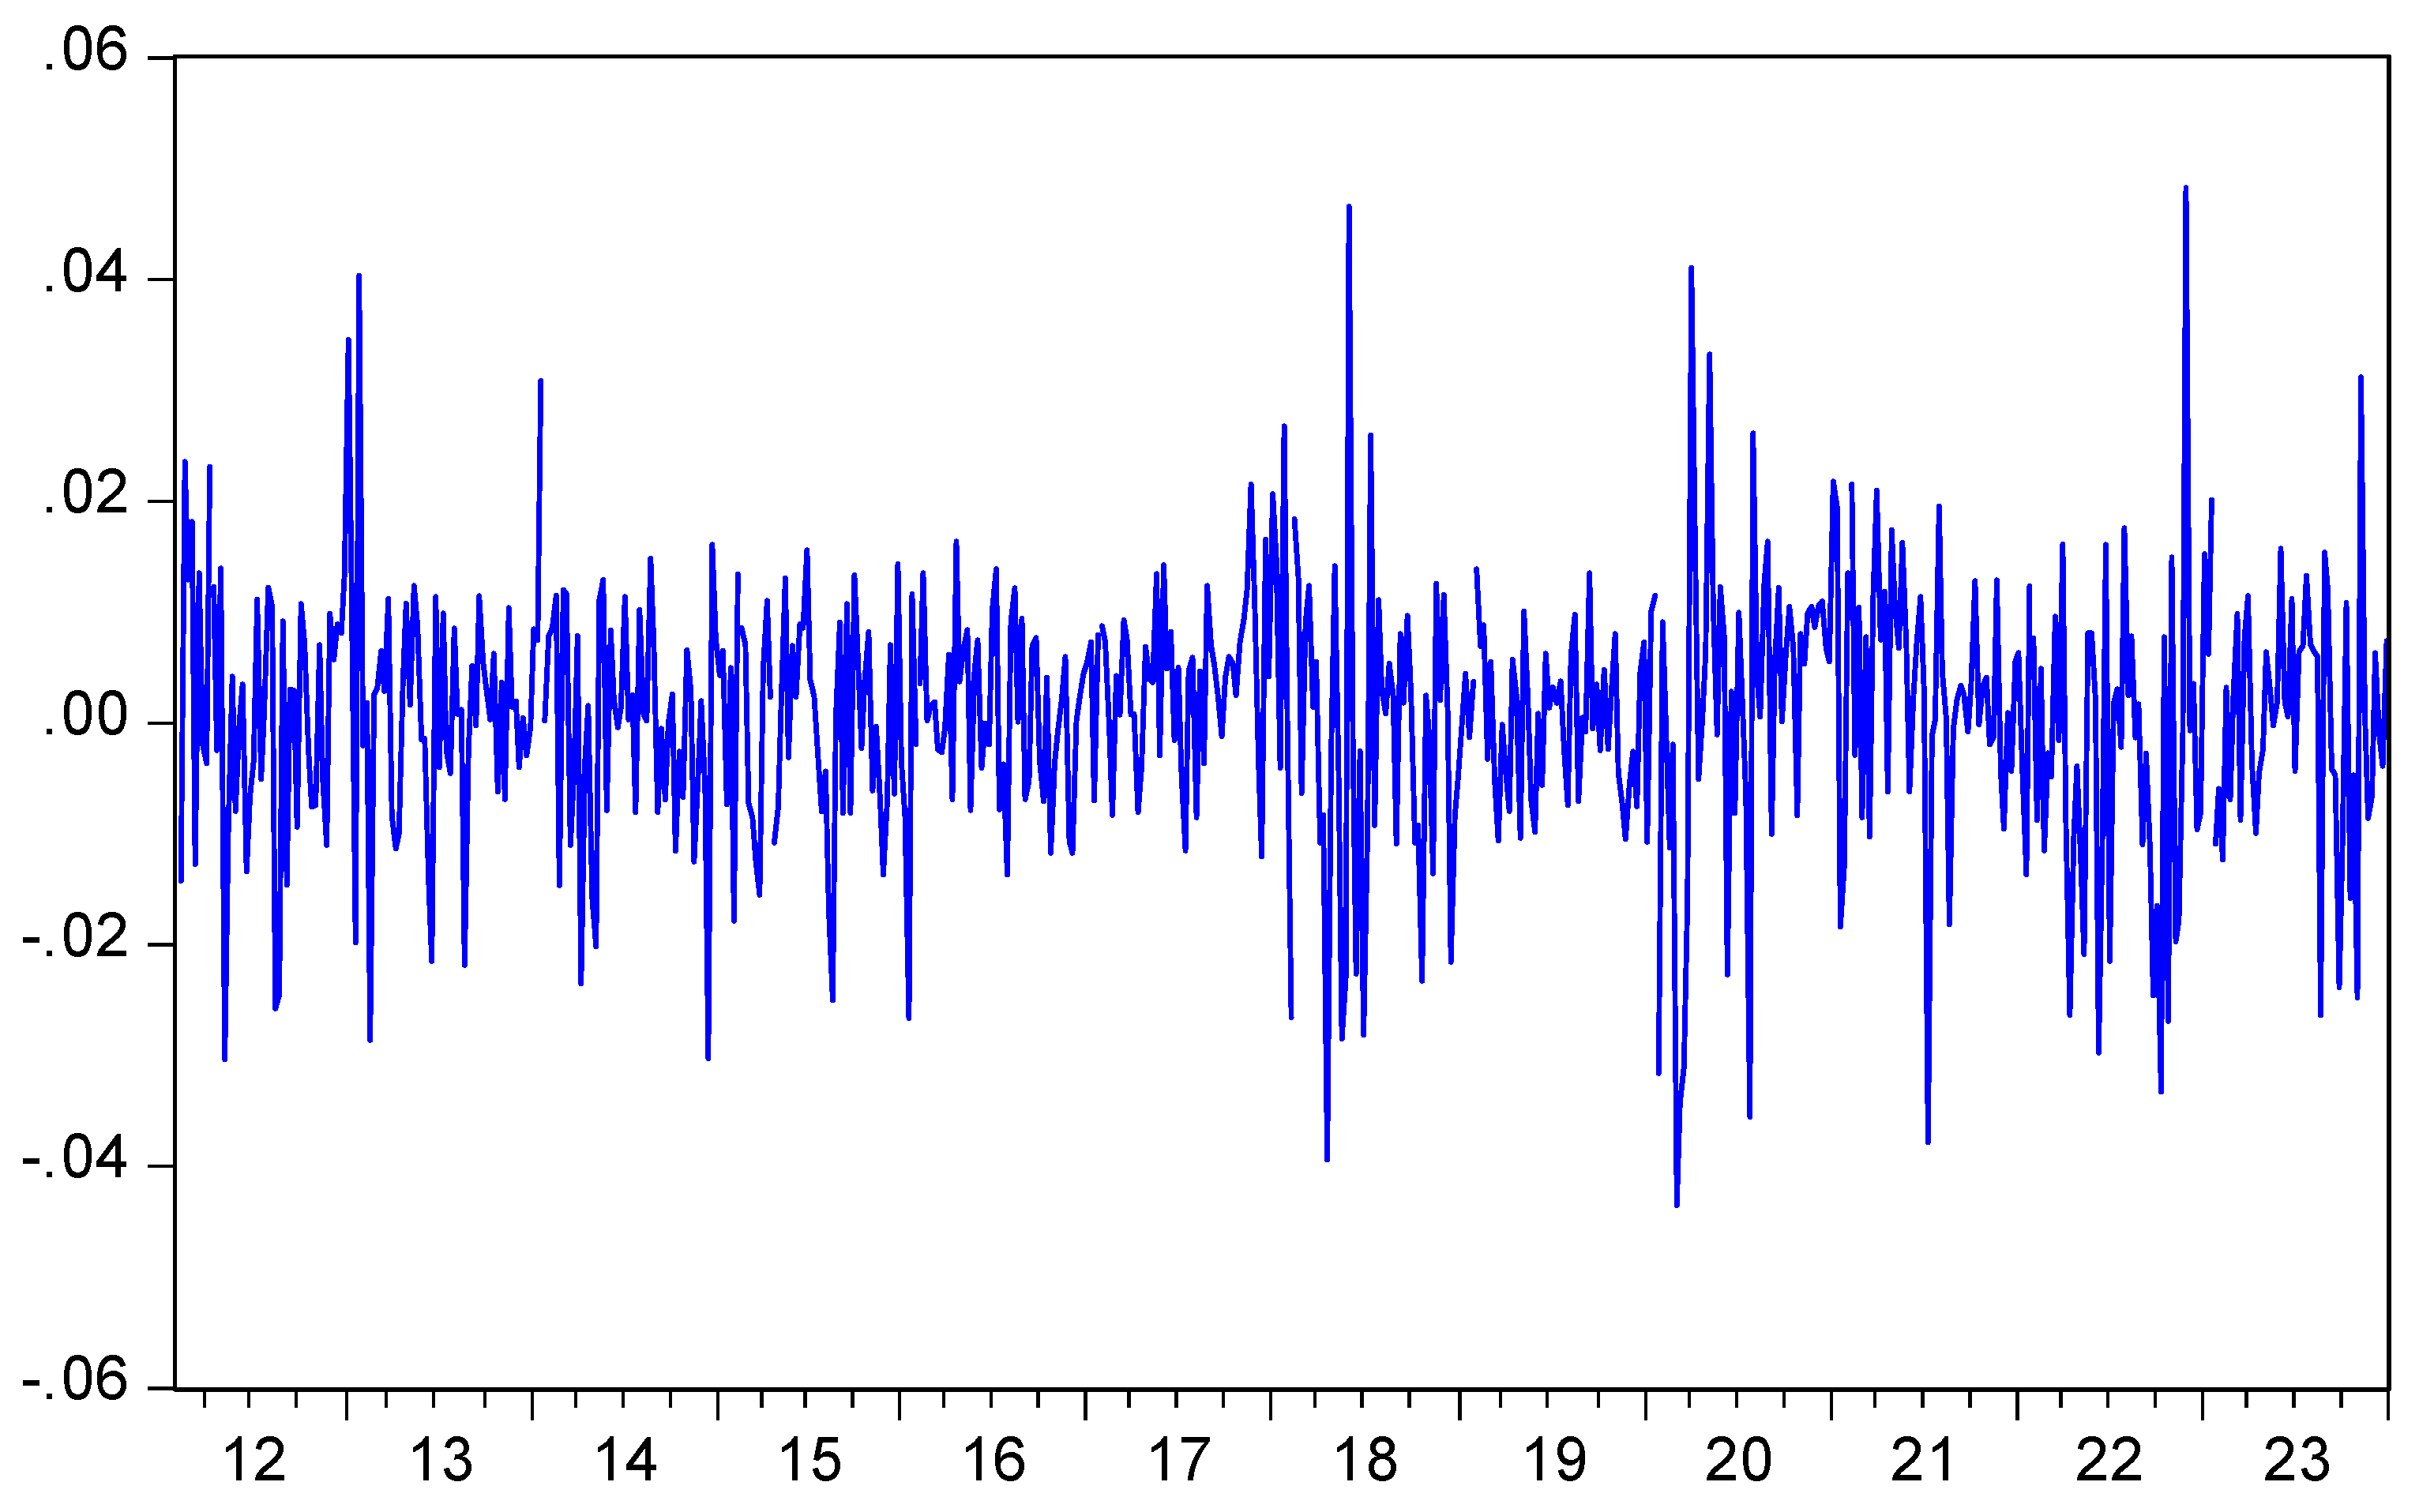
Figure 2.
The market returns for the period 2012–2023.
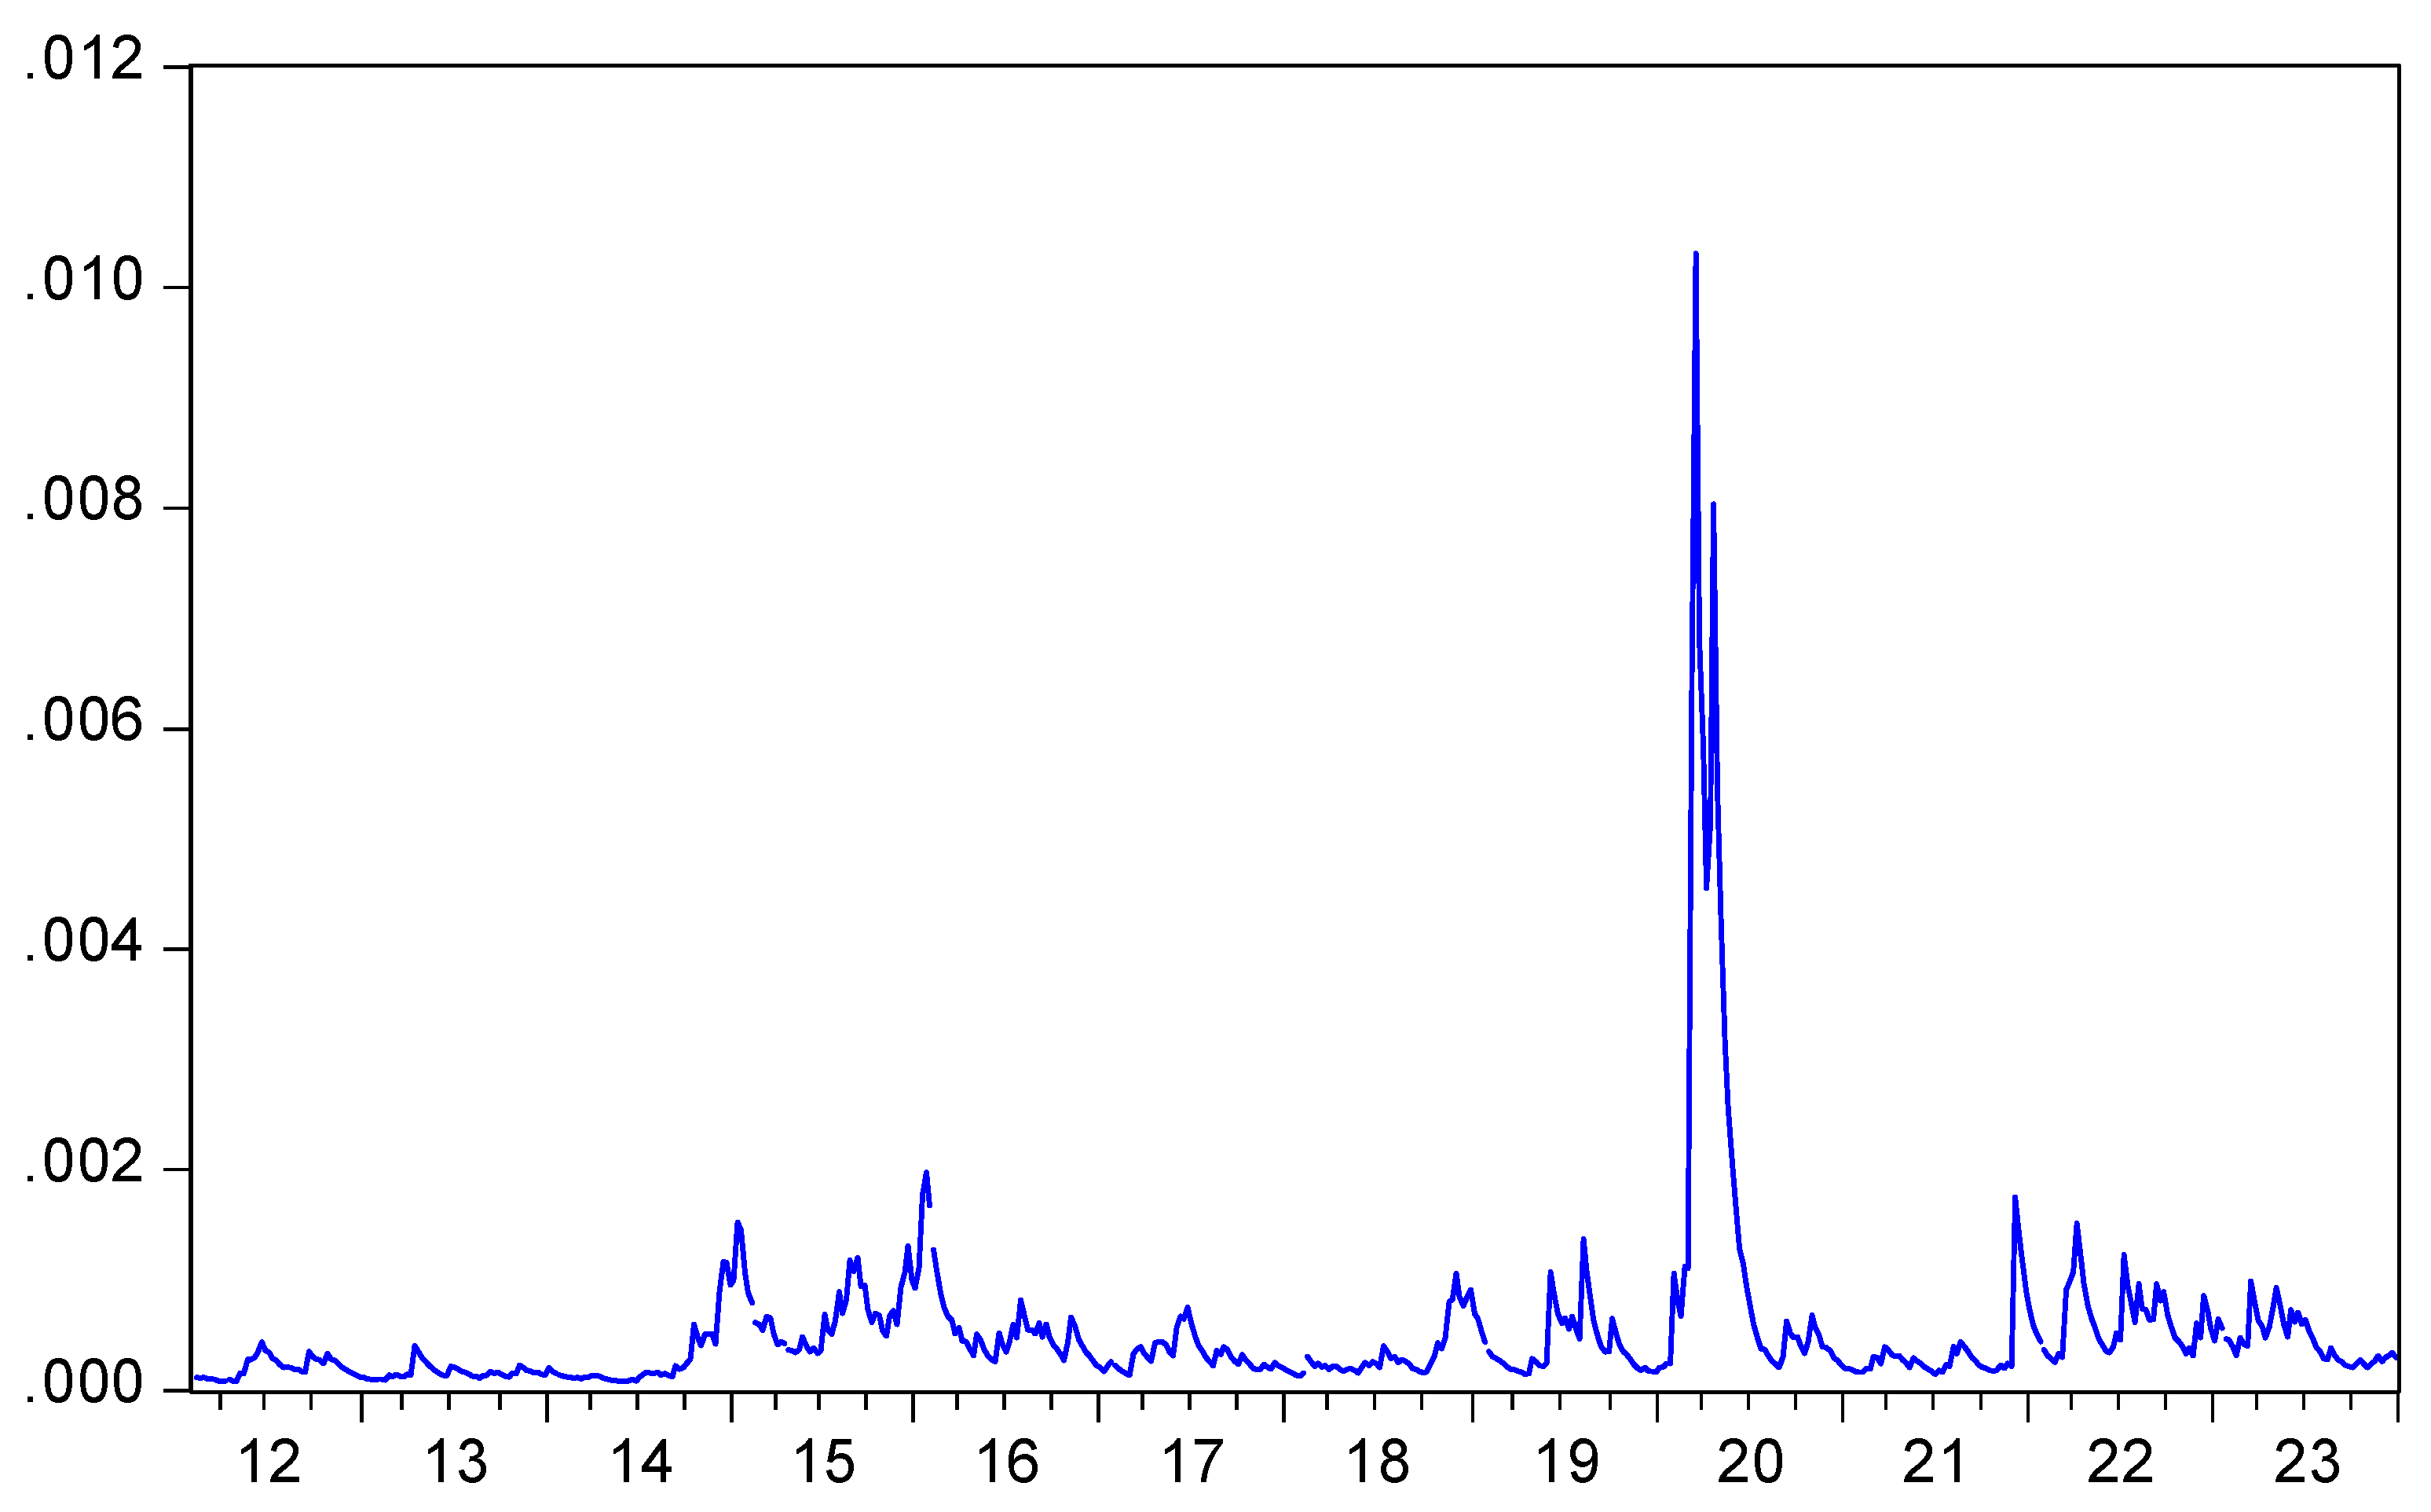
Figure 3.
Plots of cumulative sum of recursive residuals.
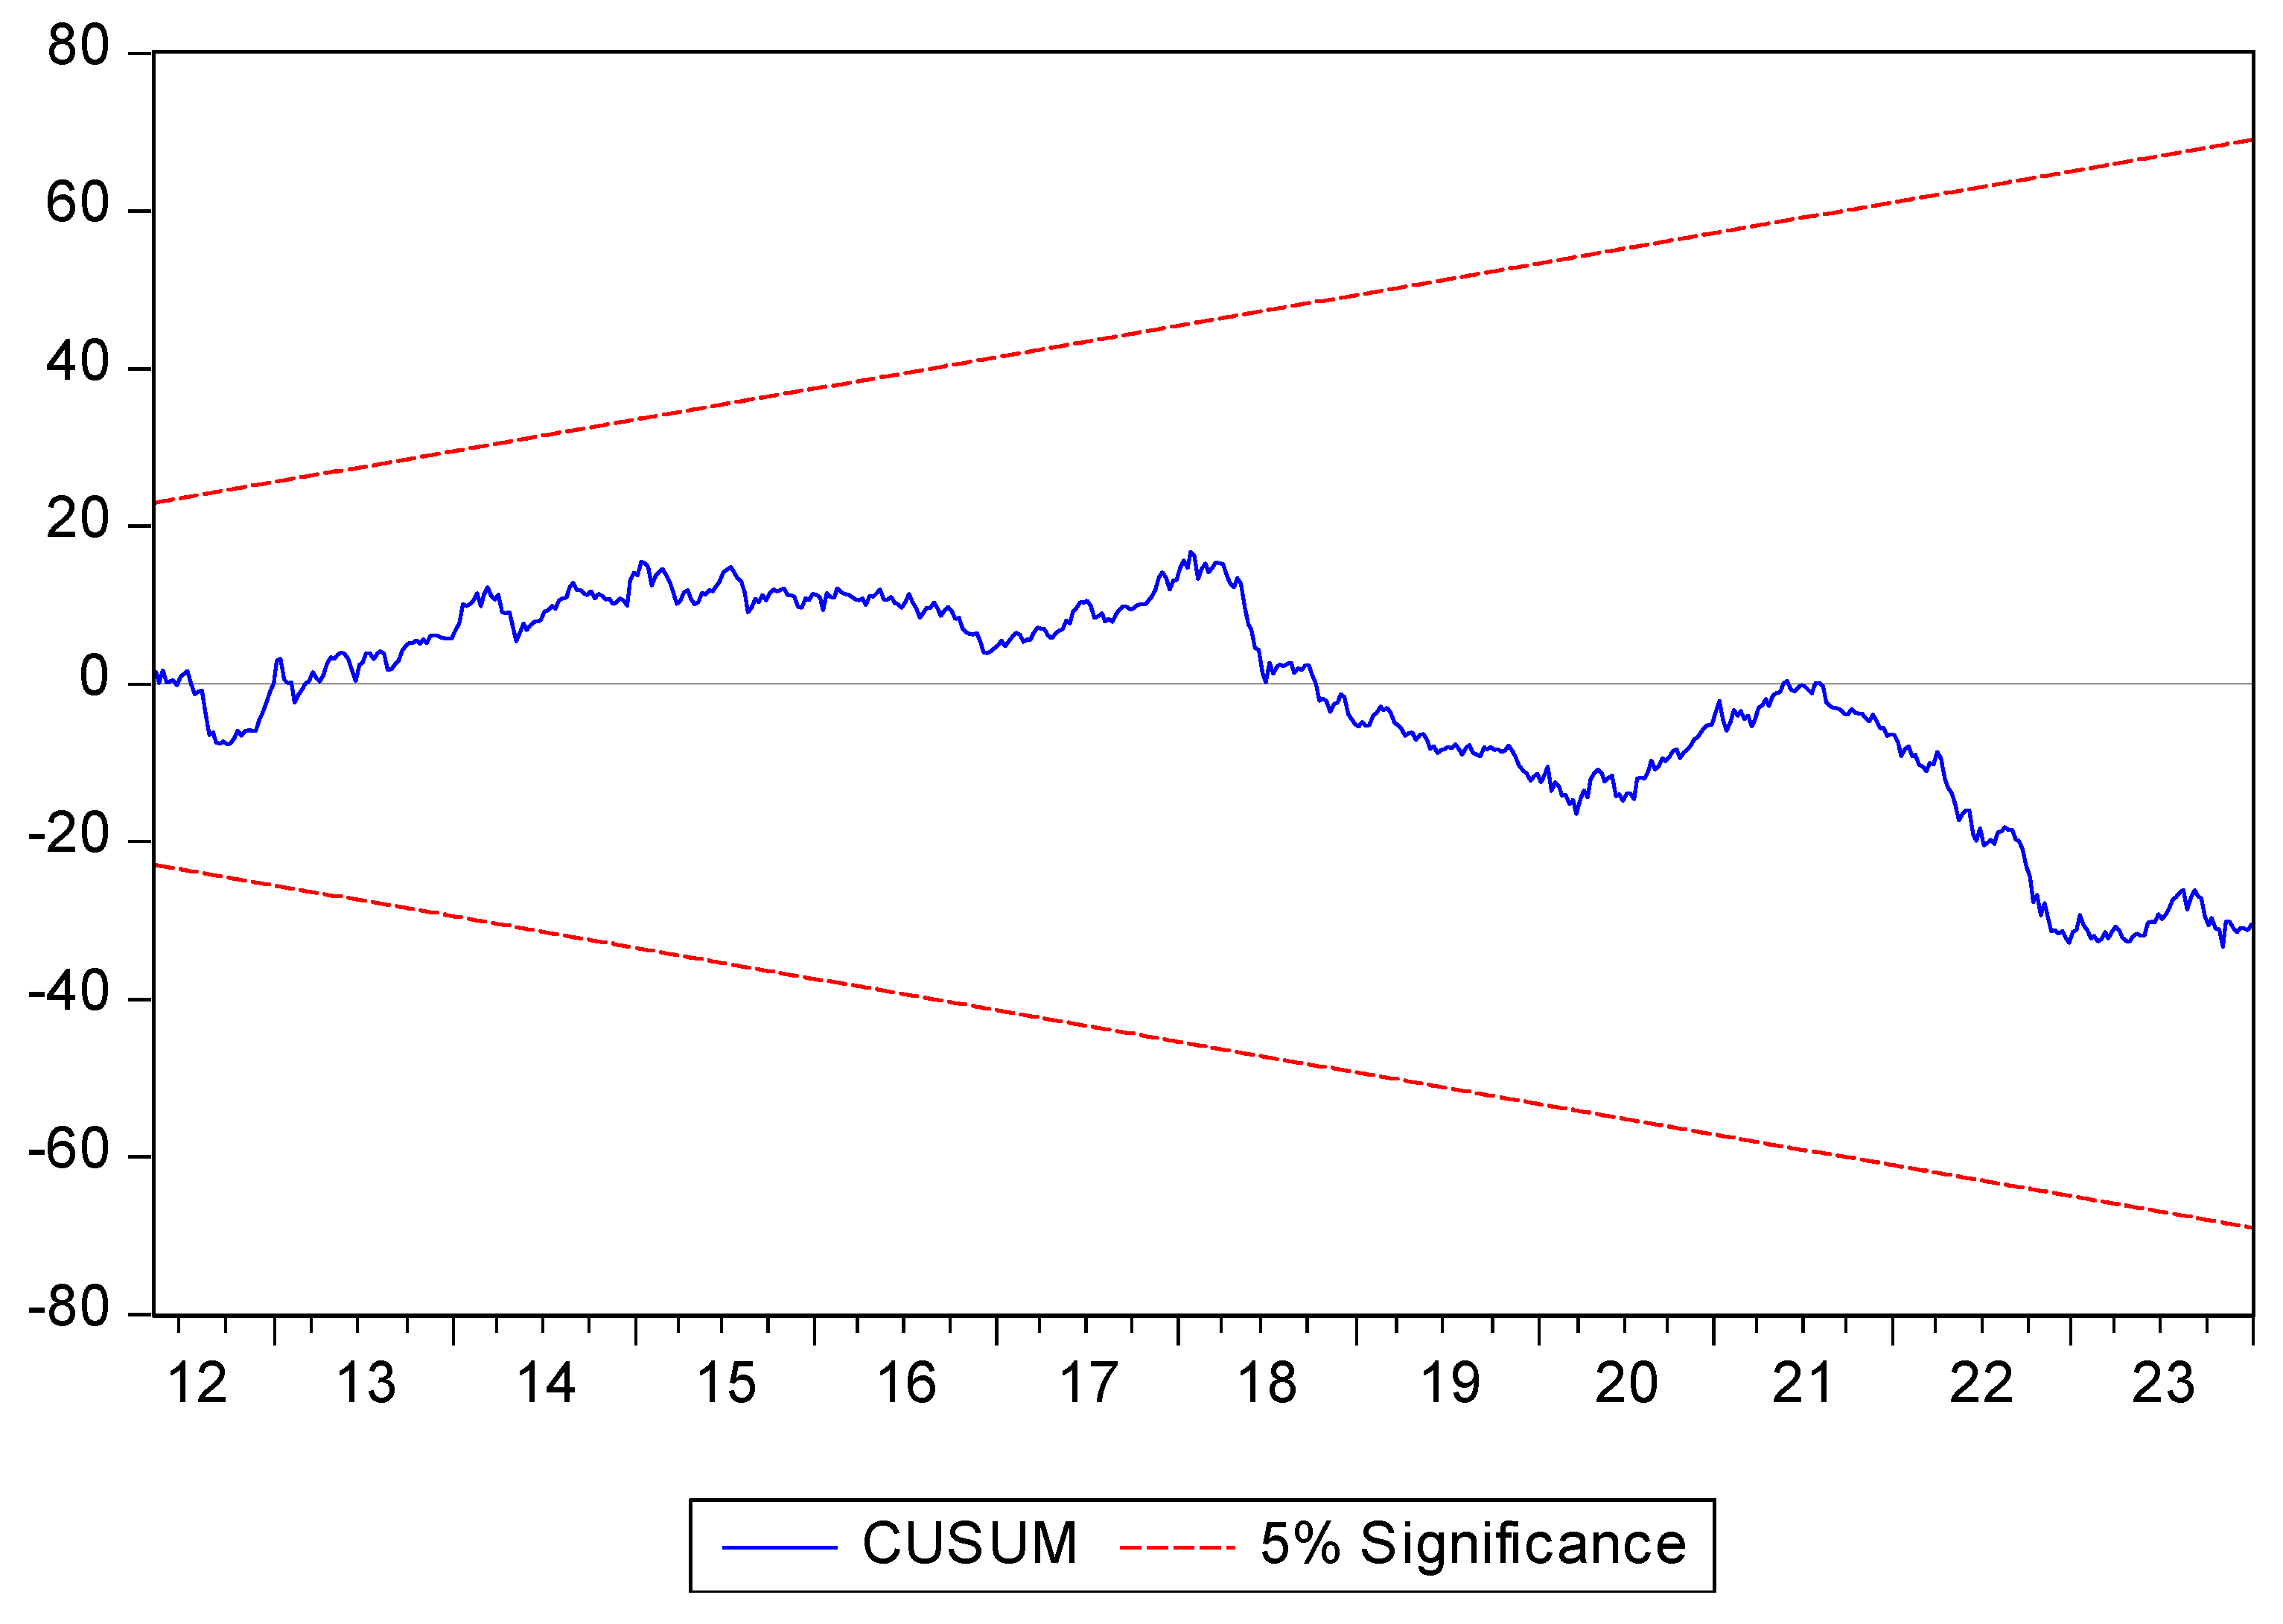
Figure 4.
Plots of cumulative sum squares of recursive residuals.
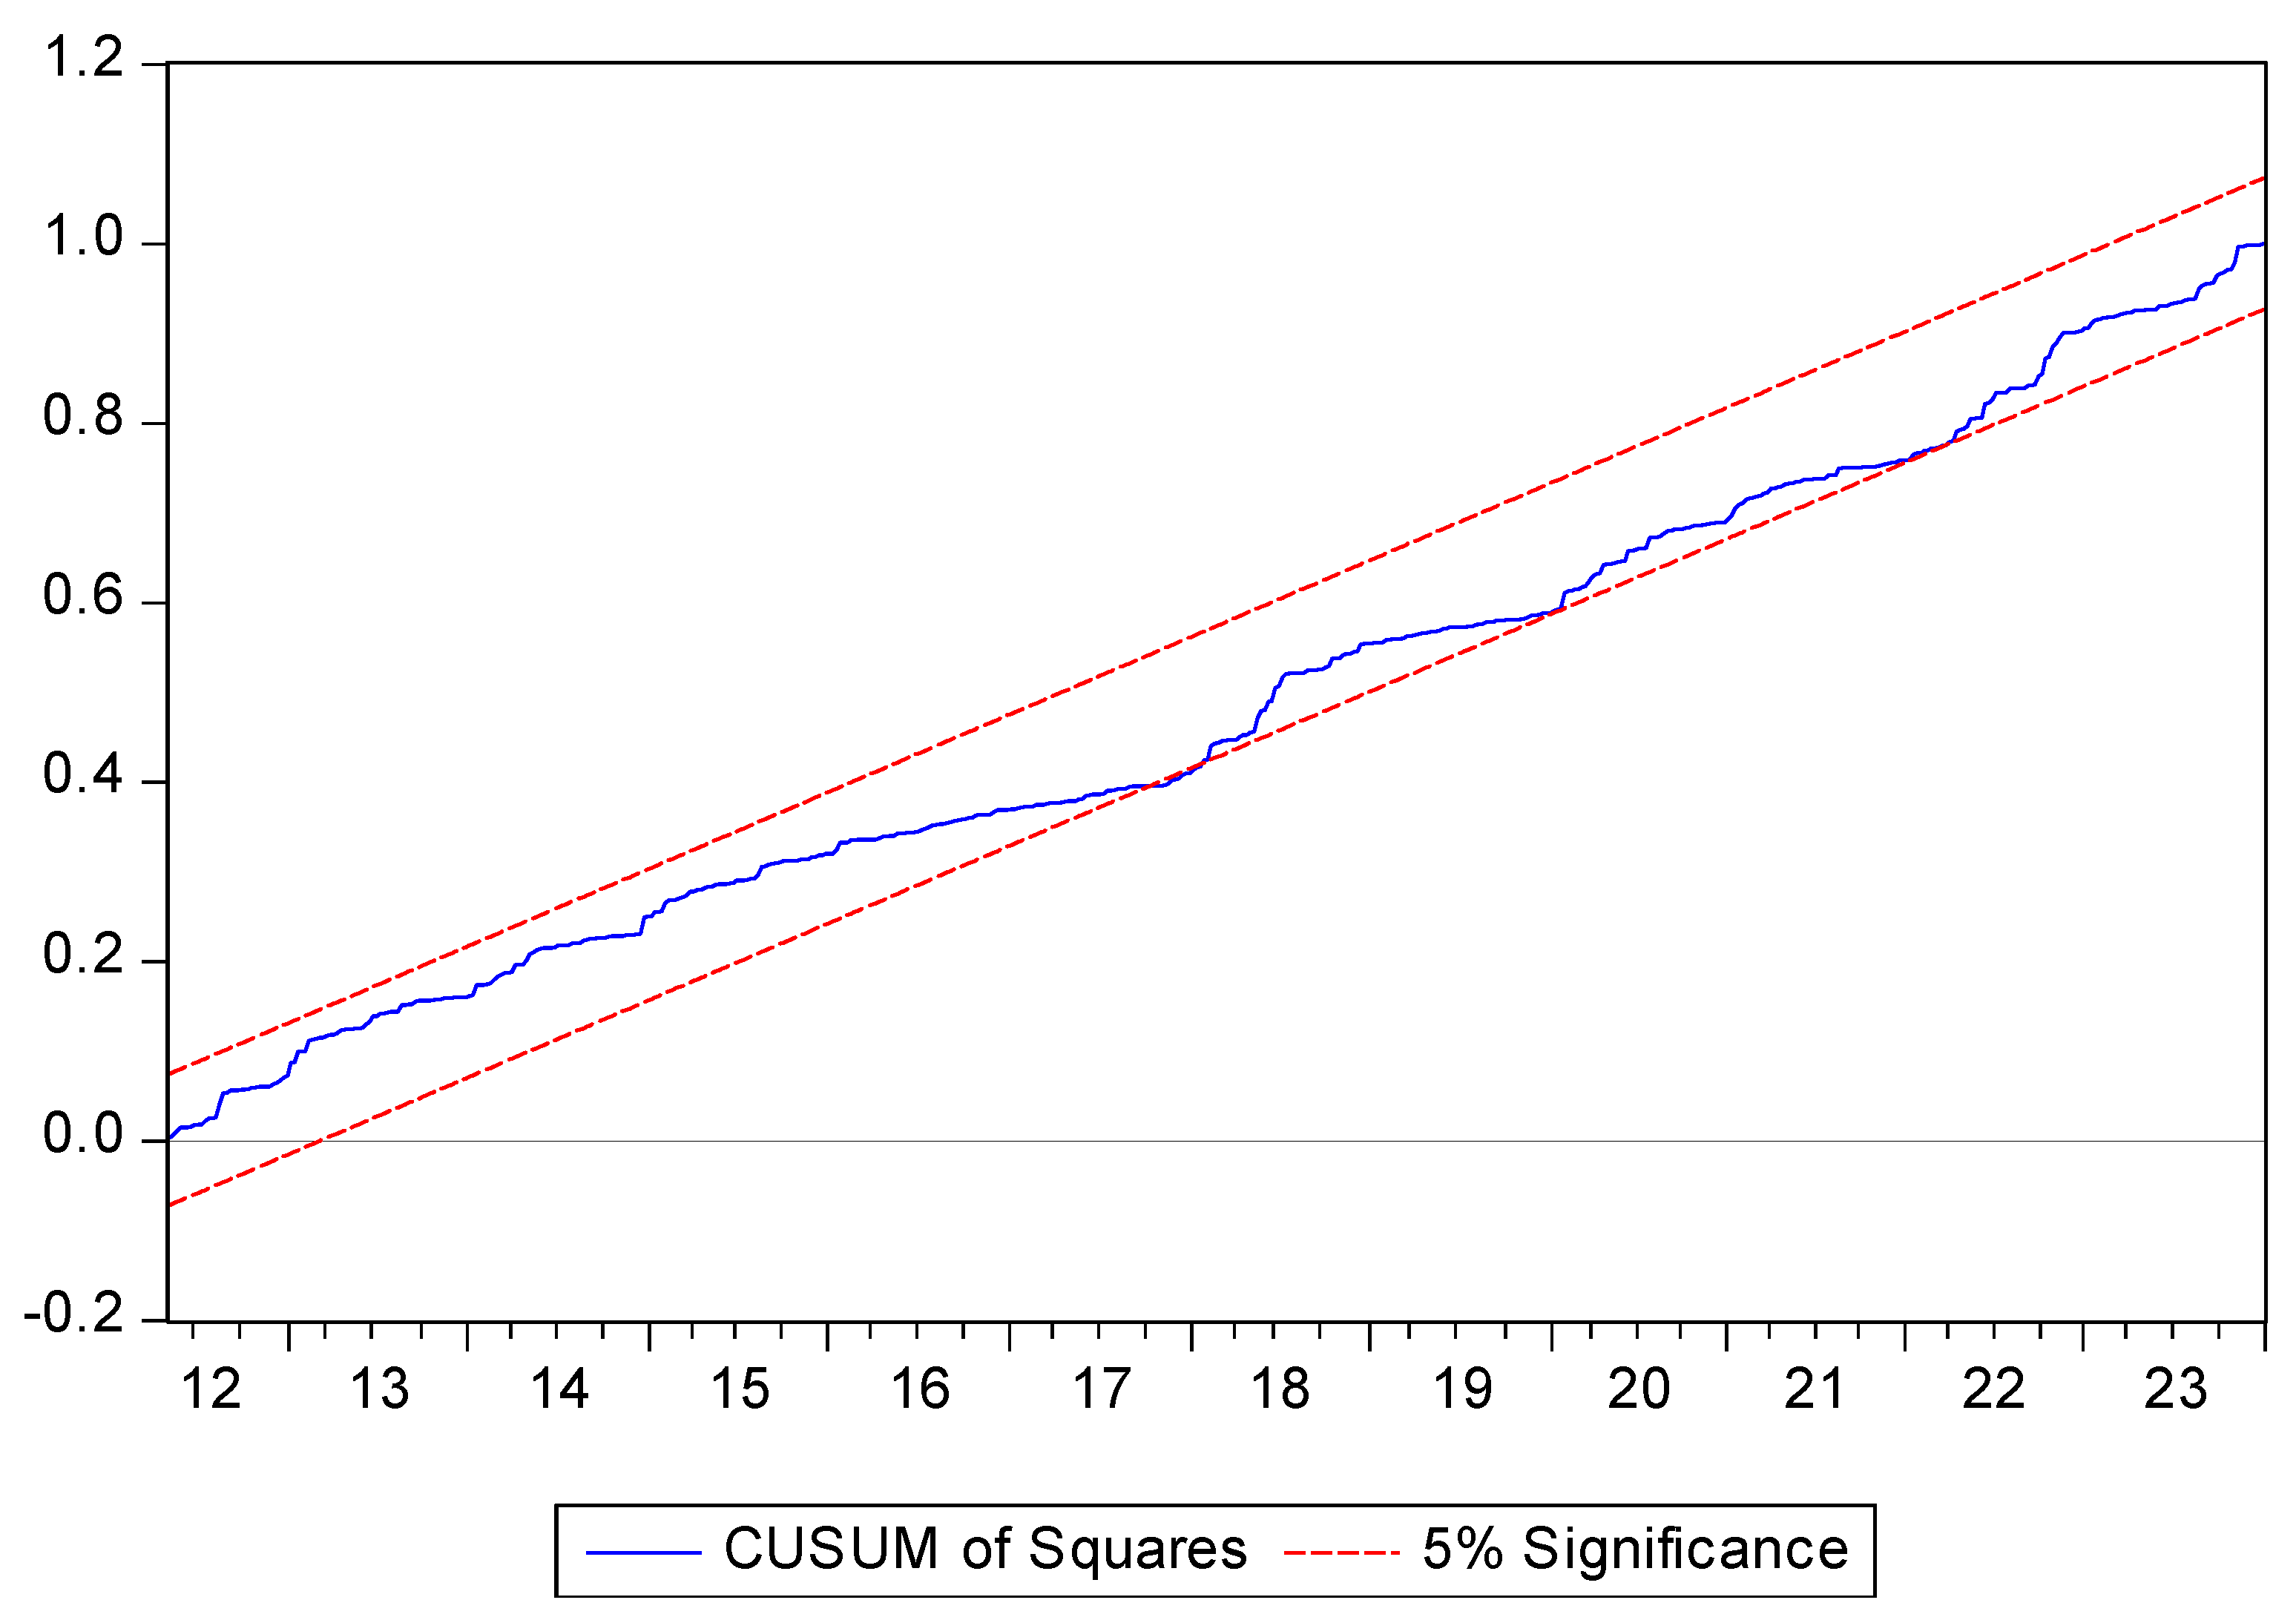

Table 1.
Data sources of the study.
| Data | Data source |
|---|---|
| VN30-Index | Investing.com (https://www.investing.com, accessed on 30 January 2024) |
| Oil prices | Investing.com (https://www.investing.com, accessed on 15 January 2024) |
| GPR Index | Caldara and Iacoviello’s website (https://www.matteoiacoviello.com, accessed on 15 January 2024) |
| Gold prices | Investing.com (https://www.investing.com, accessed on 15 January 2024) |
Table 2.
Summary statistics of oil prices volatility and the market returns (2012-2023).
| Variables | Observations | Minimum | Mean | Maximum | Standard deviation |
|---|---|---|---|---|---|
| VOL | 607 | 0.0001 | 0.0005 | 0.0103 | 0.0008 |
| R | 607 | -0.0435 | 0.0006 | 0.0483 | 0.0118 |
Source: Own calculation on the data obtained from the Investing.com.
Table 3.
The results of the GARCH(1,1) model.
| Variables | Coefficients | t-statistics |
|---|---|---|
| Conditional mean equation | ||
| 0.02666 | 2.52** | |
| 0.98617 | 174.59*** | |
| Observations | 607 | |
| Conditional variance equation | ||
| 0.00003 | 4.49*** | |
| γ | 0.75242 | 22.37*** |
| δ | 0.20103 | 7.33*** |
*** and ** indicate significance at 1% and 5% levels respectively. .
Table 4.
Results of ADF unit root tests.
| Variable | Constant without trend | Constant with trend |
|---|---|---|
| R | ||
| Level | -23.17*** (0) | -23.17*** (0) |
| Level | 0.26 (7) | -2.18 (7) |
| First difference | -7.12*** (6) | -7.18*** (6) |
| Level | 0.61 (10) | -1.95 (10) |
| First difference | -6.51*** (9) | -6.63*** (9) |
| LNGPR | ||
| Level | -8.30*** (2) | -8.67***(2) |
| LNG | ||
| Level | -0.94 (0) | -2.44 (0) |
| First difference | -25.07*** (0) | -25.17*** (0) |
Table 5.
Results of the bounds test.
| Model | k | F-statistic | Significance level | Critical value | |
|---|---|---|---|---|---|
| Lower bounds I(0) | Upper bounds I(1) | ||||
| NARDL (1,0,2,0,1) |
4 | 115.40*** | 5% | 2.86 | 4.01 |
| 1% | 3.74 | 5.06 | |||
k indicates the number of regressors. *** represents significance at 1% level.
Table 6.
Estimated short-term and long-term coefficients of the NARDL model.
| Variables | Coefficients | t-statistic |
|---|---|---|
| Panel A: The estimated short-term coefficients | ||
| -2.6868 | -3.66*** | |
| -6.3180 | -2.00** | |
| -11.6117 | -4.50*** | |
| -0.0019 | -0.66 | |
| 0.0036 | 0.38 | |
| ECM(-1) | -0.9821 | -24.18*** |
| Panel B: The estimated long-term coefficients | ||
| Constant | 0.0046 | 0.14 |
| VOL+ | -2.7358 | -3.72*** |
| VOL- | -2.7298 | -3.67*** |
| LNGPR | -0.0077 | -2.30** |
| LNG | -0.0037 | -0.38 |
*** and ** indicate significance at 1% and 5% levels respectively.
Table 7.
Results of Breusch-Godfrey and ARCH tests.
| Diagnostic test | Statistics | P-value | Conclusions |
|---|---|---|---|
| Autocorrelation (Breusch-Godfrey test) H0: No serial correlation |
1.38 | 0.24 | Fail to reject H0 |
| Heteroskedasticity (ARCH test) H0: No ARCH effects |
1.02 | 0.31 | Fail to reject H0 |
Disclaimer/Publisher’s Note: The statements, opinions and data contained in all publications are solely those of the individual author(s) and contributor(s) and not of MDPI and/or the editor(s). MDPI and/or the editor(s) disclaim responsibility for any injury to people or property resulting from any ideas, methods, instructions or products referred to in the content. |
© 2024 by the authors. Licensee MDPI, Basel, Switzerland. This article is an open access article distributed under the terms and conditions of the Creative Commons Attribution (CC BY) license (http://creativecommons.org/licenses/by/4.0/).
Copyright: This open access article is published under a Creative Commons CC BY 4.0 license, which permit the free download, distribution, and reuse, provided that the author and preprint are cited in any reuse.


