Submitted:
23 May 2024
Posted:
23 May 2024
You are already at the latest version
Abstract
Infrastructure such as transport, electricity, telecommunications, and sanitation are indispensable drivers for improving the country’s social and economic development. The industrial, agricultural, fisheries and service sectors are also key tools for the country's economic growth. This study aims to analyze the influence of infrastructure development on Djibouti’s economic growth and determine the other economic sectors. This study employs multiple regression analyses from Eviews Software to establish a correlation between these variables and Djibouti’s economic growth, utilizing data spanning from the period 2013 to 2022. The results reveals that mobile cell phone subscriptions, and the people using the health service management, industry, and service have a positive and highly significant influence on Djibouti's economic growth. The study found that access to electricity has a positive influence on economic growth in Djibouti, but is not statistically significant. In addition, the study shows that agriculture, forestry, and fisheries have a negative influence on economic growth in Djibouti, but are statistically significant. Therefore, we recommend that the Government of Djibouti strengthen and ensure the benefit of developing electricity infrastructure in Djibouti and the agriculture, forestry, and fisheries sectors to achieve sustainable economic growth in the coming years.
Keywords:
Infrastructure development
; economic growth
; and other variables sectors
1. Introduction
Infrastructure development is essential for the functioning of the country's economic activities and is also an essential pillar for the country's development. Improving infrastructure plays a crucial role in creating opportunities that enhance social living conditions and contribute to the country’s economic growth. Infrastructure development is capital to increase the economic productivity of a region (Susantono& Berawl, 2015; Stephan, 1997). In recent decades, the country’s adequate infrastructure has helped to attract foreign investment and reduce poverty through the creation of direct and indirect jobs. According to Bhattacharya et al. (2015), infrastructure drives sustainable development because it is a key driver of poverty reduction and economic growth. Similarly, the studies done by Srinivasu and Rao. (2013) also argued that infrastructure plays a crucial role in contributing to poverty reduction and economic growth. The modernization of the country’s various infrastructure facilities encourages growth because it attracts businesses to increase their activity while also supporting social and economic development. The development of infrastructure such as electricity, transport, telecommunication, water, and sanitation is important to increase competitiveness and economic development in a country. Some studies, such as in China by Du et al. (2022), demonstrate that infrastructure investment promotes the quality of economic growth in China.
In recent years, Djibouti’s economic growth has encountered numerous regional challenges, including the internal conflict in Ethiopia, which has resulted in a decrease in various port activities in Djibouti. Data collected by the World Bank (2022) indicates that Djibouti’s GDP growth has rebounded to 4.3 percent in 2021, up from 0.5 percent in 2020. Health challenges such as the COVID 19 movement restriction in 2020 and the war between Russia and Ukraine negatively impact Djibouti’s economic growth. Numerous studies, including those by Fosu & Twumasi (2022), Pan (2024), and Ardiansyah et al. (2020), have demonstrated the positive and significant impact of infrastructure on economic growth. Additionally, previous studies conducted in China by Shi et al. (2017), Peru by Urrunaga et al. (2012), and India by Sahoo et al. (2009) have also investigated the role or development of infrastructure on economic growth.
Infrastructure such as electricity, telecommunications, transportation, and sanitation play a crucial role in promoting the development of the country. The lack of a country's effective infrastructure causes severe growth, poverty, and a decrease in the country's essential economic activity. Approximately, 4 billion people live without access to the Internet (ITU, 2022). Recently, many countries have faced obstacles that increase the lack of access to adequate infrastructure, especially African countries, which generally disrupt the country’s economic development. In 2021, 675 million people still lacked access to electricity (Tracking SGD7, 2023). According to data collected from SDG 7, the majority of these people (estimated 567 million) who have no access to electricity are in sub-Saharan Africa, which explains that more than 80 percent of the world's population does not have access to electricity. Previous empirical studies, such as those conducted in Nigeria by Oyetade and Applanaidu (2014) and Sri Lanka by Anusha and Vijesandiran (2022), have also investigated the effects of agricultural sector determinants. Several researchers in China, including Yang et al. (2020), Lin and Chiu (2018), Wang et al.(2020a), and others, have explored the impact of infrastructure. Similarly, previous studies conducted by researchers (e.g. Mitra et al., 2016; Apurv and Uzma, 2020; Haftu, 2019; Wang et al., 2020b; Maparu and Mazumder, 2017) also studied the impact on infrastructure to promote development. The majority of these studies mentioned above have shown that infrastructure can have a negative or positive impact on economic growth. Some authors have recently conducted studies on similar topics, examining the relationship between economic growth and infrastructure (e.g. Timilsina et al., 2023) and electricity consumption (e.g. Zhang et al., 2017). In addition, numerous studies (e.g. Lydon and Willians, 2005; Srinivasu and Rao, 2013; Ekeocha et al., 2022; Sahoo and Dash, 2012; Amos and Jidda, 2018) also found that infrastructure supports the country's economic growth and development. Studies such as (e.g. Elburz et al., 2017; Garcia-Mila and McGuire, 1992; Aushauer, 1989; Lewis, 1998) have also explained the role of public infrastructure in economic growth. Some authors have argued that infrastructure such as telecommunications (e.g. Lee et al., 2012), and electricity consumption in China (e.g. Xu et al., 2022) and Nigeria (e.g. Mohamed, 2023) has a significant and determinant effect on economic growth.
This research aims to analyze the influence of infrastructure development on economic growth in Djibouti. This paper applies the multiple regression model used with Eviews Software to investigate the correlation between various infrastructures such as electricity, telecommunication, and sanitation, and GDP during the period from 2013 to 2022. Furthermore, the study also used the same regression model to determine the influence of other economic sectors on Djibouti’s economic growth over the same period. Additionally, we organize the research into several sections, with Section 1 serving as the introduction and Section 2 presenting the previous study on the topic. Section 3 presents the methodology and data collected. The analysis and research results are discussed in Section 4. Section 5 presents the discussion. In addition, the conclusion and recommendation are discussed in Section 6.
2. Literature Review
Many previous studies have investigated the impact of infrastructure on economic growth, often focusing on critical infrastructure such as transport, electricity and telecommunication. The majority of these studies on infrastructure and economic growth found that infrastructure development is critical to the country’s development. Some recent studies investigate the importance of the relationship between infrastructure and economic growth, such as an article by Ali (2023), who explored the causal relationship between economic growth and air transport in BRICS countries using an equilibrium panel for the period from 1993 to 2019. The long-term result showed that air transport is important to economic growth. Similarly, the study also found that in the short term, the economies of these countries determine the importance of air transport. In addition, the study by Xu et al. (2022) found that electricity consumption and economic growth have a direct and indirect relationship, which is strengthened over time. This study highlighted the direct and indirect causal relationship between China’s economic growth and electricity consumption. Additionally, the recent study by Zhang et al. (2017) also investigated in three dimensions the relationship between China's electricity consumption and economic growth. The study argued that accelerating industrialization, rapid population growth, and electric power have become essential keys to promoting China's social and economic development. Fedajev et al. (2023) analysed a panel of 15 Central and Eastern European economies during the period from 1995 to 2021, and argued that electricity generated from renewable energy sources (RES) has a positive effect on GDP growth and the growth rate of industry value added (IVA) for fully developed models. This result indicated that inefficient electricity infrastructure has a negative impact on GDP and the growth rate of the IVA. On the other hand, Ardiansyah et al., 2020 showed that infrastructure such as electricity, schools, health facilities, capital expenditure, and water have positive and significant effects on economic growth. At the same point, Burke et al. (2018) found that access to and use of electricity promote economic development. However, some authors, such as Brueckner (2021), have explained that infrastructure plays a crucial role in a country’s economic development, and analyzing the significant relationship between economic growth and infrastructure.
Previous studies demonstrated that investment and improvement of infrastructure facilities have a significant impact on the country’s development outlook and promote sustainable economic growth. Several previous studies, such as Calderón and Servén (2010), demurger (2001), Sahoo and Dash (2009), Srinivasu et Rao (2013), and Urrunaga et al. (2012), have investigated the importance of infrastructure development for economic growth and have determined a significant relationship. For example, Calderón and Servén (2010) studied infrastructure and economic development in sub-Saharan Africa using data covering the years from 1960 to 2005. The study found that infrastructure development has a positive and significant impact on economic growth. Based on the theoretical framework of Solow (1956) and Romer (1987), as well as the empirical development of Aschauer (1989) and Munnell (1990), Sahoo and Dash (2009) investigated the role of infrastructure on India’s economic growth. This study revealed that infrastructure development is positively and significantly boosting India's economic growth. In addition, Srinivasu and Rao (2013) investigate the relationship between infrastructure and economic growth. However, Urrunaga et al., 2012 confirmed that the development of public service infrastructure such as roads, electricity, and telecommunications played a significant role in Peru's regional production and economic growth for the period 1980 to 2009. Furthermore, Sanchez-Robles (1998) studied investment and economic growth and found that infrastructure has a significant correlation with the country's growth.
Demurge (2001) indicated that transport infrastructure, geographical location, and telecommunication facilities play an important role in observing the difference in growth performance among Chinese provinces. Also, Adhuze et al. (2023) concluded that infrastructure development is vital to increase tourism and stimulate economic growth. The result of these studies above also confirm that infrastructure enhances the efficiency of crucial economic sector and fosters the country’s economic growth. The importance of agriculture in the economy of any nation cannot be overemphasized, because it plays a major role in virtually all social and economic activities of countries for example poverty reduction (Wahab, 2011). Sanchez-Robles (1998) studied investment and economic growth and found that infrastructure has a significant correlation with the country's growth. Additionally, Apurv and Uzma (2020) examined the impact of infrastructure development and investment on the economic growth of the BRICS member countries. In panel analyses, the study concluded that telecommunication infrastructure development and investment are important and stimulate a negative relationship with economic growth, while energy infrastructure leads to economic growth. Some previous authors, such as Oyetade and Applanaidu (2014), suggest that improving agricultural sector exports is important for Nigeria's economic growth prospects.
However, the relevant research literature reveals that the development of infrastructure such as transport, electricity, and telecommunications is crucial to ensure the sustainable development of the country, reduce poverty and also represent an indispensable driver for the social and economic development of the country. Some previous studies such as those by Anusha and Vijesandiran (2022), found that fisheries, forestry, food production, and livestock have a significant influence on Sri Lanka's economic growth. At the same point, Oyetade and Applanaidu (2014) found that food production and fisheries had a significant effect on Nigeria's economic growth from 1981 to 2011. Nevertheless, the improvement of other essential sectors such as the agricultural, industrial, and service sectors are also indispensable elements to achieving significant economic growth in a country. It generally supports development and is crucial for global economic transformation. Recently, some previous studies carried out by Yang et al. (2022), demonstrated that synergy between agriculture, service industries, and industry contributes to poverty reduction.
3. Data and Methodologies
This section presents and discusses the selected data and methodologies used in this study, including the data description and the original source.
3.1. Data Description
This study examines the influence of infrastructure development on economic growth, identifying additional variables through an appropriate regression model analysis over the selected time period. The data variables used were mainly selected in the period from 2013 to 2022. The variable data collected are generally constituted based on access to electricity (% of population), people using safety managed sanitaire service (% of population), mobile cellular subscriptions (per 100 people), agriculture, forestry and fisheries, value added (in current US dollars), industry (including construction) value added (current US dollars), services, value added (per million US dollars) and GDP per capita of Djibouti ($). In this study, we employ the econometric method, specifically the multiple regression model, to analyze the variables mentioned above respectively. The regression model is permanent to determine the relationship that exists between several dependent and independent variables. Furthemore, to carry out an in-depth analysis of this study, two regression equation were adopted. In this research, the variable data will be analyzed using Eviews statistical software. The general formula for the multiple regression equation used to analyze these variables is as follows:
Y= β0+ β1 X1t+ β2 X2t+ β3 X3t+ εt
ε: Indicates the random error term of the regression
t: indicates the time period (yearly)
Based on this equation, where β0 is the intercept, as well as β1, β2, and β3 are the estimated slope coefficients of this regression. X1, X2, and X3 are independent variables based on this regression.
3.2. Data Explanation and Source
Based on the present variables, the first equation (1) establishes a linear relationship between Djibouti’s infrastructure and economic growth during the period from 2013 to 2022. We use a multiple regression model to analyze the relationship and identify the degree of influence between infrastructure development and economic growth. At the same time, infrastructure development consists of electricity infrastructure, transport infrastructure, telecommunications infrastructure, and sanitation. Therefore, the transport infrastructure in Djibouti does not have the availability of data in this selected period so it will not be mentioned in the empirical analysis of the research. In this study, economic growth is measured by Djibouti’s GDP per capital, as used by some previous studies (e.g. Ibrahim et al., 2022 and Bounphone et al., 2023). In this case, the model taken for regression equation (1) is the following:
GDP = β0 + β1 (Electricity infrastructure) + β2 (telecommunication infrastructure) + β3 (Infrastructure Sanitation) + εt
Therefore, the equation (1) will be formulated as follows:
LNGDPt = β + β1 LNAE1t + β2 LNMC2t + β3 LNPSS3t + εt
Based on these variables, we use the variable access to electricity that is measured by the electricity infrastructure, as used by (e.g. Timilsina et al., 2023 and Bounphone et al., 2023). As used by Timilsina et al. (2023), the telecommunication infrastructure measured by the mobile cellular subscription as well as the infrastructure sanitation is the person using safety managed sanitation service (% of the population). On the other hand, we establish the second econometric equation (2), namely the regression model to analyze the relationship between dependent variable factors such as agriculture, forestry and fisheries, industry (including construction) and service, which represent independent and dependent variables of GDP per capita in Djibouti. The second regression equation that was established is as follows:
LNGDPt = β + β1 LNAFF1t + β2 LNIN2t + β3 LNSE3t + εt
The following Table 1 provides detailed information about the chosen variables and their source.
However, the following section is divided into several sections that represent the different methods of analysis and the result. First, descriptive statistical analysis and unit root testing are discussed. To test the stationary set of variables selected for this study, we apply the augmented Dickey-Fuller test (Dickey & Fuller, 1979) to measure the unit root. We present various analyses, including correlation and regression analysis tests, to determine the relationship between selected variable and economic growth in Djibouti. Aside from that, the residual diagnostic test and the regression results stability are discussed. We employ the Jarque Bera test for the normality test of the regression, followed by the Breusch-Pagon-Godfrey test to test heteroscedasticity and Breusch-Godfrey LM serial correlation tests, respectively. In addition, we also check the stability of these two regression models using the CUSUM and CUSMUSQ tests.
4. Analysis and Result
This section presents several test analyses and results, primarily detailing the result of descriptive statistics, and unit root tests for the selected variables. This section also covers the variables analyses and regression of each model, along with residual diagnostic testing and stability measures such as CUSUM and CUSUMSQ tests.
4.1. The Descriptive Statistics Test Result
Table 2 below details the descriptive statistics for the variables selected in this research.
4.2. Unit Root Test of All Selected Variables
In this research, we apply the Augmented Dickey-Fuller test (ADF) to test the stationarity of the data used in this study. Additionally, to have a reliable and better estimate, the unit root test using ADF is established for the given sets in different models of the study. The Table 3 below, which displays the result of ADF test, indicates that set of data selected in both equations is not stationary at the level based on the unit root test.
4.3. Explanation of Variable Analysis
As can be seen in the result above, Figure 1 above demonstrates a strong linear relationship between independent variables (such as electricity infrastructure, telecommunication, and sanitation) and GDP per capita growth in Djibouti. We can see that LNPSS and GDP have a strong and positive linear relationship on this graph. The graph also demonstrates a strong linear relationship between LNMC and LNGDP. However, the results of the graph analysis indicate that the influence of LNAE and LNGDP is not particularly strong or significant. Additionally, we examine the variables in equation (2) of the regression model to determine the influence of these variables on Djibouti’s economic growth. We present the linear variable relationships between these independent and GDP variables, as can be seen in Figure 2 below:
As shown in Figure 2 above, there is a linear relationship between these independent and dependent variables presented by scatter plots. The graph demonstrates a robust linear relationship between LNSE and LNGDP, as well as a strong linear relationship between LNIN and LNGDP. The scatter plots above demonstrate a significant relationship, although the linear relationship between LNAFF and LNGDP is not as strong as the other independent variables presented in this study. To better deepen our analysis perspective on this study, we conducted regression analyses to determine the R squares and to analyze the influence between these variables present in the two regression equations.
4.4. Correlation Analysis
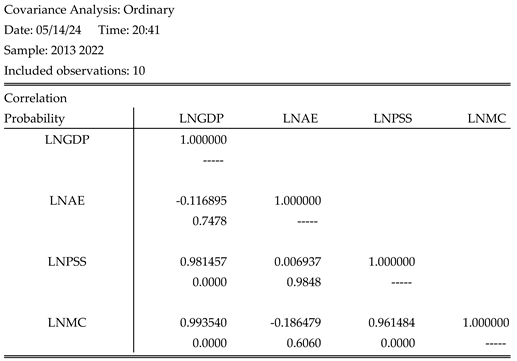
Model (1) allow us to determine the existence of a correlation between the variables (LNAE, LNPSS, and LNMC) and the variable LNGDP. The Table 4 below presents the result of the correlation test analysis of this first equation (1) model.
The table result above demonstrates a strong positive and significant correlation between variables, such as mobile cellular subscriptions and health service to manage security, and the GDP per capita variable. As can be seen in table above, the correlation between mobile cellular subscriptions (LNMC) and economic growth (GDP) is strong and significant, with a correlation coefficient of 0.993540, which is very close to 1, and a probability of 0.0000 (see Appendix 1), which is less than 0.05 of the significance level. Similarly, the variable of people using the safety managed sanitation service (LNPSS) shows a strong positive correlation with economic growth, with a correlation coefficient equivalent to 0.981457. This correlation is highly significant, with a probability of 0.0000 (see Appendix 1), which is less than 0.05 of the significance level. Therefore, we find that the variables Access to electricity (LNAE) has a negative correlation with economic growth, with a coefficient of -0.116895. This correlation is also not significant, with a probability equal to 0.7478 (see Appendix1), which is greater than 0.05 of the significance level. Finally, it can be noted that the LNPSS and LNMC variables have a strong positive and significant correlation with economic growth.
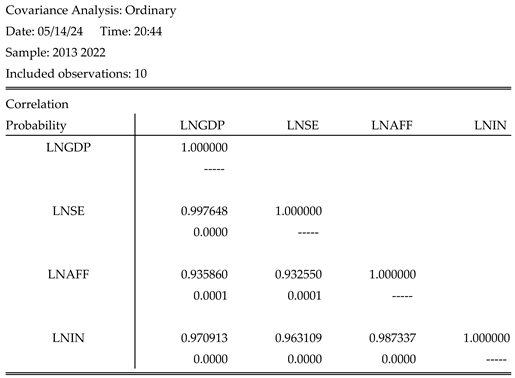
In addition, we conduct the correlation test on the second regression model (2) to determine the other important sectors that have an important influence on economic growth in Djibouti. The following Table 5 shows the correlation test result between the variables selected in this study such as (LNGDP, LNSE, LNAFF, and LNIN), presented as follows:
The table above demonstrates a strong and positive correlation between the selected variables, such as LNSE, LNAFF, and LNIN, and economic growth. The Agriculture, Forestry, and Fisheries (LNAFF) variables exhibits a strictly positive and significant correlation with economic growth, with a correlation coefficient of 0.935860, which is very close to 1, and a probability of 0.0001(see Appendix 2), which is less than 0.05 of the significance level. Moreover, variables such as industries (including construction) and service value added exhibit a positive and significant correlation with economic growth, with probabilities of 0.0000 and 0.0000 (see Appendix 2), both of which are less than 0.05 of the significance level, respectively. Therefore, we can conclude that these selected variables, such as LNSE, LNAFF, and LNIN, exhibit a strong positive correlation with economic growth (LNGDP).
4.5. Regression Analysis
Aa can be explained, we will compose the analysis of this study into two parts using the same multiple regression model. In this research, we will apply the regression analysis method, which is considered one of the appropriate analyses to determine the relationship between independent and dependent variables. Thus, we established this analysis using the statistical software Eviews to determine the influence between these independent variables and GDP per capita ($).
4.5.1. 1st Regression Model Test
We perform the first regression model, which focuses on determining the relationship between the dependent variable, which is the GDP per capita of Djibouti ($), and the independent variables, which include access to electricity (% of population), the percentage of people using safety managed sanitation services (% of population), and the number of mobile cellular subscriptions (per 100 people). The equation (1) of this applied regression model is as follows:
LNGDPt = β + β1 LNAE1t + β2 LNMC2t + β3 LNPSS3t + εt
ε: is a Random Error
From Equation (1), The analysis is performed using ordinary least squares (ordinary least squares) on sets of variables selected in this part to determine the linear relationship between these dependent and independent variables. The regression analysis results are shown below:
From the result in Table 4 above, we can see that the independent variables presented in the first equations have a significant relationship with GDP. We can observe that the independent variables, such as LNPSS and LNMC, significantly influence the GDP variable at a significance level of 0.05. As can be seen in result above, the regression analysis test gives us a result of the value of Regression Probability (F-statistic) of 0.000000 less than 0.05 at the confidence significance level, which shows that the regression model applied to this first analysis is very significant. Furthermore, the goodness-of-fit measure this R2 regression model is equal to 0.994339, indicating a strong relationship between the variables presenting and GDP. Additionally, this can show that the fitting effect of this applied regression is good. The regression equation is presented as follows:
LNGDPt = - 590.9943 + 0.391367 LNAE1t + 35.75507 LNMC2t + 51.51711 LNPSS3t + εt
In this first regression model, we can see that the telecommunication infrastructure variable (Mobile cellular subscription per 100 people) shares a positive and statistically significant relationship with Djibouti's GDP per capita per p value equal to 0.0018, less than the 0.05 confidence level. The variable correlation coefficient for mobile cellular subscriptions (per 100 persons) is 35.75507. this indicates that if we increase the Mobile cellular subscriptions variable (per 100 persons) by one unit, the economic growth variable will also increase by 35.75507 units, assuming the other variables remain constant. Moreover, the relationship between infrastructure sanitation variables (People using safety managed sanitaire service as % of the population) and economic growth is also positive and statistically significant with a p-value equal to 0.0405, less than 0.05 of significance level. The regression coefficient of the variable people using safety managed sanitaire service is positive and equal to 51.51711. It can be shown that if the variable of Persons using safety-managed sanitaire (% of the population) increases by 1 unit, the economic growth variable will increase by 51.51711 units, assuming the other variables remain constant. The table above reveals a positive but not statistically significant relationship between the electricity infrastructure variable, such as Access to electricity (% of population), and economic growth, with a p value of 0.8369, which is greater than 0.05 of the significant level. As we can that the effect of the electricity infrastructure on economic growth is positive, with a coefficient of regression of 0.391367, respectively.
4.5.1. 2nd Regression Test Analyses
Similarly, we conduct the second regression model test to determine the linear relationship between independent variables such as agriculture, forestry, and fisheries ( in US dollars), industry (including construction ) in dollars, services ( per Billion US dollars) , and Djibouti’s GDP per capita ( in US$). We also applied the regression analysis method over the same selected period from 2013 to 2022, to determine the other variables that influence economic growth. Furthermore, this model applied equation (2) is shown as follows:
LNGDPt = β + β1 LNAFF1t + β2 LNIN2t + β3 LNSE3t + εt
ε: is a Random Error
We conduct analyses of the selected variables sets in the above equation using ordinary least squares (OLS) to determine whether the relationship exists. The regression result is as follows:
The test result above explains that the relationship between these independent variables and GDP is highly significant at the significance level of 0.05. We can also observe that the Prob (F-statistics) value of 0.000000, which is less than 0.05 at the significant confidence level, indicates a significant relationship between the variables presented in these second tests. Furthermore, the fit quality of model R2 is equal to 0.998533, indicating that this equation model has a strong relationship with the dependent variable (LNGDP). This set of interpretations allows us to understand that the regression adjustment effect of this model is good, so the regression equation is formulated as follows:
LNGDPt = 604.4173 – 757E-06 LNAFF1t + 1.62E-06 LNIN2t + 796.6949 LNSE3t + εt
According to this established regression model, the independent variable industry (including construction), exhibits a positive and statistically significant relationship, with a p-value of 0.0036, which is less than the 0.05 level of significance. This variable industry (including construction) has a positive regression coefficient equivalent to 1.62E-06. It can be interpreted, if the industrial variable (including construction) increases by d units, Djibouti's economic growth will also increase by 1.62E-06 units, as long as the other variables remain constant. Similarly, there is a strong relationship between the service variable, value added, and economic growth in Djibouti, with a positive regression coefficient of 796.6949 and a statistically significant p-value of 0.0000, less than 0.05 at the level of significance. The result indicates that if the service variable, value added (per million US dollars) increases by 1 unit, the economic growth in Djibouti will also increase by 796.6949 units. As can be seen from the test result in Table 5 above, the relationship between the variables agriculture, forestry, and fisheries and GDP is highly significant but the regression coefficient is negative, with a p-value of 0.0093, less than 0.05 of the significant test level. This indicates that if the agriculture, forestry, and fisheries variable increases by 1 unit, Djibouti's economic growth will decrease by 757E-06 units.
4.6. Residual Diagnostic Test and Stability of Regression Result
Table 6 below shows the normality test results for the two regression models used in this research.
As can be seen in Table 6 above, the result of the normality test performed in the two regression equations established in this study. In this analysis, we tested the normality regression test using the Jarque-Bera statistic as well as the probability to determine whether the selected data are normally distributed in both models. Table 6 above shows that the Jarque-Bera values are 0.320513 and 0.952157, while the Probability values are 0.851925 and 0.621215, respectively. Therefore, we can conclude that two regression models normality test results, along with the normally distributed data selected from them, meet the relative requirement to validate the hypothesis.
Table 7 above presents various tests, including the heteroscedasticity test using the Breusch-Pagon-Godfrey test type. In both regression analyses, the probability is 0.2440 and 0.4101, both of which are relatively greater than 0.05 at the significance test level, with F-statistics 0f 0.786018 and 0.809942. We establish tests to assess the diagnostic stability of regression using the Ramsey RESET Test, and discovered a specification with F-statistics and p value are greater than 5 percent of the significance level. This indicates that both regression models are good and stable for determining the influence that exists between the variables selected in this study.

Table 7.
The results of the analysis regression test.
| Dependent variable: LNGDP Method: Least Squares Date: 02/11/24 Time: 23:15 Sample: 2013-2022 Included observation: 10 | ||||
| Variable | Coefficient | Std. Error | t-Statistic | Prob. |
| C | 604.4173 | 58.48244 | 10.33502 | 0.0000 |
| LNAFF | -7.57E-06 | 2.01E-06 | -3.772955 | 0.0093 |
| LNSE | 796.6949 | 53.77386 | 14.81565 | 0.0000 |
| LNIN | 1.62E-06 | 3.49E-07 | 4.626090 | 0.0036 |
| R-squared | 0.999022 | Mean dependent var | 2670.420 | |
| Adjusted R-squared | 0.998533 | S.D. dependent var | 345.8040 | |
| S.E. of regression | 13.24312 | Akaike info criterion | 8.294008 | |
| Sum squared resid | 1052.282 | Schwarz criterion | 8.415042 | |
| Log likelihood | -37.47004 | Hannan-Quinn criter | 8.161234 | |
| F-statistics | 2043.505 | Durbin-Watson stat | 2.595124 | |
| Prob (F-statistic) | 0.000000 | |||
Table 8.
normality test result of regression.
| Normality test | 1 er regression model | 2 er regression model |
| Mean | -4.61e-14 | 4.49e-14 |
| Maximin | 38.05816 | 23.12854 |
| Minimum | -32.95284 | -12.92113 |
| Std. Deviation | 21.24362 | 10.81296 |
| Jarque-Bera | 0.320513 | 0.952157 |
| Probability | 0.851925 | 0.621215 |
Table 9.
The results of other diagnostic regression tests.
| Diagnostic Tests | 1 er regression model | 2 er regression model |
| Heteroskedasticity Test: Breusch-Pagon-Godfrey | F (2,4) = 0.786018 | F (3,6) = 0.809942 |
| Obs*R-squared =2.821296 | Obs*R-squared = 2.882416 | |
| Chi-Square (2) = 0.2440 | Chi-Square (3) = 0.4101 | |
| Breusch-Godfrey Serial Correlation LM Test: | F (3,6) = 0.526197 | F (2,4) = 0.673122 |
| Obs*R-square = 2.082961 | Obs*R-squared = 2.518112 | |
| Chi-Square (3) = 0.5554 | Chi-Square (2) = 0.2839 | |
| Ramsey RESET Test: | t-statistic = 0.774081 | t-statistic = 1.957639 |
| F-statistic = 0.599201 | F-statistic= 3.832351 | |
| p = 0.4739 | p = 0.1076 |
4.7. CUSUM, and CUSMUSQ Test Results
Based on the residual tests and diagnostic stability established in Table 7, we discovered that the two-regression models do not present any risk or heteroscedasticity issues, and the probability values, which exceed 5 percent, are not significant. Thus, we can also show that there is no serial correlation and that the selected variables are normally distributed in each of these regression models. However, this reveals that each of the established regression models can determine the influence between these variables and Djibouti's economic growth in the period from 2013 to 2022. On the other hand, the null hypothesis is approved in both established models. In addition, we can confirm that there is good stability in this regression model, as determined by the CUSUM and CUSUMSQ stability tests at a significant level of 5%, as can be seen in Figure 3 and Figure 4 below:
Discussion
This study aims to analyze the influence of infrastructure development on Djibouti’s economic growth using numerous independent variables selected from official sources. The selected variables, such as access to electricity in Djibouti, measure the country electricity infrastructure, play a fundamental role in accelerating development, and even contribute to the improvement of social life. The study reveals that the electricity infrastructure plays a crucial role in the country’s development, particularity in promoting the growth of the country’s other fundamental sectors, such as the port and industrial sectors. Based on established regression analyses (1), the results indicate that Djibouti’s economic growth is positively influenced by access to electricity, although this effect is not statistically significant (0.8369>0.05). This indicates that while the Development of Djibouti’s electricity infrastructure has a strong influence on economic growth, but it does not significantly compared to other essential infrastructure for the country’s development. The results of this study also conformed with the previous study carried out in Nigeria by Mohamed (2023) and in Indonesia by Suriani & Keusuma (2015), which found that electricity has a positive impact or effect on economic growth.
At the same time, the results of the analyses show that mobile cellular subscriptions (per 100 people) have a positive and highly significant influence on Djibouti's economic growth with a p-value lower than the confidence level (0.0018<0.05). the finding is also similar with previous studies conducted by Lee et al. (2012) and Haftu (2019), which also found a positive and significant impact on economic growth. Similarly, our result is also consistent with that of Akinwale et al., 2018, which found that mobile cellular subscriptions have a positive impact on Nigeria's economic growth. As some previous studies have highlighted, our study confirms that telecommunication infrastructure plays a crucial role in the country’s development, facilitating the flow of information and bolstering the economy and social standard living. Recent findings indicate that having access to telephones can foster communication and integration, a crucial factor in reducing poverty and enhancing the country’s activities. The result also revealed that there is an indispensable infrastructure for Djibouti's economic growth. The study shows that people using safety-managed sanitaire services (% of the population) have a positive and statistically significant influence on Djibouti's economic growth (0.0405<0.05).
The analysis of equation (2) of the regression establishes a strong relationship between industries, including construction, and GDP, indicating their positive and significant influence on Djibouti’s economic growth. The development of industry is crucial to supporting the economy and also participates in job creation, which justifies it as an indispensable sector for the development of the country. In Djibouti, economic development is based on many sectors crucial for investment and improvement, especially the industrial sector (including construction) is also statistically significant, as can be seen from the result of the regression analysis (p 0.0036<0.05). The result also indicates a positive and highly significant influence of service and value-added (per billion US dollars) on economic growth in Djibouti, with a p-value of less than 0.05 at the significant level. Therefore, the research result also reveals that agriculture, forestry, and fisheries have a negative influence on economic growth, but are statistically significant on p-value less than 0.05 of the significant level.
Concussion
The study analyzes the influence of infrastructure development on Djibouti's economic growth in the period from 2013 to 2022. In the analysis of this study, we investigate the relationship between the different infrastructures selected according to the available data and the GDP of Djibouti to determine the influence and the same as the other economic sectors of Djibouti. The studies first provided an in-depth analysis of the influence of infrastructure such as electricity, telecommunication, and sanitation infrastructure on economic growth, according to the multiple regression model. Second, using data from 2013 to 2022, the study determines the influence of other economic sectors on economic growth using data covering the same period from 2013 to 2022.
Infrastructure development is the engine of progress and ensures Djibouti’s economic growth. Additionally, infrastructure such as electricity, telecommunications, and sanitation play a critical role in supporting the country's economic development and social condition. In this study, the result reveals that mobile cellular subscriptions and people using safety managed sanitaire service (% of population) have a positive and strongly significant influence on economic growth in Djibouti. In addition, the result shows that access to electricity has a positive influence on economic growth in Djibouti, but is not statistically significant. Furthermore, the study shows that economic sectors such as industry and service have a strongly positive and statistically significant influence on Djibouti’s economic growth. Nevertheless, the result of this study shows that agriculture, forestry, and fisheries have a negative but highly significant relationship with Djibouti's economic growth. This study demonstrates the critical role of electricity, telecommunication, and sanitation infrastructure in enhancing social and economic conditions, as well as fostering the growth of the country’s economic activities, including industries and ports. However, the industries and services sector also plays a crucial role in maintaining Djibouti's economic growth and development. Therefore, we recommend that the Government of Djibouti implement the necessary measures and benefits to promote the under-agricultural sectors such as agriculture, forestry, and fisheries, with the aims of achieving high economic growth in the coming years. Thus, we also recommend that the government support the necessary benefits in order to increase the electricity infrastructure by providing adequate facilities to improve social living conditions in Djibouti and achieve sustainable economic growth. In the coming years, the development of infrastructure, particularity in African countries, is crucial for achieving stable living conditions and enhancing economic activities across various sectors.
Funding
This research did not receive any specific financial funding from public sector organizations or others.
Data Availability
The data generated in this study, as well as the additional material used, are available from the corresponding author upon reasonable request.
Acknowledgments
The author would like to express his sincere gratitude to all the proofreaders who participated in the reading process and provided unconditional support during the writing of this research. The author also expresses his sincere gratitude to all those who have made invaluable contributions to this article.
Appendices
Appendices 1: result of the correlation analysis test.
Appendices 2: result of correlation analysis test
References
- Adhuze, O., Adewole, A., & Adeaga, O. (2023). Infrastructure as Drivers for Economic Growth: A Way to advancing Tourism. International International Journal of Latest Technology in Engineering, Management & Applied Science (IJLTEMAS), XII, 86-93. https://doi.org/10.51583/IJLTEMAS.2023.12908.
- Akims, K., & Danyil, C.J. (2018). Infrastructural development as a strategy for Nigeria’s export promotion. African Research Review, 12(4), 40. https://dx.doi.org/10.4314/afrrev.v12i4.4.
- Akinwale, Y.O., Sanusi, K.A., & Surujlal, J. (2018). An empirical analysis of information and communication technology (ICT) and economic growth in Nigeria. Economics, Computer Science, 10(1): 129-142.
- Ali, R., Bakhsh, K., & Yasin, M.A. (2023). Causal nexus between air transportation and economic growth in BRICS countries. Journal of Air Transport Management, 107, 102335. https://doi.org/10.1016/j.jairtraman.2022.102335.
- Anusha, P., and Vijesandiran, S. (2022). An Empirical Analysis of the Effect of Agriculture Sector Determinants on Economic Growth in Sri Lanka. Business and Economic Research, 12(2): 155-167. https://doi.org/10.5296/ber. y12i2.19823.
- Apurv, R., & Uzma, S.H. (2020). The impact of infrastructure investment and development on economic growth on BRICS. Indian Growth and Development Review, 14(1): 122-147. https://doi.org/10.1108/IGDR-01-2020-0007.
- Ardiansyah, B., Kusmaryo, H., & Muin, M.F. (2020). Prospects of infrastructure Development in the Perspective of Economic Growth. International Journal of Social and Business, 4(3): 390-399. https://doi.org/10.23887/ijssb.v4i3.25168.
- Aschauer, D.A. (1989). Is public expenditure productive? Journal of Monetary Economics, 23(2): 177-200. https://doi.org/10.1016/0304-3932(89)90047-0.
- Bhattacharya, A., Oppenheim, J., and Stern, N. (2015). Driving Sustainable Development Through Better Infrastructure: key Elements of a Transformation Program. Brookings Global working Paper Series. Available at: https://www.lse.ac.uk/granthaminstitute/wp-content/uploads/2015/07/Bhattacharya-et-al.-2015.pdf.
- Bounphone, K., Keothephar, K., Srithilat, V., & Kidoikhammuan, S. (2023). The Dynamic Impact of Economic Growth, Foreign Direct Investment and Infrastructure in Laos. Sch J Econ Bus Manag, 10(09): 198-208. DOI: 10.36347/sjebm. 2023.v10i09.001.
- Brueckner, M. (2021). Infrastructure and Economic growth. Journal of Risk and Financial Management, 14(11): 543. https://doi.3390/jrfm14110543.
- Burke, P.J., Stern, D.I., & Bruns, S.B. (2018). The Impact of Electricity on Economic Development: A Macroeconomic Perspective. International Review of Environmental and Resource Economics, 12(1): 85-127. https://dx.doi.org/10.1561/101.00000101.
- Calderón, C., Servén, L. (2010). Infrastructure and Economic Development in Sub-Saharan Africa. Journal of African Economies, 19(1): i13-i87. [CrossRef]
- Démurger, S. (2001). Infrastructure Development and Economic Growth: An Explanation for regional Disparities in China? Journal of Comparative Economics, 29(1): 95-117. [CrossRef]
- Du, X., Zhang, H., & Han, Y. (2022). How Does New Infrastructure Investment Affect Economic Growth Quality? Empirical Evidence from China. Sustainability, 14(6): 3511. https://doi.10.3390/su14063511.
- Ekeocha, D.O., Ogbuabor, J.E., & Orji, A. (2022). Public infrastructural development and economic performance in Africa. new evidence from panel data analysis. Economic Change and Restructuring, 55(2): 931-950. [CrossRef]
- Elburz, Z., Nijkamp, P., & Pels, E. (2017). Public infrastructure and regional growth: Lessons from meta-analysis. Journal of Transport Geography, 58:1-8. [CrossRef]
- Fedajev, A., Mitić, P., Kojić, M., & Radulescu, M. (2023). Driving industrial and economic growth in Central and Eastern Europe: The role of electricity infrastructure and renewable energy. Utilities Policy, 85: 101683. [CrossRef]
- Fosu, P., & Twumasi, M.A. (2022). Infrastructure and economic growth: Evidence from the United States. Journal of Infrastructure Policy and Development, 6(1):1-13. [CrossRef]
- Garcia-Mila, T., and McGuire, T.J. (1992). The contribution of publicly provided inputs to states ’economies’. Regional Science and Urbain Economics, 22(2): 229-241. [CrossRef]
- Haftu, G.G. (2019). Information communication technology and economic growth in Sub-Saharan Africa: A panel data approach. Telecommunications Policy, 43(1): 88-99. [CrossRef]
- Ibrahim, K.H., Handoyo, R.D., Wasiaturrahma, W., & Sarmidi, T. (2022). Service trade and infrastructure development: Evidence from countries. Cogent Economics & Finance, 10(1): 1-21. [CrossRef]
- ITU (2022). Internet more affordable and widespread, but world poorest still shut off from online opportunity. The International Telecommunications Union (ITU)- United Nation. Presse Release. Available from: https://www.itu.int/en/mediacentre/Pages/PR-2022-11-30-Facts-Figures-2022.aspx.
- Lee, S., Levandis, J., and Gutiérrez, L.H. (2012). Telecommunications and economic growth: An empirical analysis of sub-Saharan Africa. Applied Economics, Taylor & Francis Journal, 44(4): 461-469. [CrossRef]
- Lewis, B.D. (1998). The Impact of Public Infrastructure on Municipal Economic Development: Empirical Results from Kenya. Review of Urban & Regional Development Studies, 10(2): 142-156. [CrossRef]
- Lin, T-Y., & Chiu, S-H. (2018). Sustainable Performance of Low-Carbon Energy Infrastructure Investment on Regional Development: Evidence from China. Sustainable, MDPI, 10(12): 1-21. [CrossRef]
- Lydon, R., & Williams, M. (2005). Communication Networks and Foreign Direct Investment in Developing Countries. Communications and Strategies, 58(2): 43-60. https://mpra.ub.uni-muenchen.de/2492.
- Maparu, T.S., & Mazumder, T.N. (2017). Transport infrastructure, economic development and urbanization in India (1990-2011): Is there any causal relationship? Transportation Research Part A: Policy and Practice, 100: 319-336. [CrossRef]
- Mitra, A., Sharma, C., & Véganzonès-Varoudakis, M-A. (2016). Infrastructure, information & communication technology and firms’ productive performance of the Indian manufacturing. Journal of Policy Modeling, 38(2): 353-371. [CrossRef]
- Mohamed, B.S. (2023). Electricity Consumption and Economic Growth: Evidence from Nigeria. Investment Journal of Sharia & Economic Law 3(1): 1-21. [CrossRef]
- Munnell, A.H. (1990). Why has productivity growth declined? Productivity and Public Investment. New England Economic Review, Federal Reserve Bank of Boston, 3-22.
- Oyetade, O., and Applanaidu, S.D. (2014). Effect of Agricultural Sector Determinants on Economic Growth. Australian Journal of Basic and Applied Sciences, 8(8): 68-72.
- Pan, C. (2024). Infrastructure and Economic Growth: From the Perspective of New Infrastructure. Urban Infrastructure and Economic Development in China, 123-135. [CrossRef]
- Romer, P.M. (1987). Crazy Explanation for the Productivity Slowdown. NBER Chapter, in: NBER Macroeconomics Annual 1987, 2:163-210, National Bureau of Economic Research, Inc. Available at: http://www.nber,org/chapters/c11101.pdf.
- Sahoo, P., and Dash, R.K. (2009). Infrastructure development and economic growth in India. Journal of the Asia Pacific Economy, Taylor & Francis Journal, 14(4): 351-365. [CrossRef]
- Sahoo, P., and Dash, R.K. (2012). Economic growth in South Asia: Role of infrastructure. Journal of International Trade Economic Development, Taylor & Francis Journal, 21(2): 217-252. [CrossRef]
- Sanchez-Robles, B. (1998). Infrastructure Investment and Growth: Some Empirical Evidence. Contemporary Economic Policy, 16(1): 98-108. [CrossRef]
- Shi, Y., Guo, S., and Sun, P. (2017). The role of infrastructure in China’s regional economic growth. Journal of Asian Economics, 49: 26-41. [CrossRef]
- Solow, R.M. (1956). A Contribution to the Theory of Economic Growth. The Quarterly Journal of Economics, Oxford University Press, 70(1): 65-94. [CrossRef]
- Srinivasu, B., and Rao, S. (2013). Infrastructure Development and Economic Growth: Prospects and Perspective. Journal of Business Management & Social Science Research, 2(1): 81-91.
- Stephan, A. (1997). The Impact of Road Infrastructure on Productivity and Growth. Some Preliminary Result for the German Manufacturing Sector. WZB Discussion Papers, No. FS IV: 97-47, 51. Available at: http://hdl.handle.net/10419/50991.
- Suriani, S., & Keusuma, C.N. (2015). The Influence of Basic Infrastructure Development on Economic Growth in Indonesia. Ecosciences: Scientific Journal of Economics and Development, 4(1). [CrossRef]
- Susantono, B., & Berawi, A.R. (2015). Improving the Sustainable Infrastructure Development through Innovative Approaches in Technology, Management and Financial Aspects. CSID Journal of Infrastructure Development, 1(1): 1-3. [CrossRef]
- Timilsina, G., Stern, D.I., & Das, D.K. (2023). Physical infrastructure and economic growth. Applied Economics, Taylor & Francis Journal, 58(18): 2142-2157. [CrossRef]
- Tracking SDG7. (2023). The energy Progress Report 2023. Sustainable Development Goals (SDG). Available from: https://trackingsdg7.esmap.
- Urrunaga, R., and Aparicio, C. (2012). Infrastructure and economic growth in Peru. CEPAL Review, 107: 145-163. [CrossRef]
- Wahab, A.L.F. (2011). An analysis of government spending on agricultural sector and its contribution to gdp in Nigeria. International Journal of Business and Social Science, 2(20): 244-250.
- Wang, C., Lim, M., Zhang, X., Zhao, L., & Lee, P. (2020b). Railway and Road Infrastructure in the Belt and Road Initiative Countries: Estimating the Impact Infrastructure on Economic Growth. Transportation Research Part A: Policy and Practice, 134: 288-307. [CrossRef]
- Wang, N., Zhu, Y., & Yang, T. (2020a). The impact of transportation infrastructure and industrial agglomeration on energy efficiency: Evidence from China’s industrial sectors. Journal of Cleaner Production, 244:118708. [CrossRef]
- Xu, G., Yang, H., & Schwarz, P. (2022). A strengthened relationship between electricity and economic growth in China: An empirical study with a structural equation model. Energy, 241: 1-11. [CrossRef]
- Yang, F., Zhang, S., & Sun, C. (2020). Energy infrastructure investment and regional inequality: Evidence from China’s power grid. Science of The Total Environment, 749: 142384. [CrossRef]
- Yang, G., Zhou, C., & Zhang, J. (2022). Does the synergy among agriculture, industry, and the service industry alleviate rural poverty? Evidence from China. Applied Economics Letters, Taylor & Francis Journal, 30(11): 1417-1421. [CrossRef]
- Zhang, C., H. Zhou., Yang, S., & Shao, Z. (2017). On electricity consumption and economic growth in China. Renewable and Sustainable Energy Reviews, 76, 353-368. doi: . [CrossRef]
- Zhang, C., Zhou, K., Yang, S., & Shao, Z. (2017). On electricity consumption and economic growth in China. Renewable and Sustainable Energy Reviews, 76: 353-368. [CrossRef]
Figure 1.
The scatter plot between the relationship of the independent variables LNAE, LNMC, and LNPSS, and the GDP per capita of Djibouti.
Figure 1.
The scatter plot between the relationship of the independent variables LNAE, LNMC, and LNPSS, and the GDP per capita of Djibouti.
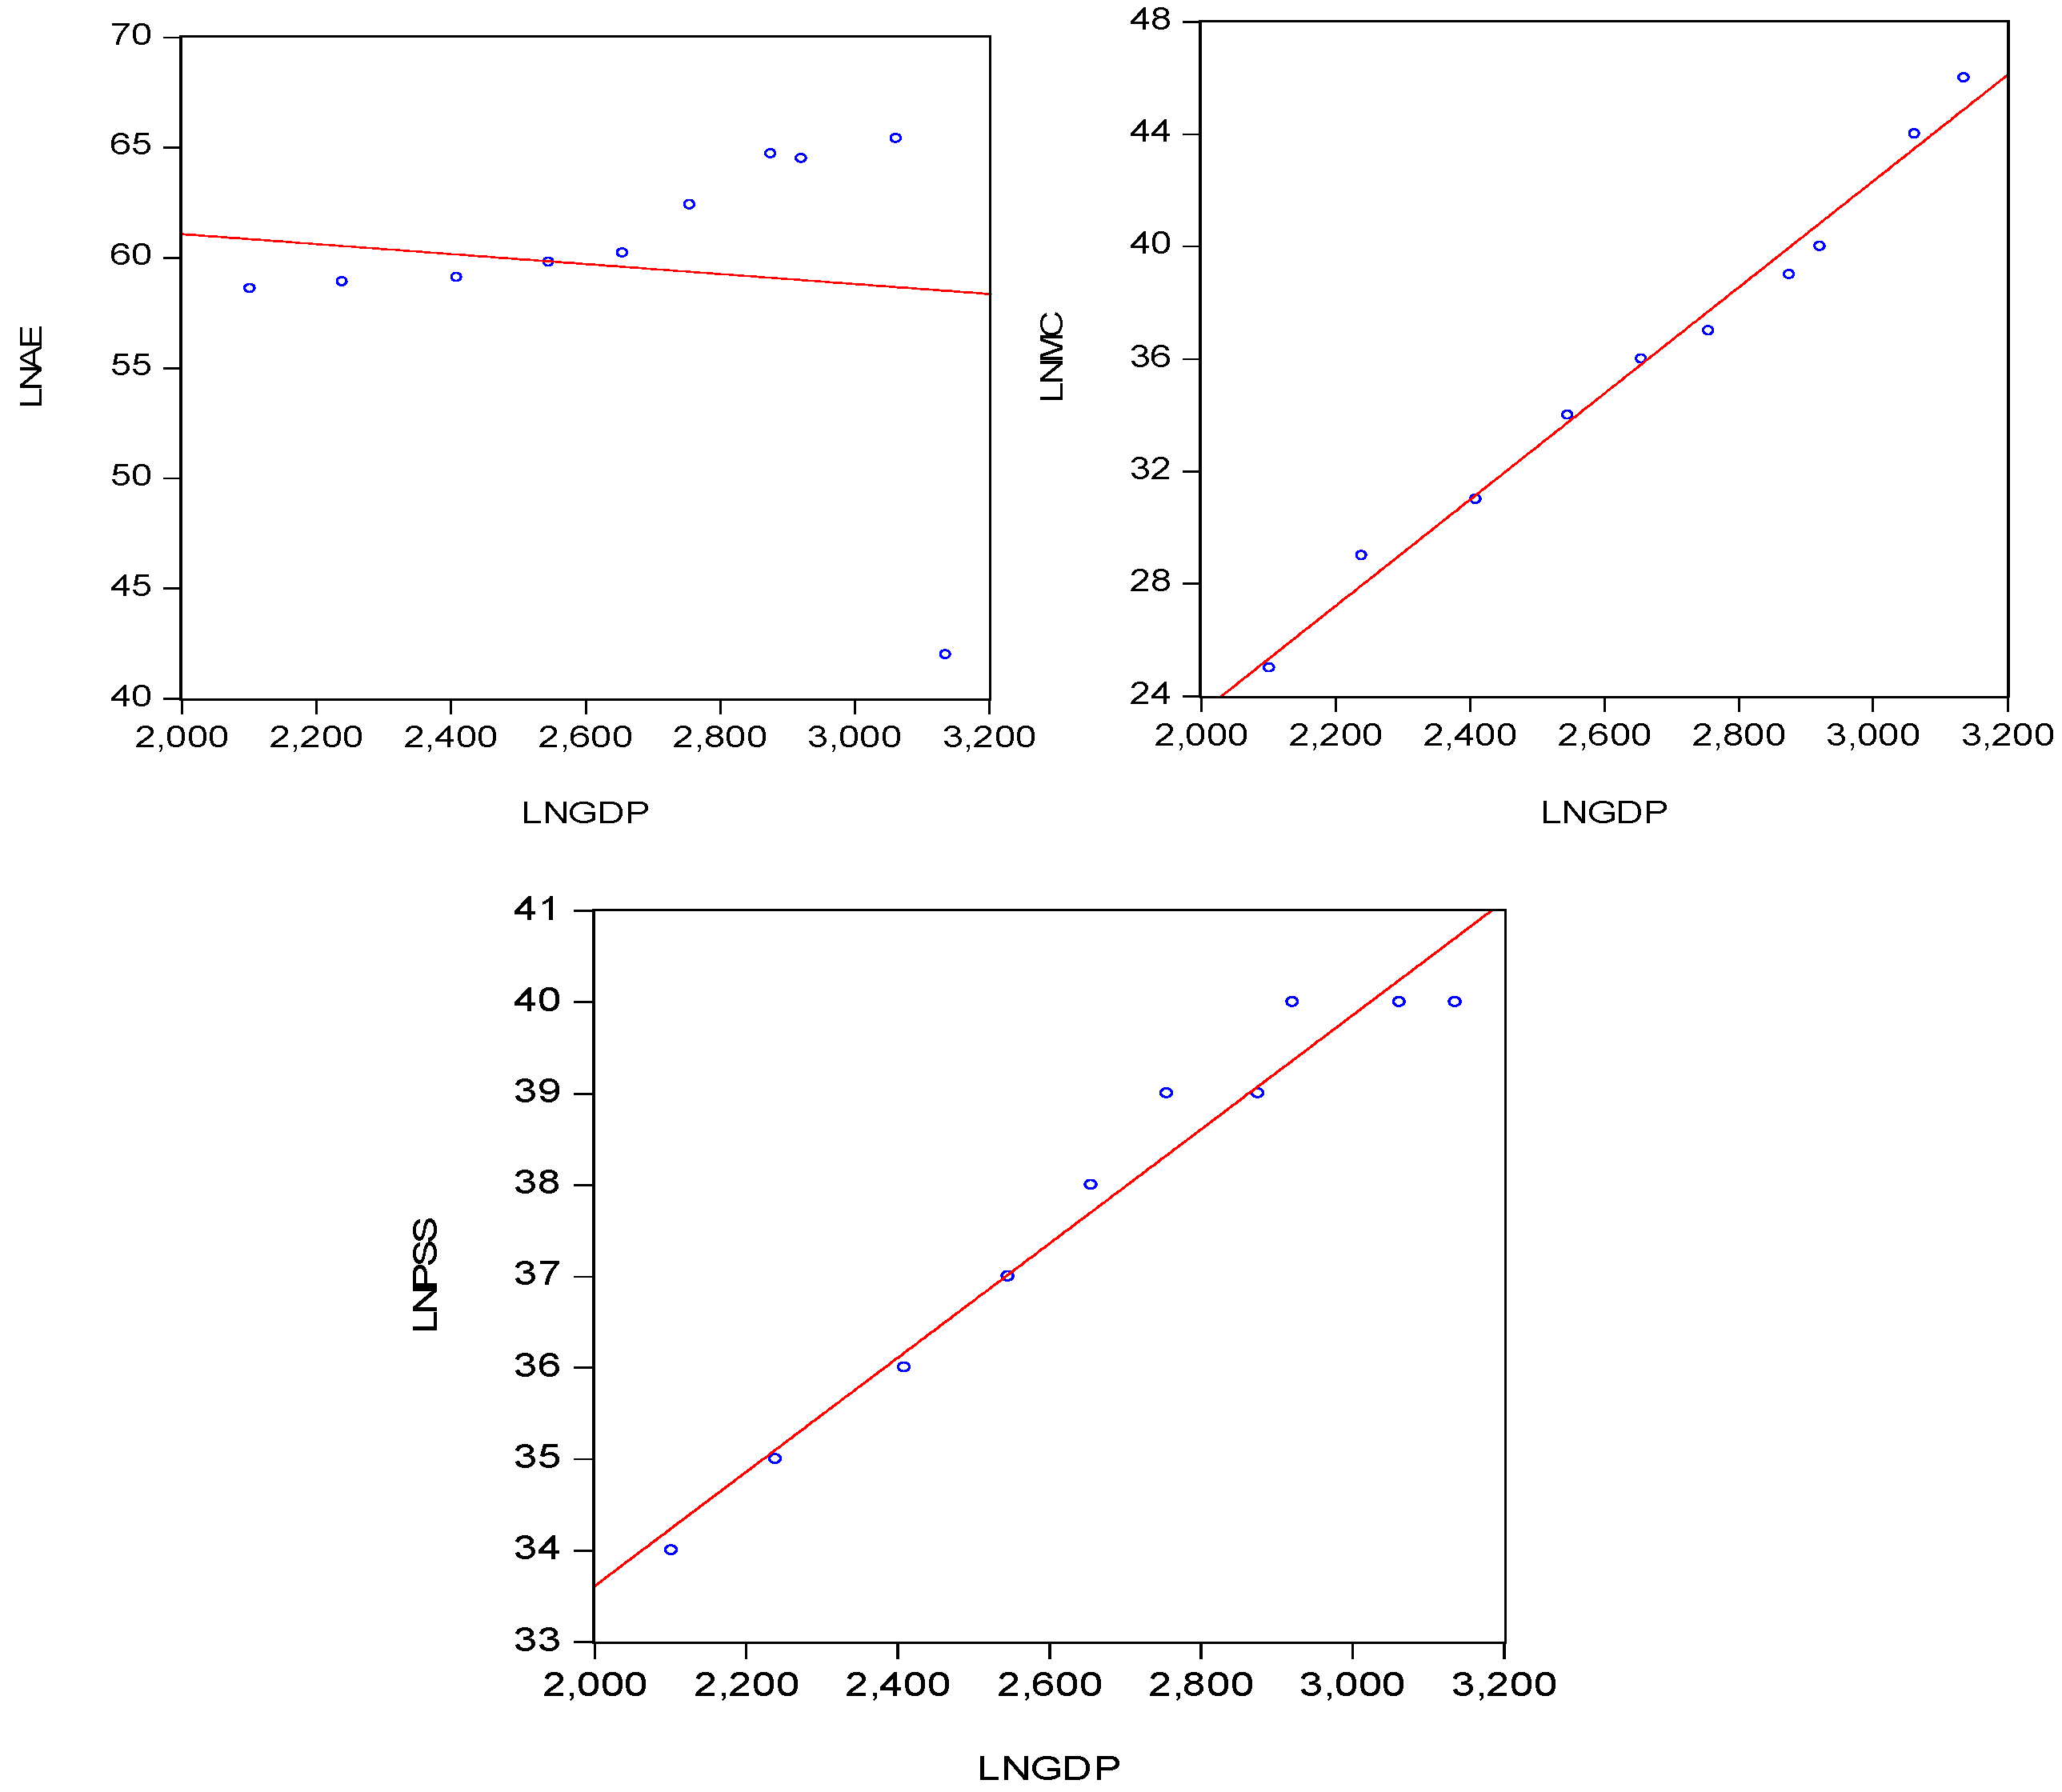
Figure 2.
The scatter plots between the independent variables LNAFF, LNIN, LNSE and GDP in Djibouti.
Figure 2.
The scatter plots between the independent variables LNAFF, LNIN, LNSE and GDP in Djibouti.
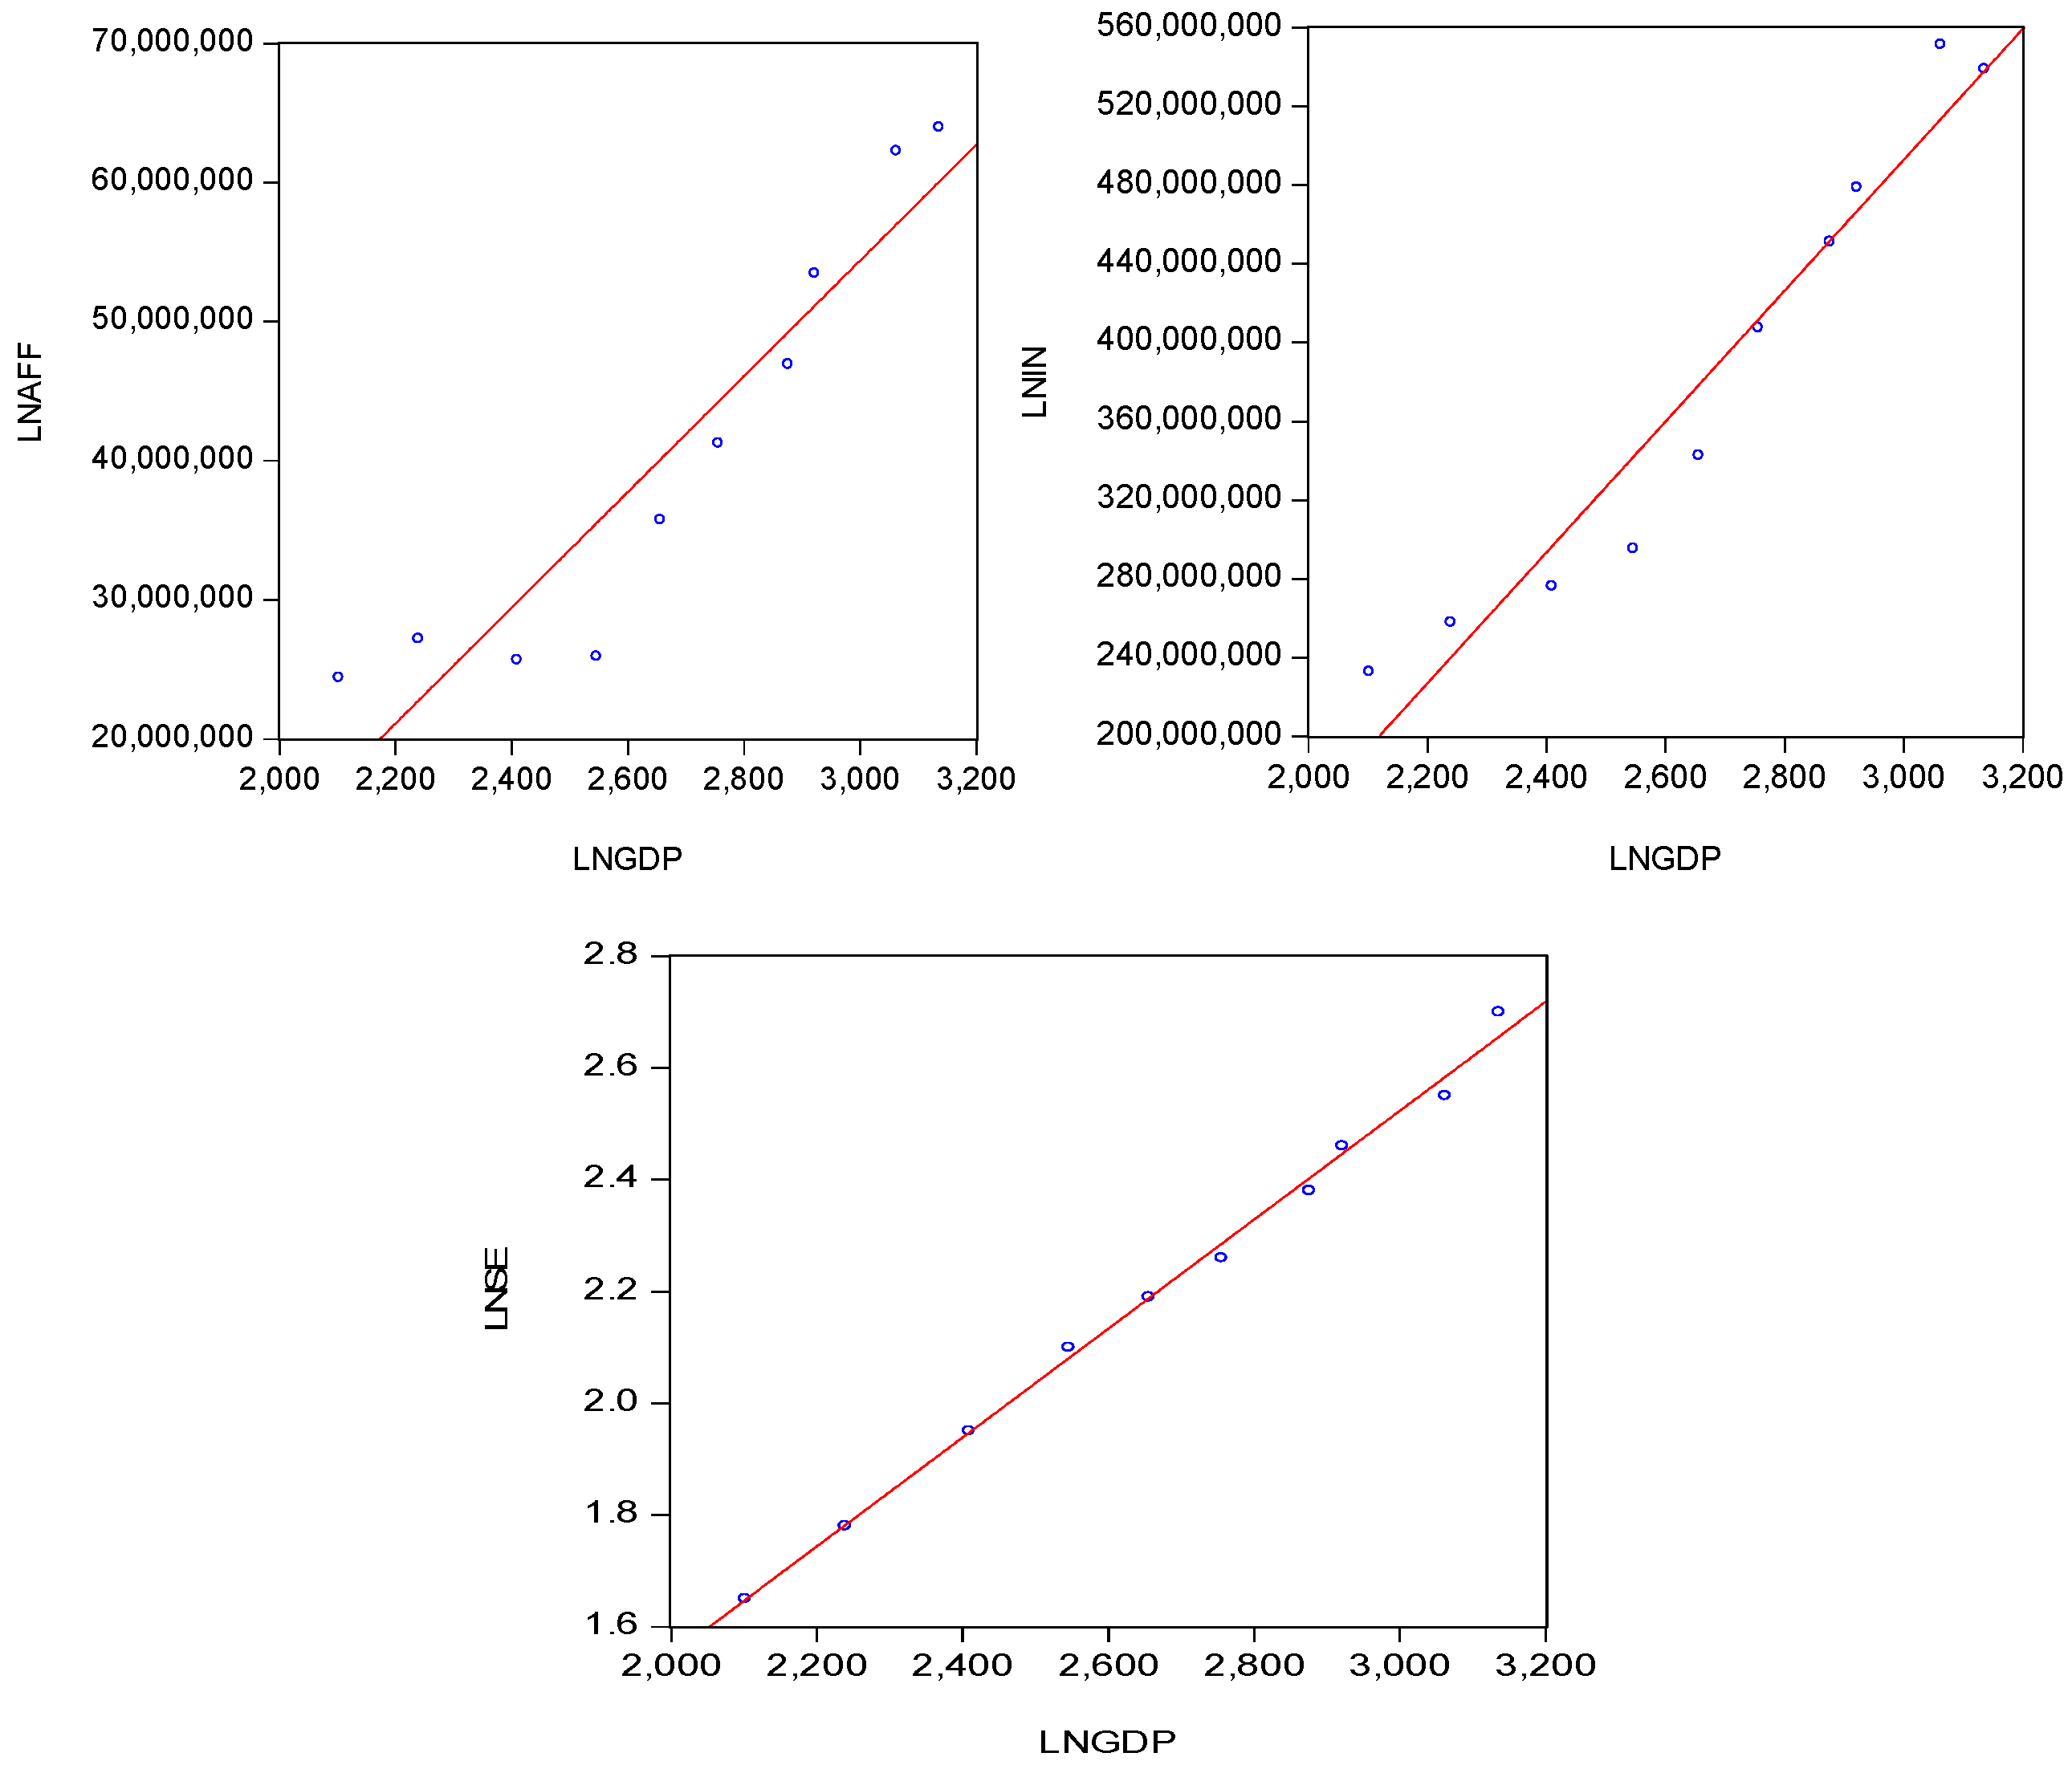
Figure 3.
The CUSUM and CUSMUSQ test results on the first regression.
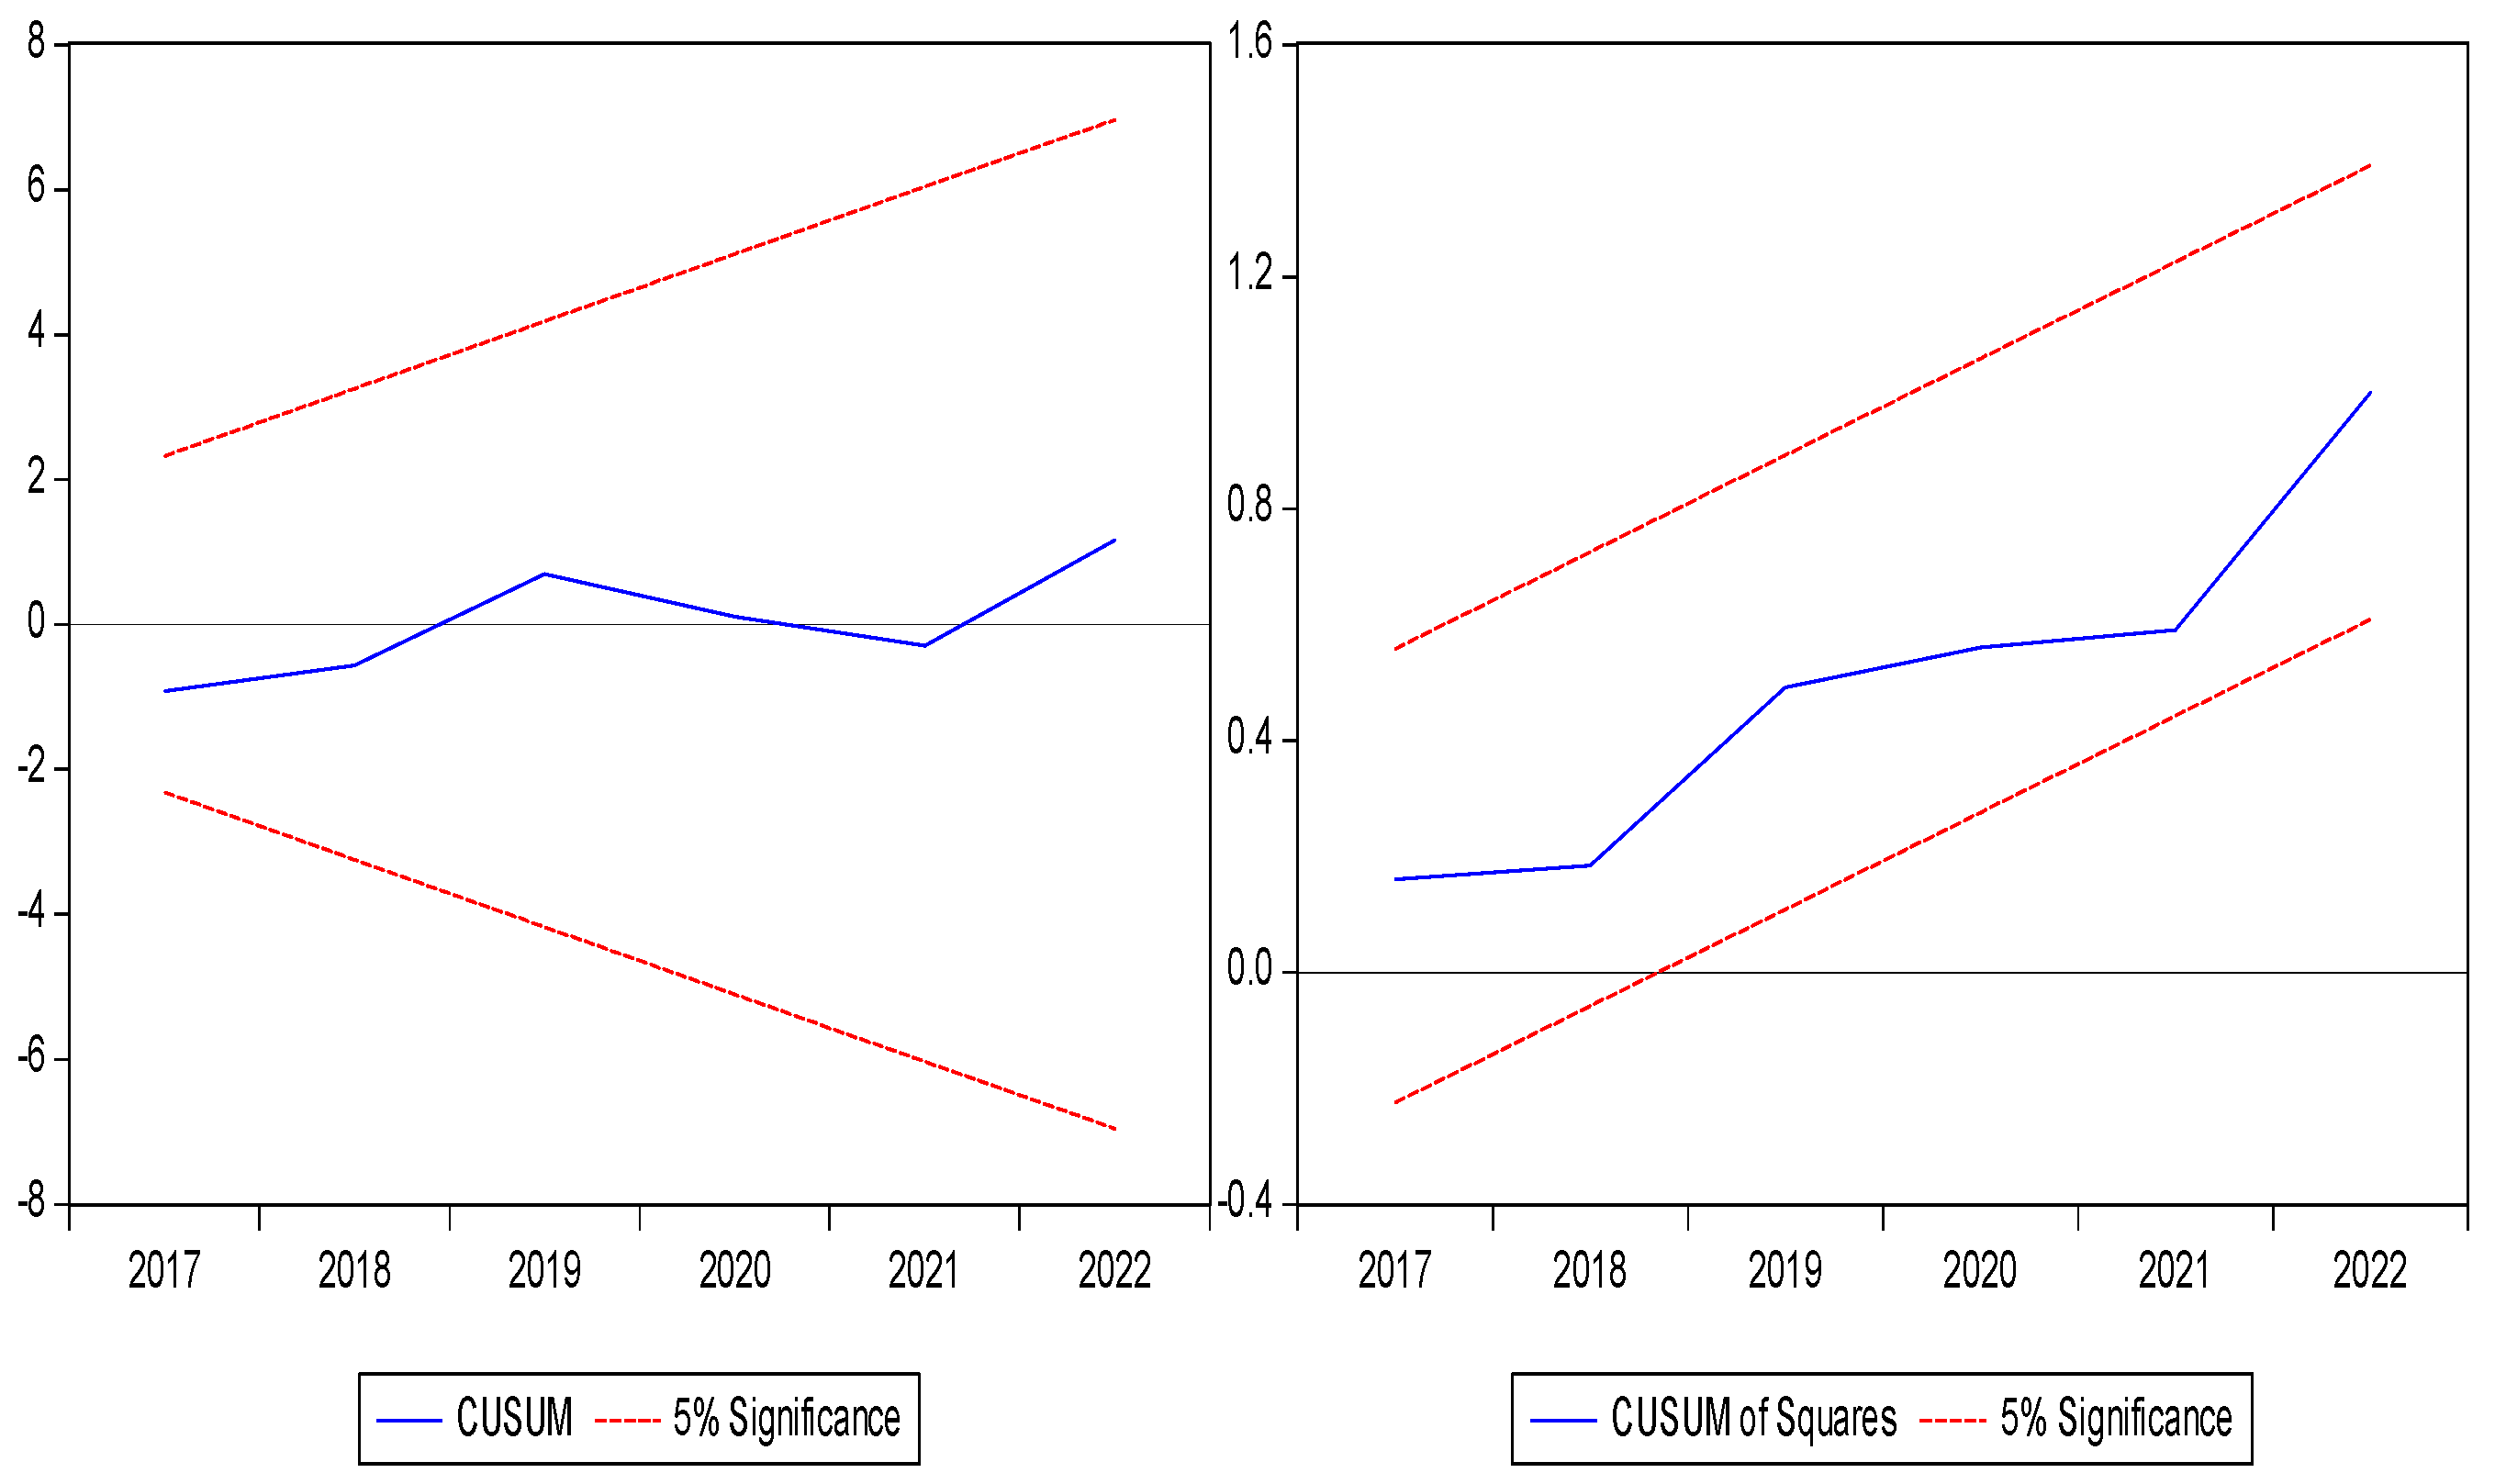
Figure 4.
The CUSUM and CUSMUSQ test results on the 2nd regression.
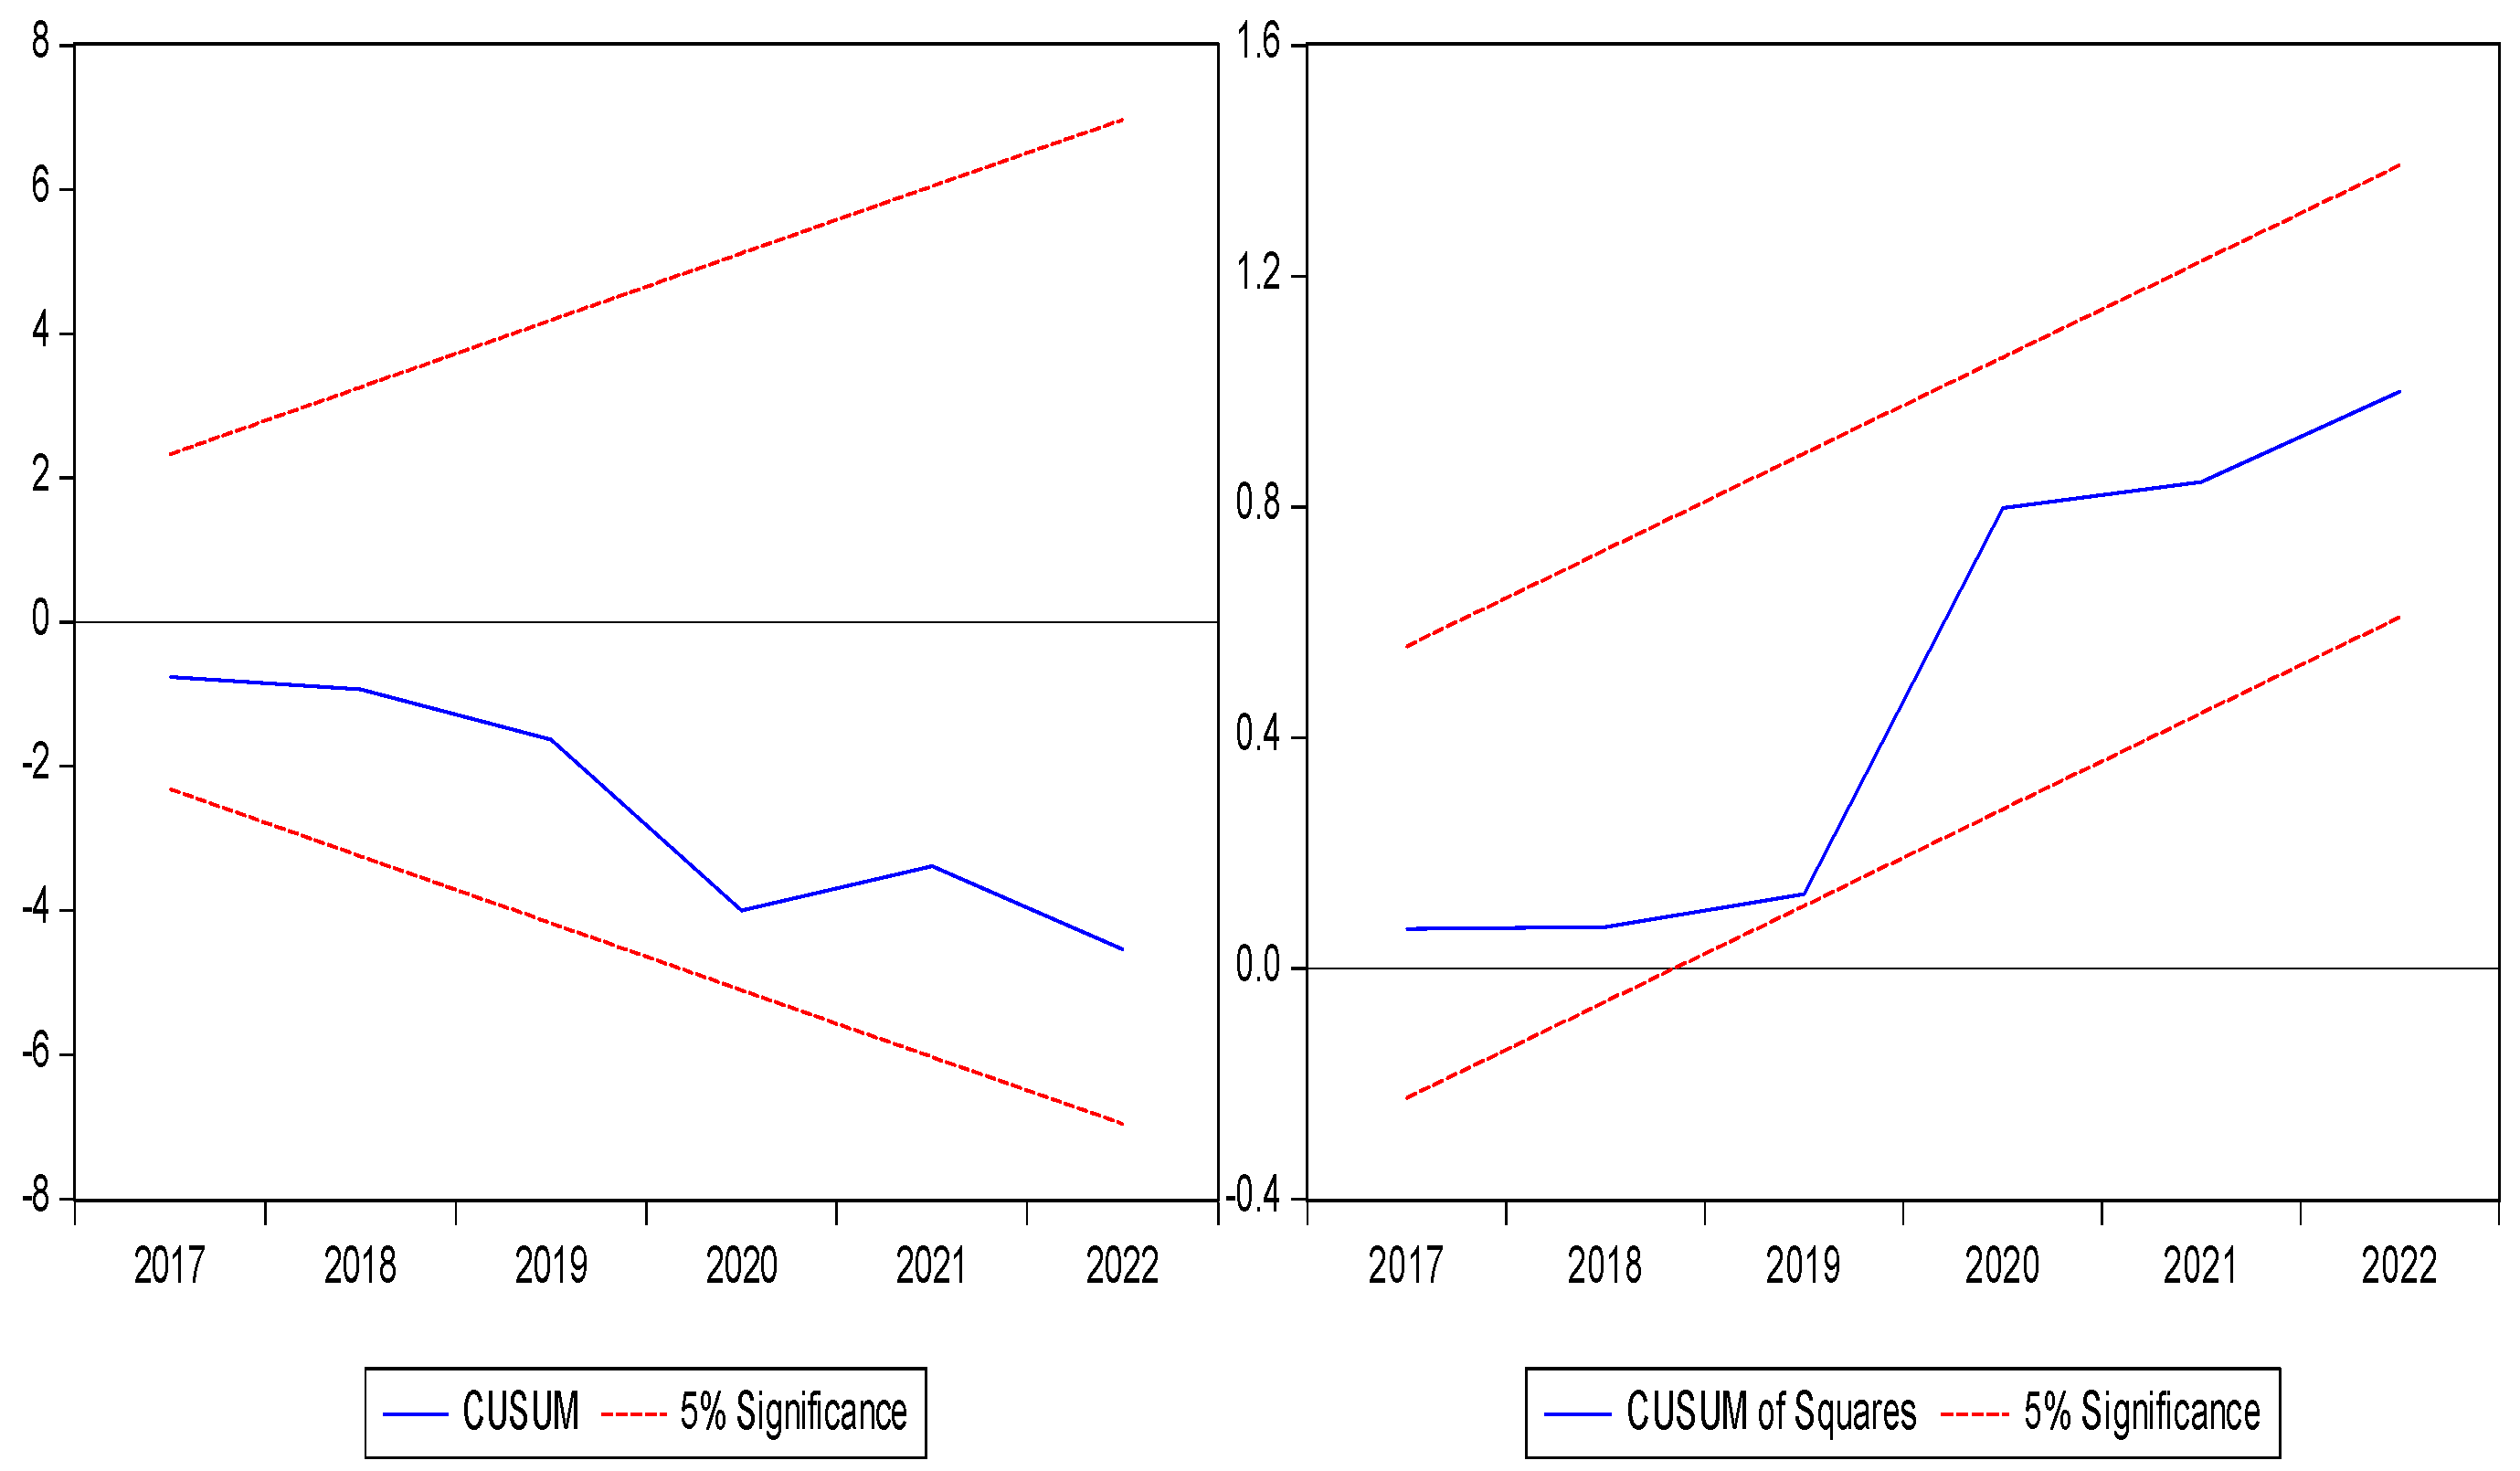
Table 1.
The different variables applied in this research.
| Abbreviation | Description Variable | Source |
| GDP | GDP per capita in Djibouti ($) | World Bank open data/ WDI |
| LNMC | Mobile Cellular subscription (per 100 people) | World Bank open data/ WDI |
| LNPSS | People using safety managed sanitaire service (% of population) | World Bank open data |
| LNAE | Access to electricity (% of population) | WDI / IEA energy access |
| LNAFF | Agriculture, Forestry, and Fishing, valued added (current US$) | World Bank open data/ WDI |
| LNIN | Industry (included construction) valued added (current US$) | World Bank open data/ WDI |
| LNSE | Service valued added (Billion US$) | World Bank open data/ WDI |
Table 2.
Descriptive statistics.
| Variables | observation | Minimum | Mean | Maximum | Std. Deviation |
| Access to electricity (% of population) | 10 | 42 | 59.56 | 65.4 | 6.694807 |
| Mobile Cellular subscription (per 100 people) | 10 | 25 | 36.1 | 46 | 6.573516 |
| People using safety managed sanitaire service (% of population) | 10 | 34 | 37.8 | 40 | 2.20101 |
| Agriculture, Forestry, and Fishing, valued added (current US$) | 10 | 24409046 | 40690033 | 63983297 | 15371156 |
| Industry (included construction), valued added (current US$) | 10 | 232791848 | 383337867.3 | 551432922 | 118367159 |
| Service, valued added (Billion US$) | 10 | 1.65 | 2.202 | 2.7 | 0.337895 |
| GDP per capita in Djibouti ($) | 10 | 2102.2 | 2670.42 | 3136.1 | 345.804 |
Source: Using Eviews Software.
Table 3.
Unit root test Result.
| At level | At First Difference | |||||||
| Variables | Intercept | P-value | Trend and Intercept | P-value | Intercept | P-value | Trend and Intercept | P-value |
| LNGDP | -3.2283 | 0.0565* | -2.4310 | 0.3436 | -1.4983 | 0.4761 | -4.4061 | 0.0429** |
| LNAE | -1.6190 | 0.4343 | -0.2417 | 0.9735 | -0.3019 | 0.8836 | 1.9630 | 0.9999 |
| LNPSS | -2.7799 | 0.0987* | 0.7255 | 0.9972 | 0.0000 | 0.9256 | -4.4647 | 0.0400** |
| LNMC | -1.0179 | 0.6962 | -2.9372 | 0.2021 | -3.8031 | 0.0267** | -3.3741 | 0.1292 |
| LNAFF | 0.6087 | 0.9796 | -1.9813 | 0.5338 | -2.0113 | 0.2769 | -2.1150 | 0.4657 |
| LNIN | -0.2118 | 0.9040 | -2.3605 | 0.3707 | -2.7420 | 0.1084 | -2.3145 | 0.3830 |
| LNSE | -1.2170 | 0.6161 | -1.9340 | 0.5584 | -1.7100 | 0.3912 | -1.4618 | 0.7563 |
Notes: The null hypothesis is the series is non-stationary. The symbols *, **and *** denote the significance level at 10, 5 and 1 percent, respectively.
Table 4.
Test of Correlation 1.
| Correlation | LNGDP | LNAE | LNPSS | LNMC |
| LNGDP | 1.000000 | |||
| LNAE | -0.116895 | 1.000000 | ||
| LNPSS | 0.981457* | 0.006937* | 1.000000 | |
| LNMC | 0.993540* | -0.186479* | 0.961484* | 1.000000 |
Note: * p-value< 0.05.
Table 5.
Test of Correlation 2.
| Correlation | LNGDP | LNSE | LNAFF | LNIN |
| LNGDP | 1.000000 | |||
| LNSE | 0.997648* | 1.000000 | ||
| LNAFF | 0.935860* | 0.932550* | 1.000000 | |
| LNIN | 0.970913* | 0.963109* | 0.987337* | 1.000000 |
Note: * p-value<0.05.
Table 6.
Results of the Regression Analysis Test.
| Dependent variable: LNGDP Method: Least Squares Date: 02/11/24 Time: 23:14 Sample: 2013-2022 Included observation: 10 | ||||
| Variable | Coefficient | Std. Error | t-Statistic | Prob. |
| C | -510.9943 | 446.2004 | -1.324504 | 0.2335 |
| LNPSS | 51.51711 | 19.79694 | 2.602276 | 0.0405 |
| LNMC | 35.75507 | 6.746794 | 5.299563 | 0.0018 |
| LNAE | 0.391367 | 1.820874 | 0.214934 | 0.8369 |
| R-squared | 0.996226 | Mean dependent var | 2670.420 | |
| Adjusted R-squared | 0.994339 | S.D. dependent var | 345.8040 | |
| S.E. of regression | 26.01801 | Akaike info criterion | 9.644630 | |
| Sum squared resid | 4061.623 | Schwarz criterion | 9.765664 | |
| Log likelihood |
-44.22315 | Hannan-Quinn criter | 9.511856 | |
| F-statistics |
527.9477 | Durbin-Watson stat | 2.590053 | |
| Prob (F-statistic) | 0.000000 | |||
Disclaimer/Publisher’s Note: The statements, opinions and data contained in all publications are solely those of the individual author(s) and contributor(s) and not of MDPI and/or the editor(s). MDPI and/or the editor(s) disclaim responsibility for any injury to people or property resulting from any ideas, methods, instructions or products referred to in the content. |
© 2024 by the authors. Licensee MDPI, Basel, Switzerland. This article is an open access article distributed under the terms and conditions of the Creative Commons Attribution (CC BY) license (http://creativecommons.org/licenses/by/4.0/).
Copyright: This open access article is published under a Creative Commons CC BY 4.0 license, which permit the free download, distribution, and reuse, provided that the author and preprint are cited in any reuse.


