
Submitted:
18 May 2024
Posted:
23 May 2024
You are already at the latest version
Abstract
Abstract
Background: Atrazine, a widely used herbicide, is recognized for its potential endocrine-disrupting effects, though its direct link to diabetes has not been extensively studied.
Objectives: This study investigates the relationship between atrazine exposure and diabetes incidence, especially in agricultural settings, and examines how socioeconomic factors like income and education levels influence diabetes risk.
Methods: A retrospective cohort study was conducted using data from 67 counties in Pennsylvania from 2011 to 2019. Atrazine exposure was measured in local water sources and correlated with diabetes data from the Pennsylvania Behavioral Risk Factor Surveillance System (BRFSS). Socioeconomic data were sourced from U.S. Census Bureau records, with logistic regression used to adjust for confounders such as age, race, and lifestyle.
Results: Findings showed a significant association between high atrazine exposure and increased diabetes incidence, even after adjusting for confounders.
Discussion and Conclusion: The study highlights a significant health risk posed by atrazine, particularly for socioeconomically disadvantaged groups. It underscores the need for stricter atrazine regulation and public health interventions to mitigate its impact. Further research is crucial to understand how atrazine affects glucose metabolism and diabetes development. Implementing stricter environmental controls and educational initiatives could reduce the diabetes burden in impacted communities.

Keywords:
Diabetes
; Atrazine
; Pennsylvania
; Exposure
1. Introduction
Diabetes is a non-communicable disease that communicates throughout the body and causes premature mortality. Its main characteristic is an increase in the blood glucose level due to the lack of glucose metabolization in the cells and this is due to the inability of the pancreas to produce insulin or the inability of beta cells to effectively use the insulin that is being produced [1]. Diabetes is often characterized as a metabolic disorder and its symptoms may be symptomatic and asymptomatic. They also differ according to the type of diabetes that a person may have. Diabetes can be classified into four types: type 1, type 2, gestational and secondary or other [2]. According to the Centre for Disease Control and Prevention, in 2021 approximately 38.4 million people (of all ages) in the U.S suffered from diabetes, of which more than “8.7 million adults aged 18 years or older who met the laboratory criteria for diabetes were not aware and did not report having diabetes. The percentage of adults with diabetes has also increased with age, reaching 29.2% among those aged 65 years or older.” It is important to study and understand the effects of diabetes on the body so that preventive steps can be taken by individuals and local authorities [3]. Prediabetes is a condition wherein the blood glucose levels are high but not yet to a level that can be diagnosed as diabetes, it is important for everyone over the ages of 45 to be tested for diabetes and should continue doing it every three years. The most prevalent types of diabetes are type 1 and type 2. Type 1 diabetes is an autoimmune disease in which insulin-produced beta cells in the pancreas are destroyed, whereas type 2 diabetes is a metabolic disorder in which the body is unable to produce or make efficient use of insulin; contradicting earlier years, it is now more prevalent in children and teens due to the high rates of increase in childhood obesity [4].
A general overview of the disease process in a person diagnosed with type 1 diabetes begins with the immune system targeting pancreatic beta cells. The ability of the pancreas to regulate insulin decreases, leading to insulin deficiency and excess glucose entering the bloodstream instead of being converted into energy. Some of these effects include extreme fatigue, craving for high levels of sugar, and vision problems. However, if left untreated for long periods of time, it can also lead to nephropathy, retinopathy, neuropathy, and several cardiovascular diseases such as heart attack and stroke [5,6]. Type 2 diabetes develops over a period of time and due to insulin resistance and dysregulates the body metabolically by causing damage to the functioning of the small and large blood vessels, nerve kidneys, and eyes with outcomes such as blindness and dialysis, it is unfavorable and can even lead to amputation due to nerve damage [7,8,9] However, Proactive management at an early stage in individuals at high risk is needed to either delay or prevent type 2 diabetes. Type 2 diabetes can be prevented through lifestyle changes, such as better nutrition and calorie deficit diets [10]. A Community-based phenotyping might also help in identifying individuals at increased risk for type 2 diabetes and allow for efficient prevention strategies [11].
On the other hand, It has been estimated that, in the United States, one in every seven healthcare dollars is spent on treating diabetes and its complications [12]. There are enormous economic and social burdens imposed by Diabetes and it demands new ways of reducing expenditure on related healthcare, which also should include long-term care [13]. Additional costs for amputation, loss of vision and any organ failure needs to be added to it and reduced productivity and withdrawal from work should also be considered [14,15]. Additionally, it has been estimated that the ‘informal costs’ range somewhere between $1162 to $5082 per year and this is significantly more than costs for other organ failures such as heart failures, which is estimated to be $862 [16,17]. Overall, it is estimated that in 2017 alone, diabetes has costed “$237 billion in direct medical costs and $90 billion in reduced productivity” [18].
“Decades of research have demonstrated that diabetes disproportionately affects racial and ethnic minorities and low-income adult populations in the U.S. disproportionately, with relatively patterns seen in these populations’ higher risk of diabetes and rates of diabetes complications and mortality” [19]. In diabetes, priority should be given to understanding the social determinants of disease prevalence, economic costs, and the disproportionality among populations pertaining to gender, education, and income medium [20,21]. Some of the most important social determinants of who are most affected by diabetes along with mortality rates and outcomes depend on socioeconomic status (SES), which is a multidimensional construct that includes educational, economic, and occupational status [22,23,24]. SES is one of the strongest predictors of disease onset and progression at all levels, including diabetes [25] It is because it is closely linked to individuals and communities that can access material resources, including health care, housing, transportation, and nutritious food. For example, economic status is often measured by determining a person’s household income and the community in which they or resides.
Other major determinants also include educational status that can be quantified either in years of schooling or highest degree earned [26]. However, literacy has also emerged as a measure of educational quality which is majorly more reflective of SES than years of schooling, especially among African Americans and low-income Whites [27,28]. Those that fall under the lower SES ladders are more likely to develop type 2 diabetes(that is, due to higher prolonged exposure without proper intervention) and may likely experience more complications, and die sooner than those higher up on the SES ladder [29,30]. Research has also proven prevalence between higher income which most likely leads to higher educational levels of an individual or family as a unit and hence the increase their income levels leading to less likelihood of developing type 2 diabetes, as shown in research conducted by Gaskin et al [31,32]. This pattern of diabetes-related mortality has been observed specifically in adults with type 1 diabetes as well [33]. Other determinants also include factors such as age and geography [34]. Hence, Type 1 diabetes disregarded mostly leads to 2 diabetes which is a complex disease and needs continuous medical care. It also has other risks, such as kidney, heart, and other organ failures, which lead to an increase in early mortality rates and a decrease in productivity at the workplace, which may affect the treatment plans of the patients. Other factors affecting proper intervention include age, income, educational level, race, and sex [35].
Moving on, we will shift our focus to atrazine and its potential link with diabetes. Atrazine is a widely used herbicide that has been identified as a contaminant because of its persistence in the environment and potential health impacts. Atrazine is primarily employed in agriculture to control broadleaf and grassy weeds, predominantly crops such as corn and sugarcane. It is also known for its environmental persistence, transport through surface runoff, and easy absorption into the groundwater. Concentrations of atrazine in surface waters that are impacted by agricultural use tend to fluctuate with the season, with the highest atrazine concentrations being observed in the weeks and months following application of the herbicide [36]. According to studies, atrazine has been detected in various environmental compartments, including surface water, groundwater, and even in some food products because of its widespread use and persistent nature. Research has demonstrated that atrazine can disrupt endocrine function in both wildlife and humans, potentially leading to reproductive and developmental problems. In animals such as fish and amphibians, atrazine exposure has been linked to hormonal imbalances and reproductive issues [37].
However, in humans, it is difficult to establish observational studies with possible associations between endocrine disruption and reproductive health concerns owing to ethical and methodological constraints. However, a multi-pathway exposure assessment evaluated the exposure of children aged 3–12 years to pesticides in the Minnesota Children’s Pesticide Exposure Study (MNCPES) [38], which was designed to acquire exposure information for children for a variety of pesticides, including atrazine [39] in assessment sought to address multipath exposures from air, water, food, soil, and residential surfaces in the homes of children. The results of that study showed that contact with atrazine can be achieved through the tracking of soil into the home on shoes and feet and was present in 62 of 102 surface samples of the homes and in 12 of 100 children’s hand rinse samples, but only in 2 of 89 urine samples collected from the children in the study contained atrazine [40]; however, more data are needed. According to the Federal Insecticide Fungicide and Rodenticide Act (FIFRA) report on the hazard and dose-response assessment of atrazine [41], there are not enough data on the risk of atrazine in children because exposure data are not yet available.
Hence, it remains unclear whether there is a direct link between atrazine exposure and diabetes in humans, owing to the complexity of disease pathways and multifactorial influences on diabetes development. However, Atrazine usage is banned in European countries [42] but globally, about 70,000 to 90,000 tons of atrazine are used per annum, and Mexico, Brazil, USA, India, China, and Argentina are the primary users [43]. However, in a study conducted with flies, it was indicated that co-exposure to 20 μg/ml atrazine and 0.5 M sucrose leads to early onset of diabetes within 20 days of exposure as compared to atrazine alone for 30 days [44]. Given the potential implications of atrazine on health and its prevalence in environments like Pennsylvania, where agriculture is a significant part of the economy, the question arises: "Is there an association between diabetes outcomes and atrazine exposure, particularly in Pennsylvania?" This research question is crucial for understanding broader public health impacts and could guide environmental and health policy decisions in regions where atrazine use is prevalent.
2. Methods
2.1. Regulatory Approval
IRB approval was granted by the Juniata College Institutional Review Board. IRB approval was designated as exempt (Category 4).
2.2. Database Sources
All data was taken from the following online databases:
- The total population, age, income, race, and education data were obtained from census data of the United States Burro for Pennsylvania.
- Diabetes, Body Mass Index (BMI), obesity, BMI overweight, atrazine, no physical activities, and fruit and vegetable consumption datasets were obtained from the Enterprise Data Dissemination Informatics Exchange, Pennsylvania BRFSS: Diabetes - Ever told they have diabetes, Overweight, and Obesity - Obese (BMI GE 30); Overweight and Obesity - Overweight (BMI GE 25); Drinking Water Quality: Annual Distribution of Water Systems and Number of People Served by Atrazine Concentration, Physical Activity - No–no leisure time physical activity in the past month, and Fruits and Vegetables: Consume at least five servings of fruits and/or vegetables every day.
2.3. Inclusion/Exclusion Criteria
The diabetes data set came in 3-year bins of 2017-19, 2016-18, 2015-17, 2014- 16, 2013-15, 2012- 14, 2011-13. The remaining data were transformed to fit these bins by averaging the values for the three-year bin it is to fit. The diabetes dataset also grouped the smaller counties together as regions, resulting in cumulative values for these regions for all other data. Data on fruits and vegetables, physical activity, diabetes, BMI, obesity, and overweight BMI were expressed as percentages and converted to numbers of people for each category with the total population taken from the census (population estimate). The mean levels of atrazine were not continuous numbers and were bins that were too large, as almost all the datasets fit into it. Therefore, we used the number of individuals exposed to the highest levels of atrazine. Data () were then removed based on multicollinearity, which broke the assumptions for the logistic linear regression.
2.4. Sample Size
With all counties, cumulative regions, and 3-year bins, there were 405 data points.
2.5. Target Population
Population with diabetes that concur with the atrazine levels
2.6. Data Collection and Data Processing
Data were extracted from the Census Tract and Pennsylvania BRFSS and consolidation over 3-year bins. The data was then cleaned and processed to ensure standardization across all data points.
2.6.1. Handling Missing Values
To address the missing data in our study, we employed the imputation method, specifically utilizing the median to fill in the missing values for various variables. This approach was chosen for its practicality and effectiveness in handling missing data, while ensuring the integrity of our analyses. Imputation with the median offers several advantages that align with the research objectives. First, it enables us to maintain the sample size by retaining all observations in our dataset. This is crucial for preserving the statistical power and ensuring the robustness of our findings. Additionally, the simplicity of implementing median imputation makes it accessible and feasible, even for datasets of considerable size. Unlike mean imputation, which can be sensitive to outliers and skewed distributions, imputing missing values with the median provides a more robust estimate of the central tendency, thereby reducing the risk of bias introduced by extreme values. Moreover, by preserving the original distribution of variables, median imputation helps maintain the integrity of the data while minimizing the loss of information. However, it is important to acknowledge the limitations of this approach. Imputation with the median may underestimate variability and assume certain patterns of missingness, potentially introducing bias under certain conditions. Despite these considerations, median imputation emerged as a reliable and practical choice for handling missing data in our study, contributing to the validity and reliability of our research outcomes.
2.7. Variable Selection
The outcome variable of interest was the frequency of diabetes per 67 counties in Pennsylvania (Diabetes) from to 2011-2019. Potential predictors were selected based on the known risk factors associated with diabetes and availability in the dataset. The following variables were considered as potential predictors:
- County: Geographic location.
- Total Population: Total population count.
- Fruits and Vegetables: Frequency of consumption of at least five servings of fruits and vegetables.
- Physical activity: Level of physical activity.
- Atrazine Counts: Frequency of Individuals exposed to 1ug/L, an environmental contaminant.
- No Physical Activity: Frequency of no physical activity.
- BMI Obese: Percentage of population categorized as obese.
- BMI Overweight: Percentage of population categorized as overweight.
- Age: Median age of the population.
- White alone, Black or African American alone, American Indian and Alaska Native alone, Asian alone, Native Hawaiian and Other Pacific Islander alone: Frequency of population by racial/ethnic groups.
- Median Income: Median household income.
- Less than high school, Highschool graduates, Some college or associate, Bachelor degree: Frequency of population by education level.
2.8. Statistical Analysis
Statistical analyses were conducted using R Studio Software version 4.3.2. Descriptive statistics, including means, standard deviations, and frequencies, were computed for the continuous and categorical variables. Regression analysis was employed to gauge the association between atrazine counts and diabetes outcomes, while accounting for potential confounders. To meet the model assumptions, robust regression techniques such as log transformation were implemented. Cross-validation techniques were used to ensure generalizability and robustness of the model. Bootstrapping was performed to corroborate the robustness of the model. Significance in the model was established at p-values of <0.05.
3. Results
The descriptive statistics outlined in Table 1 illuminate the diverse characteristics of the study cohort and variables under investigation. Across the 405 data points from 2011-2019 taken from 67 counties in Pennsylvania; Total Population exhibited a mean of 189,155.25 individuals, with a notable standard deviation of 167,382.89 and a range spanning from 4,610 to 1,580,081.00 individuals. Similarly, Fruit and Vegetable consumption displayed considerable variability, with a mean of 24,627.67 servings and a standard deviation of 53,870.61, ranging from 371 to 257,894.50 servings. Noteworthy variations were observed in physical activity levels, which ranged widely from 2,253 to 811,591.00 units, with a mean of 92,940.88 and standard deviation of 227,185.90. Atrazine Exposure also demonstrated substantial variability, with a mean level of 93,357.76, and a standard deviation of 315,117.43, ranging from 258 to 1,600,000.00 units.
Furthermore, health-related variables showed diverse distributions. The prevalence of diabetes, for instance, exhibited a mean of 20,067.52 cases per 100,000 population, with a standard deviation of 37,640.94, ranging from 517 to 189,609.80 cases. Likewise, measures of obesity, as indicated by BMI Obese, ranged from 1,491 to 505,626.00, with a mean of 56,746.90, and standard deviation of 90,299.11. Additionally, demographic factors such as race and education level showed notable variations. The proportion of individuals identified as White alone had a mean of 581,883.41 and a standard deviation of 2,879,614.61, while the median income ranged from $806 to $226,041.00, with a mean of $2,867.83 and a standard deviation of $36,473.61. These descriptive insights serve as foundational knowledge for further analytical pursuits exploring the intricate relationships between the studied variables.
Higher counts of atrazine exposure were analyzed across several counties in Pennsylvania, with Erie, Allegheny, Center, and Philadelphia specifically highlighted for their data on the incidence of diabetes (Figure 1). The data revealed varying rates of incidence of diabetes among these counties. Erie and Philadelphia counties exhibited higher diabetes incidence rates than the state average, suggesting a potential correlation with atrazine exposure levels, as marked by pink indicators on the map. In contrast, Allegheny and Center counties reported lower or equivalent rates of diabetes incidence relative to average state levels. These results are purely observational and reflect the geographic distribution of atrazine exposure and reported cases of diabetes in the selected counties in Pennsylvania.
Linear regression was run for all variables in the model with diabetes counts with the primary predictor atrazine exposure counts while adjusting for county, total population, educational attainment counts (less than high school, high school, some high school or associate, bachelor’s), age, median household income, BMI (obese and overweight counts), fruit and vegetable consumption counts, physical activity counts, no physical activity counts, and ethnicity (White alone, Black or African American alone, Asian alone, Native American Indian and Alaska Native alone, Asian alone, Native Hawaiian, and other Pacific Islander alone). The overall model was statistically significant (p < 2.2e-16) with an R2 of 99.34%, which was indicative of overfitting. Assumptions such as multicollinearity were employed, with many values having a Variance Inflation Factor (VIF) of over 10. Subsequently, these variables were removed from the model. The remaining variables in the model were diabetes as the dependent variable and atrazine exposure, median household income, BMI obesity only, Black or African American alone, Native Indian and Alaska Native alone, age, and high school and bachelor’s degree educational attainment as predictors. Multicollinearity when retested was met; however, other assumptions, such as normality and homoscedasticity, were not met. As a result, the diabetes and atrazine counts due to variance differences among all counties underwent a log transformation. The assumptions of multicollinearity, homoscedasticity, linearity, influential outliers, and normality were repeated. The assumptions show some improvements, but influential outliers are present. Influential outliers were removed from the model and the assumptions were generally met. The final model with log-transformed diabetes and atrazine, along with the removal of influential outliers, was tested using cross-validation (Table 2) and sensitivity analysis (Table 3). The cross-validation results illustrate the mean squared error (MSE) across ten folds, providing insight into the predictive performance of the model. Across the folds, the MSE values ranged from 0.0692 to 0.4449, indicating variations in prediction accuracy. Notably, the average MSE across all folds was calculated as 0.1595, which serves as an overall indicator of model performance. These results highlight the effectiveness of the model in capturing the relationship between the variables and the outcome of interest, with lower MSE values suggesting a better predictive accuracy. Sensitivity analysis revealed notable variations in the predicted values across several variables. For instance, the log-transformed Mean Atrazine Levels exhibited a substantial increase in the upper-bound prediction with a change of +1.063. Conversely, variables such as Black or African American alone, American Indian and Alaska Native alone, and high school graduates demonstrated minimal changes in prediction, with marginal fluctuations of -0.001 to -0.004. Interestingly, a bachelor’s degree showed a notable decrease in prediction, with a change of -0.022. Moreover, Age and Median Income displayed modest changes in prediction, with increases of +0.003 and +0.021, respectively. Notably, BMI Obese exhibited the most substantial increase in prediction, with a change of +0.325. These findings underscore the importance of sensitivity analysis in elucidating the robustness and reliability of model predictions across various variables.
The intercept term, representing the expected value of the diabetes outcome when all predictor variables were zero (Table 4), yielded a coefficient of 3.3745 (95% CI, 2.5393–4.2097), indicating a statistically significant relationship with diabetes (p < 0.001). Among the predictors, log-transformed atrazine exposure counts exhibited a strong positive association with diabetes outcomes, with a coefficient of 0.4951 (95% CI: 0.4562–0.5341) and a highly significant p-value (p < 0.001). Conversely, variables such as race (Black or African American alone, American Indian and Alaska Native alone), education level (high school graduates), and age did not show statistically significant associations with diabetes incidence (p > 0.05). Interestingly, the education level represented by Bachelor's degree demonstrated a significant negative association with diabetes, with a coefficient of -1.53e-05 (95% CI: -2.07e-05, -9.77e-06) and a highly significant p-value (p < 0.001). This suggests that higher educational levels may have a protective effect against diabetes. Additionally, Median Income was positively associated with diabetes outcomes, as indicated by its coefficient of 5.48e-06 (95% CI: 2.05e-06, 8.91e-06) and a significant p-value (p = 0.0018). This finding suggests that a higher median income level may be associated with an increased risk of diabetes. Furthermore, BMI obesity showed a strong positive association with diabetes, with a coefficient of 7.87e-06 (95% CI: 6.38e-06–9.36e-06) and highly significant p-value (p < 0.001). This underscores the importance of obesity as a significant predictor of diabetes incidence. Overall, the results highlight the critical role of mean atrazine level, educational level (bachelor’s degree), median income, and obesity (BMI Obese) as significant predictors of diabetes. However, variables such as race, educational level (high school graduates), and age were not significantly associated with the incidence of diabetes in this analysis.
For further robustness of the model, bootstrapping was used to support the accuracy of the regression (Table 5). A statistically significant positive association was observed between log-transformed Mean Atrazine Levels and the incidence of diabetes (coefficient = 0.3943, p < 0.001, 95% CI [0.3316, 0.4495]), indicating that higher levels of atrazine exposure may contribute to an increased risk of diabetes. Conversely, demographic variables such as Black or African American alone (coefficient = -1.76e-07, p = 0.081) and American Indian and Alaska Native alone (coefficient = -2.46e-07, p = 0.123) did not exhibit statistically significant associations with diabetes prevalence. Furthermore, the educational attainment variables, including high school graduates (coefficient = -2.63e-05, p = 0.054) and bachelor’s degree (coefficient = -1.80e-05, p < 0.001, 95% CI [-2.32e-05, -9.66e-06]), displayed negative coefficients, although not statistically significant, suggesting a potential protective effect against diabetes. Age (coefficient = 0.0048, p = 0.308, 95% CI [-0.0044, 0.0147]) and Median Income (coefficient = 3.00e-06, p = 0.048, 95% CI [1.69e-07, 6.01e-06]) were moderately positively associated with diabetes, indicating that older age and higher income may slightly increase the risk of diabetes. Moreover, obesity showed a significant positive association with diabetes (coefficient = 1.37e-05, p < 0.001, 95% CI [1.13e-05, 1.64e-05]), highlighting the critical role of obesity as a potent risk factor for this disease. These findings provide valuable insights into the complex interplay between various risk factors and diabetes prevalence, emphasizing the importance of targeted interventions to mitigate this widespread health issue.
4. Discussion
The findings of this study provide important insights into the complex interplay between environmental exposure, social determinants of health, and diabetes outcomes. The primary result was that higher atrazine levels were significantly associated with an increased risk of developing diabetes, consistent with a growing body of evidence demonstrating the diabetes-inducing effects of atrazine exposure.
A study analyzing the impact of traditional and non-traditional risk factors of type 2 diabetes found that adult exposure to atrazine, either alone or in combination with a high-carbohydrate diet, can accelerate the development of the disease in Drosophila [45]. Similarly, in mouse models, exposure to atrazine can have a compounding effect, as mice that were already diabetic were found to be more likely to suffer from an increase in kidney and liver damage biomarkers after short-term atrazine exposure [46]. This effect is also evident in human populations, although there has not been substantial research on it. For instance, a 2009 study assessing the impact of plasma herbicides, including atrazine, on the health of rural Chinese communities revealed that atrazine was among the compounds most significantly associated with an increased risk of type 2 Diabetes Mellitus [47].
Mechanistic studies revealed that chronic exposure to atrazine decreased the basal metabolic rate, increased body weight, and caused insulin resistance in rats independent of their diet and exercise levels. This is mainly due to atrazine-triggered damage to mitochondrial function in both human and animal cells [48,49,50,51]. This disruption leads to decreased oxygen consumption and suppressed insulin-mediated phosphorylation of Akt, potentially contributing to oxidative stress and impaired glucose metabolism [48].
The adverse effects of atrazine go beyond those of diabetes, with studies linking atrazine exposure to decreased gonadal hormone concentrations in rats and an increase in the odds of preterm birth in humans [52,53]. These consistent findings underscore the multifaceted detrimental effects of atrazine on various physiological systems, corroborating the significance of our observations on its role in diabetes development. In addition, these associations were observed even at relatively low exposure levels, underscoring the need for greater regulation and mitigation of atrazine contamination [48,54].
The ubiquitous presence of atrazine in water sources is a significant public health concern because it allows widespread chronic exposure in the general population. Studies have found atrazine in drinking water, surface water, and groundwater across the United States, with levels often exceeding regulatory limits [54,55]. The ease with which pesticides and other environmental contaminants can enter and persist in water systems highlights the importance of implementing robust monitoring and treatment strategies. Successful mitigation efforts in other contexts, such as the removal of lead and other herbicides from drinking water, have provided models for effectively addressing environmental exposure to atrazine [56,57].
Interestingly, the results indicated that race and ethnicity were not significantly correlated with diabetes outcomes in this population. This finding contrasts with epidemiological data that show disparities in the prevalence of diabetes across racial/ethnic groups. For example, national surveys have consistently found that Black, Hispanic, and Native American individuals have substantially higher rates of diabetes than their Caucasian counterparts do [58,59]. The lack of a significant association in our study may be due to the relatively homogeneous racial composition of the sample, which was predominantly Caucasian. The underlying drivers of these racial/ethnic differences likely involve complex interactions among genetic, socioeconomic, and environmental factors, which require further investigation.
Interestingly, the median household income was positively associated with the prevalence of diabetes. Existing population-based literature reveals that a higher median household income has an inverse relationship with diabetes, with diabetes prevalence increasing as median household income decreases [47,60]. However, it is important to acknowledge that these findings are specifically related to Saskatchewan, Canada, and China. 47,60 The Income, Employment, and Diabetes Report for Minnesota (last updated in 2022) reported that this pattern was true, but only for individuals living in households earning less than $35,000 per year [61]. Hence, there might be underlying confounding factors present in the context of the median household income data collected for regions in Pennsylvania. For instance, higher-income individuals in Pennsylvania may have better access to healthcare resources, leading to increased diagnosis and reporting of diabetes cases. This may or may not be true for other regions.
Therefore, investigating the median individual income could serve as a valuable avenue for further exploration, offering insights into the relationship between income levels and diabetes prevalence.
Educational attainment at the high school level showed a minimal association with the risk of diabetes. However, having a bachelor's degree or higher was found to have a protective effect, reducing the likelihood of developing the condition. This aligns with research demonstrating an inverse relationship between educational level and the prevalence of diabetes [62,63,64]. Higher educational achievement is often linked to greater health literacy, better health behaviors (e.g., monitoring glucose levels), and access to resources that can mitigate diabetes risk. Targeted interventions to improve educational outcomes, particularly in underserved communities, may be an effective strategy for diabetes prevention.
Consistent with the broader epidemiological literature, body mass index (BMI) in the obese range had the most substantial positive effect on diabetes outcomes in this study. Numerous studies have established obesity as a primary driver of type 2 diabetes, with a graded increase in risk as the BMI increases [65,66,67]. The biological mechanisms underlying this relationship include obesity-induced insulin resistance, impaired pancreatic cell function, and chronic inflammation, all of which contribute to disease development [68]. While overweight status (BMI 25-29.9 kg/m²) has been associated with elevated diabetes risk, the current findings suggest that the obese category (BMI ≥30 kg/m²) may represent a more critical threshold for determining diabetes outcomes [69]. This is consistent with our study's findings, which revealed a significant relationship between BMI (obese) and diabetes, but not between BMI (overweight) and diabetes [70,71,72].
The strengths of this study include the use of a large, diverse dataset that allowed for the examination of multiple environmental, sociodemographic, and lifestyle factors in relation to diabetes outcomes. The inclusion of atrazine exposure data, which is often lacking in population-based studies, provides a unique opportunity to assess the impact of this ubiquitous environmental contaminant. However, this study had some limitations. As the data were aggregated at the county or district level, the findings may not be generalizable to the individual level. Additionally, binning the data into 3-year intervals might oversimplify the trends or variations within each individual year, potentially obscuring important fluctuations or patterns. Grouping smaller counties into regions could introduce biases or inaccuracies, as it assumes homogeneity within each region and may overlook important differences between individual counties. Furthermore, focusing solely on the number of people exposed to the highest levels of atrazine may overlook important nuances in exposure patterns, thus limiting our ability to detect associations with health outcomes. Finally, the lack of median individual income data is a notable limitation, as income is an important socioeconomic factor that can influence diabetes prevalence.
Future research should focus on longitudinal cohort studies that can track individual-level exposures, such as atrazine, over time and assess their long-term impact on the development of diabetes and other adverse health outcomes. Integrating environmental data with comprehensive health records and socioeconomic indicators is pivotal for unraveling the intricate interactions among these multifaceted determinants of diabetes. Moreover, conducting qualitative inquiries into the lived experiences and perspectives of individuals in communities disproportionately affected by environmental pollutants and diabetes could offer valuable insights to shape more targeted interventions.
5. Conclusion
In conclusion, the substantial economic and social impacts of diabetes in the United States underscore the potential significance of addressing both traditional and emerging risk factors such as environmental contaminants such as atrazine. Although the observed association between atrazine exposure and increased risk of diabetes points to the possibility that environmental factors play a role, further research is necessary to confirm these findings and fully understand their implications. Similarly, socioeconomic factors such as income and education levels appear to influence diabetes prevalence and management, suggesting that interventions tailored to lower socioeconomic groups could be beneficial.
It is essential for stakeholders in the health, environmental, and regulatory sectors to collaborate in developing cautious and well-informed strategies for diabetes prevention and management. This collaboration should focus on strengthening regulations on harmful substances, enhancing public awareness of diabetes risks, and improving accessibility for early detection and intervention. By adopting a careful and integrated approach, we can better address the complex challenges of diabetes and reduce its burden on society.
Author Contributions
Tia Warrick was responsible for all aspects of the project including conceptualization, methodology, software, validation, formal analysis, investigation, resources, writing—original draft preparation, visualization, supervision, project administration, and funding acquisition, demonstrating comprehensive involvement and leadership throughout the project. Sharon Shaju, Mohini Khedekar, and Aishwarya Rajput contributed specifically to data curation and played significant roles in the editing of the draft manuscript. All authors have read and agreed to the published version of the manuscript, ensuring that their contributions align with the CRediT taxonomy to accurately acknowledge their roles in the research.
Funding
This research received no external funding.
Acknowledgments
We would like to extend our gratitude to the United States Census and Pennsylvania Department of Health for making the data available for this study.
Conflicts of Interest
The authors declare no conflicts of interest.
Appendix A
Assumptions
| Breusch-Pagan Test for Heteroscedasticity | Statistic: 10.052, p-value: 0.26 |
| Durbin-Watson Test for Autocorrelation | 1.64 |
| VIF (log_Mean Atrazine Levels) | 2.69 |
| VIF (Black or African American alone) | 1.14 |
| VIF (American Indian and Alaska Native alone) | 1.16 |
| VIF (Highschool graduates) | 3.09 |
| VIF (Bachelor degree) | 3.51 |
| VIF (Age) | 1.03 |
| VIF (Median Income) | 1.11 |
| VIF (BMI Obese) | 5.81 |
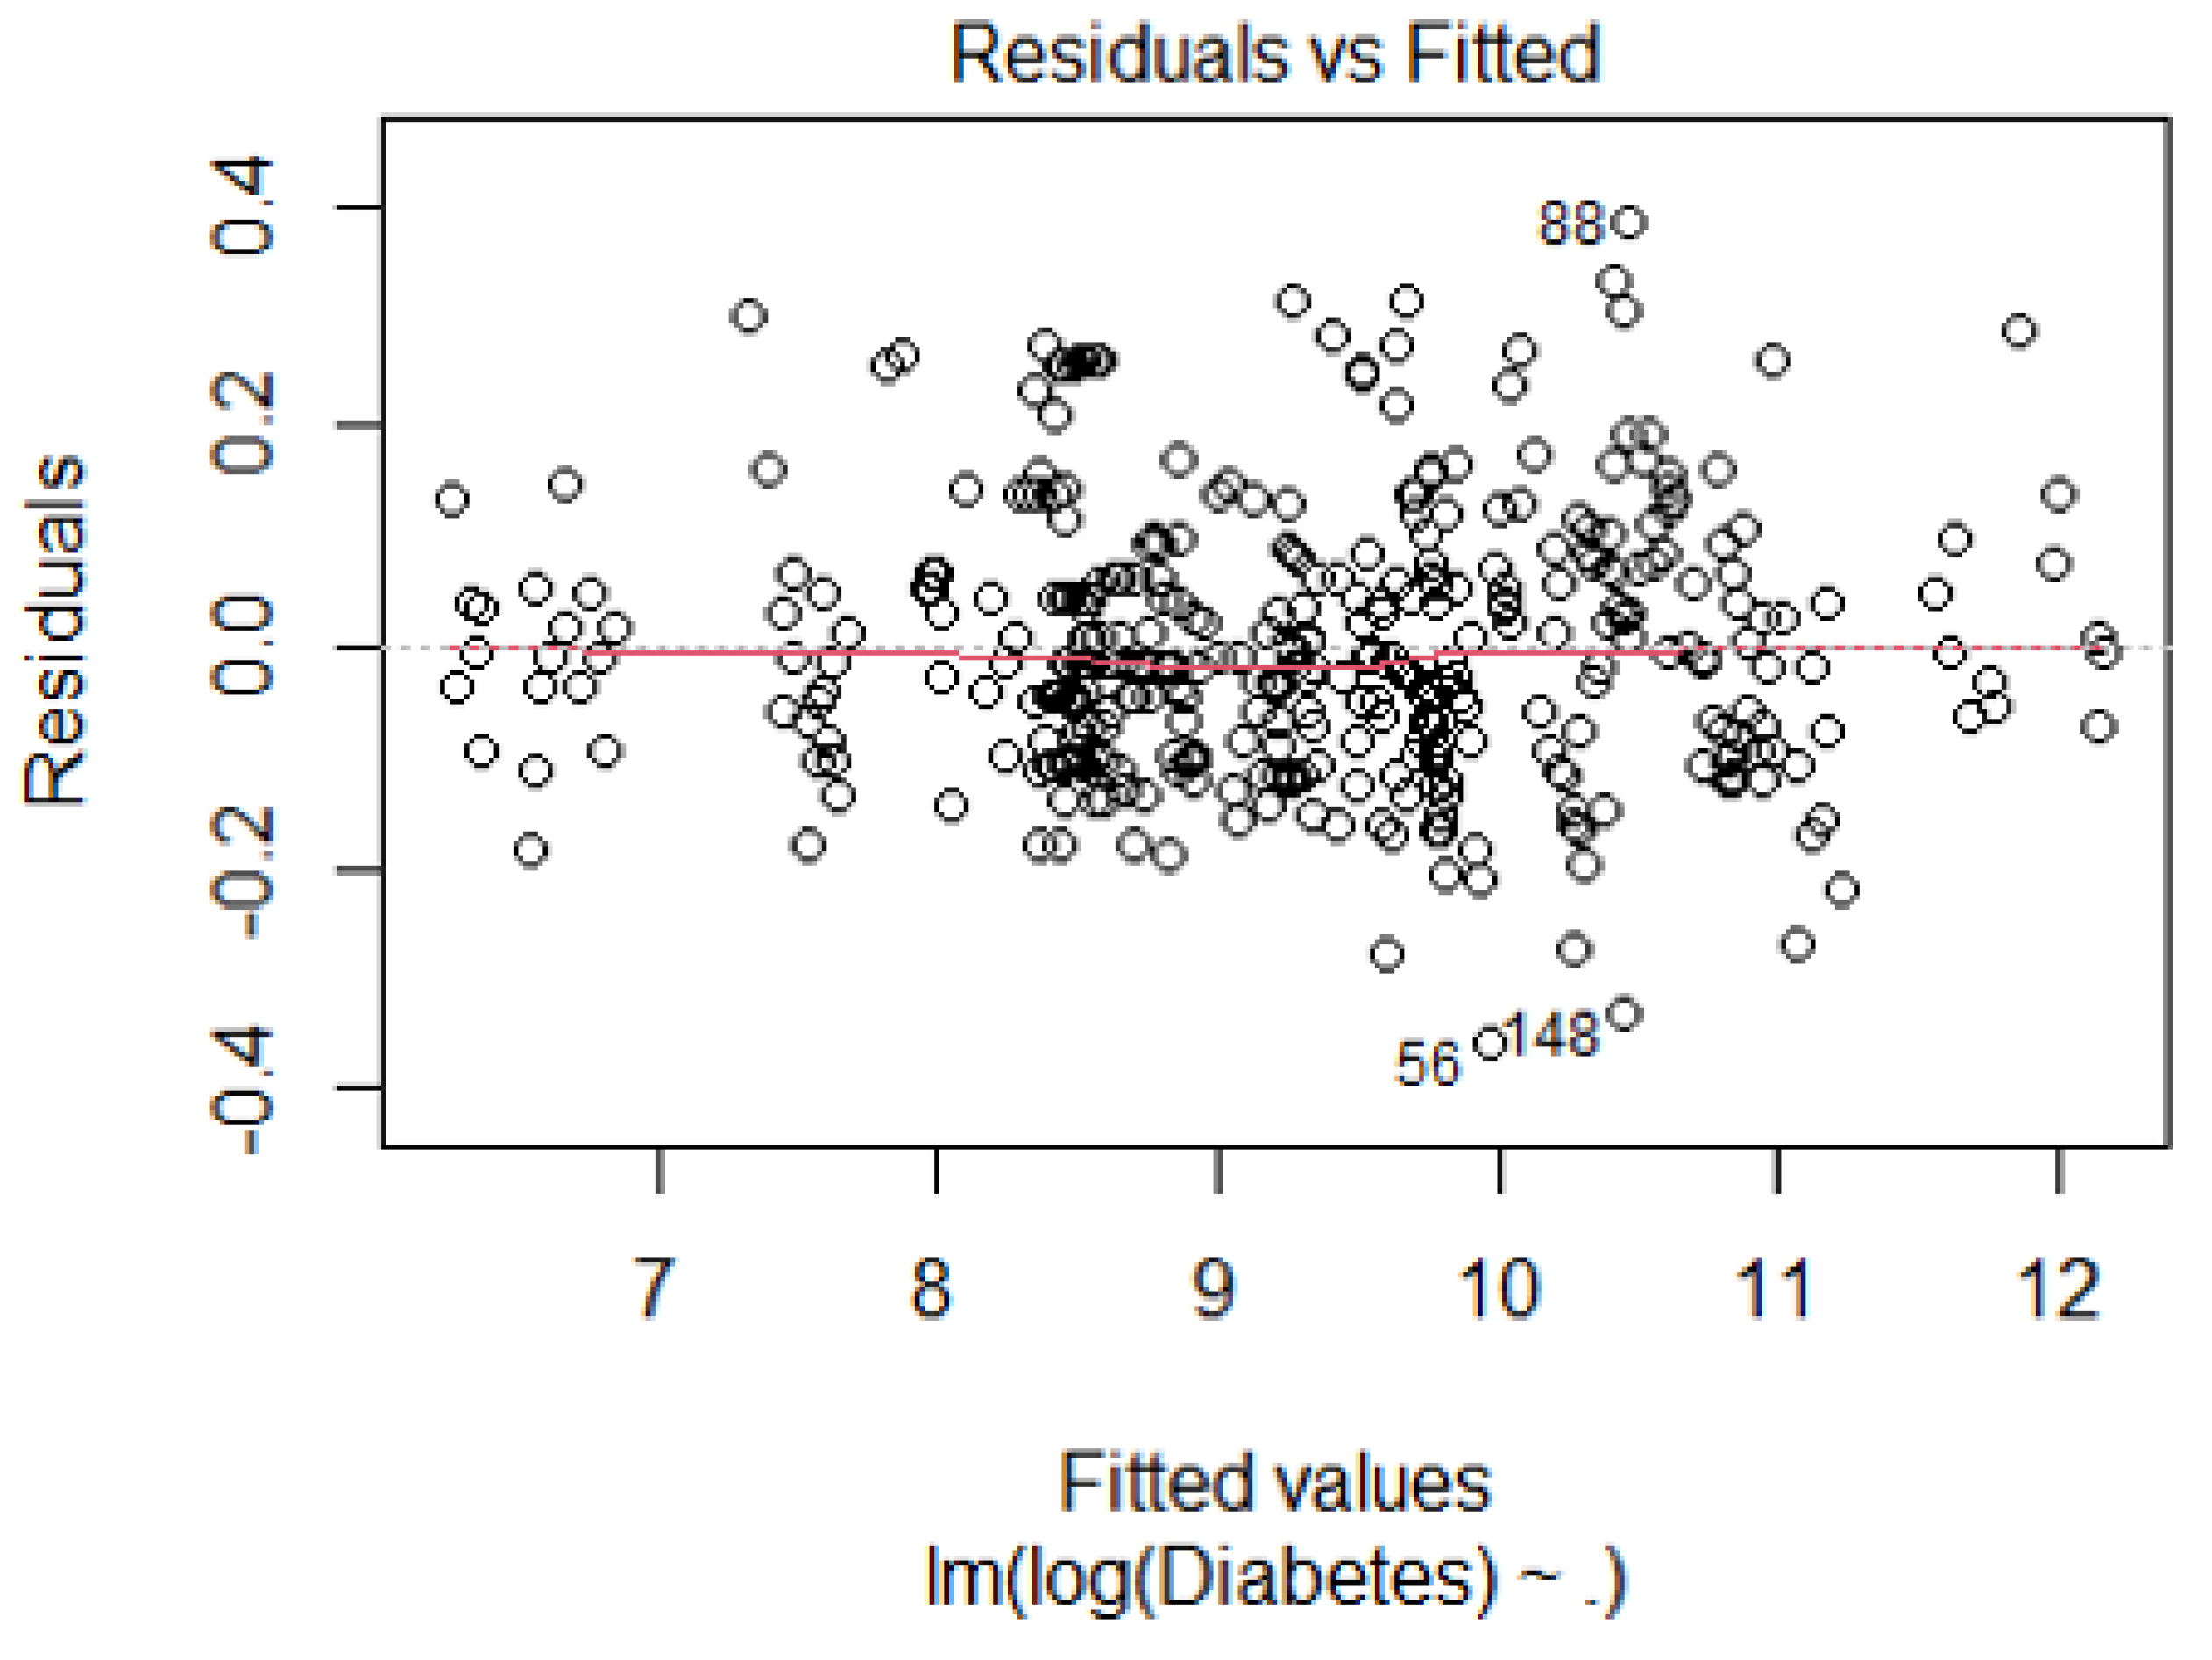
Most of the data points cluster around zero, which is positive. Some data points were further from zero, possibly indicating outliers or influential observations. No clear pattern is evident, suggesting no major issues with homoscedasticity or nonlinearity.
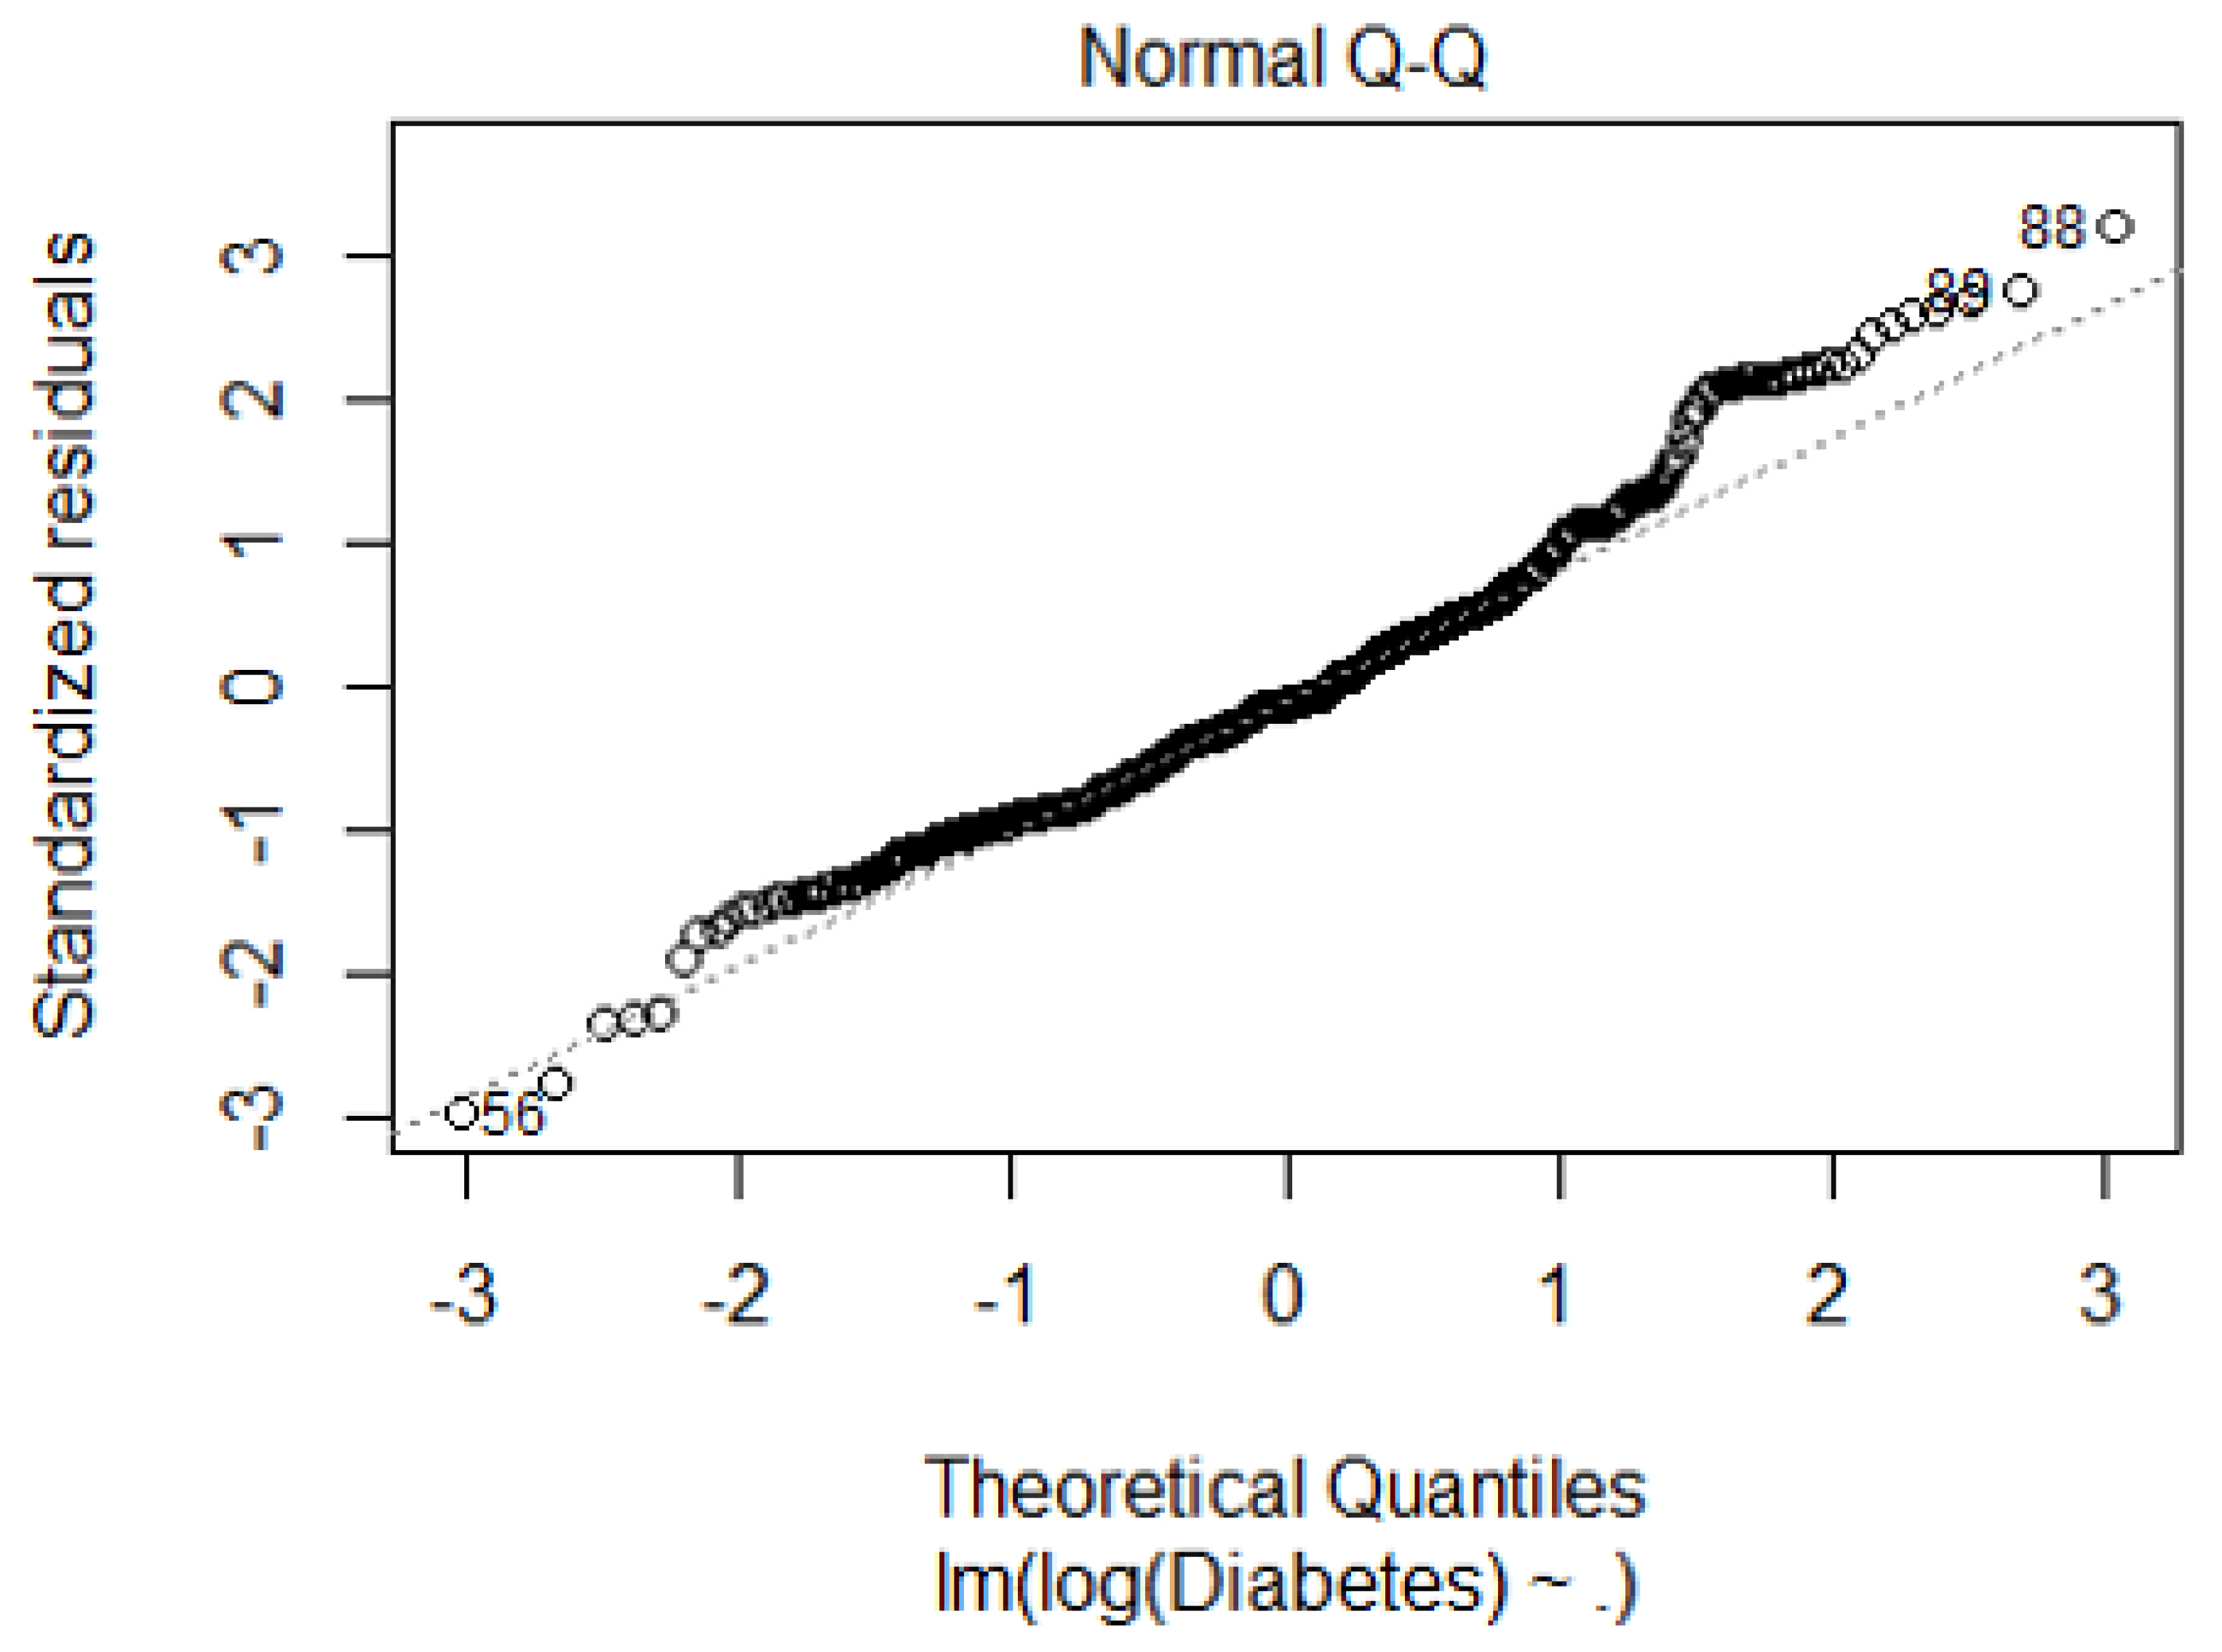
Most data points clustered around the diagonal line, suggesting that the residuals were approximately normally distributed. However, there were deviations from this line, indicating potential skewness or outliers in the data. Notably, two outliers were marked with values.” Because the points closely follow a diagonal line, supporting the assumption of normality.
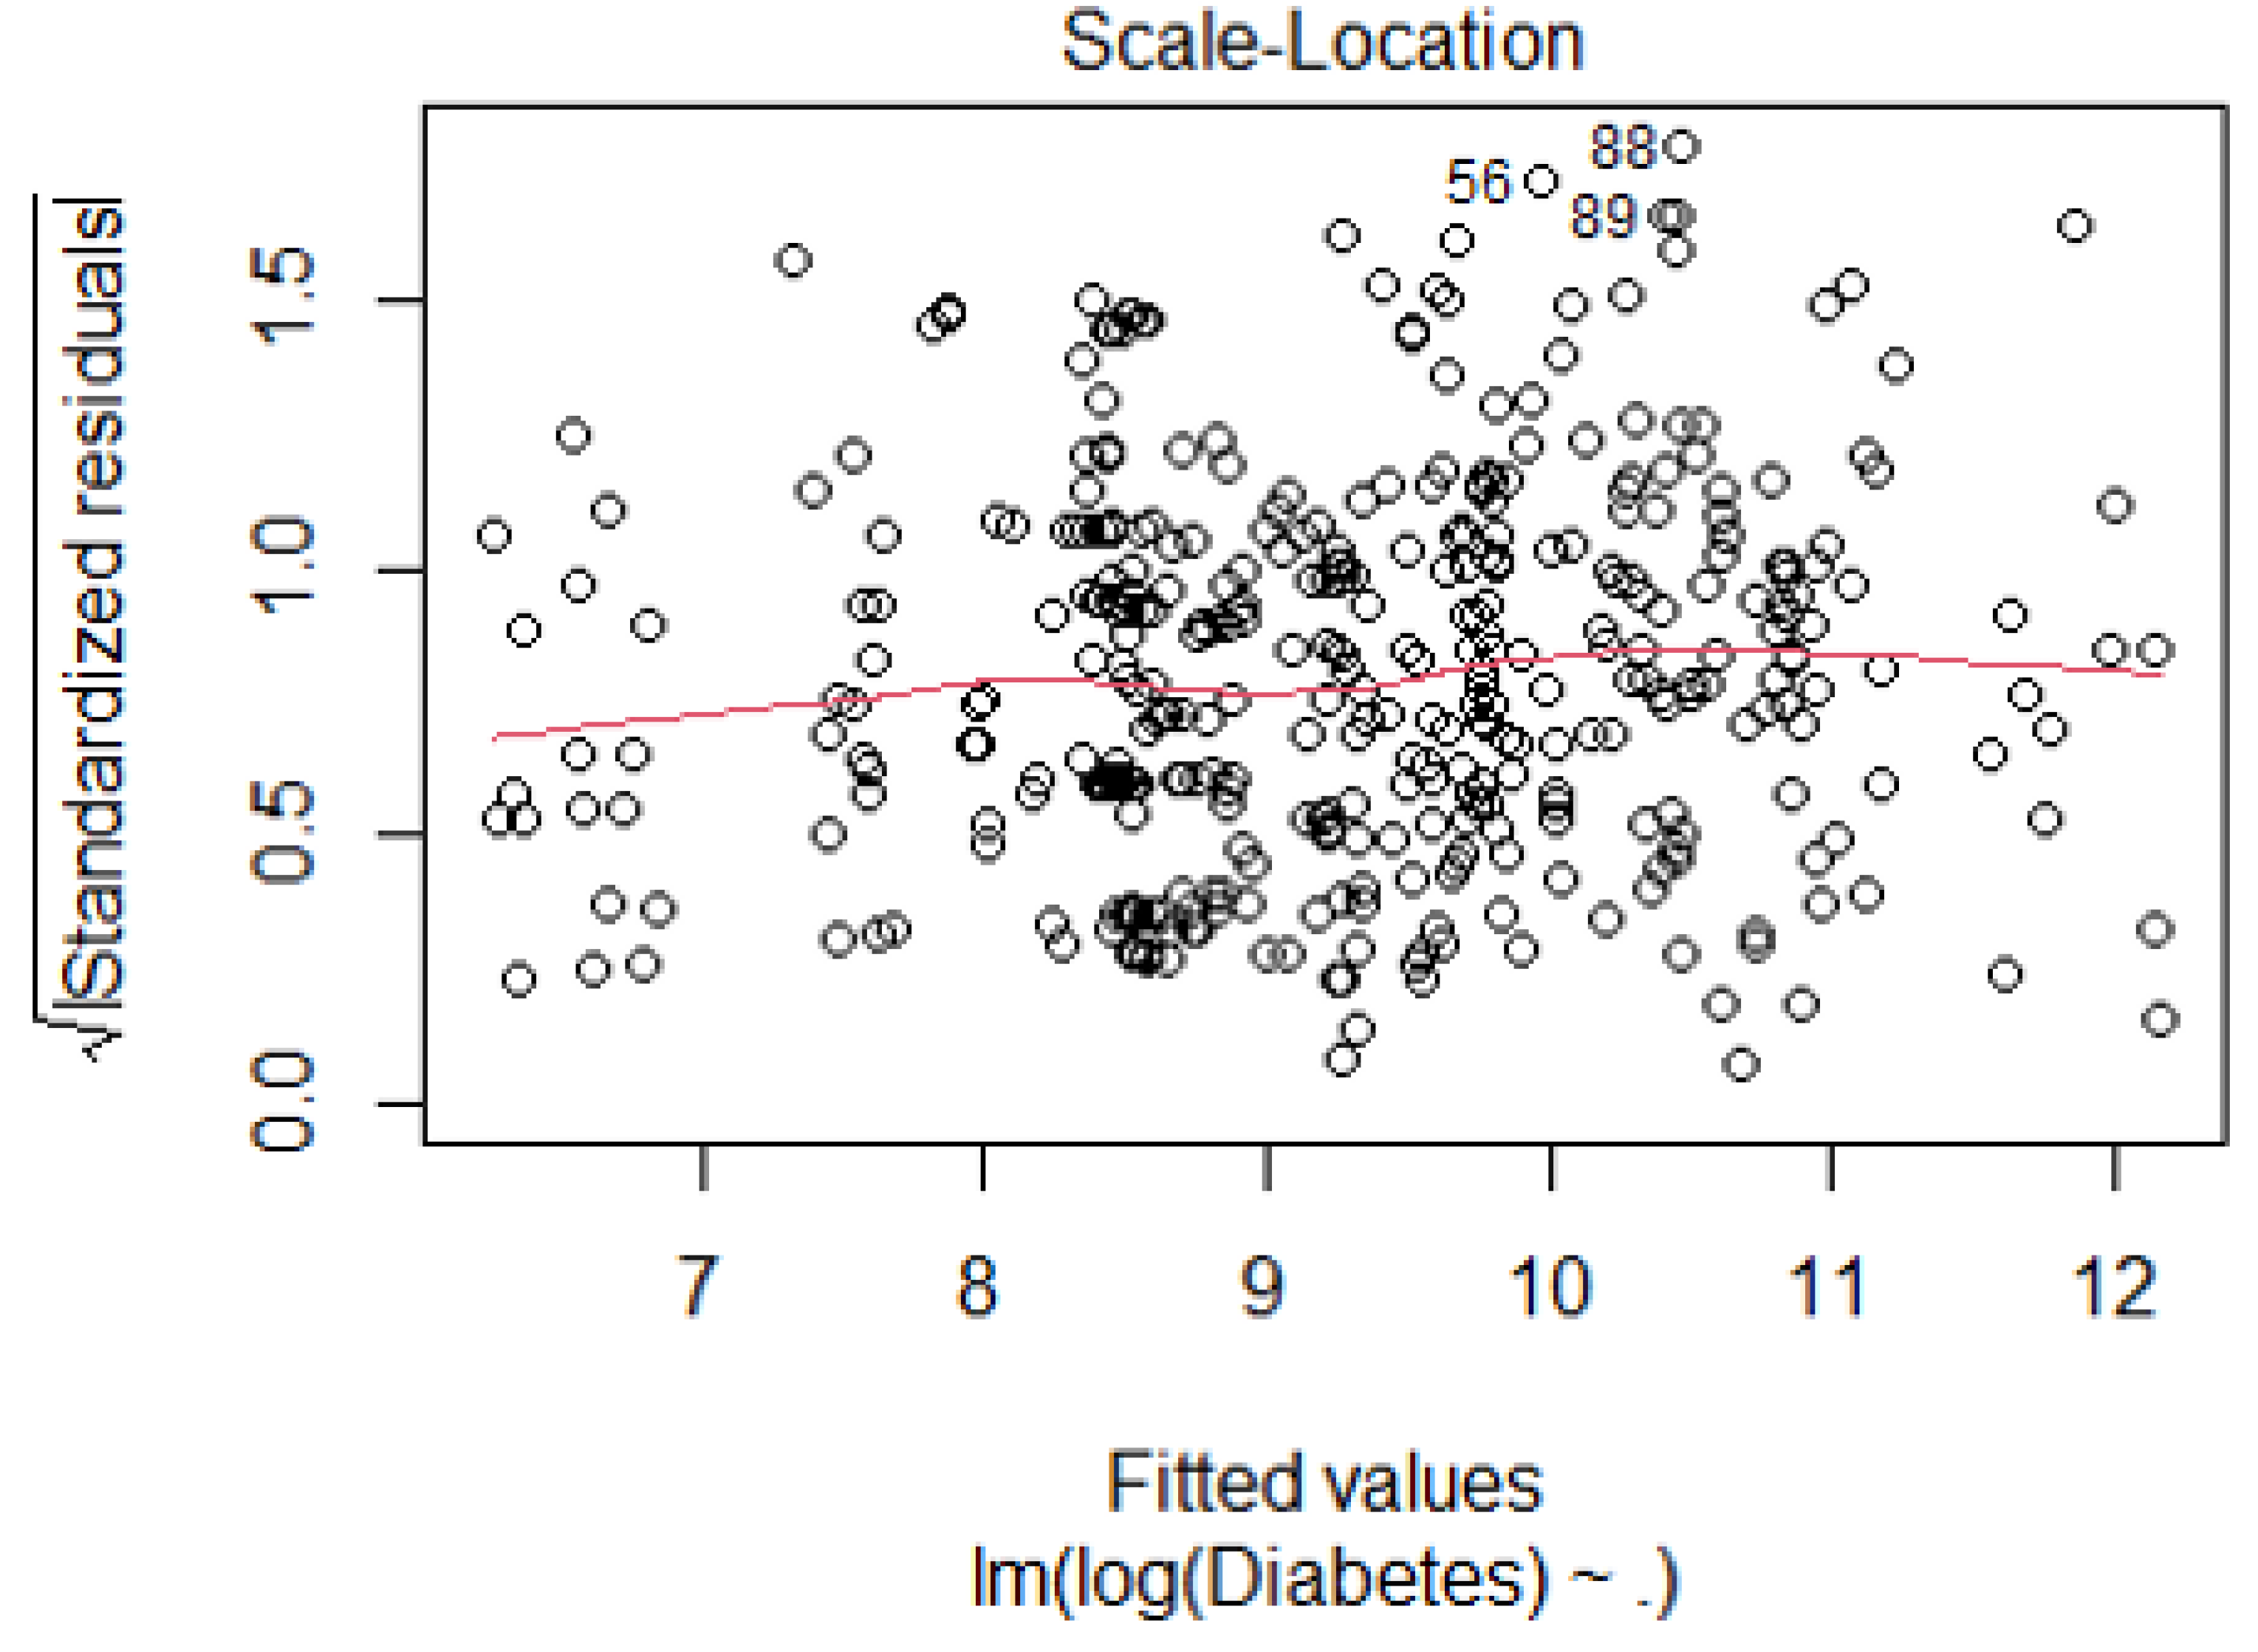
Most data points were clustered around the curve, indicating relatively consistent variance. However, there are deviations: outliers labeled “56,” “88,” and “89” may impact the variance. The spread of points was not uniform across the fitted values.
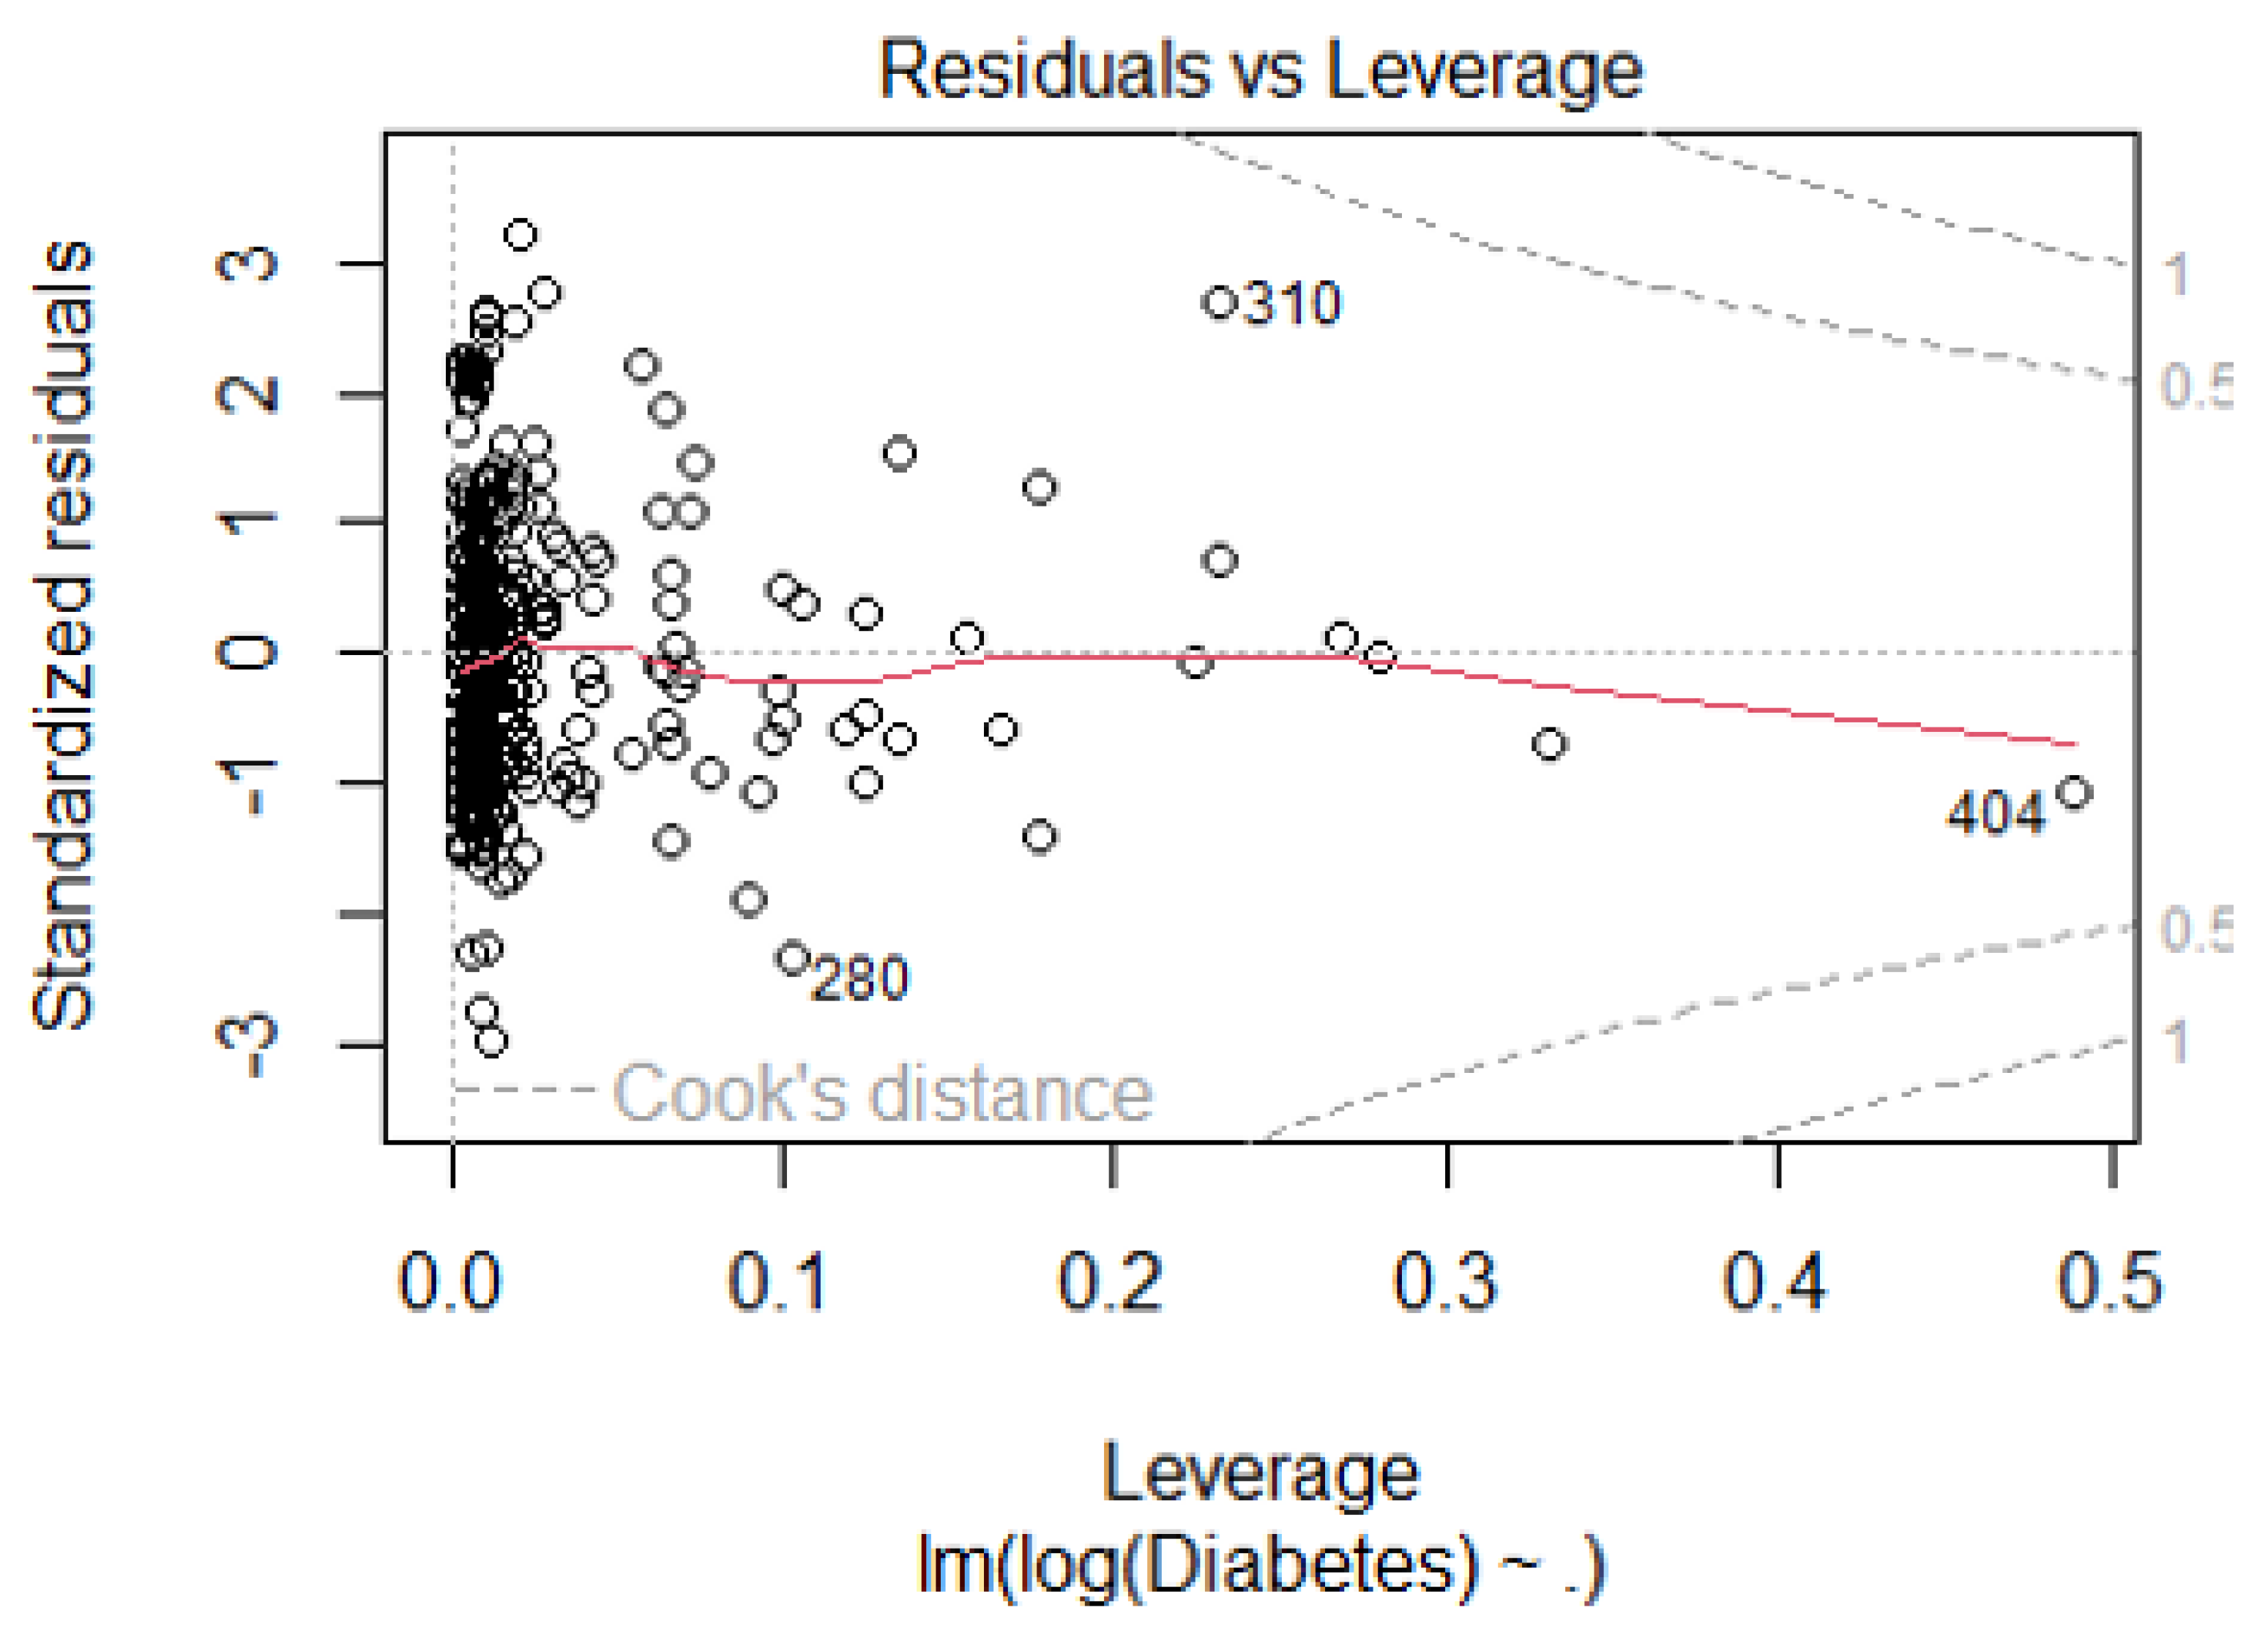
Most data points cluster around the center, indicating low leverage and residuals. Three data points labeled ‘280, ‘‘309,’ and ‘404’ lie outside the dashed lines, suggesting they may be influential observations. High leverage points (far from zero on the x-axis) impact the regression model disproportionately.
References
- Roglic, Gojka. WHO Global report on diabetes: A summary. International Journal of Noncommunicable Diseases 1(1):p 3-8, Apr–Jun 2016. |. [CrossRef]
- Genuth SM, Palmer JP, Nathan DM. Classification and Diagnosis of Diabetes. In: Cowie CC, Casagrande SS, Menke A, et al., editors. Diabetes in America. 3rd edition. Bethesda (MD): National Institute of Diabetes and Digestive and Kidney Diseases (US); 2018 Aug.
- Wagenknecht LE, Lawrence JM, Isom S, et al. Trends in incidence of youth-onset type 1 and type 2 diabetes in the USA, 2002-18: results from the population-based SEARCH for Diabetes in Youth study. Lancet Diabetes Endocrinol. 2023;11(4):242–250. [CrossRef]
- "Diabetes." hopkinsmedicine.org. Johns Hopkins Medicine. Web. Accessed 05/03/2024.
- Davis IC, Ahmadizadeh I, Randell J, Younk L, Davis SN. Understanding the impact of hypoglycemia on the cardiovascular system. Expert Rev Endocrinol Metab. 2017;12(1):21–33. [CrossRef]
- Mobasseri, Majid, Masoud Shirmohammadi, Tarlan Amiri, Nafiseh Vahed, Hossein Hosseini Fard, and Morteza Ghojazadeh. "Prevalence and Incidence of Type 1 Diabetes in the World: A Systematic Review and Meta-Analysis." Health Promotion Perspectives, vol. 10, no. 2, 2020, pp. 98–115. PubMed Central. [CrossRef]
- Ahmad, Ehtasham, et al. "Type 2 Diabetes." The Lancet, vol. 400, no. 10362, 1 Nov. 2022. VOLUME 400, ISSUE 10365, P1803-1820. [CrossRef]
- Teliti, M. , et al. "Risk Factors for the Development of Microvascular Complications of Type 2 Diabetes in a Single-Centre Cohort of Patients." Diabetes and Vascular Disease Research, vol. 15, 2018, pp. 424-432.
- Kosiborod, M. , et al. "Vascular Complications in Patients with Type 2 Diabetes: Prevalence and Associated Factors in 38 Countries (the DISCOVER Study Program)." Cardiovascular Diabetology, vol. 17, 2018, article 150.
- Scott, E. S. , et al. "Long-Term Glycemic Variability and Vascular Complications in Type 2 Diabetes: Post Hoc Analysis of the FIELD Study." Journal of Clinical Endocrinology and Metabolism, vol. 105, 2020, pp. e3638-e3649.
- Wagner, R. , et al. “Pathophysiology-Based Subphenotyping of Individuals at Elevated Risk for Type 2 Diabetes." Nature Medicine, vol. 27, 2021, pp. 49-57.
- Association, American Diabetes. "Economic Costs of Diabetes in the U.S. in 2017." Diabetes Care, vol. 41, no. 5, 2018, pp. 917-928. [CrossRef]
- de Lagasnerie, G. , et al. "The Economic Burden of Diabetes to French National Health Insurance: A New Cost-of-Illness Method Based on a Combined Medicalized and Incremental Approach." European Journal of Health Economics, vol. 19, no. 2, 2018, pp. 189-201. [CrossRef]
- Rodriguez-Sanchez, B. , Aranda-Reneo, I., Oliva-Moreno, J., & Lopez-Bastida, J. (2021). Assessing the Effect of Including Social Costs in Economic Evaluations of Diabetes-Related Interventions: A Systematic Review. ClinicoEconomics and Outcomes Research, 13, 307–334. [CrossRef]
- Ericsson, Å. , & Fridhammar, A. (2019). Cost-effectiveness of once-weekly semaglutide versus dulaglutide and lixisenatide in patients with type 2 diabetes with inadequate glycemic control in Sweden. Journal of Medical Economics, 22(10), 997–1005. [CrossRef]
- Hex, N. , et al. "Estimating the Current and Future Costs of Type 1 and Type 2 Diabetes in the UK, Including Direct Health Costs and Indirect Societal and Productivity Costs." Diabetic Medicine, vol. 29, no. 7, 2012, pp. 855-862. [CrossRef]
- Lopez-Bastida, J. , et al. "Social Economic Costs of Type 1 Diabetes Mellitus in Pediatric Patients in Spain: CHRYSTAL Observational Study." Diabetes Research and Clinical Practice, vol. 127, 2017, pp. 59-69. [CrossRef]
- American Diabetes Association. "Economic Costs of Diabetes in the U.S. in 2017." Diabetes Care, vol. 41, no. 5, May 2018, pp. 917-928. [CrossRef] [PubMed] [PubMed Central]
- Golden SH, Brown A, Cauley JA, et al.. Health disparities in endocrine disorders: biological, clinical, and nonclinical factors—an Endocrine Society scientific statement. J Clin Endocrinol Metab 2012;97.
- Haire-Joshu D, Hill-Briggs F. The next generation of diabetes translation: a path to health equity. Annu Rev Public Health 2019, 40, 391–391. [CrossRef] [PubMed]
- Hill-Briggs F 2018 Health Care & Education Presidential Address: the American Diabetes Association in the era of health care transformation. Diabetes Care 2019, 42.
- Kezer, M. , & Cemalcilar, Z. (2020). A Comprehensive Investigation of Associations of Objective and Subjective Socioeconomic Status with Perceived Health and Subjective Well-Being. International Review of Social Psychology, 33(1), 10. [CrossRef]
- Yu, S. , & Blader, S. L. (2020). Why Does Social Class Affect Subjective Well-Being? The Role of Status and Power. Personality and Social Psychology Bulletin, 46(3), 331-348. [CrossRef]
- Garrison, S. M. , & Rodgers, J. L. (2019). Decomposing the causes of the socioeconomic status-health gradient with biometrical modeling. Journal of Personality and Social Psychology, 116(6), 1030–1047. [CrossRef]
- Adler NE, Newman K. Socioeconomic disparities in health: pathways and policies. Health Aff (Millwood) 2002, 21, 60–76. [CrossRef] [PubMed]
- Hermsen S, van Kraaij A, Camps G Low– and Medium–Socioeconomic-Status Group Members’ Perceived Challenges and Solutions for Healthy Nutrition: Qualitative Focus Group Study JMIR Hum Factors 2022;9(4):e40123. [CrossRef]
- Sherman-Wilkins KJ, Thierry AD. Education as the Great Equalizer? Racial and Ethnic Differences in the Effect of Education on Cognitive Impairment in Later Life. Geriatrics. 2019; 4(3):51. [CrossRef]
- Sisco S, Gross AL, Shih RA, et al.. The role of early-life educational quality and literacy in explaining racial disparities in cognition in late life. J Gerontol B Psychol Sci Soc Sci, 2015; 70, 557–567.
- Qi Y, Koster A, van Boxtel M, et al. Adulthood Socioeconomic Position and Type 2 Diabetes Mellitus-A Comparison of Education, Occupation, Income, and Material Deprivation: The Maastricht Study. Int J Environ Res Public Health. 2019;16(8):1435. Published 2019 Apr 23. [CrossRef]
- Sezer B, Koster A, Albers J, et al. Socioeconomic Position and Type 2 Diabetes: The Mediating Role of Psychosocial Work Environment- the Maastricht Study. Int J Public Health. 2023;68:1606036. Published 2023 Sep 7. [CrossRef]
- Gaskin DJ, Thorpe RJ Jr, McGinty EE, et al.. Disparities in diabetes: the nexus of race, poverty, and place. Am J Public Health 2014, 104, 2147–2155. [CrossRef] [PubMed]
- Felicia Hill-Briggs, Nancy E. Adler, Seth A. Berkowitz, Marshall H. Chin, Tiffany L. Gary-Webb, Ana Navas-Acien, Pamela L. Thornton, Debra Haire-Joshu; Social Determinants of Health and Diabetes: A Scientific Review. Diabetes Care 1 January 2021; 44 (1): 258–279. [CrossRef]
- Scott A, Chambers D, Goyder E, O’Cathain A. Socioeconomic inequalities in mortality, morbidity and diabetes management for adults with type 1 diabetes: a systematic review. PLoS One 2017;12:e0177210.
- Centers for Disease Control and Prevention National Diabetes Statistics Report, 2017. Atlanta, GA, Centers for Disease Control and Prevention, US Department of Health and Human Services, 2017. Accessed 25 October 2020.
- Gæde P, Oellgaard J, Carstensen B, et al. Years of life gained by multifactorial intervention in patients with type 2 diabetes mellitus and microalbuminuria: 21 years follow-up on the Steno-2 randomised trial. Diabetologia. 2016;59(11):2298-2307. [CrossRef]
- Biradar DP, Rayburn AL. 1995a. Chromosomal damage induced by herbicide contamination at concentrations observed in public water supplies. J Environ Qual, 24, 2015, 1222-1225.
- Supekar SC, Gramapurohit NP. Does atrazine induce changes in predator recognition, growth, morphology, and metamorphic traits of larval skipper frogs (Euphlyctis cyanophlyctis)? J Exp Zool. Published online October 17, 2022. [CrossRef]
- Agency for Toxic Substances and Disease Registry (US). "Glossary." Toxicological Profile for Atrazine, 10 Sept. 2003, Atlanta, GA. https://www.ncbi.nlm.nih.gov/books/NBK597844/.
- Quackenboss JJ, Pellizzari ED, Shubat P, et al 2000. Design strategy for assessing multi-pathway exposure for children: The Minnesota Children's Pesticide Exposure Study (MNCPES). J Expo Anal Environ Epidemiol 10:145–158.
- Lioy PJ, Edwards RD, Freeman N, et al 2000. House dust levels of selected insecticides and a herbicide measured by the EL and LWW samplers and comparisons to hand rinses and urine metabolites. J Expo Anal Environ Epidemiol 10:327–340.
- Dorsey, L. , and C. Portier. Atrazine: Hazard and Dose-Response Assessment and Characterization. FIFRA Scientific Advisory Panel Meeting, SAP Report No. 2000-05, 13 Feb. 2000. [Google Scholar]
- Ackerman, F. "The Economics of Atrazine." International Journal of Occupational and Environmental Health, vol. 13, 2007, pp. 437-445.
- Singh, S. , et al. "Toxicity, Degradation and Analysis of the Herbicide Atrazine." Environmental Chemistry Letters, vol. 16, 2018, pp. 211-237.
- Gupta, H. P. , et al. "Xenobiotic Mediated Diabetogenesis: Developmental Exposure to Dichlorvos or Atrazine Leads to Type 1 or Type 2 Diabetes in Drosophila." Free Radical Biology and Medicine, vol. 141, 2019, pp. 461-474.
- Gupta, H. P. , Fatima, M., Pandey, R., & Ravi Ram, K. (2023). Adult exposure of atrazine alone or in combination with a carbohydrate diet hastens the onset/progression of type 2 diabetes in Drosophila. Life Sciences, 316, 121370. [CrossRef]
- Jestadi, D. B. , Phaniendra, A., Babji, U., Srinu, T., Shanmuganathan, B., & Periyasamy, L. (2014). Effects of Short Term Exposure of Atrazine on the Liver and Kidney of Normal and Diabetic Rats. Journal of Toxicology, 2014. [CrossRef]
- Wei, D. , Wang, L., Xu, Q., Wang, J., Shi, J., Ma, C., Geng, J., Zhao, M., Liu, X., Hou, J., Huo, W., Li, L., Jing, T., Wang, C., & Mao, Z. (2023). Exposure to herbicides mixtures in relation to type 2 diabetes mellitus among Chinese rural population: Results from different statistical models. Ecotoxicology and Environmental Safety, 261, 115109. [CrossRef]
- Lim S, Ahn SY, Song IC, Chung MH, Jang HC, Park KS, et al. Chronic exposure to the herbicide, atrazine, causes mitochondrial dysfunction and insulin resistance. PLoS One. 2009;4(4): e5186. https://journals.plos.org/plosone/article?id=10.1371%2Fjournal.pone.0005186.
- Sagarkar, S.; Gandhi, D.; Devi, S.S.; Sakharkar, A.; Kapley, A. Atrazine exposure causes mitochondrial toxicity in liver and muscle cell lines. Indian Journal of Pharmacology 2016, 48, 200–207. [Google Scholar] [CrossRef] [PubMed]
- Karadayian, A.G.; Paez, B.; Bustamante, J.; Lores-Arnaiz, S.; Czerniczyniec, A. Mitochondrial dysfunction due to in vitro exposure to atrazine and its metabolite in striatum. Journal of Biochemical and Molecular Toxicology 2023, 37, e23232. [Google Scholar] [CrossRef] [PubMed]
- Lin, J. , Zhao, H., Qin, L., Li, X., Zhang, C., Xia, J., … & Li, J. (2018). Atrazine triggers mitochondrial dysfunction and oxidative stress in quail (coturnix c. coturnix) cerebrum via activating xenobiotic-sensing nuclear receptors and modulating cytochrome p450 systems. Journal of Agricultural and Food Chemistry, 66(25), 6402-6413. [CrossRef]
- Rotimi, D. E. , Ojo, O. A., & Adeyemi, O. S. (2024). Atrazine exposure caused oxidative stress in male rats and inhibited brain-pituitary-testicular functions. Journal of Biochemical and Molecular Toxicology, 38(1), e23579. [CrossRef]
- Rinsky JL, Hopenhayn C, Golla V, Browning S, Bush HM. Atrazine exposure in public drinking water and preterm birth. Public Health Rep. 2012 Jan-Feb;127(1):72-80. [CrossRef] [PubMed]
- Jablonowski ND, Schäffer A, Burauel P. Still present after all these years: persistence plus potential toxicity raise questions about the use of atrazine. Environ Sci Pollut Res Int. 2011 Feb;18(2):328-31. [CrossRef] [PubMed]
- Ribaudo M, Bouzaher A. Atrazine: Environmental Characteristics and Economics of Management. USDA, Agricultural Economic Report No. 699; 1994.
- Petrie, A. J. , Melvin, M. A. L., Plane, N. H., & LittleJohn, J. W.. The effectiveness of water treatment processes for removal of herbicides. (2003, July 7) Science of The Total Environment. https://www.sciencedirect.com/science/article/abs/pii/004896979390287G. 7 July 0048. [Google Scholar]
- Brooks, Robert M.; Bahadory, Mozhgan; Tovia, Fernando; and Rostami, Hossein (2010) "Removal of Lead from Contaminated Water," International Journal of Soil, Sediment and Water: Vol. 3: Iss. 2, Article 14. Available at: https://scholarworks.umassumass.edu/intljssw/vol3/iss2/14.
- Menke A, Casagrande S, Geiss L, Cowie CC. Prevalence of and Trends in Diabetes Among Adults in the United States, 1988-2012. JAMA. 2015 Sep 8;314(10):1021-9. [CrossRef] [PubMed]
- Spanakis EK and Golden, SH. Race/Ethnic Differences in Diabetes and Complications.
- Curr Diab Rep. 2013 Dec;13(6):814-23. [CrossRef] [PubMed]
- Bird Y, Lemstra M, Rogers M, Moraros J. The relationship between socioeconomic status/income and prevalence of diabetes and associated conditions: A cross-sectional population-based study in Saskatchewan, Canada. Int J Equity Health. 2015 Oct 12;14:93. [CrossRef] [PubMed]
- Income, Employment, and Diabetes in Minnesota. Minnesota Department of Health; 2022.
- Saydah S, Lochner K. Socioeconomic status and risk of diabetes-related mortality in the U.S. Public Health Rep. 2010 May-Jun;125(3):377-88. [CrossRef] [PubMed]
- Sacerdote C, Ricceri F, Rolandsson O, Baldi I, Chirlaque MD, Feskens E, Bendinelli B, Ardanaz E, Arriola L, Balkau B, Bergmann M, Beulens JW, Boeing H, Clavel-Chapelon F, Crowe F, de Lauzon-Guillain B, Forouhi N, Franks PW, Gallo V, Gonzalez C, Halkjær J, Illner AK, Kaaks R, Key T, Khaw KT, Navarro C, Nilsson PM, Dal Ton SO, Overvad K, Pala V, Palli D, Panico S, Polidoro S, Quirós JR, Romieu I, Sánchez MJ, Slimani N, Sluijs I, Spijkerman A, Teucher B, Tjønneland A, Tumino R, van der A D, Vergnaud AC, Wennberg P, Sharp S, Langenberg C, Riboli E, Vineis P, Wareham N. Lower educational level is a predictor of incident type 2 diabetes in European countries: the EPIC-InterAct study. Int J Epidemiol. 2012 Aug;41(4):1162-73. [CrossRef] [PubMed]
- Whitaker SM, Bowie JV, McCleary R, Gaskin DJ, LaVeist TA, Thorpe RJ Jr. The Association Between Educational Attainment and Diabetes Among Men in the United States. Am J Mens Health. 2014 Jul;8(4):349-56. [CrossRef] [PubMed]
- Gray N, Picone G, Sloan F, Yashkin A. Relation between BMI and diabetes mellitus and its complications among US older adults. South Med J. 2015 Jan;108(1):29-36. [CrossRef] [PubMed]
- Andréasson K, Edqvist J, Adiels M, Björck L, Lindgren M, Sattar N. EClinicalMedicine (Part of the LANCET Discovery Science); 2022 [cited 2024 May 8]. Available from, 8 May. [CrossRef]
- K.M.V. Narayan, James P. Boyle, Theodore J. Thompson, Edward W. Gregg, David F. Williamson; Effect of BMI on Lifetime Risk for Diabetes in the U.S.. Diabetes Care 1 June 2007; 30 (6): 1562–1566. [CrossRef]
- Nitecki, M. , Gerstein, H.C., Balmakov, Y. et al. High BMI and the risk for incident type 1 Diabetes Mellitus: a systematic review and meta-analysis of aggregated cohort studies. Cardiovasc Diabetol 22, 300 (2023). [CrossRef]
- Al-Goblan AS, Al-Alfi MA, Khan MZ. Mechanism linking diabetes mellitus and obesity. Diabetes Metab Syndr Obes. 2014;7:587-591. Published 2014 Dec 4. [CrossRef]
- Diabetes Metab Syndr Obes. 2014 Dec 4;7:587-91. [CrossRef] [PubMed]
- Bhupathiraju SN, Hu FB. Epidemiology of Obesity and Diabetes and Their Cardiovascular Complications. Circ Res. 2016 May 27;118(11):1723-35. [CrossRef] [PubMed] [PubMed Central]
Figure 1.
Diabetes and Atrazine Distribution in Pennsylvania, USA. Note: Darker blue indicates higher diabetes counts in the corresponding counties. Larger purple diamonds indicate higher counts of maximum atrazine exposure (1ug/L).
Figure 1.
Diabetes and Atrazine Distribution in Pennsylvania, USA. Note: Darker blue indicates higher diabetes counts in the corresponding counties. Larger purple diamonds indicate higher counts of maximum atrazine exposure (1ug/L).


Table 1.
Descriptive Statistics of Key Study Variables from 2011-2019.
| Variable | N | Standard Deviation | Mean | Minimum | Median | Maximum |
|---|---|---|---|---|---|---|
| Total Population | 405 | 167,382.89 | 189,155.25 | 4,610 | 87,331 | 1,580,081.00 |
| Fruits and Vegetable | 405 | 53,870.61 | 24,627.67 | 371 | 10,585 | 257,894.50 |
| Physical activity | 405 | 227,185.90 | 92,940.88 | 2,253 | 42,243 | 811,591.00 |
| Atrazine Exposure | 405 | 315,117.43 | 93,357.76 | 258 | 26,180 | 1,600,000.00 |
| No Physical Activity | 405 | 93,413.65 | 47,914.23 | 1,326 | 24,004 | 425,495.00 |
| Diabetes | 405 | 37,640.94 | 20,067.52 | 517 | 10,381 | 189,609.80 |
| BMI Obese | 405 | 90,299.11 | 56,746.90 | 1,491 | 30,149 | 505,626.00 |
| BMI Overweight | 405 | 233,187.52 | 123,280.13 | 3,197 | 59,362 | 1,042,854.00 |
| Age | 405 | 4.62 | 41.12 | 29.1 | 41.2 | 46.2 |
| White alone | 405 | 2,879,614.61 | 581,883.41 | 6,537 | 196,152 | 9,115,388.00 |
| Black or African American alone | 405 | 1,220,136.23 | 109,248.61 | 295 | 19,935 | 6,749,973.00 |
| American Indian and Alaska Native alone | 405 | 352,743.26 | 15,583.28 | 22 | 512 | 1,145,408.00 |
| Asian alone | 405 | 324,465.26 | 28,166.94 | 31 | 3,413 | 456,752.00 |
| Native Hawaiians and Other Pacific Islanders alone | 405 | 160,000 | 9,871 | 0 | 78 | 456,790 |
| Median Income | 405 | 36,473.61 | 2,867.83 | 806 | 52,638 | 226,041.00 |
| Less than high school | 405 | 10,443.98 | 4,046.81 | 1.7 | 2,419 | 59,742.00 |
| High school graduates | 405 | 9,247.18 | 2,596.58 | 22.1 | 1,670 | 42,571.30 |
| Some college or associate | 405 | 18,650.43 | 6,129.49 | 4.17 | 1,827 | 118,264.27 |
| Bachelor’s degree | 405 | 19,432.99 | 8,900.17 | 4 | 4,962 | 116,518.00 |
Note: Descriptive statistics of key variables in the study cohort. The table summarizes the number of observations (N); standard deviation; and mean, minimum, median, and maximum values for various factors, including demographics, health indicators, and socioeconomic variables.
Table 2.
Cross Validation Results.
| Fold Number | Mean Squared Error (MSE) |
|---|---|
| 1 | 0.4449 |
| 2 | 0.0692 |
| 3 | 0.0998 |
| 4 | 0.2880 |
| 5 | 0.1749 |
| 6 | 0.0710 |
| 7 | 0.1194 |
| 8 | 0.1074 |
| 9 | 0.1285 |
| 10 | 0.0919 |
| Average | 0.1595 |
Note: The numbers display the mean squared error (MSE) values across ten folds obtained from cross-validation. MSE serves as a measure of the predictive accuracy of a regression model, with lower values indicating better performance.
Table 3.
Sensitivity Analysis.
| Variable | Lower Bound Value | Upper Bound Value | Predicted Lower Bound | Predicted Upper Bound | Change in Prediction |
|---|---|---|---|---|---|
| log_Mean Atrazine Levels | 8.958 | 11.105 | 8.687 | 9.750 | +1.063 |
| Black or African American alone | 79,682 | 86,069 | 9.219 | 9.218 | -0.001 |
| American Indian and Alaska Native alone | 10,828 | 10,856 | 9.219 | 9.219 | 0.000 |
| Highschool graduates | 2,096 | 2,570 | 9.221 | 9.217 | -0.004 |
| Bachelor degree | 6,922 | 8,376 | 9.230 | 9.208 | -0.022 |
| Age | 40.927 | 41.327 | 9.217 | 9.220 | +0.003 |
| Median Income | 50,429 | 54,159 | 9.208 | 9.229 | +0.021 |
| BMI Obese | 27,604 | 68,903 | 9.056 | 9.381 | +0.325 |
Note: Outputs provide the lower and upper bounds of the predictor variables, along with the corresponding predicted lower and upper bounds and the change in prediction. These values offer insights into the variability and potential fluctuations in predicted outcomes associated with changes in each predictor variable.
Table 4.
Regression Coefficients and Statistical Significance.
| Variable | Coefficient | Std Error | t-Value | p-Value | Significance | 95% CI Range |
|---|---|---|---|---|---|---|
| Constant | 3.3745 | 0.425 | 7.945 | 2.41e-14 | ** | (2.5393, 4.2097) |
| log_Mean Atrazine Levels | 0.4951 | 0.020 | 24.993 | 3.17e-81 | ** | (0.4562, 0.5341) |
| Black or African American alone | -5.23e-08 | 8.09e-08 | -0.647 | 0.518 | (-2.11e-07, 1.07e-07) | |
| American Indian and Alaska Native alone | -3.31e-07 | 3.51e-07 | -0.943 | 0.346 | (-1.02e-06, 3.59e-07) | |
| Highschool graduates | -8.09e-06 | 9.84e-06 | -0.822 | 0.412 | (-2.74e-05, 1.13e-05) | |
| Bachelor degree | -1.53e-05 | 2.79e-06 | -5.468 | 8.43e-08 | ** | (-2.07e-05, -9.77e-06) |
| Age | 0.0086 | 0.008 | 1.040 | 0.299 | (-0.0077, 0.0249) | |
| Median Income | 5.48e-06 | 1.74e-06 | 3.144 | 0.0018 | ** | (2.05e-06, 8.91e-06) |
| BMI Obese | 7.87e-06 | 7.59e-07 | 10.370 | 2.88e-22 | ** | (6.38e-06, 9.36e-06) |
Note: Regression coefficients, standard errors, t-values, p-values, significance levels, and 95% confidence intervals for each predictor variable in the model. These coefficients indicate the strength and direction of the relationship between each predictor and the outcome variable, providing valuable insights into the factors influencing the outcome of interest.
Table 5.
Bootstrapping Regression.
| Variable | Mean Coeff | Std Error | 2.5% CI | 97.5% CI |
|---|---|---|---|---|
| Constant | 4.5021 | 0.3883 | 3.7633 | 5.2680 |
| log_Mean Atrazine Levels | 0.3943 | 0.0303 | 0.3316 | 0.4495 |
| Black or African American alone | -1.76e-07 | 1.98e-07 | -3.31e-07 | -4.87e-08 |
| American Indian and Alaska Native alone | -2.46e-07 | 3.06e-06 | -1.31e-06 | -3.25e-08 |
| Highschool graduates | -2.63e-05 | 1.09e-05 | -4.80e-05 | -4.36e-06 |
| Bachelor degree | -1.80e-05 | 3.49e-06 | -2.32e-05 | -9.66e-06 |
| Age | 0.0048 | 0.0046 | -0.0044 | 0.0147 |
| Median Income | 3.00e-06 | 1.53e-06 | 1.69e-07 | 6.01e-06 |
| BMI Obese | 1.37e-05 | 1.34e-06 | 1.13e-05 | 1.64e-05 |
Note: The table provides coefficient estimates, standard errors, and confidence intervals for predictor variables associated with diabetes incidence. Additionally, bootstrapping, a resampling technique, is used to assess the robustness of the regression model by generating multiple datasets through random sampling with replacement. This method allows for the estimation of the sampling distribution of the coefficients and helps evaluate the stability and reliability of the regression results.
Disclaimer/Publisher’s Note: The statements, opinions and data contained in all publications are solely those of the individual author(s) and contributor(s) and not of MDPI and/or the editor(s). MDPI and/or the editor(s) disclaim responsibility for any injury to people or property resulting from any ideas, methods, instructions or products referred to in the content. |
© 2024 by the authors. Licensee MDPI, Basel, Switzerland. This article is an open access article distributed under the terms and conditions of the Creative Commons Attribution (CC BY) license (http://creativecommons.org/licenses/by/4.0/).
Copyright: This open access article is published under a Creative Commons CC BY 4.0 license, which permit the free download, distribution, and reuse, provided that the author and preprint are cited in any reuse.


