Submitted:
17 May 2024
Posted:
20 May 2024
You are already at the latest version
Abstract
This study assesses the impact of militarization, industrialization, technological innovation, and energy consumption on CO2 emissions in NATO countries, divided into "traditional" (Group 1) and "new member" states (Group 2), using data from 1985 to 2019. It identifies heterogeneity in effects and dependencies between the groups. Employing Pedroni and Kao panel cointegration tests, a long-term equilibrium relationship among the variables is confirmed. The analysis, using panel ARDL and GMM methods, reveals distinct outcomes for each group. In Group 1, military spending and energy consumption significantly increase CO2 emissions, while industrialization and technological innovation reduce them. Conversely, in Group 2, technological innovation and energy consumption raise emissions, whereas military spending and industrialization decrease them. The findings suggest Group 1 should strategize military expenditure and energy consumption to cut emissions, whereas Group 2 should focus on eco-friendly technology and efficient energy use to achieve environmental sustainability.
Keywords:
CO2
; Energy consumption
; Environmental sustainability
; Industrialization
; Militarization
; NATO
; Technology innovation
1. Introduction
The Earth’s surface temperature has been steadily increasing over the past few decades, leading to rising sea levels, decreased snowfall as well as polar cover, extinction of other breeds, and various other significant ecological issues (Li et al., 2023; Olivier et al., 2017). NATO, being a formidable military alliance, poses a risk of environmental harm due to its large industrialized arms manufacturers and high military expenditures (Çolak et al., 2022). Jorgenson and Clark (2011) state that the military’s organizations, technologies, armaments, and operations can create environmental issues.
Since World War II’s conclusion, carbon dioxide emissions have risen due to global military and economic expansion, nearing a critical threshold when environmental harm from would become irreversible. 2015 global emissions totaled 32.1 billion tons, showing minimal change from 2013 (IEA, 2016). In 2014, discharge associated with energy was up 5,406 million metric tons (MMt), which was stated by the Energy Information Administration (EIA) in 2015. Carbon emissions significantly contribute to greenhouse gases, accounting for approximately 60% of temperature increase (Franco et al., 2017). Recent research shows that higher energy use negatively impacts environmental sustainability (Chiu & Zhang, 2022). This issue is under consideration whilst in Brussels for the NATO Summit 2021. The summit’s final declaration stated that leaders of nations and states agreed to achieve carbon neutrality by 2050 (NATO, 2022b). Currently, NATO’s approach to environmental issues mostly emphasizes raising awareness, sharing information, providing training and instruction to troops, and assisting member countries in aligning with their laws and policies.
The author of this paper selected the NATO countries based on different justifications. NATO consists of 31 states with significant defense budgets, advanced technological capabilities, high levels of industrialization, and massive energy consumption, making them some of the biggest global emitters. Research by Jakub Odehnal (2015) categorizes NATO member countries into “new” and “traditional” categories based on their date of joining, with a focus on security and economic factors. Odehnal and Neubauer (2020) studied specific factors that influence military spending. Their research was recognized by two groups of NATO countries, namely the “traditional” and “new” member countries, according to the study conducted by Jakub Odehnal in 2015. The author of this research investigated how militarization, industrialization, technological innovation, and use of energy have affected carbon radiation in NATO nations, including traditional and new members, from 1985 to 2019, with the goal of achieving environmental sustainability. In 2023, NATO members dedicated an average of two and a half times their GDP to defense spending. Alliance countries have agreed to dedicate no less than 2% of their gross domestic product (GDP) to defense spending. However, many nations in the alliance pay less than this guideline. Poland spends 3.9% of its GDP on defense, while Luxembourg barely spent 0.72% of its GDP on defense in 2023 (Statista, 2023a). The quantity of soldiers in NATO countries is expected to reach nearly 3.37 million by 2023. Global defense spending in 2022 has reached a record high of $2.2 trillion. In this instance, the combined defense expenditure of NATO members totaled over 1.26 trillion U.S. dollars. In 2020, the Stockholm International Peace Research Institute (SIPRI) predicts that global military expenditures will represent 2.4% of the world’s Gross Domestic Product (GDP), reaching a record high. In 2020, the top fifteen countries with the highest military spending made up 81% of all military spending worldwide, totaling USD 1603 billion. The USA is the top country in military spending, with USD 778 billion, followed by the UK, the Russian Federation, China, and India. The top three military spenders, the USA, China, and Russia, accounted for 56% of global military expenditure (SIPRI, 2021; Yahoo Finance, 2023). According to a recent NATO report, the USA is expected to have dedicated more than $821 billion to defense spending in 2022. This figure reflects the highest proportion of worldwide defense spending for that year, about 40% of the total. Additionally, the USA’s military expenditure is about three times larger than China’s, positioning it as the world’s second-largest military spender (NATO, 2022a). Six of the world’s top fifteen spenders, including the USA, UK, Germany, France, Italy, and Canada, are members of NATO. Furthermore, the United States, Germany, Canada, and Turkey, all members of the Alliance, ranked among the top fifteen most significant -emitting countries worldwide in 2020, according to the IEA (2022). NATO warrants particular examination, accounting for 55% of the global defined spending in 2020 (SIPRI, 2021). The quality of the environment is significantly impacted by NATO. The military expends substantial amounts of energy through its financial expenditures, potentially causing enormous environmental harm. Most NATO countries possess advanced technology and industrialized economies that can impact the ecological quality connection, making it difficult to achieve environmental sustainability.
Several recent researches have given priority to analyzing the effect of military spending on carbon radiation in various nations, including Myanmar (Ahmed et al., 2020), Turkey (Gokmenoglu et al., 2021), Pakistan, as well as India (Ullah et al., 2021). Analyses have been conducted on panel information from geographically focused areas, such as the Mediterranean nations (Erdogan et al., 2022) and the G20 countries (Uddin et al., 2023). In this case, a limited amount of research funding is available in the literature on the environmental sustainability of NATO countries. Since NATO is an intergovernmental military alliance, member nations may increase their military expenditures, leading to environmental harm. In a contemporary report, Olcay Çolak (2022) covered the relationship between the weight of defense (the ratio of soldiery spending to GDP, expressed as a percentage) of NATO countries and environmental degradation. The author identified a clear link between militarization and environmental harm but did not explore how NATO countries sustain the environment. Several studies have centered on the connection between industrialization and the discharge of carbon, including research by Asumadu-Sarkodie & Owusu (2017), Li & Lin (2015), and Pata (2018).
Moreover, the research investigates the impact of technological advancement on carbon radiation (Yii and Geetha et al., 2017; Erdogan, 2021; Xinmin et al., 2020). However, research conducted after World War II led to technological advancements that enhanced production and the economy, albeit resulting in higher carbon emissions from energy-intensive processes and reliance on fossil fuels. Several research has concentrated on the connection between energy usage and carbon emissions, including research by Dogan and Turkekul (2016), Lean and Smyth (2010) and Ullah et al. (2021). They did not discuss protecting environmental sustainability; their research concentrated only on the relationship between carbon radiation and energy usage. In previous studies, the relationships between carbon emissions, militarization, industrialization, technological advancement, and energy usage have not been collectively analyzed in NATO countries to achieve environmental sustainability. Furthermore, there is another research gap focusing on comparing the outcomes of two groups: “traditional NATO member states” (Group 1) and “new member NATO states” (Group 2), to provide insights on achieving environmental sustainability. A research void exists with respect to the influence of militarization, industrialization, innovation in technology, and the impact of energy use on carbon emissions to promote the sustainability of the environment in NATO countries.
This research project makes a valuable addition to the various aspects of the existing discussion. Regarding this project adds to the current body of research in different ways. Exploring the effects of militarization, industrialization, technological innovation, usage of energy, and carbon emissions on ecological sustainability by analyzing panel statistics from NATO countries between 1985 and 2019. The analysis considers two groups: “traditional NATO member states” (Group 1) and “new member NATO states” (Group 2). Moreover, it presents a novel method by investigating the consequence of specific factors on radiation within a single building. Nevertheless, few studies have thoroughly examined this matter while considering several econometric challenges, such as cross-sectional dependence, Pedroni and Kao panel cointegration tests, and panel ARDL techniques, to identify dependable, consistent, and equitable long-term connections among the desired variables. Similarly, the study utilizes system GMM estimation to validate the foundation model results and address endogeneity concerns. After conducting various tests, the model’s accuracy was thoroughly verified using the test for heteroskedasticity using the Breusch-Pagan/Cook-Weisberg method, the Wooldridge verify the autocorrelation, and the Ramsey RESET test for specification error. The study revealed that military spending and power usage provide a long-term, substantial reduction in emissions in the “traditional NATO member states” (Group 1). Moreover, advancements in the industry and technology help reduce emissions. Moreover, technological progress and power consumption contribute to the rise in the discharge of . In addition, military spending and industrialization significantly reduced emissions in the “new member NATO states” (Group 2). In addition, the research offers valuable insights and knowledge for researchers, governments, and policymakers to take crucial steps toward environmental sustainability and provides recommendations on reducing carbon emissions.
The next sections consist of a second portion of the literature review, and the third section covers the statistics, model, and approach. The experimental findings and the subsequent argument are in the fourth and fifth segments, respectively. Finally, the concluding part includes a summary of policy applications, repercussions, restrictions, and suggestions for future studies.
2. Literature Review
This research reflects prior discussion examining the connection between militarization, industrialization, advancement in technology, use of energy, and discharge of carbon towards achieving environmental sustainability in NATO countries. The link between militarization, industrialization, technical innovation, energy usage, and carbon outflow is strongly rooted. They are interconnected in a complex network where achievements in one area might lead to progress in others. Therefore, Richard Tucker (2012) has explored the environmental impacts of military activity. Military operations, training exercises, and the maintenance of military equipment can have direct and indirect environmental effects, contributing to carbon emissions. Moreover, experts often emphasize that the soldiery-industrial complex is essential in encouraging economic growth through government expenditures on defense. According to Seymour Melman (1973), who wrote books like “Pentagon Capitalism,” military spending promotes industrialization by raising consumer demand for cutting-edge products and production techniques. As a result, the connection between the Industrial Revolution and the discharge of carbon is well established. Paul David and Robert Thomas (2015) study the environmental impacts of industrialization, focusing on the increased force demand and radiations associated with dominant-scale manufacturing processes and the usage of fossil fuels. Furthermore, various studies explore the connection between military research and technological innovation. For example, the writings of Stuart Leslie (1987) demonstrate how military-oriented R&D has traditionally resulted in advances in computing, aerospace, and materials science. These innovations often find uses in civilian sectors, further boosting industrialization. Furthermore, researchers such as Nemet and Greene (2022) examined the energy intensity of technological advancement. Although innovation is typically seen as a catalyst for efficiency and viability, specific technological advancements, particularly in information technology and data centers, can result in increased energy consumption and carbon discharge. To ensure constancy, the relationship between the analytical factors and radiation of carbon is presented below, using the necessary theoretical connection.
2.1. Soldiery Spending and Carbon Emissions Nexus
Defense spending is essential for a nation’s existence, but the environmental impacts of militarization have only lately started to be thoroughly investigated in academic literature (Hooks & Smith, 2004a, 2005b). A theoretical framework has been established by ecologists studying the environment linking soldiery and ecological quality according to the chore of destruction concept proposed by Givens (2014) and Hooks and Smith (2004). They highlighted the environmental dangers of militarization as a “treadmill of destruction.” This theory asserts that the escalation of military capabilities among nations and the proliferation of militarism due to geopolitical rivalries carry economic consequences and result in environmental degradation, impacting ecosystems during war and peacetime. Influenced by geopolitical and internal factors, military development leads to various environmental damage (Jorgenson et al., 2010). Foundations of nuclear as well as power facilities are susceptible to ongoing local disputes and wars, and atomic arms permanently destroy the ecosystem (Rawtani et al., 2022). A sociologist of the environment, Kenneth Gould (2007), states that militarism is the most detrimental human act to the environment. Weapon development is prevalent in various human societies, and there is a connection between armed conflicts and climate change (Bildirici, 2017a). Chemicals used to create weapons that release poisonous compounds are frequently used by soldiers in routine actions (Trivedi et al., 2004). Empirical studies typically focus on the relationship between militarization and income, investment, and debt, as evidenced by several researchers (Azam, 2020; DeRouen, 1994; Pieroni, 2009; Saba & Ngepah, 2020; Aziz & Khalid, 2019; Hou & Chen, 2014; Smith, 1980; Azam & Feng, 2017; Khan et al., 2021). The correlation between military expenditure and the environment has not been thoroughly investigated. Therefore, the research worker focused on military investment as a key feature of the arms-dominated society. Previous research showed the correlation between G7 nations’ militarization and the discharge of using annual panel statistics between 1985 to 2015. The panel autoregressive distributed lag (ARDL) model investigated the long-term link among discharge, militarization, GDP per head, and usage of energy. The data show the extended interaction between the factors (Bildirici, 2017; Khan, 2023). Further, another study demonstrated a noteworthy improvement in correlation linking militarization and discharge of in G20 countries by employing forum co-integration and methods of causality (M. Bildirici, 2019). He verified a one-way cause-and-effect relationship between militarism and emissions. Furthermore, A. K. Jorgenson (2010) investigated the accuracy of the treadmill of destruction concept in 72 nations from 1970 to 2000. The standard panel information analysis (fixed effects estimator) suggests that militarization leads to direct favorable impacts on ecological deterioration. Additionally, in the USA, M. E. Bildirici (2017a) examined the influence of military expansion on the discharge of carbon dioxide using a limits test technique for cointegration from 1960 to 2013. The research showed that emissions rise as a consequence of militarization, economic expansion, and energy usage. Further, a different study investigated the connection between the discharge of and soldiery expenditure of 81 nations from 1990 to 2010. Research indicates that soldiery activities in OECD countries have a greater environmental impact than military expansion in other areas, resulting in emissions. Some studies concentrate on certain countries or geographic regions (Jorgenson & Clark, 2016). In addition, Gokmenoglu (2021) discovered that military expenditure in Turkey from 1960 to 2014, analyzed using FMOLS, decreased environmental quality. On the other hand, a different study showed that military spending greatly impacted emissions for 15 countries using CS-ARDL. It also found that environmental damage has worsened due to increased military expenditure in Asia-Pacific (Chang et al., 2023). Erdogan (2021) utilizes the global vector autoregressive (GVAR) model to analyze the correlation between variables like military spending and environmental changes. This study suggests that boosting military expenditure leads to elevated carbon emissions at both local and global levels while also demonstrating the destructive influence of military expenditure on nature. Ullah (2021) used the NARDL technique to analyze data from Pakistan and India between 1985 and 2018. The study focused on reducing military spending, decreasing emissions and demonstrating the unequal connections between the two different factors. Similarly, Konuk (2023) suggested that military spending decreases environmental harm in G7 nations.
H1: Militarization increases the discharge of carbon dioxide in NATO countries.
2.2. Industrialization and Carbon Emissions Nexus
Human connection with the Environment According to Hammond (1995), the environment provides energy, food, and natural resources for economic activity, which are then transformed into final products through industrialization. The rise in these activities leads to environmental pollution, which hinders the environment’s ability to support life and ultimately damages human health. Living standards have significantly improved in the last few years because of the advancement of new technologies in various economic sectors. However, a disproportionate increase in emissions has negatively affected environmental quality (Uddin et al., 2016). Research subsequently explored and analyzed many industrial sectors across different countries to address this issue. Studies have investigated the manufacturing industry, electricity sector, and steel industry and have shown that all these sectors significantly contribute to emissions (Akbostancı et al., 2011; González & Martínez, 2012; Shrestha et al., 2009; Moya & Pardo, 2013). Moreover, industrialization can often lead to deforestation, requiring more natural resources (Usman et al., 2020). Therefore, Wang (2011) has also emphasized that the increase in heavy industry leads to an increase in carbon emissions. Increased industrial activity requires more energy, primarily from fossil fuels, than the agricultural sector, leading to higher carbon dioxide emissions (Sheng & Guo, 2016). Industrialization results in swift economic growth through the widespread utilization of diverse energy sources and natural resources, with industries consuming 51% of the world’s energy (Maryam et al., 2017). Increasing energy use leads to inefficiency, environmental degradation, and the release of carbon emissions (Gokmenoglu et al., 2021). The decline in natural quality is a significant concern and is listed among the top worries acknowledged by the United Nations (Phimphanthavong, 2013). Green economics theory encompasses various concepts that explore the relationship between mankind’s actions and nature. It implies that efforts to meet societal demand should be connected to environmental conservation (Cato, 2012). Most empirical research has discovered that industrialization has a stronger positive influence on the discharge of carbon than a negative impact. Therefore, Lin (2015) used Johansen’s cointegration technique and VECM to analyze the consequence of industrialization on radiation in Nigeria between 1980 and 2011. The research discovered that industrial value added significantly negatively affected emissions. Additionally, Asumadu-Sarkodie and Owusu (2016a) reviewed the relationship between the use of power, industrialization, expansion of the economy, and discharge of carbon dioxide in Benin using data from 1980 to 2012. The ARDL results indicated a favorable connection between energy use, industrialization, and carbon dioxide release throughout time. The Granger causality analysis shows that the release of carbon dioxide led to economic development and industrialization, while electricity consumption led to carbon dioxide release and economic improvement. Furthermore, Using the ARDL framework, researchers found a favorable link between industrialization and the discharge of carbon dioxide in the long term, but a negative connection exists between Rwanda’s GDP per head and carbon dioxide release between 1965 and 2011 (Asumadu-Sarkodie & Owusu, 2016b). Further, Zafar (2020) used fully modified ordinary least squares (FMOLS) to determine that gross domestic product (GDP) per person negatively correlates with carbon dioxide emissions. Carbon dioxide discharge positively affected industrialization and energy consumption in 46 countries from 1991 to 2017. On the other hand, a separate study, including a panel poll of 73 individuals, showed conflicting results on the impact of industrial expansion on carbon release (Li & Lin, 2015). A clear positive correlation was found between the two variables for middle- and low-earning and high-earning classes. No significant impact was found in middle- or high-income countries. Another study discovered that industrialization considerably and positively impacts emissions in middle-income countries. Asane-Otoo, 2015. Pata (2018) discovered that the development of industry has a beneficial impact on the release of carbon in Turkey. Ekwueme and Zoaka (2020) discovered that industrialization is a significant factor in driving carbon radiation in the MENA region. Wang (2011) discovered that the Chinese iron and steel sector decreases carbon emissions. In addition, Dong (2020) found that updating industrial structures in 41 countries leads to decreased carbon emissions.
H2: Industrialization positively affects the release of carbon dioxide in NATO countries.
2.3. Technical Innovation and Carbon Emissions Nexus
Technological innovation activities significantly influence energy technology patents, which are commonly used to assess innovation performance in pollution abatement (Li & Lin, 2016; Ponce & Khan, 2021). Most scholars favor patents as a representation of innovation (Albino et al., 2014; Raiser et al., 2017). Most developed countries in the modern era implement smart cities, advanced transport systems, upgraded industrial methods, and energy-conserving innovations to reduce emissions (Lennerfors et al., 2015). Therefore, Hong (2018) defines innovation as creative destruction. Further, Kumar and Managi (2009) contended that technical development increases emissions in emerging nations but helps reduce carbon emissions in wealthy countries. Most studies have concluded that technology can effectively decrease emissions and enhance ecological quality. This supports the idea that technology is crucial in how economic growth impacts the environment (Brock & Taylor, 2005; Grossman & Krueger, 1991; Yang & Li, 2017). Empirical study focuses on the bond between technological innovation and emissions from energy-efficient practices, ultimately reducing ecological deterioration (Balsalobre-Lorente et al., 2018; Samargandi, 2017). Thus, Fisher-Vanden (2004) asserts that technical innovation is vital in decreasing energy intensity. Moreover, various studies have shown that technical advances can decrease the discharge of (Gould, 2007). Furthermore, a study conducted by Adebayo (2021) found that technological innovation helps reduce the discharge of in South Korea. Furthermore, Adebayo (2022) discovered that the positive impact of technological innovation is negatively correlated with the amount of released in Sweden from 1980 to 2018. In addition, Rafique (2020) used the augmented mean group (AMG) method to study the correlation among financial development, technical innovation, foreign direct investment, and emissions in the BRICS nations between 1990 and 2017. He figured out that technical advancements helped reduce carbon discharge to a substantial extent. Furthermore, Yii and Geetha (2017) figured out a direct connection between technological developments, growth, power use, energy pricing, and levels in Malaysia between 1971 and 2013. The study showed that scientific advancements led to a short-term decrease in levels, but no lasting impact was observed. Then, L. Wang (2020) also examine the correlation between carbon dioxide discharge and financial stability in G7 economies, together with technological innovation. Technology and renewable energy capabilities were found to considerably impact reducing carbon dioxide emissions, as shown by the results. This will significantly reduce the energy industry’s coal consumption and emissions. Additionally, Sgobbi (2016) utilized the JRC-EU-times model to analyze how technical advancements affect the utilization of cutting-edge ocean power in European nations. The findings represented that improvements in ocean energy technologies might increase marine energy production and reduce emissions. Another work, from 1971 to 2013 in Malaysia, Yii and Geetha (2017) identified a correlation between technological innovation, economic growth, power use, energy costs, and emissions. Technological advancement resulted in a short-term decrease in emissions, even without a long-term connection. Another researcher assessed the influence of the high-tech environmental protection factory on reducing the release of in Asian nations. The study found that low-carbon automobiles, green technology, and energy-saving innovations are significantly essential for reducing emissions (Lee et al., 2017). Contrastingly, Omri and Hadj (2020) found that technological innovation had a notable adverse effect on the four indices of emission in developing nations from 1996 to 2014, applying the generalized method of moments (GMM) technique. Further, Shahbaz (2020) discovered that new technologies negatively impacted the release of carbon dioxide in China from 1984 to 2018 using the bootstrapping autoregressive distributed lag modeling (BARDL) financial mechanics. Furthermore, Dauda (2019) found that technical progress increased emissions in 18 nations between 1990 and 2016. In Addition, Destek and Manga (2021) discovered that technological innovation harmed emissions in ten countries from 1995 to 2016. However, there is no notable connection between technological innovation and environmental imprint. Then, other studies have investigated the correlation between eco research and development (R&D) and carbon emissions. They found a positive relationship between the two in Japanese production companies between 2001 and 2010 (Lee & Min, 2015). Further, energy-related research and development costs increase carbon emissions in 19 high-income OECD countries (Koçak & Ulucak, 2019).
H3: Technological innovation favorably impacts carbon dioxide emissions in NATO countries.
2.4. Use of Energy and Discharge of Carbon Nexus
The connection between the energy we consume, economic growth, and the amount of that is released is widely acknowledged to be either favorable or unfavorable. A recent study has examined the correlation among energy usage, financial development, and emissions. Jorgenson and Wilcoxen (1993) conducted a study that analyses the connection between power, nature, and economic development within an intertemporal general equilibrium framework. Prior studies conducted in Indonesia and Turkey revealed that economic growth increased the use of energy and raised emissions. This established a unidirectional causal connection between energy consumption and emissions in G20 nations (Chiu & Zhang, 2022; Gokmenoglu et al., 2021; Shahbaz et al., 2013). Thus, Ang (2007) investigates the causal link between ecological quality, use of energy, and economic production in France. She posits a connection between these factors, with evidence suggesting that growth in the economy results in higher energy usage and pollution over time. Moreover, Jamil (2022) used the FMOLS and DOLS models to analyze the relationship between renewable source usage and discharge in G-20 nations. The discovery is consistent with previous studies and shows a notable negative relationship between the implementation of geothermal power and emissions. Then, Selvanathan (2021) discovered that in several South Asian countries, implementing FMOLS caused a huge rise in the discharge of carbon dioxide between 1990 and 2014, primarily driven by per capita usage of energy in the temporary and medium term. Furthermore, S. Wang and colleagues (2018) discovered that in a group of countries, including Mexico, Indonesia, Nigeria, and Turkey, the use of power is linked with a decrease in carbon discharge. Additionally, Kongkuah (2022) discovered that economic growth and energy consumption directly correlate with the increase in emissions in China. Contrary to expectations, Saud (2020) employed the pooled mean group (PMG-ARDL) method from 1990–2014 in selected countries partaking in the one-belt-one-road project to illustrate a positive connection among economic improvement, energy use, financial growth, and carbon dioxide emissions. Then, Ehigiamusoe and Lean (2019) analyzed how power utilization, economic development, and financial development affect carbon dioxide venting in 122 nations by employing several econometric models such as FMOLS, DOLS, GMM, CCEMG, and dynamic CCEMG. The study showed that energy utilization, economic growth, and financial improvement undoubtedly impact levels. Furthermore, Lean and Smyth (2010) use commission information from Asian nations to demonstrate long-term causation among energy utilization and emissions and economic expansion, as well as short-term Granger adversity between discharge and power utilization. Furthermore, Abbasi (2020) found a favorable relationship between GDP per capita, energy consumption, and financial growth with carbon dioxide emissions in eight Asian countries from 1982 to 2017, implying fully modified ordinary least squares (FMOLS). In addition, Tahir (2021) employed fully modified ordinary least squares (FMOLS), dynamic least squares (DOLS), and pooled mean group (PMG) to determine that release of carbon dioxide had a favorable long-term impact on GDP per capita, power consumption, as well as financial development in south Asian countries between 1990 and 2014. Then, Dogan and Turkekul (2016) found that consumption of power firmly influences emissions, and expansion of the economy unfavorably influences emissions, besides improvement of the finance has a noteworthy consequence on release in the USA from 1960–2010 applying the autoregressive distributed lag (ARDL) model. Moreover, Apergis and Payne (2010) utilized a system of dynamic panel models to analyze data on emerging and developing nations from 1984 to 2007, focusing on real gross domestic product, utilization of nuclear power, sustainable energy consumption, and release of total carbon dioxide as per OECD information. Nuclear energy effectively decreases emissions, but sustainable power has minimal immediate effects on emission reduction. Lastly, Apergis and Payne (2010) studied the association among carbon dioxide radiation, power consumption, and real consequences in 11 Commonwealth of Sovereign States nations from 1992 to 2004. In the long term, power usage was found to have a considerable and favorable effect on carbon dioxide emissions.
H4: Energy consumption positively affects carbon dioxide emissions in NATO countries.
Previous research evaluating the connections among carbon discharge, militarization, industrialization, technological development, and energy consumption had varying effects on the world, as depicted in Figure 1. No prior study has combined militarization, industrialization, technical innovation, usage of power, and carbon radiation in NATO nations to assess their collective impact on achieving environmental sustainability. Concern arises regarding the influence of military, industrialization, technological advancement, and power usage on carbon release in NATO nations and their environmental sustainability.
3. Methodology of the Study
3.1. Data and Sources
This research aims to analyze the elements such as militarism, industrialization, technical innovation, and energy usage that influence carbon emissions in NATO nations to achieve environmental sustainability. The study classified the 26 NATO countries into two categories based on the data shown in Table 1. One group comprises 14 countries, and the other includes 12 countries. Jakub Odehnal (2015) categorized the 27 NATO countries into two groups: 14 “Traditional” NATO countries in Group 1 and 13 “NEW” NATO member countries in Group 2, based on their year of membership, with a focus on security and economic factors. Table 2 displays the chosen variables, abbreviations, descriptions, units, and sources. The data extracted from World Bank Indicators (WDI) from 1985 to 2019.
3.2. Model Specification
The objective of this research is to examine the impact of military expenditure (lnME), industrialization (lnIND), technical innovation (lnTECH), energy consumption (lnEC), and economic growth (lnGDP) on carbon emissions () in NATO member nations.
The analysis is carried out using the mathematical equation (1) that has been set up.
Where i represents the number of countries, where i can be any integer starting from 1, where N indicates the cross country, and t is a positive integer starting from 1. The variable T denotes the time in panel data. Equation (1) denotes the coefficients β0, β1, β2, β3, β4, and β5 for each explanatory variable. Furthermore, the model includes the εit error component, and β0 represents a constant coefficient that differs among countries but remains constant over time. The equation specifies that the dependent variable is represented by . Eq. (1) includes the independent variables lnMEX, lnIND, lnTECH, lnEC, and lnGDP, as defined in Table 2.
3.3. Econometric Methodology
3.3.1. Slope Homogeneity Test
Swamy (1970) proposed the slope homogeneity test as a means to ascertain the uniformity of the slope coefficients within the cointegration equation. Pesaran and Yamagata (2008) modified Swamy’s slope homogeneity test and formulated two test statistics: Delta tilde and Adj. Delta tilde .
In Equation (2) and (3), the variables N, S, and k represent the number of cross-section units, the Swamy test statistic, and the independent variables, respectively. If the p-value of the test exceeds 5%, the null hypothesis is accepted at a significance level of 5%, indicating that the cointegrating coefficients are homogeneous.
3.3.2. Cross-Sectional Dependence Test
Urbain and Westerlund (2006) argued that the concept of “cross-sectional independence” is not relevant in macroeconomic or finance research, particularly when considering large inter-economy ties. According to Chudik and Pesaran (2013), the occurrence of cross-sectional dependence (CSD) can be attributed to the presence of shared shocks and lack of model definition. According to Pesaran (2004), the absence of proper oversight in cross-sectional reliance might result in biased and untrustworthy outcomes. The identification of cross-sectional dependence is of paramount significance in achieving impartial and reliable outcomes while conducting an analysis of panel data. Assess the potential impact of the CSD. CSD is addressed through the application of panel unit-root testing. Preliminary examinations anticipate the presence of cross-sectional independence and homogeneity. First-generation tests sometimes produce suboptimal outcomes when confronted with heterogeneity and CSD. Next-generation tests were employed to account for CSD and heterogeneity. The research employed well-known methodologies, including Pesarans’s (2004) CD test, Friedman’s (1937) test, and Frees’s (1995) test, to detect CSD in panel data.
Consider the standard panel-data model:
Equation (4) represents the integers i, 1, 2..., N. The cross country is denoted by N, and t is a positive integer. In panel data, T represents the time, Xit is a vector of regressors with K×1, is the vector of parameters to be evaluated with K×1, and εit represents individual nuisance parameters that do not change over time.
Therefore, the null hypothesis is that there is no CSD in mathematical form,
and the alternative hypothesis asserts mathematical cross-sectional dependence.
where Eq. (5) provides , the correlation coefficient of the residuals:
where is the product-moment correlation coefficient of the residuals and is provided as Eq. (5):
With N, the number of potential pairings increases.
The CD test, as proposed by Pesaran (2004), is expressed as Equation (6).
Pesaran (2004) suggests a somewhat altered variant for unbalanced panels, which is provided in Eq. (7):
According to Friedman (1937), a nonparametric test was introduced that relies on Spearman’s rank correlation coefficient. Friedman’s statistic is based on Spearman’s correlation and is expressed as Equation 8:
where is the rank correlation coefficient of the residuals. High average values show the presence of non-zero cross-sectional correlations.
Eq. (9) presents Frees’ (1995) statistic, which is based on the sum of squared rank correlation coefficients.
3.3.3. Unit Root Tests
Due to CSD, the study employs a second-generation unit root test. The variables’ stationary qualities are verified using the CIPS and CADF tests, as suggested by Pesaran (2007). Both tests consider cross-sectional dependence. The investigations yield dependable data on the static characteristics. The CADF and CIPS test methods have similarities, except that CIPS includes the cross-sectional average of the CADF test. The “cross-sectional augmented Dickey-Fuller (CADF)” regression, represented by Equation (10):
The one lag in the previous equation, Eq. 10, and the subsequent equation, Eq. (11), is as follows:
The variables and Indicate the first difference of the mean of the lagged level and each unit cross-section. The straightforward average is utilized to produce the Pesaran and Shin (CIPS) test statistics in Equation (12), subsequent to the generation of the CADF statistics.
N represents the cross-sectional aspect of the study, which refers to the number of states, while T represents the time component. The null hypothesis for the CADF and CIPS tests is that the series contains a unit root. The essential values needed to validate these hypotheses are provided by Pesaran (2007).
3.3.4. Pedroni and Kao Panel Cointegration Test
Panel cointegration testing should be performed after determining the parallel order of integration. This study employed the panel tests for cointegration developed by Pedroni (1999) and Kao (1999). This approach enables examining different panels with diverse slope coefficients, consistent effects, and individual-specific determined patterns. He proposed two categorizations of examinations. The primary approach relies on the inner dimension and encompasses four statistical measures. The second technique relies on the inter-dimensional idea and comprises three statistics. The statistics are derived from estimators that calculate the mean of the coefficients independently evaluated for each member. This entails employing the notion of no cointegration as the initial assumption and examining the residuals from a panelized version of the Engle and Granger (1987) static regression to compute the test statistic and observe the distributions. The cointegration equation is represented in eqn (13):
The variable N denotes the number of units in the panel, K is the number of regressors, and T denotes the number of observations across time. Pedroni (1999) created seven-panel cointegration test statistics by utilizing co-integrated error terms. Pedroni (1999) introduced panel cointegration statistics encompassing both heterogeneous and group mean panel statistics.
Panel v-statistics:
Panel rho-statistics:
Panel PP-statistic:
Panel ADF-statistic:
Group p-statistic:
Group PP-statistic:
Group ADF-statistics:
The Kao (1999) test assumes that panel members are homogeneous and follow the two-step process proposed by Engle and Granger (1987). The null hypothesis that there is no cointegration is tested using an ADF-style test.
3.3.5. The panel ARDL Model
The research employs the “autoregressive distributive lag (ARDL)” model to analyze the speed of short-term changes toward long-term equilibrium. Pesaran and Smith (1995) developed this concept. Three estimators are used in ARDL estimation: the mean group (MG), the pooled mean group (PMG), and the dynamic fixed effect (DFE). We conducted a Hausman test to assess the appropriateness of the PMG estimator in comparison to the Mean Group (MG) estimator. The MG estimator can accommodate fluctuations in both short-term and long-term estimators and is renowned for its constancy. Suppose the null hypothesis, which suggests that there is no significant difference between the PMG and MG, is confirmed. In that case, it indicates that the PMG estimator is superior in terms of effectiveness and reliability compared to the MG. The Pooled Mean Group (PMG) approach was employed to ascertain the enduring and immediate connections between the chosen variables and explore the dynamic diversity features among the countries. The Pooled Mean Group (PMG) model, proposed by Pesaran in 1999, is a suitable ARDL model for assessing the dynamic panel with error correction. It pertains to variables having a combination of integrated orders. The model is defined in Equation 14.
Where denotes the vector (k x l) represents the explanatory variables for group i, and represents the random effect. Within an unbalanced panel, the values of p and q have the potential to differ across different countries. Therefore, it is possible to reparametrize this as a Vector Error Correction Model (VECM) system in Equation (15):
In this context, βi represents the parameters that are applicable in the long term, while θi refers to the parameters that account for error correction. Within the framework of the PMG approach, the long-run parameters exhibit a high degree of similarity across different countries. Eq. (16) displays the subsequent model:
The is represented by the dependent variable ‘y,’ while the explanatory variables are represented by ‘X.’ Furthermore, the short-run coefficients of the dependent and explanatory variables are denoted by “γ” and “δ.” “β” stands for the long-run coefficients, whereas “θ” is the coefficient that modifies the long-run coefficient and represents the adjustment rate. The countries and times are denoted by the variables “i” and “t,” respectively. The regression for long-term improvement is shown in square brackets.
The flow chart of the analytical methodologies applied in the study to analyse the dynamic impacts of militarization, industrialization, technological innovation, and energy consumption on emissions in NATO countries is illustrated in Figure 2.
4. Results and Discussion
4.1. Descriptive Statistics
The study variables’ descriptive statistics are shown in Table 3. The descriptive analysis shows that carbon emissions are higher in Group 2 compared to Group 1. The variables display positive skewness. Positively skewed variables indicate that all subsequent data points for that variable will exceed one. The kurtosis data indicate that all variables exhibit a leptokurtic distribution with values below 3. Furthermore, the skewness and kurtosis values show that the distribution of any of the variables is not normal. The “Jarque-Bera (JB)” normalcy statistic is utilized to validate the normality tests for the shape of the distribution, with a significance level of 0.05.
4.2. Multicollinearity Tests Based on VIF
A method for calculating and quantifying the amount that variation is increased is the variation Inflation Factor (VIF). Variables have no association when the VIF score is 1, a moderate correlation is shown when the VIF is between 1 and 5, and a strong correlation is shown when the VIF is greater than 5. A more prominent Variance Inflation Factor (VIF) number suggests a higher probability of multicollinearity, requiring more examination. If the variance inflation factor (VIF) is above 10, it shows significant multicollinearity that needs to be addressed. Table 4 shows multicollinearity is optional if the VIF value is less than 10.
4.3. Heterogeneity of slope test
Neglecting the heterogeneity in slope coefficients may lead to inaccurate approximations and biased results. Table 5 demonstrates that the Pesaran and Yamagata (2008) test supports this study’s alternative hypothesis of slope coefficient heterogeneity. Robust estimators built upon this principle were utilized for diverse scenarios and interconnection across different sections.
4.4. Cross-Sectional Dependence Test
The results of the CSD tests are represented in Table 6. When cross-sectional variables are tested using the CSD test, statistically significant P-values lead to the rejection of the null hypothesis of cross-sectional independence. This indicates that CSD exists for the studied variables at a significance level of 1% and 5%. The econometric calculations accounted for CSD, showing a substantial cross-sectional relationship in panel group error terms.
4.5. Panel Unit Root Test
Table 7 displays the parallel integration order, as the panel root test results show. The second-generation panel unit root tests, such as CIPS and CADF, tackle the CSD issue by demonstrating that the unit root null hypothesis remains valid irrespective of temporal trends and levels. After implementing the initial modification, the six variables remained consistent regardless of the significance levels tested, which included 1%, 5%, and 10%. In econometrics, variables were classified as order 0, denoted as I (0), and subsequently as order 1, denoted as I (1). This opportunity allows for a more comprehensive examination of the extended-term balance between the variables.
4.6. Pedroni and Kao Panel Cointegration Test
Since all the variables are steady from the initial difference, assessing the stationarity of variables is necessary to proceed with panel cointegration tests. Pedroni’s (1999) and Kao’s (1999) first-generation panel cointegration tests are conducted following the methodology established by Elfaki (2022). Table 8 shows four data points for Group 1 and five for Group 2 from a total of seven statistics indicating the failure to accept the null hypothesis according to the Pedroni test, both intra-dimensional and inter-dimensional. This conclusion confirms a long-term cointegration among discharges, militarization, industrialization, technical innovation, and energy usage. The outcome of the Kao ADF cointegration test provides evidence in favor of the existence of a long-term cointegration connection.
4.7. Parameter Estimation
It is essential to estimate both the “short-term” and the “long-term” relationship once it is determined that the variables are cointegrated. The Hausman test was utilized to determine the model’s most accurate estimator, as previous research suggested. The Hausman test was utilized to assess the hypothesis of a “long-term” relationship and determined that the PMG estimator exhibited greater efficiency. Furthermore, Figure 3. illustrates the graphical representation of the long-run results from PMG-ARDL for Groups 1 and 2
4.7.1. Long-Run and Short-Run Estimates for Group 1 and Group 2
The study used the PMG technique to analyze the “long-term” and “short-term” connections among carbon discharges, militarization, industrialization, technological innovation, and energy usage to promote environmental sustainability. The findings are displayed in Table 9 for “traditional NATO member countries” (Group 1) and Table 10 for “new NATO member states” (Group 2).
The study shows that military spending in “traditional NATO member states” (Group 1) has a significant and advantageous impact on long-term carbon discharges. A study indicates that a 1% increase in military expenditure outcomes in a 17.68% rise in carbon discharges, supporting the conclusions drawn by Jorgenson & Clark, 2016)Baldric (2019), Bildirici (2017b), and A. K. Jorgenson (2010), who highlighted the substantial impact of military spending on discharges. Military operations consume significant energy and release greenhouse gases, posing a danger to environmental sustainability. Additionally, the study could not identify a correlation between them in the near term.
Military spending has a notable adverse effect on carbon discharges in the “long run” for the “new member NATO nations” (Group 2). A 1% rise in military expenditure yields in a 2.59% decrease in emission, supporting results from recent research by Konuk et al., 2023, and Ullah et al., 2021. The study also confirms a positive association between them in the short term. This research shows that military spending in “traditional NATO member countries” (Group 1) has hindered environmental progress. This is mainly due to the use of military vehicles like fighter-bombers and long-range aircraft, which consume substantial resources and produce a significant amount of carbon dioxide. This poses a significant risk to environmental sustainability. The study “New member NATO countries” (Group 2) suggests that military spending has helped accomplish environmental development and ensure environmental sustainability.
Industrialization has substantial and negative impacts on carbon discharges in the “long-term” in “traditional NATO member countries” (Group 1). There is a 19.45% decrease in carbon emissions for every 1% increase in industrialization. This analysis indicates that industrialization has a negligible negative effect on carbon discharges in the “short-term”. The industrialization of new NATO member countries in Group 2 has had a notably adverse effect on “long-term” carbon discharges. According to recent research by Dong et al. (2020) and Z. Wang et al. (2011), there is a 3.42% drop in carbon discharges for every 1% rise in industrialization. This discovery indicates that industrialization can be lessened and lower carbon emissions in both sectors by implementing technological advancements, utilizing clean energy, ensuring energy efficiency, enforcing government regulations and incentives, and fostering employee engagement and awareness, ultimately enhancing environmental sustainability.
Technological innovation in technology has had a significant negative impact on the release of carbon in nations considered traditional members of NATO (Group 1). The findings of Adebayo (2022), and Yii & Geetha (2017) are consistent with the notion that a 1% increase in technical innovation leads to a significant 2.99% reduction in releases of carbon dioxide. The analysis indicates that technological innovation significantly reduces carbon discharges in the short run. Technological innovation has a marginally positive impact on carbon discharges over a prolonged period, but it has a significantly adverse impact in the short term. An increase of 1% in technological innovation will result in a subsequent decrease of 1.47% in carbon discharges. In the near term, technological innovation achieved environmental sustainability for both traditional NATO member countries (Group 1) and new member NATO countries (Group 2). Nevertheless, its long-term effect on the latter was not substantial.
In “traditional NATO member countries” (Group 1), energy consumption is positively correlated with carbon discharges over the long run. 109.44% more carbon is released into the atmosphere for every 1% increase in energy use. The long-term impact of energy consumption on carbon discharges in “new member NATO countries” (Group 2) is significantly positive. 123.73% more carbon discharges are produced for every 1% increase in energy use. Energy consumption has a notably positive impact on carbon discharges, according to short-term research findings. According to Gokmenoglu et al. (2021), Shahbaz et al. (2013), and Kongkuah (2022), the results are consistent with their research. Significant carbon emissions worldwide stem from energy consumption in the energy, industrial, and transportation sectors, impacting environmental sustainability. NATO, a military organization that consumes significant energy for military activities resulting in environmental damage, bears a high responsibility for climate change.
4.8. Robustness Estimates of GMM and FMOLS
The generalized method of moments (GMM), initially proposed by Arellano & Bover (1995) and Blundell & Bond (1998), was utilized in this investigation to assess the reliability of the PMG. Country-specific effects, endogeneity, and autocorrelation can all be managed with GMM. In this study, the reliability of the GMM estimator and instruments is assessed through the utilization of the Hansen test for over-identifying restriction. The Hansen test deems two-step GMM instruments to be suitable. The two-step GMM estimator utilized in the study is recognized for its greater efficiency compared to the one-step GMM estimator initially proposed by Arellano and Bond in 1991. As illustrated in Table 11, the influence of energy consumption on carbon discharges is significantly greater than that of military expenditure, which is found to be negligible. Conversely, industrialization and technological innovation exhibit a substantial adverse effect on carbon discharges within the “traditional NATO member states” (Group 1). On the other hand, energy consumption, military expenditures, and technological advancements all contributed to an increase in carbon emissions. Conversely, industrialization exerts a substantial impact on the reduction of carbon emissions in “new member NATO countries” (Group 2).
4.9. Diagnostic Checks
Once the short-term and long-term impacts of the independent variables on carbon discharges were investigated using the PMG estimator, the accuracy of the model was extensively confirmed. In order to verify the model’s strength, Table 12 presents the outcomes of the Ramsey RESET test, the Breusch-Pagan/Cook-Weisberg heteroskedasticity tests, and the Wooldridge serial correlation demonstrated the lack of specification mistakes, the existence of heteroskedasticity, and the absence of problems with serial correlation.
5. Conclusion and Policy Implications
5.1. Conclusions
This research examines how militarization, industrialization, technological innovation, and energy consumption affect carbon discharges in NATO countries from 1985 to 2019. To analyze environmental sustainability, it considers two groups of countries: “traditional NATO member states” (Group 1) and “new member NATO states” (Group 2). This investigation is examined using several ways to determine reliable, consistent, and efficient findings. The investigation used the CIPS and CADF second-generation panel unit root tests to evaluate the variables’ stationarity. The analytical outcomes demonstrate that the selected variables exhibit a parallel integration sequence. The inquiry aims to analyze the evidence of “long-term” correlations among the study variables. The study utilized the Pedroni and Kao panel cointegration test to identify cointegration despite cross-sectional dependence. The results indicated a long-term association among carbon discharges, militarization, industrialization, technological innovation, and usage of energy. The work employs panel ARDL estimators under the assumption of parallel integration order in unit root tests. The Hausman test recognizes PMG as more reliable and effective than the MG and DFE estimators. This study used the GMM estimates to evaluate the reliability of the results. The model’s correctness was fully assessed using the Breusch-Pagan/Cook-Weisberg test for heteroskedasticity, the Wooldridge test for autocorrelation, and the Ramsey RESET test for specification error. The empirical findings show that long-term carbon emissions are notably increased by military spending and energy utilization, hindering environmental sustainability. Industrialization and technical innovation help reduce carbon emissions in the “traditional NATO member nations” (Group 1). However, technological advancements and energy use significantly increase carbon emissions, negatively impacting environmental sustainability. Furthermore, increased military expenditure and industrial development have significantly reduced carbon emissions in the “New Member NATO States” (Group 2), contributing to environmental protection.
5.2. Policies and Implications
Group 1, consisting of the traditional NATO member states, must reduce military expenditures. Legislative bodies should create comprehensive plans for military spending and energy usage to help (Group 1) countries reduce carbon emissions and promote environmental sustainability. Lawmakers should impose constraints on nuclear power, regulate missile tests, and decrease military equipment and weaponry use. Military actions significantly contribute to elements that harm environmental sustainability. The “new member NATO states” (Group 2) authorities should use modern and eco-friendly technology and efficiently utilize energy to decrease carbon emissions. The authorities of Group 2 countries should avoid implementing technologies that harm the environment and focus on promoting the advancement of eco-friendly technologies. This study improves energy efficiency and protects the world from environmental damage. Assessing the advancement of contemporary green technology is crucial for promoting environmental sustainability by decreasing energy usage and supporting the shift to eco-friendly industries. Implementing specific actions through regional collaboration is crucial to reducing the negative impacts of military spending, technical progress, and energy usage on the environment. Policymakers should implement strategic measures to reduce energy consumption or adopt advanced and eco-friendly technologies in NATO countries to minimize the impact on environmental sustainability, as energy consumption is the primary factor contributing to environmental degradation in each group. Industrialization and technological advancements significantly contribute to reducing carbon emissions in Group 1 nations. In addition, military spending and industrialization significantly help decrease emissions in Group 2 countries. These groups’ authorities should prioritize understanding the long-term cost benefits of reducing emissions and promoting environmental sustainability.
5.3. Limitations and directions for future research
There are several constraints in the inquiry. The study focuses on states that are part of NATO, predominantly economically developed, substantially industrialized, have high energy consumption, are technologically advanced, and possess a strong military. The analysis may not apply to underdeveloped, unarmed, or other countries. Secondly, while the overall military expenditure is utilized in this study to represent militarization, the organization of military spending could affect environmental shifts. However, a few additional crucial variables could be included. In the future, research could focus on extending the duration and scope of the study while also incorporating other essential factors to address these constraints. Further inquiry is necessary to explore how military spending, such as investments in weapons development or personnel wages, can impact the environment differently. Moreover, increasing the sample size to include countries with significant military capacities beyond those in NATO may be required.
| 1 | Economic growth (GDP) is used as a control variable that holds constant |
References
- Abbasi, M. A., Parveen, S., Khan, S., & Kamal, M. A. (2020). Urbanization and energy consumption effects on carbon dioxide emissions: Evidence from Asian-8 countries using panel data analysis. Environmental Science and Pollution Research, 27(15), 18029–18043. [CrossRef]
- Adebayo, T. S., Coelho, M. F., Onbaşıoğlu, D. Ç., Rjoub, H., Mata, M. N., Carvalho, P. V., Rita, J. X., & Adeshola, I. (2021). Modeling the Dynamic Linkage between Renewable Energy Consumption, Globalization, and Environmental Degradation in South Korea: Does Technological Innovation Matter? Energies, 14(14), 4265. [CrossRef]
- Adebayo, T. S., Oladipupo, S. D., Kirikkaleli, D., & Adeshola, I. (2022). Asymmetric nexus between technological innovation and environmental degradation in Sweden: An aggregated and disaggregated analysis. Environmental Science and Pollution Research, 29(24), 36547–36564. [CrossRef]
- Ahmed, Z., Zafar, M. W., & Mansoor, S. (2020). Analyzing the linkage between military spending, economic growth, and ecological footprint in Pakistan: Evidence from cointegration and bootstrap causality. Environmental Science and Pollution Research, 27(33), 41551–41567. [CrossRef]
- Akbostancı, E., Tunç, G. İ., & Türüt-Aşık, S. (2011). CO2 emissions of Turkish manufacturing industry: A decomposition analysis. Applied Energy, 88(6), 2273–2278. [CrossRef]
- Albino, V., Ardito, L., Dangelico, R. M., & Messeni Petruzzelli, A. (2014). Understanding the development trends of low-carbon energy technologies: A patent analysis. Applied Energy, 135, 836–854. [CrossRef]
- Aldieri, L., Bruno, B., Makkonen, T., & Vinci, C. P. (2023). Environmental innovations, geographically mediated knowledge spillovers, economic and environmental performance. Resources Policy, 81, 103423. [CrossRef]
- Ang, J. B. (2007). CO2 emissions, energy consumption, and output in France. Energy Policy, 35(10), 4772–4778. [CrossRef]
- Apergis, N., & Payne, J. E. (2010). The emissions, energy consumption, and growth nexus: Evidence from the commonwealth of independent states. Energy Policy, 38(1), 650–655.
- Arellano, M., & Bond, S. (1991). Some Tests of Specification for Panel Data: Monte Carlo Evidence and an Application to Employment Equations. The Review of Economic Studies, 58(2), 277. [CrossRef]
- Arellano, M., & Bover, O. (1995). Another look at the instrumental variable estimation of error-components models. Journal of Econometrics, 68(1), 29–51. [CrossRef]
- Asane-Otoo, E. (2015). Carbon footprint and emission determinants in Africa. Energy, 82, 426–435. [CrossRef]
- Asumadu-Sarkodie, S., & Owusu, P. A. (2016a). Carbon dioxide emission, electricity consumption, industrialization, and economic growth nexus: The Beninese case. Energy Sources, Part B: Economics, Planning, and Policy, 11(11), 1089–1096. [CrossRef]
- Asumadu-Sarkodie, S., & Owusu, P. A. (2016b). Carbon dioxide emissions, GDP per capita, industrialization and population: Evidence from Rwanda. Environmental Engineering Research, 22(1), 116–124. [CrossRef]
- Azam, M. (2020). Does military spending stifle economic growth? The empirical evidence from non-OECD countries. Heliyon, 6(12), e05853. [CrossRef]
- Azam, M., & Feng, Y. (2017). Does military expenditure increase external debt? Evidence from Asia. Defence and Peace Economics, 28(5), 550–567. [CrossRef]
- Aziz, N., & Khalid, U. (2019). Armed Conflict, Military Expenses and FDI Inflow to Developing Countries. Defence and Peace Economics, 30(2), 238–251. [CrossRef]
- Balsalobre-Lorente, D., Shahbaz, M., Roubaud, D., & Farhani, S. (2018). How do economic growth, renewable electricity, and natural resources contribute to CO2 emissions? Energy Policy, 113, 356–367. [CrossRef]
- Bildirici, M. (2017). CO 2 emissions and militarization in G7 countries: Panel cointegration and trivariate causality approaches. Environment and Development Economics, 22(6), 771–791. [CrossRef]
- Bildirici, M. (2019). CO2 emissions and militarisation in G20 countries: Panel cointegration and causality approaches. International Journal of Oil, Gas and Coal Technology, 22(1), 104–121.
- Bildirici, M. E. (2017a). The causal link among militarization, economic growth, CO2 emission, and energy consumption. Environmental Science and Pollution Research, 24(5), 4625–4636. [CrossRef]
- Bildirici, M. E. (2017b). The effects of militarization on biofuel consumption and CO2 emission. Journal of Cleaner Production, 152, 420–428. [CrossRef]
- Blundell, R., & Bond, S. (1998). Initial conditions and moment restrictions in dynamic panel data models. Journal of Econometrics, 87(1), 115–143. [CrossRef]
- Brock, W. A., & Taylor, M. S. (2005). Economic growth and the environment: A review of theory and empirics. Handbook of Economic Growth, p. 1, 1749–1821.
- Cato, M. S. (2012). Green economics: An introduction to theory, policy and practice. Routledge.
- Chang, S., Chen, B., & Song, Y. (2023). Militarization, renewable energy utilization, and ecological footprints: Evidence from RCEP economies. Journal of Cleaner Production, 391, 136298. [CrossRef]
- Chiu, Y.-B., & Zhang, W. (2022). Effects of energy and economic growth on CO2 emissions: What does globalization matter? Environment, Development and Sustainability. [CrossRef]
- Chudik, A., & Pesaran, M. H. (2013). Large Panel Data Models with Cross-Sectional Dependence: A Survey. SSRN Electronic Journal. [CrossRef]
- Clark, B., & Jorgenson, A. K. (2012). The treadmill of destruction and the environmental impacts of militaries 1. Sociology Compass, 6(7), 557–569.
- Çolak, O., Özuyar, S. E. G., & Bölükbaşı, Ö. F. (2022). Asymmetric Effects of the Defense Burden on Environmental Degradation: Evidence from NATO Countries. Sustainability, 15(1), 573. [CrossRef]
- Dauda, L., Long, X., Mensah, C. N., & Salman, M. (2019). The effects of economic growth and innovation on CO2 emissions in different regions. Environmental Science and Pollution Research, 26(15), 15028–15038. [CrossRef]
- DeRouen, K. R. (1994). Défense spending and economic growth in Latin America: The externalities effects. International Interactions, 19(3), 193–212. [CrossRef]
- Destek, M. A., & Manga, M. (2021). Technological innovation, financialization, and ecological footprint: Evidence from BEM economies. Environmental Science and Pollution Research, 28(17), 21991–22001. [CrossRef]
- Dogan, E., & Turkekul, B. (2016). CO2 emissions, real output, energy consumption, trade, urbanization and financial development: Testing the EKC hypothesis for the USA. Environmental Science and Pollution Research, 23(2), 1203–1213. [CrossRef]
- Dong, J., He, J., Li, X., Mou, X., & Dong, Z. (2020). The Effect of Industrial Structure Change on Carbon Dioxide Emissions: A Cross-Country Panel Analysis. Journal of Systems Science and Information, 8(1), 1–16. [CrossRef]
- Dycus, S. (1996). National defense and the environment. (No Title).
- Ehigiamusoe, K. U., & Lean, H. H. (2019). Effects of energy consumption, economic growth, and financial development on carbon emissions: Evidence from heterogeneous income groups. Environmental Science and Pollution Research, 26(22), 22611–22624. [CrossRef]
- EIA. (2015). U.S. Energy-related Carbon Dioxide Emissions, 2014, Washington, DC: US Department of Energy, [Available at] https://www.eia.gov/environment/ emissions/carbon/pdf/2014 co2analysis.pdf.
- Ekwueme, D. C., & Zoaka, J. D. (2020). Effusions of carbon dioxide in MENA countries: Inference of financial development, trade receptivity, and energy utilization. Environmental Science and Pollution Research, 27(11), 12449–12460. [CrossRef]
- Elfaki, K. E., Khan, Z., Kirikkaleli, D., & Khan, N. (2022). On the nexus between industrialization and carbon emissions: Evidence from ASEAN + 3 economies. Environmental Science and Pollution Research, 29(21), 31476–31485. [CrossRef]
- Engle, R. F., & Granger, C. W. J. (1987). Cointegration and Error Correction: Representation, Estimation, and Testing. Econometrica, 55(2), 251. [CrossRef]
- Erdogan, S. (2021). Dynamic Nexus between Technological Innovation and Building Sector Carbon Emissions in the BRICS Countries. Journal of Environmental Management, p. 293, 112780. [CrossRef]
- Erdogan, S., Gedikli, A., Çevik, E. İ., & Öncü, M. A. (2022). Does military expenditure impact environmental sustainability in developed Mediterranean countries? Environmental Science and Pollution Research, 29(21), 31612–31630. [CrossRef]
- Fisher-Vanden, K., Jefferson, G. H., Liu, H., & Tao, Q. (2004). What is driving China’s decline in energy intensity? Resource and Energy Economics, 26(1), 77–97. [CrossRef]
- Franco, S., Mandla, V. R., & Rao, K. R. M. (2017). Urbanization, energy consumption and emissions in the Indian context A review. Renewable and Sustainable Energy Reviews, 71, 898–907.
- Frees, E. W. (1995). Assessing cross-sectional correlation in panel data. Journal of Econometrics, 69(2), 393–414. [CrossRef]
- Friedman, M. (1937). Using Ranks to Avoid the Assumption of Normality Implicit in the Analysis of Variance. Journal of the American Statistical Association, 32(200), 675–701. [CrossRef]
- Givens, J. E. (2014). Global Climate Change Negotiations, the Treadmill of Destruction, and World Society: An Analysis of Kyoto Protocol Ratification. International Journal of Sociology, 44(2), 7–36. [CrossRef]
- Gokmenoglu, K. K., Taspinar, N., & Rahman, M. M. (2021). Military expenditure, financial development, and environmental degradation in Turkey: A comparison of CO 2 emissions and ecological footprint. International Journal of Finance & Economics, 26(1), 986–997. [CrossRef]
- González, D., & Martínez, M. (2012). Changes in CO2 emission intensities in the Mexican industry. Energy Policy, 51, 149–163. [CrossRef]
- Gould, K. A. (2007). The Ecological Costs of Militarization. Peace Review, 19(3), 331–334. [CrossRef]
- Grossman, G. M., & Krueger, A. B. (1991). Environmental impacts of a North American free trade agreement. National Bureau of Economic Research Cambridge, Mass., USA.
- Hammond, A., Adriaanse, A., Rodenburg, E., Bryant, D., & Woodward, R. (1995). E NVI RO NM ENTAL INDKAT 0 RS: A Systematic Approach to Measuring and Reporting on Environmental Policy Performance in the Context of Sustainable Development.
- Harlan, S. L., Pellow, D. N., Roberts, J. T., Bell, S. E., Holt, W. G., & Nagel, J. (2015). Climate Justice and Inequality. In R. E. Dunlap & R. J. Brulle (Eds.), Climate Change and Society (pp. 127–163). Oxford University Press. [CrossRef]
- Hashem Pesaran, M., & Yamagata, T. (2008). Testing slope homogeneity in large panels. Journal of Econometrics, 142(1), 50–93. [CrossRef]
- Hong, Y. (2018). The major innovations of Chinese economic development theories in the new era. China Political Economy, 1(1), 13–29. [CrossRef]
- Hooks, G., & Smith, C. L. (2004) a. The Treadmill of Destruction: National Sacrifice Areas and Native Americans. American Sociological Review, 69(4), 558–575. [CrossRef]
- Hooks, G., & Smith, C. L. (2005) b. Treadmills of Production and Destruction: Threats to the Environment Posed by Militarism. Organization & Environment, 18(1), 19–37. [CrossRef]
- Hou, N., & Chen, B. (2014). Military Expenditure and Investment in OECD Countries: Revisited. Peace Economics, Peace Science and Public Policy, 20(4), 621–630. [CrossRef]
- IEA. (2016). ‘Decoupling of global emissions and economic growth confirmed’, International Energy Agency, Paris, [Available at] https://www.iea.org/news room/news/2016/march/decoupling-of-global-emissions-and-economic-growthconfirmed. Html.
- IEA. (2022). International Energy Agency (IEA). Global Energy Review 2021: CO Emissions 2022. Available online: Https://www.iea.org/ reports/global-energy-review-2021/CO-emissions (accessed on 14 April 2022).
- Jamil, K., Dunnan, L., Gul, R. F., Shehzad, M. U., Gillani, S. H. M., & Awan, F. H. (2022). Role of Social Media Marketing Activities in Influencing Customer Intentions: A Perspective of a New Emerging Era. Frontiers in Psychology, 12, 808525. [CrossRef]
- Jorgenson, A. K., & Clark, B. (2011). Societies consuming nature: A panel study of the ecological footprints of nations, 1960–2003. Social Science Research, 40(1), 226–244.
- Jorgenson, A. K., & Clark, B. (2016). The temporal stability and developmental differences in the environmental impacts of militarism: The treadmill of destruction and consumption-based carbon emissions. Sustainability Science, 11(3), 505–514. [CrossRef]
- Jorgenson, A. K., Clark, B., & Kentor, J. (2010). Militarization and the Environment: A Panel Study of Carbon Dioxide Emissions and the Ecological Footprints of Nations, 1970–2000. Global Environmental Politics, 10(1), 7–29. [CrossRef]
- Jorgenson, D. W., & Wilcoxen, P. J. (1993). Energy, The Environment, and Economic Growth. In Handbook of Natural Resource and Energy Economics (Vol. 3, pp. 1267–1349). Elsevier. [CrossRef]
- Kao, C. (1999). Spurious regression and residual-based tests for cointegration in panel data. Journal of Econometrics, 90(1), 1–44. [CrossRef]
- Khan, L., Arif, I., & Waqar, S. (2021). The Impact of Military Expenditure on External Debt: The Case of 35 Arms Importing Countries. Defence and Peace Economics, 32(5), 588–599. [CrossRef]
- Khan, M. (2023). Macroeconomic factors affecting carbon dioxide emissions in Bangladesh: an ARDL approach. Polityka Energetyczna – Energy Policy Journal, 26(3), 27-46. [CrossRef]
- Koçak, E., & Ulucak, Z. Ş. (2019). The effect of energy R&D expenditures on CO 2 emission reduction: Estimation of the STIRPAT model for OECD countries. Environmental Science and Pollution Research, 26, 14328–14338.
- Kongkuah, M., Yao, H., & Yilanci, V. (2022). The relationship between energy consumption, economic growth, and CO2 emissions in China: The role of urbanization and international trade. Environment, Development and Sustainability, 24(4), 4684–4708. [CrossRef]
- Konuk, F., Kaya, E., Akpınar, S., & Yıldız, Ş. (2023). The Relationship Between Military Expenditures, Financial Development and Environmental Pollution in G7 Countries. Journal of the Knowledge Economy. [CrossRef]
- Kumar, S., & Managi, S. (2009). Energy price-induced and exogenous technological change: Assessing the economic and environmental outcomes. Resource and Energy Economics, 31(4), 334–353. [CrossRef]
- Lean, H. H., & Smyth, R. (2010). CO2 emissions, electricity consumption, and output in ASEAN. Applied Energy, 87(6), 1858–1864. [CrossRef]
- Lee, C. T., Hashim, H., Ho, C. S., Fan, Y. V., & Klemeš, J. J. (2017). Sustaining the low-carbon emission development in Asia and beyond Sustainable energy, water, transportation, and low-carbon emission technology. Journal of Cleaner Production, 146, 1–13. [CrossRef]
- Lee, K.-H., & Min, B. (2015). Green R&D for eco-innovation and its impact on carbon emissions and firm performance. Journal of Cleaner Production, 108, 534–542. [CrossRef]
- Lennerfors, T. T., Fors, P., & van Rooijen, J. (2015). ICT and environmental sustainability in a changing society: The ecological World Systems Theory view. Information Technology & People, 28(4), 758–774.
- Leslie, S. W. (1987). Playing the education game to win: Stanford’s military and interdisciplinary research. Historical Studies in the Physical and Biological Sciences, 18(1), 55–88.
- Li, D., Cao, L., Zhou, Z., Zhao, K., Du, Z., & Chen, Y. (2023). Correlating CO2 emissions of cities with the inter-city carbon compensation mechanism: A regional perspective in the middle reaches of the Yangtze River (MRYR), China. Environment, Development and Sustainability. [CrossRef]
- Li, K., & Lin, B. (2015). Impacts of urbanization and industrialization on energy consumption/CO2 emissions: Does the level of development matter? Renewable and Sustainable Energy Reviews, p. 52, 1107–1122. [CrossRef]
- Li, K., & Lin, B. (2016). Impact of energy technology patents in China: Evidence from a panel cointegration and error correction model. Energy Policy, pp. 89, 214–223. [CrossRef]
- Lin, B., Omoju, O. E., & Okonkwo, J. U. (2015). Impact of industrialization on CO 2 emissions in Nigeria. Renewable and Sustainable Energy Reviews, 52, 1228–1239. [CrossRef]
- Maryam, J., Mittal, A., & Sharma, V. (2017). CO2 emissions, energy consumption, and economic growth in BRICS: an empirical analysis.
- Melman, S. (1973). Pentagon capitalism: The political economy of war. HM Hodges (Ed.), Conflict and Consensus. Readings Toward a Sociological Perspective, New York et al.(Harper and Row, Publishers) 1973, Pp. 209–216.
- Moya, J. A., & Pardo, N. (2013). There is potential for improvements in energy efficiency and CO2 emissions in the EU27 iron and steel industry under different payback periods. Journal of Cleaner Production, 52, 71–83. [CrossRef]
- NATO. (2022a). Defence Expenditure of NATO Countries (2014-2022). Available online: Https://www.nato.int/nato_static_fl2014/assets/pdf/2023/3/pdf/230321-def-exp-2022-en.pdf.
- NATO. (2022b). North Atlantic Treaty Organization (NATO). Brussels Submit Communiqué 2021. Available online: Https://www.nato.int/cps/ en/natohq/news_185000.htm (accessed on 17 December 2022).
- Nemet, G., & Greene, J. (2022). Innovation in low-energy demand and its policy implications. Oxford Open Energy, 1, oiac003. [CrossRef]
- Odehnal, J. (2015). Military Expenditures and Free-Riding in NATO. Peace Economics, Peace Science and Public Policy, 21(4), 479–487. [CrossRef]
- Odehnal, J., & Neubauer, J. (2020). Economic, Security, and Political Determinants of Military Spending in NATO Countries. Defence and Peace Economics, 31(5), 517–531. [CrossRef]
- Olivier, J. G., Schure, K. M., & Peters, J. (2017). Trends in global CO2 and total greenhouse gas emissions. PBL Netherlands Environmental Assessment Agency, 5, 1–11.
- Omri, A., & Hadj, T. B. (2020). Foreign investment and air pollution: Do good governance and technological innovation matter? Environmental Research, 185, 109469.
- Pata, U. K. (2018). Renewable energy consumption, urbanization, financial development, income, and CO2 emissions in Turkey: Testing EKC hypothesis with structural breaks. Journal of Cleaner Production, pp. 187, 770–779. [CrossRef]
- Pedroni, P. (1999). Critical Values for Cointegration Tests in Heterogeneous Panels with Multiple Regressors. Oxford Bulletin of Economics and Statistics, 61(s1), 653–670. [CrossRef]
- Pesaran, M. (2004). General Diagnostic Tests for Cross Section Dependence in Panels [Cambridge Working Papers in Economics]. Faculty of Economics, University of Cambridge. https://EconPapers.repec.org/RePEc:cam:camdae:0435.
- Pesaran, M. H. (2007). A simple panel unit root test in the presence of cross-section dependence. Journal of Applied Econometrics, 22(2), 265–312. [CrossRef]
- Pesaran, M. H., Shin, Y., & Smith, R. P. (1999). Pooled Mean Group Estimation of Dynamic Heterogeneous Panels. Journal of the American Statistical Association, 94(446), 621–634. [CrossRef]
- Pesaran, M. H., & Smith, R. (1995). Estimating long-run relationships from dynamic heterogeneous panels. Journal of Econometrics, 68(1), 79–113. [CrossRef]
- Phimphanthavong, H. (2013). The impacts of economic growth on environmental conditions in Laos. International Journal of Business Management and Economic Research, 4(5), 766–774.
- Pieroni, L. (2009). MILITARY EXPENDITURE AND ECONOMIC GROWTH. Defence and Peace Economics, 20(4), 327–339. [CrossRef]
- Polsterer, F. (2015). The impacts of militarism on climate change: A sorely neglected relationship: The effects on human rights and how a civil society approach can bring about system change.
- Ponce, P., & Khan, S. A. R. (2021). A causal link between renewable energy, energy efficiency, property rights, and CO2 emissions in developed countries: A road map for environmental sustainability. Environmental Science and Pollution Research, 28(28), 37804–37817. [CrossRef]
- Rafique, M. Z., Li, Y., Larik, A. R., & Monaheng, M. P. (2020). The effects of FDI, technological innovation, and financial development on CO2 emissions: Evidence from the BRICS countries. Environmental Science and Pollution Research, 27(19), 23899–23913. [CrossRef]
- Raiser, K., Naims, H., & Bruhn, T. (2017). Corporatization of the climate? Innovation, intellectual property rights, and patents for climate change mitigation. Energy Research & Social Science, pp. 27, 1–8. [CrossRef]
- Rawtani, D., Gupta, G., Khatri, N., Rao, P. K., & Hussain, C. M. (2022). Environmental damages due to war in Ukraine: A perspective. Science of The Total Environment, p. 850, 157932. [CrossRef]
- RTO TECHNICAL REPORT of NATO. (2023). North Atlantic Treaty Organization (NATO). Handbook on Long Term Defense Planning 2021. Available online: Https://apps. Dtic.mil/sti/citations/ADA414193 (accessed on 14 April 2022).
- Saba, C. S., & Ngepah, N. (2020). Convergence in military expenditure and economic growth in Africa and its regional economic communities: Evidence from a club clustering algorithm. Cogent Economics & Finance, 8(1), 1832344. [CrossRef]
- Samargandi, N. (2017). Sector value addition, technology, and CO2 emissions in Saudi Arabia. Renewable and Sustainable Energy Reviews, 78, 868–877. [CrossRef]
- Sanders, B. (2009). The green zone: The environmental costs of militarism. AK Press.
- Saud, S., Chen, S., Haseeb, A., & Sumayya. (2020). The role of financial development and globalization in the environment: Accounting ecological footprint indicators for selected one-belt-one-road initiative countries. Journal of Cleaner Production, 250, 119518. [CrossRef]
- Selvanathan, E. A., Jayasinghe, M., & Selvanathan, S. (2021). Dynamic modeling of inter-relationship between tourism, energy consumption, CO 2 emissions and economic growth in South Asia. International Journal of Tourism Research, 23(4), 597–610. [CrossRef]
- Sgobbi, A., Simões, S. G., Magagna, D., & Nijs, W. (2016). Assessing the impacts of technology improvements on the deployment of marine energy in Europe with an energy system perspective. Renewable Energy, 89, 515–525. [CrossRef]
- Shahbaz, M., Hye, Q. M. A., Tiwari, A. K., & Leitão, N. C. (2013). Economic growth, energy consumption, financial development, international trade, and CO2 emissions in Indonesia. Renewable and Sustainable Energy Reviews, 25, 109–121.
- Shahbaz, M., Raghutla, C., Song, M., Zameer, H., & Jiao, Z. (2020). Public-private partnerships investment in energy as new determinant of CO2 emissions: The role of technological innovations in China. Energy Economics, 86, 104664. [CrossRef]
- Sheng, P., & Guo, X. (2016). The long-run and short-run impacts of urbanization on carbon dioxide emissions. Economic Modelling, 53, 208–215.
- Shrestha, R. M., Anandarajah, G., & Liyanage, M. H. (2009). Factors affecting CO2 emission from the power sector of selected countries in Asia and the Pacific. Energy Policy, 37(6), 2375–2384. [CrossRef]
- Shrivastava, P., Stafford Smith, M., O’Brien, K., & Zsolnai, L. (2020). Transforming Sustainability Science to Generate Positive Social and Environmental Change Globally. One Earth, 2(4), 329–340. [CrossRef]
- SIPRI. (2021). Stockholm International Peace and Research Institute. SIPRI Yearbook 2021: Armaments, Disarmament and International Security 2021. Available online: Https://www.sipri.org/yearbook/2021 (accessed on 14 April 2022).
- Skytt, T., Nielsen, S. N., & Jonsson, B.-G. (2020). Global warming and absolute global temperature change potential from carbon dioxide and methane fluxes as regional sustainability indicators – A Jämtland, Sweden case study. Ecological Indicators, 110, 105831. [CrossRef]
- Smith, R. P. (1980). Military expenditure and investment in OECD countries, 1954–1973. Journal of Comparative Economics, 4(1), 19–32. [CrossRef]
- Statista. (2023a). Average defense expenditure of NATO countries as a share of GDP 2014-2023. Available online: Https://www.statista.com/statistics/1293314/nato-defense-spending-share-gdp/.
- Statista. (2023b). Combined defense expenditure of NATO countries from 2014 to 2023. Available online: Https://www.statista.com/statistics/1293301/combined-defense-expenditures-nato/.
- Statista. (2023c). The combined number of military personnel in NATO countries from 2014 to 2023. Available online: Https://www.statista.com/statistics/1293365/nato-overall-military-personnel/.
- Tahir, T., Luni, T., Majeed, M. T., & Zafar, A. (2021). The impact of financial development and globalization on environmental quality: Evidence from South Asian economies. Environmental Science and Pollution Research, 28(7), 8088–8101. [CrossRef]
- Trivedi, H. K., Massey, M. L., Bhattacharya, R. S., Strahl, G. A., & Collum, D. (2004). Cleaners for military machine parts—Is there a green alternative? Journal of Cleaner Production, 12(7), 771–780. [CrossRef]
- 126. Tucker, R. P. (2012). War and the Environment. A Companion to Global Environmental History, pp. 319–339.
- Uddin, M. G. S., Bidisha, S. H., & Ozturk, I. (2016). Carbon emissions, energy consumption, and economic growth relationship in Sri Lanka. Energy Sources, Part B: Economics, Planning, and Policy, 11(3), 282–287. [CrossRef]
- Uddin, M., Rashid, M. H. U., Ahamad, S., & Ehigiamusoe, K. U. (2023). Impact of militarization, energy consumption, and ICT on CO2 emissions in G20 countries. Environment, Development and Sustainability. [CrossRef]
- Ullah, S., Andlib, Z., Majeed, M. T., Sohail, S., & Chishti, M. Z. (2021). Asymmetric effects of militarization on economic growth and environmental degradation: Fresh evidence from Pakistan and India. Environmental Science and Pollution Research, 28(8), 9484–9497. [CrossRef]
- Urbain, J.-P., & Westerlund, J. (2006). Spurious regression in nonstationary panels with cross-unit cointegration (Research Memorandum 057). Maastricht University, Maastricht Research School of Economics of Technology and Organization (METEOR). https://EconPapers.repec.org/RePEc:unm:umamet:2006057.
- Usman, O., Olanipekun, I. O., Iorember, P. T., & Abu-Goodman, M. (2020). Modeling environmental degradation in South Africa: The effects of energy consumption, democracy, and globalization using innovation accounting tests. Environmental Science and Pollution Research, 27, 8334–8349.
- Wang, L., Chang, H.-L., Rizvi, S. K. A., & Sari, A. (2020). Are eco-innovation and export diversification mutually exclusive to control carbon emissions in G-7 countries? Journal of Environmental Management, 270, 110829. [CrossRef]
- Wang, S., Li, G., & Fang, C. (2018). Urbanization, economic growth, energy consumption, and CO2 emissions: Empirical evidence from countries with different income levels. Renewable and Sustainable Energy Reviews, 81, 2144–2159.
- Wang, Z., Shi, C., Li, Q., & Wang, G. (2011). Impact of heavy industrialization on the carbon emissions: An empirical study of China. Energy Procedia, 5, 2610–2616.
- Xinmin, W., Hui, P., Hafeez, M., Aziz, B., Akbar, M. W., & Mirza, M. A. (2020). The nexus of environmental degradation and technology innovation and adoption: An experience from the dragon. Air Quality, Atmosphere & Health, 13(9), 1119–1126. [CrossRef]
- Yahoo Finance. (2023). NATO Military Spending by Country: Top 20 Countries. Available online: Https://finance.yahoo.com/news/nato-military-spending-country-top-093007390.html?guccounter=1&guce_referrer=aHR0cHM6Ly93d3cuZ29vZ2xlLmNvbS8&guce_referrer_sig=AQAAAM_D5pH_hRz7RdIzLmIwq—ytbrK_U7AIHz5JBN_HWFl2b8rLBwGUcHr3WSksOKF-GfbKESjUYyLjOYAuGbrZTA7npKfvYxR1ANfPMQyc1PLqk7W9VHM58A4vPi2hJ5s7ewoFKbXQgRv_2bIaOVfbrA19uWm3gLnKa9Wm8-pNeKa.
- Yang, L., & Li, Z. (2017). Technology advance and the carbon dioxide emission in China–Empirical research based on the rebound effect. Energy Policy, 101, 150–161.
- Yii, K.-J., & Geetha, C. (2017). The Nexus between Technology Innovation and CO 2 Emissions in Malaysia: Evidence from Granger Causality Test. Energy Procedia, 105, 3118–3124. [CrossRef]
- Zafar, A., Ullah, S., Majeed, M. T., & Yasmeen, R. (2020). Environmental pollution in Asian economies: Does industrialization matter? OPEC Energy Review, 44(3), 227–248. [CrossRef]
Figure 1.
Visualization of the association between chosen variables.
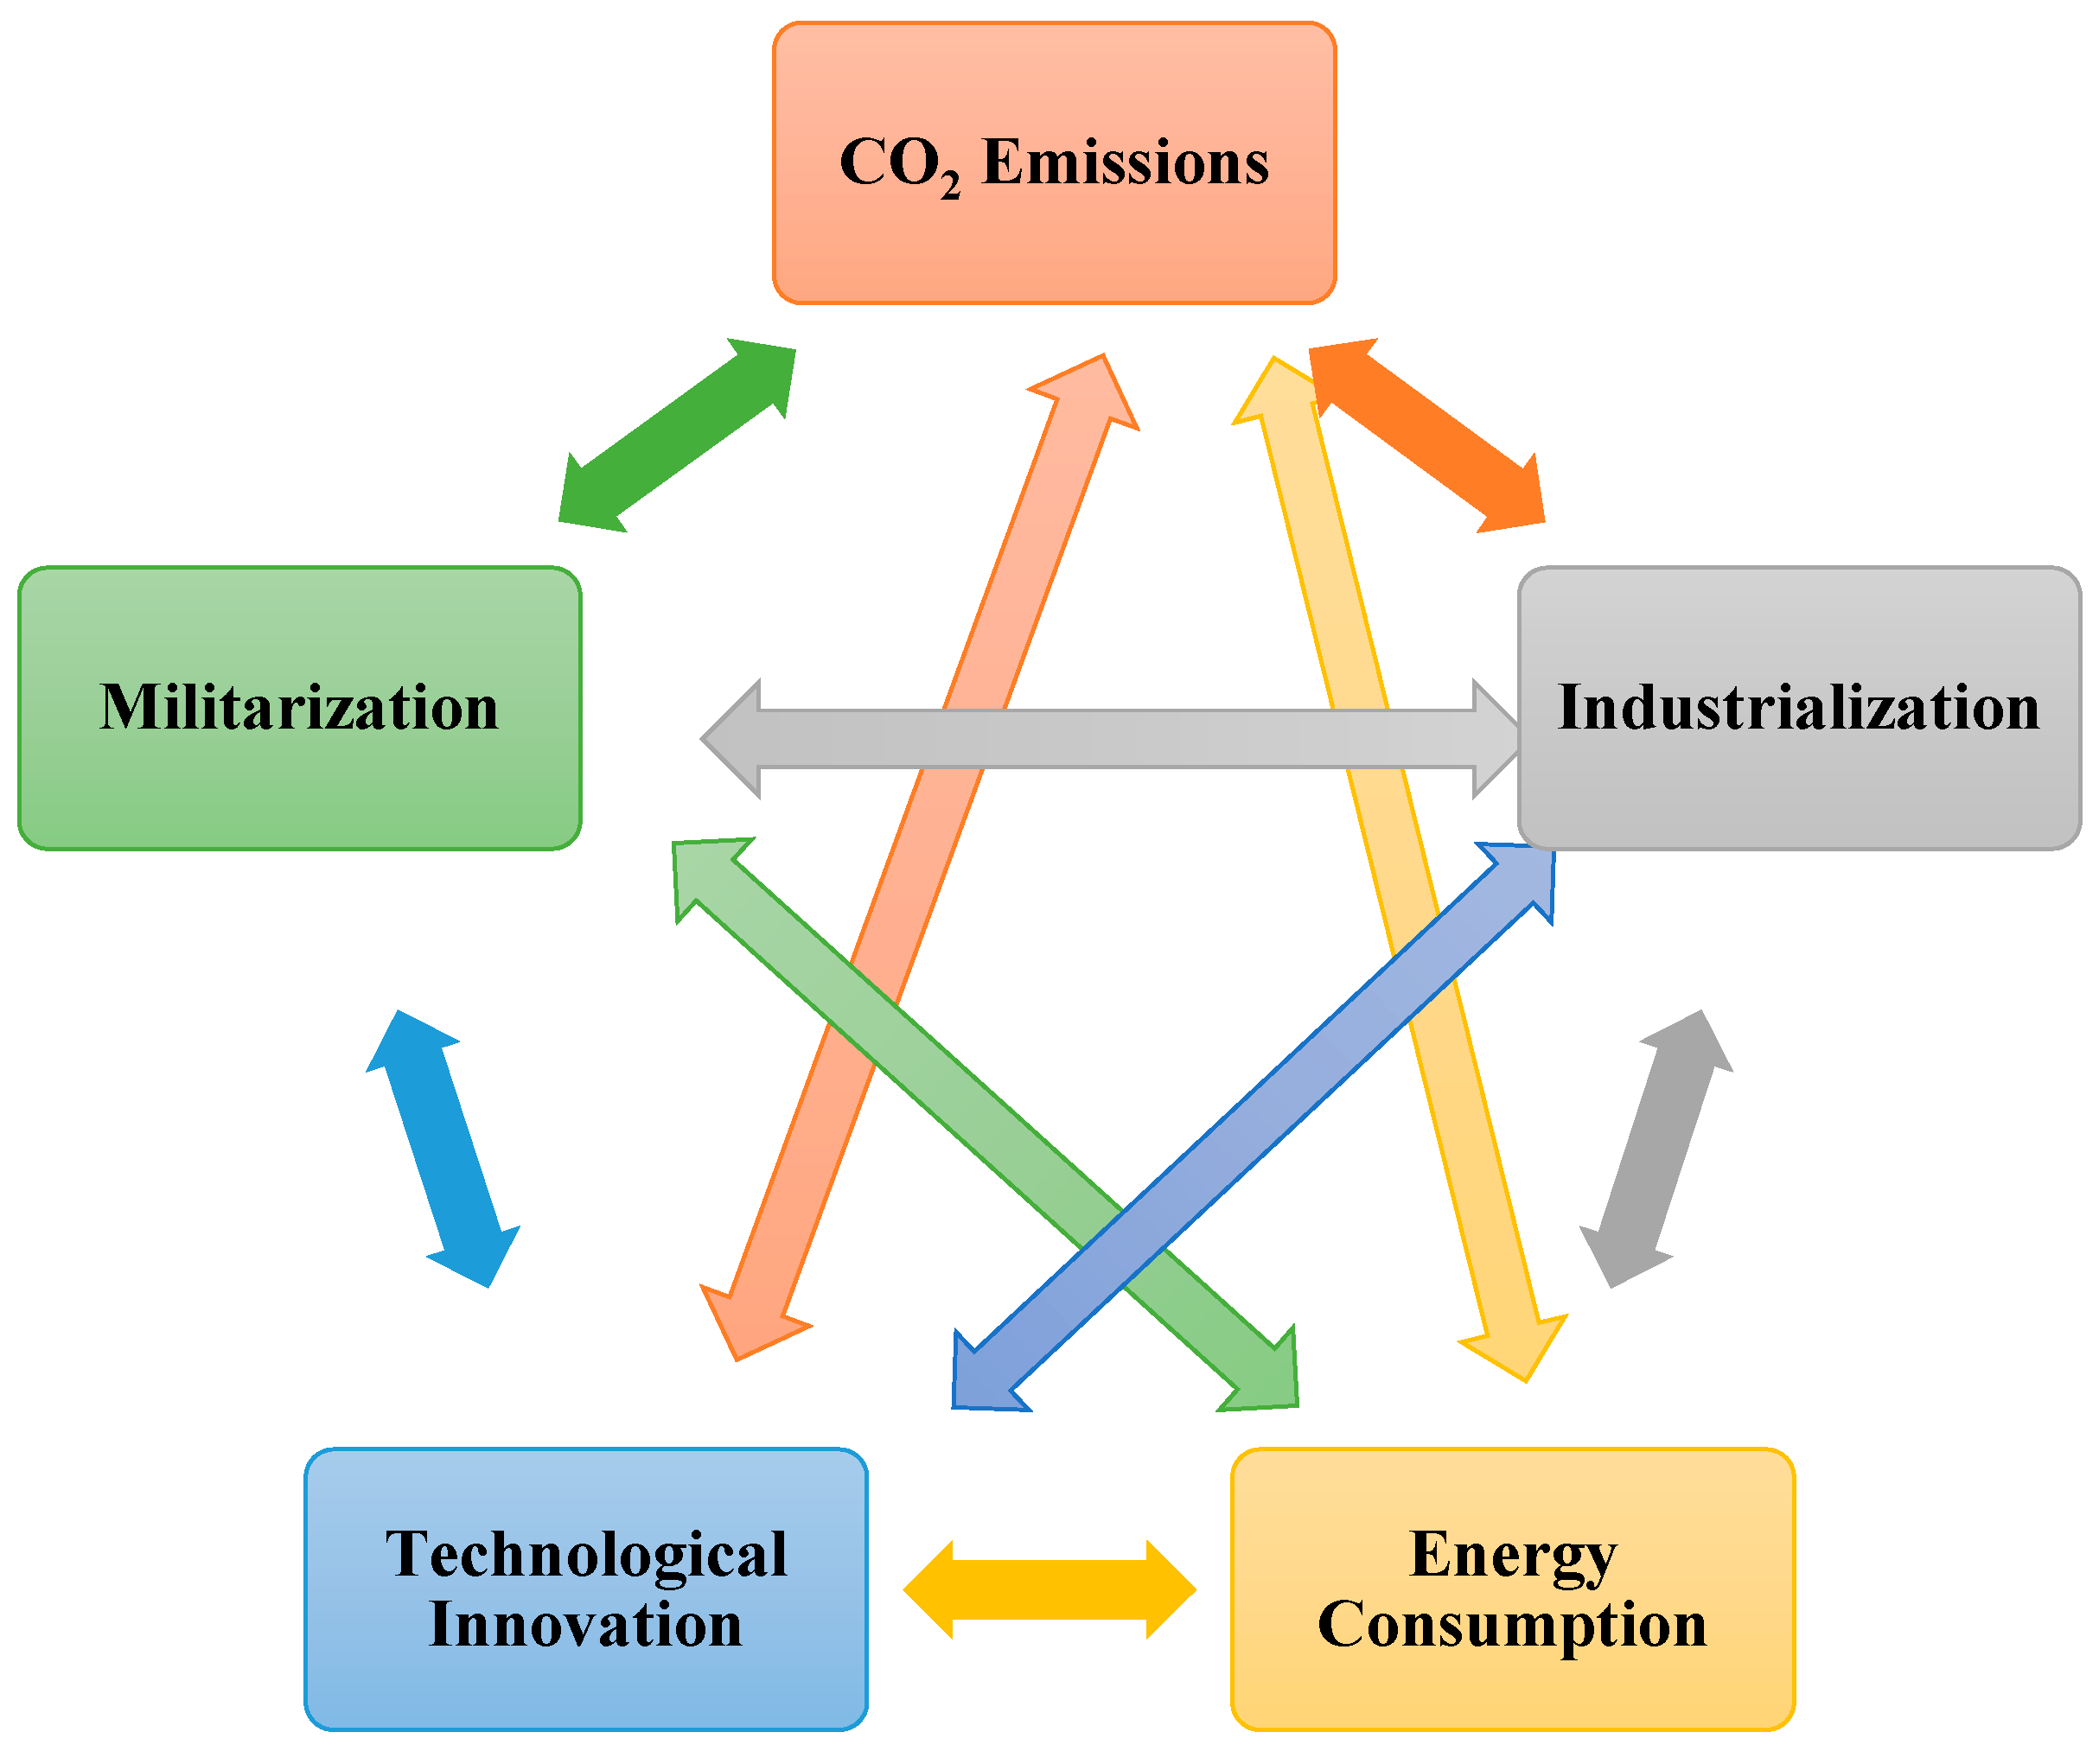
Figure 2.
Flow chart of the analytical techniques employed in the research.
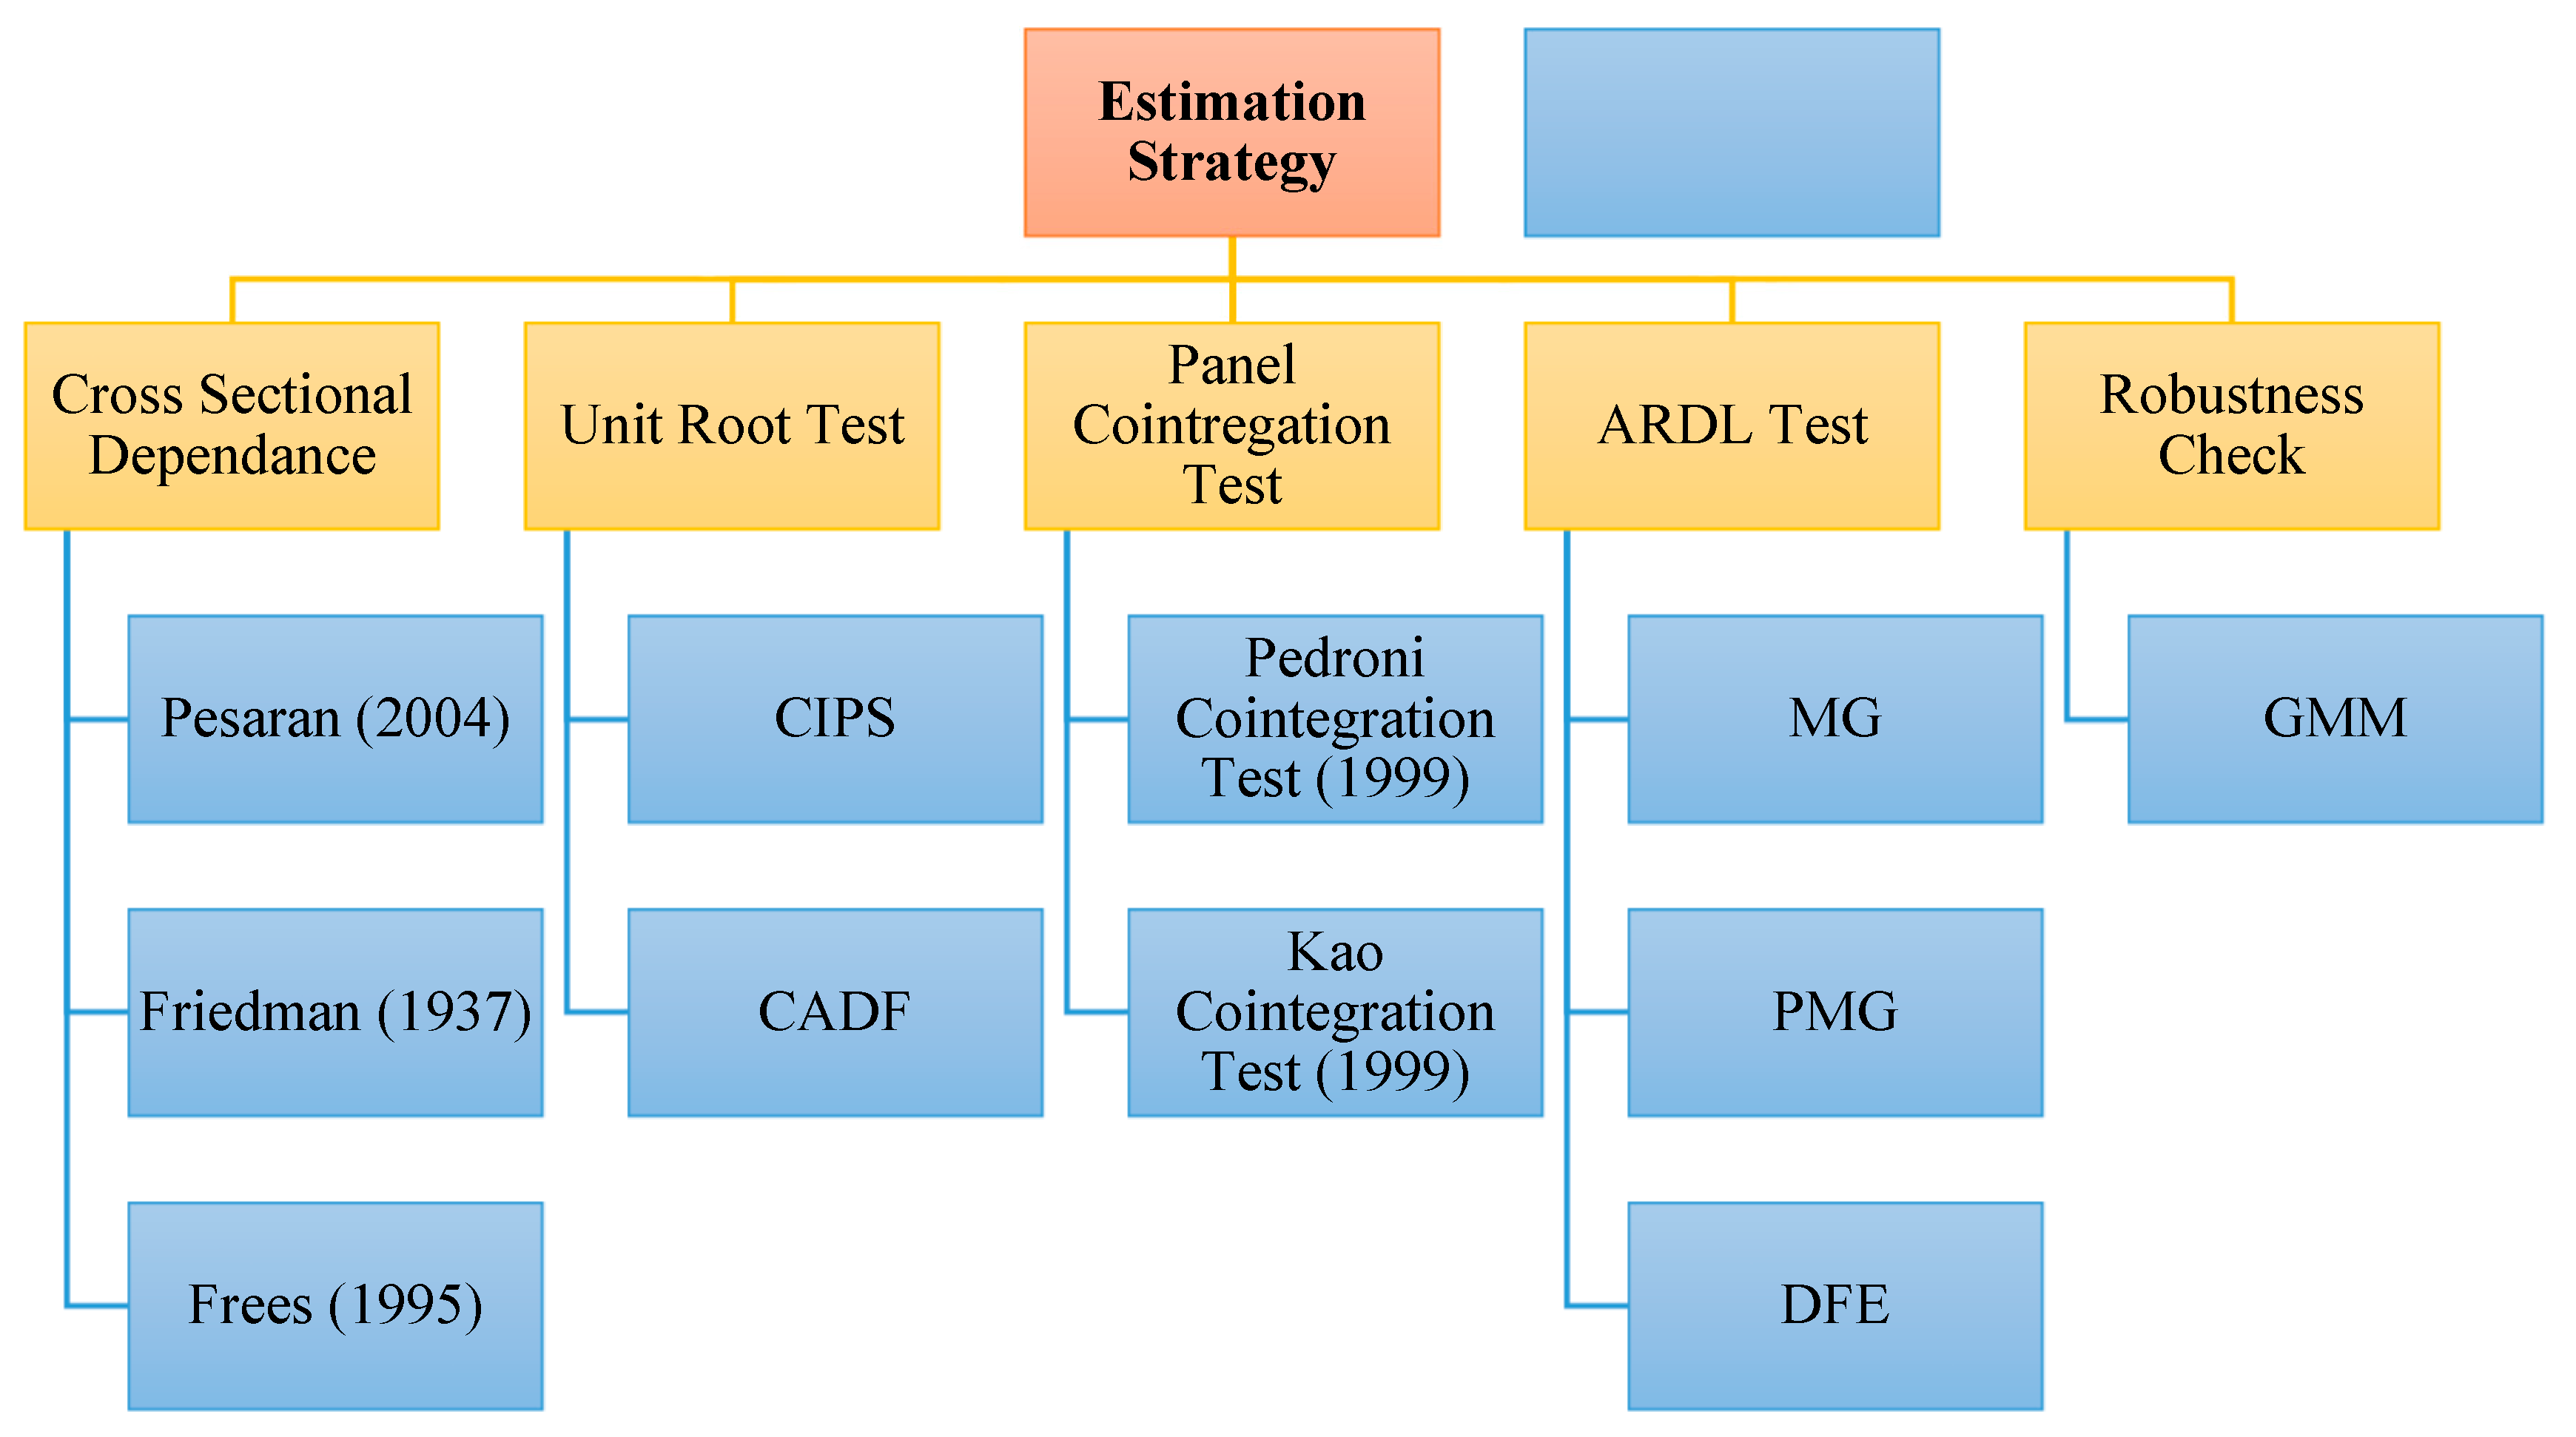
Figure 3.
Graphical representation of long-run results from PMG-ARDL for Group 1 and 2.
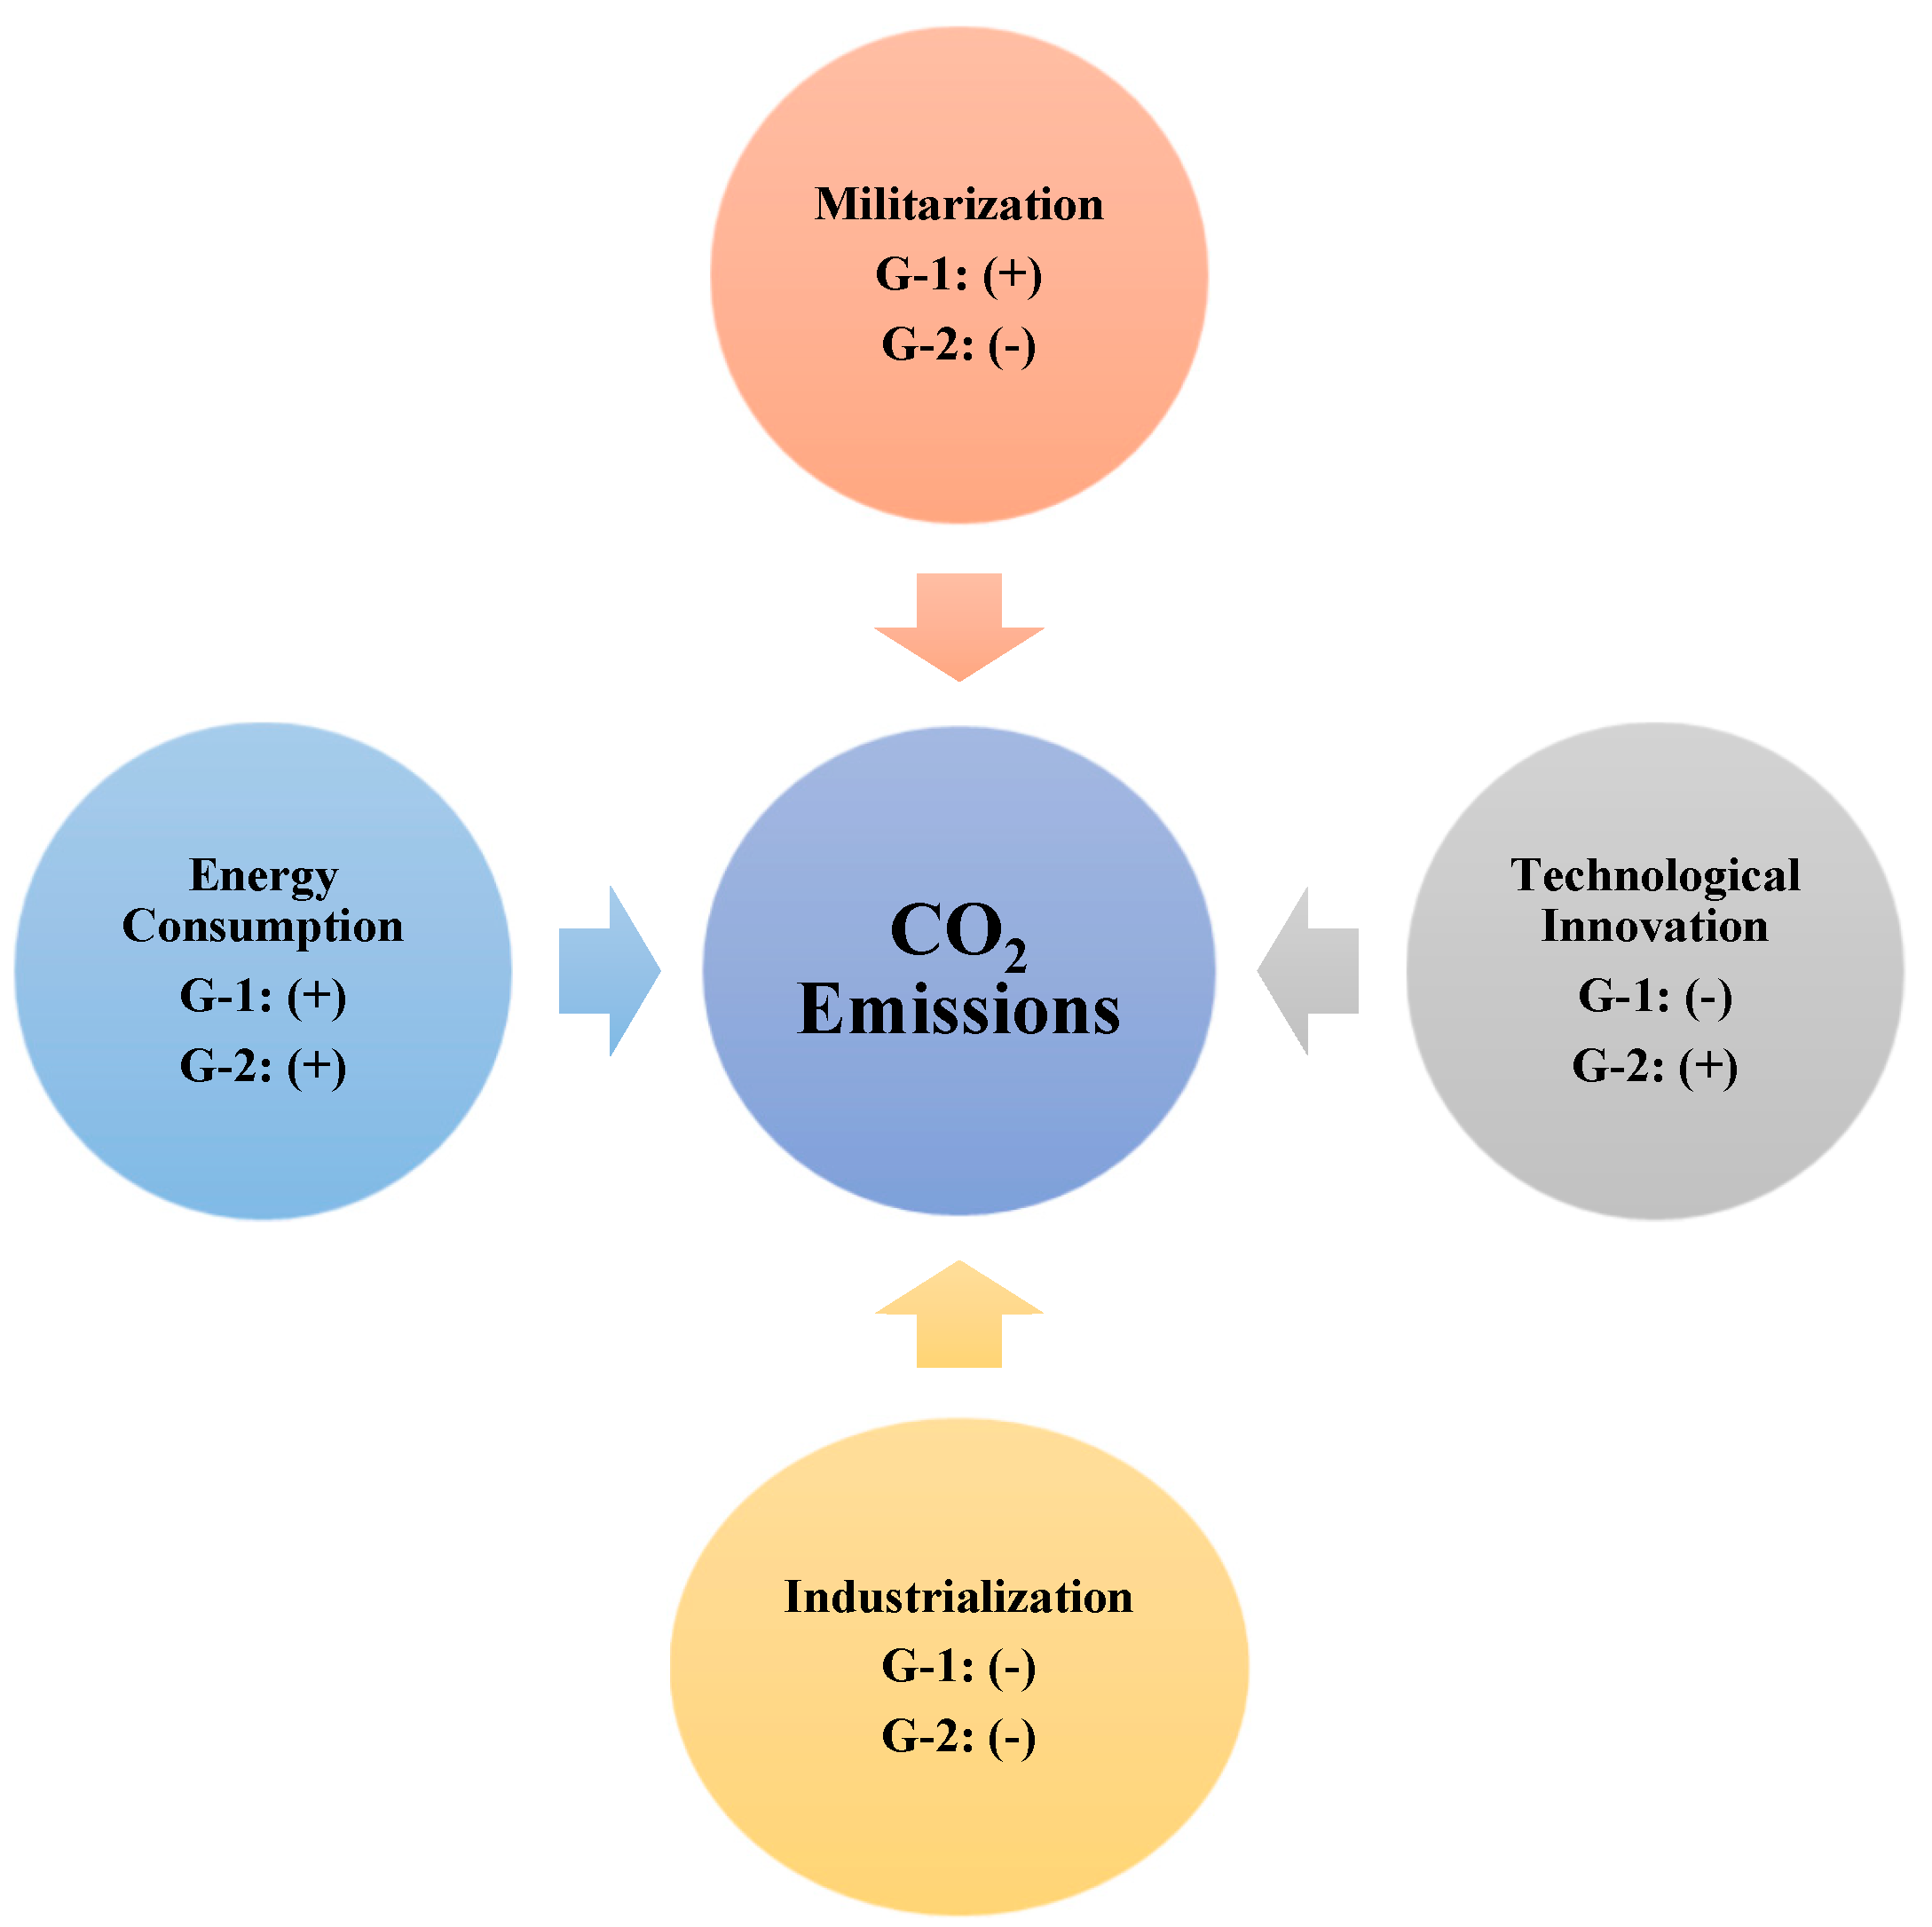

Table 1.
List of selected NATO countries.
| Regional panel classification | Selected countries |
| “Traditional NATO member countries” (Group 1) | Belgium, Canada, Denmark, France, Germany, Greece, Italy, Luxembourg, Netherlands, Norway, Portugal, Spain, United Kingdom, United States. |
| “New NATO member countries” (Group 2) |
Bulgaria, Croatia, Czechia, Estonia, Hungary, Latvia, Lithuania, Poland, Romania, Slovak Republic, Slovenia, Türkiye. |
| Note: Albania is excluded from Group 2 because the data is unavailable | |
Table 2.
Variables’ description and data source.
| Variables | Abbreviation with log | Description | Units | Sources | |
|---|---|---|---|---|---|
| Carbon emissions () | Amount of emissions | Metric tons per capita | WDI | ||
| Military expenditure (ME) | lnMEX | Military spending | % of GDP | WDI | |
| Industrialization (IND) | lnIND | Industry (including construction) | value added per worker (constant 2015 US$) | WDI | |
| Technological innovation (TECH) | lnTECH | Patent applications, residents and non-residents | Total number of patent applications | WDI | |
| Energy consumption (EC) | lnEC | Total energy use | Kg of oil equivalent per capita | WDI | |
| Economic growth (GDP)1 | lnGDP | Gross domestic product (GDP) per capita | GDP per capita (constant 2015 US$) | WDI | |
| Variable | Mean | Std. Dev | Min | Max | Skewness | Kurtosis | JB Test |
|---|---|---|---|---|---|---|---|
| Group 1 | |||||||
| 2.907243 | 0.4774392 | -0.1590199 | 4.106891 | 0.1571 | 0.0000 | 167.8 | |
| lnMEX | 1.358008 | .4226931 | 0.3512265 | 2.589873 | 0.0129 | 0.4444 | 6.623 |
| lnIND | 11.89305 | 0.5761494 | 7.99373 | 13.17638 | 0.0000 | 0.0000 | 840.3 |
| lnTECH | 9.232924 | 2.066408 | 3.871635 | 14.03296 | 0.3353 | 0.0232 | 4.475 |
| lnEC | 9.012977 | 0.4478673 | 7.690614 | 9.844672 | 0.5987 | 0.0000 | 10.8 |
| lnGDP | 11.17935 | 0.4549325 | 10.00017 | 12.32313 | 0.2087 | 0.7707 | 1.566 |
| Group 2 | |||||||
| 2.55415 | 0.4826141 | 1.600814 | 4.095598 | 0.0006 | 0.4914 | 12.89 | |
| lnMEX | 1.288087 | 0.6730298 | -3.349606 | 3.106429 | 0.0000 | 0.0000 | 4191 |
| lnIND | 10.19661 | 1.876975 | -9.028168 | 11.39726 | 0.0000 | 0.0000 | 1.2e+05 |
| lnTECH | 6.570333 | 3.551128 | -9.534884 | 9.747418 | 0.0000 | 0.0000 | 2863 |
| lnEC | 8.563366 | 0.3766522 | 7.37726 | 9.703748 | 0.0006 | 0.0120 | 21.55 |
| lnGDP | 9.764018 | 0.5122664 | 8.200723 | 10.78417 | 0.0097 | 0.0038 | 11.63 |
Table 4.
Variance inflation factor.
| Group 1 | Group 2 | |||
|---|---|---|---|---|
| VIF | 1/VIF | VIF | 1/VIF | |
| lnGDP | 6.700 | 0.149 | 1.31 | 0.764756 |
| lnEC | 4.490 | 0.222 | 1.29 | 0.776475 |
| lnIND | 2.570 | 0.389 | 1.21 | 0.824004 |
| lnTECH | 1.750 | 0.570 | 1.14 | 0.873409 |
| lnMEX | 1.550 | 0.644 | 1.07 | 0.932037 |
| Mean VIF | 3.410 | . | 1.21 | . |
| Source: authors’ calculations | ||||
Table 5.
Heterogeneity of slope test.
| Group 1 | Group 2 | |||
|---|---|---|---|---|
| Statistic | Probability | Statistic | Probability | |
| Delta tilde | 16.335*** | 0.000 | 18.646*** | 0.000 |
| Adj. Delta tilde | 18.263*** | 0.000 | 20.847*** | 0.000 |
| Note: *** represent statistical significance at 1% level, respectively Source: authors’ calculations | ||||
Table 6.
Cross-sectional dependency.
| Group 1 | Group 2 | |||
|---|---|---|---|---|
| Statistic | Probability | Statistic | Probability | |
| Pesaran’s test | 6.543*** | 0.0000 | 2.638*** | 0.0083 |
| Friedman’s test | 87.605*** | 0.0000 | 48.971*** | 0.0000 |
| Frees’ test | 1.783*** | 0.0000 | 0.954*** | 0.0000 |
| Note: ***, **, and * represent statistical significance at 1%, 5%, 10% level respectively. Source: authors’ calculations | ||||
Table 7.
Panel unit root test.
| CIPS | CADF | |||||||
|---|---|---|---|---|---|---|---|---|
| Level I (0) |
First Difference I (1) |
Level I (0) |
First Difference I (1) |
|||||
| Constant | Constant & Trend | Constant | Constant & Trend | Constant | Constant & Trend | Constant | Constant & Trend | |
| Group 1 | ||||||||
| -3.126*** | -3.319*** | -4.844*** | -4.937*** | -2.036 | -2.973*** | -3.296*** | -3.292*** | |
| lnMEX | -2.687*** | -2.616 | -5.476*** | -5.601*** | -2.124 | -2.144 | -2.975*** | -3.097*** |
| lnIND | -2.641*** | -3.059*** | -4.747*** | -4.909*** | -1.896 | -2.206 | -2.889*** | -3.007*** |
| lnTECH | -1.737 | -2.053 | -3.891*** | -4.085*** | -1.492 | -1.951 | -2.963*** | -3.169*** |
| lnEC | -1.152 | -2.290 | -5.066*** | -5.348*** | -0.677 | -2.176 | -2.827*** | -3.283*** |
| lnGDP | -2.427** | -3.575 | -3.794*** | -3.759*** | -2.221* | -3.361*** | -3.344*** | -3.271*** |
| Group 2 | ||||||||
| -1.486 | -2.051 | -4.601*** | -4.803*** | -1.241 | -1.905 | -2.260** | -2.256 | |
| lnMEX | -2.836*** | -2.093 | -3.768*** | -4.161*** | -2.726 | -1.995 | -2.095 | -2.506 |
| lnIND | -1.508 | -1.511 | -4.404*** | -4.851*** | -1.485 | -1.257 | -2.571*** | -3.188*** |
| lnTECH | -1.310 | -2.858** | -4.772*** | -4.796*** | -1.257 | -2.454 | -2.992*** | -2.948*** |
| lnEC | -1.290 | -1.789 | -4.595*** | -5.013*** | -1.006 | -1.342 | -2.412** | -2.677* |
| lnGDP | -3.192*** | -3.153*** | -3.233*** | -3.354*** | -2.851*** | -2.609 | -2.310** | -2.426 |
|
Note: ***, **, and * represent statistical significance at 1%, 5%, 10% level respectively Source: authors’ calculations | ||||||||
Table 8.
Pedroni and Kao panel cointegration test.
| Pedroni residual cointegration test | ||||||||
|---|---|---|---|---|---|---|---|---|
| Statistic | Probability | Statistic | Probability | |||||
| Constant | Constant & Trend | Constant | Constant & Trend | Constant | Constant & Trend | Constant | Constant & Trend | |
| Group 1 | Group 2 | |||||||
| Within-dimension | ||||||||
| Panel v-Statistic | 4.727*** | 2.186** | 0.000 | 0.014 | 0.297 | 1.991** | 0.383 | 0.023 |
| Panel rho-Statistic | -2.488*** | -0.542*** | 0.006 | 0.293 | 1.016 | 2.448 | 0.845 | 0.992 |
| Panel PP-Statistic | -10.114*** | -10.124*** | 0.000 | 0.000 | -0.224 | -1.742** | 0.411 | 0.040 |
| Panel ADF-Statistic | -12.980*** | -13.753*** | 0.000 | 0.000 | -0.306 | -3.986*** | 0.379 | 0.000 |
| Between-dimension | ||||||||
| Group rho-Statistic | 2.871 | 3.654 | 0.998 | 0.999 | 2.447 | 3.986 | 0.992 | 1.000 |
| Group PP-Statistic | 1.917 | -0.171 | 0.972 | 0.431 | 0.053 | -3.166*** | 0.521 | 0.000 |
| Group ADF-Statistic | 0.260 | -1.170 | 0.602 | 0.120 | -0,983 | -6.200*** | 0.162 | 0.000 |
| Kao residual cointegration test | ||||||||
| ADF | -26.523*** | 0.000 | -.6.902*** | 0.000 | ||||
| Note: (1) Note: ***, **, and * represent statistical significance at 1%, 5%, and 10% levels, respectively. (2) Schwarz information criteria were used to select the optimal lag lengths. | ||||||||
Table 9.
Parameter estimation of panel ARDL models for Group 1.
| Variables | MG | PMG | DFE | |||
|---|---|---|---|---|---|---|
| Coefficient | Probability | Coefficient | Probability | Coefficient | Probability | |
| Long-run relationship | ||||||
| lnMEX | -0.239454 | 0.347 | 0.1768092*** | 0.000 | 0.1721638*** | 0.005 |
| lnIND | -0.1763105 | 0.541 | -0.1934654*** | 0.000 | -0.1868367*** | 0.003 |
| lnTECH | -0.0854502 | 0.680 | -0.029903*** | 0.003 | 0.077325*** | 0.000 |
| lnEC | 1.340788*** | 0.000 | 1.094479*** | 0.000 | 1.254371*** | 0.000 |
| lnGDP | -0.4819572 | 0.287 | 0.1029753 | 0.210 | -0.0448153 | 0.699 |
| Short-run relationship | ||||||
| EC | 0.2445071*** | 0.005 | 0.1224995 | 0.154 | -0.4640908*** | 0.000 |
| ∆lnMEX | 0.0006244 | 0.990 | -0.0204241 | 0.789 | -0.0340196 | 0.597 |
| ∆lnIND | -0.0455854 | 0.599 | -0.0257829 | 0.756 | -0.1215438* | 0.086 |
| ∆lnTECH | -0.0588707** | 0.021 | -0.0778112** | 0.041 | -0.0295642* | 0.076 |
| ∆lnEC | 0.8429548*** | 0.000 | 0.8848524*** | 0.000 | 0.5832298*** | 0.000 |
| ∆lnGDP | 0.1940896* | 0.065 | 0.3268684** | 0.013 | 0.4576593*** | 0.005 |
| _cons | 0.391473 | 0.477 | 0.6984402 | 0.149 | -3.0758*** | 0.000 |
|
Hausman test (MG or PMG) Hausman test (PMG or DFE) |
chi2(5) = 90.38 chi2(5) = 0.01 |
Prob>chi2 =0.000 Prob>chi2 =1.00 |
||||
|
Note: ***, ** and * represent statistical significance at 1%, 5%, 10% level respectively. Source: authors’ calculations | ||||||
Table 10.
Parameter estimation of panel ARDL models for Group 2.
| Variables | MG | PMG | DFE | |||
|---|---|---|---|---|---|---|
| Coefficient | Probability | Coefficient | Probability | Coefficient | Probability | |
| Long-run relationship | ||||||
| lnMEX | -0.073165 | 0.344 | -0.0258854* | 0.095 | -0.014343 | 0.905 |
| lnIND | -0.6509841 | 0.223 | -0.0342161*** | 0.000 | -0.1193859* | 0.093 |
| lnTECH | -0.0559915 | 0.167 | 0.001171 | 0.577 | 0.0123523 | 0.614 |
| lnEC | 0.6173261 | 0.264 | 1.237353*** | 0.000 | 2.096976*** | 0.003 |
| lnGDP | 0.4541743 | 0.407 | -0.1844376*** | 0.000 | -0.2780919 | 0.197 |
| Short-run relationship | ||||||
| EC | 0.4554397*** | 0.000 | 0.237796*** | 0.002 | 0.0427209 | 0.112 |
| ∆lnMEX | 0.0427715 | 0.313 | 0.0321529** | 0.042 | -0.0428389*** | 0.002 |
| ∆lnIND | 0.1194509** | 0.046 | 0.1646023** | 0.051 | -0.0044866 | 0.212 |
| ∆lnTECH | -0.0191826** | 0.038 | -0.0147227** | 0.016 | -0.0052607** | 0.015 |
| ∆lnEC | 0.82537*** | 0.000 | 0.8540665*** | 0.000 | 0.8844481*** | 0.000 |
| ∆lnGDP | 0.1317669* | 0.096 | 0.12743 | 0.142 | 0.1337392** | 0.024 |
| _cons | 1.873465*** | 0.008 | 1.376883*** | 0.002 | 0.4765038* | 0.053 |
|
Hausman test (MG or PMG) Hausman test (PMG or DFE) |
chi2(5) = 14.03 chi2(5) = 1.51 |
Prob>chi2 =0.0154 Prob>chi2 =0.9114 |
||||
|
Note: ***, ** and * represent statistical significance at 1%, 5%, 10% level respectively.
Source: authors’ calculations | ||||||
Table 11.
Robustness estimates of GMM.
| Variables |
GMM | |
|---|---|---|
| Coefficient | Probability | |
| Group 1 | ||
| lnMEX | 0.1270882 | 0.532 |
| lnIND | -0.1723895 | 0.493 |
| lnTECH | -0.0362646 | 0.413 |
| lnEC | 1.023732*** | 0.000 |
| lnGDP | 0.1070246 | 0.654 |
| _cons | -5.319957*** | 0.007 |
| Wald chi2(5) | 3546.72*** | 0.000 |
|
Arellano-Bond test for AR (2) in first differences: Hansen test of over-identifying restrictions: |
z = 1.12 chi2(34) = 12.76 |
Pr > z = 0.262 Prob > chi2 = 1.000 |
| Group 2 | ||
| lnMEX | 0.1007923 | 0.141 |
| lnIND | -0.0144558 | 0.456 |
| lnTECH | 0.0212856** | 0.013 |
| lnEC | 1.229355*** | 0.000 |
| lnGDP | -0.1306995** | 0.016 |
| _cons | -6.821844*** | 0.000 |
| Wald chi2(5) | 1975.88*** | 0.000 |
|
Arellano-Bond test for AR (2) in first differences: Hansen test of over-identifying restrictions: |
z = -0.57 chi2(34) = 9.49 |
Pr > z = 0.570 Prob > chi2 = 1.000 |
|
Note: ***, ** and * represent statistical significance at 1%, 5%, 10% level respectively.
Source: authors’ calculations | ||
Table 12.
Diagnostic test.
| Statistic | Probability | |
|---|---|---|
| Breusch-Pagan / Cook-Weisberg test for heteroskedasticity | ||
| Group 1 | chi2(1) =0.35 | Prob > chi2=0.5546 |
| Group 2 | chi2(1) =0.83 | Prob > chi2=0.3616 |
| Wooldridge test for autocorrelation test | ||
| Group 1 | F (1, 13) =980.594 | Prob > F =0.0000 |
| Group 2 | F (1, 11) =50.925 | Prob > F =0.0000 |
| Specification error test: Ramsey RESET test | ||
| Group 1 | F (3, 481) =33.37 | Prob > F =0.0000 |
| Group 2 | F (3, 411) =30.18 | Prob > F =0.0000 |
| Source: authors’ calculations | ||
Disclaimer/Publisher’s Note: The statements, opinions and data contained in all publications are solely those of the individual author(s) and contributor(s) and not of MDPI and/or the editor(s). MDPI and/or the editor(s) disclaim responsibility for any injury to people or property resulting from any ideas, methods, instructions or products referred to in the content. |
© 2024 by the authors. Licensee MDPI, Basel, Switzerland. This article is an open access article distributed under the terms and conditions of the Creative Commons Attribution (CC BY) license (http://creativecommons.org/licenses/by/4.0/).
Copyright: This open access article is published under a Creative Commons CC BY 4.0 license, which permit the free download, distribution, and reuse, provided that the author and preprint are cited in any reuse.


