Submitted:
14 May 2024
Posted:
15 May 2024
You are already at the latest version
Abstract
In recent years, the utilization of machine learning algorithms and advancements in Unmanned Aerial Vehicle (UAV) technology have marked significant shifts in remote sensing practices. In particular, the integration of machine learning with physical models and their application in UAV-satellite data fusion have emerged as two prominent approaches for estimating vegetation biochemistry. This study evaluates the performance of five machine learning regression algorithms (MLRAs) for mapping crop canopy chlorophyll at the Kellogg Biological Station (KBS) in Michigan, USA, across three scenarios: (1) application to Landsat 7, RapidEye, and PlanetScope satellite images; (2) application to UAV-satellite data fusion; and (3) integration with the PROSAIL radiative transfer model (hybrid methods PROSAIL + MLRAs). The results indicate that the majority of the five MLRAs utilized in UAV-satellite data fusion perform better than the five PROSAIL + MLRAs. The general trend suggests that the integration of satellite data with UAV-derived information, including the normalized difference red-edge index (NDRE), canopy height model, and leaf area index (LAI), significantly enhances the performance of MLRAs. The UAV-RapidEye dataset exhibits the highest coefficient of determination (R2) and the lowest root-mean-square errors (RMSE) when employing kernel ridge regression (KRR) and Gaussian processes regression (GPR) (R2 = 0.89 and 0.89 and RMSE = 8.99 µg/cm2 and 9.65 µg/cm2, respectively). Similar performance is closely observed for the UAV-Landsat and UAV-PlanetScope datasets (R2 = 0.86 and 0.87 for KRR, respectively). For the hybrid models, maximum performance is attained with Landsat data using KRR and GPR (R2 = 0.77 and 0.51 and RMSE = 33.10 µg/cm2 and 42.91 µg/cm2, respectively), followed by R2 = 0.75 and RMSE = 39.78 µg/cm2 for PlanetScope data upon integrating partial least squares regression (PLSR) into the hybrid model. Across all hybrid models, RapidEye data yielded the most stable performance, with R2 ranging from 0.45 to 0.71 and RMSE ranging from 19.16 µg/cm2 to 33.07 µg/cm2. The study highlights the importance of synergizing UAV and satellite data which enables effective monitoring of canopy chlorophyll in small agricultural lands.
Keywords:
hybrid model
; radiative transfer model
; machine learning
; data fusion
; multispectral sensors
; unmanned aerial vehicle
1. Introduction
Leaf chlorophyll, an essential element of the photosynthetic system in crops, has long been recognized as one of the leaf pigments most responsive to external conditions. It serves as a primary indicator of plant health and productivity, influencing photosynthesis, nutrient uptake, and stress responses [1]. Two instrumental approaches facilitate the estimation of canopy chlorophyll derived from remote sensing data: (1) integration and inversion of radiative transfer models (RTMs), and (2) statistical (machine learning) regression methods. In recent years, a synthesis of RTMs and machine learning statistical methods emerged as a promising pathway in capturing the complexities of canopy chlorophyll estimation while leveraging both physical principles and model flexibility [2,3].
The integration of leaf and canopy RTMs has been prevalent for several decades [4,5,6,7,8]. While the leaf RTMs simulate the optical properties of leaves based on their biochemical constituents, such as chlorophyll, carotenoids, and leaf structure parameters [9,10], the canopy RTMs simulate the interactions between electromagnetic radiation and vegetation canopies considering canopy architecture factors like leaf angle distribution, leaf area index, and soil background [11,12]. This integration allows for a more comprehensive representation of vegetation reflectance by accounting for both the biochemical composition of individual leaves and the structural characteristics of the canopy. The PROSAIL model, is one of the most widely used integrated RTMs that combines the leaf-level optical properties simulated by the PROSPECT model [13,14,15] with the canopy-level interactions modeled by the SAIL (Scattering by Arbitrarily Inclined Leaves) model [16,17,18]. By combining these two models, the PROSAIL model can simulate the spectral reflectance of vegetation canopies with greater accuracy and realism. Over the years, advancements in understanding the optical properties of leaves and canopies have led to refinements in the model's algorithms and parameterizations. These improvements include incorporating more realistic representations of canopy architecture, leaf angle distribution, and soil background characteristics for SAIL [4,16,19,20,21] and enhancements in handling pigments and incorporating additional biochemical components for PROSPECT [22,23]. Developed by Verhoef and Bach in the early 2000s [21], the 4SAIL (4-scale SAIL) model introduced additional complexity by incorporating horizontal and vertical heterogeneities of canopy into the simulation. The latest leaf model version, the PROSPECT-PRO model, was developed by Feret et al. [24], which could separate the nitrogen-based constituents (proteins) from carbon-based constituents and estimate leaf mass per area as the sum of proteins and carbon-based constituents. This increased complexity allows for a more detailed and realistic representation of canopy structure and improves the accuracy of forward (reflectance) simulations, particularly in dense and heterogeneous canopies [25,26].
The inversion of RTMs plays a crucial role in extracting meaningful information from remote sensing data and deriving canopy and leaf chlorophyll content [27,28]. Inversion techniques of RTMs commonly utilize look-up table (LUT) approaches [7,29,30,31,32], and machine learning methods such as artificial neural network [33,34]. The efficacy of LUT and neural network methods hinges on the training process and a database containing canopy biophysical properties and corresponding canopy reflectance spectra, including parameters like leaf chlorophyll content and leaf area index [35]. In contrast, the iterative optimization approach allows for direct retrieval of biophysical parameters from observed reflectance, bypassing the need for training data, albeit with the drawback of high computational requirements [36]. The ill-posed nature of problems within RTMs underscores the importance of carefully selecting initial parameter values and incorporating regularization techniques in the inverse process [37,38].
Statistical modeling of chlorophyll content can involve simple techniques such as a linear regression equation or more sophisticated approaches utilizing machine learning regression algorithms (MLRAs), which excel at identifying patterns in remote sensing data and are particularly effective when dealing with complex, nonlinear relationships. MLRAs such as decision trees, support vector machines, or neural networks are trained on the extracted features from remote sensing data and corresponding chlorophyll measurements. In recent times, data fusion techniques are gaining popularity in improving the accuracy of estimating chlorophyll content. By merging data from multiple sources, data fusion techniques help overcome the limitations of individual data sources and provide a more comprehensive and accurate estimation of chlorophyll content [39,40]. By integrating data from multiple sources and leveraging the power of machine learning, regression models applied to data fusion offer a robust and efficient approach for retrieving chlorophyll content in vegetation [41,42]. Once trained, the models can be applied to new remote sensing data, enabling comprehensive mapping, and monitoring of chlorophyll distribution in vegetation across various ecosystems. The advancement of unmanned aerial vehicle (UAV) technology has ushered in a new era in remote sensing, enhancing the modeling process through the synergy between very high spatial resolution UAV data and satellite images. However, the integration of satellite data with UAV-derived information still requires formalization and evaluation across various research studies and at different levels such as ‘data comparison’, ‘multiscale explanation’, ‘model calibration’, and ‘data fusion’ [43]. According to Alvarez-Vanhard et al. [43], two-thirds of UAV-satellite data fusion publications are related to enhancing satellite spatial resolution by incorporating very high spatial resolution information from UAVs. While studies related to the retrieval of canopy chlorophyl content commonly utilize multispectral, hyperspectral satellite or UAV imagery [44,45], UAV-satellite data fusion has been emerging slowly [40,46,47] and the scientific literature yet must demonstrate how and to what extent UAV information can enhance different satellite data. It is worth noting that while RTMs offer a more detailed understanding but are often computationally intensive, empirical models are site-specific and lack a physical interpretation of spectral interactions with vegetation [48,49].
In this study, the aim is to assess and contrast the effectiveness of multiple MLRAs when utilized with UAV-satellite fused data or integrated within the hybrid RTMs (PROSAIL + MLRAs), as outlined by Verrelst et al. [38,50]. The performances of five MLRAs for mapping crop canopy chlorophyl are quantified over the Kellogg Biological Station in Michigan, USA, in three scenarios: (1) applied to Landsat 7, RapidEye, and PlanetScope images; (2) applied to UAV-satellite fused data; and (3) integrated within the PROSAIL radiative transfer model (hybrid methods PROSAIL + MLRAs). The five MLRAs include: kernel ridge regression (KRR), least squares linear regression (LSLR), partial least squares regression (PLSR), Gaussian processes regression (GPR), and neural network (NN). It is anticipated that this study will attract increasing research interest in the future development of the synthesis of data-driven machine learning methods and RTMs, with an emphasis on data fusion.
2. Data and Methods
2.1. Study Area
The study site is located within the Kellogg Biological Station (KBS) in south-western Michigan, USA (Figure 1). KBS includes a diverse range of ecosystems such as agricultural lands, wetlands, forests, and lakes. Since the 1980s, the area has undergone continuous monitoring, offering invaluable long-term data on agricultural, hydrological, and meteorological processes in the region. The study site (42°24'32.3"N, 85°22'23.8"W) covers a farmland area of approximately 800 x 1000 m (Figure 1). The site is maintained through the Main Cropping System Experiment (MCSE) of the Long-Term Ecological Research (LTER) program, which is a part of a nationwide network of LTER sites established by the National Science Foundation [51,52]. The KBS MCSE site is well-known for its rotational cultivation of corn, soybean, and wheat using different chemical and soil management treatments. In 2017, when the current study was conducted, the main crop was corn. Twenty-four parcels of corn were randomly distributed and placed among the parcels of alfalfa, early successional community, and young poplar trees.
The corn parcels, each with an approximate size of one hectare (87 x 105 m), have been grown under four agricultural treatments (T1-T4), each with 6 replicates (R1-R6) (Figure 1). The conventional tillage (T1) and no-tillage (T2) treatments receive conventional levels of chemical inputs. The reduced input (T3) treatment is a biologically based treatment with a low-chemical input. The certified organic (T4) treatment receives no chemical inputs, and it is rotary hoed for weed control.
MCSE soils are well-drained Alfisol loams of the Kalamazoo series (fine-loamy, mixed, mesic Typic Hapludalfs) mixed with well-drained loams of the Oshtemo series (coarse-loamy, mixed, mesic Typic Hapludalfs), as described by Robertson et al. [51]. The study area has a humid continental climate with warm summers and cold winters.
2.2. Field and Satellite Data
Field data, leaf chlorophyll content and leaf area measurements, were collected on 11 August 2017. Leaf chlorophyl measurements were collected at three randomly chosen locations at each parcel with the Konica Minolta Chlorophyll Meter SPAD-502Plus. The meter has an accuracy of ± 1 SPAD unit [53]. The measurements were taken over several leaves at each location, at various positions within each leaf and from top and middle parts of plants, as expected to be seen by the sensors. The sampling locations were approximately 10–15 m apart and positioned as a triangle around the center of each parcel to avoid any negative impact from the edge effect and mini-plots placed at some corners of the parcels. Digital hemispherical photographs were taken using a Canon EOS Rebel T5 digital SLR 18.7-megapixel camera with the Sigma 8 mm F3.5 EX DG Circular Fisheye lens at each location and used to derive leaf area index (LAI). At each location, the set of measurements were collected within a radius of 5 m. The photographs were processed using the Can-Eye software package [54].
The eBee AG Sensefly UAV and the Sequoia camera were used to collect UAV spectral information over KBS on 11 August 2017 (Figure 2) [55]. Lateral and longitudinal overlap was set to 75%, and spatial resolution/ground sampling distance was ~13 cm. The reflectance images were created for each green (530–570 nm), red (640–680 nm), red-edge (RE) (730–740 nm), and near-infrared (NIR) (770–810 nm) band (for more information on UAV data collection and processing see [55]) (Figure 2).
Landsat 7 and PlanetScope images were acquired on 8 August 2017, while RapidEye imagery was obtained on 9 August 2017 (Figure 2; Table 1). It is worth noting that five bands, including the RE band, were available within the RapidEye dataset. The Landsat dataset was equipped with six bands within the visible (VIS), NIR, and shortwave (SWIR) range, whereas the PlanetScope dataset contained four bands within the VIS and NIR spectral range. Spatial resolution varied among the datasets, with Landsat images having a resolution of 30 m, and RapidEye and PlanetScope images having relatively similar resolutions of 5 m and 3.125 m, respectively. Unfortunately, cloud-free Landsat 8 or Sentinel-2 datasets for this period were not available.
2.3. Methods and Models
Five machine learning regression algorithms (MLRAs) were employed across three scenarios to assess their performance in estimating canopy chlorophyll content (CCC): (1) application to Landsat 7, RapidEye, and PlanetScope images; (2) application to UAV-satellite fused data; and (3) integration within the hybrid radiative transfer model PROSAIL + MLRAs (Figure 3). The study also evaluated the impact of the different spatial and spectral characteristics of Landsat 7, RapidEye, and PlanetScope datasets on each method. The five MLRAs utilized in this study were kernel ridge regression (KRR), least squares linear regression (LSLR), partial least squares regression (PLSR), Gaussian processes regression (GPR), and neural network (NN). The fundamental advantages and disadvantages of these MLRAs are outlined in Table 2.
In the first scenario, reflectance values were extracted from each satellite images in ENVI 5.6 software [62] and paired with the measured CCC values, calculated as the product of leaf chlorophyll content and LAI, to form the training dataset for each MLRAs. In the second scenario, application to UAV-satellite fused data, the training data included extracted values from satellite imagery and from three UAV-derived products: NDRE index, LAI, and crop height model [55], which were spatially resampled and geo-registered before they were integrated with the satellite information. Additionally, nine non-vegetated spectra (pixels from bare soil, roads, water bodies) were added to the training dataset to enhance the accuracy of MLRAs. The 3-fold cross-validation method was employed to determine their accuracies.
In the third scenario, the hybrid methods integrated PROSAIL RTM and each MLRA, all implemented within the ARTMO toolbox [63,64]. PROSAIL used in this study combines PROSPECT-PRO RTM that operates at the leaf level [24] incorporated in 4SAIL, a canopy RTM [16]. The model can simulate the bidirectional reflectance of the canopy across the spectrum from 400 to 2500 nm. RTM incorporates various biochemical input parameters, such as pigments, proteins, and water content, along with biophysical input parameters like LAI, average leaf inclination angle, spectral soil background, and viewing geometries [2,20,65].
PROSAIL creates training databases of vegetation properties and simulates their spectral signals via LUT, a reliable physically based inversion technique [32]. In Table 3, the input parameters of PROSAIL RTM are listed. Among the parameters, LAI and leaf chlorophyll content were determined based on in-situ measurements, while diffuse/direct radiation was set to the default value provided by the ARTMO toolbox [64]. The remaining parameters were established using references from the literature (Table 3). The Latin hypercube sampling method [66] was employed and 500 simulations were selected to train each MLRA to facilitates avoidance of data redundancy while increasing computation speed for further analysis [67]. The simulations were resampled to match the 6 bands of Landsat 7, 5 bands of RapidEye, 4 bands of PlanetScope, and 4 bands of UAV using the spectral bandwidth and response function unique to each sensor. The active learning (AL) strategy was employed to optimize the model by selecting the best samples from the simulations, which used the Euclidean distance-based diversity (EBD) sampling approach [60] and GPR machine learning regression algorithm [60]. AL is based on intelligent sampling, which optimizes the selection of training datasets from LUTs and increase the accuracy of the regression algorithms [60,68]. The hybrid model was executed with each MLRA using satellite imagery: Landsat 7, RapidEye, PlanetScope, as well as the UAV image.
CCC maps were generated as output for each of the three scenarios for every MLRA. Subsequently, the estimated and measured CCC values were correlated and compared for each model [70]. The effectiveness of each model in predicting CCC were reported and compared.
3. Results
The five MLRAs applied to satellite images (‘without-fusion’ scenario) demonstrate relatively strong performance for RapidEye and PlanetScope (maximum coefficient of determination R2 = 0.62 and R2 = 0.53, respectively, for GPR), but considerably poorer performance for Landsat 7 (maximum R2 = 0.30 for GPR) (Table 4), although the root mean square error and normalized root mean square error (RMSE = 22.28 µg/cm2 and NRMSE = 24.96 %, respectively) are relatively low for GPR and similar to other datasets. Other models applied to Landsat 7 such as LSLR (RMSE = 158.53 µg/cm2, NMRSE = 177.56%) and PLSR (RMSE = 153.76 µg/cm2, NMRSE = 172.22%) demonstrate exceptionally high error values. Overall, GPR emerges as the most effective method among the five algorithms for all three satellite images. The finer spatial resolution of RapidEye and PlanetScope images positively influences the outcomes of regression modeling for most of algorithms, particularly for GPR. The superior performance observed for RapidEye can be attributed to the presence of the red edge band, which is known to be a reliable predictor of chlorophyll content. This underscores the significance of both spectral and spatial properties of satellite data within this method, such as those provided by RapidEye and PlanetScope images.
Combining UAV information (NDRE, LAI and canopy height model) with satellite data yields considerably improved performance across almost all five MLRAs across all satellite images. Particularly noteworthy is the significant enhancement observed for UAV-Landsat 7, where R2 values increase substantially for all five models, with best performing KRR, which achieves its maximum value of R2 = 0.86 (up from R2 = 0.23 in the ‘without-fusion’ scenario). Also, the GPR model demonstrates significant improvement, with its R2 increasing from 0.30 to 0.85 when UAV information is integrated with Landsat 7 dataset. Similarly, for PlanetScope, the data fusion significantly enhances the performance of MLRAs, with KRR and GPR reaching an R2 of 0.87 and 0.83, respectively (up from R2 = 0.37 and 0.53, in the ‘without-fusion’ scenario, respectively). The UAV- RapidEye dataset reaches the best results with the maximum values of R2 = 0.89 for both KRR and GPR, compared to its previous R2 of 0.45 and 0.62, respectively. KRR and GPR consistently emerge as the most effective predictors across images, demonstrating comparatively low RMSE and NRMSE. While the integration of UAV information significantly enhances the performance of NN for all three satellites, LSLR and PLSR do not demonstrate any trends. Overall, the results for the data fusion scenario are consistent regardless of the spatial and spectral resolution of the imagery. Although the red-edge band may contribute the most to the optimal results in the UAV-RapidEye scenario, the observed differences across models are not significant or uniformly improved.
The performances of the hybrid models (PROSAIL + MLRAs) exhibit generally higher R2 values for all three satellite images compared to the empirical MLRA methods for the ‘without-fusion’ scenario. However, the performance is lower for most of the models across all datasets for the ‘with-fusion’ scenario. For instance, GPR shows only a slight improvement for the hybrid models employing RapidEye (R2 = 0.66) when compared to the ‘without fusion’ scenario (R2 = 0.62), while it performs worse for the ‘with-fusion’ scenario (R2 = 0.89). KRR and GPR are best models for Landsat data (R2 = 0.77 and 0.51, respectively; RMSE = 33.10 µg/cm2 and 42.92 µg/cm2, respectively). LSLR and PLSR reach their maximum performance for the data of finer spatial resolution (RapidEye and PlanetScope) within the hybrid model (e.i., PROSAIL + PLSR: R2 = 0.71 and 0.75, for RapidEye and PlanetScope, respectively).
Despite the careful parametrization of the PROSAIL model, the RMSE and NRMSE values for most models are exceedingly high across all runs using Landsat 7 (RMSE = 33.10-148.72 µg/cm2) and PlanetScope (RMSE = 37.36-148.72 µg/cm2) imagery. Notably, only the RapidEye-based hybrid models exhibit insignificantly different errors, with the maximum RMSE value of 33.07 µg/cm2. While the Landsat 7- and PlanetScope-based hybrid models achieve higher R2 values for KRR and PLSR, respectively, the RapidEye-based hybrid models emerge as the most stable option, demonstrating high R2 values and the lowest error values across all PROSAIL + MLRAs.
The Landsat-based CCC maps over the study site appear fuzzier compared to maps produced with RapidEye and PlanetScope data (Figure 4) due to their coarser spatial resolution. Notably, the UAV-RapidEye data fusion approach exhibits the largest range of the estimated CCC values but has the correlation coefficient R = 0.94 when compared with the field measured CCC (Figure 5). Among the three models, the ‘with-fusion’ scenario demonstrates the highest correlation coefficient between measured and estimated CCC values (R = 0.93 from Landsat and PlanetScope, and R = 0.94 for RapidEye) (Figure 5).
There is a considerable improvement between estimated and measured CCC values from the ‘without-fusion’ to ‘with-fusion’ scenario, increasing from R = 0.55 to R = 0.93 using the best-performing MLRAs for Landsat data. The RapidEye-based empirical models demonstrate the highest R values when compared with other satellites (R = 0.79 and R = 0.94 for the ‘without-fusion’ and ‘with-fusion’ scenario, respectively) but slightly lower value within the hybrid modeling than two other satellites (R = 0.81 for RapidEye vs. R = 0.88 for Landsat and R = 0.86 for PlanetScope). The Landsat-based hybrid model achieves the highest R value of 0.88; however, the estimated CCC values are slightly underestimated. In contrary, the estimated CCC are highly overestimated for PlanetScope imagery (Figure 5).
The models were also run on the single UAV image to explore the performance of the models on a very fine resolution image, potentially serving as a reference point (Table 5). The MLRAs method applied to the UAV bands achieves best performance with LSLR, PLSR and KRR (R2 = 0.74, 0.73, and 0.72, respectively). The addition of the NDRE, LAI, and height model to the UAV bands considerably improves the performance of all MLRAs reaching R2 = 0.92 for KRR. The hybrid model did not perform well for most of MLRAs. The highest R2 is reached with KRR (R2 = 0.25). Overall, all empirical MLRAs generally perform well in both with- and without-fusion scenarios. The similar trend is observed when the estimated and measured CCC values are compared for the UAV image while reaching its best R value for the ‘with-fusion’ scenario (R = 0.96) (Figure 6).
4. Discussion
4.1. Empirical Modeling Using MRLAs
The primary focus of this study has been to contrast data-fusion versus hybrid approaches for small agricultural land. In this context, data fusion involves integrating commonly used UAV-derived products, while the hybrid modeling exclusively utilizes satellite bands. The findings affirm the significance of fusing UAV-satellite data for retrieving canopy chlorophyll content in crops. The 'with-fusion' empirical MLRAs exhibit notably superior performance compared to other modeling scenarios, including the 'without-fusion' empirical MLRAs approach and hybrid models (PROSAIL + MLRAs). With the highest R2 values (max R2 = 0.89) and the lowest RMSE (RMSE = 9.65 µg/cm2), this approach demonstrates stability with minimal performance variability among the five MLRAs. Two MLRAs, GPR and KRR, stand out for their strong and consistent performances: GPR excels as the best-performing model for the 'without-fusion' scenario across all three satellites, while KRR leads as the best-performing model for the 'with-fusion' empirical scenarios across all three UAV-satellite combinations. Another noticeable trend is the significant improvement in the performance of NN within the data fusion scenario for all satellites. The incorporation of NDRE bands likely contributed to NN's enhanced ability to estimate chlorophyll values regardless of the spatial resolution of satellite images.
Although the concept is underexplored, several studies in the agriculture or precision agriculture fields demonstrate the benefits of using machine learning techniques in combination with UAVs or the synergies between UAVs and satellites to effectively explore the impact of multiscale phenomena [43]. Random forest and support vector machine are some of commonly used MLRAs in various agriculture related studies showing the advantages of using UAV imagery or data fusion of UAV and satellite data such as Seninel-2 [71,72] or Worldview-2/3 [41]. Singhal et al. [71], who utilized UAV imagery to estimate leaf chlorophyll, praised KRR as the top performing MLRA among those tested, surpassing GPR. Similarly, Zhou et al. [73] compared multiple MLRAs, including KRR and GPR, and concluded that KRR excelled, particularly when working with high resolution UAV sensors data. Wang et al. [74] used UAV hyperspectral data to retrieve CCC and found that the backward propagation neutral network worked better than support vector machine and PLSR, praising the incorporation of the RE-related parameters in the modeling. On the other hand, Maimaitijiang et al. [41] suggested that random forest regression outperformed PLSR, support vector machine, and extreme learning regression with a newly proposed activation function.
Based on our observations and a quick sensitivity analysis, two major properties of the UAV images significantly contribute to the robust results of the 'with-fusion' empirical modeling. Firstly, the very high spatial resolution of UAV imagery enables the detailed and precise capture of vegetation characteristics. Secondly, the inclusion of NDRE proves valuable for detecting subtle changes in chlorophyll content, leveraging the specific absorption properties of chlorophyll in the red-edge region [75,76]. Additionally, it is noted that the UAV-derived canopy height model effectively distinguishes corn parcels from other crops and vegetation types such as poplar trees, grass, and alfalfa. Although the primary goal of this study has not been to map the differences between the four treatments (T1-T4, as described in the Study Site section), most of the models using RapidEye and PlanetScope imagery generally distinguish parcels with different treatments. This is especially evident in the case of T4 (organic) parcels with minimal or no chemical inputs (see Figure 1, Figure 2, and Figure 4). In both 'with-fusion' modeling and modeling using solely UAV imagery, LAI emerges as a pivotal input parameter. Its inclusion significantly boosts the regression power of all models and bolsters the correlation between estimated and measured CCC. This observation is consistent with the findings of Simic Milas et al. [55], who underscored the importance of LAI, particularly when combined with UAV-derived biochemical parameters, in CCC estimation. Consequently, incorporating canopy structural parameters into the process of upscaling UAV measurements to the satellite level for CCC monitoring is imperative, especially across heterogeneous fields, as demonstrated in our study. A similar beneficial approach of integrating UAV-derived canopy structural information with satellite reflectance data was highlighted by [41].
Interestingly, while the 'without-fusion' scenario suggests generally more sensitivity to the spatial and spectral resolution of satellite data—with Landsat-based models exhibiting the least powerful and RapidEye showing the most powerful predictive capabilities for most of the models—this trend is mitigated within the 'with-fusion' scenario. It is surmised that very high spatial resolution UAV imagery helps overcome, or at least minimizes, the gap between in-situ and satellite reflectance measurements. Overall, the integration of UAV information with satellite imagery has been shown to enhance the accuracy of analyses [41,43]. Consequently, the ongoing advancement of UAV technology is expected to further bolster the synergistic approach between UAVs and satellites, bridging the gap between sensor capacities and potentially replacing the need for in-situ measurements.
4.2. Hybrid Models (PROSAIL + MRLAs)
The PROSAIL model has been a cornerstone in remote sensing research for more than three decades, owing to its ability to account for both spectral and structural characteristics of canopies based on leaf-level biochemistry [20,65]. However, the findings of this study suggest that the performance of the hybrid models is strongly influenced by the choice of MLRA used in conjunction with PROSAIL, as well as their capacity to handle the spatial and spectral resolution of the input satellite data.
Although PROSAIL + KRR demonstrates the highest R2 for Landsat data (R2 = 0.77), followed by PROSAIL + LSLR/PLSR for PlanetScope image (R2 = 0.75), the hybrid models exhibit their best overall performance with RapidEye data. Across all MLRAs, RapidEye data display relatively high R2 and relatively low errors (max R2 = 0.71, RMSE = 19.16 µg/cm2). The RapidEye dataset features a high spatial resolution of 5 m, slightly surpassing PlanetScope (3.125 m) but significantly finer than Landsat data (30 m). Additionally, RapidEye incorporates the RE band, absent in PlanetScope. The combination of spectral and spatial information from RapidEye is anticipated to enhance the stability of the hybrid models, as evidenced by both R2 and RMSE/NRMSE values. Similar to the 'with-fusion' empirical modeling, the hybrid model with RapidEye demonstrates minimal performance variability among the five MLRAs.
As briefly mentioned above, the RE band is widely recognized for its sensitivity to changes in chlorophyll content [71,77,78]. Over time, numerous RE chlorophyll indices have been developed and documented in the literature, enhancing spectral data for both canopy chlorophyll content, such as the Canopy Chlorophyll Content Index [79,80], and leaf chlorophyll content, including the Chlorophyll Index – Red Edge (CLRE) [81], NDRE [82], and Chlorophyll Sensitive Index (CSI) [83].
When considering both R2 and error values as criteria for comparison, KRR demonstrates strong performance for both Landsat 7 and RapidEye data, generally followed by GPR. Both KRR and GPR excel particularly well with datasets containing more abundant spectral information or bands, such as Landsat 7 and RapidEye. Despite their differing mathematical formulations, both KRR and GPR are kernel-based methods. They rely on kernel functions to compute similarities between pairs of data points in a high-dimensional feature space. This characteristic allows them to capture non-linear relationships between input features and output variables, enabling them to model complex data relationships effectively. Furthermore, both methods incorporate regularization techniques to prevent overfitting, thereby enhancing generalization performance on unseen data [56,59].
Several studies have suggested that integrating PROSAIL with GPR yields robust performance in hybrid models. For instance, Guo et al. [2] found that integrating PROSAIL with GRP alongside an AL strategy enhanced model performance (from R2 = 0.57 to R2 = 0.74 and RMSE from 5.60 to 3.96 when applied to Sentinel-2 imagery). GPR is a potent nonparametric probabilistic algorithm [59] that requires a relatively small amount of training data to establish relationships between spectra and parameters, corresponding to the number of simulations generated by the PROSAIL model. Active Learning (AL)-based optimized training datasets are better suited to real-world scenarios as they are queried against in-situ data. GPR trained with AL-based optimized datasets results in higher retrieval certainties compared to the training method with a full dataset [69]. Furthermore, GPR does not necessitate large training datasets, and it generates uncertainties in chlorophyll content estimates [50].
LSLR and PLSR demonstrate superior results in this study for RapidEye and PlanetScope data compared to Landsat data, where both methods performed poorly. It is hypothesized that these two statistical approaches work significantly better for fine spatial resolution data, a phenomenon also observed in the "without-fusion" empirical modeling. When dealing with fine spatial resolution data, both LSLR and PLSR can offer advantages, although they operate differently and may be better suited for different aspects of analysis [84,85]. They are both linear regression techniques that are simple to implement; however, PLSR addresses multicollinearity in a better way and aims to achieve both prediction accuracy and dimensionality reduction simultaneously, while LSLR primarily focuses on predicting the response variable accurately [57,58]. LSLR works well when there's little collinearity among predictors and the relationship between predictors and the response can be accurately modeled with a linear equation. In the current study, there was no significant difference between the results yielded by LSLR and PLSR for each satellite. Similarly, to LSLR/PLSR, NN performed weakly for Landsat data but considerably better for RapidEye data, suggesting the possible importance of the RE band for this model. However, unlike PLSR and LSLR, NN is commonly used in remote sensing for predicting vegetation parameters and crop yields [86,87]. Nevertheless, it inevitably faces overfitting issues [85]. Additionally, the design parameters and implementation of NN involve complex and time-consuming processes, and its performance can be compromised when dealing with low-dimensional datasets [88].
Regarding the spectral and spatial resolution of the input data, the study of Guo et al. [2] revealed that the PROSAIL + GPR model performed better with Planet data compared to 4-band Sentinel-2 data but not as well as 10-band Sentinel-2 imagery. In this study, the same model performs better for Landsat than for PlanetScope. However, the best performance with RapidEye underscores the importance of red-edge information in the hybrid models’ performance, as explained above. This coincides with the findings of Guo et al. [2].
The hybrid models PROSAIL + MLRAs have performed better than the empirical machine learning methods applied to satellite data in our study area, but it has not outperformed the UAV data fusion technique. The hybrid model is generally used for a bigger study area where there is much heterogeneity in the surface available [38]. The wide range of simulated training data of hybrid model helps the regression algorithms to predict various surfaces apart from only crops. However, for small agricultural fields, simple machine learning and data fusion techniques are preferable for higher overall accuracy and lower uncertainty.
4.3. Uncertainties
One of the main irregularities that may impact the results of this study is related to the process of UAV-satellite data fusion. As explained earlier, the UAV-generated products were properly resampled, geo-registered and combined within the satellite data. However, a better approach must be utilized, especially for the UAV-Landsat data integration, as the difference between the two spatial resolutions is large (30 m vs. 0.13 m) [72]. The process of geo-registration between satellite and UAV data is a challenging task and may add to the uncertainties. Although physically based models, as opposed to empirical statistical models, can offer more general and in-depth estimates of biochemical variables, their proper parameterization is critical to correctly simulate remote sensing information used as a reference for model calibration. Some predictive uncertainties of the hybrid models can be attributed to uncertainties in the model parameterization. This could be investigated by employing Prior Networks (PNs), which utilize a unique approach to generate uncertainties in model performance. Unlike traditional methods that focus on the model itself or the training data, PNs concentrate on understanding uncertainty arising from disparities between the data the model was trained on and the new data it encounters. This methodology is advantageous because it assists the model in distinguishing between uncertainty stemming from unfamiliar data and uncertainty regarding its own settings [89]. For this study, Landsat 7 data was used for building the model and comparing the performances with satellites with higher spatial resolution. Landsat 8 or Sentinel 2 could have been used for this purpose, but the higher cloud coverage of those images at the study time hindered us from choosing those satellites.
In summary, integrating UAV data with data fusion techniques and machine learning algorithms provides a potent method for improving chlorophyll retrieval accuracy. This involves merging high-resolution UAV imagery with complementary satellite data and utilizing advanced machine learning techniques. Such integration enables researchers to gain more precise insights into chlorophyll distribution within vegetation, thereby enhancing our understanding of plant health, productivity, and environmental dynamics. The increasing adoption of UAVs in remote sensing applications is due to their outstanding spatial resolution capabilities, versatility, and adaptability in data acquisition. This was reaffirmed by employing solely UAV data in all three scenarios in this study. While the results of empirical modeling using UAV data alone demonstrate strong performance when based on UAV bands (including the red-edge band), the incorporation of additional information (such as NDRE, LAI, and canopy height model) significantly enhances the performance of all MLRAs for the UAV image. Another advantage of UAV-satellite data fusion is observed in its ability to neutralize the impact of spatial and spectral resolution of satellite data on the performance of the models.
The primary message of this study is not to advocate for MLRAs over UAV-satellite data, but rather to emphasize the importance of enhancing the integration of UAV-satellite data fusion within the hybrid models. RTM indeed play a crucial role in estimating chlorophyll content using remote sensing data, including both UAV and satellite imagery. RTMs allow sensitivity analysis to understand the influence of various factors, such as leaf biochemical content, canopy structure, and atmospheric conditions, on the observed spectral signals and chlorophyll estimation accuracy. Overall, RTMs are indispensable tools for understanding the physical principles underlying remote sensing observations and for developing accurate and robust methods for estimating chlorophyll content in vegetation using UAV and satellite data. [26]
5. Conclusions
This study evaluated the performance of five machine learning regression algorithms (MLRAs) for mapping crop canopy chlorophyll content (CCC) at the Kellogg Biological Station (KBS) in Michigan, USA, across three scenarios: (1) application to Landsat 7, RapidEye, and PlanetScope images; (2) application to UAV-satellite data fusion; and (3) integration within the hybrid radiative transfer model (PROSAIL + MLRAs). The five MLRAs included: kernel ridge regression (KRR), least squares linear regression (LSLR), partial least squares regression (PLSR), Gaussian processes regression (GPR), and neural network (NN). The research also investigated the impact of different spatial and spectral resolutions of satellite data on the performances of the five MLRAs. Based on the results obtained, the following overall conclusions were drawn:
- The five MLRAs applied to UAV-satellite data fusion outperformed their application to satellite bands or integration within hybrid models (PROSAIL + MLRAs) in small agricultural areas such as KBS.
- UAV-satellite data fusion neutralized and mitigated the impact of spatial and spectral resolution of satellite imagery on MLRAs' performance.
- The red-edge-related information of RapidEye proved advantageous for all models across all three study scenarios, contributing to the stability of the models with minimal performance variability.
- Leaf area index (LAI) emerged as a critical parameter, necessitating incorporation with UAV-derived products in estimating biochemical parameters.
- The choice of MLRAs significantly influenced the performance of the hybrid models (PROSAIL + MLRAs).
- GPR and KRR emerged as standout models, demonstrating strong performance across various scenarios.
The study emphasizes the crucial role of integrating both UAV and satellite data to optimize the utilization of MLRAs for mapping canopy chlorophyll content in small agricultural areas. It provides valuable insights for further advancement in hybrid model development.
Author Contributions
Conceptualization, M.M.T.A. and A.S.M.; methodology, M.M.T.A.; software, M.M.T.A.; validation, M.M.T.A. and A.S.M.; formal analysis, M.M.T.A.; resources, M.M.T.A. and M.G.; data curation, M.M.T.A.; writing—original draft preparation, M.M.T.A. and A.S.M.; writing—review and editing, M.M.T.A., H.P.O., and A.S.M.; visualization, M.M.T.A. and H.P.O; supervision, A.S.M. and M.G.; project administration, A.S.M. All authors have read and agreed to the published version of the manuscript.
Funding
This research was funded by AmericaView/USGS grant number AV23-OH-01.
Data Availability Statement
Landsat 7 data were provided by the U.S. Geological Survey (USGS, https://earthexplorer.usgs.gov/, accessed on 5 June 2023). RapidEYE and PlanetScope data were provided by the Planet Developer Center (https://developers.planet.com/docs/planetschool/downloading-imagery-with-data-api/, accessed on 5 June 2023). Field data and UAV data are not publicly available for ongoing research.
Acknowledgments
Support for this research was provided by the NSF Long-term Ecological Research Program (DEB 2224712) at the Kellogg Biological Station and by Michigan State University AgBioResearch.
Conflicts of Interest
The authors declare no conflicts of interest.
References
- Chakhvashvili, E.; Siegmann, B.; Muller, O.; Verrelst, J.; Bendig, J.; Kraska, T.; Rascher, U. Retrieval of Crop Variables from Proximal Multispectral UAV Image Data Using PROSAIL in Maize Canopy. Remote sensing 2022, 14, 1247. [Google Scholar] [CrossRef] [PubMed]
- Guo, A.; Ye, H.; Li, G.; Zhang, B.; Huang, W.; Jiao, Q.; Qian, B.; Luo, P. Evaluation of Hybrid Models for Maize Chlorophyll Retrieval Using Medium-and High-Spatial-Resolution Satellite Images. Remote Sensing 2023, 15, 1784. [Google Scholar] [CrossRef]
- Tagliabue, G.; Boschetti, M.; Bramati, G.; Candiani, G.; Colombo, R.; Nutini, F.; Pompilio, L.; Rivera-Caicedo, J. P.; Rossi, M.; Rossini, M.; Verrelst, J.; Panigada, C. Hybrid Retrieval of Crop Traits from Multi-Temporal PRISMA Hyperspectral Imagery. ISPRS Journal of Photogrammetry and Remote Sensing 2022, 187, 362–377. [Google Scholar] [CrossRef] [PubMed]
- Jacquemoud, S.; Baret, F.; Andrieu, B.; Danson, F. M.; Jaggard, K. Extraction of Vegetation Biophysical Parameters by Inversion of the PROSPECT+ SAIL Models on Sugar Beet Canopy Reflectance Data. Application to TM and AVIRIS Sensors. Remote sensing of environment 1995, 52, 163–172. [Google Scholar] [CrossRef]
- Kuusk, A. A Fast, Invertible Canopy Reflectance Model. Remote Sensing of Environment 1995, 51, 342–350. [Google Scholar] [CrossRef]
- Bicheron, P.; Leroy, M. A Method of Biophysical Parameter Retrieval at Global Scale by Inversion of a Vegetation Reflectance Model. Remote Sensing of Environment 1999, 67, 251–266. [Google Scholar] [CrossRef]
- Simic, A.; Chen, J. M.; Noland, T. L. Retrieval of Forest Chlorophyll Content Using Canopy Structure Parameters Derived from Multi-Angle Data: The Measurement Concept of Combining Nadir Hyperspectral and off-Nadir Multispectral Data. International Journal of Remote Sensing 2011, 32, 5621–5644. [Google Scholar] [CrossRef]
- Croft, H.; Chen, J. M.; Zhang, Y.; Simic, A. Modelling Leaf Chlorophyll Content in Broadleaf and Needle Leaf Canopies from Ground, CASI, Landsat TM 5 and MERIS Reflectance Data. Remote Sensing of Environment 2013, 133, 128–140. [Google Scholar] [CrossRef]
- Sun, J.; Shi, S.; Wang, L.; Li, H.; Wang, S.; Gong, W.; Tagesson, T. Optimizing LUT-Based Inversion of Leaf Chlorophyll from Hyperspectral Lidar Data: Role of Cost Functions and Regulation Strategies. International Journal of Applied Earth Observation and Geoinformation 2021, 105, 102602. [Google Scholar] [CrossRef]
- Miraglio, T.; Adeline, K.; Huesca, M.; Ustin, S.; Briottet, X. Monitoring LAI, Chlorophylls, and Carotenoids Content of a Woodland Savanna Using Hyperspectral Imagery and 3D Radiative Transfer Modeling. Remote Sensing 2019, 12, 28. [Google Scholar] [CrossRef]
- Koetz, B.; Sun, G.; Morsdorf, F.; Ranson, K. J.; Kneubühler, M.; Itten, K.; Allgöwer, B. Fusion of Imaging Spectrometer and LIDAR Data over Combined Radiative Transfer Models for Forest Canopy Characterization. Remote Sensing of Environment 2007, 106, 449–459. [Google Scholar] [CrossRef]
- Schiefer, F.; Schmidtlein, S.; Kattenborn, T. The Retrieval of Plant Functional Traits from Canopy Spectra through RTM-Inversions and Statistical Models Are Both Critically Affected by Plant Phenology. Ecological Indicators 2021, 121, 107062. [Google Scholar] [CrossRef]
- Jacquemoud, S.; Baret, F. PROSPECT: A Model of Leaf Optical Properties Spectra. Remote sensing of environment 1990, 34, 75–91. [Google Scholar] [CrossRef]
- Romero, A.; Aguado, I.; Yebra, M. Estimation of Dry Matter Content in Leaves Using Normalized Indexes and PROSPECT Model Inversion. International Journal of Remote Sensing 2012, 33, 396–414. [Google Scholar] [CrossRef]
- Shiklomanov, A. N.; Dietze, M. C.; Viskari, T.; Townsend, P. A.; Serbin, S. P. Quantifying the Influences of Spectral Resolution on Uncertainty in Leaf Trait Estimates through a Bayesian Approach to RTM Inversion. Remote Sensing of Environment 2016, 183, 226–238. [Google Scholar] [CrossRef]
- Verhoef, W. Light Scattering by Leaf Layers with Application to Canopy Reflectance Modeling: The SAIL Model. Remote Sensing of Environment 1984, 16, 125–141. [Google Scholar] [CrossRef]
- Han, D.; Liu, J.; Zhang, R.; Liu, Z.; Guo, T.; Jiang, H.; Wang, J.; Zhao, H.; Ren, S.; Yang, P. Evaluation of the SAIL Radiative Transfer Model for Simulating Canopy Reflectance of Row Crop Canopies. Remote Sensing 2023, 15, 5433. [Google Scholar] [CrossRef]
- Andrieu, B.; Baret, F.; Jacquemoud, S.; Malthus, T.; Steven, M. Evaluation of an Improved Version of SAIL Model for Simulating Bidirectional Reflectance of Sugar Beet Canopies. Remote sensing of environment 1997, 60, 247–257. [Google Scholar] [CrossRef]
- Verhoef, W.; Jia, L.; Su, Z. Optical-Thermal Canopy Radiance Directionality Modelling by Unified 4SAIL Model. 2007.
- Jacquemoud, S.; Verhoef, W.; Baret, F.; Bacour, C.; Zarco-Tejada, P. J.; Asner, G. P.; François, C.; Ustin, S. L. PROSPECT+ SAIL Models: A Review of Use for Vegetation Characterization. Remote sensing of environment 2009, 113, S56–S66. [Google Scholar] [CrossRef]
- Verhoef, W.; Bach, H. Coupled Soil–Leaf-Canopy and Atmosphere Radiative Transfer Modeling to Simulate Hyperspectral Multi-Angular Surface Reflectance and TOA Radiance Data. Remote Sensing of Environment 2007, 109, 166–182. [Google Scholar] [CrossRef]
- Schaepman, M. E.; Wamelink, G. W. W.; van Dobben, H. F.; Gloor, M.; Schaepman-Strub, G.; Kooistra, L.; Clevers, J. G. P. W.; Schmidt, A.; Berendse, F. River Floodplain Vegetation Scenario Development Using Imaging Spectroscopy Derived Products as Input Variables in a Dynamic Vegetation Model. Photogrammetric Engineering & Remote Sensing 2007, 73, 1179–1188. [Google Scholar] [CrossRef]
- Malenovský, Z.; Albrechtová, J.; Lhotáková, Z.; Zurita-Milla, R.; Clevers, J.; Schaepman, M. E.; Cudlín, P. Applicability of the PROSPECT Model for Norway Spruce Needles. International Journal of Remote Sensing 2006, 27, 5315–5340. [Google Scholar] [CrossRef]
- Féret, J.-B.; Berger, K.; de Boissieu, F.; Malenovský, Z. PROSPECT-PRO for Estimating Content of Nitrogen-Containing Leaf Proteins and Other Carbon-Based Constituents. Remote Sensing of Environment 2021, 252, 112173. [Google Scholar] [CrossRef]
- Parry, C. K.; Nieto, H.; Guillevic, P.; Agam, N.; Kustas, W. P.; Alfieri, J.; McKee, L.; McElrone, A. J. An Intercomparison of Radiation Partitioning Models in Vineyard Canopies. Irrigation science 2019, 37, 239–252. [Google Scholar] [CrossRef]
- Cao, B.; Guo, M.; Fan, W.; Xu, X.; Peng, J.; Ren, H.; Du, Y.; Li, H.; Bian, Z.; Hu, T. A New Directional Canopy Emissivity Model Based on Spectral Invariants. IEEE Transactions on Geoscience and Remote Sensing 2018, 56, 6911–6926. [Google Scholar] [CrossRef]
- Chaabouni, S.; Kallel, A.; Houborg, R. Improving Retrieval of Crop Biophysical Properties in Dryland Areas Using a Multi-Scale Variational RTM Inversion Approach. International Journal of Applied Earth Observation and Geoinformation 2021, 94, 102220. [Google Scholar] [CrossRef]
- Verrelst, J.; Rivera, J. P.; Leonenko, G.; Alonso, L.; Moreno, J. Optimizing LUT-Based RTM Inversion for Semiautomatic Mapping of Crop Biophysical Parameters from Sentinel-2 and-3 Data: Role of Cost Functions. IEEE Transactions on Geoscience and Remote Sensing 2013, 52, 257–269. [Google Scholar] [CrossRef]
- Vicent, J.; Verrelst, J.; Sabater, N.; Alonso, L.; Rivera-Caicedo, J. P.; Martino, L.; Muñoz-Marí, J.; Moreno, J. Comparative Analysis of Atmospheric Radiative Transfer Models Using the Atmospheric Look-up Table Generator (ALG) Toolbox (Version 2. 0). Geoscientific model development 2020, 13, 1945–1957. [Google Scholar] [CrossRef]
- Vicent, J.; Sabater, N.; Alonso, L.; Verrelst, J.; Moreno, J. Alg: A Toolbox for the Generation of Look-Up Tables Based on Atmospheric Radiative Transfer Models. In 2018 9th Workshop on Hyperspectral Image and Signal Processing: Evolution in Remote Sensing (WHISPERS); IEEE, 2018; pp 1–5.
- Darvishzadeh, R.; Skidmore, A.; Schlerf, M.; Atzberger, C. Inversion of a Radiative Transfer Model for Estimating Vegetation LAI and Chlorophyll in a Heterogeneous Grassland. Remote sensing of environment 2008, 112, 2592–2604. [Google Scholar] [CrossRef]
- Weiss, M.; Baret, F.; Myneni, R.; Pragnère, A.; Knyazikhin, Y. Investigation of a Model Inversion Technique to Estimate Canopy Biophysical Variables from Spectral and Directional Reflectance Data. Agronomie 2000, 20, 3–22. [Google Scholar] [CrossRef]
- He, Y.; Gong, Z.; Zheng, Y.; Zhang, Y. Inland Reservoir Water Quality Inversion and Eutrophication Evaluation Using BP Neural Network and Remote Sensing Imagery: A Case Study of Dashahe Reservoir. Water 2021, 13, 2844. [Google Scholar] [CrossRef]
- Ai, B.; Wen, Z.; Jiang, Y.; Gao, S.; Lv, G. Sea Surface Temperature Inversion Model for Infrared Remote Sensing Images Based on Deep Neural Network. Infrared Physics & Technology 2019, 99, 231–239. [Google Scholar] [CrossRef]
- Houborg, R.; Boegh, E. Mapping Leaf Chlorophyll and Leaf Area Index Using Inverse and Forward Canopy Reflectance Modeling and SPOT Reflectance Data. Remote sensing of environment 2008, 112, 186–202. [Google Scholar] [CrossRef]
- Jacquemoud, S.; Bacour, C.; Poilvé, H.; Frangi, J.-P. Comparison of Four Radiative Transfer Models to Simulate Plant Canopies Reflectance: Direct and Inverse Mode. Remote Sensing of Environment 2000, 74, 471–481. [Google Scholar] [CrossRef]
- Kimes, D. S.; Knyazikhin, Y.; Privette, J. L.; Abuelgasim, A. A.; Gao, F. Inversion Methods for Physically-based Models. Remote Sensing Reviews 2000, 18, 381–439. [Google Scholar] [CrossRef]
- Verrelst, J.; Malenovský, Z.; Van der Tol, C.; Camps-Valls, G.; Gastellu-Etchegorry, J.-P.; Lewis, P.; North, P.; Moreno, J. Quantifying Vegetation Biophysical Variables from Imaging Spectroscopy Data: A Review on Retrieval Methods. Surveys in Geophysics 2019, 40, 589–629. [Google Scholar] [CrossRef]
- Boiarskii, B.; Hasegawa, H. Comparison of NDVI and NDRE Indices to Detect Differences in Vegetation and Chlorophyll Content. JOURNAL OF MECHANICS OF CONTINUA AND MATHEMATICAL SCIENCES 2019, spl1. [Google Scholar] [CrossRef]
- Chen, C.; Chen, Q.; Li, G.; He, M.; Dong, J.; Yan, H.; Wang, Z.; Duan, Z. A Novel Multi-Source Data Fusion Method Based on Bayesian Inference for Accurate Estimation of Chlorophyll-a Concentration over Eutrophic Lakes. Environmental Modelling & Software 2021, 141, 105057. [Google Scholar]
- Maimaitijiang, M.; Sagan, V.; Sidike, P.; Daloye, A. M.; Erkbol, H.; Fritschi, F. B. Crop Monitoring Using Satellite/UAV Data Fusion and Machine Learning. Remote Sensing 2020, 12, 1357. [Google Scholar] [CrossRef]
- Chusnah, W. N.; Chu, H.-J.; Tatas; Jaelani, L. M. Machine-Learning-Estimation of High-Spatiotemporal-Resolution Chlorophyll-a Concentration Using Multi-Satellite Imagery. Sustainable Environment Research 2023, 33, 11. [Google Scholar] [CrossRef]
- Alvarez-Vanhard, E.; Corpetti, T.; Houet, T. UAV & Satellite Synergies for Optical Remote Sensing Applications: A Literature Review. Science of Remote Sensing 2021, 3, 100019. [Google Scholar] [CrossRef]
- Shu, M.; Shen, M.; Zuo, J.; Yin, P.; Wang, M.; Xie, Z.; Tang, J.; Wang, R.; Li, B.; Yang, X.; Ma, Y. The Application of UAV-Based Hyperspectral Imaging to Estimate Crop Traits in Maize Inbred Lines. Plant Phenomics 2021, 2021. [Google Scholar] [CrossRef]
- Lelong, C. C.; Burger, P.; Jubelin, G.; Roux, B.; Labbé, S.; Baret, F. Assessment of Unmanned Aerial Vehicles Imagery for Quantitative Monitoring of Wheat Crop in Small Plots. Sensors 2008, 8, 3557–3585. [Google Scholar] [CrossRef] [PubMed]
- Gunia, M.; Laine, M.; Malve, O.; Kallio, K.; Kervinen, M.; Anttila, S.; Kotamäki, N.; Siivola, E.; Kettunen, J.; Kauranne, T. Data Fusion System for Monitoring Water Quality: Application to Chlorophyll-a in Baltic Sea Coast. Environmental Modelling & Software 2022, 155, 105465. [Google Scholar]
- Maimaitijiang, M.; Ghulam, A.; Sidike, P.; Hartling, S.; Maimaitiyiming, M.; Peterson, K.; Shavers, E.; Fishman, J.; Peterson, J.; Kadam, S. Unmanned Aerial System (UAS)-Based Phenotyping of Soybean Using Multi-Sensor Data Fusion and Extreme Learning Machine. ISPRS Journal of Photogrammetry and Remote Sensing 2017, 134, 43–58. [Google Scholar] [CrossRef]
- Houborg, R.; Soegaard, H.; Boegh, E. Combining Vegetation Index and Model Inversion Methods for the Extraction of Key Vegetation Biophysical Parameters Using Terra and Aqua MODIS Reflectance Data. Remote sensing of environment 2007, 106, 39–58. [Google Scholar] [CrossRef]
- Sefer, A.; Yapar, A.; Yelkenci, T. Imaging of Rough Surfaces by RTM Method. IEEE Transactions on Geoscience and Remote Sensing 2024, 62, 1–12. [Google Scholar] [CrossRef]
- Verrelst, J.; Muñoz, J.; Alonso, L.; Delegido, J.; Rivera, J. P.; Camps-Valls, G.; Moreno, J. Machine Learning Regression Algorithms for Biophysical Parameter Retrieval: Opportunities for Sentinel-2 and -3. Remote Sensing of Environment 2012, 118, 127–139. [Google Scholar] [CrossRef]
- Robertson, G. P.; Collins, S. L.; Foster, D. R.; Brokaw, N.; Ducklow, H. W.; Gragson, T. L.; Gries, C.; Hamilton, S. K.; McGuire, A. D.; Moore, J. C.; Stanley, E. H.; Waide, R. B.; Williams, M. W. Long-Term Ecological Research in a Human-Dominated World. BioScience 2012, 62, 342–353. [Google Scholar] [CrossRef]
- Robertson, G. P. The Ecology of Agricultural Landscapes: Long-Term Research on the Path to Sustainability; Oxford University Press, 2015.
- Uddling, J.; Gelang-Alfredsson, J.; Piikki, K.; Pleijel, H. Evaluating the Relationship between Leaf Chlorophyll Concentration and SPAD-502 Chlorophyll Meter Readings. Photosynth Res 2007, 91, 37–46. [Google Scholar] [CrossRef]
- CAN_EYE_User_Manual.Pdf. https://jecam.org/wp-content/uploads/2018/07/CAN_EYE_User_Manual.pdf (accessed 2024-05-09).
- Simic Milas, A.; Romanko, M.; Reil, P.; Abeysinghe, T.; Marambe, A. The Importance of Leaf Area Index in Mapping Chlorophyll Content of Corn under Different Agricultural Treatments Using UAV Images. International Journal of Remote Sensing 2018, 39, 5415–5431. [Google Scholar] [CrossRef]
- Suykens, J. a. K.; Vandewalle, J. Chaos Control Using Least-Squares Support Vector Machines. International Journal of Circuit Theory and Applications 1999, 27, 605–615. [Google Scholar] [CrossRef]
- Wolberg, J.; Wolberg, E. J. The Method of Least Squares. Designing Quantitative Experiments: Prediction Analysis 2010, 47–89.
- Geladi, P.; Kowalski, B. R. Partial Least-Squares Regression: A Tutorial. Analytica chimica acta 1986, 185, 1–17. [Google Scholar] [CrossRef]
- Williams, C. K.; Rasmussen, C. E. Gaussian Processes for Machine Learning; MIT press Cambridge, MA, 2006; Vol. 2.
- Verrelst, J.; Rivera-Caicedo, J. P.; Reyes-Muñoz, P.; Morata, M.; Amin, E.; Tagliabue, G.; Panigada, C.; Hank, T.; Berger, K. Mapping Landscape Canopy Nitrogen Content from Space Using PRISMA Data. ISPRS Journal of Photogrammetry and Remote Sensing 2021, 178, 382–395. [Google Scholar] [CrossRef] [PubMed]
- Hagan, M. T.; Menhaj, M. B. Training Feedforward Networks with the Marquardt Algorithm. IEEE transactions on Neural Networks 1994, 5, 989–993. [Google Scholar] [CrossRef] [PubMed]
- NV5 Geospatial Solutions & Services Expertise. https://www.nv5.com/geospatial/ (accessed 2024-05-09).
- Verrelst, J.; Rivera, J.; Alonso, L.; Moreno, J. ARTMO: An Automated Radiative Transfer Models Operator Toolbox for Automated Retrieval of Biophysical Parameters through Model Inversion. In Proceedings of the EARSeL 7th SIG-Imaging Spectroscopy Workshop, Edinburgh, UK; 2011; pp. 11–13. [Google Scholar]
- ARTMO Toolbox. https://artmotoolbox.com/ (accessed 2024-05-09).
- Berger, K.; Atzberger, C.; Danner, M.; D’Urso, G.; Mauser, W.; Vuolo, F.; Hank, T. Evaluation of the PROSAIL Model Capabilities for Future Hyperspectral Model Environments: A Review Study. Remote Sensing 2018, 10, 85. [Google Scholar] [CrossRef]
- Haboudane, D.; Miller, J. R.; Pattey, E.; Zarco-Tejada, P. J.; Strachan, I. B. Hyperspectral Vegetation Indices and Novel Algorithms for Predicting Green LAI of Crop Canopies: Modeling and Validation in the Context of Precision Agriculture. Remote sensing of environment 2004, 90, 337–352. [Google Scholar] [CrossRef]
- Tuia, D.; Volpi, M.; Copa, L.; Kanevski, M.; Munoz-Mari, J. A Survey of Active Learning Algorithms for Supervised Remote Sensing Image Classification. IEEE Journal of Selected Topics in Signal Processing 2011, 5, 606–617. [Google Scholar] [CrossRef]
- Candiani, G.; Tagliabue, G.; Panigada, C.; Verrelst, J.; Picchi, V.; Rivera Caicedo, J. P.; Boschetti, M. Evaluation of Hybrid Models to Estimate Chlorophyll and Nitrogen Content of Maize Crops in the Framework of the Future CHIME Mission. Remote sensing 2022, 14, 1792. [Google Scholar] [CrossRef]
- Berger, K.; Verrelst, J.; Féret, J.-B.; Hank, T.; Wocher, M.; Mauser, W.; Camps-Valls, G. Retrieval of Aboveground Crop Nitrogen Content with a Hybrid Machine Learning Method. International Journal of Applied Earth Observation and Geoinformation 2020, 92, 102174. [Google Scholar] [CrossRef]
- Brown, L. A.; Ogutu, B. O.; Dash, J. Estimating Forest Leaf Area Index and Canopy Chlorophyll Content with Sentinel-2: An Evaluation of Two Hybrid Retrieval Algorithms. Remote Sensing 2019, 11, 1752. [Google Scholar] [CrossRef]
- Singhal, G.; Bansod, B.; Mathew, L.; Goswami, J.; Choudhury, B. U.; Raju, P. L. N. Chlorophyll Estimation Using Multi-Spectral Unmanned Aerial System Based on Machine Learning Techniques. Remote Sensing Applications: Society and Environment 2019, 15, 100235. [Google Scholar] [CrossRef]
- Priyanka; Srivastava, P.K.; Rawat, R. Retrieval of Leaf Chlorophyll Content Using Drone Imagery and Fusion with Sentinel-2 Data. Smart Agricultural Technology 2023, 6, 100353. [Google Scholar] [CrossRef]
- Zhou, X.; Zhang, J.; Chen, D.; Huang, Y.; Kong, W.; Yuan, L.; Ye, H.; Huang, W. Assessment of Leaf Chlorophyll Content Models for Winter Wheat Using Landsat-8 Multispectral Remote Sensing Data. Remote Sensing 2020, 12, 2574. [Google Scholar] [CrossRef]
- Wang, Q.; Chen, X.; Meng, H.; Miao, H.; Jiang, S.; Chang, Q. UAV Hyperspectral Data Combined with Machine Learning for Winter Wheat Canopy SPAD Values Estimation. Remote Sensing 2023, 15, 4658. [Google Scholar] [CrossRef]
- Chang-Hua, J. U.; Yong-Chao, T.; Xia, Y. A. O.; Wei-Xing, C. A. O.; Yan, Z. H. U.; Hannaway, D. Estimating Leaf Chlorophyll Content Using Red Edge Parameters. Pedosphere 2010, 20, 633–644. [Google Scholar]
- Horler, D. N. H.; Dockray, M.; Barber, J.; Barringer, A. R. Red Edge Measurements for Remotely Sensing Plant Chlorophyll Content. Advances in Space Research 1983, 3, 273–277. [Google Scholar] [CrossRef]
- Zhang, H.; Li, J.; Liu, Q.; Lin, S.; Huete, A.; Liu, L.; Croft, H.; Clevers, J. G.; Zeng, Y.; Wang, X. A Novel Red-edge Spectral Index for Retrieving the Leaf Chlorophyll Content. Methods in Ecology and Evolution 2022, 13, 2771–2787. [Google Scholar] [CrossRef]
- Alam, M. Md. T.; Milas, A. Machine Learning-Based Estimation of Canopy Chlorophyll Content in Crops from Multiple Satellite Images with Various Spatial Resolutions; 2023. [CrossRef]
- Fitzgerald, G.; Rodriguez, D.; O’Leary, G. Measuring and Predicting Canopy Nitrogen Nutrition in Wheat Using a Spectral Index—The Canopy Chlorophyll Content Index (CCCI). Field crops research 2010, 116, 318–324. [Google Scholar] [CrossRef]
- El-Shikha, D. M.; Barnes, E. M.; Clarke, T. R.; Hunsaker, D. J.; Haberland, J. A.; Pinter Jr, P. J.; Waller, P. M.; Thompson, T. L. Remote Sensing of Cotton Nitrogen Status Using the Canopy Chlorophyll Content Index (CCCI). Transactions of the ASABE 2008, 51, 73–82. [Google Scholar] [CrossRef]
- Macedo, L. S.; Kawakubo, F. S. Temporal Analysis of Vegetation Indices Related to Biophysical Parameters Using Sentinel 2A Images to Estimate Maize Production. In Remote Sensing for Agriculture, Ecosystems, and Hydrology XIX; SPIE, 2017; Vol. 10421, pp 213–220.
- Barnes, E.; Clarke, T. R.; Richards, S. E.; Colaizzi, P.; Haberland, J.; Kostrzewski, M.; Waller, P.; Choi, C.; Riley, E.; Thompson, T. L. Coincident Detection of Crop Water Stress, Nitrogen Status, and Canopy Density Using Ground Based Multispectral Data. 2000.
- Zhang, H.; Li, J.; Liu, Q.; Zhao, J.; Dong, Y. A Highly Chlorophyll-Sensitive and LAI-Insensitive Index Based on the Red-Edge Band: CSI. In IGARSS 2020-2020 IEEE International Geoscience and Remote Sensing Symposium; IEEE, 2020; pp 5014–5017.
- Bi, K.; Gao, S.; Niu, Z.; Zhang, C.; Huang, N. Estimating Leaf Chlorophyll and Nitrogen Contents Using Active Hyperspectral LiDAR and Partial Least Square Regression Method. Journal of Applied Remote Sensing 2019, 13, 034513–034513. [Google Scholar] [CrossRef]
- Peng, Z.; Guan, L.; Liao, Y.; Lian, S. Estimating Total Leaf Chlorophyll Content of Gannan Navel Orange Leaves Using Hyperspectral Data Based on Partial Least Squares Regression. IEEE Access 2019, 7, 155540–155551. [Google Scholar] [CrossRef]
- Yu, K.; Li, F.; Gnyp, M. L.; Miao, Y.; Bareth, G.; Chen, X. Remotely Detecting Canopy Nitrogen Concentration and Uptake of Paddy Rice in the Northeast China Plain. ISPRS Journal of Photogrammetry and Remote Sensing 2013, 78, 102–115. [Google Scholar] [CrossRef]
- Farifteh, J.; Van der Meer, F.; Atzberger, C.; Carranza, E. J. M. Quantitative Analysis of Salt-Affected Soil Reflectance Spectra: A Comparison of Two Adaptive Methods (PLSR and ANN). Remote Sensing of Environment 2007, 110, 59–78. [Google Scholar] [CrossRef]
- Song, S.; Gong, W.; Zhu, B.; Huang, X. Wavelength Selection and Spectral Discrimination for Paddy Rice, with Laboratory Measurements of Hyperspectral Leaf Reflectance. ISPRS Journal of Photogrammetry and Remote Sensing 2011, 66, 672–682. [Google Scholar] [CrossRef]
- Malinin, A.; Gales, M. Predictive Uncertainty Estimation via Prior Networks. Advances in neural information processing systems 2018, 31. [Google Scholar]
Figure 1.
Study site (42°24'32.3"N, 85°22'23.8"W) with 24 parcels of corn grown under four chemical and management treatments.
Figure 1.
Study site (42°24'32.3"N, 85°22'23.8"W) with 24 parcels of corn grown under four chemical and management treatments.
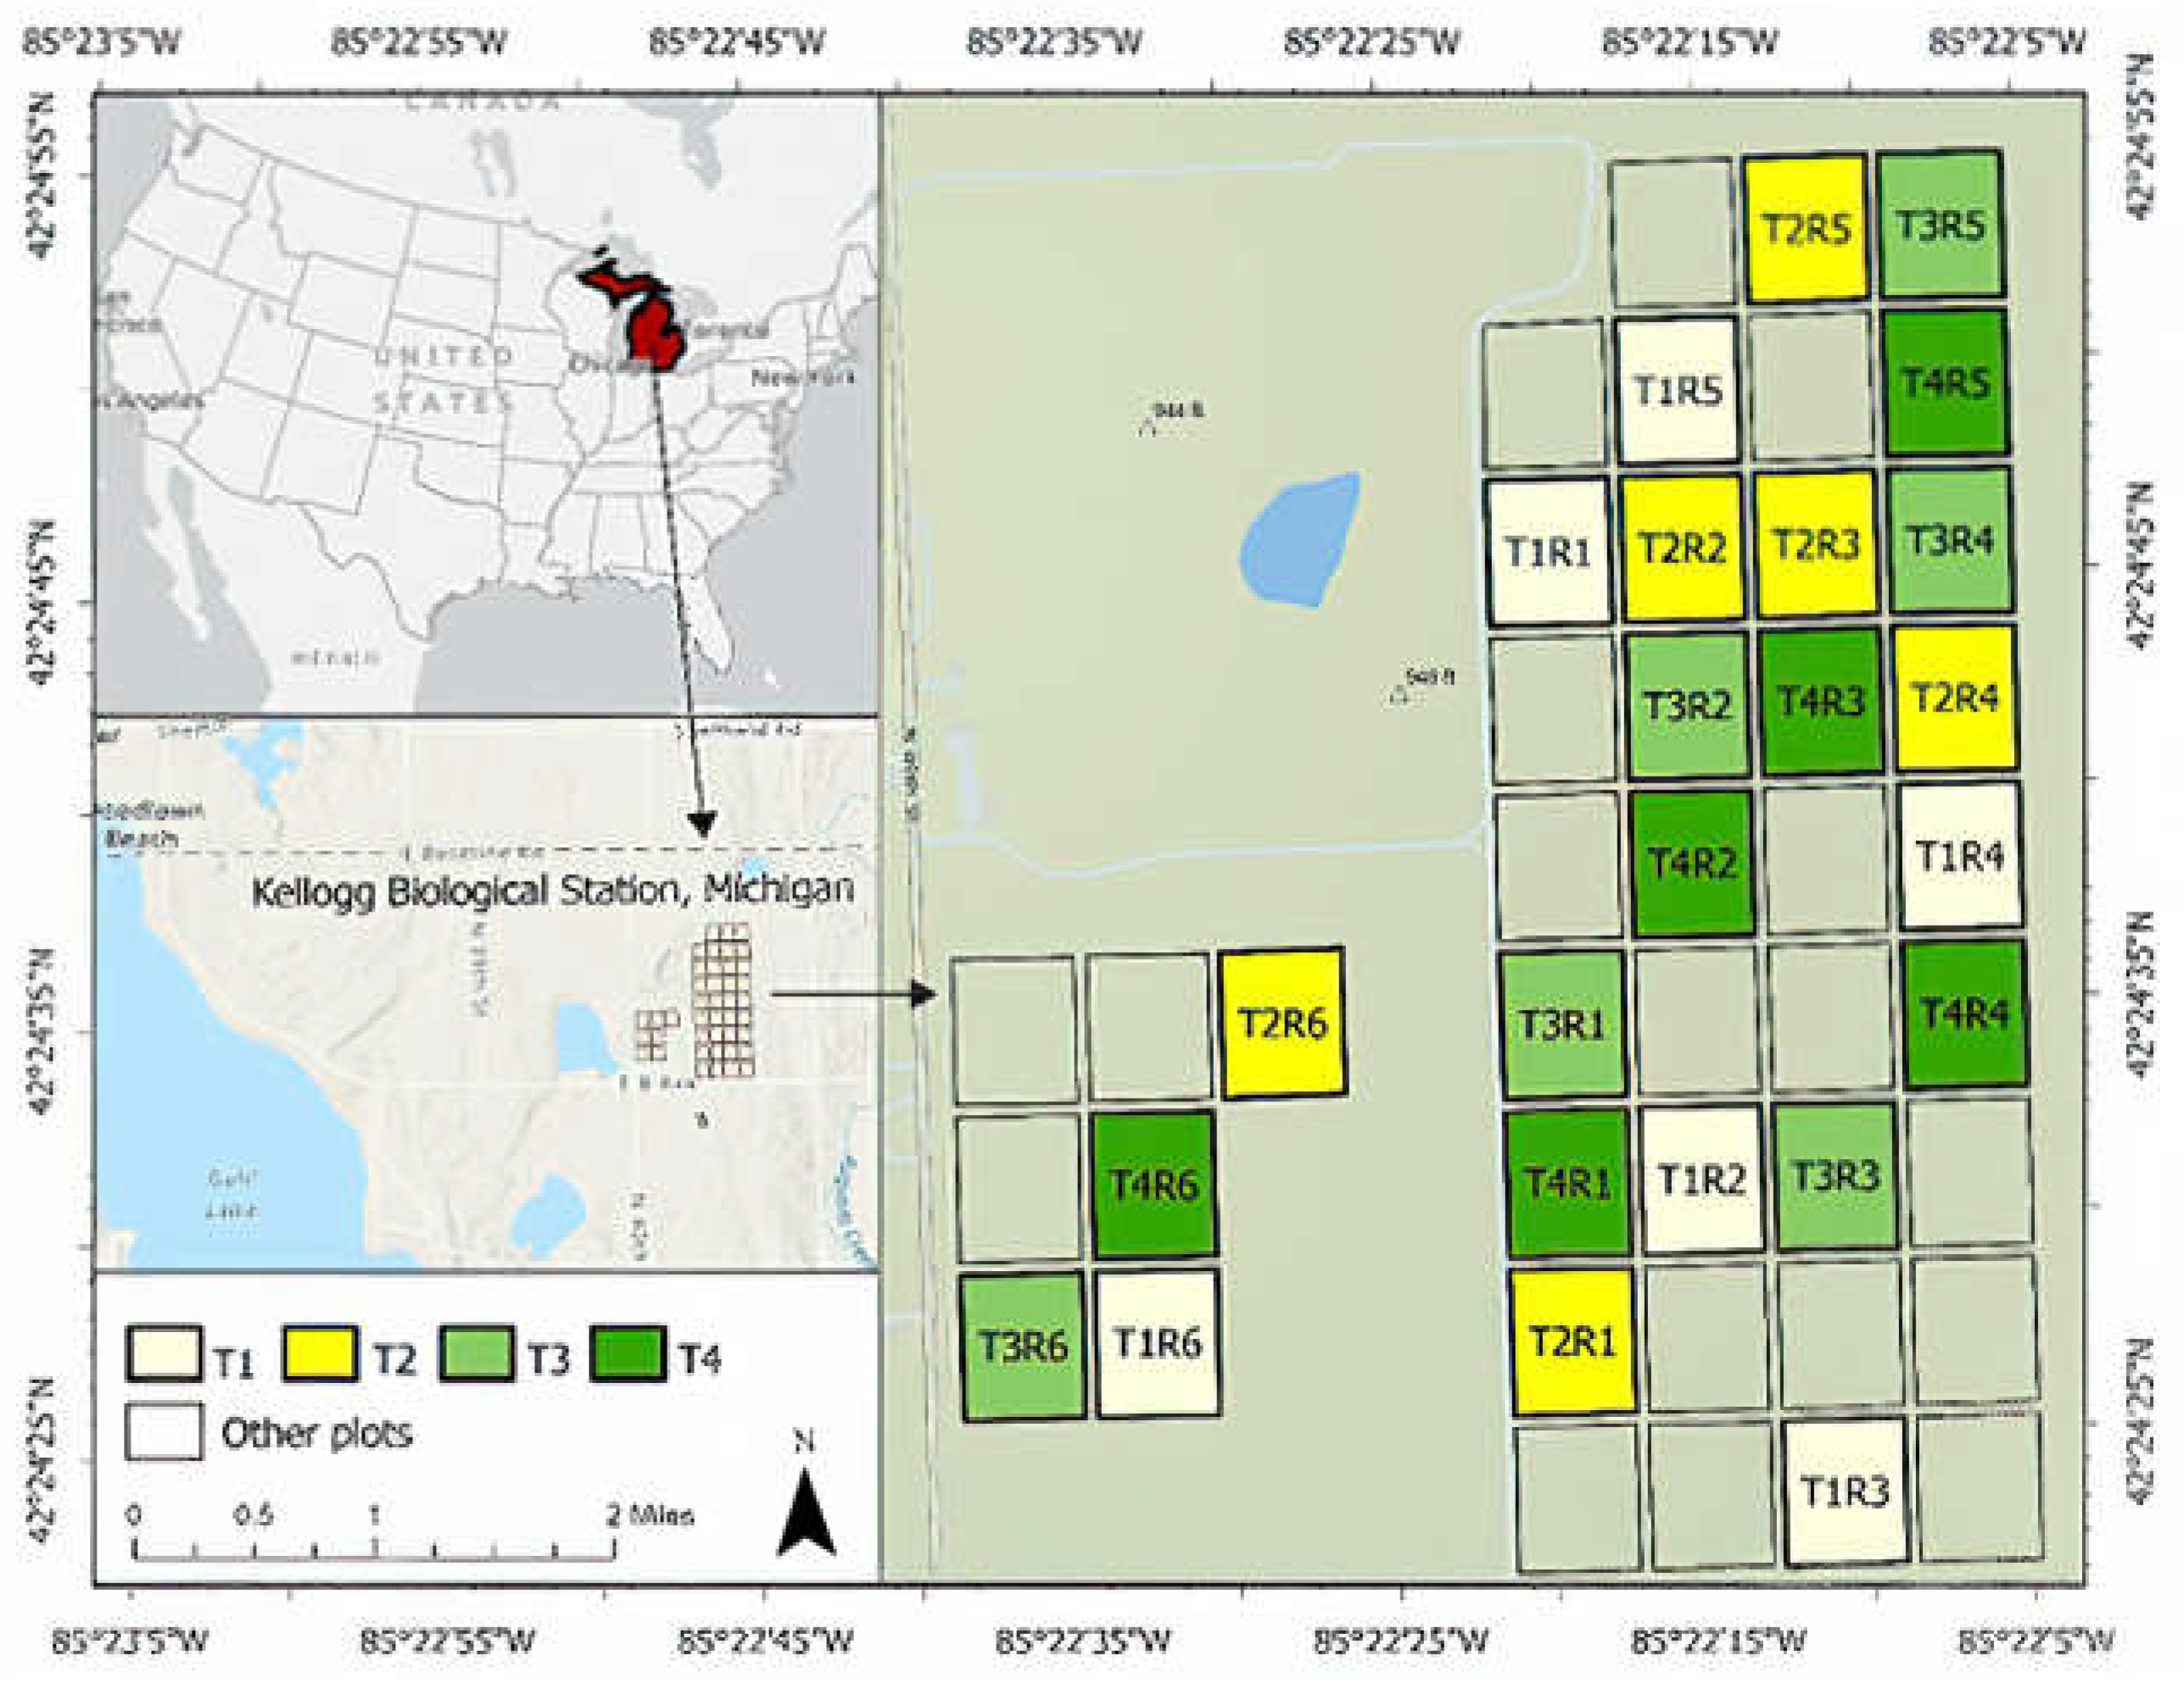
Figure 2.
Images acquired in 2017 for the study site by Landsat 7 (8 August), RapidEye (9 August), PlanetScope (8 August) and UAV (11 August). .
Figure 2.
Images acquired in 2017 for the study site by Landsat 7 (8 August), RapidEye (9 August), PlanetScope (8 August) and UAV (11 August). .
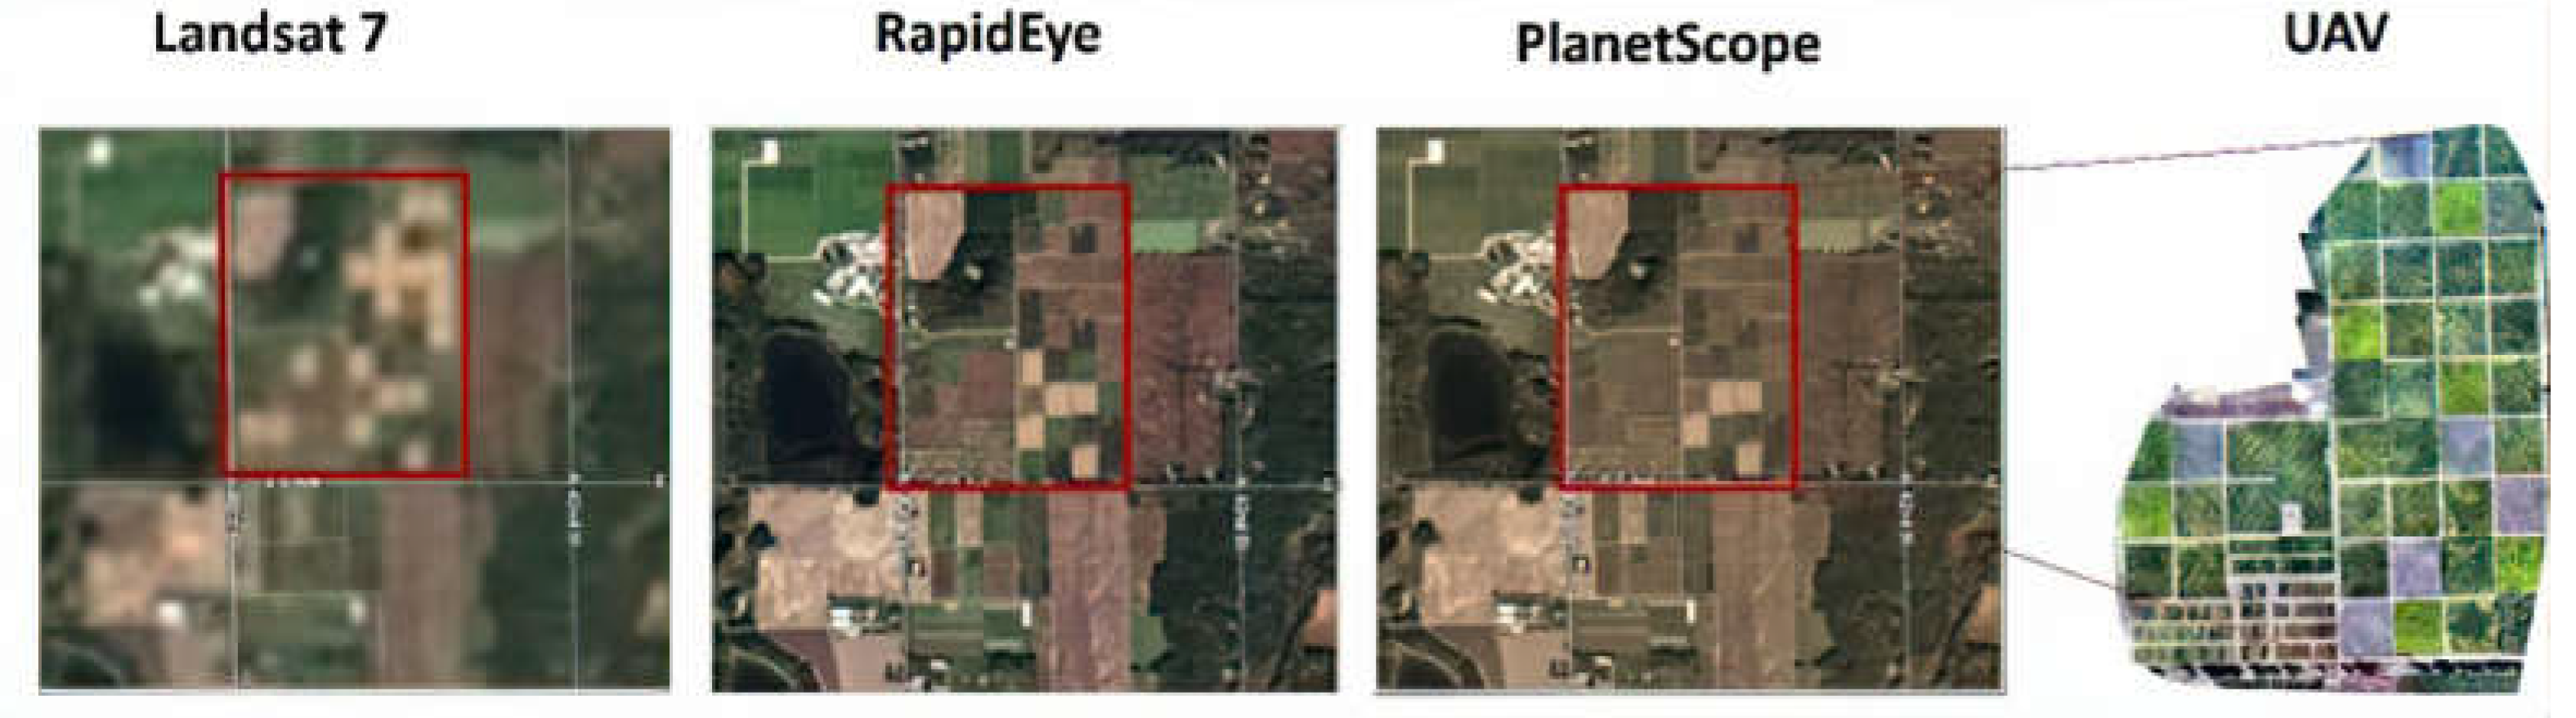
Figure 3.
The flowchart illustrates the methods employed to derive canopy chlorophyll content (CCC) across the study area. Note that MLRA stands for machine learning regression algorithm, which includes kernel ridge regression (KRR), least squares linear regression (LSLR), partial least squares regression (PLSR), Gaussian process regression (GPR), and neural network (NN); NV signifies non-vegetated spectra.
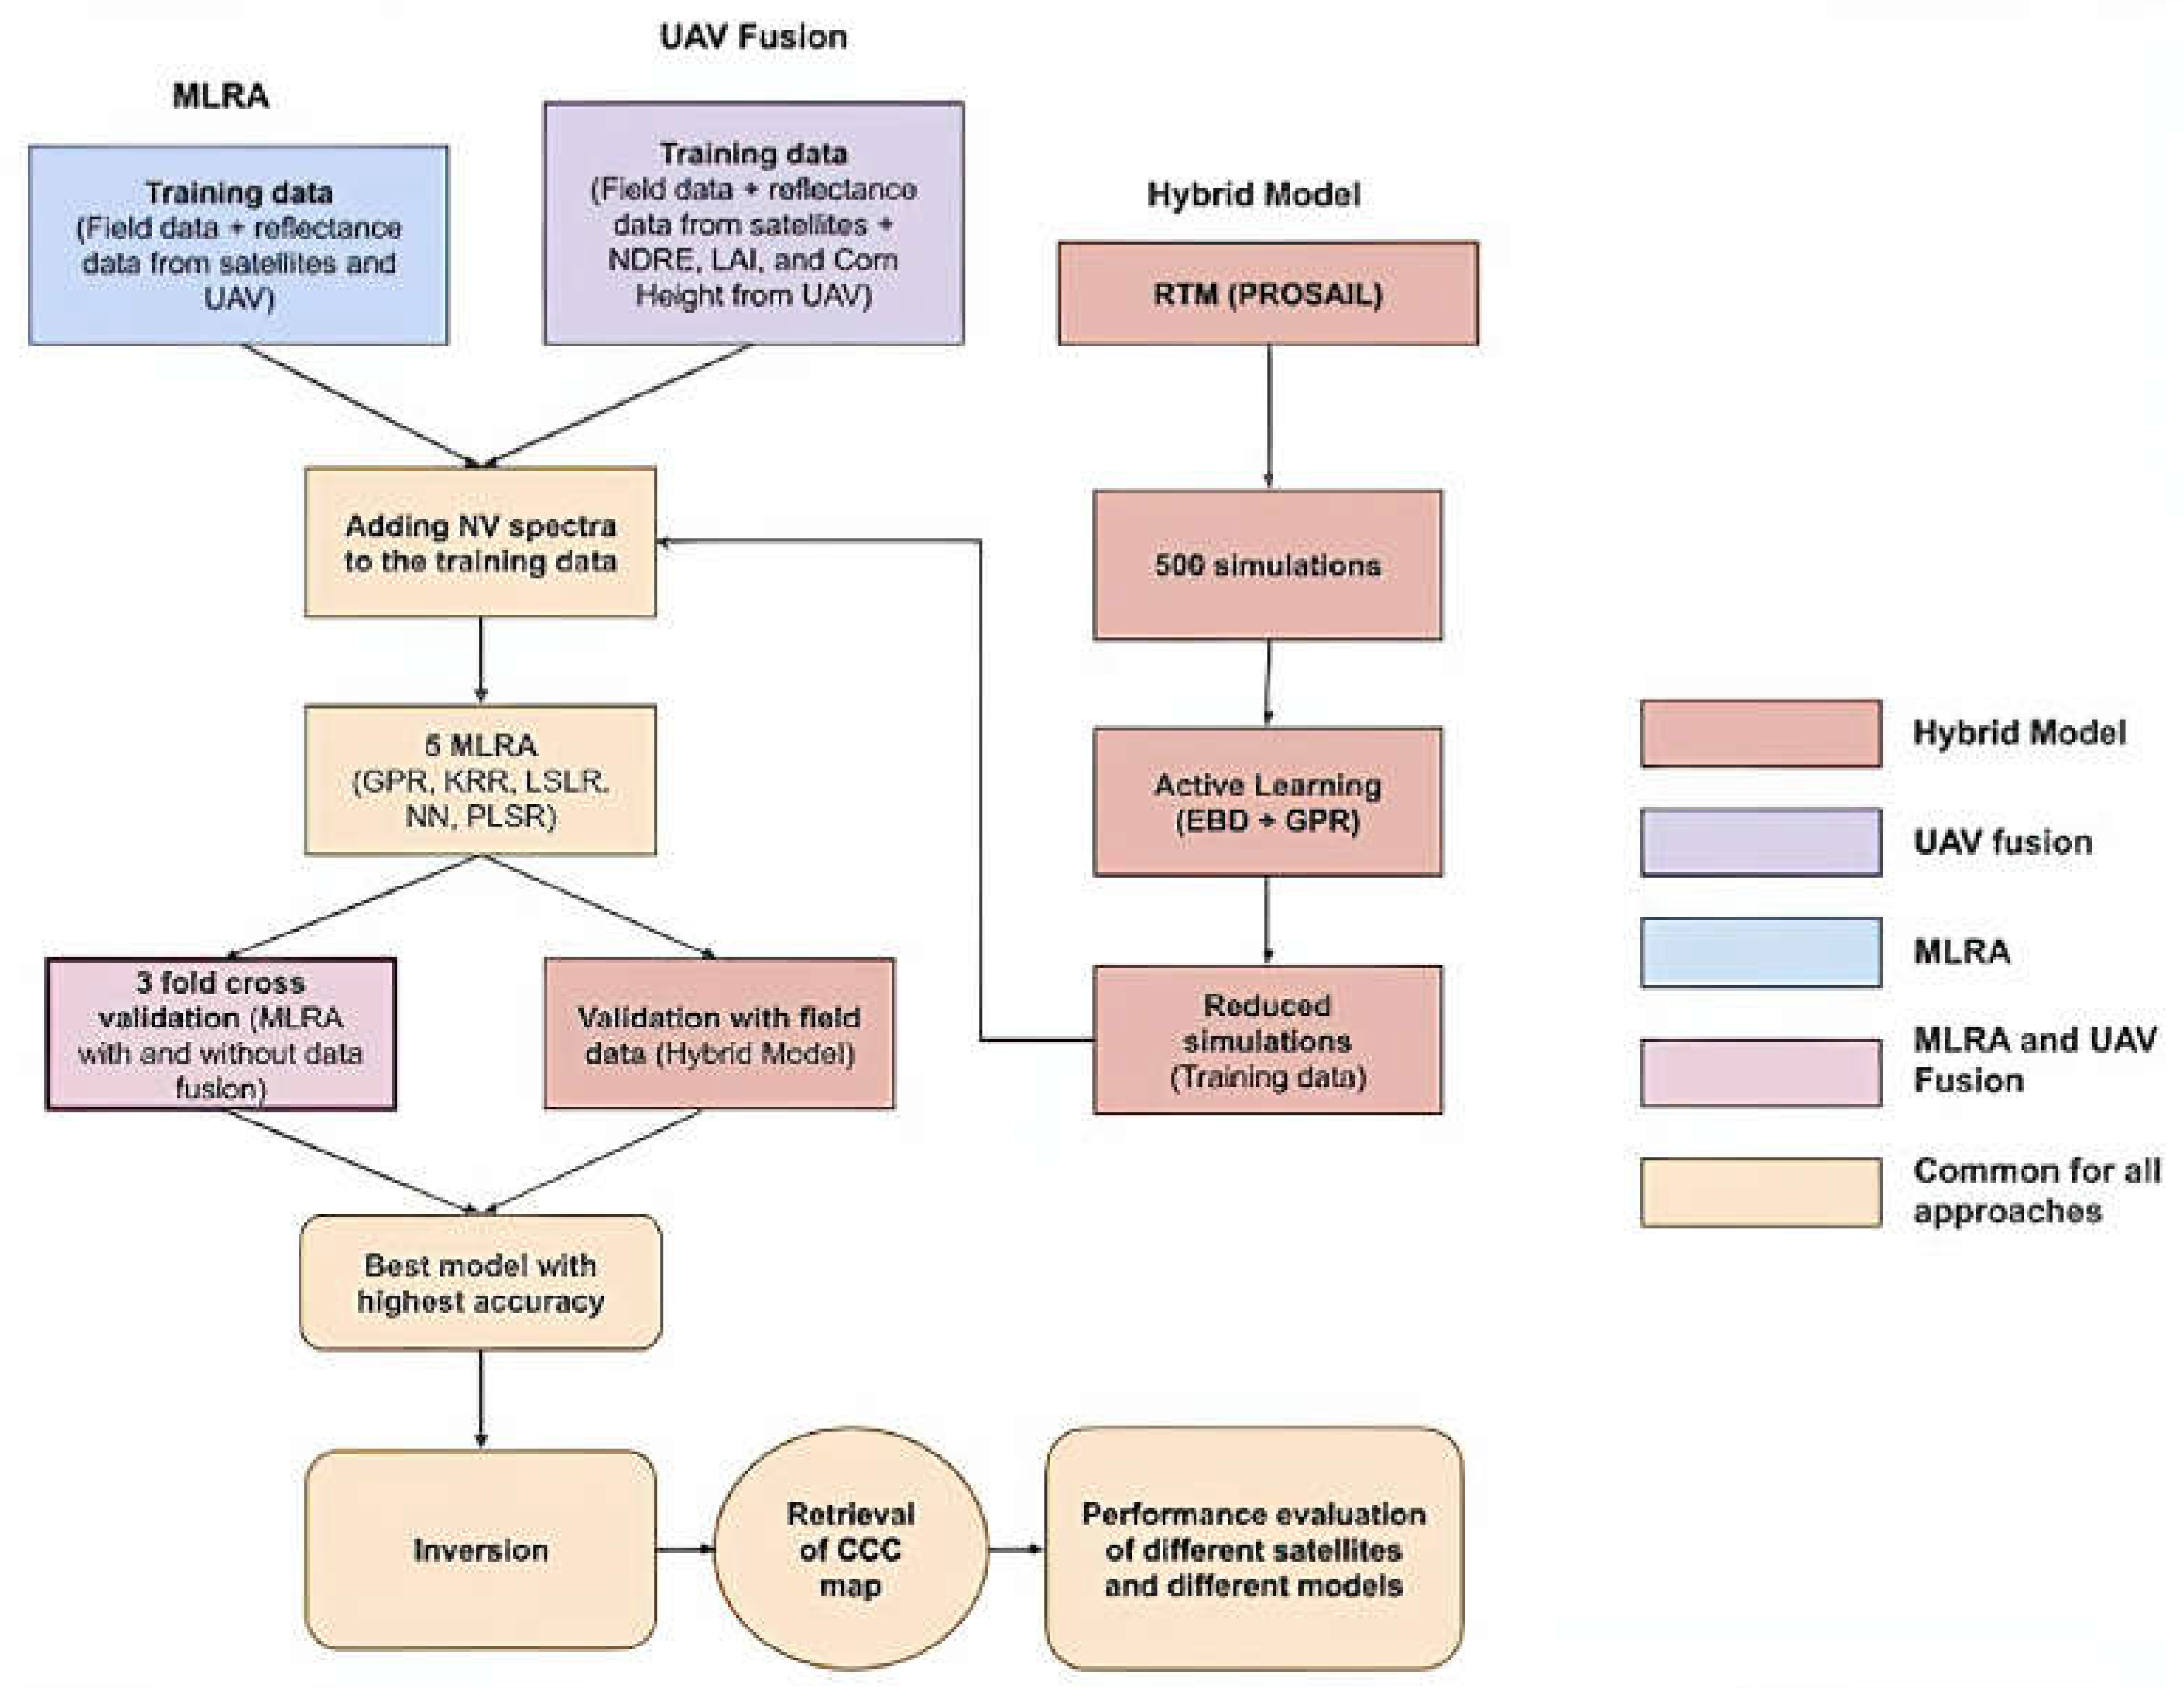
Figure 4.
Canopy chlorophyl content (CCC) maps generated from (a-c) Landsat 7, (d-f) RapidEye, and (g-i) PlanetScope satellite images using the best-performing MLRA applied to satellite images, to fused UAV-satellite imagery, and integrated within the hybrid model (PROSAIL + MLRA) for each satellite dataset, respectively.
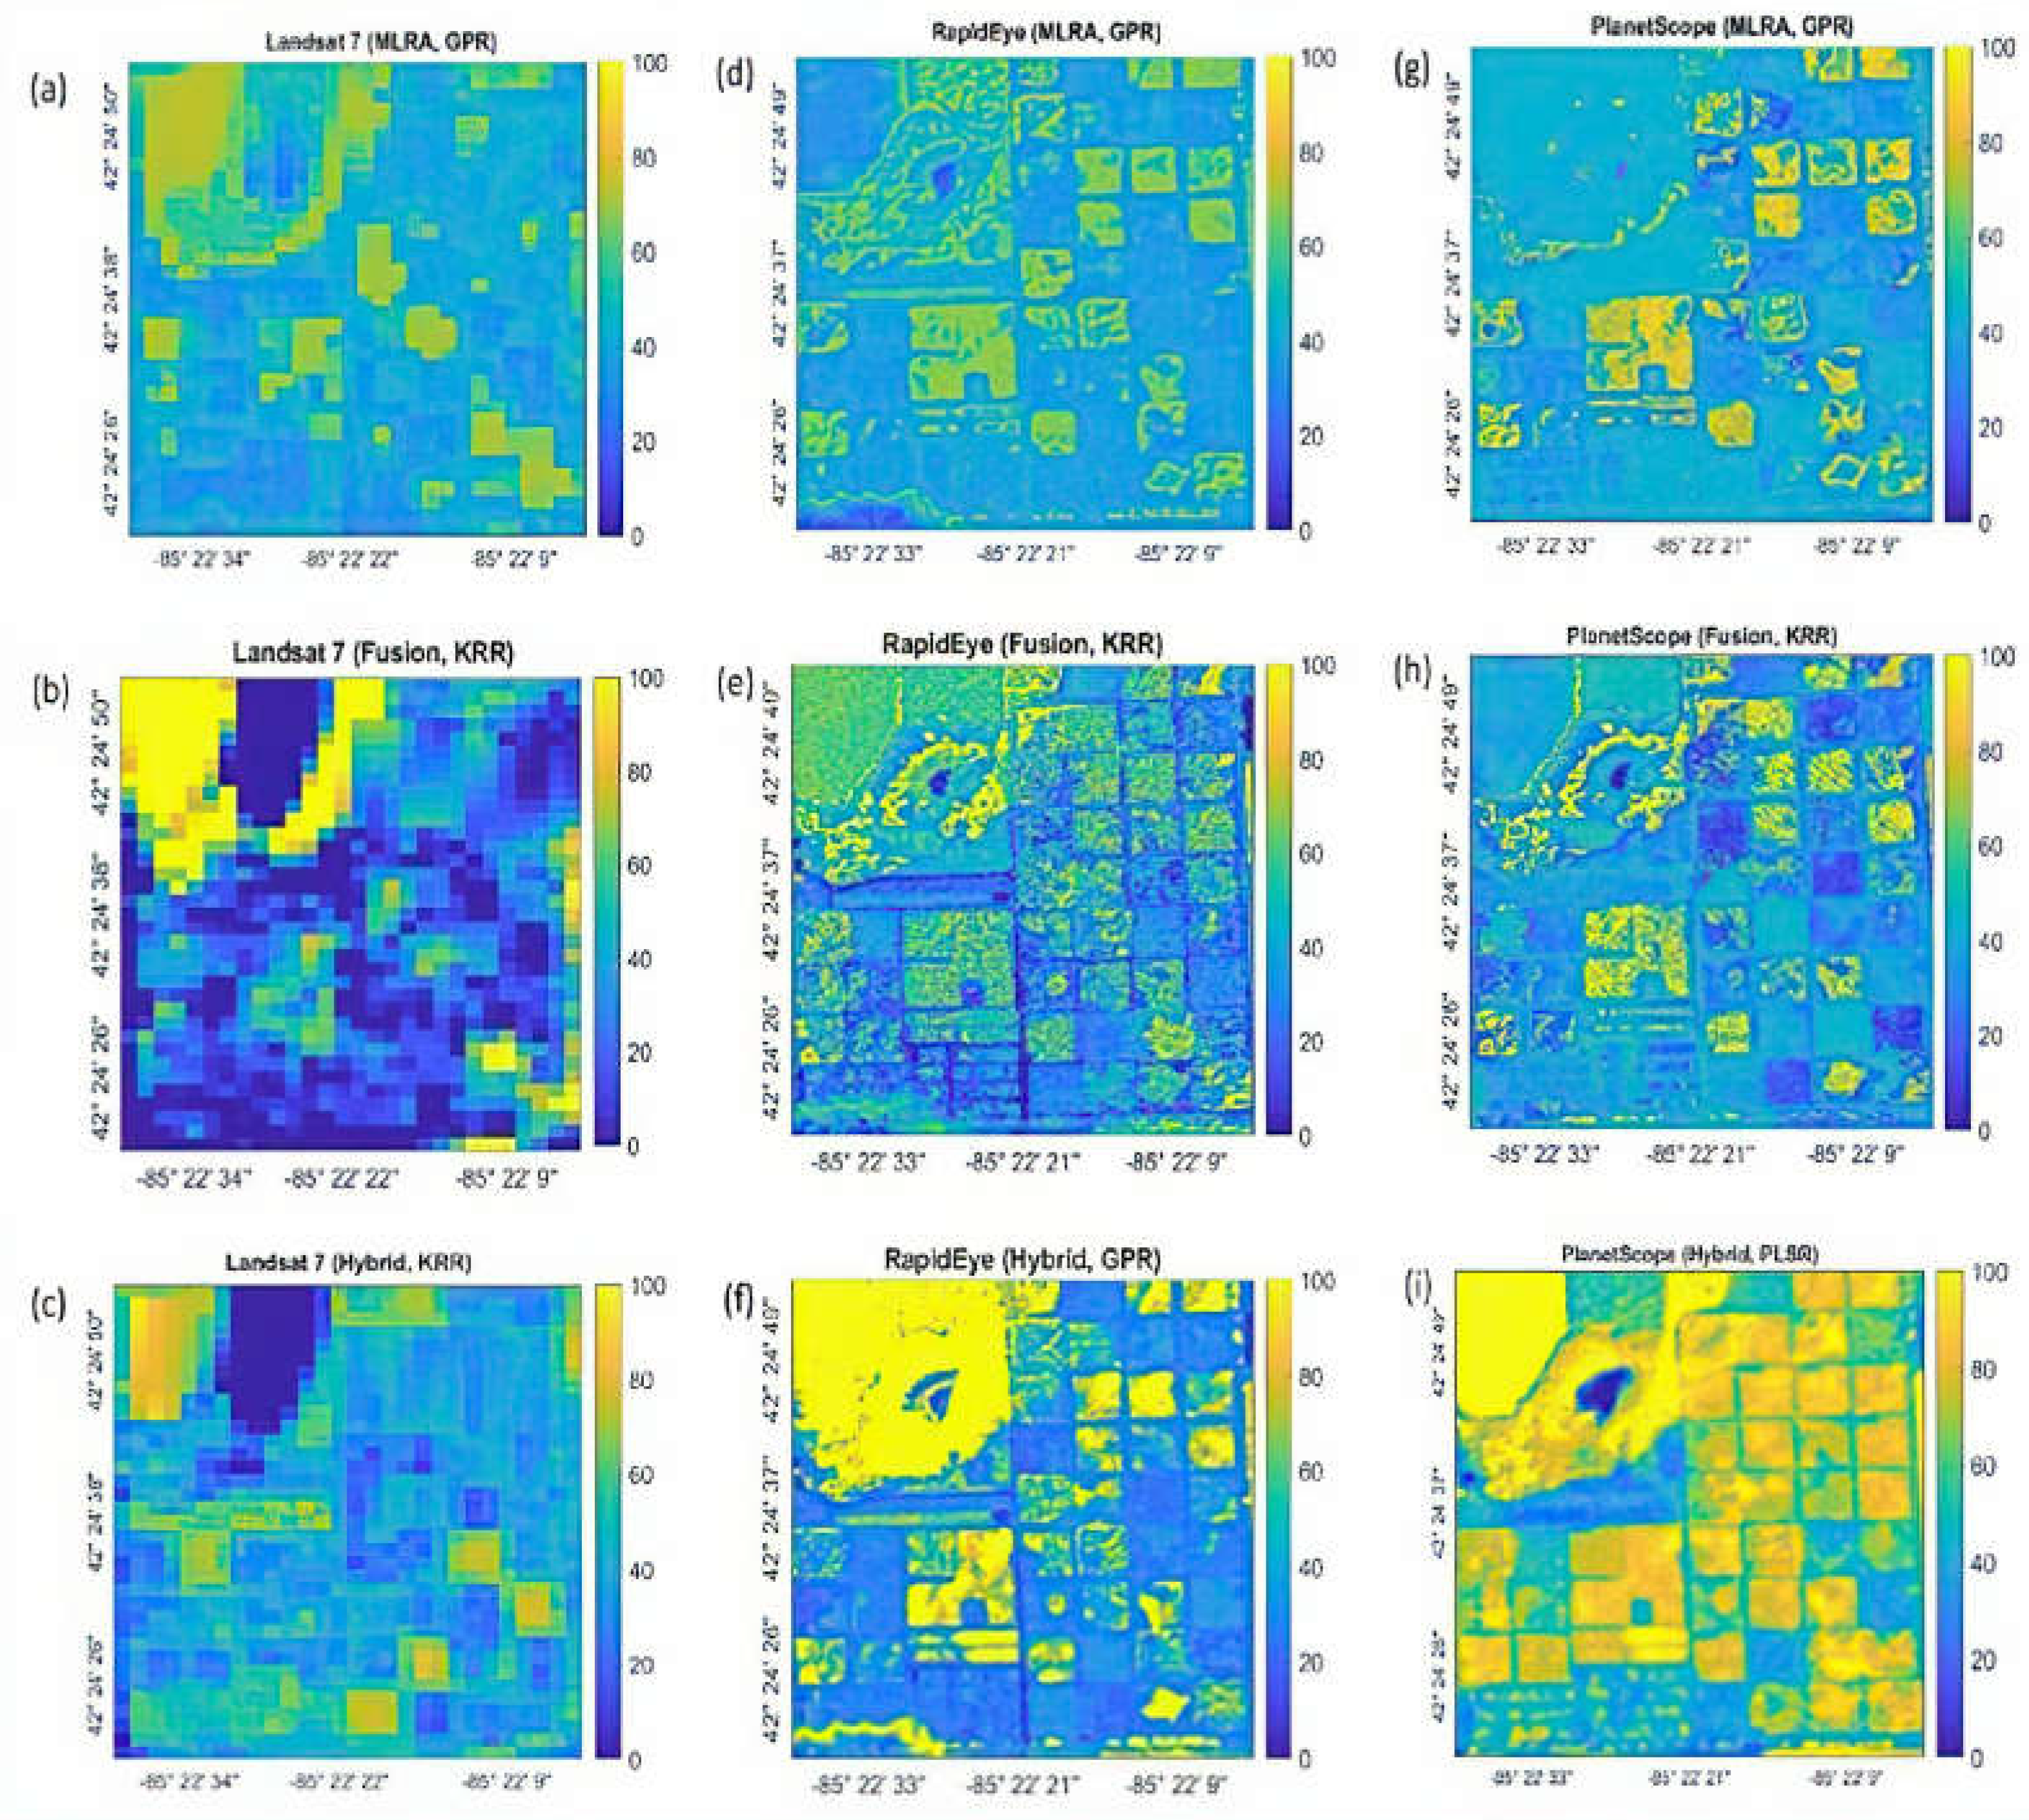
Figure 5.
Relationship between measured and estimated canopy chlorophyll content (CCC) values for maps generated from (a-c) Landsat 7, (d-f) RapidEye, and (g-i) PlanetScope satellite images using the best-performing MLRA applied to satellite images, to fused UAV-satellite imagery, and integrated within the hybrid model (PROSAIL + MLRA) for each satellite dataset, respectively.
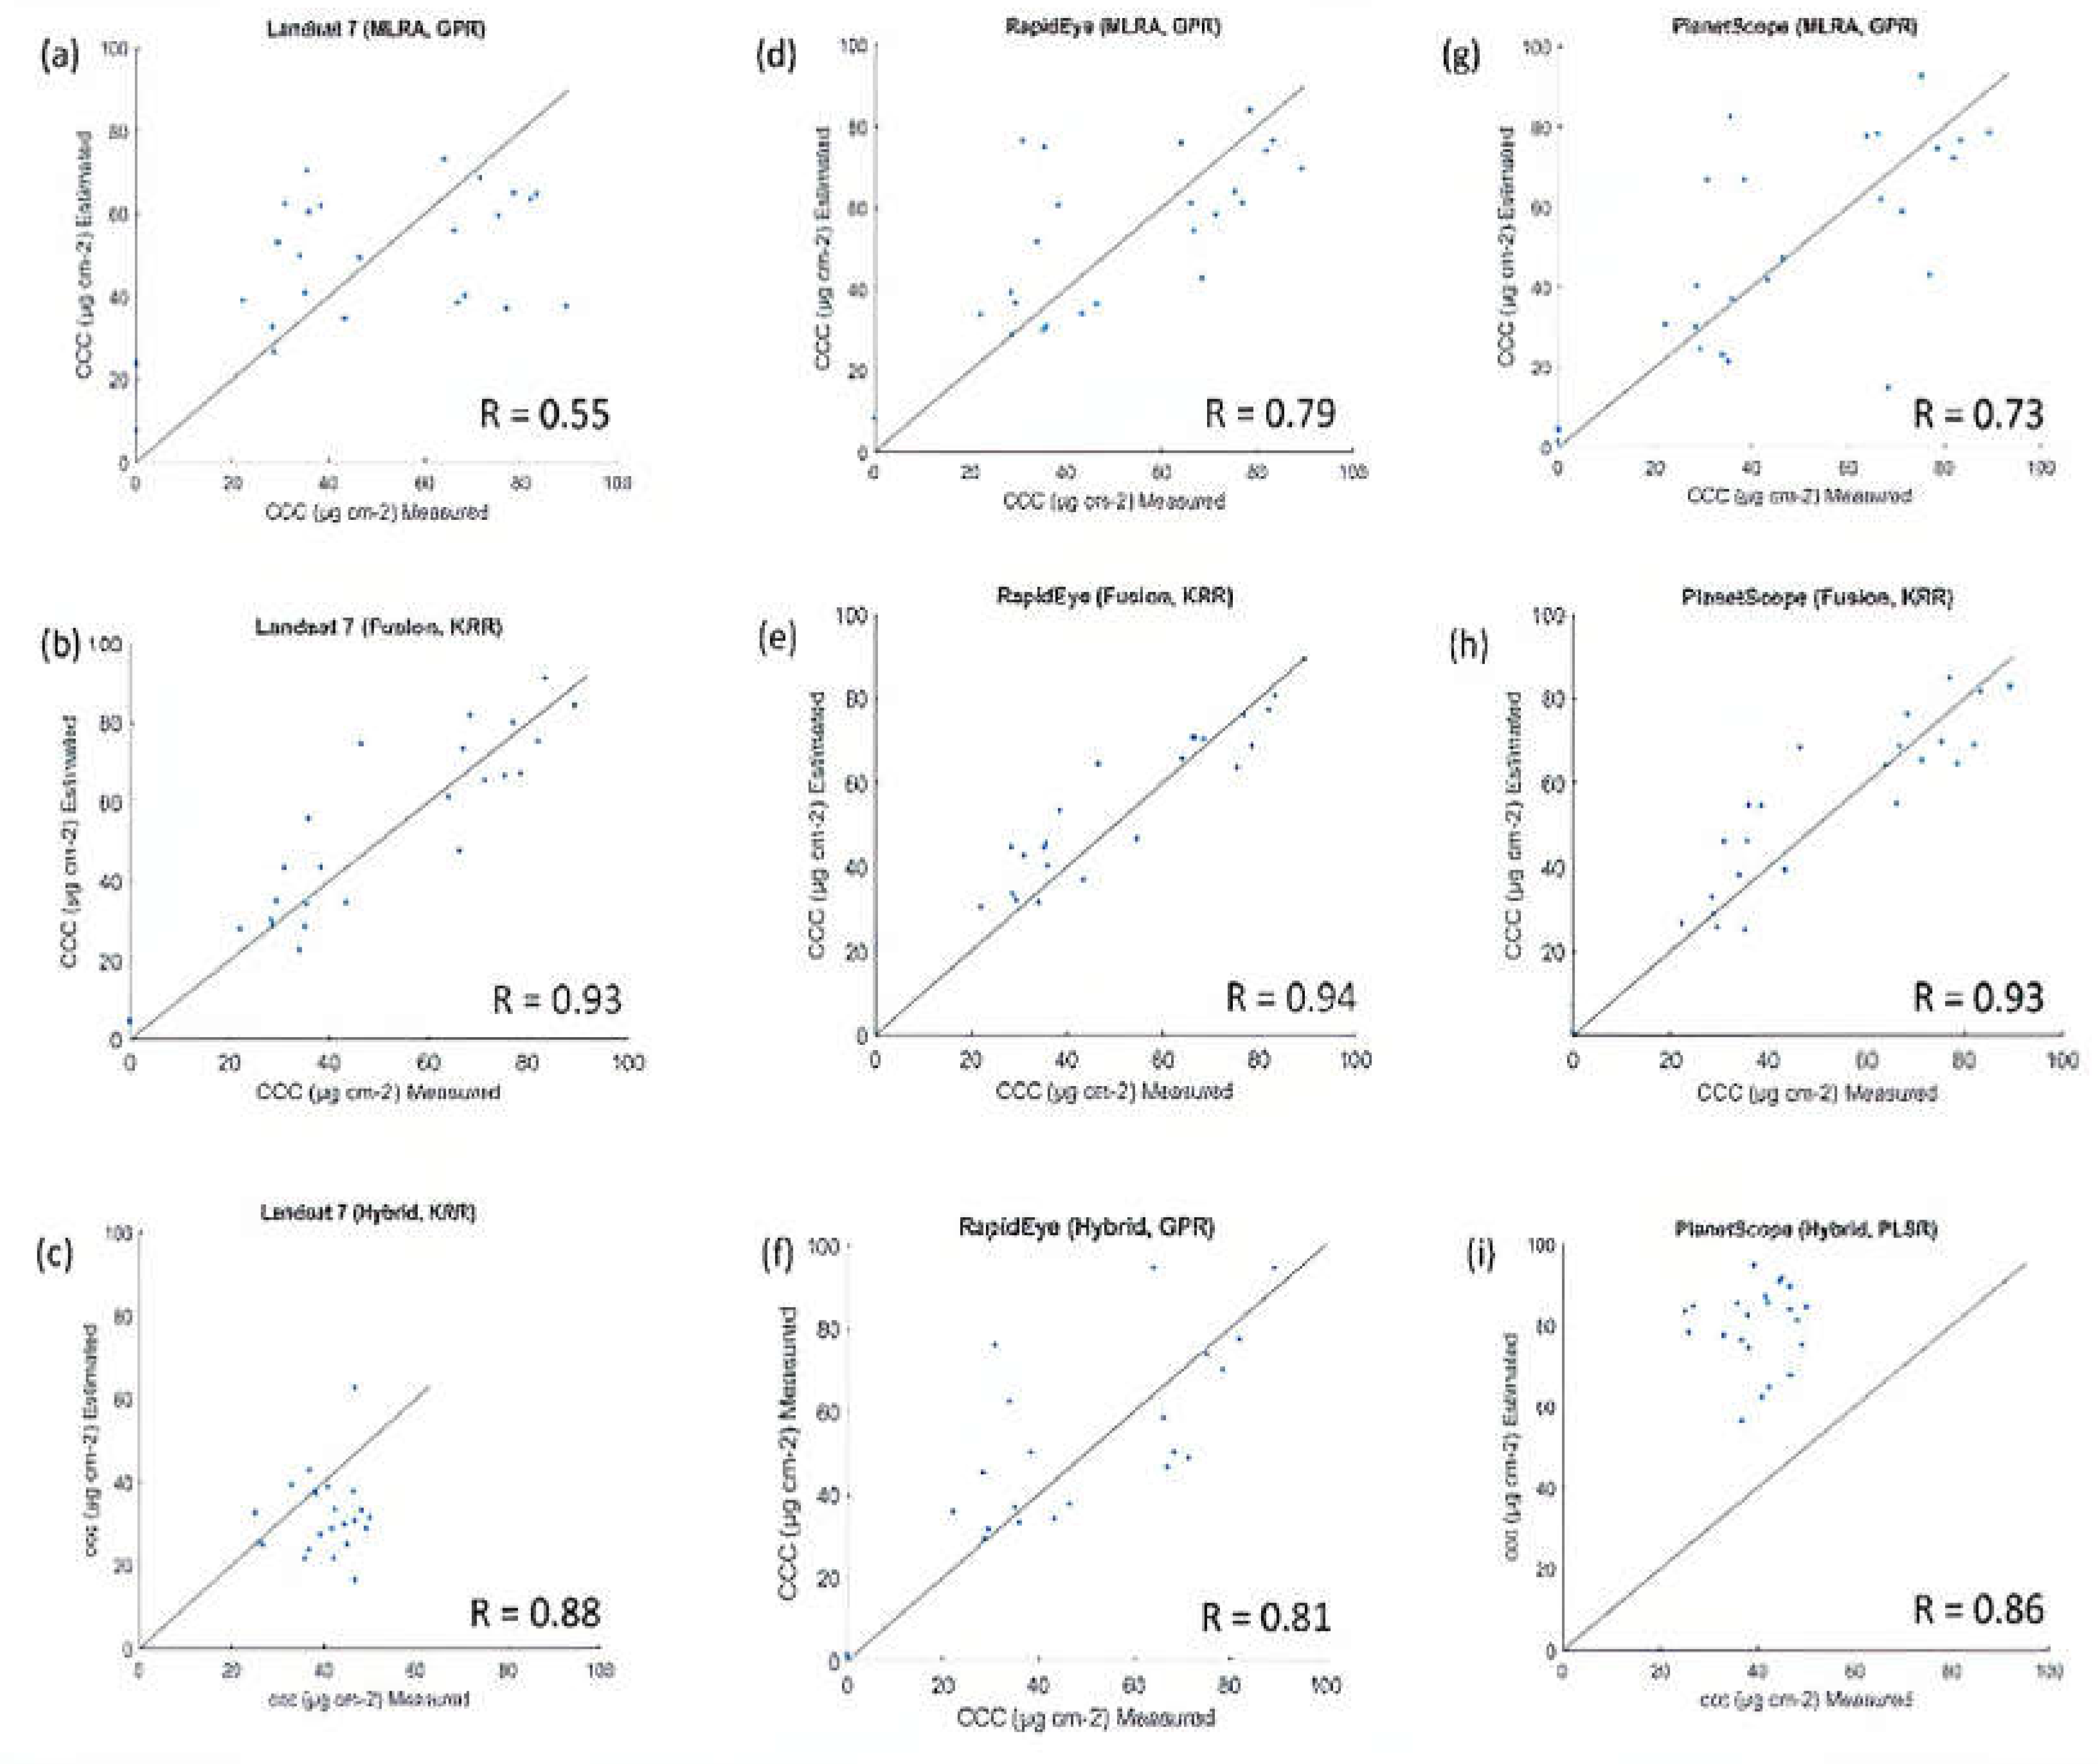
Figure 6.
Canopy chlorophyl content (CCC) maps generated from (a) UAV image; (b) UAV image including UAV-derived NDRE, LAI, and canopy height model; (c) hybrid (PROSAIL + MLRA) model applied to UAV image - all using the best performing MLRA for each scenario, followed by graphs showing the relationship between measured and estimated CCC.
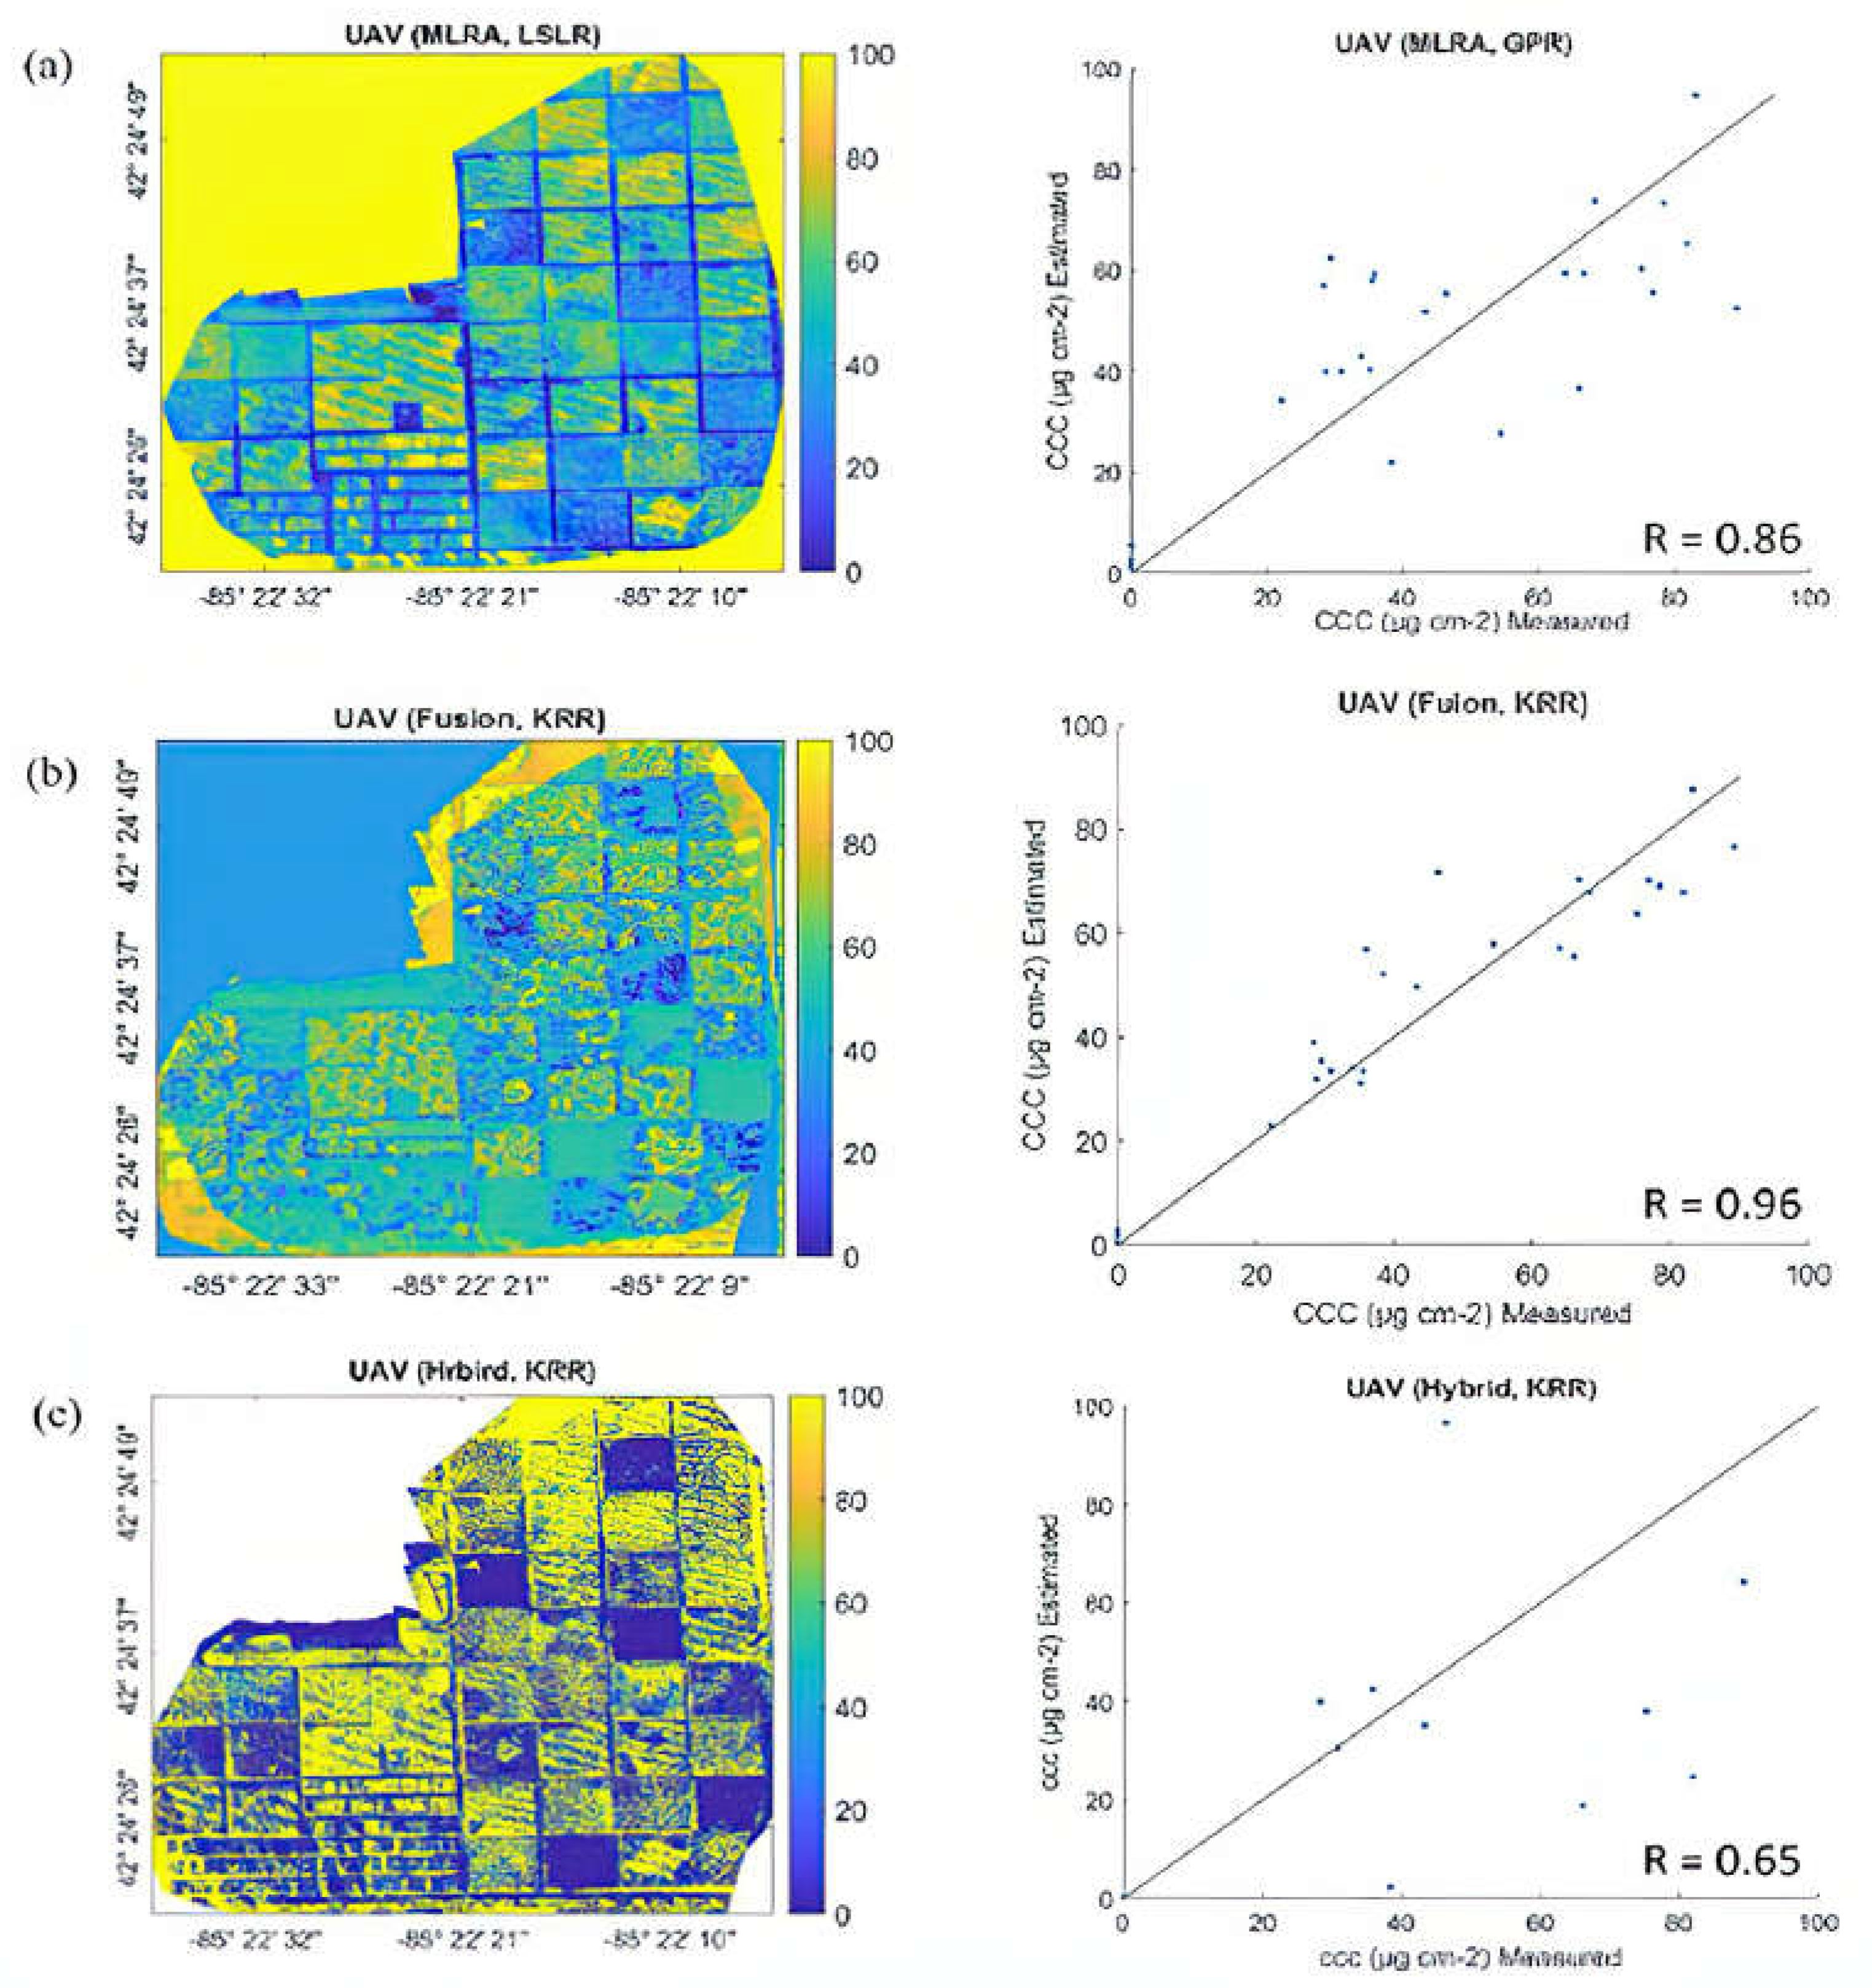

Table 1.
Sensors and bands used in the current study. Note: GSD - ground sampling distance.
| Landsat 7 | RapidEye | PlanetScope | UAV | |||||
|---|---|---|---|---|---|---|---|---|
| Band Center (nm) | GSD (m) |
Band Center (nm) | GSD (m) |
Band Center (nm) | GSD (m) |
Band Center (nm) | GSD (m) |
|
| Blue | 485 | 30 | 440 | 5 | 455 | 3.125 | - | - |
| Green | 560 | 30 | 520 | 5 | 545 | 3.125 | 550 | 0.13 |
| Red | 665 | 30 | 670 | 5 | 660 | 3.125 | 650 | 0.13 |
| Red Edge | - | - | 690 | 5 | - | - | 720 | 0.13 |
| NIR | 835 | 30 | 760 | 5 | 865 | 3.125 | 800 | 0.13 |
| SWIR1 | 1650 | 30 | - | - | - | - | - | - |
| SWIR2 | 2200 | 30 | - | - | - | - | - | - |
Table 2.
Advantages and disadvantages of the MLRAs used in the study.
| Algorithm Name | Advantages | Disadvantages | Source |
|---|---|---|---|
| Kernel ridge regression (KRR) | Handles non-linear relationships with kernel functions | The memory requirement for storing the kernel matrix can be quite high for large datasets, which can be a limitation for systems with limited memory resources. | [56] |
| Least squares linear regression (LSLR) | Simple, interpretable, computationally efficient | Prone to overfitting with high-dimensional data | [57] |
| Partial least squares regression (PLSR) | Reduces dimensionality and handles correlated features | Interpretability of coefficients can be challenging | [58] |
| Gaussian processes regression (GPR) | Provides uncertainty estimates for predictions, simple to train and works well with comparatively smaller dataset. | Computationally expensive for large datasets | [59,60] |
| Neural network (NN) | Highly flexible, learns complex patterns in data | Can be prone to overfitting and requires careful configuration | [61] |
Table 3.
Description and range of the parameters used as input data in PROSPECT-PRO and 4SAIL models.
Table 3.
Description and range of the parameters used as input data in PROSPECT-PRO and 4SAIL models.
| Model | Parameter | Description | Unit | Distribution | Range | Source |
|---|---|---|---|---|---|---|
| PROSPECT-PRO | N | Leaf structure | unitless | Uniform | 1-2 | [69] |
| Cab | Leaf chlorophyll content | µg/cm2 | Uniform | 0-80 | - | |
| Ccx | Leaf carotenoid content | µg/cm2 | Uniform | 2-20 | [3] | |
| Canth | Leaf anthocyanin content | µg/cm2 | Uniform | 0-2 | [69] | |
| EWT | Leaf water content | cm | Uniform | 0.001-0.02 | [69] | |
| Cp | Leaf protein content | g/cm2 | Uniform | 0.001-0.0015 | [3] | |
| Cbrown | Brown pigment content | µg/cm2 | - | 0 | [69] | |
| CBC | Carbon-Based constituents | g/cm2 | Uniform | 0.001-0.01 | [69] | |
| 4SAIL | ALA | Average leaf inclination angle | deg | Uniform | 20-70 | [1] |
| LAI | Leaf area index | m2/m2 | Uniform | 0-6 | - | |
| HOT | Hot spot parameter | m/m | Uniform | 0.01-0.5 | [1] | |
| SZA | Solar zenith angle | deg | Uniform | 20-35 | [68] | |
| OZA | Observer azimuth angle | deg | - | 0 | [68] | |
| RAA | Relative azimuth angle | deg | - | 0 | [68] | |
| BG | Soil brightness | unitless | - | 0.8 | [9] | |
| DR | Diffuse/direct radiation | unitless | - | 80 | - |
Table 4.
Performance of MLRAs with and without data fusion and performance of the hybrid PROSAIL + MLRAs models using five MLRAs: kernel ridge regression (KRR); Gaussian process regression (GPR); neural network (NN); partial least squares regression (PLSR); least squares linear regression (LSLR).
Table 4.
Performance of MLRAs with and without data fusion and performance of the hybrid PROSAIL + MLRAs models using five MLRAs: kernel ridge regression (KRR); Gaussian process regression (GPR); neural network (NN); partial least squares regression (PLSR); least squares linear regression (LSLR).
| Performance of five MLRAs applied to satellite images | |||||||||
|---|---|---|---|---|---|---|---|---|---|
| Landsat 7 | RapidEye | PlanetScope | |||||||
| RMSE µg/cm2 | NRMSE % | R2 | RMSE µg/cm2 | NRMSE % | R2 | RMSE µg/cm2 | NRMSE % | R2 | |
| GPR | 22.28 | 24.96 | 0.30 | 16.51 | 18.49 | 0.62 | 19.61 | 21.96 | 0.53 |
| KRR | 24.65 | 27.61 | 0.23 | 20.91 | 23.42 | 0.45 | 22.34 | 25.03 | 0.37 |
| LSLR | 158.53 | 177.56 | 0.07 | 22.62 | 25.34 | 0.34 | 22.27 | 24.95 | 0.40 |
| NN | 29.74 | 33.31 | 0.25 | 23.96 | 26.83 | 0.37 | 24.24 | 27.15 | 0.33 |
| PLSR | 153.76 | 172.22 | 0.07 | 22.62 | 25.34 | 0.34 | 21.11 | 23.65 | 0.43 |
| Performance of five MLRAs applied to fused satellite and UAV images | |||||||||
| GPR | 10.61 | 11.88 | 0.85 | 9.65 | 10.81 | 0.89 | 11.69 | 13.09 | 0.83 |
| KRR | 10.22 | 11.45 | 0.86 | 8.99 | 10.07 | 0.89 | 9.64 | 10.79 | 0.87 |
| LSLR | 19.06 | 21.34 | 0.67 | 48.50 | 54.30 | 0.36 | 13.37 | 14.97 | 0.76 |
| NN | 12.83 | 14.37 | 0.78 | 14.41 | 16.15 | 0.75 | 14.66 | 16.42 | 0.75 |
| PLSR | 24.73 | 27.70 | 0.49 | 79.50 | 89.90 | 0.26 | 24.30 | 27.21 | 0.36 |
| Performance of the hybrid PROSAIL + MLRAs models applied to satellite images | |||||||||
| GPR | 42.91 | 85.96 | 0.51 | 19.16 | 21.46 | 0.66 | 76.33 | 152.76 | 0.47 |
| KRR | 33.10 | 66.24 | 0.77 | 26.13 | 29.27 | 0.69 | 148.12 | 296.45 | 0.57 |
| LSLR | 71.83 | 143.76 | 0.02 | 28.54 | 31.97 | 0.71 | 40.66 | 81.37 | 0.75 |
| NN | 148.72 | 297.63 | 0.34 | 25.60 | 28.68 | 0.71 | 67.73 | 135.55 | 0.48 |
| PLSR | 73.64 | 147.37 | 0.02 | 27.53 | 32.99 | 0.71 | 39.78 | 79.60 | 0.75 |
*Note: best results are in bold.
Table 5.
Performance of the proposed MLRAs applied to UAV image with and without UAV-generated NDRE, LAI, and canopy height information, and integrated in the hybrid PROSAIL + MLRAs models.
Table 5.
Performance of the proposed MLRAs applied to UAV image with and without UAV-generated NDRE, LAI, and canopy height information, and integrated in the hybrid PROSAIL + MLRAs models.
| MLRAs applied to UAV image | MLRAs applied to UAV image including UAV-derived NDRE, LAI and canopy height model | Hybrid (PROSAIL + MLRA) applied to UAV image | |||||||
|---|---|---|---|---|---|---|---|---|---|
| RMSE µg/cm2 | NRMSE % | R2 | RMSE µg/cm2 | NRMSE % | R2 | RMSE µg/cm2 | NRMSE % | R2 | |
| GPR | 17.60 | 19.72 | 0.67 | 9.27 | 10.38 | 0.91 | 38.89 | 43.56 | 0.06 |
| KRR | 16.11 | 18.05 | 0.72 | 8.31 | 9.31 | 0.92 | 83.21 | 93.20 | 0.25 |
| LSLR | 15.57 | 17.44 | 0.74 | 9.77 | 10.94 | 0.90 | 92.46 | 103.57 | 0.02 |
| NN | 18.49 | 20.70 | 0.66 | 13.34 | 14.94 | 0.81 | 35.80 | 40.10 | 0.02 |
| PLSR | 16.59 | 18.58 | 0.73 | 9.26 | 10.37 | 0.91 | 92.46 | 103.57 | 0.02 |
*Note: best results are in bold.
Disclaimer/Publisher’s Note: The statements, opinions and data contained in all publications are solely those of the individual author(s) and contributor(s) and not of MDPI and/or the editor(s). MDPI and/or the editor(s) disclaim responsibility for any injury to people or property resulting from any ideas, methods, instructions or products referred to in the content. |
© 2024 by the authors. Licensee MDPI, Basel, Switzerland. This article is an open access article distributed under the terms and conditions of the Creative Commons Attribution (CC BY) license (http://creativecommons.org/licenses/by/4.0/).
Copyright: This open access article is published under a Creative Commons CC BY 4.0 license, which permit the free download, distribution, and reuse, provided that the author and preprint are cited in any reuse.


