Submitted:
14 May 2024
Posted:
15 May 2024
You are already at the latest version
Abstract
The article examines the relationship between household food waste and GDP in various European regions, aiming to determine how economic prosperity influences household food waste levels. Using comparative analysis of secondary and tertiary data, we developed a synthetic indicator (IpFW), to assess the interaction between GDP per capita and household food waste per capita. Despite expectations, higher GDP did not consistently correlate with lower food waste, challenging assumptions about economic prosperity and environmental stewardship. The research underscores the complex interplay between economic factors and food waste management, revealing no significant correlation even at regional levels. It also highlights the potential of e-commerce in enhancing food waste reduction strategies. E-commerce platforms can optimize food supply chains and consumer behavior, contributing to more sustainable consumption patterns. The conclusions call for a reevaluation of policies and suggest that integrating e-commerce could bolster efforts to manage food waste more effectively, aligning with the Sustainable Development Goals.
Keywords:
e-commerce
; household food waste
; regions
; Europe
; GDP
; 2030 Agenda SDGs
1. Introduction
The United Nations’ Sustainable Development Goals (SDGs) represent an integrated and collaborative approach to global development that involves governments, the private sector, civil society, and individual citizens. Achieving these goals requires an interdisciplinary approach and strong collaboration between all mentioned stakeholders. The implementation of the SDGs requires strong commitment and coordinated action from all countries, including underlying social and economic parties [1].
SDG 12: Responsible Consumption and Production is one of the 17 Sustainable Development Goals (SDGs) adopted by the UN in September 2015. All 17 goals are interconnected and aim to address the most pressing global issues, including poverty, hunger, health, education, inequality of gender, access to energy, climate change, and environmental protection. These goals are part of the UN’s 2030 Agenda for Sustainable Development, which aims to achieve a more sustainable and prosperous future for all people and for our planet [2].
Within SDG 12: Responsible Consumption and Production, there is a specific objective (12.3) meant to reduce worldwide food waste per capita by half until 2030 (this objective is also taking into account household levels). The target includes reducing food waste through measures such as downsizing the amount of food purchased, storing and preserving food properly, planning food purchases more carefully, sharing and donating surplus food to those in need, and using cooking techniques that minimize waste [3,4].
Reducing food waste at the household level is equally essential for achieving the specific goal of SDG 12.3: Food Loss and Waste, as well as the general goal of SDG 2: Zero Hunger and SDG 13: Climate Action, as it can contribute to reducing greenhouse gas emissions and increasing the efficiency and sustainability of food supply chains [5,6].
Given the current context, it is obvious that a strong and better-coordinated government policy is more feasible if supported by a stronger economy, with a high GDP, as the government can have the financial and human resources required to effectively implement and monitor public policies. This statement is especially valid for complex and interdisciplinary policies, such as those aimed at reducing food waste [7].
A number of additional studies are already showing that a strong and more stable economy can create a more favorable environment for the implementation of effective public policies, including policies to reduce food waste. Druckman et al. show that higher economic growth can help finance the investment needed to reduce food waste in households and other sectors [8].
In addition, based on the abovementioned premises, the EU adopted the Common Agricultural Policy (CAP), which has been in operation for over 60 years, with the aim of ensuring food security in the Member States of the European Union, while taking into account access to food at affordable prices for consumers. According to the European Court of Auditors (2016), the EU budget for the financial years 2021-2027, holds food security as the most important objective for the financial support of agriculture through the CAP [9,10].
Food waste, including household food waste – a valid phenomenon in consumer behavior around the world, is a determinant factor for food security [11]. On an imaginary scale, we appreciate that as more adults waste food; more people die or suffer from hunger. At the same time as more children are pretentious about their food, even more children die of hunger or malnutrition [12,13,14].
Food waste is one of the major concerns of every EU Member State and the EU as a whole. To this end, the measures that have been and are being adopted both at the level of each EU Member State and at the EU level are increasingly important and consistent. Yet, despite all this, the above-mentioned measures prove to be ineffective [15]. Household food waste, a behavior in which each consumer engages within the confines of their homes, is a widespread phenomenon, present on all continents, in all geographical regions and in all countries, while the reason for this is due to a large variety of factors [16]. If in sub-Saharan Africa and South-East Asia, for example, the reason for food waste can be attributed to the poor infrastructure of the relevant industries [14], in Europe and especially the EU, the situation is completely different [17].
According to the Food and Agriculture Organization of the United Nations, quoted by Global Food Waste Statistics 1.3 billion tons of edible food, or 1/3 of global production, are wasted annually worldwide, which would be enough to feed approximately 2 billion people [18]. At the same time, this trend is growing, with the amount of food waste worldwide expected to increase by another third by 2030 [19,20].
Food waste can be reduced mainly at the household level [3,21,22,23]. In essence, household food waste is the largest contributor to the phenomena as a whole. Food waste manifests itself in several stages of the food chain, but the most important sectors are households, food service and retail. According to the United Nations Environment Program - Food Waste Index Report 2021 [23], high-income countries with a high gross domestic product (GDP), annually average 79 kg/capita household food waste, 26 kg/capita food service waste, and 13 kg/capita retail food waste.
In the European Union and in Europe in general, household food waste is and has been constantly present at various levels. Currently, there is a large variance in food waste across European geographical areas, to the extent that there may not be homogeneity even within a certain group of countries. Therefore, in some regions of Europe, which group countries with high GDP compared to other European countries, the average per capita household food waste is high. A high value of GDP per capita largely implies a wealthy population [24,25]. This fact should reflect the level of education and citizens’ concern for the natural resources and the labor used in the production process of food that ends up wasted [26]. This assumption is supported both by international bodies, responsible for the management of natural resources, in general, and food security, in particular, and by researchers in the field of the food chain [27,28].
2. Materials and Methods
Comparative analysis of secondary and tertiary data is a method used in economics to assess the differences and relationships between two or more variables in different countries or regions. We use the same method in order to understand the differences and possible relationships between household food waste per capita, GDP per capita and linked tertiary sets of data from European countries. With regard to the mentioned tertiary data, we have chosen various related indicators published by the [23] data which is published by the World Bank - International Monetary Fund World Economic Outlook [29], World Bank Report 2018 (for: Andorra, Faroe Islands, Isle of Man, Liechtenstein, Monaco) [30,31,32,33,34] and data published by CIA’s World Factbook [35].
First, we use comparative analysis to assess the amount of household food waste per capita (HFWkg/capita/year) in each European country. This allows the identification of significant differences for HFWkg/capita/year between European countries. Furthermore, the approach maps the countries with the highest and lowest amounts of wasted food at household level. At the same time, we use comparative analysis to assess GDP per capita per year (GDPthous.USD/capita/year) in each European country. This allows us to identify significant differences in the level of economic prosperity between European countries and to identify countries with the highest and lowest GDPthous.USD/capita/year.
Secondly, we created a synthetic indicator IpFW (Personal Food Waste Indicator) to evaluate the relationship between the two variables. This indicator is calculated by relating GDPthous.USD/capita/year to the amount of HFWkg/capita/year in each country. In this manner, we can identify the best and worst performing countries in terms of the relationship between the level of economic prosperity and the amount of wasted food. Taking into consideration the ratio between the two, in analyzing the correlation between GDP and the level of household food waste, proves relevant. Therefore:
where:
IpFW = GDPthous.USD/capita/year / HFWkg/capita/year
IpFW – Personal Food Waste Indicator (HFWkg/capita/year depending on GDPthous.USD/capita/year)
GDPthous.USD/capita/year – GDP in relation to a single citizen of the country
HFWkg/capita/year – household food waste in relation to a single citizen of the country
Thirdly, we use a linear regression analysis to observe the data, and thus perform an interpretation to smooth resulting problems and observations. Testing the correlation between the statistical data series GDPthous.USD/capita/year, respectively HFWkg/capita/year, was carried out using the non-parametric Kendall’s tau-b test, using the SAS procedure Studio Correlation Analysis. This was first used for all European countries, and secondly for groups of countries, associated by the geographical position criteria: North, South, East and West of Europe. In addition, Pearson’s linear correlation coefficient was used for testing the links between the two series (GDPthous.USD/capita/year; HFWkg/capita/year) for all European countries. The graphic representation of the linear regression functions are a result of the Scatter plot regression procedure in SAS STUDIO, as well.
Since GDP, according to its definition, is the total market value of all final goods and services produced in a country in a given year and is a representative indicator of a country’s economic level in terms of production, justifies its use in this study (World Bank, 2020). Each country reports its own data in its own currency, and in order to be able to compare data, it is necessary for each country’s national statistics to be converted into a common currency. The World Bank uses the US dollar as its conversion currency, which is also the currency of choice for our study.
3. Results
3.1. Household Food Waste and GDP in European Countries
In the following section, we will treat each European major cardinal area as in individual case study in relation to economic well-being and food waste.
3.1.1. Household Food Waste and GDP in the Countries of the Northern European Region
The Northern European countries are countries with significantly higher GDPthous.USD/capita/year than countries in many other parts of Europe. This varies between USD 23.13 thous. and USD 82.18 thous. per capita per year. The level of HFWkg/capita/year varies between 55 and 81 kg per capita per year. It should be noted that in the case of the Northern Europe region, the country with the highest GDP in terms of US dollar amount per capita per year is also the country with the lowest level of household food waste, respectively Ireland. Detailed by country, the level of household food waste variation in Northern Europe is as following: Denmark 81 kg per capita per year (GDP USD 58.60 thous. per capita per year), Estonia 78 kg per capita per year (GDP USD 23.13 thous. per capita per year), Faroe Islands 76 kg per capita per year (GDP USD 63.85 thous. per capita per year – the last available reported being in 2018), Finland 65 kg per capita per year (GDP USD 48.10 thous. per capita per year), Iceland 76 kg per capita per year (GDP USD 61.22 thous. per capita per year), Ireland 55 kg per capita per year (GDP USD 82.18 thous. per capita per year), Isle of Man 76 kg per capita per year (GDP USD 88.33 thous. per capita per year - the last available report - 2018), Latvia 76 kg per capita per year (GDP USD 17.27 thous. per capita per year), Lithuania 76 kg per capita per year (GDP USD 19.90 thous. per capita per year), Norway 79 kg per capita per year (GDP USD 68.29 thous. per capita per year), Sweden 81 kg per capita per year (GDP USD 52.71 thous. per capita per year), United Kingdom 77 kg per capita per year (GDP USD 39.07 thous per capita per year) [23,30,31,32,33,34,35] (Figure 1).
In Northern Europe, the weighted average of HFWkg/capita/year, relative to the total population in this region, is about 49% higher than in Eastern Europe (in absolute values: Eastern Europe 51 kg per capita per year versus Northern Europe 76 kg per capita per year), in spite of the fact that the GDPthous.USD/capita/year of these countries is obviously much lower.
3.1.2. Household Food Waste and GDP in the Countries of the Southern European Region
The data presented in this region, unlike those in the regions presented above, are not fully reported for 2020 or are not reported at all in the last 3 years, but we appreciate that this does not jeopardize the objectivity of the study because the underlying countries do not have a numerically significant population, respectively: Albania 83 kg HFWkg/capita/year (GDP USD 4.88 thous. per capita per year), Andorra 84 kg HFWkg/capita/year (GDP USD 40.77 thous. per capita per year- the last available report - 2018), Spain 77 kg HFWkg/capita/year (GDP USD 26.58 thous. per capita per year) [23,30,31,32,33,34,35] (Figure 2).
The weighted average of household food waste in Southern Europe, relative to the total population, is the highest in the whole of Europe, respectively 78 kg per capita per year, and with the lowest GDPthous.USD/capita/year, bearing an interval between USD 4.88 and USD 41.46 thous. per capita per year.
An interesting observation points out that this region hosts the countries with the first two highest values of household food waste in all of Europe, namely Greece (142 kg per capita per year) and Malta (129 kg per capita per year). Although it is difficult to justify this situation, it can be assumed that the high level of household food waste is because the economic activities of the two countries are mainly based on tourism. Their tourist units are family-ran, as family tourist boarding houses shared with the respective families’ homes, which is why it is possible that food waste was reported in the “household food waste” category and not in the “food service” category. Regardless, the situation in these two countries is worrying.
3.1.3. Household Food Waste and GDP in the Countries of the Eastern European Region
Eastern European countries are countries with a high level of household food waste, which ranges between 33 and 94 kg per capita per year. Hungary, with a GDP of USD 15.51 thous. per capita per year, has the highest level of household food waste in Europe and the EU, reaching 94 kg per capita per year. At the opposite end of Eastern Europe is Poland, with 56 kg HFWkg/capita/year (GDP USD 15.35 thous. per capita per year) and the Russian Federation, with 33 HFWkg/capita/year (GDP USD 9.92 thous. per capita per year). The rest of the countries in this region have an intermediate level of household food waste, as follows: Belarus 68 kg HFWkg/capita/year (GDP USD 6.07 thous. per capita per year, also being the second lowest in Eastern Europe), Bulgaria 68 kg HFWkg/capita/year (GDP USD 9.65 thous. per capita per year), and the Czech Republic 70 kg HFWkg/capita/year (GDP USD 22.68 thous. per capita per year, with the largest food waste in Eastern Europe) [23,29,35,36] (Figure 3).
3.1.4. Household Food Waste and GDP in the Countries of the Western European Region
The weighted average of HFWkg/capita/year, relative to the total population of this region of Western Europe is the second lowest in all of Europe, with 65 kg HFWkg/capita/year, and values ranging between 39 and 90 kg HFWkg/capita/year. Also, it is worth mentioning that the GDPthous.USD/capita/year is the highest, ranging from USD 39.27 to- USD 185.10 thous. per capita per year, as listed below: Austria 39 kg HFWkg/capita/year (GDP USD 48.34 thous. per capita per year), Belgium 50 kg HFWkg/capita/year (GDP USD 43.70 thous. per capita per year), France 85 kg HFWkg/capita/year (GDP USD 39.27 thous. per capita per year), Germany 75 kg HFWkg/capita/year (GDP USD 45.27 thous. per capita per year), Liechtenstein 72 kg HFWkg/capita/year (GDP USD 181.70 thous. per capita per year - the last available report - 2018), Luxembourg 90 kg HFWkg/capita/year (GDP USD 112.02 thous. per capita per year), Monaco 72 kg HFWkg/capita/year (GDP USD 185.10 thous per capita per year - the last available report -2018), Netherlands 50 HFWkg/capita/year (GDP USD 51.84 thous. per capita per year), Switzerland 72 kg HFWkg/capita/year (GDP USD 82.73 thous. per capita per year) [23,31,32,33,34,35,36] (Figure 4).
It should be noted that both in terms of HFWkg/capita/year and GDPthous.USD/capita/year, the values achieved by Liechtenstein and Monaco are almost identical, which reveals the similarity of economic aspects. Although economic performance is well above the average of other Western European countries, the level of household food waste is above the average in this region. On the other hand, Switzerland, which has a reduced GDPthous.USD/capita/year of less than half of these two states, has a similar level of HFWkg/capita/year, respectively all 3 states, Monaco, Liechtenstein and Switzerland have HFWkg/capita/year of 72 kg.
3.2. Personal Food Waste Synthetic Indicator (IpFW) in Europe
If we consider that economic performance implies a higher level of education and, inherently, a higher level of the population’s responsibility towards food, then the value of the ratio between GDP and household food waste, in terms of per capita level, should be as high as possible, in the sense that a high economic performance should generate a low level of food waste. This hypothesis was sustained by the mentioned literature, which concluded that the higher the GDP, the lower the household food waste should be, which in turn yields a higher value for the personal food waste indicator. Using the formula for IpFW (1), we determined the values for all European countries (Table 1).
The assumption that the higher the GDP, the lower the household food waste should be, which, in turn, brings a higher value for the personal food waste indicator, is not confirmed. Using the IpFW formula and interpreting these data graphically, it is revealed that the value of this indicator is not high, as expected, in all European countries whose GDP is high. (Figure 5.)
This situation is not confirmed due to the fact that if GDPthous.USD/capita/year is high, its ratio with a high level of HFWkg/capita/year will not be a low one, respectively, even if food waste is high, GDP being also high, the IpFW value will also be high. So, the hypothesis that high GDP generates a greater responsibility towards natural resources, implicitly towards food, is not confirmed.
In this context we applied another analysis, persisting in identifying the correlation supported by the SGDs using a different approach.
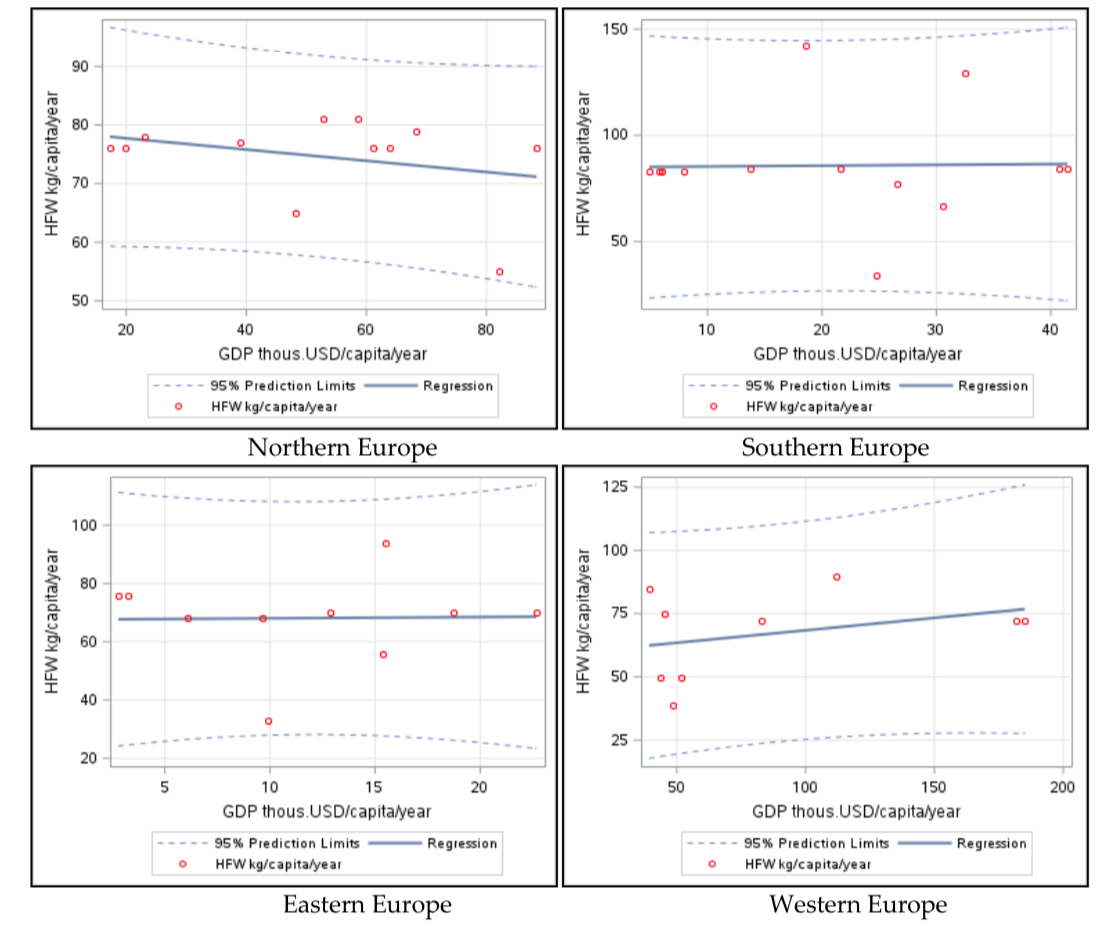
Therefore, we have tested the correlation between the statistical data series GDPthous.USD/capita/year, respectively HFWkg/capita/year, using the non-parametric Kendall’s tau-b test, with the SAS procedure Studio Correlation Analysis, for all European states. The graphic representation of the linear regression functions, as shown in Figure 6, is a result of using SAS STUDIO, with the Scatter plot regression procedure, for all European countries.
Furthermore, Pearson’s linear correlation coefficient is used when testing the links between the two series (GDPthous.USD/capita/year, HFWkg/capita/year) for the data related to all European countries. Following this test, when the analysis is performed for all European countries, low values of the correlation coefficients Pearson r = - 0.06 and Kendall τ = - 0.08 resulted, with high p-values of over 0.4. Thus, it is revealed that at the European level, there is no connection of statistical significance between GDPthous.USD/capita/year, and HFWkg/capita/year).
In order to find out if the situation changes at various European regional levels, we tested the correlation between the statistical data series GDPthous.USD/capita/year, respectively HFWkg/capita/year, using the non-parametric Kendall’s tau-b test, with the SAS procedure Studio Correlation Analysis software, for the following geographical areas (as defined above): the Northern Europe states, the Southern European states, the Eastern European states, and Western European states. The graphic representation of the linear regression functions, using SAS STUDIO with the Scatter plot regression procedure, is presented in Figure 7 for each European region.
Therefore, the absence of correlation is also confirmed at regional levels. Thus, in all 4 groups of countries, the Kendall correlation coefficients present values close to 0, ranging between -0.08 and 0.16. Moreover, the p-values are high, exceeding the α=5% threshold. This fact indicates an absence of correlation between the analyzed series. Also, the data does not indicate a significant departure from the 0 value of the correlation coefficient.
4. Discussion
In the context of household food waste, economic performance, assessed in terms of GDP, should reflect the level of responsibility of the population towards food in general, environmental care and towards the resources needed to obtain foods items [16,37,38].
Even if some studies show that a strong and more stable economy can create a more favorable environment for implementing effective public policies, including policies to reduce food waste, in practice this does not happen. While estimates recommend that higher economic growth can help finance the investment needed to reduce food waste in households and other sectors, this has no concrete effects related to household food waste, at least.
Responsibility towards food in general materializes in the awareness that food is the source of life, nutrients, and health of every citizen of each country. Viewing things from this perspective, makes us realize that in every country there are people, more or less, who are economically disadvantaged, and who suffer from lack of food and, implicitly, from hunger. Awareness of this should generate a special respect for food.
Responsibility for environmental protection materializes in the awareness and the assumption that food manufacturing has a negative impact on the environment, through generated waste, including household food waste. Household food waste pollutes the environment in various ways, and it is becoming increasingly difficult for society to manage the implicit outcome [39]. Disposing of this waste is the result of employing technologies that affect the environment in ways that are currently unquantifiable. At the same time, intensive agriculture is extremely polluting by stimulating plant and livestock production, through various technologies, intended to increase output. If food would not be subject to waste, the food needs of the population would decrease, and therefore this increase in production would not be necessary.
The forms of household food waste materialize in various aspects, in addition to the very frequent action of throwing food in the trash because too much has been bought and exceeded its shelf life. Other forms of household food waste include consumption of food in excessive quantities and the consumption of products of animal origin in excess, beyond the nutritional needs of the human body. Obesity and overweightness are a consequence of metabolic food waste, except for situations imposed by medical reasons [40]. Meat and meat products, as well as milk and dairy products, are in demand far beyond people’s protein needs, which generates the demand for intensive exploitation of animals, which also in turn depletes plant resources. Most often vegetable proteins can successfully replace animal protein for human consumption. Should norms be implemented in this sense, it would substantially reduce the negative impact on the environment, as well on the consumers’ health [41,42].
In the digital era, electronic commerce (e-commerce) emerges as a transformative force in tackling household food waste, leveraging technology to enhance both economic and environmental outcomes. While traditional economic growth has shown a limited direct impact on reducing food waste, e-commerce presents innovative pathways to connect surplus food with needs, or better inventory management for perishable food items, and thereby reducing waste and its associated environmental burden. Online platforms can facilitate more efficient food distribution systems, matching excess food with demand in real-time and thus mitigating the overproduction and excess purchasing that lead to waste. Furthermore, e-commerce enables the promotion of awareness campaigns directly to consumers, educating them about sustainable consumption practices and the importance of minimizing food waste. These platforms can also support the implementation of policies by providing data-driven insights into consumer behavior and waste patterns, offering a potent tool for policymakers to craft more targeted and effective food waste strategies. Thus, e-commerce not only supports economic growth but also fosters a more responsible stewardship of resources, highlighting its critical role in achieving sustainable food systems and environmental protection [43,44,45,46].
Responsibility for the resources needed to obtain food, which is finally wasted, is another issue that public policymakers should take into account. Water is one of the basic resources in food production, along with energy, land, and labor. The more food we waste in each household, the more water, energy, land, and labor go to waste [47,48]. Furthermore, food packaging is also manufactured in a large industry that consumes large quantities of natural resources, in addition to the pollution factor. If food waste were reduced, the consumption of all these natural resources would, in turn, be reduced.
In Europe, as in much of the developed world, household food waste represents a significant challenge to sustainability goals, with economic implications that ripple through societies. Traditionally, Gross Domestic Product (GDP) has been a marker of economic health but does not inherently account for environmental outcomes like food waste. However, the digital era presents new opportunities to redefine the interplay between economic performance and sustainability through the lens of e-commerce.
E-commerce, has surged, reshaping consumer behaviors and market dynamics. In the context of GDP and food waste, e-commerce platforms are uniquely positioned to influence both. They can optimize supply chains, reduce excess production, and facilitate the redistribution of food, thus addressing one of the critical points of waste in the food service and retail sectors.
- -
- Streamlining supply chains. E-commerce can streamline food supply chains by enabling more direct interactions between producers and consumers. Platforms can use predictive analytics to gauge demand more accurately, reducing the overproduction that often leads to significant waste. For instance, online grocery stores can adjust orders based on real-time consumer purchasing data, ensuring that only the needed food items are harvested and transported. Another advantage of this just-in-time inventory approach reduces waste at the retail level, as better date usage leads to lowering the amounts of perishable food items that reach expiration dates. This precision, overall, reduces the environmental burden and aligns better with sustainable GDP growth by focusing on efficiency over volume.
- -
- Enhancing consumer awareness. Furthermore, e-commerce platforms are powerful tools for consumer education. They can provide information directly to consumers about sustainable practices, such as how to store food properly to extend its shelf life or recipes designed to use leftover ingredients. By integrating sustainability into the consumer experience, e-commerce not only helps reduce waste at the household level but also promotes a culture of responsibility that can have broad implications for GDP. Educated consumers are likely to make purchasing decisions that reflect their values, favoring products and services that align with sustainability goals.
- -
- Facilitating food redistribution. Another significant advantage of e-commerce is its ability to facilitate the redistribution of food that would otherwise go to waste. Platforms can connect businesses with surplus products to consumers or charities that can use these products. This not only helps reduce waste but also supports social welfare programs, indirectly contributing to a healthier economy by alleviating some of the burdens on social services.
- -
- Policy integration. To maximize the impact of e-commerce on reducing food waste and enhancing GDP, policymakers need to integrate digital strategies into broader economic and environmental policies. Regulations that support fair digital marketplaces, data protection, and the promotion of green technologies can enhance the effectiveness of e-commerce in sustainability practices.
5. Conclusions
Measures to reduce food waste are becoming more pronounced but are still insufficient and inefficient [9,49,50]. Food waste cannot be associated only with certain social or demographic categories or with countries with a certain level of GDP. It is a form of human behavior commonly found not only in regions across Europe but in all countries globally, in all socio-demographic categories [9].
According to the UN, half of the fruits and vegetables harvested worldwide go to waste [51]. At the European level, the FAO estimated in 2013 that the quantity of food wasted in Europe could feed 200 million people [17]. Currently, the actual results that have come to pass far exceed the FAO quotas from 2013. Recent estimates indicate more waste than in previous years, due to the fact that the estimation methods are much improved as a result of food policy implementation at the state level [2]. No matter how food waste is analyzed and how realistic household food waste estimates are, it is a fact that people around the world are wasting a lot of food. Of course, it is debatable how much of this waste cannot be avoided (inedible parts of vegetables and fruits, as well as meat, unavoidable perishability during storage and transportation, etc.) [52,53]. Regardless, it is an undeniable fact that food waste is present in households in each country across Europe.
If we consider that the level of education of the population is dependent on the economic performance of each state, then a higher GDP should generate a more educated population, with increased responsibility for food, environmental protection, and the resources needed to produce these foods [54,55,56]. This does not happen in reality, as we managed to prove. In Europe, the level of household food waste varies greatly across countries (between 33 - 142 kg per capita per year), and this fact is not dependent on the GDP of those countries (between USD 2.78 – USD 185.10 thous. per capita per year), as might be erroneously estimated.
The issue of food waste is even more serious since household food waste is not the sole factor that significantly raises its value per capita.
Given these issues, we conclude that the UN’s strategy to combat food waste needs to be more concrete and better strengthened. The UN should improve the measures previously taken to reduce food waste and draw up concrete action plans for each country, depending on individual specifics. At the same time, in order to facilitate food donation, the UN should adopt uniform legislation, which clearly regulates the scope and encourages food donation in all forms, including the form of e-commerce, which would otherwise be wasted, even more now. This point of view is strengthened by the recent extraordinary circumstances surrounding the COVID-19 pandemic experience when more people were suffering from a lack of proper food [57].
If there is a certain connection between GDP and food waste at the household level, it is not a direct or simple one. First, a country’s GDP is a result of several factors, such as household consumption, investments, government expenditure and net exports [58,59]. Therefore, we cannot conclude that an increase or decrease in GDP will automatically have a direct impact on household food waste.
Second, household food waste can be influenced by several internal and external factors, such as living standards, food habits, food education, food infrastructure and services, government policy, etc. These factors can vary from country to country and have a different impact on food waste.
However, there are some possible links between GDP and food waste at the household level. For example, an increase in GDP can bring an improvement in living standards and an increase in income, which can lead to a change in eating habits and a reduction in food waste [26,60]. Likewise, a stronger, better, and more realistically adapted, better-coordinated governmental policy on food waste management can be supported by a stronger and more stable economy.
In summary, there are some possible links between GDP and food waste at the household level, but these are complex and cannot be generalized without considering the specific context of each country. All in all, each particular context must refer especially to consumer behavior, consumption practices and habits.
In this context, e-commerce plays a pivotal role not only in enhancing economic efficiency but also in addressing pressing global challenges such as food waste. As outlined by the United Nations’ Sustainable Development Goals, reducing food waste is essential for responsible consumption and production (SDG 12.3). E-commerce can be a powerful tool in this fight, offering innovative solutions that optimize food distribution and consumption patterns. For instance, online platforms can help match supply with demand more accurately, reducing overproduction and surplus which often lead to waste. Moreover, e-commerce facilitates better consumer education on food sustainability through targeted content and smarter purchasing options, potentially leading to a more informed consumer base that makes choices that can reduce waste. The integration of e-commerce into the management of food systems promises not only to enhance economic growth, as evidenced by its correlation with GDP but also to foster more sustainable consumer behaviors. This dual benefit underscores the importance of further interdisciplinary research into the nexus between e-commerce, economic indicators, and environmental sustainability [43,44,45,46].
Finally, the main potential venue of reducing household food waste is educating the population to develop responsibility and respect for food. For this purpose, the IpFW indicator should be an important benchmark for the population’s educational level. Thus, the higher the GDP per capita per year will be (in thousands of USD), the lower should the household food waste be (in kg per capita per year). Therefore, holding the statement that a high individual financial standing implies a higher level of education to be true, the IpFW indicator proposed in this article should ideally be as high as possible.
One of the main weaknesses of the SDGs regarding food waste is that there is not efficient target dedicated to reducing it, including their monitoring and quantification stages. SDG 12: Responsible Consumption and Production of the UN’s 2030 Agenda for Sustainable Development, has the overall objective of ensuring sustainable patterns of consumption and production. This goal includes several sub-goals related to reducing waste and greenhouse gas emissions but does not explicitly address household food waste [61].
In addition, the SDGs do not provide a clear and very objective definition of household food waste, which leads to different interpretations from country to country. However, it is mentioned that objective government policies, with strong economic support, are needed to reduce the waste of natural resources, in general.
The SDGs also lack a specific framework for monitoring and reporting progress in reducing food waste. Although there is a specific indicator under SDG 12.3 Food Loss and Waste, monitoring the progress of food loss and waste reduction remains problematic, as there is no universal set of definitions and means of measurement.
While the SDGs offer a broad framework for sustainable development, they lack specific and measurable targets for reducing food waste. To enhance the effectiveness of these goals, a dedicated objective focused on minimizing food waste, accompanied by a clear, universally accepted definition and a robust monitoring, and reporting mechanism, is essential. E-commerce can play a pivotal role in this context by providing innovative tools for tracking and analyzing food consumption patterns. This data can help in setting precise targets and assessing progress more accurately, making e-commerce an integral part of the strategy to achieve and measure the proposed food waste reduction goals within the SDG framework.
Author Contributions
Conceptualization, A.D.G. and I.M.B.; methodology, A.D.G.; software, I.M.B; validation, A.D.G. and I.M.B.; formal analysis, I.M.B.; investigation, A.D.G.; resources, A.D.G.; data curation, I.M.B.; writing—original draft preparation, A.D.G. and I.M.B.; writing—review and editing, A.D.G. and I.M.B.; visualization, A.D.G. and I.M.B.; supervision, A.D.G. and I.M.B..; project administration, A.D.G. and I.M.B.; funding acquisition, A.D.G. All authors have read and agreed to the published version of the manuscript.
Funding
This research received no external funding.
Institutional Review Board Statement
Not applicable.
Informed Consent Statement
Not applicable.
Conflicts of Interest
The authors declare no conflicts of interest.
References
- United Nations’ Sustainable Development Goals (2023) The 17 Goals. Available at https://sdgs.un.org/goals.
- United Nations’ Sustainable Development Goals (2023) Transforming our world: the 2030 Agenda for Sustainable Development. Available at https://sdgs.un.org/2030agenda.
- FAO, IFAD, UNICEF, WFP and WHO (2023). The State of Food Security and Nutrition in the World 2023. Urbanization, agri-food systems transformation and healthy diets across the rural-urban continuum. Rome, FAO. [CrossRef]
- FAO, IFAD, UNICEF, WFP and WHO (2020). The State of Food Security and Nutrition in the World 2020. Transforming food systems for affordable healthy diets. Rome, FAO. Available at https://openknowledge.fao.org/items/08c592f2-1962-4e1a-a541-695f9404b26d (accessed on 11 January 2024).
- FAO Sustainable Development Goals Indicators (2023a) Available at https://www.fao.org/sustainable-development-goals/en/.
- Food and Agriculture Organization of the United Nations (2018) The Food Insecurity Experience Scale (FIES). Rome: FAO. Available at https://www.fao.org/in-action/voices-of-the-hungry/fies/en/ (accessed on 11 January 2024).
- Bartik TJ (1991) Who Benefits from State and Local Economic Development Policies?. Kalamazoo, MI: WE Upjohn Institute for Employment Research. Available at https://research.upjohn.org/up_press/77/.
- Druckman A, Chitnis M, Sorrell S and Jackson T (2011) Missing carbon reductions? Exploring rebound and backfire effects in UK households, Energy Policy 39 (6), 3572-3581. [CrossRef]
- European Court of Auditors (2016) Available at https://www.eca.europa.eu/Lists/ECADocuments/SR16_34/SR_FOOD_WASTE_EN.pdf (accessed on 20 January 2024).
- European Comission (2023). The common agricultural policy. Available at https://agriculture.ec.europa.eu/common-agricultural-policy/cap-overview/cap-2023-27_en (accessed on 20 January 2024).
- Global food waste statistics (2020) Available at https://cubii.co/en/global-food-waste-statistics-2020/ (accessed on 11 January 2024).
- Philippidis G, Sartori M, Ferrari E and M’Barek R (2019) Waste not, want not: A bio-economic impact assessment of household food waste reductions in the EU, Resources, Conservation and Recycling 146, 514-522. [CrossRef]
- Balan IM, Popescu, AC, Iancu T, Popescu G and Tulcan C (2020) Food Safety Versus Food Security in a World of Famine. Journal of Advanced Research in Social Sciences and Humanities 5(1), 20-30. https://dx.doi.org/10.26500/JARSSH-05-2020-0103.
- Pelau C, Sarbu R and Serban D (2020) Cultural Influences on Fruit and Vegetable Food-Wasting Behavior in the European Union, Sustainability 12(22). [CrossRef]
- Thomson Reuters Foundation (2018) In focus Food waste. Available at https://news.trust.org/packages/food-waste/ (accessed on 3 February 2024).
- Campoy MP, Alejandro CM, and Delgado C (2017) Economic impact assessment of food waste reduction on European countries through social accounting matrices. Resources, Conservation and Recycling. [CrossRef]
- FAO Food wastage footprint (2013). Impacts on natural resources - Summary Report. Available at http://www.fao.org/3/i3347e/i3347e.pdf (accessed on 11 January 2024).
- FAO, IFAD, UNICEF, WFP and WHO. 2020. The State of Food Security and Nutrition in the World 2020. Transforming food systems for affordable healthy diets. Rome, FAO. [CrossRef]
- Hegnsholt E, Unnikrishnan S, Pollmann-Larsen M, Askelsdottir B and Gerard M (2018). Boston Consulting Group.Tackling the 1.6-Billion-Ton Food Loss and Waste Crisis. Available at https://www.bcg.com/publications/2018/tackling-1.6-billion-ton-food-loss-and-waste-crisis (accessed on 10 February 2024).
- Barrera EL and Hertel T (2021) Global food waste across the income spectrum: Implications for food prices, production and resource use. Food Policy. [CrossRef]
- Macková M, Hazuchová N and Stávková J (2019) Czech consumers’ attitudes to food waste. Agricultural Economics – Czech 65, 314–321. http://doi.org/10.17221/364/2018-AGRICECON.
- Ratinger T, Tomka A, and Boskova I (2016) Sustainable consumption of bakery products; a challenge for Czech consumers and producers, Agricultural Economics – Czech 62(10), 447–458. http://doi.org/10.17221/244/2015-AGRICECON.
- United Nations Environment Programme (2021). Food Waste Index Report 2021. Nairobi. Available at https://www.unep.org/resources/report/unep-food-waste-index-report-2021 (accessed on 13 February 2024).
- Grier KB and Gordon T (1989) An empirical analysis of cross-national economic growth, 1951–1980. Journal of Monetary Economics 24(2), 259-276. [CrossRef]
- Easterly W and Aart K (2000). Small states, small problems? Income, growth, and volatility in small states. World Development 28(11), 2013-2027. [CrossRef]
- UNESCO (2022) Education increases awareness and concern for the environment, Available at https://world-education-blog.org/2015/12/08/education-increases-awareness-and-concern-for-the-environment/ (accessed on 11 January 2024).
- Dietz T, Stern PC and Guagnano GA (1998) Social Structural and Social Psycho-logical Bases of Environmental Concern. Environment and Behavior, 30(4), 450–471. [CrossRef]
- Prieur F and Thierry B (2013) Can education be good for both growth and the environment?, Macroeconomic Dynamics 17(5), 1135-1157. [CrossRef]
- World Bank (2020). Annual Report 2020, Available at https://thedocs.worldbank.org/en/doc/832891604352590592-0090022020/original/WorldBankGroupAnnualReportsExecutiveSummary.pdf (accessed on 31 January 2024).
- World Bank (2023) International Monetary Fund World Economic Outlook, World Bank Report. 2018. International Monetary Fund World Economic Outlook, Available at https://statisticstimes.com/economy/countries-by-gdp.php (accessed on 7 January 2024).
- World Bank (2023) International Monetary Fund World Economic Outlook, World Bank Report. 2018. Faroe Islands Available at https://data.worldbank.org/indicator/NY.GDP.MKTP.CD?locations=FO (accessed on 7 January 2024).
- World Bank (2023) International Monetary Fund World Economic Outlook, World Bank Report. 2018. Isle of Man, Available at https://data.worldbank.org/indicator/NY.GDP.MKTP.CD?locations=IM (accessed on 7 January 2024).
- World Bank (2023) International Monetary Fund World Economic Outlook, World Bank Report. 2018.Liechtenstein, Available at https://data.worldbank.org/indicator/NY.GDP.MKTP.CD?locations=LI (accessed on 7 January 2024).
- World Bank (2023) International Monetary Fund World Economic Outlook, World Bank Report. 2018.Monaco, Available at https://data.worldbank.org/indicator/NY.GDP.MKTP.CD?locations=MC (accessed on 7 January 2024).
- CIA’s World Factbook. (2021) Explore All Countries. Available at https://www.cia.gov/the-world-factbook/countries/ (accessed on 8 January 2024).
- International Monetary Fund. 2020. World Economic Outlook: A Long and Difficult Ascent. Washington, DC, October. Available at https://www.imf.org/en/Publications/WEO/Issues/2020/09/30/world-economic-outlook-october-2020 (accessed on 11 January 2024).
- United Nations Environment Programme, & International Resource Panel (2023) Decoupling Natural Resource Use and Environmental Impacts from Economic Growth. Available at https://wedocs.unep.org/20.500.11822/9816. (accessed on 17 March 2024).
- Yauheniya S and Mirzabaev A (2023) Social cost of household emissions: cross-country comparison across the economic development spectrum. Environment, Development and Sustainability. [CrossRef]
- Zhen HYK, Qiao Y, Li J, Ahmed WM, Tian G, Dorca-Preda T and Trydeman KM (2023) Household-level strategies to tackle plastic waste pollution in a transitional country, Urban Science 7(1). [CrossRef]
- Balan, Ioana Mihaela, Emanuela Diana Gherman, Ioan Brad, Remus Gherman, Adina Horablaga, and Teodor Ioan Trasca. 2022. “Metabolic Food Waste as Food Insecurity Factor—Causes and Preventions” Foods 11, no. 15: 2179. [CrossRef]
- Global Panel of Agriculture and Food System for Nutrition. (2019) Preventing nutrient loss and waste across the food system: Policy actions for high-quality diets. Policy Brief No. 12. London, UK: Global Panel on Agriculture and Food Systems for Nutrition. Available at https://www.glopan.org/wpcontent/uploads/2019/06/GlopanFoodLossWastePolicyBrief.pdf (accessed on 1 March 2024).
- Global Network Against Food Crises, Food Security Information Network (2020). Global Report on Food Crises, Joint Analysis for Better Decisions. Available at https://www.ifpri.org/publication/2020-global-report-food-crises-joint-analysis-better-decisions (accessed on 17 March 2024).
- Badircea, R.M., Manta, A.G., Florea, N.M., Popescu, J., Manta, F.L. and Puiu, S., 2021. E-commerce and the Factors Affecting its Development in the Age of Digital Technology: Empirical Evidence at EU–27 level. Sustainability, 14(1),. [CrossRef]
- Soava, Georgeta, Anca Mehedintu, and Mihaela Sterpu. “Analysis and forecast of the use of E-commerce in enterprises of the European Union States.” Sustainability 14, no. 14 (2022): 8943. [CrossRef]
- Kwilinski, Aleksy. “E-Commerce and Sustainable Development in the European Union: A Comprehensive Analysis of SDG2, SDG12, and SDG13.” In Forum Scientiae Oeconomia, vol. 11, no. 3, pp. 87-107. Wydawnictwo Naukowe Akademii WSB, 2023. [CrossRef]
- Grabara, Dariusz. “Sustainable E-commerce in the Perspective of SDGs and Online Marketplaces.” In Adoption of Emerging Information and Communication Technology for Sustainability, pp. 172-186. CRC Press, 2024. http://doi.org/10.14254/2071-789X.2023/16-1/6.
- Quested TE, Marsh E, Stunell D and Parry AD (2013) Spaghetti soup: The complex world of food waste behaviours, Resources, Conservation and Recycling 79, 43-51. [CrossRef]
- Kibler KM, Reinhart D, Hawkins C, Mohaghegh MA and Wright J (2018) Food waste and the food-energy-water nexus: A review of food waste management alternatives, Waste Management 74, 52-62. [CrossRef]
- Balan, Ioana Mihaela, Emanuela Diana Gherman, Remus Gherman, Ioan Brad, Raul Pascalau, Gabriela Popescu, and Teodor Ioan Trasca. 2022. “Sustainable Nutrition for Increased Food Security Related to Romanian Consumers’ Behavior” Nutrients 14, no. 22: 4892. [CrossRef]
- Nunkoo R, Bhadain M and Baboo S (2021) Household food waste: attitudes, barriers and motivations, British Food Journal 123(6), pp 2016-2035. http://doi.org/10.1108/BFJ-03-2020-0195.
- United Nations Environment Program (2022) Stop Food Waste! For People and Planet!, Available at https://www.unep.org/thinkeatsave/get-informed/worldwide-food-waste. (accessed on 10 February 2024).
- Lebersorger S and Schneider F (2011) Discussion on the methodology for determining food waste in household waste composition studies. Waste Manag 31, 1924–1933. [CrossRef]
- Barker H, Peter JS, Beth R, Zoe C and Dianna MS (2023) Towards Sustainable Food Systems: Exploring Household Food Waste by Photographic Diary in Relation to Unprocessed. Processed and Ultra-Processed Food, Sustainability 15(3), 2051. [CrossRef]
- Guiso L, Paola S and Luigi Z (2004) The Role of Social Capital in Financial Development. The American Economic Review 94(3), 526–56. http://doi.org/10.2139/ssrn.209610.
- Soubbotina T (2004) Beyond Economic Growth: An Introduction to Sustainable Development. Second Edition. © Washington, DC Available at https://www.gfdrr.org/sites/default/files/publication/Beyond%20Economic%20Growth_0.pdf (accessed on 17 March 2024).
- Barro RJ (2013) Education and economic growth. Annals of economics and finance 14(2), 301-328. https://search.oecd.org/education/innovation-education/1825455.pdf.
- World Health Organization (2020) WHO Manifesto for a healthy recovery from COVID-19, Available at https://www.who.int/news-room/feature-stories/detail/who-manifesto-for-a-healthy-recovery-from-covid-19.
- Alexiou C (2009) Government Spending and Economic Growth: Econometric Evidence from the South Eastern Europe (SEE). Journal of Economic and Social Research, 11(1), 1. https://www.academia.edu/20386560/Government_Spending_and_Economic_Growth_Econometric_Evidence_from_the_South_Eastern_Europe_SEE_.
- Ahuja D and Pandit D (2020) Public Expenditure and Economic Growth: Evidence from the Developing Countries. FIIB Business Review 9(3), 228–236. [CrossRef]
- Prados de la Escosura L (2023) Health, income, and the preston curve: A long view, Economics & Human Biology. [CrossRef]
- Sustainable Development Goals Help Desk (2023). All SDGs. Available at https://sdghelpdesk.unescap.org/SDGs/all-sdgs. [CrossRef]
Figure 1.
Household food waste and GDP in Northern Europe.
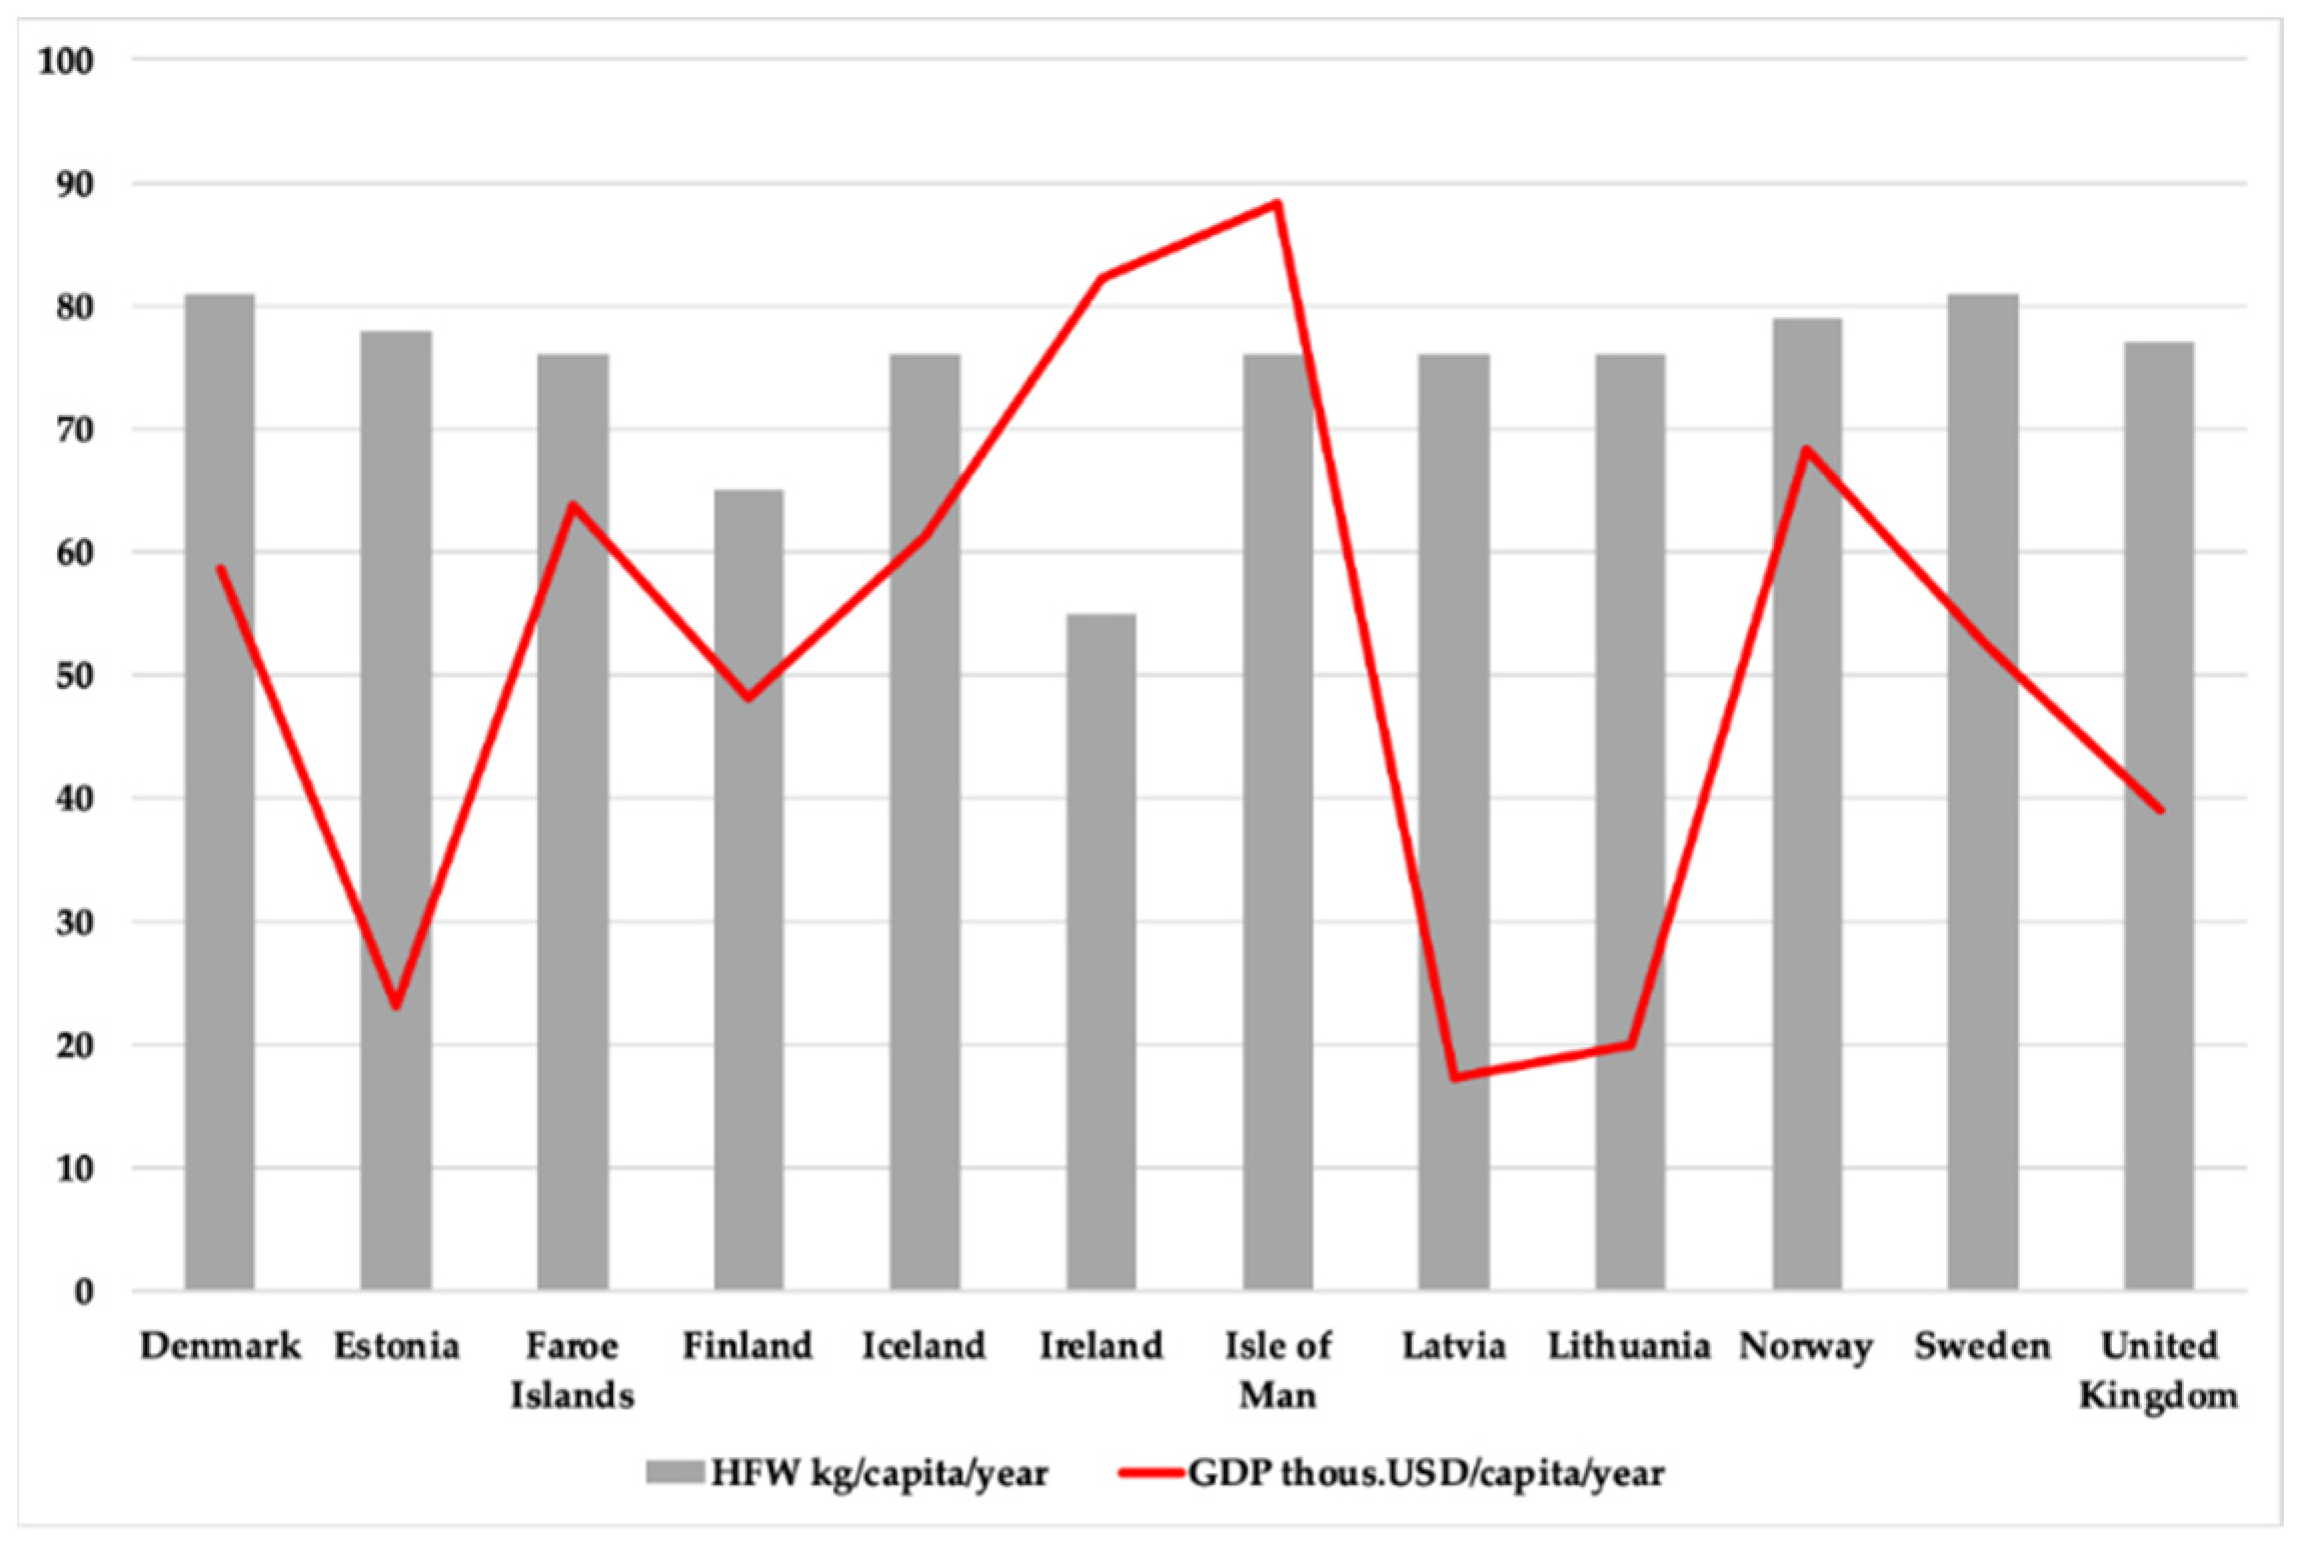
Figure 2.
Household food waste and GDP in Sothern Europe.
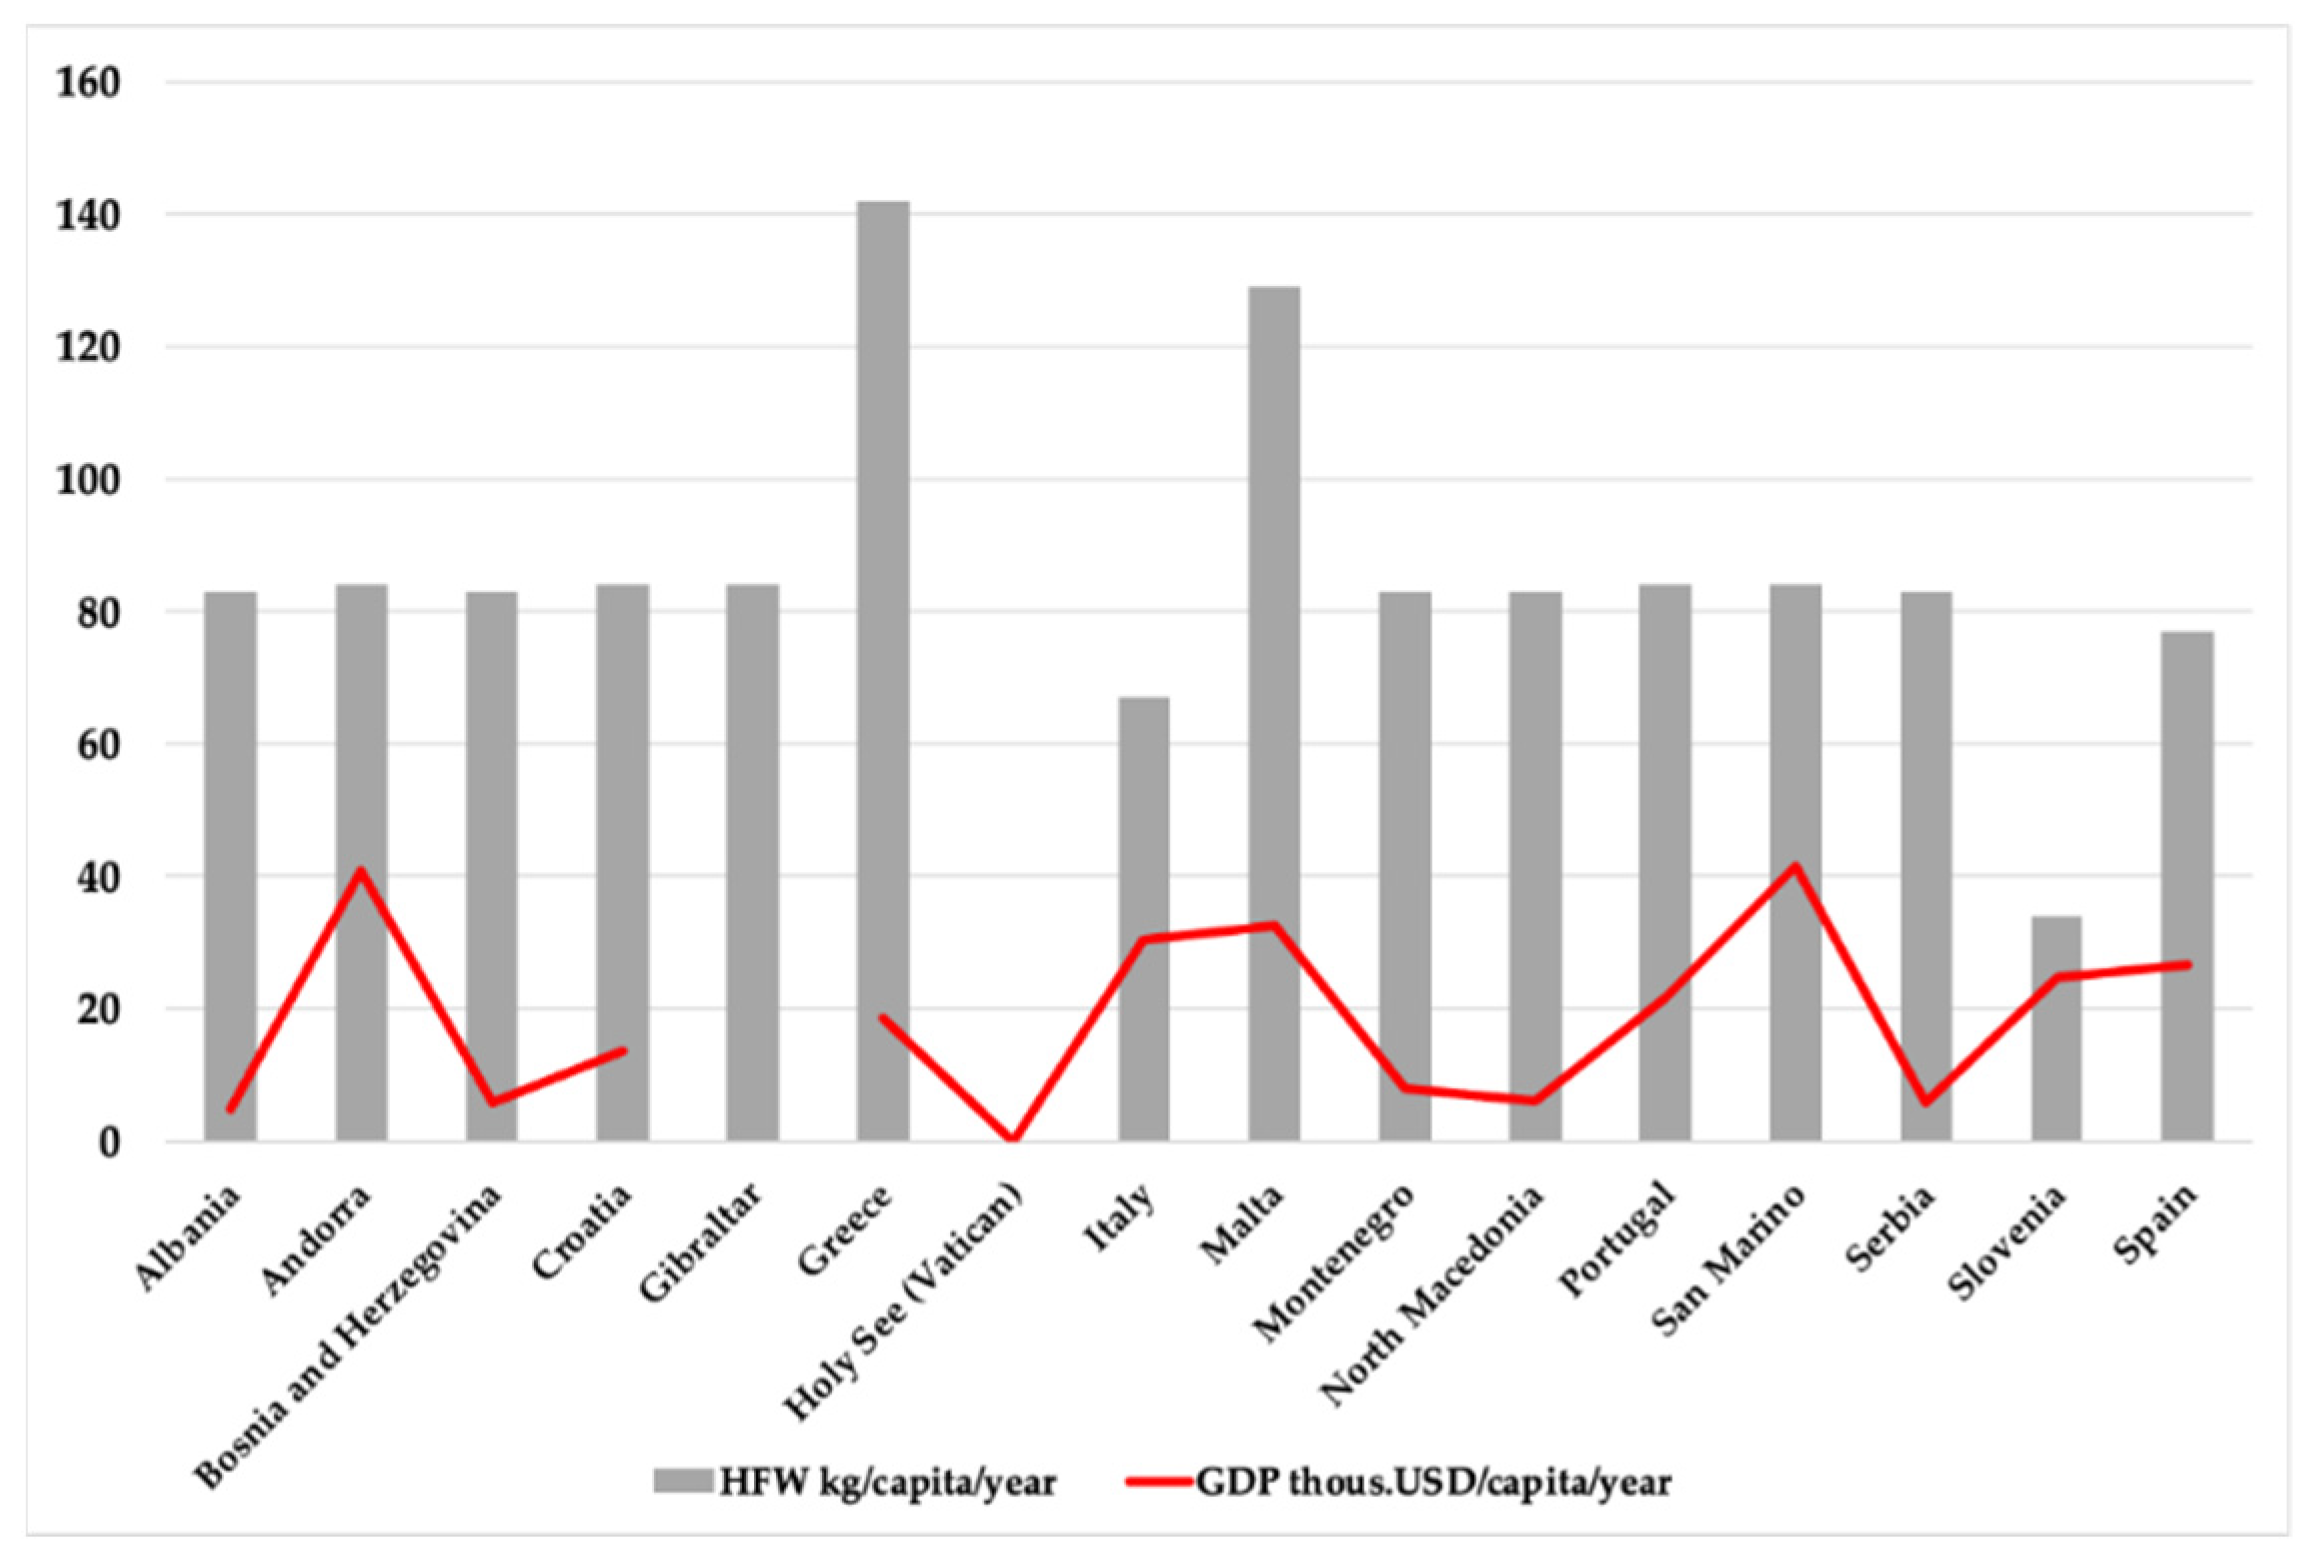
Figure 3.
Household food waste and GDP in Eastern Europe.
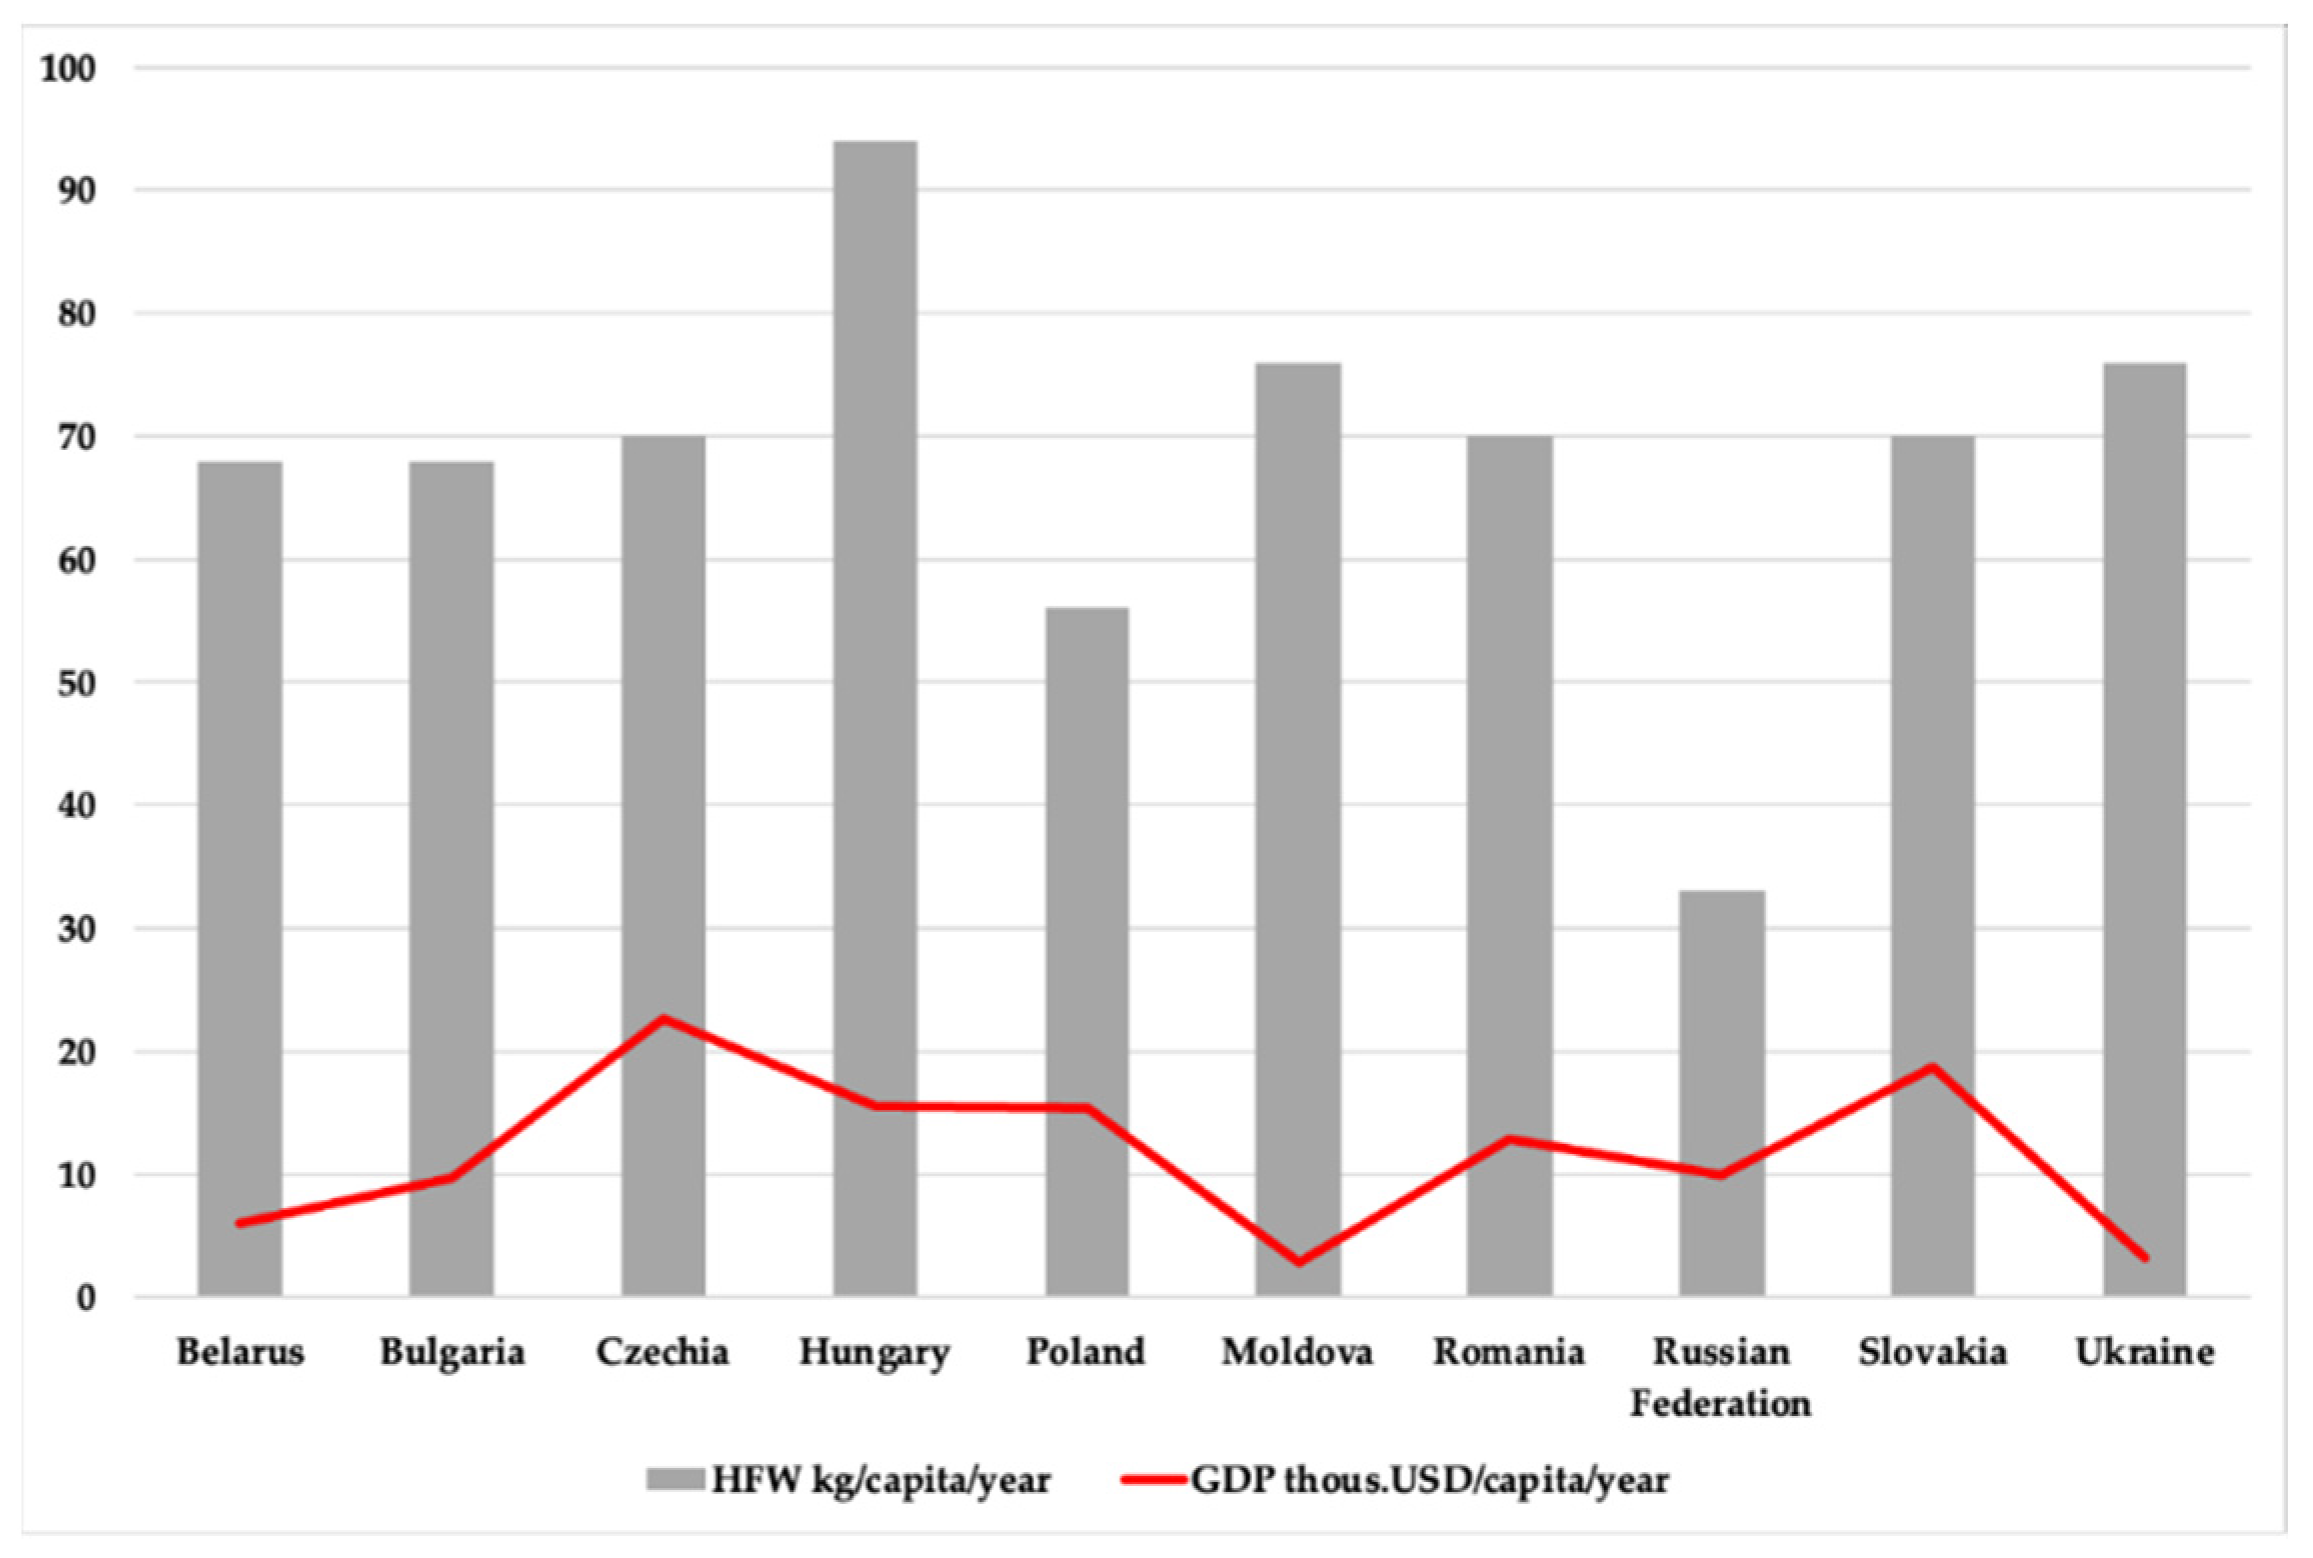
Figure 4.
Household food waste and GDP in Western Europe.
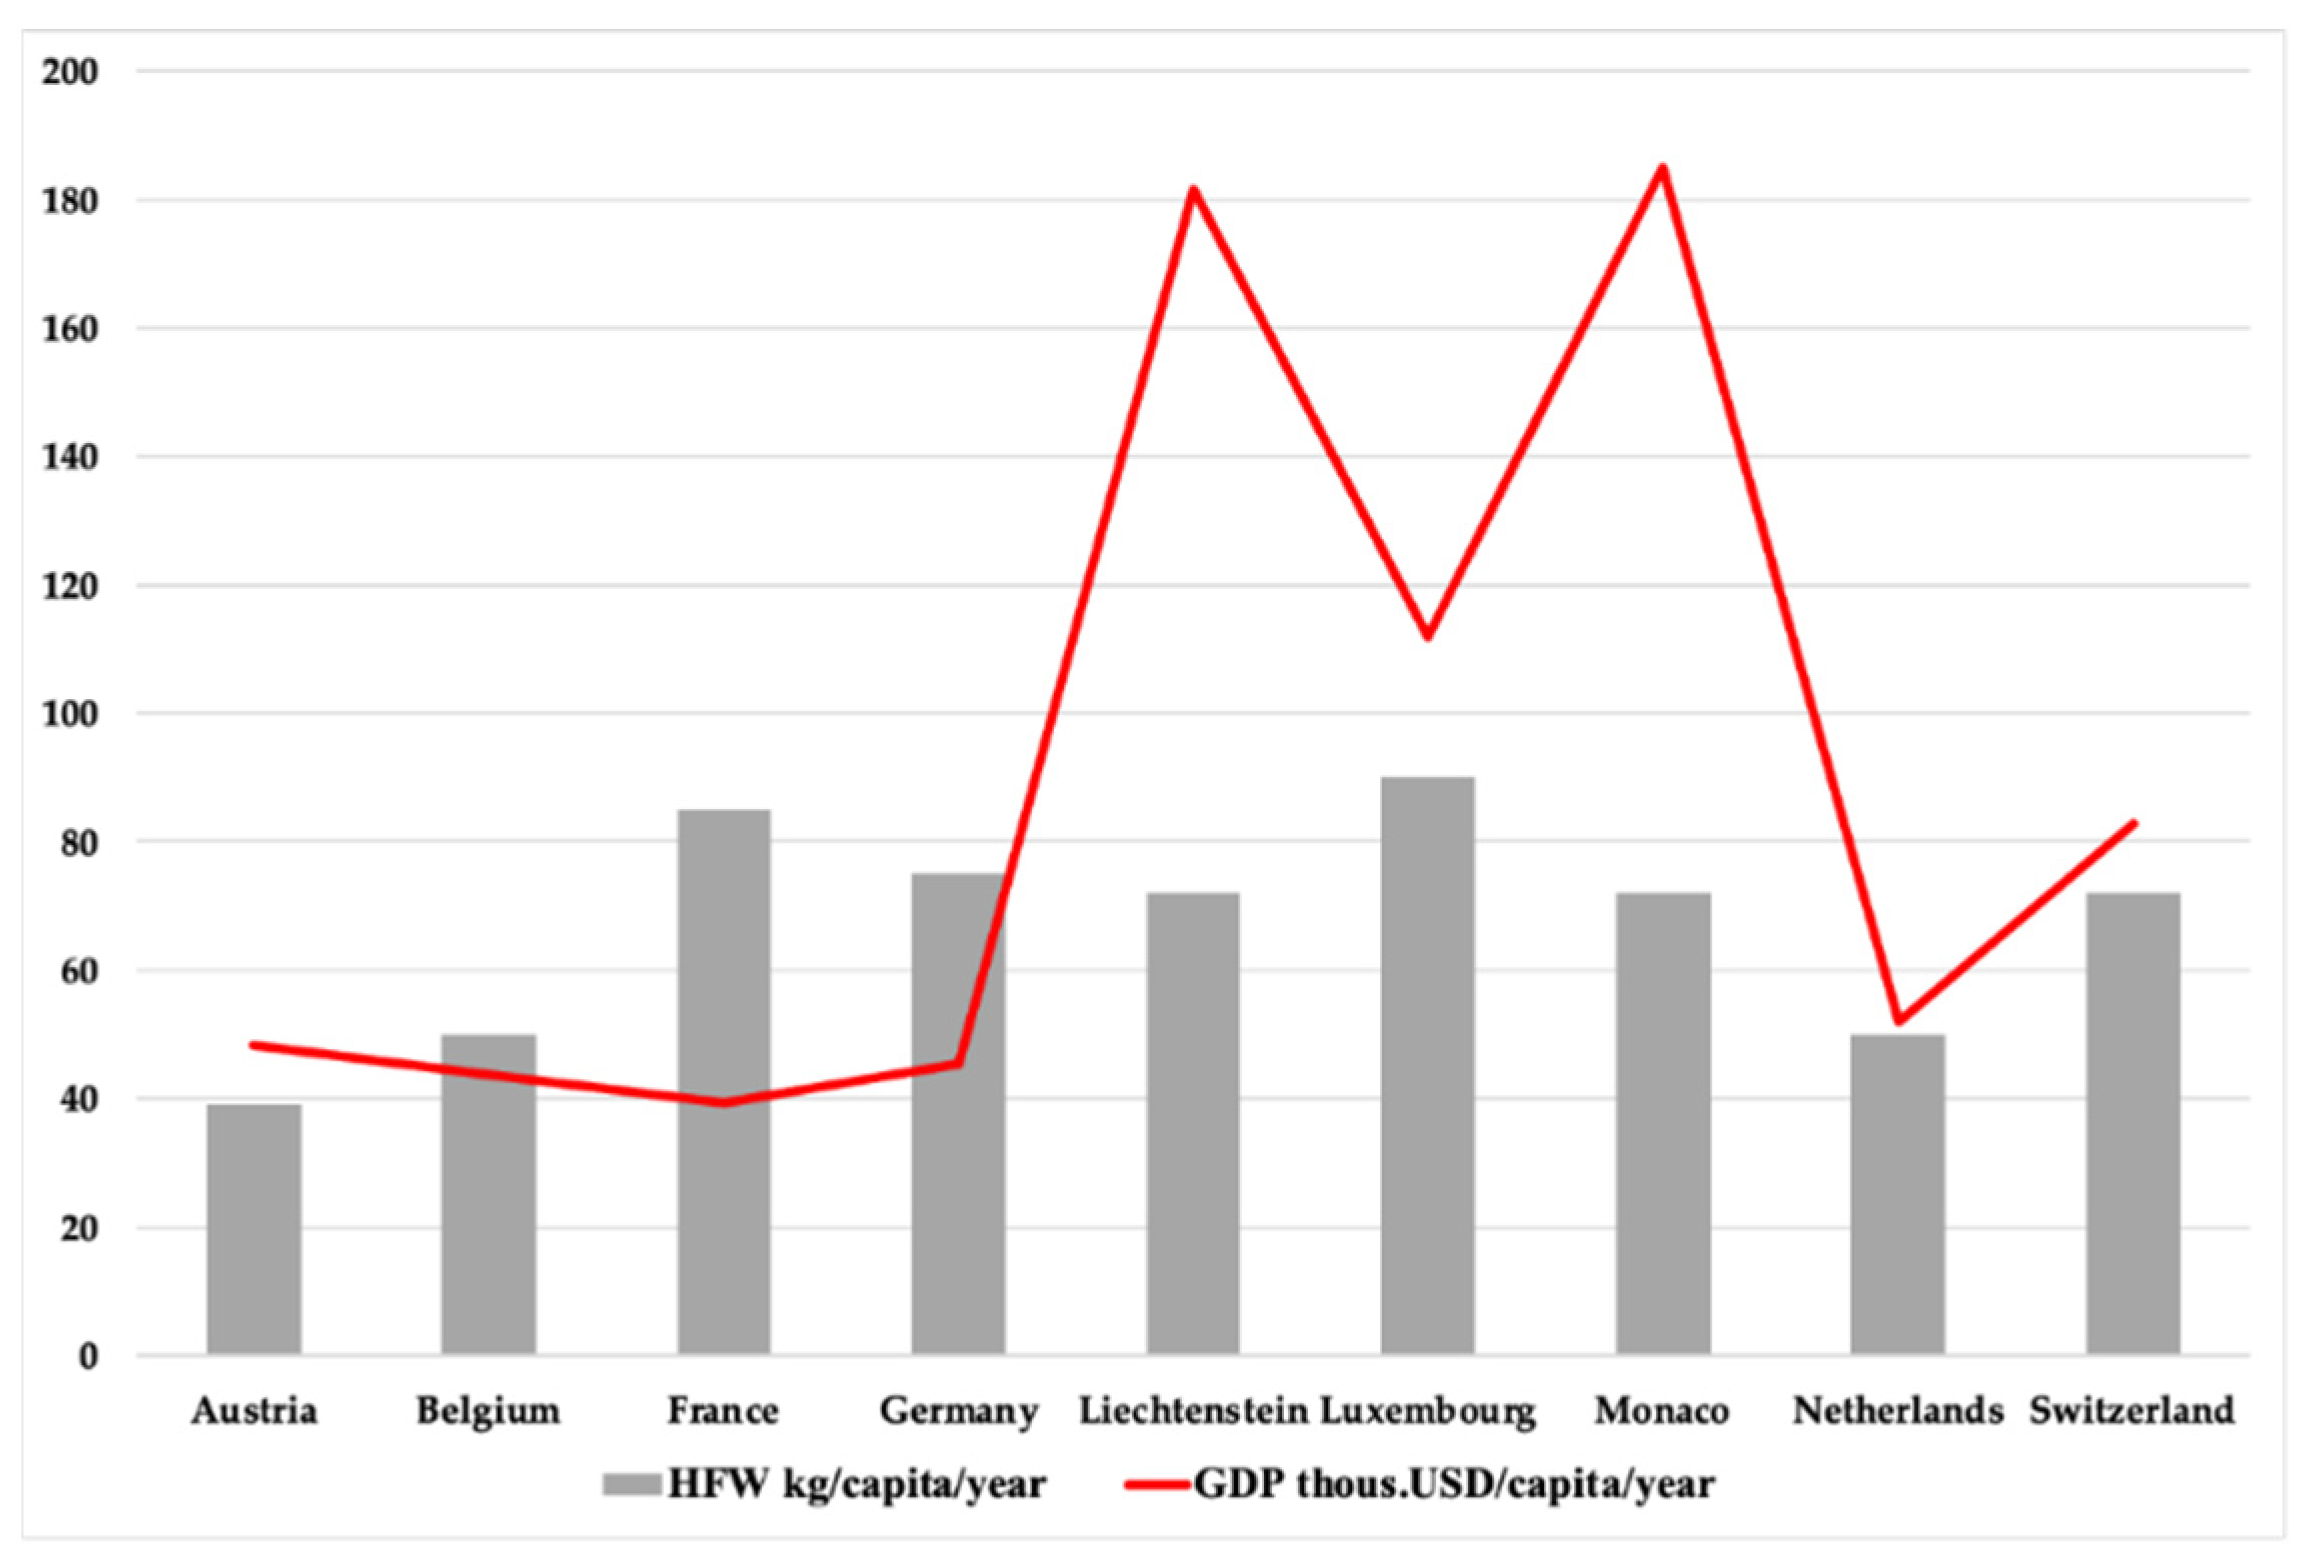
Figure 5.
Variation of IpFW in Europe by region.
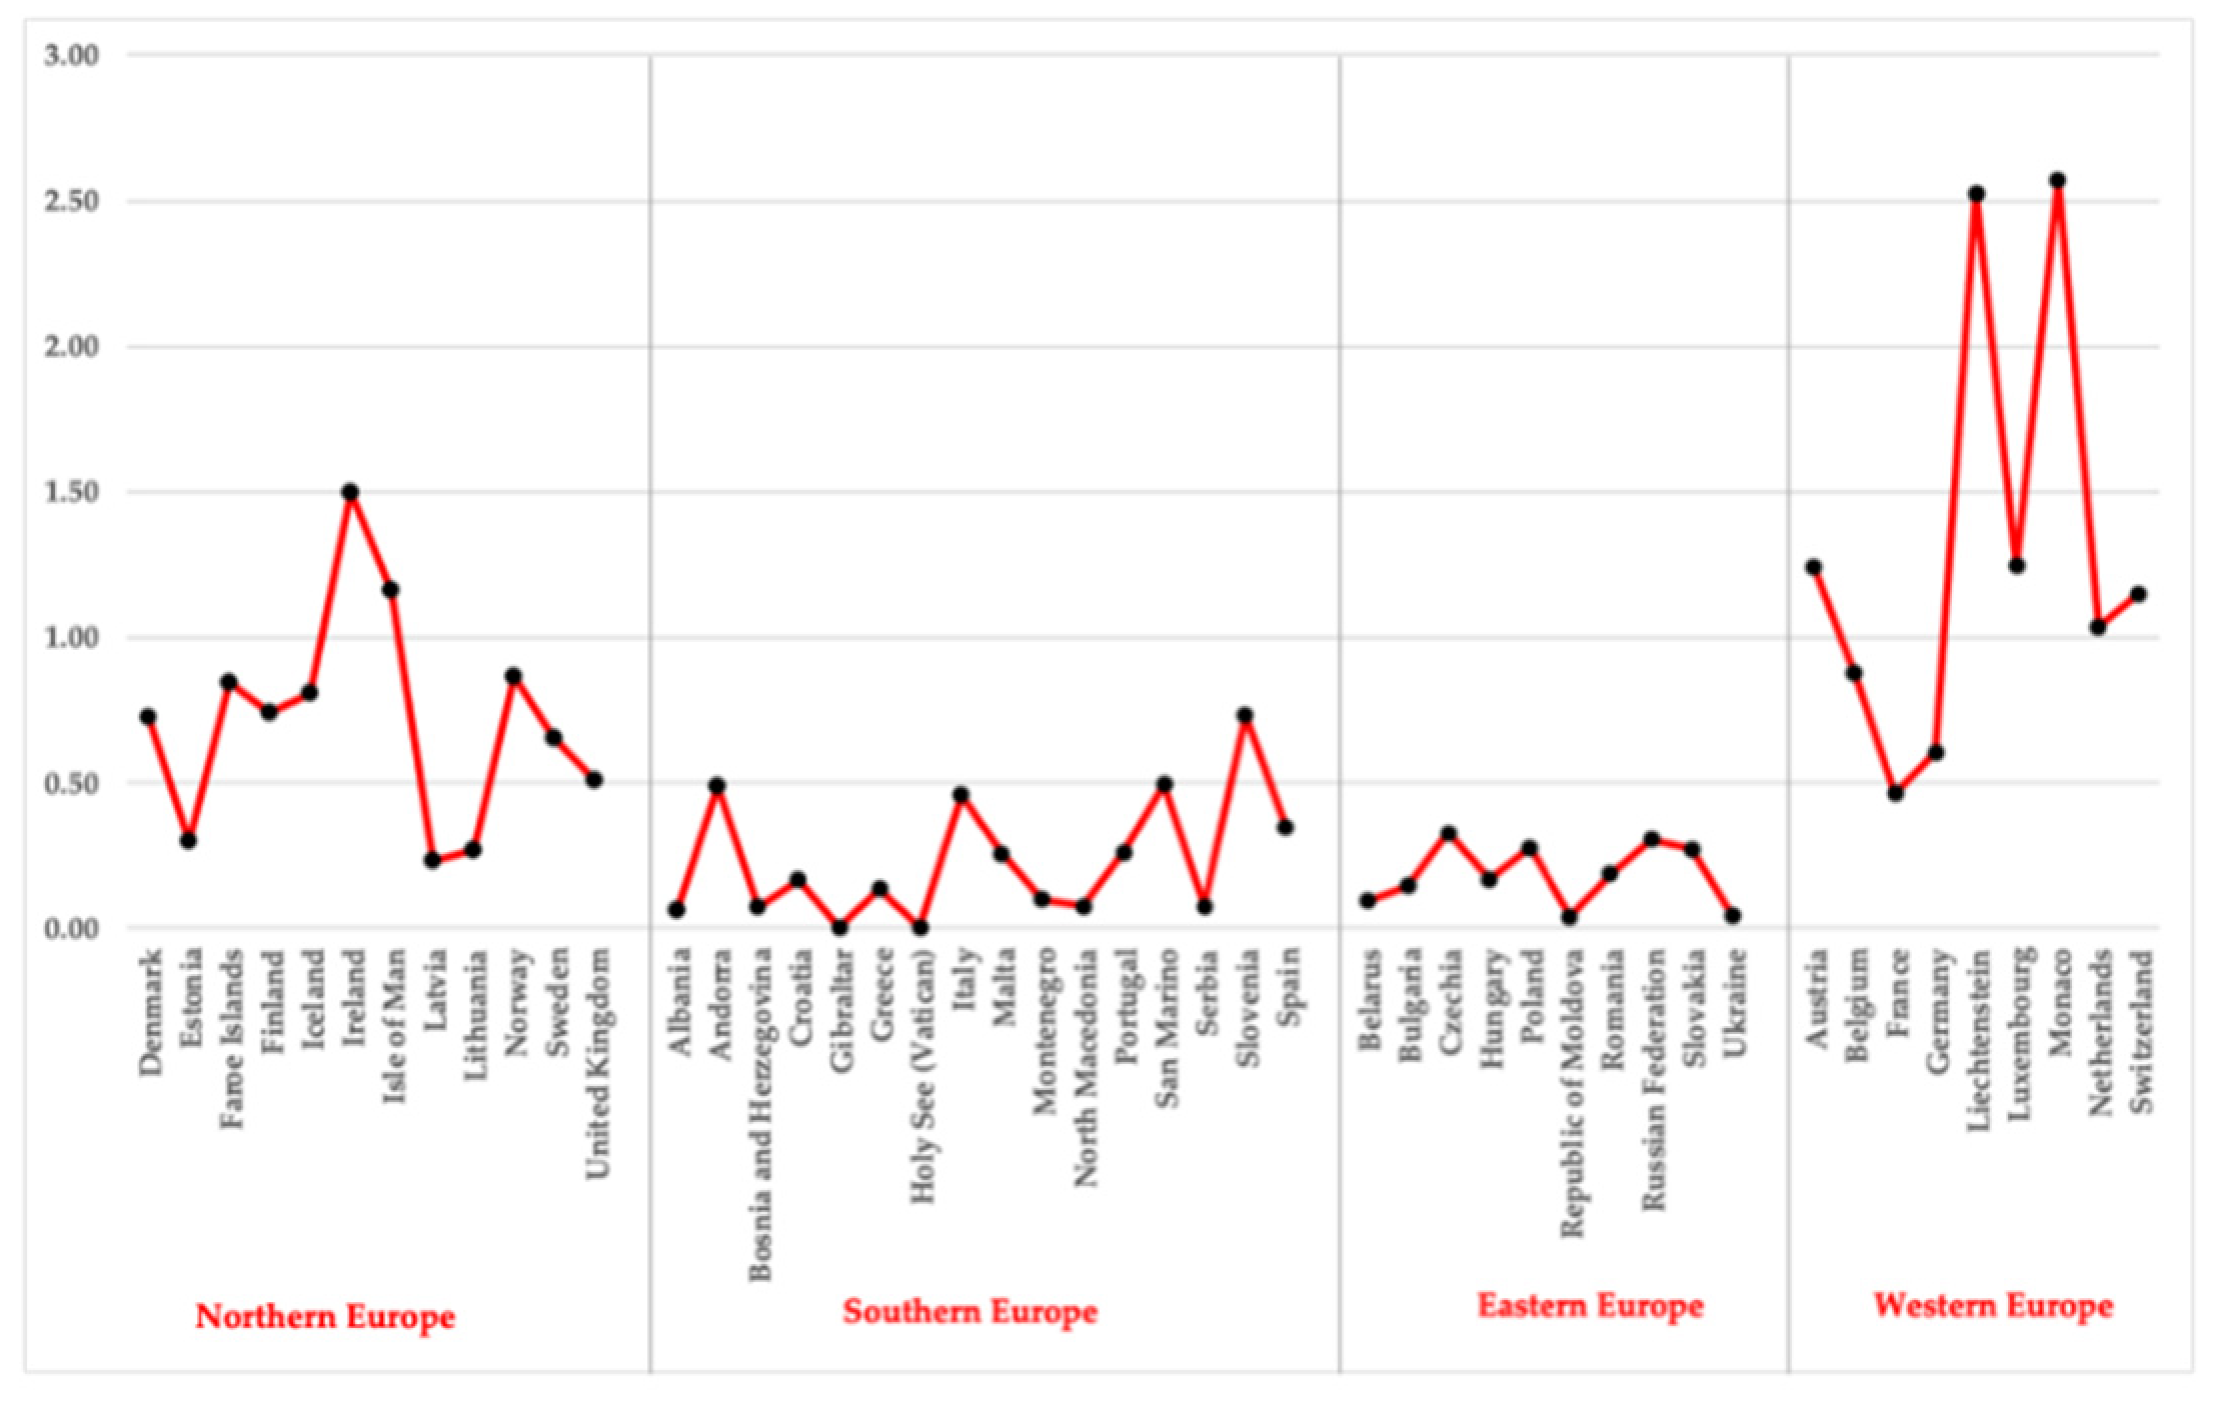
Figure 6.
The linear regression function for all European countries.
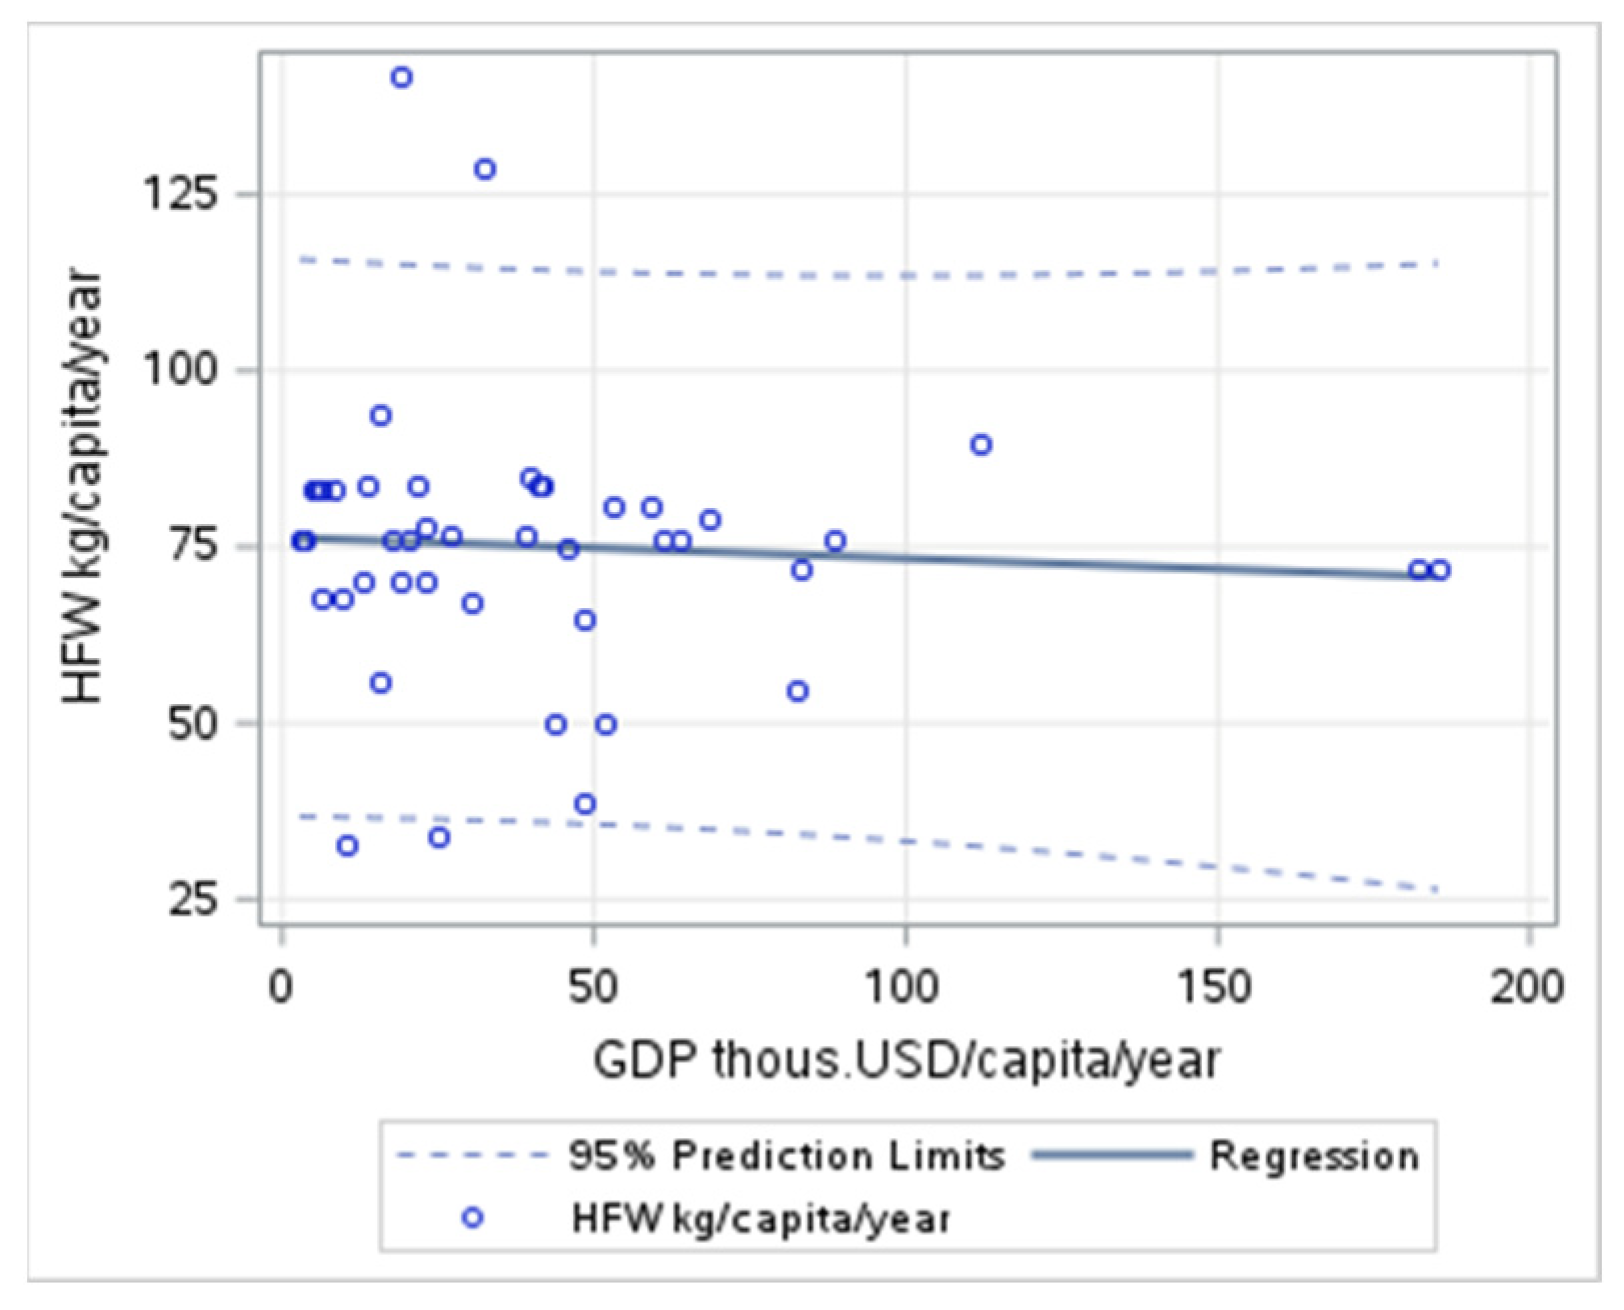
Figure 7.
The linear regression function for European geographical areas countries.
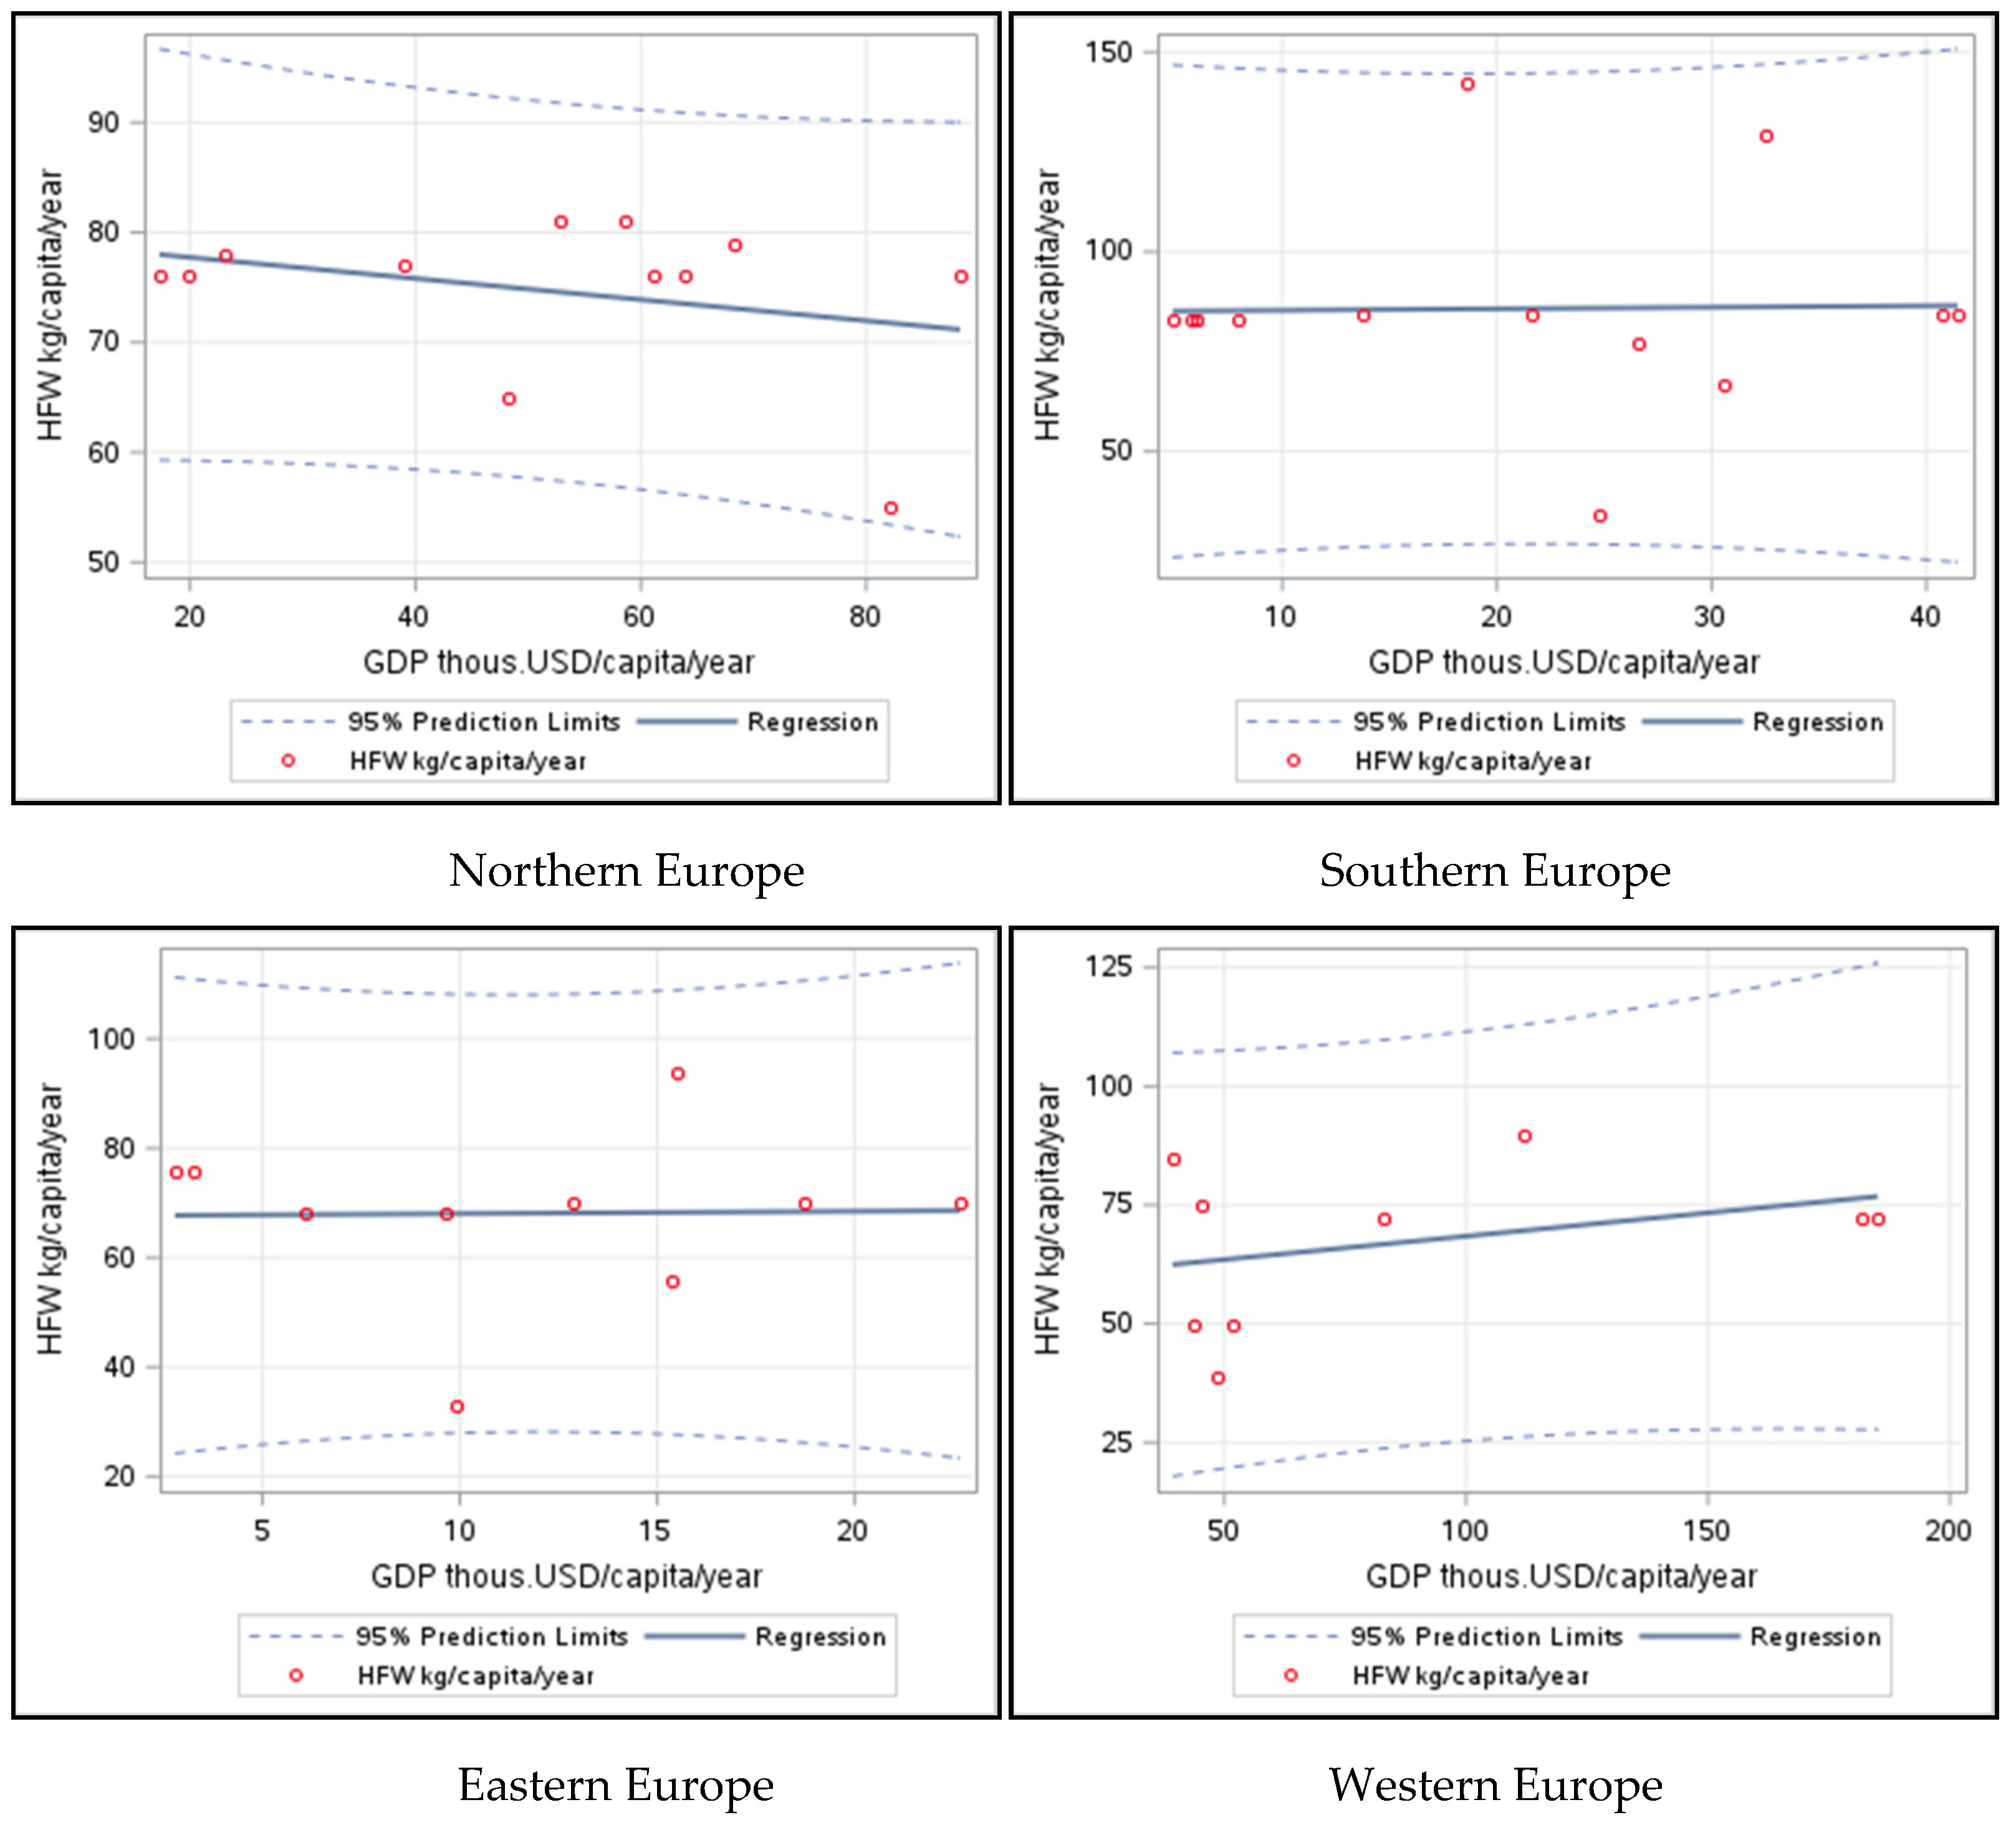

Table 1.
The level of IpFW in Europe.
| Country | GDP1 | HFW2 | IpFW | |
|---|---|---|---|---|
| Northern Europe | Denmark | 58.60 | 81 | 0.72 |
| Estonia | 23.13 | 78 | 0.30 | |
| Faroe Islands | 63.85 | 76 | 0.84 | |
| Finland | 48.10 | 65 | 0.74 | |
| Iceland | 61.22 | 76 | 0.81 | |
| Ireland | 82.18 | 55 | 1.49 | |
| Isle of Man | 88.33 | 76 | 1.16 | |
| Latvia | 17.27 | 76 | 0.23 | |
| Lithuania | 19.90 | 76 | 0.26 | |
| Norway | 68.29 | 79 | 0.86 | |
| Sweden | 52.71 | 81 | 0.65 | |
| United Kingdom | 39.07 | 77 | 0.51 | |
| Southern Europe | Albania | 4.88 | 83 | 0.06 |
| Andorra | 40.77 | 84 | 0.49 | |
| Bosnia and Herzegovina | 5.74 | 83 | 0.07 | |
| Croatia | 13.70 | 84 | 0.16 | |
| Gibraltar | * | 84 | * | |
| Greece | 18.60 | 142 | 0.13 | |
| Holy See (Vatican) | * | * | * | |
| Italy | 30.50 | 67 | 0.46 | |
| Malta | 32.45 | 129 | 0.25 | |
| Montenegro | 7.89 | 83 | 0.10 | |
| North Macedonia | 6.02 | 83 | 0.07 | |
| Portugal | 21.61 | 84 | 0.26 | |
| San Marino | 41.46 | 84 | 0.49 | |
| Serbia | 5.94 | 83 | 0.07 | |
| Slovenia | 24.77 | 34 | 0.73 | |
| Spain | 26.58 | 77 | 0.35 | |
| Eastern Europe | Belarus | 6.07 | 68 | 0.09 |
| Bulgaria | 9.65 | 68 | 0.14 | |
| Czechia | 22.68 | 70 | 0.32 | |
| Hungary | 15.51 | 94 | 0.17 | |
| Poland | 15.35 | 56 | 0.27 | |
| Moldova | 2.78 | 76 | 0.04 | |
| Romania | 12.86 | 70 | 0.18 | |
| Russian Federation | 9.92 | 33 | 0.30 | |
| Slovakia | 18.71 | 70 | 0.27 | |
| Ukraine | 3.23 | 76 | 0.04 | |
| Western Europe | Austria | 48.34 | 39 | 1.24 |
| Belgium | 43.70 | 50 | 0.87 | |
| France | 39.27 | 85 | 0.46 | |
| Germany | 45.27 | 75 | 0.60 | |
| Liechtenstein | 181.70 | 72 | 2.52 | |
| Luxembourg | 112.02 | 90 | 1.24 | |
| Monaco | 185.10 | 72 | 2.57 | |
| Netherlands | 51.84 | 50 | 1.04 | |
| Switzerland | 82.73 | 72 | 1.15 | |
1 thous. USD/capita/year. 2 kg/capita/year. * No data.
Disclaimer/Publisher’s Note: The statements, opinions and data contained in all publications are solely those of the individual author(s) and contributor(s) and not of MDPI and/or the editor(s). MDPI and/or the editor(s) disclaim responsibility for any injury to people or property resulting from any ideas, methods, instructions or products referred to in the content. |
© 2024 by the authors. Licensee MDPI, Basel, Switzerland. This article is an open access article distributed under the terms and conditions of the Creative Commons Attribution (CC BY) license (http://creativecommons.org/licenses/by/4.0/).
Copyright: This open access article is published under a Creative Commons CC BY 4.0 license, which permit the free download, distribution, and reuse, provided that the author and preprint are cited in any reuse.


