Submitted:
13 May 2024
Posted:
14 May 2024
You are already at the latest version
Abstract
This paper investigates calendar anomalies, volatility patterns, and the best forecasting model for predicting volatility in the cryptocurrency market, focusing on ten prominent cryptocurrencies: Binance USD, Bitcoin, Binance Coin, Cardano, Dogecoin, Ethereum, Solana, Tether, USD Coin, and Ripple. Spanning from January 2016 to December 2023, the study utilizes sophisticated statistical models such as GARCH (p,q), EGARCH (p,q), and GJR-GARCH (p,q) to analyze precise changes in market dynamics and the impact of day-of-week fluctuations on cryptocurrency returns. Empirical evidence reveals significant findings regarding the persistence of volatility, positive and negative news effects on volatility, and day-of-week effects on cryptocurrency returns. Post-COVID-19, Sunday emerges as the least volatile day for cryptocurrencies, while Thursdays and Tuesdays exhibit greater volatility. Binance, Ethereum, Dogecoin, and Tether show anomalies where returns on Tuesday and Thursday significantly differed from those on other days of the week. Many other currencies, like the USD coin, Cardano, and Ripple, show anomalies only in the pre-COVID-19 period. The findings highlight the best forecast model for volatility for each top cryptocurrency, offering practical implications for investors, traders, regulators, and policymakers. These insights emphasize the importance of understanding and addressing calendar anomalies in the cryptocurrency market for informed decision-making, trading strategies, regulatory frameworks, and market stability.
Keywords:
calendar anomalies
; cryptocurrency
; day-of-the-week effect
; GARCH
; volatility
; forecasting
1. Introduction
Calendar anomalies in financial time series datasets have been the subject of research for more than a century. Calendar anomalies, which are patterns or effects beyond the explanation of conventional asset pricing models, are subject to the influence of psychological and seasonal factors [1]. Kumar [2] presents a counterargument to the Efficient Market Hypothesis (EMH) by asserting that investors can capitalise on predictable patterns in asset prices to generate abnormal returns, thereby facilitating the development of efficient trading strategies.
Cryptocurrencies have posed new challenges in the analysis of calendar anomalies. With over 22,235 cryptocurrencies listed on CoinMarketCap, the emergence of digital assets has upended traditional monetary systems and called into question established standards [3,4]. As cryptocurrencies gain popularity, retail investors are increasingly including them in their portfolios [5]. This emerging phenomenon entails incorporating the rapidly expanding cryptocurrency sector, which represents a new and distinct financial domain, into the investigation of calendar anomalies.
In contrast to conventional financial theories, the Adaptive Market Hypothesis (AMH) posits that market inefficiency and efficiency can coexist, enabling market participants and investors to adapt to fluctuating market conditions [6]. The hypothesis proposes that as market participants' knowledge and market dynamics evolve, they adapt their strategies, leading to the development of trading strategies and pricing models that are more precise [7]. Miralles-Quirós & Miralles-Quirós [8] found evidence of calendar anomalies in cryptocurrencies, including the day-of-the-week effect, which shows predictable patterns in returns based on specific days. The AMH's emphasis on market adaptability is consistent with reported anomalies in cryptocurrency markets, where investors may modify their trading methods based on calendar impacts [9]. Understanding these anomalies is crucial for developing effective investment strategies and regulatory frameworks.
To enhance risk management, regulatory compliance, and forecasting precision, it is imperative to employ sophisticated statistical models to simulate the volatility and day-to-day fluctuations of cryptocurrencies. Generalized autoregressive conditional heteroscedasticity (GARCH) models, whether symmetrical or asymmetric, are appropriate for this objective. They influence crypto regulatory policies [10] aid regulators in analyzing crypto risk and volatility [11], facilitate market surveillance [12], and provide insights into market risks [13].
This study aims to investigate the volatility patterns of the cryptocurrency market both before and after the COVID-19 epidemic. We utilized sophisticated statistical models such as GARCH (p,q), EGARCH (p,q), and GJR-GARCH (p,q) to detect subtle changes in market dynamics. Furthermore, we shall examine the impact of day-of-week fluctuations on cryptocurrency returns to shed light on possible irregularities and their repercussions on market efficiency. To ensure extensive market coverage and representativeness, we used data on the ten most prominent cryptocurrencies in terms of market share. Moreover, our research ascertains the most effective GARCH model for forecasting the volatility of cryptocurrencies. This provides valuable insights that can assist policymakers, regulators, investors, and traders in effectively traversing the intricate dynamics of this rapidly growing financial domain.
2. Literature Review
Studying anomalies and volatility is critical for developing smart investing strategies, effective risk management, and market stability [14]. Anomalies call into question the efficient market hypothesis, implying the existence of regular patterns in asset prices that investors can exploit for abnormal returns [15]. The market conditions may cause these anomalies to vary over time, so a detailed analysis of their dynamics is necessary [16]. The Russian bond and stock markets, Turkish markets, US markets, Asia-Pacific stock markets, Thai stock market, Gulf Cooperation Council stock exchanges, Nigerian stock market, and Swedish stock market have historically noted calendar anomalies [17,18,19,20,21,22].
The day-of-the-week and month-of-the-year effects, divided into religious and non-religious anomalies, have received the most attention in empirical research [23]. Religious anomalies include the Yom Kippur, Diwali, and Ramadan effects; non-religious anomalies include the day-of-the-week, month-of-the-year, Halloween, turn-of-the-month, and turn-of-the-year effects [24,25]. Though calendar effects in stock markets are well-known, very little is known about calendar effects in cryptocurrency markets, particularly with regard to cryptocurrencies other than Bitcoin, Ethereum, and Litecoin [26]. Several authors have explained calendar irregularities in cryptocurrency markets by attributing them to liquidity, market moods, and other outside variables [7,27]. Important factors in cryptocurrency markets, such as sentiment analysis of social media data and liquidity dynamics, can influence calendar anomalies [28,29].
Knowing these dynamics is necessary to understand the fundamental causes of calendar anomalies. Cryptocurrency was one of the many financial markets that the COVID-19 epidemic severely affected [30]. Numerous studies have looked into these impacts in various markets, emphasizing their major influence on cryptocurrencies and stock markets [31]. The epidemic had a negative impact on several economies and completely changed the function of cryptocurrencies worldwide [32]. Though they experienced notable negative return shocks during the first wave of the epidemic, cryptocurrencies like Bitcoin, Ethereum, and Litecoin showed resilience despite the early shocks [33].
Researchers have extensively studied calendar anomalies and volatility in bitcoin markets using GARCH models, including asymmetric GARCH models [10,34]. Particularly asymmetric GARCH models are well-suited to simulate anomalies and volatility in cryptocurrencies because they can capture asymmetric volatility patterns [35]. By providing insightful information on the dynamics of cryptocurrency markets, these models improve forecasting and risk management skills [36].
Kinateder and Papavassiliou [37], Kaiser [38], Aharon and Qadan [39], Dangi [40], and Süreyya and ÖLÇEN [41] have published in-depth studies of the phenomenon of seasonality and calendar effects in cryptocurrencies. They offer empirical proof of the effect of the day of the week, indicating that some Fridays show unique trends in terms of volatility and price changes in the cryptocurrency market By examining the day-of-the-week effect, researchers can better understand the trends and patterns in cryptocurrency returns and volatility. This knowledge may have ramifications for risk management and investment strategies in the digital asset market.
Despite the evolving nature of cryptocurrency research, there remains a notable gap in the literature concerning a comparative analysis of the day-of-the-week effect in the cryptocurrency market before and after the onset of the COVID-19 pandemic. This gap offers a chance to look into how temporal patterns and anomalies have changed in reaction to the pandemic, offering insightful information about how external shocks affect market dynamics and trading techniques according to the day of the week. We aim to address this gap and contribute to a deeper understanding of the evolving relationship between external events and cryptocurrency market behavior.
3. Data and Methodology
In our empirical investigation, we examined a dataset of daily closing prices in US dollars obtained from CoinMarketCap (https://coinmarketcap.com/coins/). We focused on the top term cryptocurrencies in terms of diffusion and market capitalization: Binance USD, Bitcoin, Binance Coin, Cardano, Dogecoin, Ethereum, Solana, Tether, USD Coin, and Ripple. From January 2016 to December 2023, we separated the dataset into two periods: pre-COVID-19 (January 1, 2016, to December 31, 2019, excluding Solana and Binance USD owing to data paucity) and post-COVID-19 (January 1, 2020, to December 31, 2023).
Table 1 displays a summary of our 10 cryptocurrencies' daily closing returns. Pre-COVID-19, Binance coin had the highest average return, followed by Ripple; post-COVID-19, Binance coin had the highest average return, followed by Cardano. Among the 10 cryptocurrencies, Binance USD experienced the least fluctuation during the pre-COVID-19 period, while USD Coin experienced the least fluctuation during the post-COVID-19 period. The distribution of returns during the pre-COVID-19 period favourably skews left for Binance USD, Ethereum, and Tether, and positively for the remaining coins. The post-COVID-19 timeframe exhibits a leftward skew for the majority of cryptocurrencies, such as Binnacle USD, Bitcoin, Binance Coin, Cardano, Solana, Ethereum, and Ripple.
Our investigation began with the calculation of returns, defined as the natural logarithm of the ratio between two consecutive prices using the following formula:
where Rₙ denotes returns on an nth day in percentage; denotes closing price on an nth day; denotes the closing price on the previous trading day; and In is a natural log.
We performed the Jarque-Bera and Anderson Darling statistical tests, both of which validated the observation that the ten cryptocurrencies exhibit leptokurtic characteristics. Utilizing the returns series for all ten currencies, we conducted unit root tests, namely the Augmented Dickey-Fuller (ADF) and Philips-Perron tests (Table 2.1 and 2.2), to see if the data was stationary. Our results confirmed that the data is stationary.
We used dummy variables in an OLS regression, and after conducting unit root tests, we carried out Engle's [42] ARCH test. This test revealed the presence of volatility clustering both before and after the COVID-19 pandemic (as shown in Table A.1 in Appendix A). As all p-values were less than 0.05, the presence of ARCH effects was confirmed. These results support the use of GARCH frameworks to model volatility.
To incorporate the leptokurtic nature of cryptocurrencies, we implemented the Normal Inverse Gaussian (NIG) distribution for the error element in the GARCH model. This distribution can capture additional skewness and kurtosis in the residual return series [43]. Table 3 shows the conditional variance equations of the various GARCH models used in the study. All coefficients (ω, αi, and βj) in the GARCH (p,q) model must be non-negative and satisfy the condition αi + βj < 1. Higher αi values suggest more volatility responses to market shocks, while larger βj coefficients indicate the occurrence of market shocks. In the EGARCH (p, q) model, αi assesses shock magnitude, βj reflects volatility persistence, and γi represents the leverage effect. A negative γi indicates that negative news has a greater influence on volatility than positive news [44]. In the GJR GARCH (p,q) model, γi > 0 indicates the presence of the leverage effect. When γi ≠ 0, "good news" and "bad news" have different impacts.
In our analysis, we incorporated dummy variables into the mean equation of a GARCH model. To prevent multicollinearity between the independent variables, we excluded the intercept term and included dummy variables for all seven days of the week. This approach helps capture and quantify day-of-the-week effects in cryptocurrency returns, enabling the identification of systematic patterns. Moreover, it enhances model interpretability, improves forecasting accuracy, and controls for seasonality, contributing to a more comprehensive understanding of market behavior.
Where is the dummy variable for the day at time , is coefficient, are the autoregressive parameters, is the error term.
4. Empirical Evidence
We conducted a comparative analysis of ten cryptocurrencies using a variety of GARCH-type models, selecting the best model for p and q based on the smallest Akaike Information Criterion (AIC) information criteria as the optimal ones. We also carried out Ljung-Box and Lagrange multiplier (LM) tests on the residuals of the selected GARCH (p, q) models to assess their resilience. Notably, all coefficient p-values were highly significant at the 95% confidence level.
As indicated in Table 4.1 (period preceding COVID-19) and 4.2 (period following COVID-19), The fact that the coefficients ꞵ₁ + ꞵ₂ > α₁ indicates that when attempting to forecast present volatility, attention is directed towards the enduring consequences of past shocks rather than recent occurrences. Furthermore, the persistence of volatility was evaluated by summing the values of α₁, β₁, and β₂. This parameter's sum, which is a critical indicator of model stability, must not exceed 1. A high value of the coefficient of β₁ suggested the presence of volatility clustering.
Following the COVID-19 pandemic, Ripple demonstrated a heightened susceptibility to negative leaps and eruptive behavior, as indicated by the equation α₁ + β₁ + β₂ > 1. This observed pattern indicates a decline in volatility, which aligns with the conclusions drawn by Chan [45]. Consistent with the findings of Queiroz [46], the GARCH (1,1) model demonstrated high performance in predicting volatility across most of the cryptocurrencies during both the pre-COVID-19 and post-COVID-19 periods, leaving only Bitcoin and Ripple during the pre-COVID-19 period and Binance USD in the post-COVID-19 period where GARCH (1,2) is a better fit.
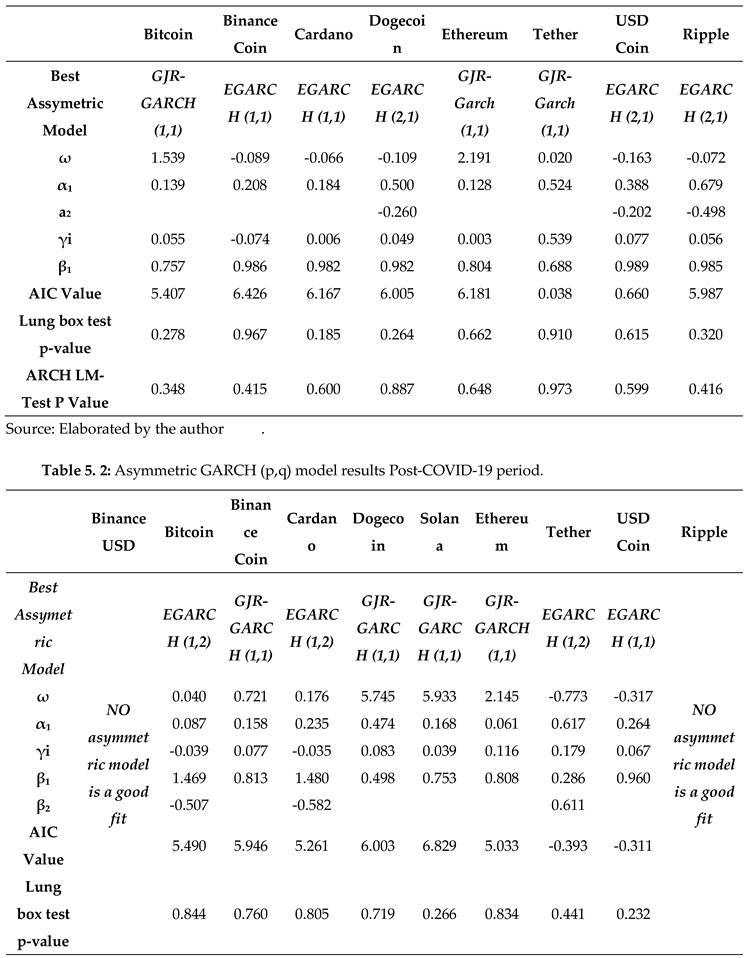
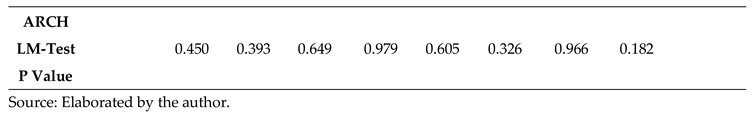
Additionally, we examined the EGARCH and GJR-GARCH asymmetric GARCH models for ten distinct cryptocurrencies pre- and post-COVID-19 pandemic. Tailored to account for heavy tails and high kurtosis, these models capture inherent volatility asymmetry, specifically as it relates to positive and negative returns, in an effective manner. We have selected the optimal p-q model with the lowest AIC score. Table 5.1 (pre-COVID-19 era) and 5.2 (post-COVID-19 era) illustrate the optimal selection of asymmetric models.
It is noteworthy that for the majority of cryptocurrencies, γᵢ > zero, suggesting that positive news or events have a more pronounced effect on escalating volatility compared to negative news or events of comparable magnitude. In contrast, γᵢ < 0 for Bitcoin and Cardano in the period following COVID-19, indicating that negative news has a more significant impact on escalating volatility compared to positive news of comparable magnitude.
We also did Q-Q plot tests on the residuals from the best-fitted GARCH model, as shown in Figure 3 (Pre-COVID) and Figure 4 (Post-COVID-19), to see how well the chosen GARCH family models fit the real-world data and to make sure they were appropriate.
In addition, as shown in Table 6, we assessed various GARCH models to determine which one predicted cryptocurrency volatility the most accurately. We utilized Mean Absolute Percentage Error (MAPE), Root Mean Squared Error (RMSE), Mean Absolute Error (MAE), and Theil's U to evaluate the efficacy of the models. Models with lower RMSE and MAE values demonstrated greater agreement with the observed data, while models with lower MAPE values predicted more accurate forecasts. With Theil's U, we were able to distinguish between predicted and actual values.
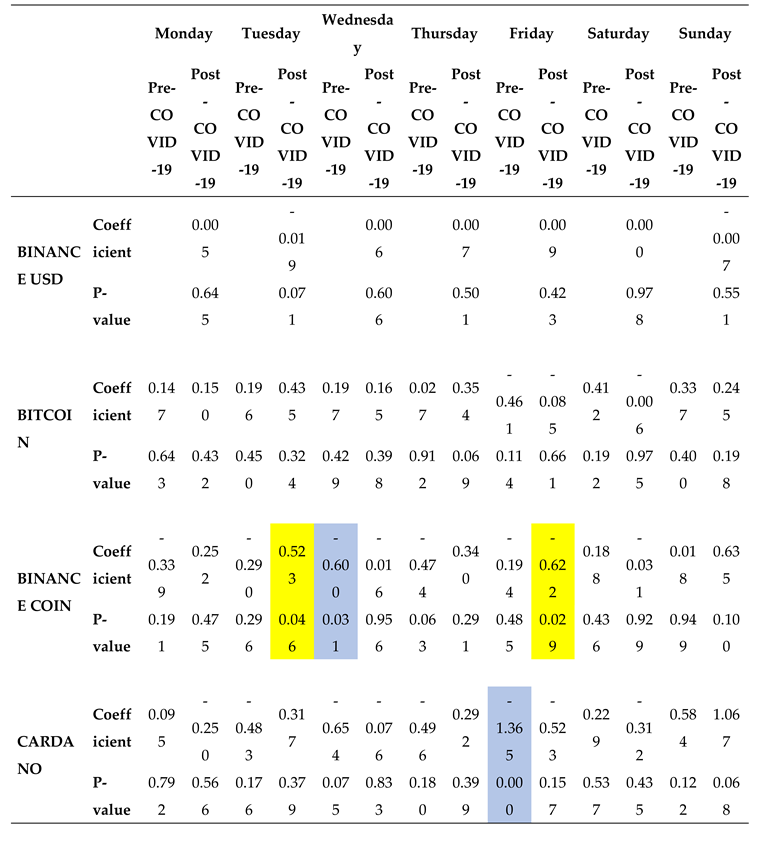
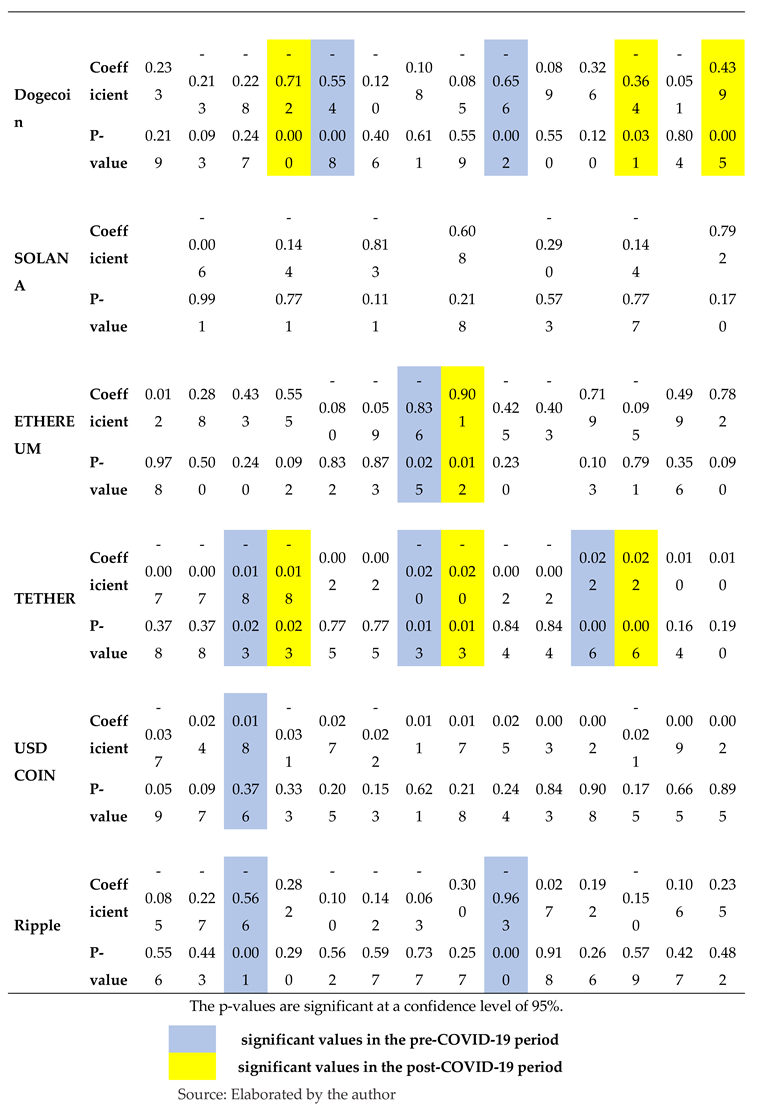
By comparing the low AIC scores of symmetric and asymmetric models for each cryptocurrency with seven dummy variables, we determined the optimal GARCH model and examined the effects of the day of the week. Table 7 presents the coefficients and corresponding p-values derived from the optimal GARCH model. We observed a noteworthy pattern on Sundays, where the majority of cryptocurrencies exhibited favorable returns both before and after the COVID-19 pandemic. In contrast to the negative Sunday effect previously documented by Dorfleitner and Lung [47] our discovery provides support for the results reported by Naz et al. [7]. Returns on Saturday also showed a discernible change. Cryptocurrencies generated favorable returns prior to the onset of the COVID-19 pandemic, which is consistent with findings from Ma & Tanizaki [48], Hamurcu [49], Lopez Martin [50], and Naz et al. [7]. Except for Tether, the majority of coins reversed this trend after COVID-19. This alignment is supportive of the adaptive market hypothesis.
Anomalies persisted in Binance Coin, Dogecoin, Ethereum, and Tether during the period following COVID-19. Dogecoin, Tether, and Binance Coin all experienced anomalies on Tuesday. Dogecoin and Tether both exhibited anomalies on Saturday and Sunday, whereas Tether only did so on Saturday. On Thursdays, Ethereum consistently maintained its anomaly. In contrast, Cardano, Ripple, and USD Coin did not exhibit these anomalies in the period following COVID-19. This suggests that the efficiency of these markets is increasing, possibly due to savvy and seasoned investors, advancements in communication and technology, and easy access to information. We can potentially attribute the observed fluctuations in cryptocurrency conduct to evolving investor sentiments, particularly in light of the COVID-19 pandemic. Market sentiment, fluctuating between positive and negative values, influences the price dynamics.
5. Conclusions
In this paper, we investigated volatility patterns in the cryptocurrency market by employing the GARCH (p,q), EGARCH (p,q), and GJR-GARCH (p,q) models. Our analysis identified the most suitable model capable of forecasting the volatility of the top ten cryptocurrencies during the post-COVID period, which can help investors accurately assess and anticipate market fluctuations. Sunday was the least volatile day for all cryptocurrencies during the post-COVID-19 period, while Thursdays and Tuesdays exhibited greater volatility. The models successfully captured the phenomenon of volatility clustering and shed light on the distinct effects of positive and negative news on volatility, thereby improving our models' precision.
Furthermore, we investigated the day-of-week effect in the cryptocurrency market before and after the COVID-19 pandemic. Our study revealed that Cardano, USD Coin, and Ripple did not exhibit any significant day-of-the-week effects in the post-COVID-19 period, indicating potential enhancements in market efficiency. Conversely, Binance Coin maintained its day-of-the-week effect, transitioning from Wednesday in the pre-COVID-19 period to Tuesday and Friday in the post-COVID-19 period.
The day-of-week effect presents a challenge to the efficient market hypothesis. Inspired by these findings, investors ought to utilize technical and fundamental analysis in order to capitalize on foreseeable price trends and exploit market inefficiencies for the purposes of strategic trading and hedging. These observations can provide guidance to policymakers and regulators as they formulate more knowledgeable regulations, establish early warning systems, and execute macroprudential policies in order to protect investor interests and market stability.
In conclusion, our study offers practical implications for investors, traders, regulators, and policymakers. It reinforces the importance of understanding and addressing day-of-the-week anomalies in the cryptocurrency market, with the potential to shape investment decisions, trading strategies, regulatory frameworks, and market surveillance practices in a rapidly evolving and increasingly influential financial landscape.
Author Contributions
Conceptualization, Sonal Sahu; methodology, Sonal Sahu; software: Sonal Sahu; validation, Sonal Sahu, Alejandro Fonseca Ramirez and Jong-Min Kim.; formal analysis, Sonal Sahu.; investigation, Sonal Sahu; resources, Sonal Sahu; data curation: Sonal Sahu; writing—original draft preparation, Sonal Sahu; writing—review and editing, Sonal Sahu, Alejandro Fonseca Ramirez.; visualization, Sonal Sahu; supervision: Jong-Min Kim; project administration, Sonal Sahu; funding acquisition: Sonal Sahu
Funding
This research received no external funding.
Data Availability Statement
The data used was downloaded from the publicly available data on https://coinmarketcap.com/coins/
Conflicts of Interest
The authors declare no conflicts of interest. Authors must identify and declare any personal circumstances or interest that may be perceived”.
Appendix A

Table A1.
Test results for Engle’s Arch tes.
| 1 | Binance USD | Post-COVID-19 | F-statistic | 236.151 | Prob. F | 0.000 |
| Obs*R-squared | 324.169 | Prob. Chi-Square | 0.000 | |||
| 2 | Bitcoin | Pre-COVID-19 | F-statistic | 19.672 | Prob. F | 0.000 |
| Obs*R-squared | 38.077 | Prob. Chi-Square | 0.000 | |||
| Post-COVID-19 | F-statistic | 0.142 | Prob. F | 0.049 | ||
| Obs*R-squared | 0.284 | Prob. Chi-Square | 0.049 | |||
| 3 | Binance Coin | Pre-COVID-19 | F-statistic | 0.038 | Prob. F | 0.963 |
| Obs*R-squared | 0.076 | Prob. Chi-Square | 0.963 | |||
| Post-COVID-19 | F-statistic | 23.340 | Prob. F | 0.000 | ||
| Obs*R-squared | 44.775 | Prob. Chi-Square | 0.000 | |||
| 4 | Cardano | Pre-COVID-19 | F-statistic | 26.171 | Prob. F | 0.000 |
| Obs*R-squared | 49.309 | Prob. Chi-Square | 0.000 | |||
| Post-COVID-19 | F-statistic | 8.806 | Prob. F | 0.000 | ||
| Obs*R-squared | 17.365 | Prob. Chi-Square | 0.000 | |||
| 5 | Dogecoin | Pre-COVID-19 | F-statistic | 16.792 | Prob. F | 0.000 |
| Obs*R-squared | 32.669 | Prob. Chi-Square | 0.000 | |||
| Post-COVID-19 | F-statistic | 24.146 | Prob. F | 0.000 | ||
| Obs*R-squared | 44.661 | Prob. Chi-Square | 0.000 | |||
| 6 | Solana | Post-COVID-19 | F-statistic | 18.776 | Prob. F | 0.000 |
| Obs*R-squared | 36.201 | Prob. Chi-Square | 0.000 | |||
| 7 | Ethereum | Pre-COVID-19 | F-statistic | 6.232 | Prob. F | 0.002 |
| Obs*R-squared | 12.313 | Prob. Chi-Square | 0.002 | |||
| Post-COVID-19 | F-statistic | 3.724 | Prob. F | 0.025 | ||
| Obs*R-squared | 7.416 | Prob. Chi-Square | 0.025 | |||
| 8 | Tether | Pre-COVID-19 | F-statistic | 7.657 | Prob. F | 0.001 |
| Obs*R-squared | 15.133 | Prob. Chi-Square | 0.001 | |||
| Post-COVID-19 | F-statistic | 234.791 | Prob. F | 0.000 | ||
| Obs*R-squared | 322.888 | Prob. Chi-Square | 0.000 | |||
| 9 | USD Coin | Pre-COVID-19 | F-statistic | 37.645 | Prob. F | 0.000 |
| Obs*R-squared | 64.870 | Prob. Chi-Square | 0.000 | |||
| Post-COVID-19 | F-statistic | 122.120 | Prob. F | 0.000 | ||
| Obs*R-squared | 197.782 | Prob. Chi-Square | 0.000 | |||
| 10 | Ripple | Pre-COVID-19 | F-statistic | 52.853 | Prob. F | 0.000 |
| Obs*R-squared | 96.619 | Prob. Chi-Square | 0.000 | |||
| Post-COVID-19 | F-statistic | 23.880 | Prob. F | 0.000 | ||
| Obs*R-squared | 45.766 | Prob. Chi-Square | 0.000 |
Source: Elaborated by the author.
References
- Chatzitzisi, E.; Fountas, S.; Panagiotidis, T. Another Look at Calendar Anomalies. The Quarterly Review of Economics and Finance 2019. [CrossRef]
- Kumar, V. Is the Beta Anomaly Real? A Correction in Existing Theories of Cost of Capital and Asset Pricing. Journal of emerging market finance 2023, 22 (2), 135–163. [CrossRef]
- Weber, B. Bitcoin and the Legitimacy Crisis of Money. Cambridge Journal of Economics 2014, 40, 17–41. [Google Scholar] [CrossRef]
- Baek, C.; Elbeck, M. Bitcoins as an Investment or Speculative Vehicle? Applied Economics Letters 2014, 22, 30–34. [Google Scholar] [CrossRef]
- Zhao, H.; Zhang, L. Financial Literacy or Investment Experience: Which Is More Influential in Cryptocurrency Investment? International Journal of Bank Marketing 2021, ahead-of-print (ahead-of-print). [CrossRef]
- ENOW, S. T. Evidence of Adaptive Market Hypothesis in International Financial Markets. Journal of Academic Finance 2022, 13, 48–55. [Google Scholar] [CrossRef]
- Naz, F.; Sayyed, M.; Rehman, R.-U. -; Naseem, M. A.; Abdullah, S. N.; Ahmad, M. I. Calendar Anomalies and Market Volatility in Selected Cryptocurrencies. Cogent Business & Management 2023, 10 (1). [CrossRef]
- Miralles-Quirós, J. L.; Miralles-Quirós, M. M. A New Perspective of the Day-of-The-Week Effect on Bitcoin Returns: Evidence from an Event Study Hourly Approach. Oeconomia Copernicana 2022, 13, 745–782. [Google Scholar] [CrossRef]
- Khuntia, S.; Pattanayak, J. K. Adaptive Calendar Effects and Volume of Extra Returns in the Cryptocurrency Market. International Journal of Emerging Markets 2021, ahead-of-print (ahead-of-print). [CrossRef]
- Ampountolas, A. Cryptocurrencies Intraday High-Frequency Volatility Spillover Effects Using Univariate and Multivariate GARCH Models. International Journal of Financial Studies 2022, 10, 51. [Google Scholar] [CrossRef]
- Ngunyi, A.; Mundia, S.; Omari, C. Modelling Volatility Dynamics of Cryptocurrencies Using GARCH Models. Journal of Mathematical Finance 2019, 9, 591–615. [Google Scholar] [CrossRef]
- Omari, C.; Ngunyi, A. The Predictive Performance of Extreme Value Analysis Based-Models in Forecasting the Volatility of Cryptocurrencies. Journal of Mathematical Finance 2021, 11, 438–465. [Google Scholar] [CrossRef]
- Aggarwal, K.; Jha, M. K. Day-of-The-Week Effect and Volatility in Stock Returns: Evidence from the Indian Stock Market. Managerial Finance 2023. [CrossRef]
- Tadepalli, M. S.; Jain, R. K. Persistence of Calendar Anomalies: Insights and Perspectives from Literature. American Journal of Business 2018, 33 (1/2), 18–60. [CrossRef]
- DONG, X.; LI, Y.; RAPACH, D. E.; ZHOU, G. Anomalies and the Expected Market Return. The Journal of Finance 2021, 77, 639–681. [Google Scholar] [CrossRef]
- KELOHARJU, M.; LINNAINMAA, J. T.; NYBERG, P. Return Seasonalities. The Journal of Finance 2016, 71, 1557–1590. [Google Scholar] [CrossRef]
- Aydoğan, K.; Geoffrey Booth, G. Calendar Anomalies in the Turkish Foreign Exchange Markets. Applied Financial Economics 2003, 13, 353–360. [Google Scholar] [CrossRef]
- Compton, W.; Kunkel, R.A.; Kuhlemeyer, G. Calendar Anomalies in Russian Stocks and Bonds. Managerial Finance 2013, 39, 1138–1154. [Google Scholar] [CrossRef]
- Aziz, T.; Ansari, V. A. The Turn of the Month Effect in Asia-Pacific Markets: New Evidence. Global Business Review 2017, 19, 214–226. [Google Scholar] [CrossRef]
- Olugbenga Adaramola, A.; Oladeji Adekanmbi, K. Day-of-The-Week Effect in Nigerian Stock Exchange: Adaptive Market Hypothesis Approach. Investment Management and Financial Innovations 2020, 17, 97–108. [Google Scholar] [CrossRef]
- Siriopoulos, C.; Youssef, L. The January Barometer in Emerging Markets: New Evidence from the Gulf Cooperation Council Stock Exchanges. Investment Management and Financial Innovations 2019, 16, 61–71. [Google Scholar] [CrossRef]
- Eidinejad, S.; Dahlem, E. The Existence and Historical Development of the Holiday Effect on the Swedish Stock Market. Applied Economics Letters 2021, 1–4. [Google Scholar] [CrossRef]
- Sejati, H.; Lihan, I.; Hendrawaty, E. Analysis of Ramadan Effect on Indonesian Islamic Stock Market: Jakarta Islamic Index (JII) (2016-2020). Asian Journal of Economics, Business and Accounting 2022, 470–480. [CrossRef]
- Kliger, D.; Qadan, M. The High Holidays: Psychological Mechanisms of Honesty in Real-Life Financial Decisions. Journal of Behavioral and Experimental Economics 2019, 78, 121–137. [Google Scholar] [CrossRef]
- Mehta, K.; Chander, R. Seasonality in Indian Stock Market: A Re-Examination of January Effect. Asia Pacific Business Review 2009, 5, 28–42. [Google Scholar] [CrossRef]
- Robiyanto, R.; Susanto, Y. A.; Ernayani, R. Examining the Day-of-The-Week-Effect and The-Month-of-The-Year-Effect in Cryptocurrency Market. Jurnal Keuangan dan Perbankan 2019, 23 (3). [CrossRef]
- Caporale, G. M.; Plastun, A. The Day of the Week Effect in the Cryptocurrency Market. Finance Research Letters 2019, 31. [Google Scholar] [CrossRef]
- Valencia, F.; Gómez-Espinosa, A.; Valdés-Aguirre, B. Price Movement Prediction of Cryptocurrencies Using Sentiment Analysis and Machine Learning. Entropy 2019, 21, 589. [Google Scholar] [CrossRef]
- Yang, W.; Song, Y.; Zhang, X.; Yin, Z. Asymmetric Volatility Connectedness between Cryptocurrencies and Energy: Dynamics and Determinants. Frontiers in Environmental Science 2023, 11. [Google Scholar] [CrossRef]
- Lahmiri, S.; Bekiros, S. The Impact of COVID-19 Pandemic upon Stability and Sequential Irregularity of Equity and Cryptocurrency Markets. Chaos, Solitons & Fractals 2020, 138, 109936. [Google Scholar] [CrossRef]
- Sahoo, P. K. COVID-19 Pandemic and Cryptocurrency Markets: An Empirical Analysis from a Linear and Nonlinear Causal Relationship. Studies in Economics and Finance 2021, 38, 454–468. [Google Scholar] [CrossRef]
- Lee, Y.-S.; Vo, A.; Chapman, T. A. Examining the Maturity of Bitcoin Price through a Catastrophic Event: The Case of Structural Break Analysis during the COVID-19 Pandemic. Finance Research Letters 2022, 49, 103165. [Google Scholar] [CrossRef]
- Marobhe, M. I. Cryptocurrency as a Safe Haven for Investment Portfolios amid COVID-19 Panic Cases of Bitcoin, Ethereum and Litecoin. China Finance Review International 2021, ahead-of-print (ahead-of-print). [CrossRef]
- Bae, G.; Kim, J.H. Observing Cryptocurrencies through Robust Anomaly Scores. Entropy 2022, 24(11), 1643–1643. [Google Scholar] [CrossRef]
- Naimy, V.; Haddad, O.; Fernández-Avilés, G.; El Khoury, R. The Predictive Capacity of GARCH-Type Models in Measuring the Volatility of Crypto and World Currencies. PLOS ONE 2021, 16, e0245904. [Google Scholar] [CrossRef]
- Micu, R.; Dumitrescu, D. Study Regarding the Volatility of Main Cryptocurrencies. Proceedings of the International Conference on Business Excellence 2022, 16, 179–187. [Google Scholar] [CrossRef]
- Kinateder, H.; Papavassiliou, V. G. Calendar Effects in Bitcoin Returns and Volatility. Finance Research Letters 2019, 101420. [Google Scholar] [CrossRef]
- Kaiser, L. Seasonality in Cryptocurrencies. Finance Research Letters 2019, 31. [Google Scholar] [CrossRef]
- Qadan, M.; Aharon, D. Y.; Eichel, R. Seasonal and Calendar Effects and the Price Efficiency of Cryptocurrencies. Finance Research Letters 2021, 102354. [Google Scholar] [CrossRef]
- Dangi, V. Day of the Week Effect in Cryptocurrencies’ Returns and Volatility. Ramanujan International Journal of Business and Research 2020, 5, 139–167. [Google Scholar] [CrossRef]
- İmre, S.; Ölçen, O. The Day of the Week Effect in Euro and Bitcoin: Evidence from Volatility Models. International Journal of Entrepreneurship and Management Inquiries 2022, 6, 1–17. [Google Scholar]
- ENGLE, R. F.; NG, V. K. Measuring and Testing the Impact of News on Volatility. The Journal of Finance 1993, 48, 1749–1778. [Google Scholar] [CrossRef]
- Osterrieder, J.; Strika, M.; Lorenz, J. Bitcoin and Cryptocurrencies—Not for the Faint-Hearted. International Finance and Banking 2017, 4, 56. [Google Scholar] [CrossRef]
- Drimbetas, E.; Sariannidis, N.; Porfiris, N. The Effect of Derivatives Trading on Volatility of the Underlying Asset: Evidence from the Greek Stock Market. Applied Financial Economics 2007, 17, 139–148. [Google Scholar] [CrossRef]
- Chan, N. H. Time Series: Applications to Finance with R and S-Plus, 2nd Edition.; John Wiley & Sons: Hoboken, New Jersey, 2011; Vol. 837.
- Queiroz, S.; McGee, R.; David, S. Does Anything Beat a GARCH(1,1)? Evidence from Crypto Markets. 2023. [CrossRef]
- Dorfleitner, G.; Lung, C. Cryptocurrencies from the Perspective of Euro Investors: A Re-Examination of Diversification Benefits and a New Day-of-The-Week Effect. Journal of Asset Management 2018, 19, 472–494. [Google Scholar] [CrossRef]
- Ma, D.; Tanizaki, H. The Day-of-The-Week Effect on Bitcoin Return and Volatility. Research in International Business and Finance 2019, 49, 127–136. [Google Scholar] [CrossRef]
- HAMURCU, C. Examining the Existence of Day-Of-Week and Month-Of-Year Anomalies in Bitcoin. Kırklareli Üniversitesi İktisadi ve İdari Bilimler Fakültesi Dergisi 2022. [CrossRef]
- López-Martín, C. Dynamic Analysis of Calendar Anomalies in Cryptocurrency Markets: Evidences of Adaptive Market Hypothesis. Spanish Journal of Finance and Accounting / Revista Española de Financiación y Contabilidad 2022, 1–34. [CrossRef]
Figure 3.
Q-Q plot of residuals pre-COVID-19 Period.
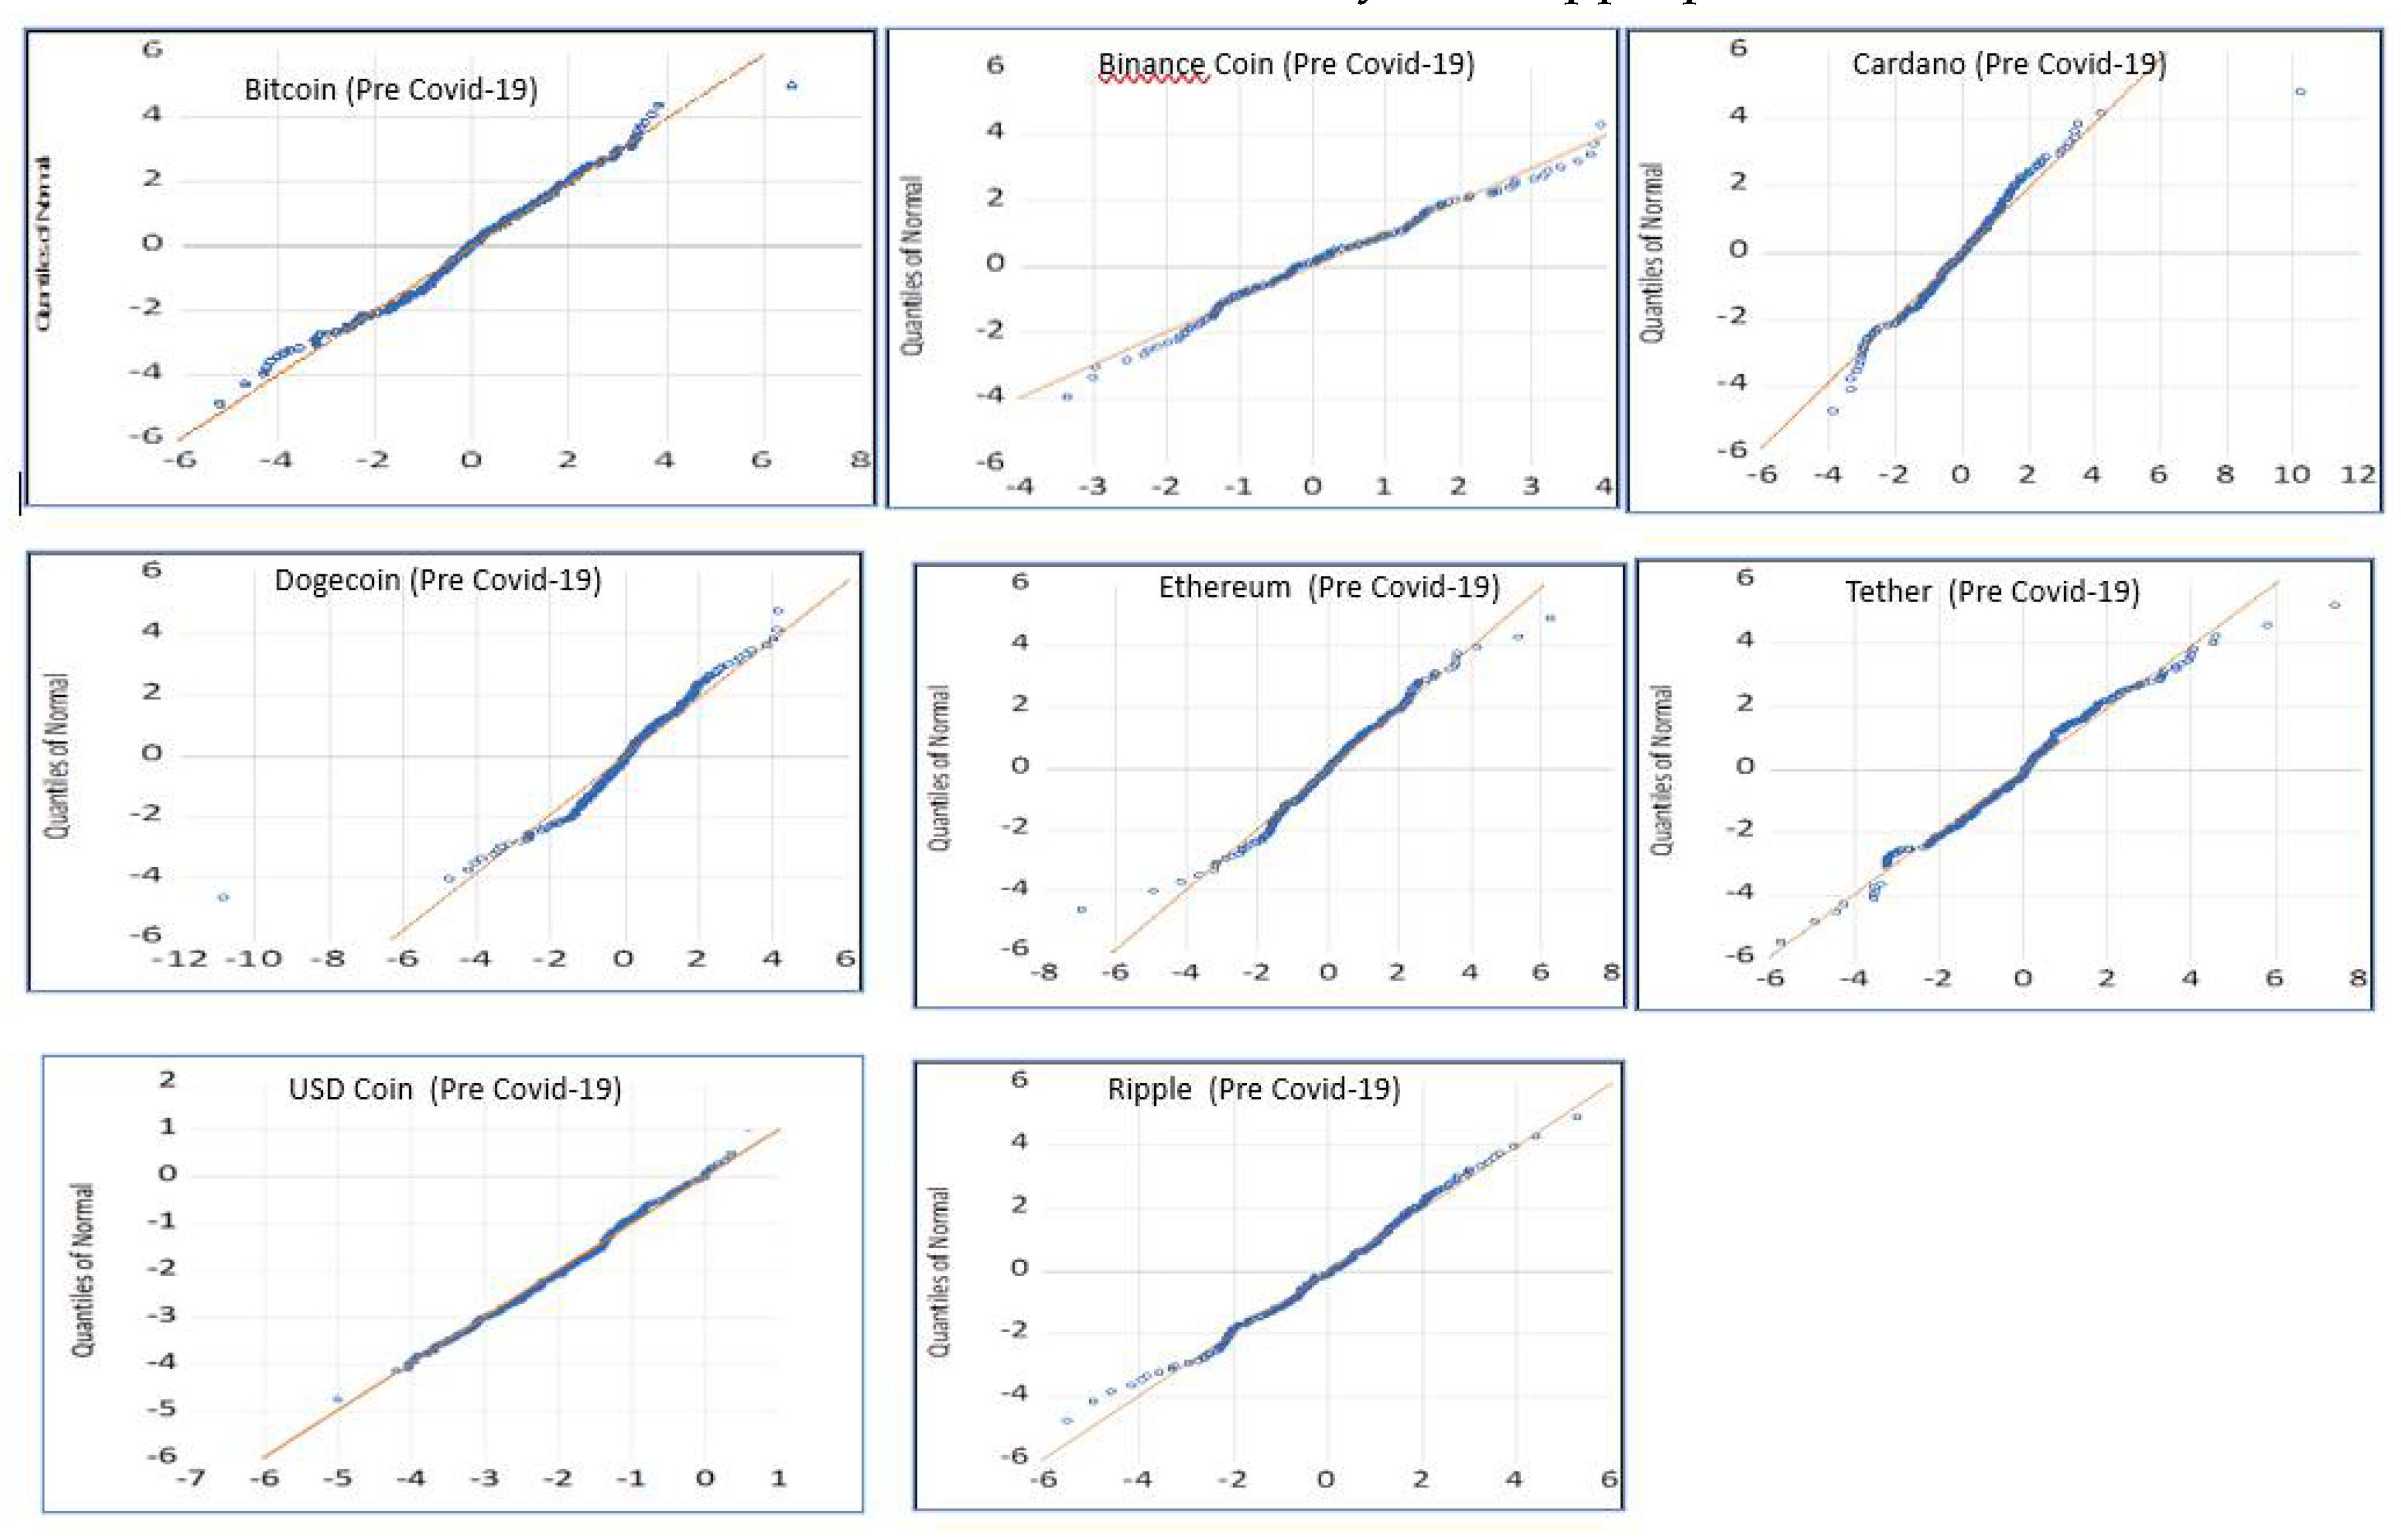
Figure 4.
Q-Q plot of residuals post-COVID-19 Period.
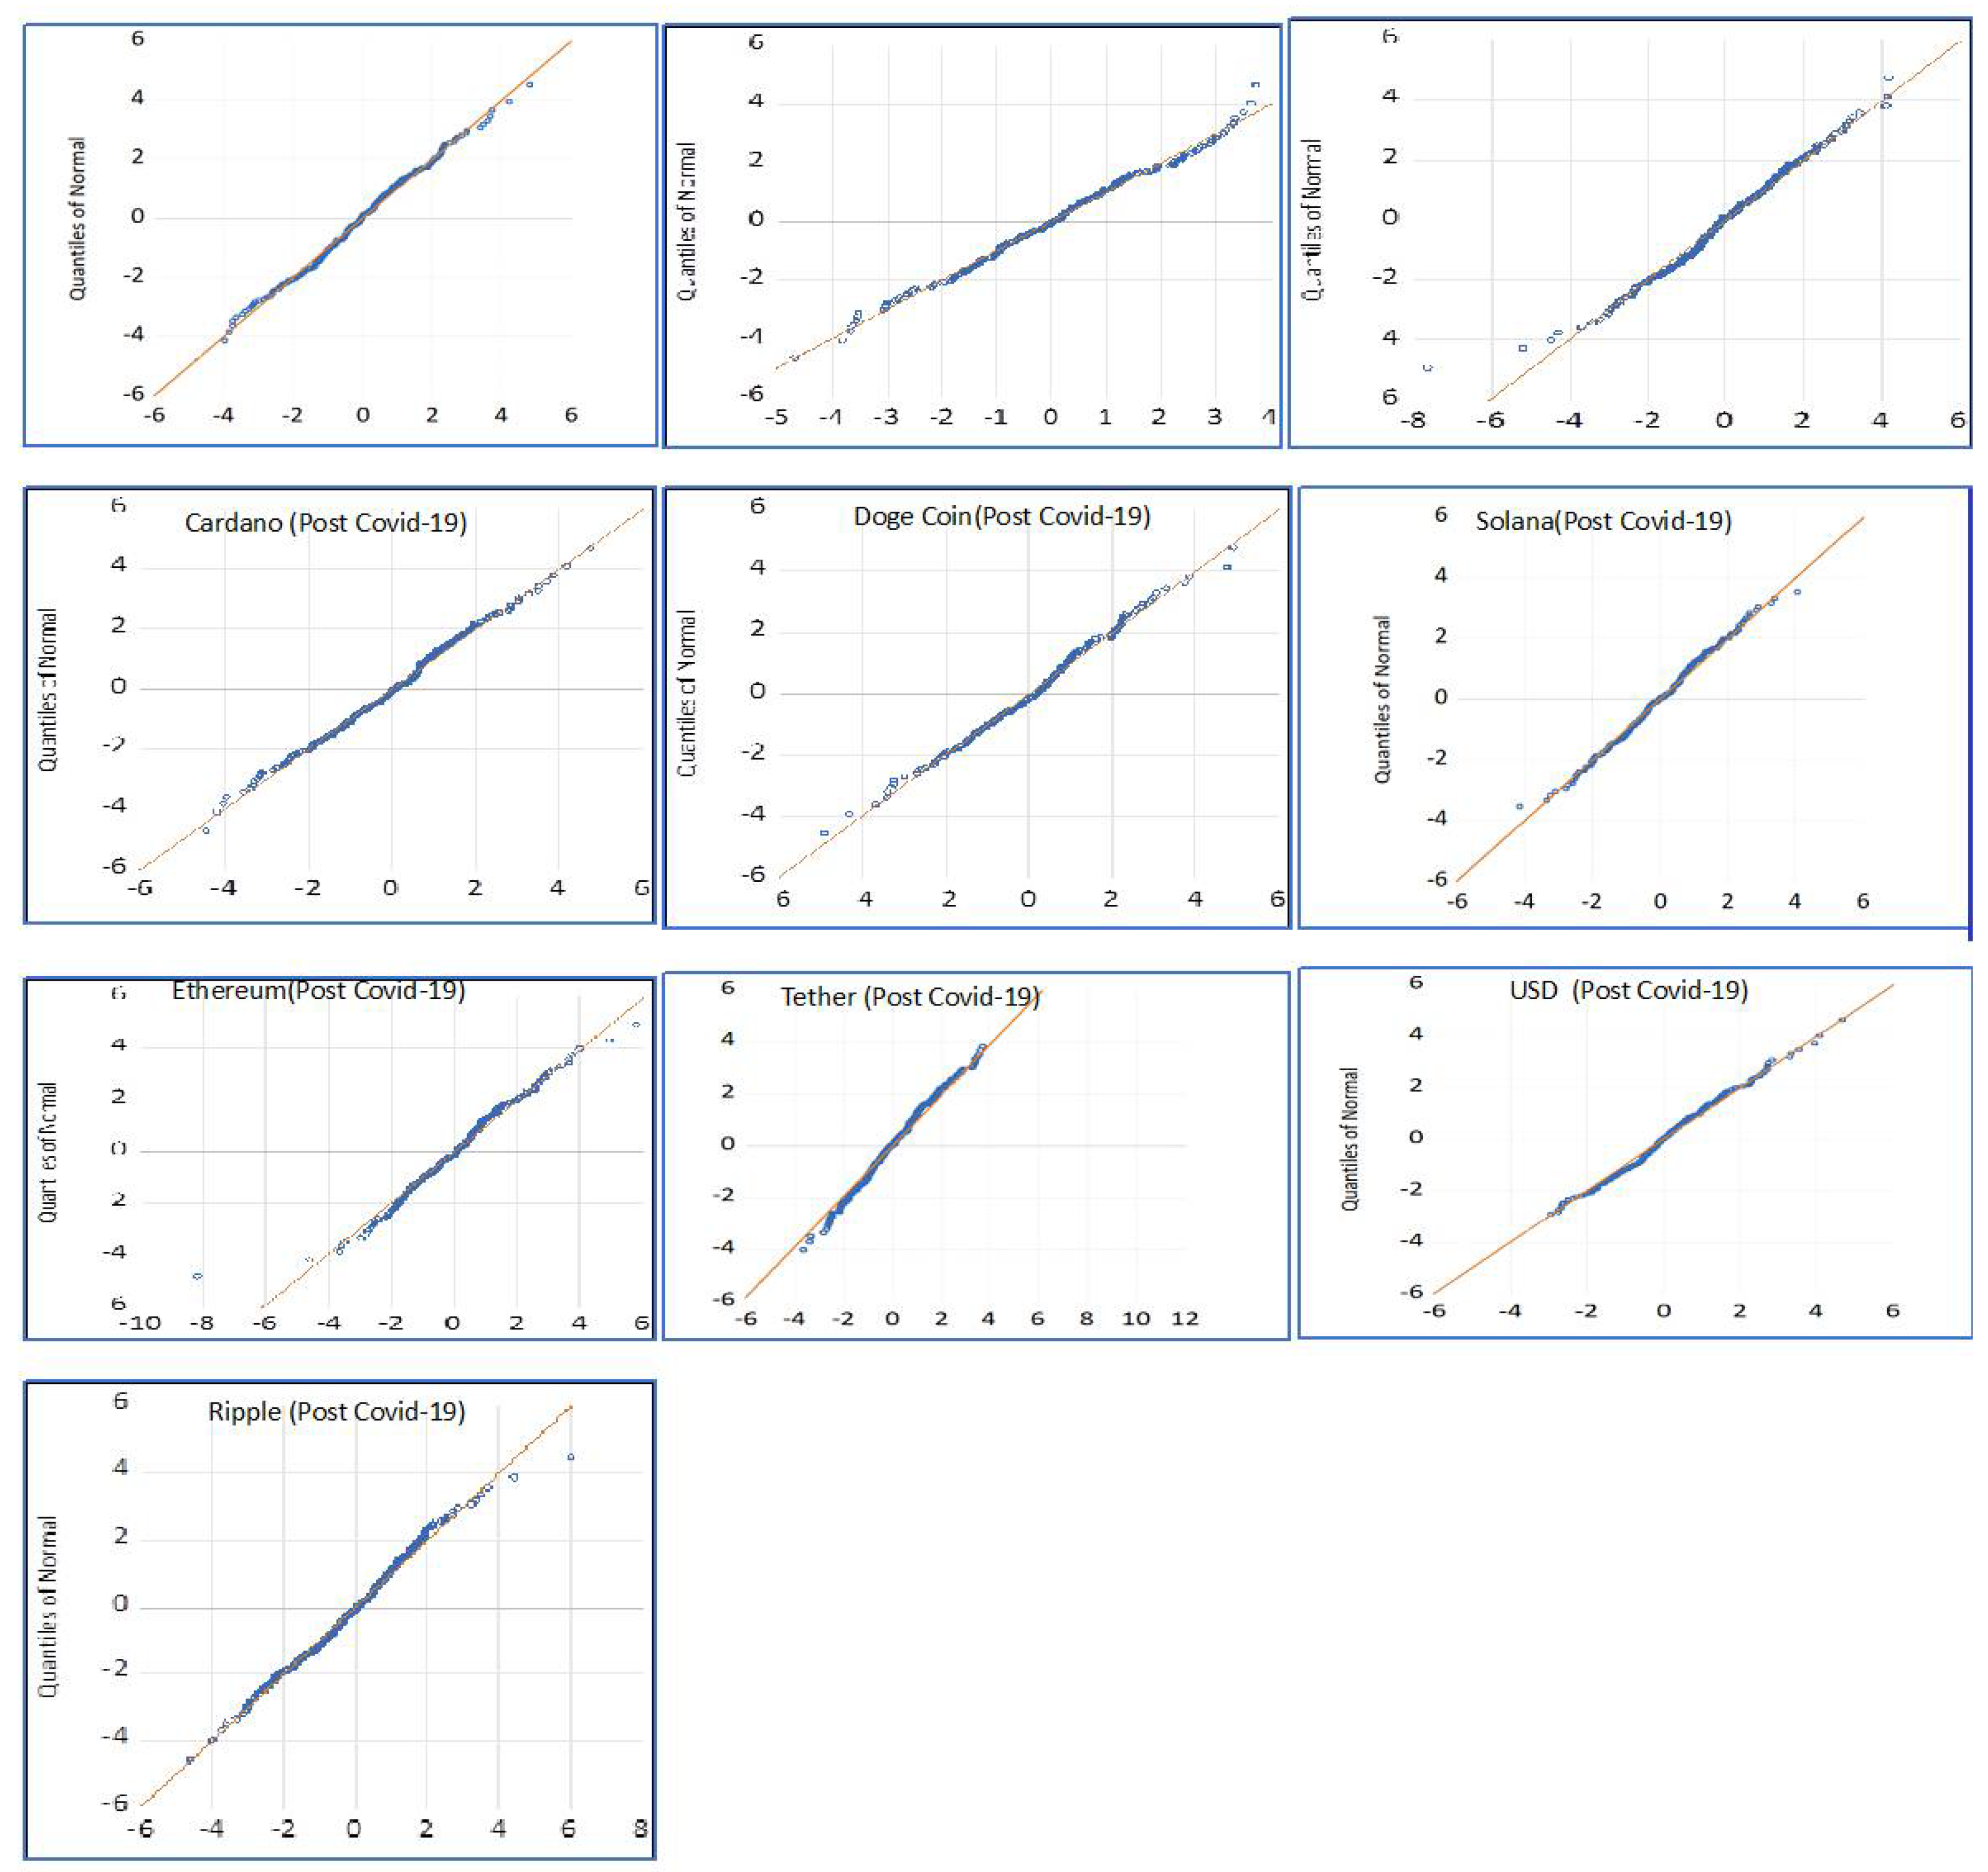
Table 1.
Daily descriptive statistics of ten cryptocurrencies in pre- and post-COVID-19 periods.
| Descriptive statistics | Binance USD | Bitcoin | Binance Coin | Cardano | Dogecoin | Solana | Ethereum | Tether | USD Coin | Ripple | |
|---|---|---|---|---|---|---|---|---|---|---|---|
| Mean | Pre-COVID | 0.122% | 12.015% | 58.287% | 2.719% | 20.358% | - | -12.189% | -0.017% | -0.110% | 31.179% |
| Post-COVID | -0.025% | 9.981% | 29.489% | 24.346% | -11.627% | 37.451% | 23.580% | 0.005% | -0.033% | 8.463% | |
| Maximum | Pre-COVID | 60.014% | 2870.990% | 32699.360% | 8721.609% | 4553.488% | - | 2625.760% | 1265.370% | 253.691% | 8812.683% |
| Post-COVID | 650.371% | 1760.260% | 5526.562% | 2691.957% | 7324.953% | 3844.862% | 2194.057% | 250.046% | 192.579% | 4233.534% | |
| Minimum | Pre-COVID | -71.155% | -2251.580% | -10024.390% | -2698.714% | -4781.982% | - | -2185.820% | -2833.380% | -209.640% | -4962.824% |
| Post-COVID | -649.448% | -4337.140% | -5590.344% | -5244.024% | -4667.967% | -4521.549% | -5630.799% | -197.281% | -158.485% | -5495.483% | |
| Standard Deviation | Pre-COVID | 0.191 | 4.393 | 15.609 | 7.708 | 6.921 | - | 5.152 | 1.486 | 0.475 | 7.703 |
| Post-COVID | 0.428 | 3.874 | 5.700 | 5.859 | 7.457 | 7.792 | 5.209 | 0.292 | 0.282 | 6.276 | |
| Coefficient of Variation | Pre-COVID | 156.065 | 36.563 | 26.78 | 283.529 | 33.996 | - | -42.271 | -9004.824 | -431.951 | 24.706 |
| Post-COVID | -1697.48 | 38.813 | 19.33 | 24.065 | -64.137 | 20.806 | 22.092 | 5760.118 | -854.539 | 74.162 | |
| Skewness | Pre-COVID | -0.184 | 0.076 | 10.643 | 2.92 | 0.829 | - | -0.201 | -5.635 | 0.186 | 2.437 |
| Post-COVID | -0.107 | -1.429 | -0.185 | -0.442 | 1.464 | -0.058 | -1.464 | 0.159 | 0.045 | -0.205 | |
| Kurtosis | Pre-COVID | 5.897 | 7.796 | 237.267 | 31.126 | 12.965 | - | 5.857 | 148.928 | 9.022 | 27.515 |
| Post-COVID | 106.763 | 19.683 | 24.491 | 11.051 | 24.921 | 6.64 | 18.420 | 15.488 | 9.884 | 17.856 |
Source- Elaborated by the author
Table 2.
1: Augmented Dickey-Fuller test results pre-and post-COVID-19 period.
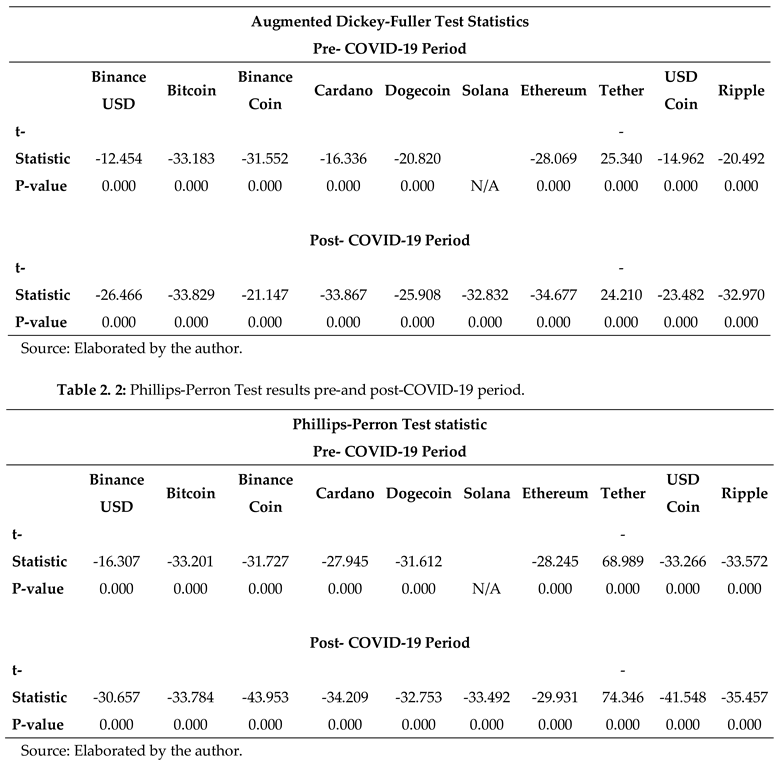 |
Table 3.
Different GARCH model equations.
| Model | Conditional Variance Equation |
|---|---|
| GARCH (p, q) Model | |
| EGARCH (p, q) Model | |
| GJRGARCH (p, q) Model |
Table 4.
1: GARCH (p,q) model results Pre-COVID-19 period.
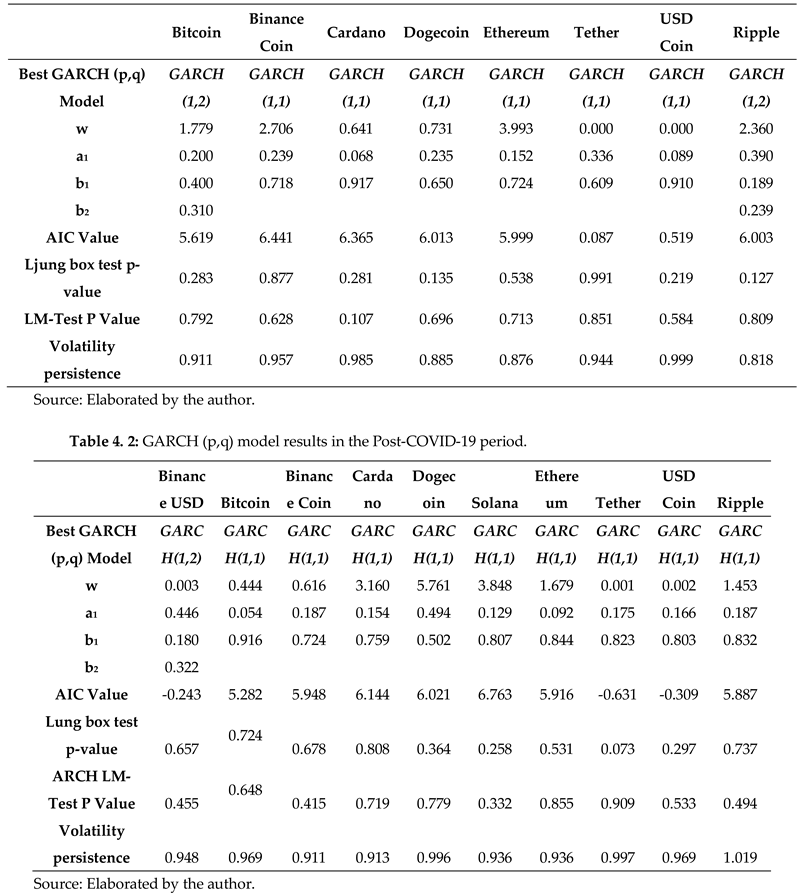 |
Table 5.
1: Asymmetric GARCH (p,q) model results pre-COVID-19 period.
|
Table 6.
Summary of Optimal GARCH Models for Cryptocurrency Volatility Forecasting.
| Best fit Model | Model type | RSME | MAE | MAPE | Theil's U | |
|---|---|---|---|---|---|---|
| Binance USD | GARCH (1,2) | Symmetric | 0.301 | 0.200 | 117.653 | 0.915 |
| Bitcoin | GARCH (1,1) | Symmetric | 3.869 | 2.610 | 371.537 | 0.898 |
| Binance Coin | GJR-GARCH (1,1) | Asymmetric | 5.699 | 3.574 | 119.400 | 0.961 |
| Cardano | EGARCH (1,2) | Asymmetric | 5.839 | 4.068 | 748.083 | 0.938 |
| Dogecoin | GJR-GARCH (1,1) | Asymmetric | 8.860 | 4.362 | 134.921 | 0.961 |
| Solana | GARCH (1,1) | Symmetric | 7.791 | 5.610 | 935.216 | 0.932 |
| Ethereum | GJR-GARCH (1,1) | Asymmetric | 5.199 | 3.596 | 140.540 | 0.905 |
| Tether | GARCH (1,1) | Symmetric | 0.293 | 0.189 | 137.435 | 0.906 |
| USD Coin | EGARCH (1,1) | Asymmetric | 0.282 | 0.190 | 134.030 | 0.910 |
| Ripple | GARCH (1,1) | Symmetric | 6.270 | 3.835 | 127.782 | 0.967 |
Source: Elaborated by the author.
Table 7.
Coefficients and p-values for Day-of-Week Effects in the Best-Fit GARCH Model.
|
Disclaimer/Publisher’s Note: The statements, opinions and data contained in all publications are solely those of the individual author(s) and contributor(s) and not of MDPI and/or the editor(s). MDPI and/or the editor(s) disclaim responsibility for any injury to people or property resulting from any ideas, methods, instructions or products referred to in the content. |
© 2024 by the authors. Licensee MDPI, Basel, Switzerland. This article is an open access article distributed under the terms and conditions of the Creative Commons Attribution (CC BY) license (http://creativecommons.org/licenses/by/4.0/).
Copyright: This open access article is published under a Creative Commons CC BY 4.0 license, which permit the free download, distribution, and reuse, provided that the author and preprint are cited in any reuse.


