Submitted:
13 May 2024
Posted:
13 May 2024
You are already at the latest version
Abstract
In response to escalating global concerns regarding climate change, nations worldwide have been undertaking structural adjustments in their energy sectors to promote diversification and decarbonization. This study conducts a comparative analysis of the policies and measures adopted by major economies, including the United States, the United Kingdom, Japan, Germany, and France, focusing on climate change, energy structural adjustments, and carbon emission reduction. By analyzing recent carbon emission and highlighting achievements in renewable energy promotion, green industry development, industrial restructuring, and energy production decarbonization, this study aims to provide valuable insights and formulate strategies for constructing an innovative energy system that ensures economic and social development while facilitating rapid growth and wide applications of low-carbon energy sources.
Keywords:
Carbon emissions
; climate change
; energy structure
; energy decarbonization
1. Introduction
Since the 1990s, issues such as rising temperatures, extreme weather events, and escalating sea levels, driven by greenhouse gas emissions, have increasingly been recognized as critical global concerns. To address the adverse impacts of climate change on human society and ecosystems, the United Nations Framework Convention on Climate Change (UNFCCC), established over 27 years ago, has progressed through several key phases, including the Kyoto Protocol, the Bali Road Map, the Durban Platform, and the Paris Agreement. At the 21st Conference of the Parties (COP21) to the UNFCCC and the 11th Meeting of the Parties to the Kyoto Protocol in 2015, 196 signatories to the UNFCCC (195 countries plus the European Union) collectively committed to "limit the increase in global average temperature to well below 2°C above pre-industrial levels and pursue efforts to limit the temperature increase to 1.5°C." Furthermore, 184 nations submitted their Intended Nationally Determined Contributions (INDCs), covering 97.9% of global carbon emissions. As a result, the world has substantially transitioned into low-carbon development.
The current climate challenges are escalating in severity, transcending environmental concerns to intersect with politics, economics, diplomacy, national security, and other domains. In the future, these challenges are poised to emerge as one of the determinative factors influencing the international political and economic landscape. Undoubtedly, addressing global climate change represents a formidable challenge confronting human society and stands as the most significant issue on the contemporary global governance agenda. In this global context, this article selects representative countries such as the United States, the United Kingdom, Japan, Germany, and France to conduct research, systematically comparing their performance and initiatives in energy structure, carbon emissions, and domestic climate change policies. It also delves deeply into and reflects upon the pathways available to humanity in responding to climate change.
2. Global Legislative Process to Address Climate Change
Through research and legislation, the process of responding to climate change has become necessary and urgent in the face of the complex and changing new situation and new requirements. The degree of attention paid by the international community to the issue of climate change is positively correlated with the process of legislation to address it.
Since the establishment of the Kyoto Protocol in 1997, nearly 20 countries and regions have enacted domestic laws and regulations related to addressing climate change, controlling greenhouse gas emissions, promoting low-carbon and green development, and implementing carbon taxation (Table 1) [1]. Europe, as a leading force in global climate governance, introduced the European Green Deal at the end of 2019 and publicly solicited feedback on the draft of the European Climate Law in early March 2020 [2]. Legislative achievements formally enacted in Europe include the Swiss Federal Act on the Reduction of CO2 Emissions, the UK Climate Change Act [3], the French Green Growth and Energy Transition Act [4], the Finnish Climate Change Act [5], the German Federal Climate Protection Act, and the Danish Climate Bill. In the Americas, Mexico has officially enacted the General Law on Climate Change [6], while the state of California in the United States has introduced the Global Warming Solutions Act (State of California), leading the way in proactive climate change policies and actions at the state level in the United States. Countries in the Asia-Pacific region have successively enacted the Climate Change Adaptation Act in Japan,the New Zealand Climate Change Response Act, the Philippine Climate Change Act, the Carbon Neutral Green Growth Framework Act and the Framework Act on Low Carbon Green Growth in South Korea [7]. South Africa stands as the legislative representative on the African continent, having officially enacted the South African Carbon Tax Act and the South African Climate Change Bill [8], which is a significant milestone in South Africa's environmental policy. The global legislative efforts demonstrate the increasing attention and commitment to addressing climate change at the national and regional levels.
The management of climate change response has evolved in the late 20th century and strengthened in the early 21st century. Many countries and regions have explicitly defined the status and powers of institutions responsible for climate change management in their climate legislation, and have achieved normativity and continuity in climate governance through legislation. Take Germany as an example. The German Federal Climate Protection Act authorizes the federal government to supervise the implementation of national emission reduction targets and adjust carbon budgets of various sectors without the approval of the Federal Council, as long as it does not violate EU laws. Federal government departments and affiliated agencies are obligated to implement emission reduction measures.
The Framework Act on Low Carbon Green Growth in South Korea establishes the composition, functions, operational rules, personnel appointments and other aspects of the national and local "Green Growth Committees." The Climate Change Response Act in New Zealand specifies the responsibilities of agencies such as the Ministry of Finance, National Register Office, and National Inventory Agency and establishes a management and supervision system for climate change response in New Zealand. The General Law on Climate Change in Mexico sets up a national climate change response system composed by Climate Change Committee, Interior Ministry Climate Change Committee, Energy and Climate Change Agency, advisory bodies, and state governments. The Global Warming Solutions Act in California establishes a management and supervision mechanism for climate change response, with the California Air Resources Board responsible for greenhouse gas emission reductions affairs. The Philippines Climate Change Act establishes the "Climate Change Commission" as the national governing body for climate change response, detailing qualifications, composition requirements, powers, meeting protocols, and reporting systems of the commission.
The statutory responsibilities of climate change management agency over the world generally include the following aspects:
1. Setting and supervising the implementation of emission reduction targets. For example, the Global Warming Solutions Act in California mandates the “Air Resources Board” to propose early action targets at different stages and annual emission reduction, and oversee the implementation of the act. The UK Climate Change Act sets an independent Climate Change Committee to advise on carbon budgets, allocate them, produce annual progress reports, and monitor the government's progress.
2. Developing climate policy to complement the law. For example, the California Global Warming Solutions Act only specifies the basic aspects of carbon trading, such as the managing institution, types of transactions, and scope, authorizing the Air Resources Board to develop specific trading rules.
3. Organizing and carrying out publicity and cooperation on climate change issues. For instance, the New Zealand Climate Change Response Act designates the Ministry of Finance to conduct overseas emission trading on behalf of the country, and the National Register Office to facilitate emission reduction information exchange with other countries.
By incorporating national climate change goals into the legal system, laws become the most important means to enforce these goals with the coercive power of the state. Through legislation, countries ensure the continuous fulfillment of international treaty obligations and promote regional transition to low-carbon economies, reducing greenhouse gas emissions and mitigating the adverse impacts of climate change.
3. Comparative Analysis of Climate Change Policies of Major Economies
The United States, United Kingdom, Japan, Germany, and France have released numerous domestic policies in recent years to advance their goals of achieving carbon neutrality by 2050. Some countries, building on their achievement of carbon peaking, have established policy frameworks similar to "1+N" system for carbon peaking and neutrality [9]. For instance, the United Kingdom has already developed a comprehensive "1+1+N+X" policy framework for achieving carbon neutrality, which includes a legislative document, a top-level plan, multiple actions and strategic consultations[10]. Such frameworks offer valuable insights for enhancing the global dual-carbon policy system.
3.1. Policies on Climate Change in the U.S.
The United States achieved peak carbon around 2005 and released the "Long-Term Strategy Toward Net Zero Emissions by 2050" in 2021, setting a clear roadmap of achieving carbon neutrality. This strategy outlines milestone plans and specific technological pathways for the United States to achieve carbon neutrality.
In terms of overall goals, the United States aims to achieve greenhouse gas reductions of 26%-28% and 50%-52% below 2005 levels by 2025 and 2030, respectively. Furthermore, the United States targets to achieve 100% clean electricity by 2035 [11,12].
The strategy notably underscores five key technological transformations as core pathways:
1) Decarbonizing the power sector by rapidly transitioning to clean energy sources such as solar and wind power due to the declining costs, federal and local government policies, and consumer demand.
2) Electrification and clean energy substitution at end-use sectors, such as transportation, buildings, and industry. Priority is given to clean energy alternatives in areas where electrification faces challenges, such as aviation and transportation.
3) Energy waste reduction by the applications of more efficient appliances and comprehensive energy-saving measures in both new and existing buildings.
4) Methane and other non-CO2 greenhouse gas emission reductions. Commitments are made to implement comprehensive measures to reduce domestic methane emissions in the U.S.. Additionally, the Global Methane Pledge is initiated, aiming to collectively reduce global methane emissions by at least 30% by 2030, thus reducing global temperature rise by 0.2℃ by 2050.
5) Scaling up carbon removal. In addition to achieving net-zero emissions by 2050, efforts will be made to implement soil carbon sequestration and other measures to remove carbon dioxide from the atmosphere.
3.2. Policies on Climate Change in the U.K.
According to data from Eurostat, the United Kingdom ranks as the ninth-largest economy in the world by GDP and is the third-largest energy consumer in Europe. The United Kingdom has demonstrated significant leadership in addressing climate change. As early as 1991, the UK achieved peak carbon emissions and in 2008 [13], it released the Climate Change Act, which set a visionary goal of reducing greenhouse gas emissions by 80% by 2050 compared to 1990 levels. This made the UK the first country to legally embed emission reduction targets into its national framework. In 2019, the UK further amended the Climate Change Act to explicitly aim for net-zero emissions by 2050.
Since 2019, the UK has entered the "Net Zero Transition Phase" and has substantially established a comprehensive policy framework known as "1+1+N+X" for carbon neutrality. Under this framework, the UK government launched the Ten Point Plan for a Green Industrial Revolution in 2020, which serves as a core guiding principle. This plan covers various sectors including energy, transportation, green buildings, CCUS (Carbon Capture, Utilization, and Storage), and green finance. It is projected to achieve a reduction of approximately 181 megatons of carbon dioxide equivalent by 2032, with energy, green buildings, and CCUS accounting for approximately 62 megatons, 71 megatons, and 40 megatons of carbon dioxide equivalent reductions, respectively. Additionally, the UK government has implemented a series of strategic action plans to enhance the effectiveness of the net-zero agenda [14].
3.3. Policies on Climate Change in Japan
Japan achieved carbon peaking in 2013 and has since then continued to strengthen the policies on climate change. In October 2020, former Prime Minister Yoshihide Suga announced in a special session of the Diet that Japan aims to achieve carbon neutrality by 2050. In pursuit of this target, new emission reduction goals were declared in April 2021, aiming to reduce greenhouse gas emissions by 46% by 2030 compared to 2013 levels and strive for a reduction of 50%. In May 2021, the Japanese House of Councilors passed the Act on Promotion of Global Warming Countermeasures, officially enshrining the goal of carbon neutrality into legislation [15].
Furthermore, Japan has implemented a series of measures in terms of industrial policy. In 2012, Japan issued the "Green Growth Strategy," aimed at promoting the development of environmental industries and facilitating the green transformation of the energy structure. To further refine and strengthen these efforts, the Ministry of Economy, Trade and Industry, together with relevant departments, issued the "Green Growth Strategy toward 2050 Carbon Neutrality" in June 2021. The strategy aims to promote the development of 14 key industries, including offshore wind power, photovoltaic power generation, geothermal energy, nuclear energy, automobiles and battery industries, to help Japan address climate change and achieve carbon neutrality. Additionally, the strategy emphasizes the necessity of implementing policies across five aspects: fiscal budgets, taxation, finance, regulatory reforms and standardization, and national cooperation, to mobilize private sector investments of 240 trillion yen into the aforementioned industries [16].
3.4. Policies on Climate Change in German
Germany achieved carbon peaking as early as 1979, demonstrating significant policy consistency and goal clarity in addressing climate change. In November 2019, Germany enacted the Climate Protection Law, which legislatively defined the country's greenhouse gas reduction targets: a reduction of at least 55% in greenhouse gas emissions by 2030 compared to 1990 levels, and net zero greenhouse gas emissions by 2050. In June 2021, Germany further revised the law, increasing the emission reduction target for 2030 to 65% compared to 1990 levels, and setting a target of 88% reduction by 2040. Simultaneously, the timeline for achieving carbon neutrality was brought forward by 5 years to 2045 [17].
Within the legal framework, Germany has formulated a series of comprehensive measures to address climate change. These measures include establishing specialized departments to implement carbon emission budgets and conduct quality inspections, enhancing the capacity of natural carbon sinks, developing emergency climate protection plans for industries and individuals, and emphasizing the importance of coordinating climate protection at the EU level. In the energy sector specifically, Germany has expedited policy planning and approval processes to actively promote the development of renewable energy, such as wind and solar power, while gradually phasing out coal and nuclear energy, in order to achieve emission reduction targets. Since 1990, the greenhouse gas emissions have significantly decreased, with emissions dropping by nearly 40% to 7.62×10⁸ tons as of 2021.
3.5. Policies on Climate Change in France
Similar to Germany, France also achieved carbon peaking in 1979. France’s National Low Carbon Strategy, initially launched in 2015, explicitly outlined greenhouse gas emission reduction targets for the first time, setting the target of carbon neutrality by 2050 after multiple revisions [18]. In May 2023, France further announced that it planned to reduce greenhouse gas emissions by 50% by 2030 compared to 1990 levels.
The National Low Carbon Strategy in France provides guidelines for various sectors, including buildings, transportation, agriculture, forestry and land, energy production, and industry and waste management, to transition to a low-carbon economy. The strategy proposed that by 2050, France should achieve carbon-free energy production, halve energy consumption through improved energy efficiency in appliances and adopting a more sustainable lifestyle, significantly reduce non-energy emissions (such as a 38% reduction in agriculture and a 60% reduction in industrial processes compared to 2015), increase and protect carbon sinks such as soil and forests, and promote CCUS (Carbon Capture, Utilization and Storage) technology in the bio-economy sector. Additionally, the strategy promotes the establishment of a carbon budget system in France to help the government calculate the remaining carbon levels that can be emitted before reaching net-zero, providing a quantifiable and sustainable framework for achieving carbon neutrality.
4. Analysis of World Energy Structure and Carbon Emission Status
Over the past six decades, global carbon dioxide emissions have shown a continuous upward trend (Figure 1), although the growth rate has slowed down. According to the 2023 Statistical Review of World Energy published by the Energy Institute (EI) [19], global CO2 emissions were 14,291.71 megatons in 1970, increasing by 49% twenty years later. During the decade from 2010 to 2019, global greenhouse gas emissions reached their highest level in history, with global CO2 emissions rising to 35.66 gigatons, representing a 3.70% increase compared to 2012. However, following the consensus reached by countries on climate issues in 2015, the average growth rate of greenhouse gas emissions during this period was lower than the previous decade, decreasing from an annual average of 2.1% from 2000 to 2009 to 1.3%.
Between 2019 to 2022, global CO2 emissions showed a notable trend of initial decline followed by a rising, with a mere 0.11% year-on-year increase in global carbon emissions in 2019. In 2020, the global economy experienced a severe downturn due to the impact of the global COVID-19 pandemic, coupled with factors such as economic lockdowns and industry shutdowns, leading to a significant reduction in carbon emissions worldwide. Carbon emissions in various countries generally decreased from 35.34 gigatons in 2019 to 33.43 gigatons in 2020, marking a substantial year-on-year decrease of 5.6%. As economies gradually recovered, global CO2 emissions reached 35.53 gigatons in 2021, representing an increase of 6.3% (2.1 gigatons) compared to 2020 and an increase of 0.5% (0.19 gigatons) compared to 2019. In 2022, global CO2 emissions were approximately 36.07 gigatons, indicating an increase of 1.5% (0.54 gigatons) compared to 2021, an increase of 7.9% (2.64 gigatons) compared to 2020, and an increase of 2.1% (0.73 gigatons) compared to the pre-pandemic level in 2019.
In 2022, global carbon emissions were lower than expected, reaching a historic high but with a slower growth rate compared to 2021. Specifically, carbon emissions from energy consumption exceeded 3.68 gigatons, an increase of 423 megatons, while CO2 emissions from industrial production decreased by 102 megatons. The promotion of new energy technologies and adjustments of the energy structure are among the primary contributing factors.
From the perspective of various energy consumption (Figure 2), global oil consumption reached 190.69 EJ in 2022, accounting for 31.6%. This was followed by coal consumption at 161.47 EJ, representing approximately 26.7%. [19].
From a regional perspective of consumption (Figure 3), the Asia-Pacific region had the highest energy consumption in 2022, reaching 17955.4 million tons of carbon dioxide, accounting for approximately 52.2%, followed by North America with 5851.4 million tons of carbon dioxide, representing approximately 17% [19].
Overall, despite some progress in global emissions reduction has been achieved, the challenge at the global level remains daunting, due to factors such as differences in energy structures, awareness of emissions reduction and other influencing factors.
4.1. U.S. Energy Structure and Carbon Emissions Status
Over the past decade, the United States has experienced an overall decline in carbon emissions, but still ranks second globally in terms of carbon emissions, primarily sourced from fossil fuels, especially natural gas and oil. According to the 2023 Statistical Review of World Energy database released by the Energy Institute (EI) [19], energy-related CO2 emissions in the United States decreased by approximately 263.3 megatons of CO2 equivalent (MtCO2e) from 2012 to 2022, representing a reduction of 5.17% (Figure 4). In 2022, global natural gas prices surged, leading most other countries to reduce their reliance on natural gas; however, the United States went in the opposite direction. Driven by rising natural gas consumption, U.S. energy-related carbon dioxide emissions increased by 1.2% (57.4 MtCO2e). In the energy structure of the United States for the year, coal, natural gas, oil, nuclear power and renewable energy accounted for 9.83%, 33.34%, 35.77%, 8.03%, and 13.03%, respectively. Notably, natural gas and oil alone comprised 69.11% of the total energy mix (Figure 5).
In recent years, the United States has placed energy system transformation at the forefront of its efforts to accelerate energy structure adjustment. The country is committed to reducing the proportion of fossil fuels and promoting comprehensive decarbonization in sectors such as electricity and industry. From 2012 to 2022, the share of fossil fuels in the US energy mix decreased by 3.11%, while the nuclear power remained relatively stable, and the proportion of renewable energy increased by 3.63%.
Based on the evolving U.S. energy structure and recent trends in primary energy consumption, projections indicate that U.S. carbon dioxide emissions will continue to rise in 2024, but at levels below from 2019.
4.2. U.K. Energy Structure and Carbon Emissions Status
Over the past decade, the United Kingdom has achieved a significant reduction in carbon emissions, with a growth rate lower than the global average. In 2019, the carbon emissions in the UK reached a lowest historic level, totaling 381.3 MtCO2e, representing a decrease of approximately 3.8% compared to 2018. In comparison to 2012, there has been a remarkable reduction of 25.15% over the span of a decade. Notably, despite a 4.1% growth in the UK's economy in 2022, carbon emissions did not experience a significant surge. Figure 6 illustrates the carbon dioxide emissions related to energy in the UK from 2012 to 2022 [19].
From 2012 to 2022, the proportion of fossil fuels and nuclear energy in the UK energy structure decreased by 9.74% and 1.73% respectively. On the contrary, the proportion of renewable energy increased by 12.5%.
Due to the expansion of clean energy utilization, rare heatwaves, and record-high fossil fuel prices, the consumption of natural gas in the United Kingdom experienced a slight decline in 2022. The proportion of oil, natural gas, coal, nuclear energy, and renewable energy in the UK's energy structure were 36.5%, 35.4%, 3%, 5.9%, and 19.2%, respectively (refer to Figure 6), with greenhouse gas emissions increasing by 0.94%, remaining relatively stable, ending the brief downward trend following the COVID-19 pandemic.
Influenced by factors such as structural adjustments in energy, based on historical data, it is expected that the carbon dioxide emissions in the UK will be lower in 2024 than in 2019.
4.3. Japan’s Energy Structure and Carbon Emissions Status
Due to the impact of the Fukushima nuclear accident, Japan experienced an increase in demand for fossil fuels, leading to a short-term rise in carbon emissions. However, in recent years, this trend has gradually started to reverse. Japan achieved carbon peaking in 2012, with carbon emissions reaching 1282.2 megatons. In 2019, Japan's CO2 emissions decreased to 1120.6 megatons, representing a reduction of 161.6 megatons or 12.6% compared to 2012. Following the end of the COVID-19 pandemic, carbon emissions in Japan slightly rebounded to 1065.7 megatons in the years 2021-2022, as shown in Figure 8 [19].
Japan is committed to accelerating the decarbonization in power sector and promoting energy structure transformation through a development model centered around electrification of the energy system. During the period from 2012 to 2022, the proportion of fossil fuels in Japan's energy structure decreased by 8.91%, while the proportion of renewable energy increased year by year due to factors such as nuclear power plant suspensions, fixed feed-in tariffs, and subsidy systems, with an increase of 7%.
In 2022, the proportions of coal, crude oil and its products, natural gas, renewable energy, and nuclear power in Japan's energy structure were 37.05%, 20.29%, 27.58%, 12.5%, and 2.63%, respectively. (Figure 9).
The share of renewable energy will continue to increase in the future. According to the Sixth Basic Energy Plan, the proportion of renewable energy in the electricity structure is expected to reach 36%-38% by 2030.
There are 54 nuclear power plants in Japan, generating about one-third of electricity came from nuclear energy. Prior to the Great East Japan Earthquake and Tsunami, nuclear power accounted for approximately 30% of Japan's national electricity supply. Following the impact of the earthquake, most of the nuclear power plants have been shut down and subsequently restarted in the Fourth Basic Energy Plan in 2014, with the proportion showing a trend of initially decreasing and then gradual increase. By 2021, the proportion of nuclear power had reached 3.34%. However, in 2022, Japan's nuclear power generation declined to 51.8 billion kilowatt-hours (kWh), accounting for 2.63% of the total, partially compensated by coal, natural gas, thermal and solar power generation.
In 2023, Japan embarked on a restructured plan for green energy transition, entitled "Basic Policy for Achieving Green Transformation" (hereinafter referred to as "the Policy"). The Japanese government revised the Policy, stipulating series of energy transformation measures including the restart of nuclear power plants, development of new-generation nuclear power units, support for research and utilization of hydrogen and ammonia, promotion of energy security, and introduction of renewable energy.
4.4. Germany’s Energy Structure and Carbon Emissions Status
As the largest economy and strongest industrial manufacturing capability, Germany has a significant energy consumption, making it one of the largest carbon emitters in Europe. According to the carbon emissions data from the German Environment Agency (Umweltbundesamt, UBA) [20], Germany has witnessed a gradual decline in carbon emissions in recent years. Notably, from 2018 to 2020, there was a significant reduction of 127.6 megatons, amounting to 17.41% decrease in carbon emissions. (Figure 10).
During the period from 2012 to 2022, the proportion of fossil fuels in Germany's energy structure decreased by 6.76%, while nuclear energy decreased by 4.68%, and the proportion of renewable energy increased by 11.44%. Simultaneously, Germany's primary energy consumption decreased from 13.54 EJ to 12.3 EJ, with a reduction of 9.16%, which is significantly higher than the decrease in carbon dioxide emissions during the same period (7.08%).
Although Germany still relies on fossil fuels, but the usage is gradually decreasing. In 2022, the proportions of oil, natural gas, coal, nuclear energy and renewable energy in Germany's energy structure were 34.66%, 22.62%, 18.96%, 2.52% and 21.24%, respectively (Figure 11). Germany's natural gas supply was affected by the "Russia-Ukraine conflict," leading to a 15.75% year-on-year decrease in natural gas consumption to 2.78 EJ. It is anticipated that in the short term, the proportion of other fossil fuel consumption may increase, and carbon emissions may temporarily rise due to adjustments of the energy structure.
Germany has implemented measures such as phasing out coal and nuclear energy, vigorously developing renewable energy, and continuously improving energy efficiency. However, due to the impact of the nuclear phase-out policy, it is anticipated that Germany's carbon dioxide emissions may increase slightly in 2023.
4.5. France’s Energy Structure and Carbon Emissions Status
France has maintained a relatively low level of carbon emissions and exhibited a fluctuating downward trend. According to the 2023 Statistical Review of World Energy published by the Energy Institute (EI) [19], from 2012 to 2022, France's carbon dioxide emissions decreased by approximately 65.9 megatons, reflecting a reduction of 19.6% (Figure 12).
From 2012 to 2022, the proportion of fossil fuels in France's energy structure remained relatively stable. France has highly depended on nuclear energy for a long time. In order to promote the transformation of energy structure and achieve decarbonization goals, France has implemented measures such as reducing nuclear energy plans and improving energy efficiency.
By 2022, the proportions of oil, natural gas, coal, nuclear energy, and renewable energy in France's energy structure were 34.73%, 16.46%, 2.51%, 31.62%, and 14.68% respectively (Figure 13). Compared to 2012, the proportion of nuclear energy decreased by 11.38%, while the proportion of renewable energy increased by 10.68%. France's primary energy consumption decreased from 10.37 EJ to 8.39 EJ, representing a reduction of 19.09%, which is slightly lower than carbon dioxide emissions during the same period (19.64%).
4.6. Analysis of Carbon Emission Reductions in the above Five Countries
In 2020, the outbreak of the COVID-19 pandemic had varying degrees of impact on the economic development of countries worldwide. The carbon dioxide emissions of the United States, United Kingdom, Japan, Germany, and France all experienced significant reductions, marking the lowest levels in nearly a decade. However, in 2021, as production and daily activities resumed to normal, carbon emissions have exceeded these years when the COVID-19 broke out. After excluding the data of 2020, this paper evaluates the "nationally determined contributions" of carbon emissions for each country, using the baseline of carbon dioxide emissions in 2019, the year before the COVID-19 outbreak.
In Article 3 of the United Nations Framework Convention on Climate Change, it is stipulated that "developed country Parties should take the lead in addressing climate change and its adverse effects." Therefore, as developed countries, the carbon emissions reduction efforts of the United States, United Kingdom, Japan, Germany, and France should surpass the global average. According to Table 2, the carbon reduction efforts of these five countries are higher than the global average, achieving a certain level of "nationally determined contributions." If ranked by "proportional carbon emissions reduction," the order would be the United Kingdom, Germany, France, Japan, and the United States.
5. Conclusions and Discussion
This paper provides a comprehensive analysis of the policies and actions taken by the United States, United Kingdom, Japan, Germany, and France in addressing climate change. In terms of energy structure, with the exception of France (53.7%), the proportion of fossil fuels in the energy mix of the other four countries in 2022 ranged from 75% to 85%, indicating a relatively high dependency on fossil fuels.
To achieve carbon neutrality, these five countries have mainly depended on measures such as phasing out fossil fuels, increasing the proportion of natural gas in primary energy consumption, improving energy efficiency, and increasing the proportion of renewable energy in the energy mix, which have achieved significant results. According to available data, around 2020, these countries updated their respective greenhouse gas emission reduction plans, with Germany notably advancing the carbon neutrality target to 2045. Furthermore, improved greenhouse gas reduction and carbon neutrality plans demonstrate their commitment to achieving the goals of the Paris Agreement.
The objective outlined in the Paris Agreement, "to strive to limit the global average temperature increase within 1.5℃ above pre-industrial levels," corresponds to the global vision of achieving net-zero greenhouse gas emissions by the mid-21st century. This vision implies "balancing anthropogenic carbon dioxide emissions and carbon removal over a given timeframe" [21]. However, achieving carbon neutrality is not limited to the global or national level alone; sub-national entities, industries, enterprises, social organizations, and individuals can all become protagonists in carbon neutrality by achieving net-zero carbon emissions within the entire lifecycle and scope of their economic activities.
Global and national carbon neutrality goals are comprehensive concepts that do not require all entities within the economic and social spheres to achieve carbon neutrality simultaneously. However, the success of the transition to net-zero carbons hinges upon the transformation and adjustment of decision-making processes by each participating entity, aimed at reducing carbon emissions associated with their respective activities based on their specific circumstances. These individual actions form the foundation and key determinant of the success or failure of the net-zero carbon transformation.
To achieve carbon reduction goals and mitigate climate change, the global revolution in energy production and energy consumption has become particularly important, which would lead to transformation in production and distribution relationships, organizational patterns, forming a new social development form and paradigm that fundamentally address the issue of climate change and harmonious coexistence between humans and nature. Throughout this process, the entire socio-economic system will undergo profound changes, ultimately transitioning and reshaping the development paradigm from industrial civilization to ecological civilization.
Institutional Review Board Statement
Not applicable.
Informed Consent Statement
Not applicable.
Data Availability Statement
Data related to carbon emissions and energy structure were obtained from EI (https://www.energyinst.org/statistical-review, 2023 Statistical Review of World Energy).
Conflicts of Interest
The authors declare no conflict of interest.
References
- European Commission. The European Green Deal. Available online: https://commission.europa.eu/publications/factsheets-european-green-deal_en (accessed on 19 Sept., 2023).
- European Commission. Regulation of the European parllament and of the council establishing the framework for achieving climate neutrality and amending regulation (EU) 2018/1999 (European climate law) Brussels, 4.3.2020COM (2020) 80 final 2020/0036(COD). Available online: https://ec.europa.eu/info/index en (accessed on 19 Sept., 2023).
- UK Parliament. Climate change act 2008, chapter 27. Available online: https://services.parliament.uk/Bills/2007-08/climatechangehl/documents.html (accessed on 19 Sept., 2023).
- Republique Francaise. LOI n 2015-992 du 2015 relative à la transition énergétique pour la croissanceverte. Available online: https://www.legifrance.gouv.fr (accessed on 19 Sept., 2023).
- Pölönen. The Finnish climate change act: architecture, functions, and challenges. Climate Law 2014, 4(3-4), 301–326. [CrossRef]
- W.X., Yu; D.Y., Tian. US and Mexico climate change legislation and lessons. J. Journal of Jiangsu University: Social Science Edition, 2016, 18 (2), 1-6, 21. [CrossRef]
- South Korean Prime Minister's Office (Economic Adjustment Office). Framework act on low carbon, green growth. Available online: http://www.law.go.kr (accessed on 19 Sept., 2023).
- Department of Environmental Affairs. Climate change bill. Available online: http://www.environment.gov.za/sites/default/files/legislations/climatechangebill2018_gn41689.pdf (accessed on 19 Sept., 2023).
- A.P., Chen. The global dual carbon policy provides insights for China. J. Ecological Civilization World. 2022, 4, 42-49.
- L.C. Li; W. Chen; F. Yue; Y. Tang. Enlightenment from Studies on Carbon Neutral Strategies of UK. J. Bulletin of Chinese Academy of Sciences. 2023, 38(3), 12. [CrossRef]
- The White House. President Biden Signs Executive Order Catalyzing America'sClean Energy Economy Through Federal Sustainability. Available online: https://www.whitehouse.gov/briefing-room/statements-releases/2021/12/08/fact-sheet-president-biden-signs-executive-order-cat-alyzing-americas-clean-energy-economy-through-federal-sustainability (accessed on 19 Sept., 2023).
- L.L. Zhu. Biden Administration’s "Clean Energy evolution": Contents, Features, and Prospects. J. Journal of China University of Petroleum (Edition of Social Sciences). 2022, 38(4), 45-55. [CrossRef]
- M. Nachmany; S. Fankhauser; T. Townsend; M. Collins; J. Setzer. Climate legislation study: a review of climate change legislation in 33 countries. J. Globe International, 2013.
- X.F. Liang; J. Lv. Carbon Peak, Carbon Neutrality and Path Options: Experience and Reflection on 20 years of British Green Low-Carbon Transformation. J. Ningxia Social Sciences, 2021, 5, 55-65. [CrossRef]
- N. K. Dubash. Varieties of climate governance: the emergence and functioning of climate institutions. J. Environmental politics, 2021, 30, 1-25. [CrossRef]
- J.X. Zhou; Y.X. Bai; Y. Sun; C. Wang. Country Comparison of Governance Models for Addressing Climate Change. J. Chinese Journal of Environmental Management, 2023, 4, 10-17. [CrossRef]
- F. Zhang; K.L. Shang. Study on Energy Governance Systems of Major Economies in the World in the Context of Carbon Neutrality. J. Sino-Global Energy. 2023. 28, 1-8.
- D.Y. Tian; H.Q. Xu. Green growth energy transformation law of France and its enlightenment on China's legislation. M. China University of Political Science and Law Press, Beijing, China, 2017; pp. 271-284.
- Energy Institute. 2023 Statistical Review of World Energy database released by the Energy Institute. Available online: https://www.energyinst.org/statistical-review (accessed on 19 Sept., 2023).
- The German Environment Agency. Available online: https://www.umweltbundesamt.de/en/data (accessed on 19 Sept., 2023).
- Intergovernmental Panel on Climate Change. Global warming of 1. 5℃. Available online: https://www. ipcc. ch/sr15 (accessed on 19 Sept., 2023).
Figure 1.
Global carbon dioxide emissions by regions (1965-2022, megatons of carbon dioxide).
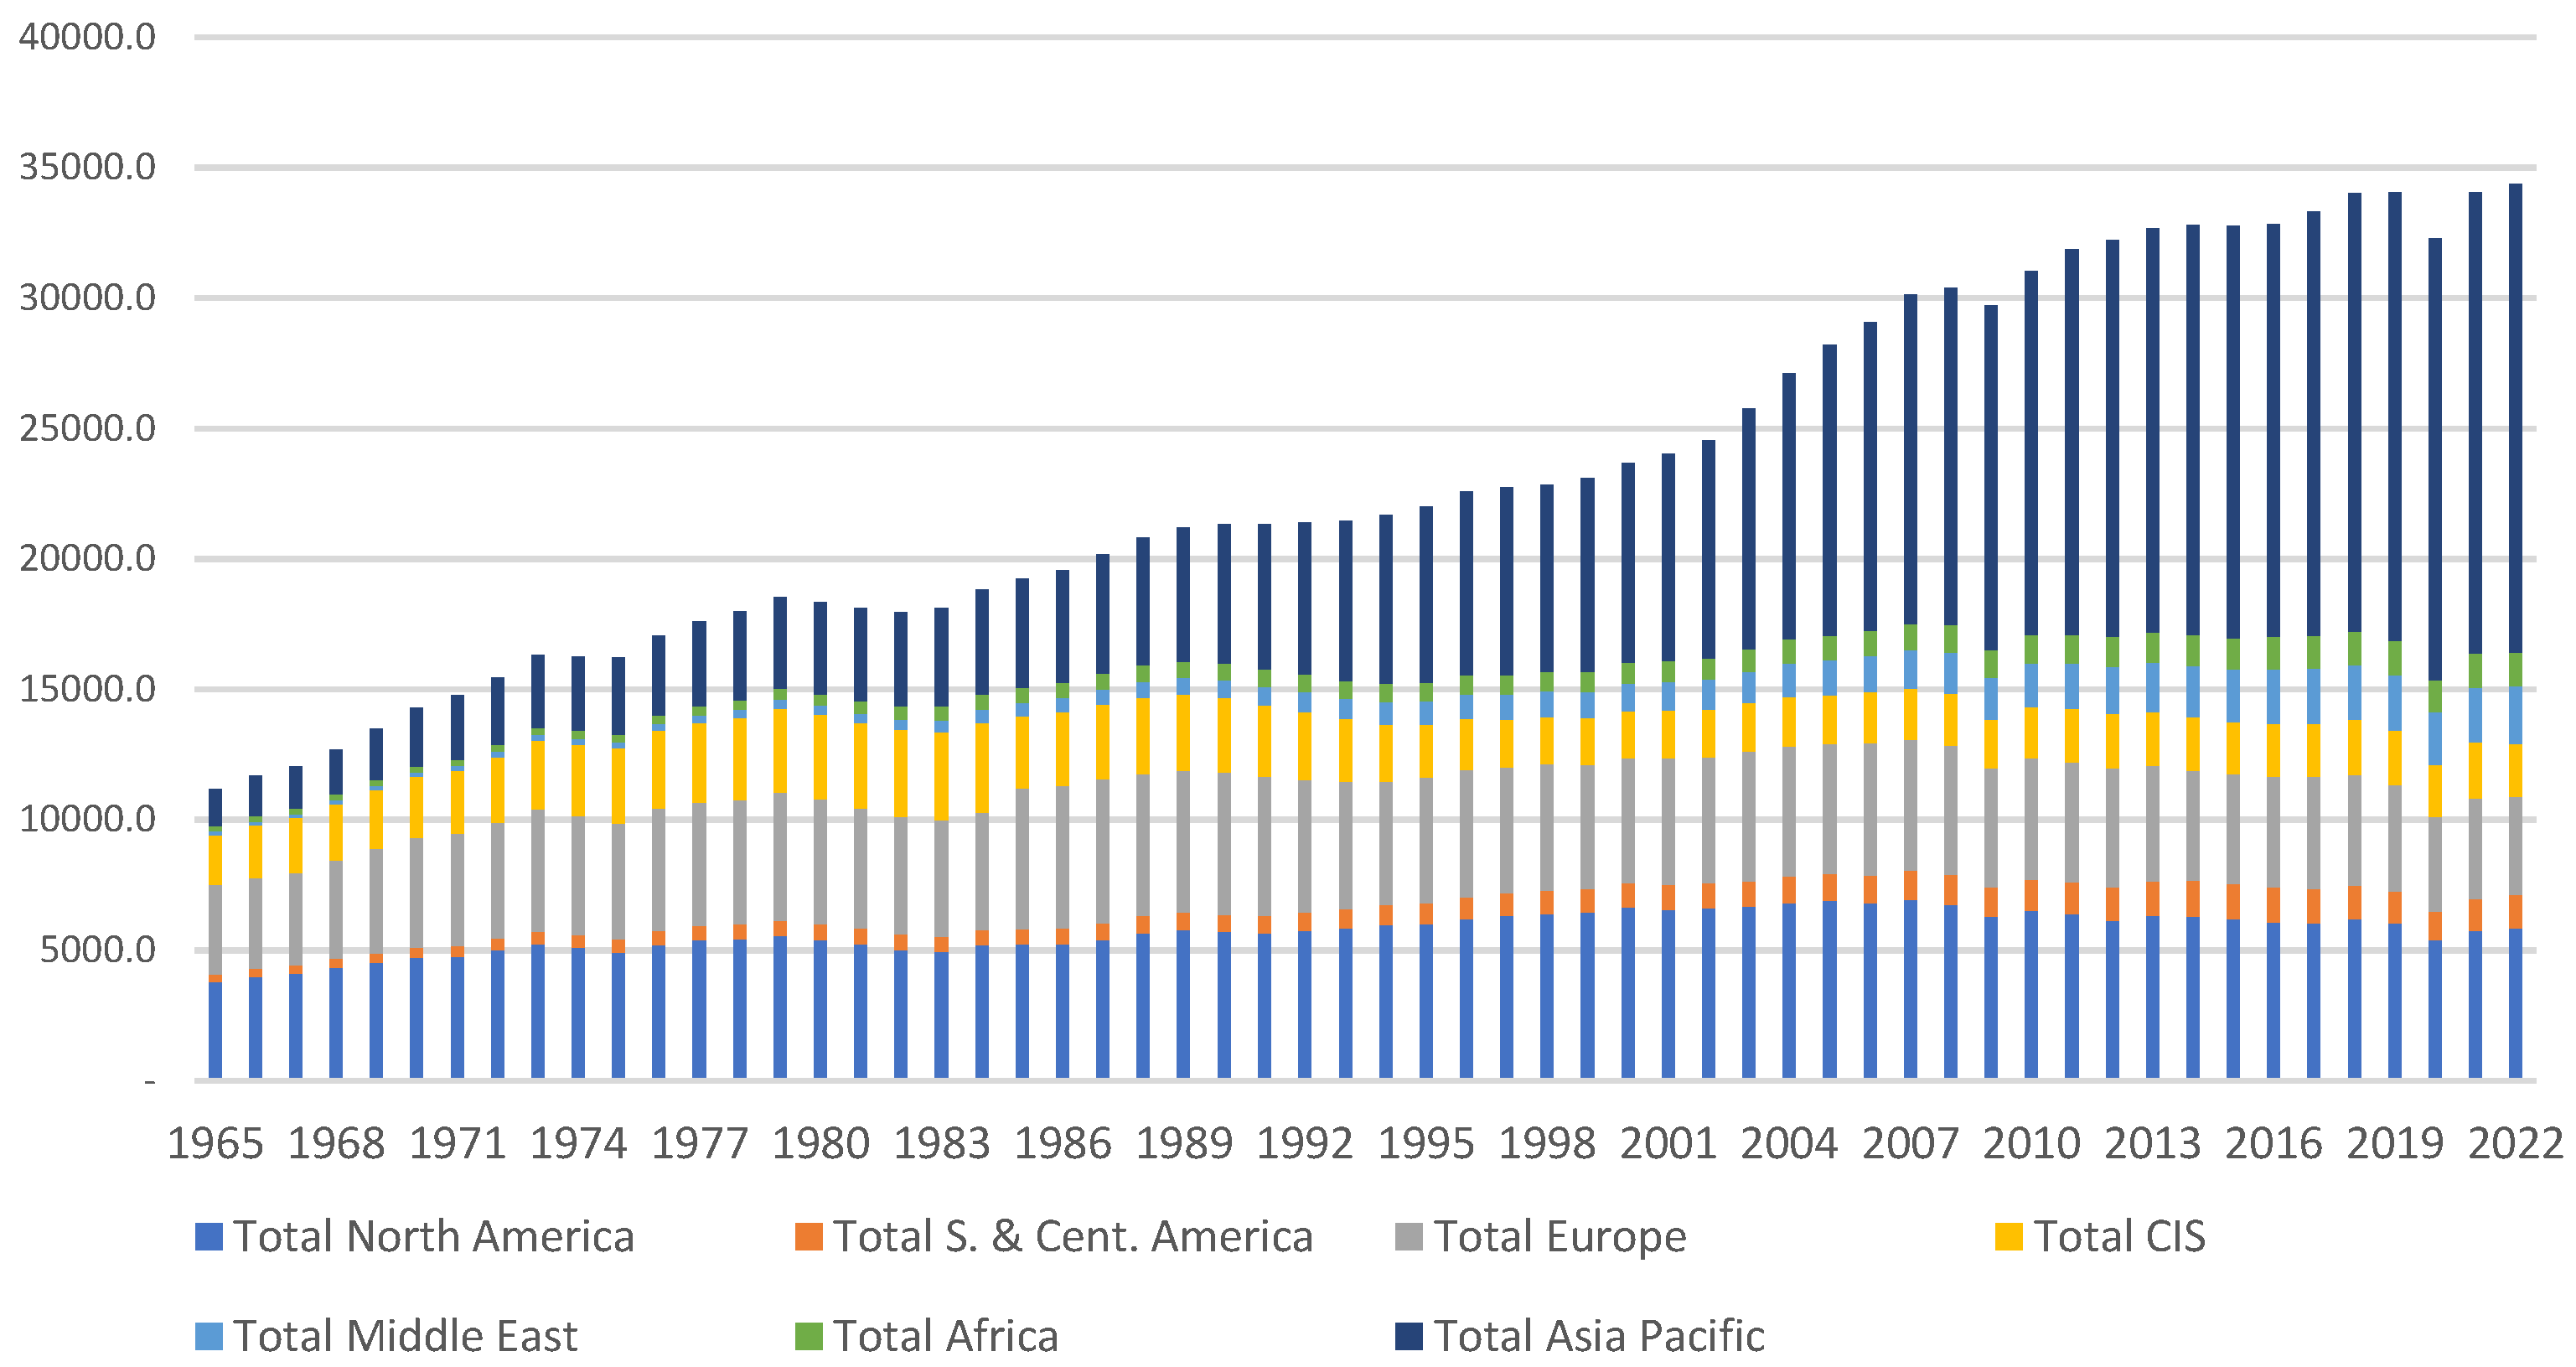
Figure 2.
Global carbon dioxide emissions by region (1965-2022, megatons of carbon dioxide).
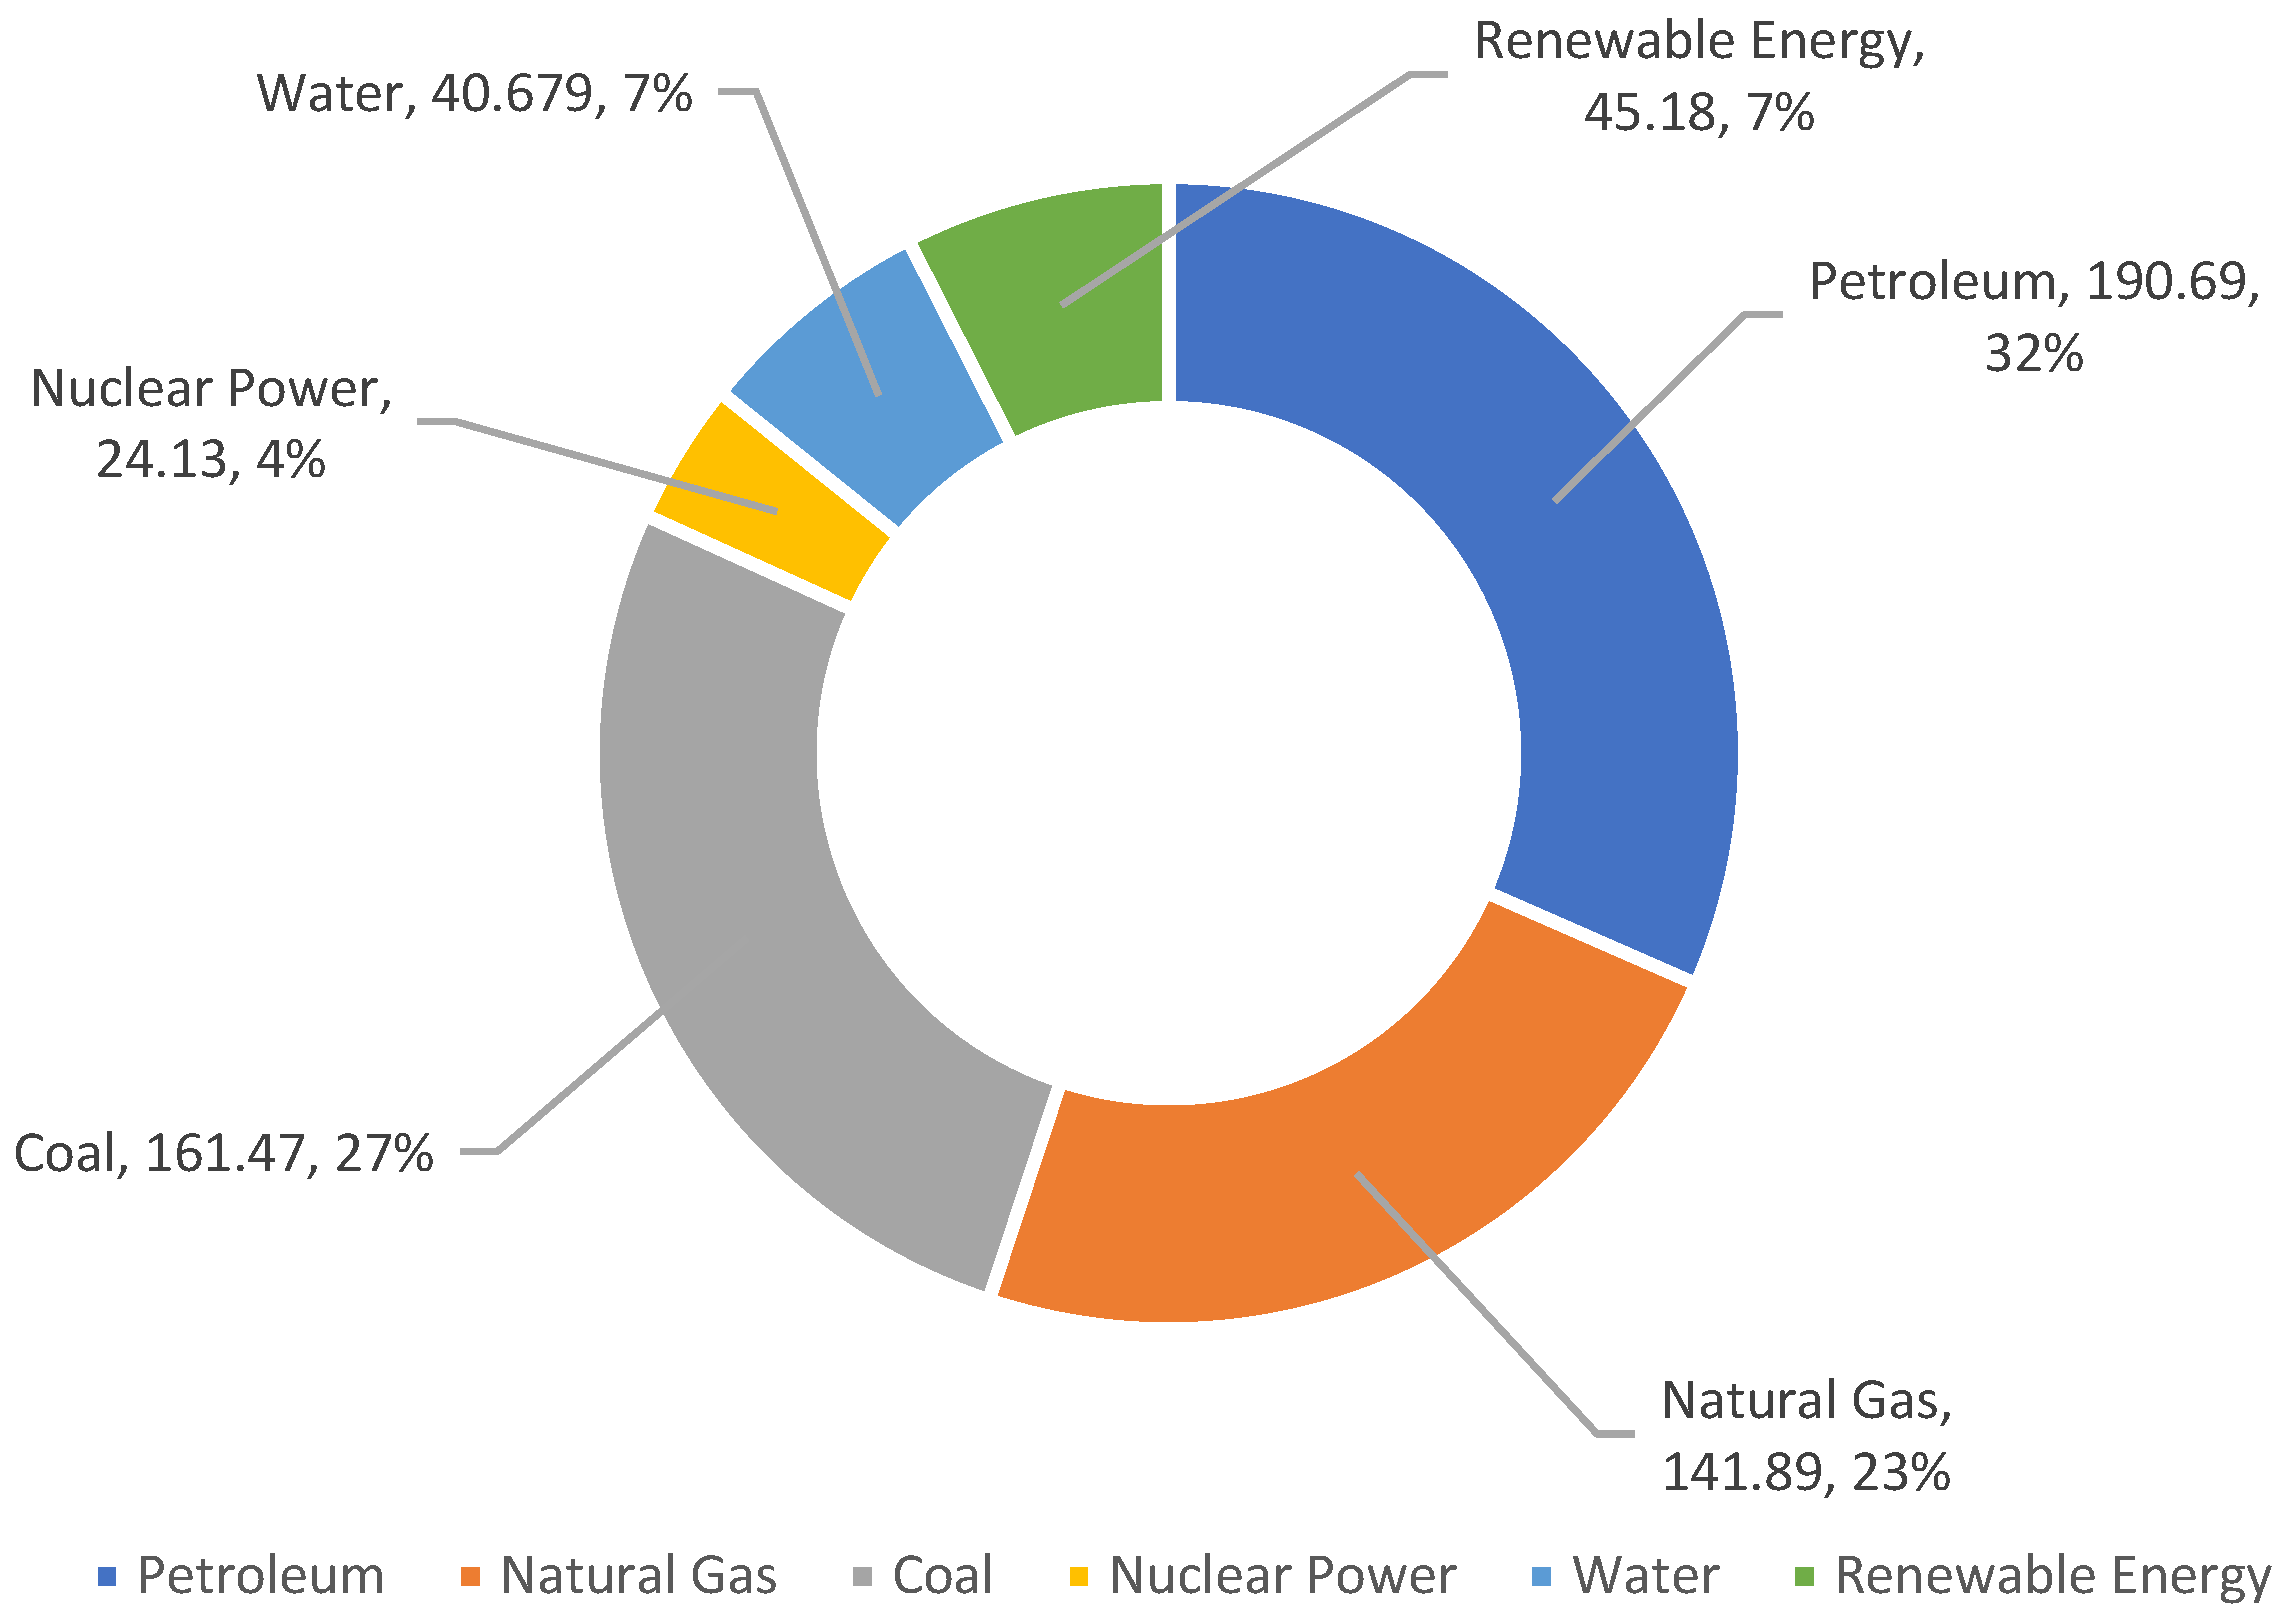
Figure 3.
Energy consumption structure in different regions of the world in 2022 (Million tons of carbon dioxide).
Figure 3.
Energy consumption structure in different regions of the world in 2022 (Million tons of carbon dioxide).
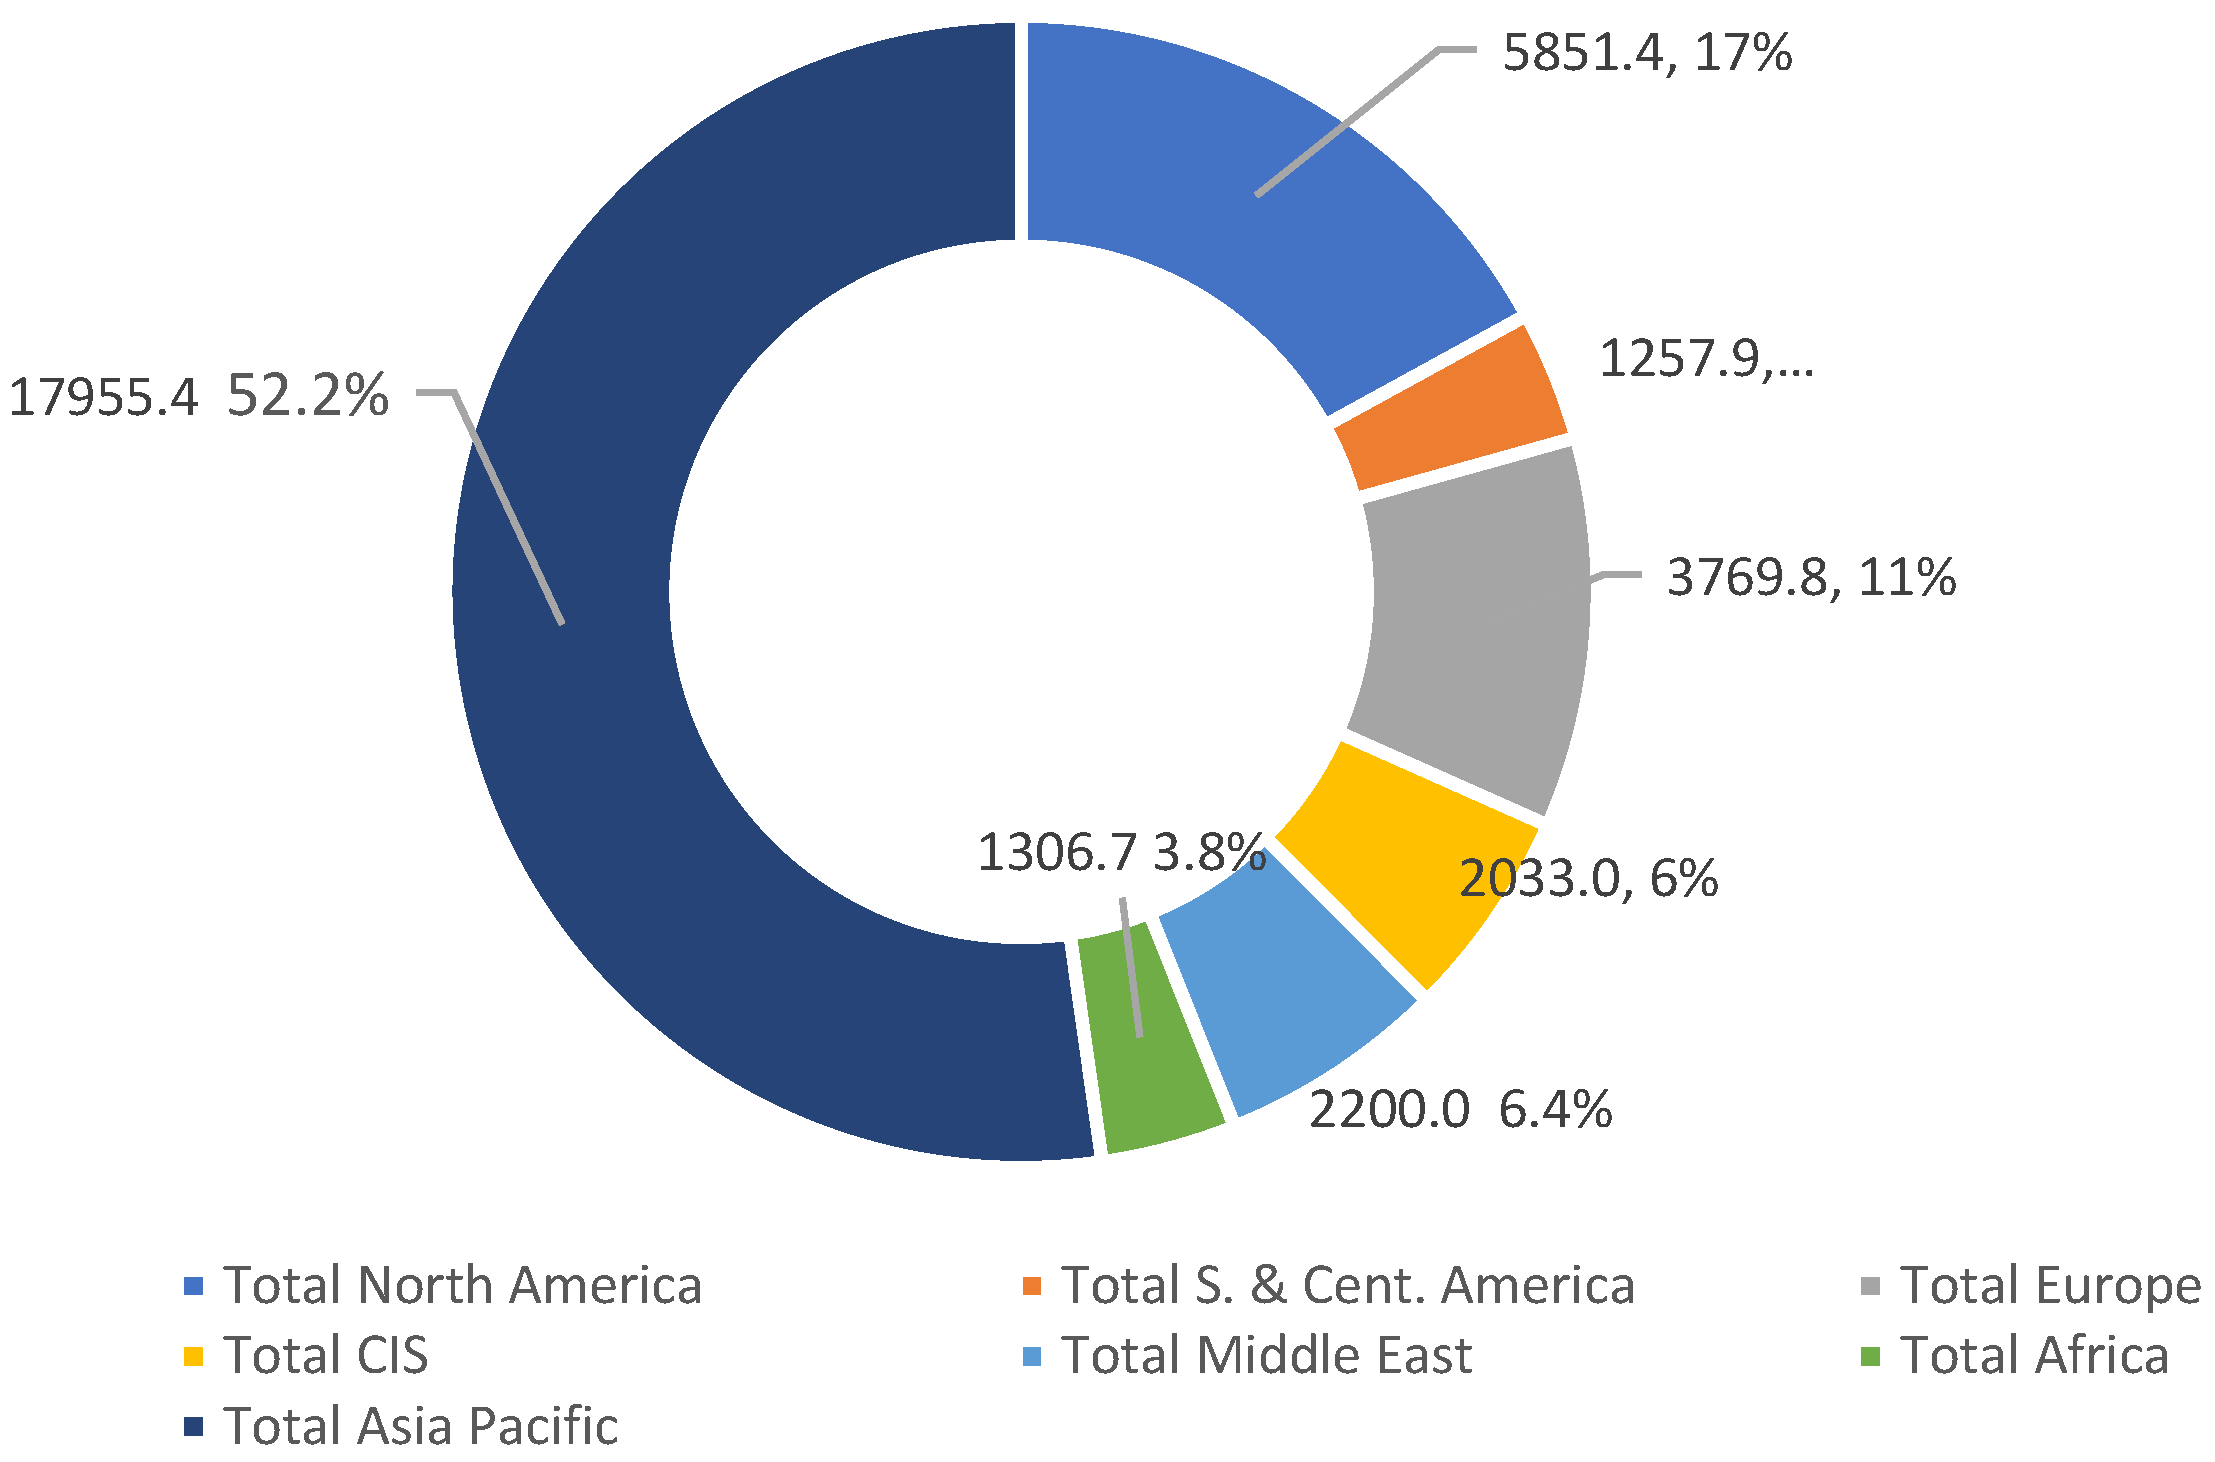
Figure 4.
U.S.’s carbon dioxide emissions from energy, 2012 to 2022 (MtCO2e).
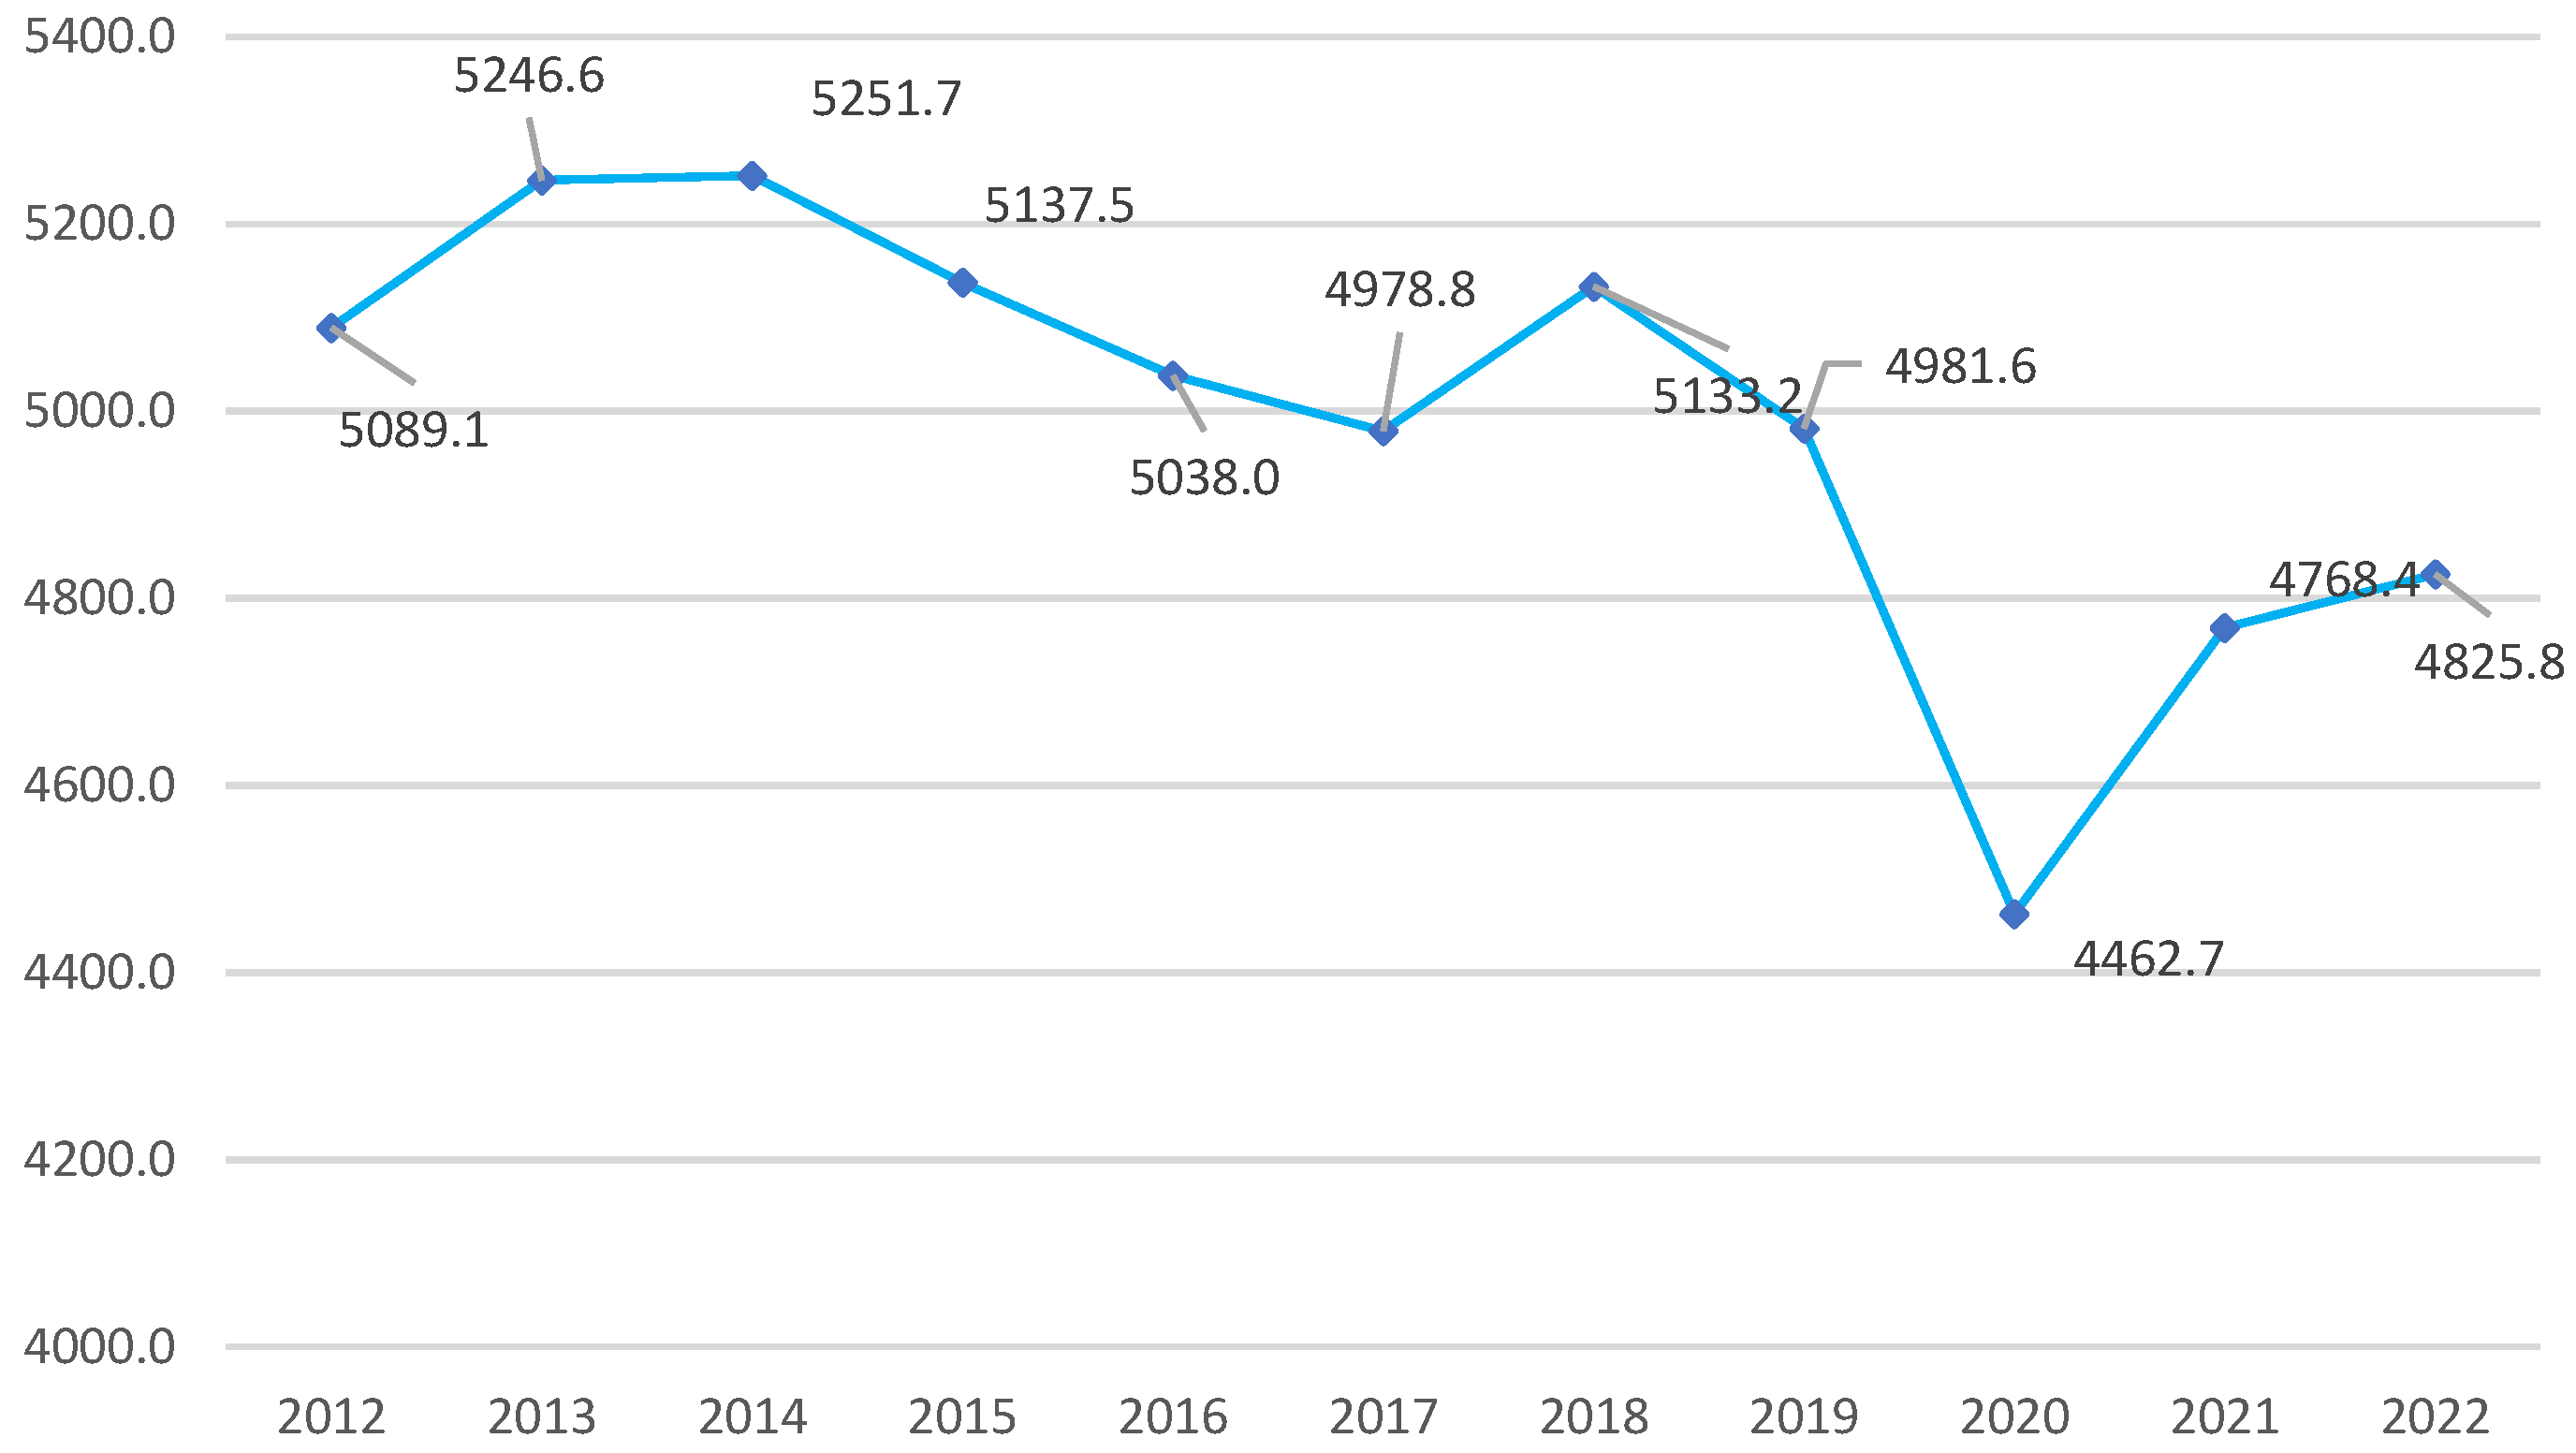
Figure 5.
U.S.’s energy consumption structure from 2012 to 2022 (%).
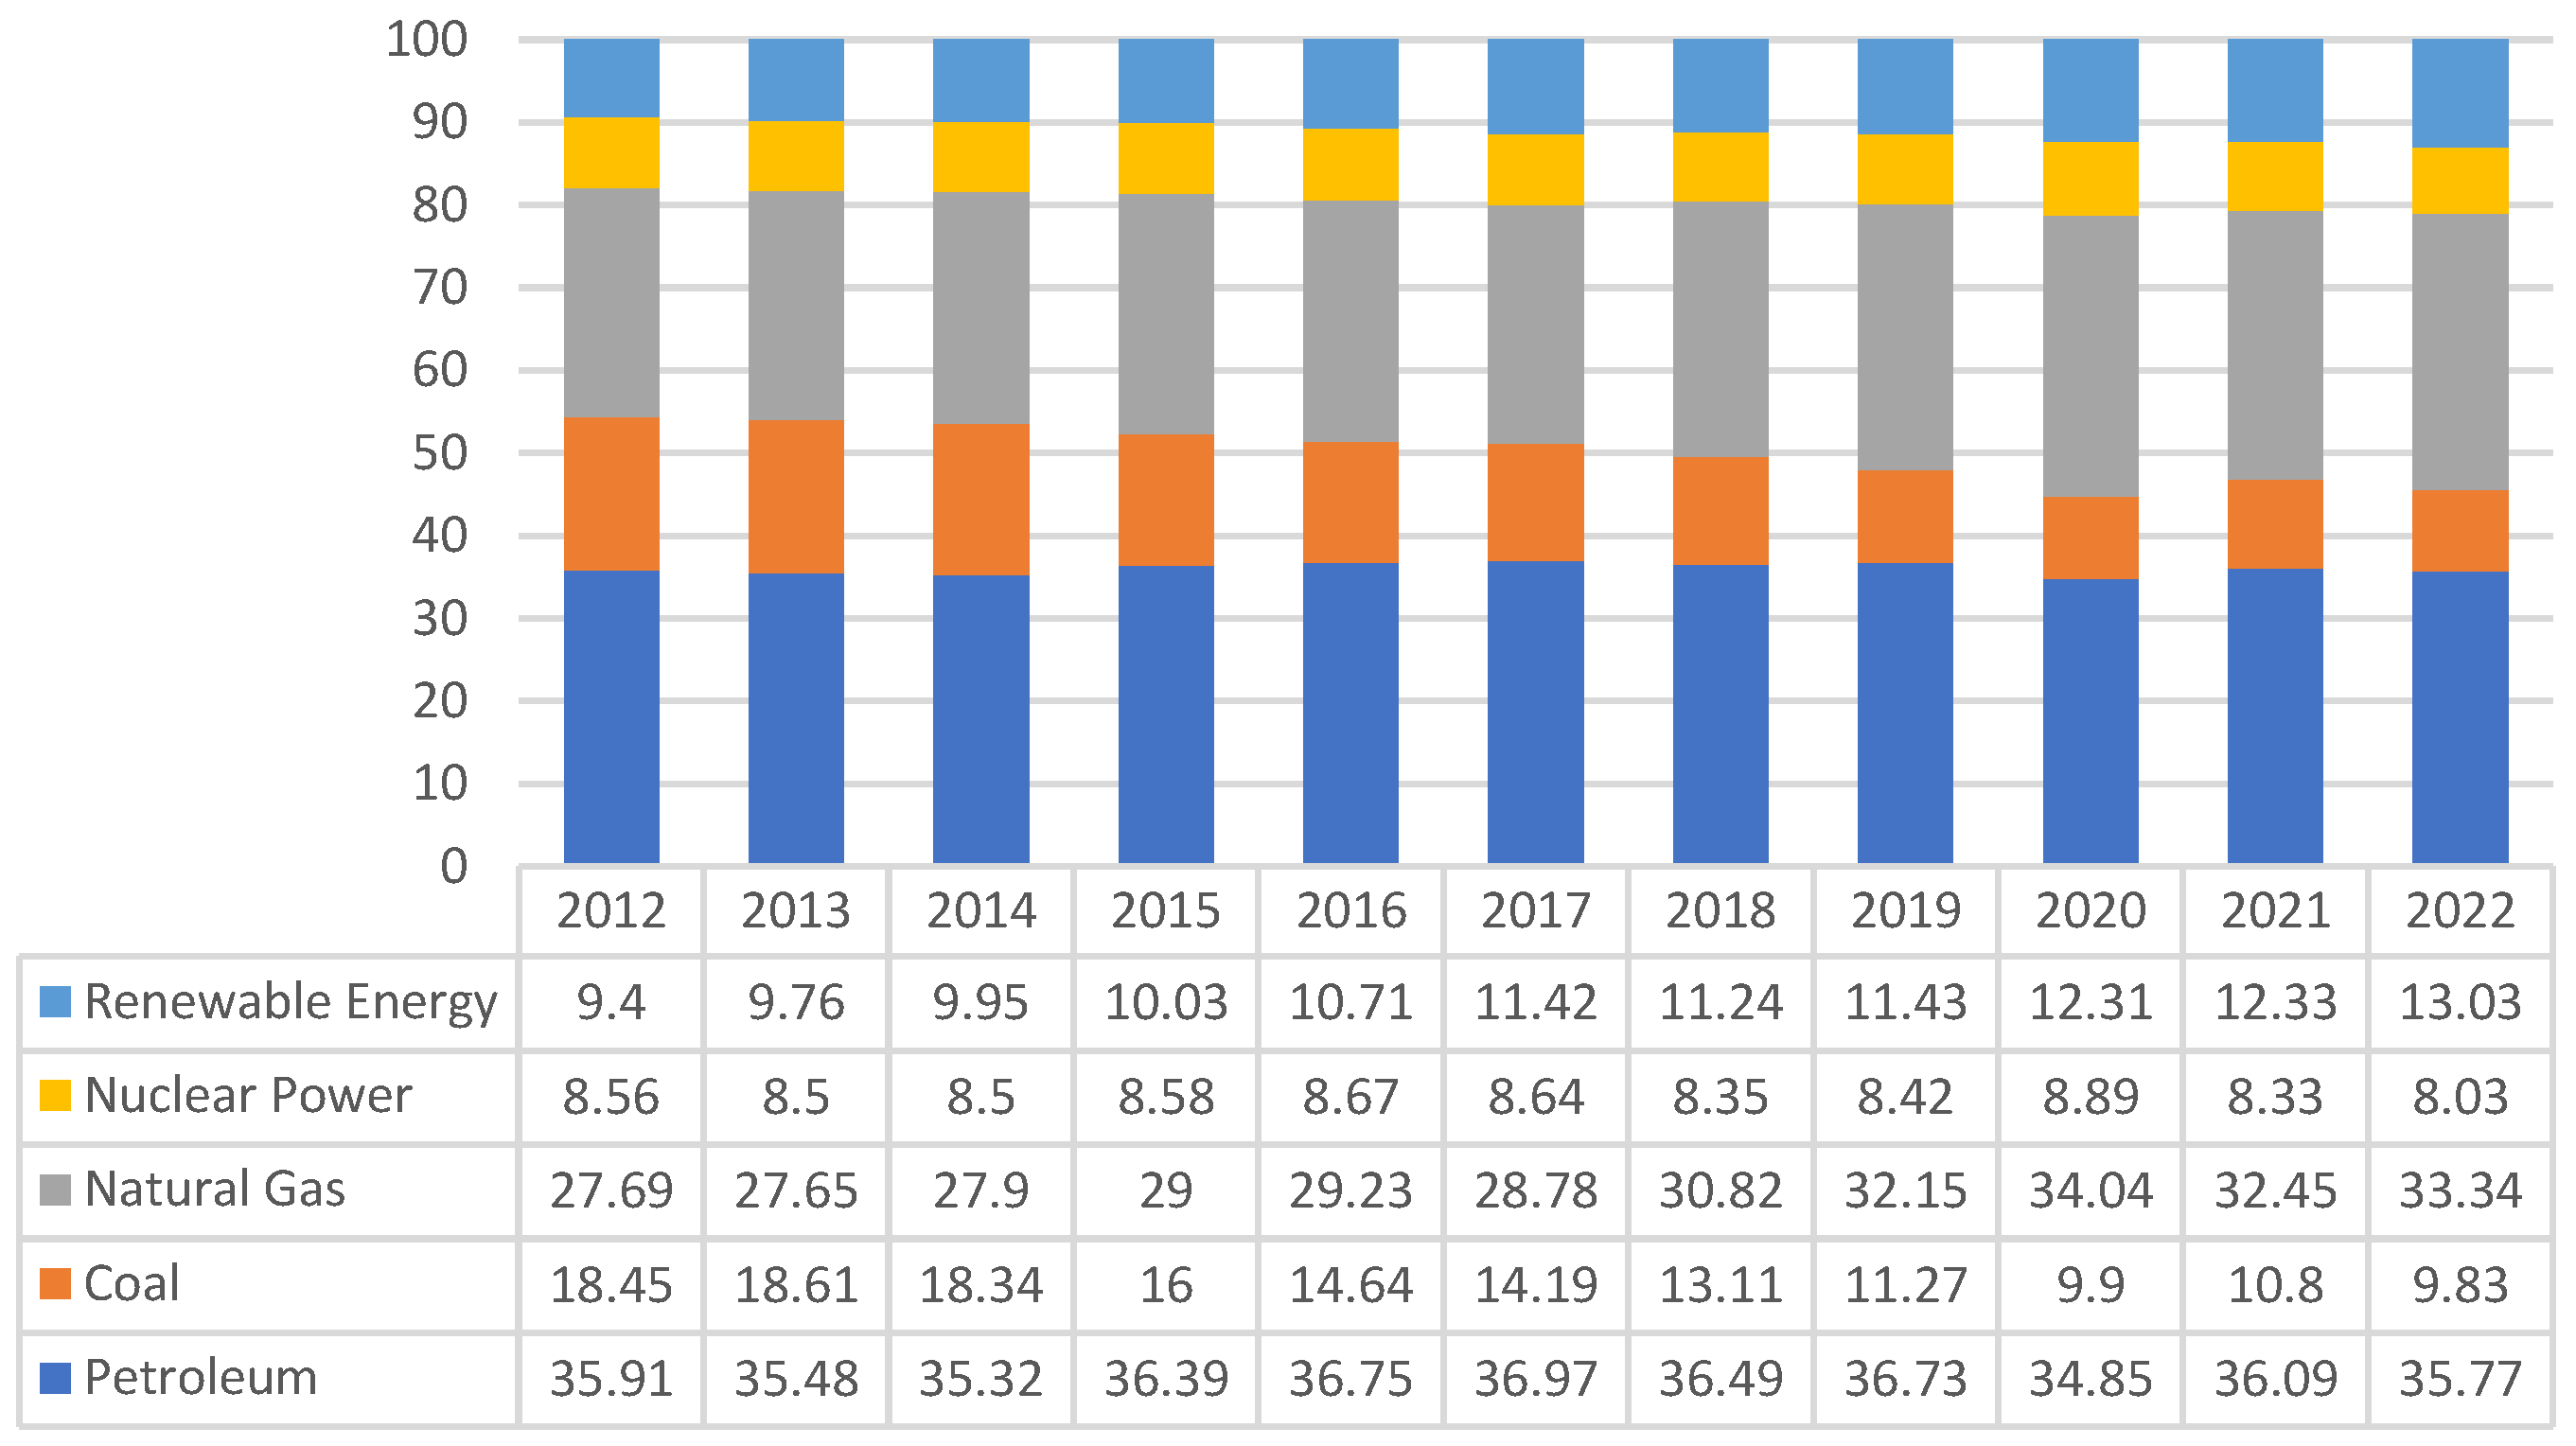
Figure 6.
UK’s carbon dioxide emissions from energy, 2012 to 2022 (MtCO2e).
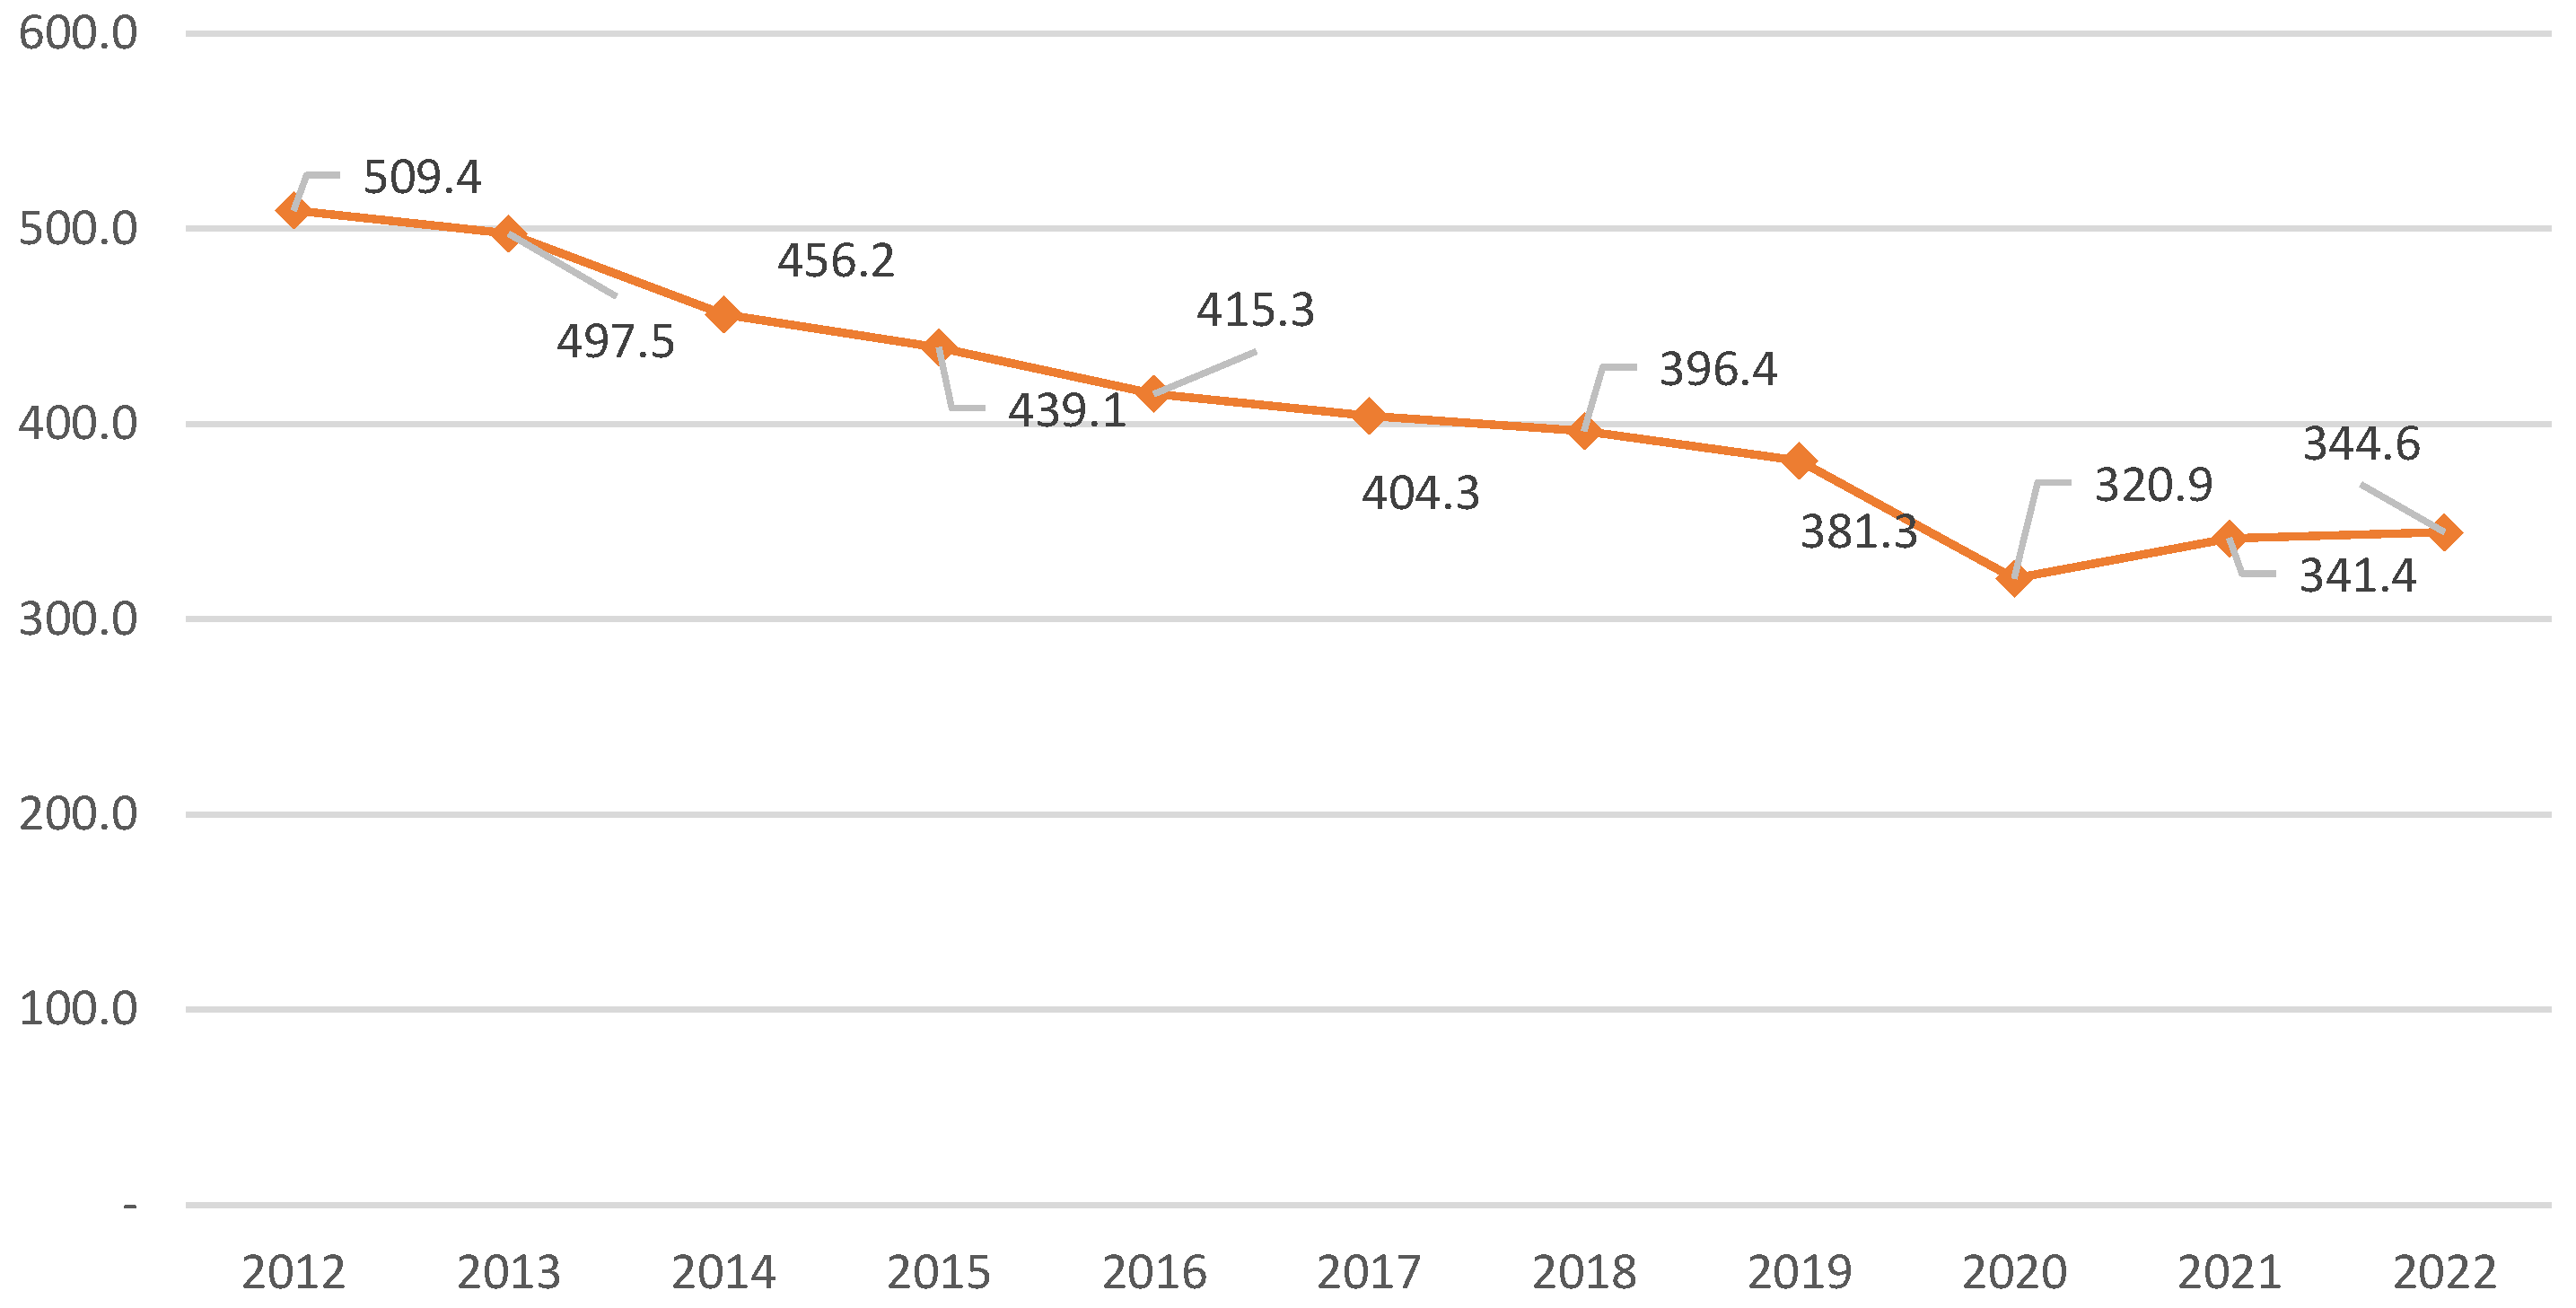
Figure 7.
UK’s energy consumption structure from 2012 to 2022 (%).
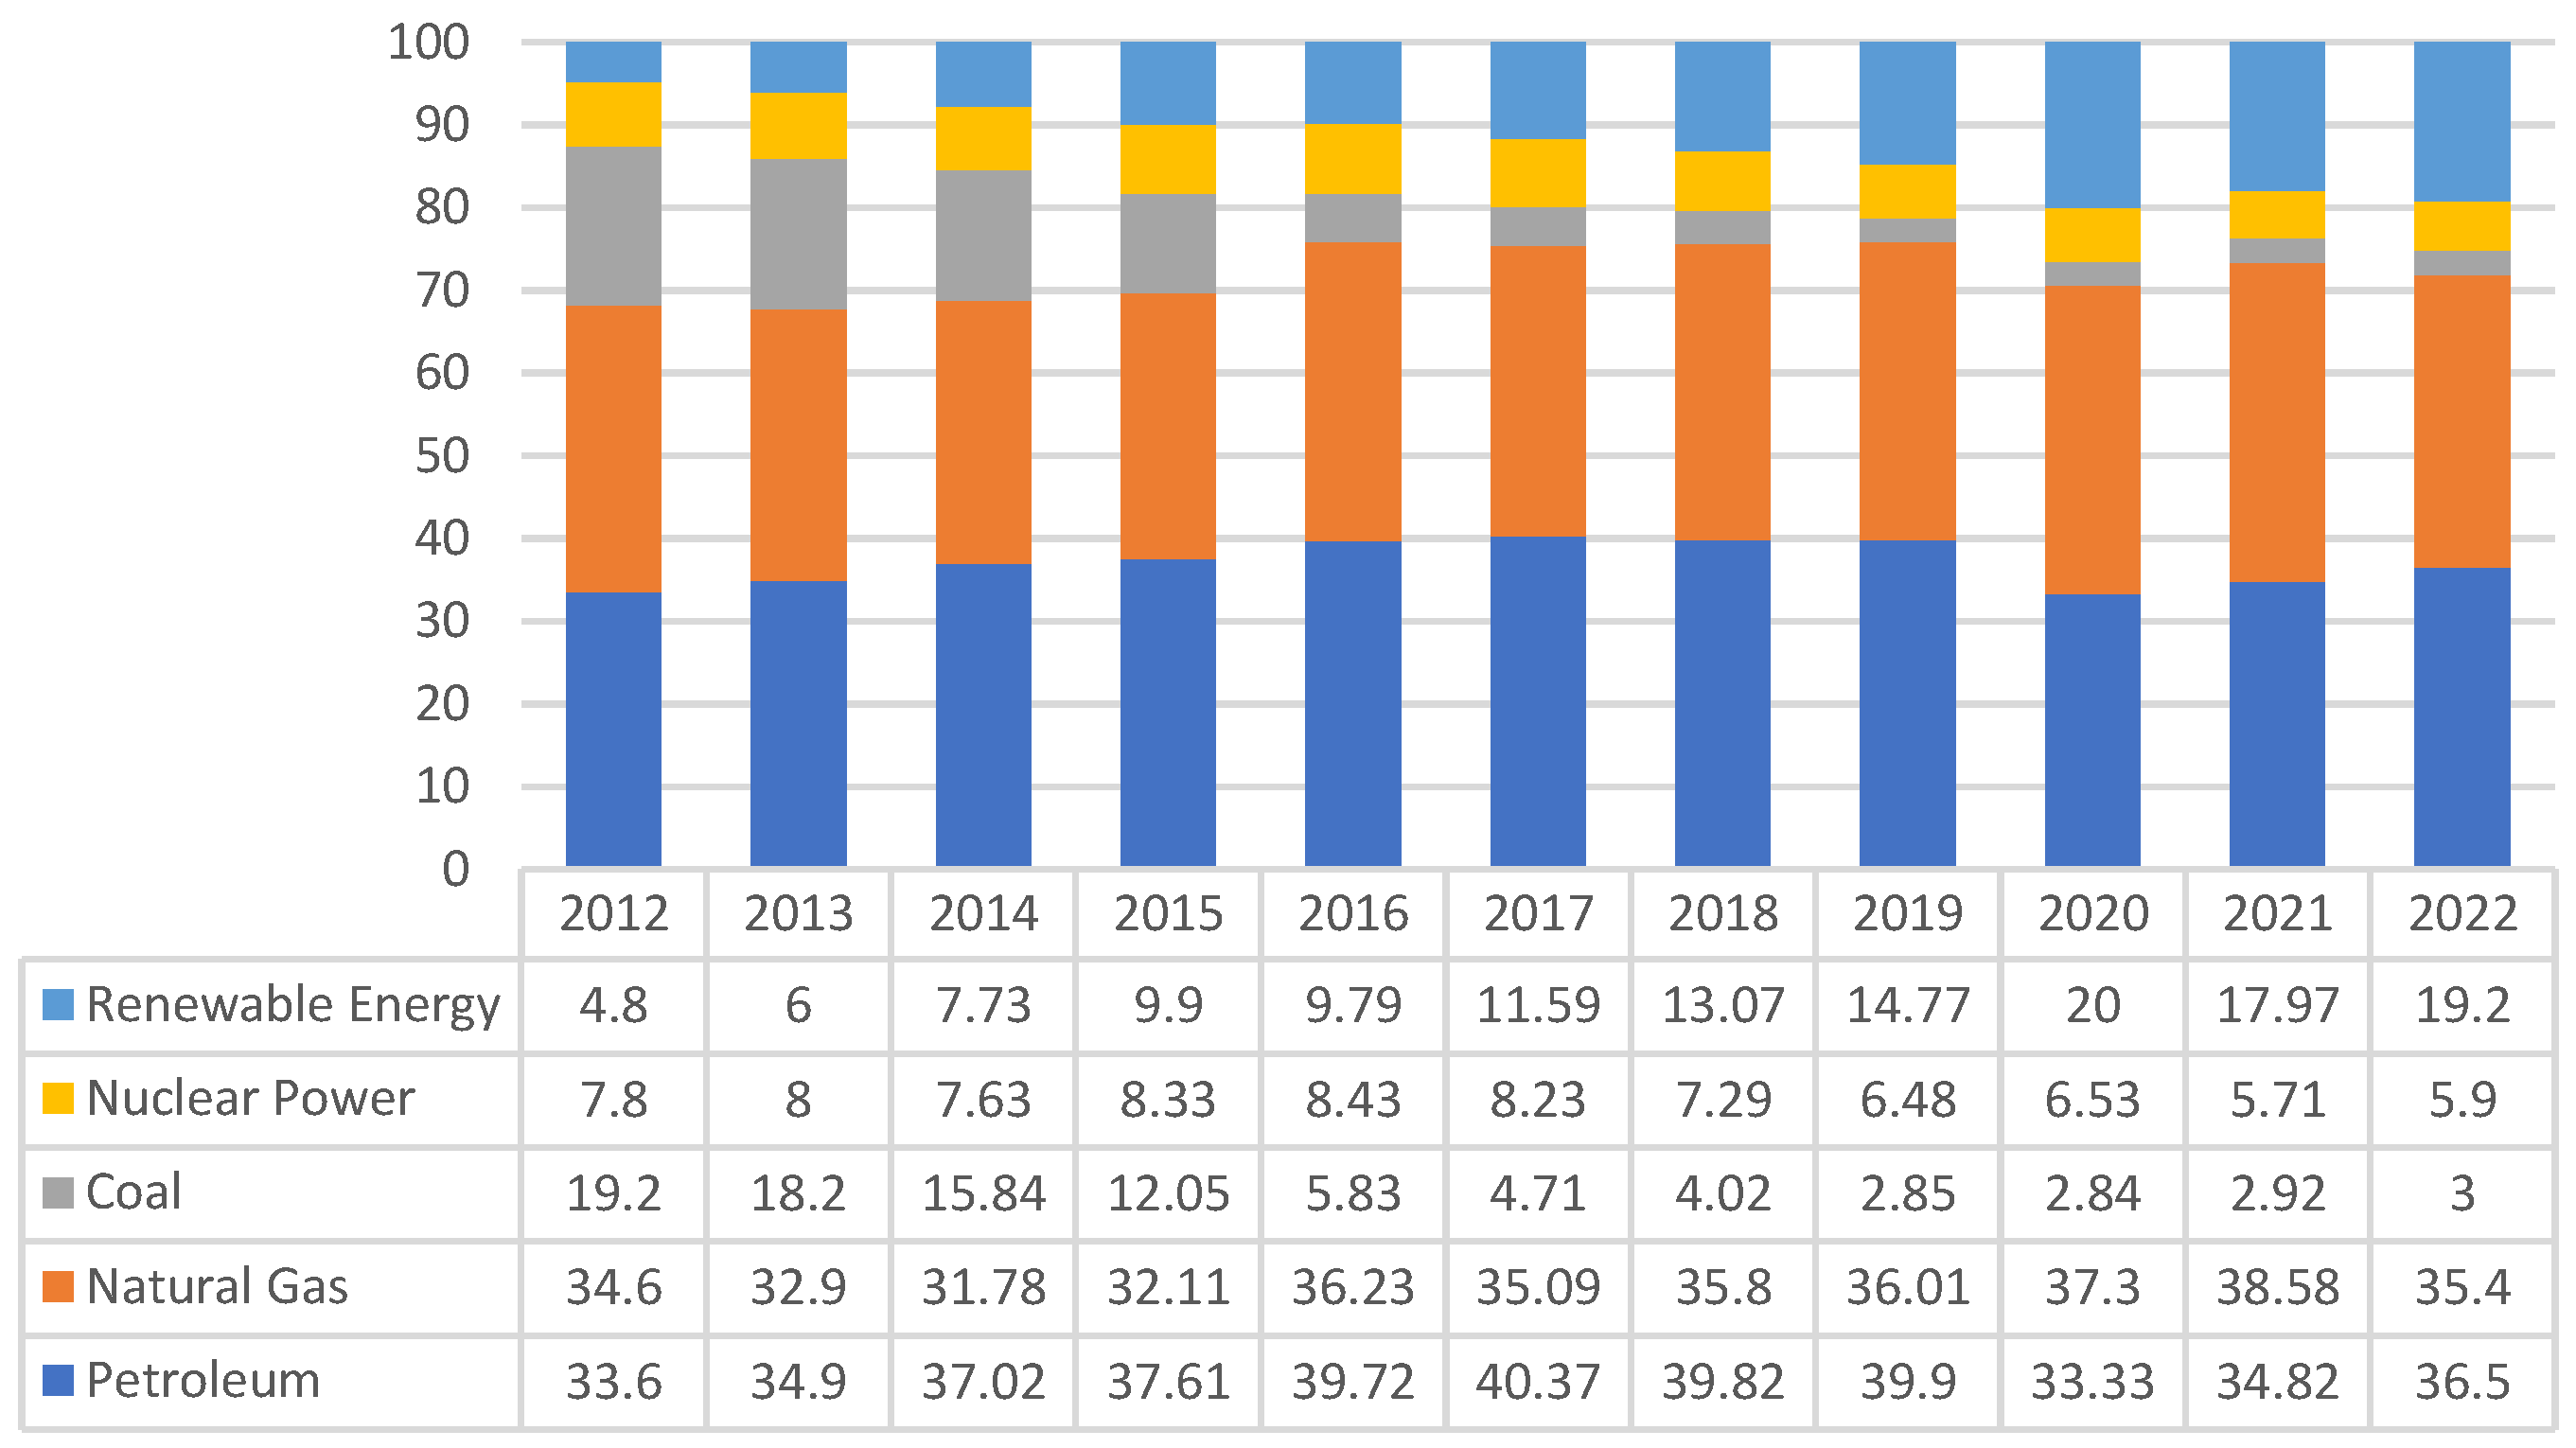
Figure 8.
Japan’s carbon dioxide emissions from energy, 2012 to 2022 (MtCO2e).
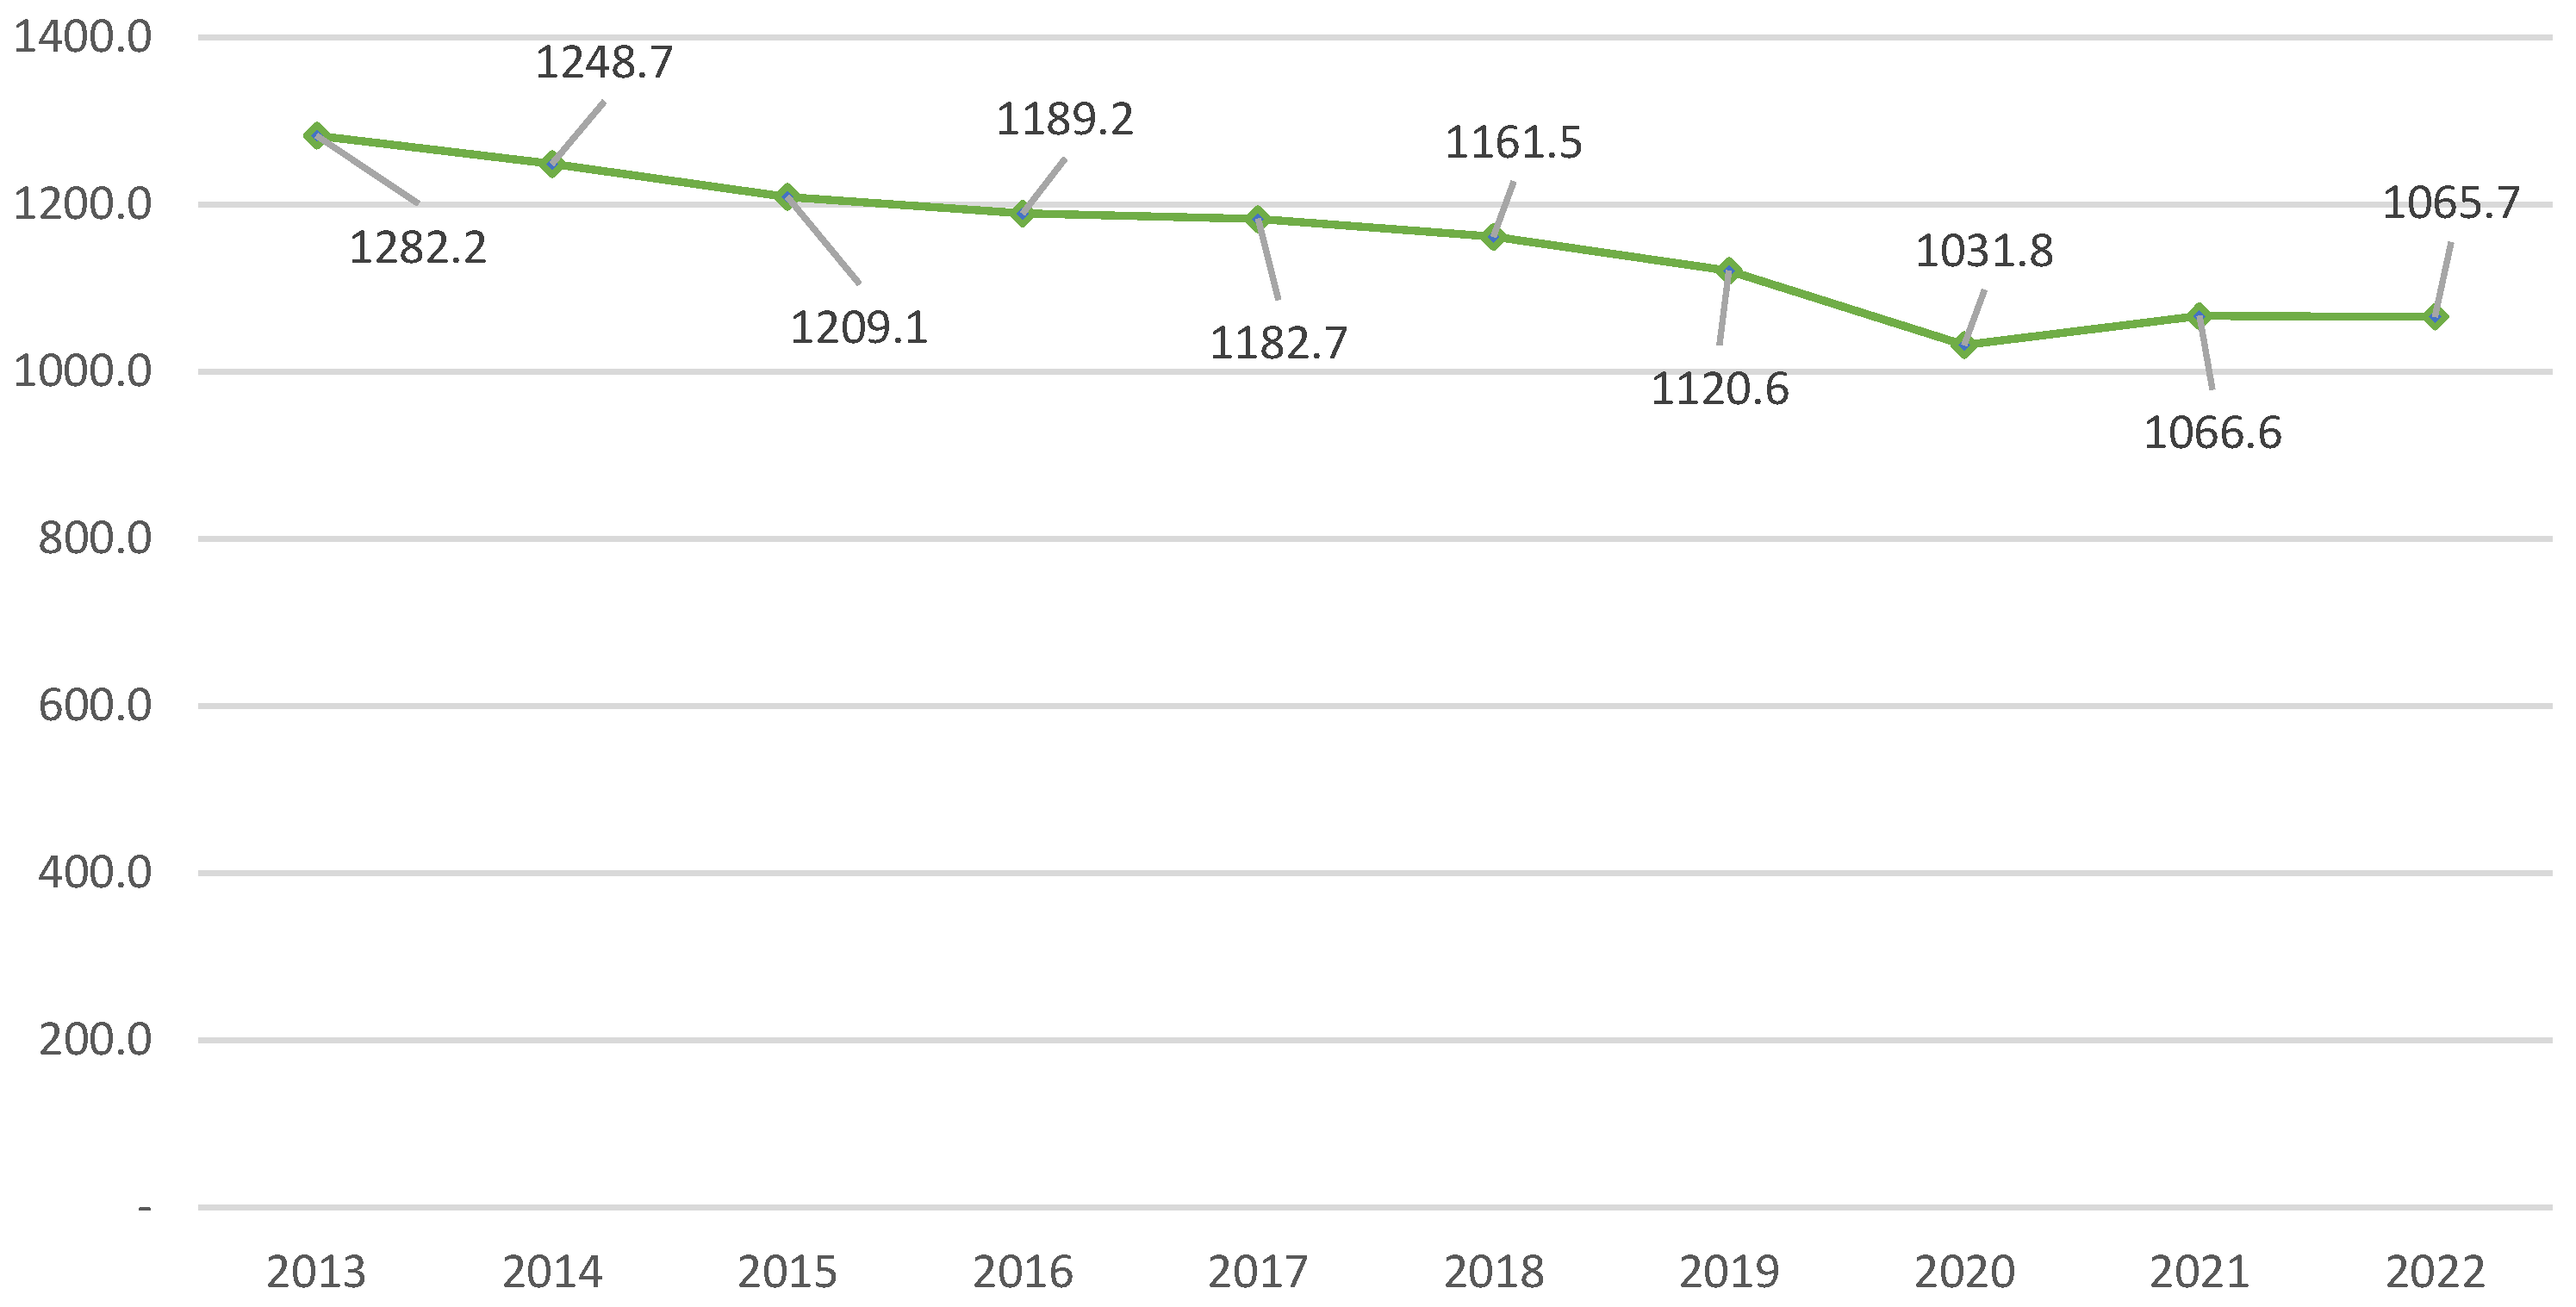
Figure 9.
Japan’s energy consumption structure from 2012 to 2022 (%).
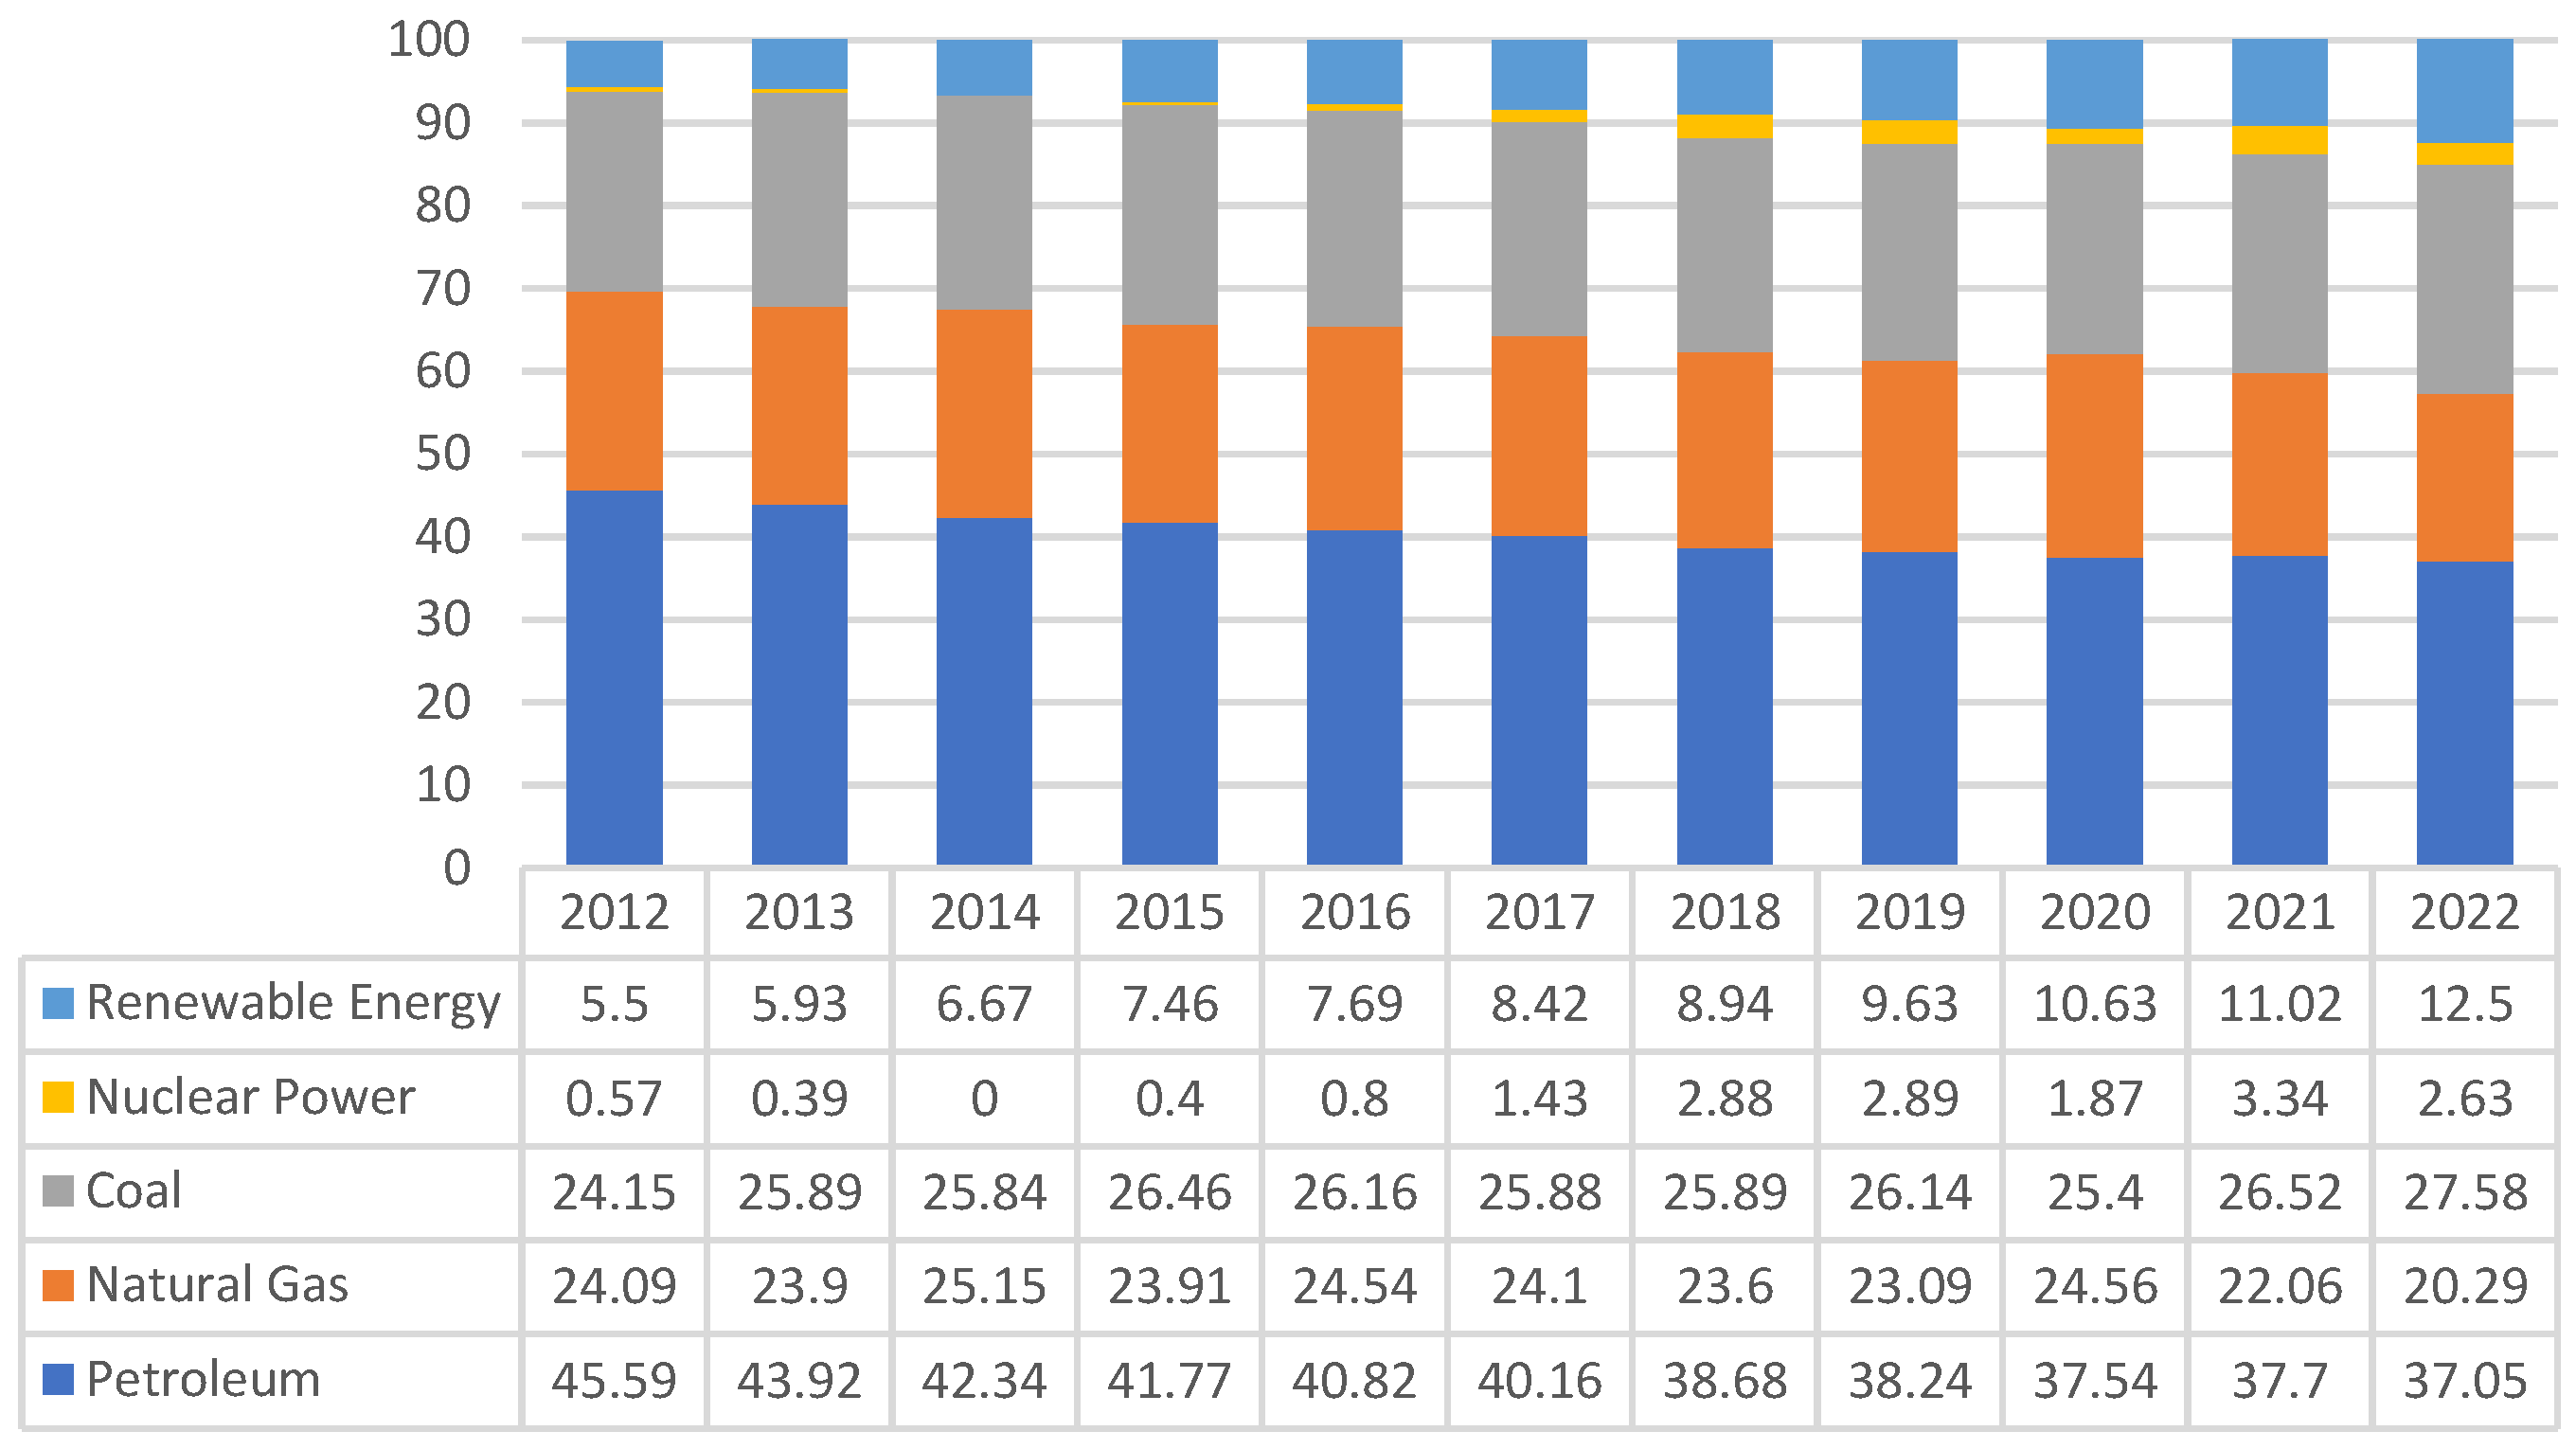
Figure 10.
Germany’s carbon dioxide emissions from energy, 2012 to 2022 (MtCO2e).
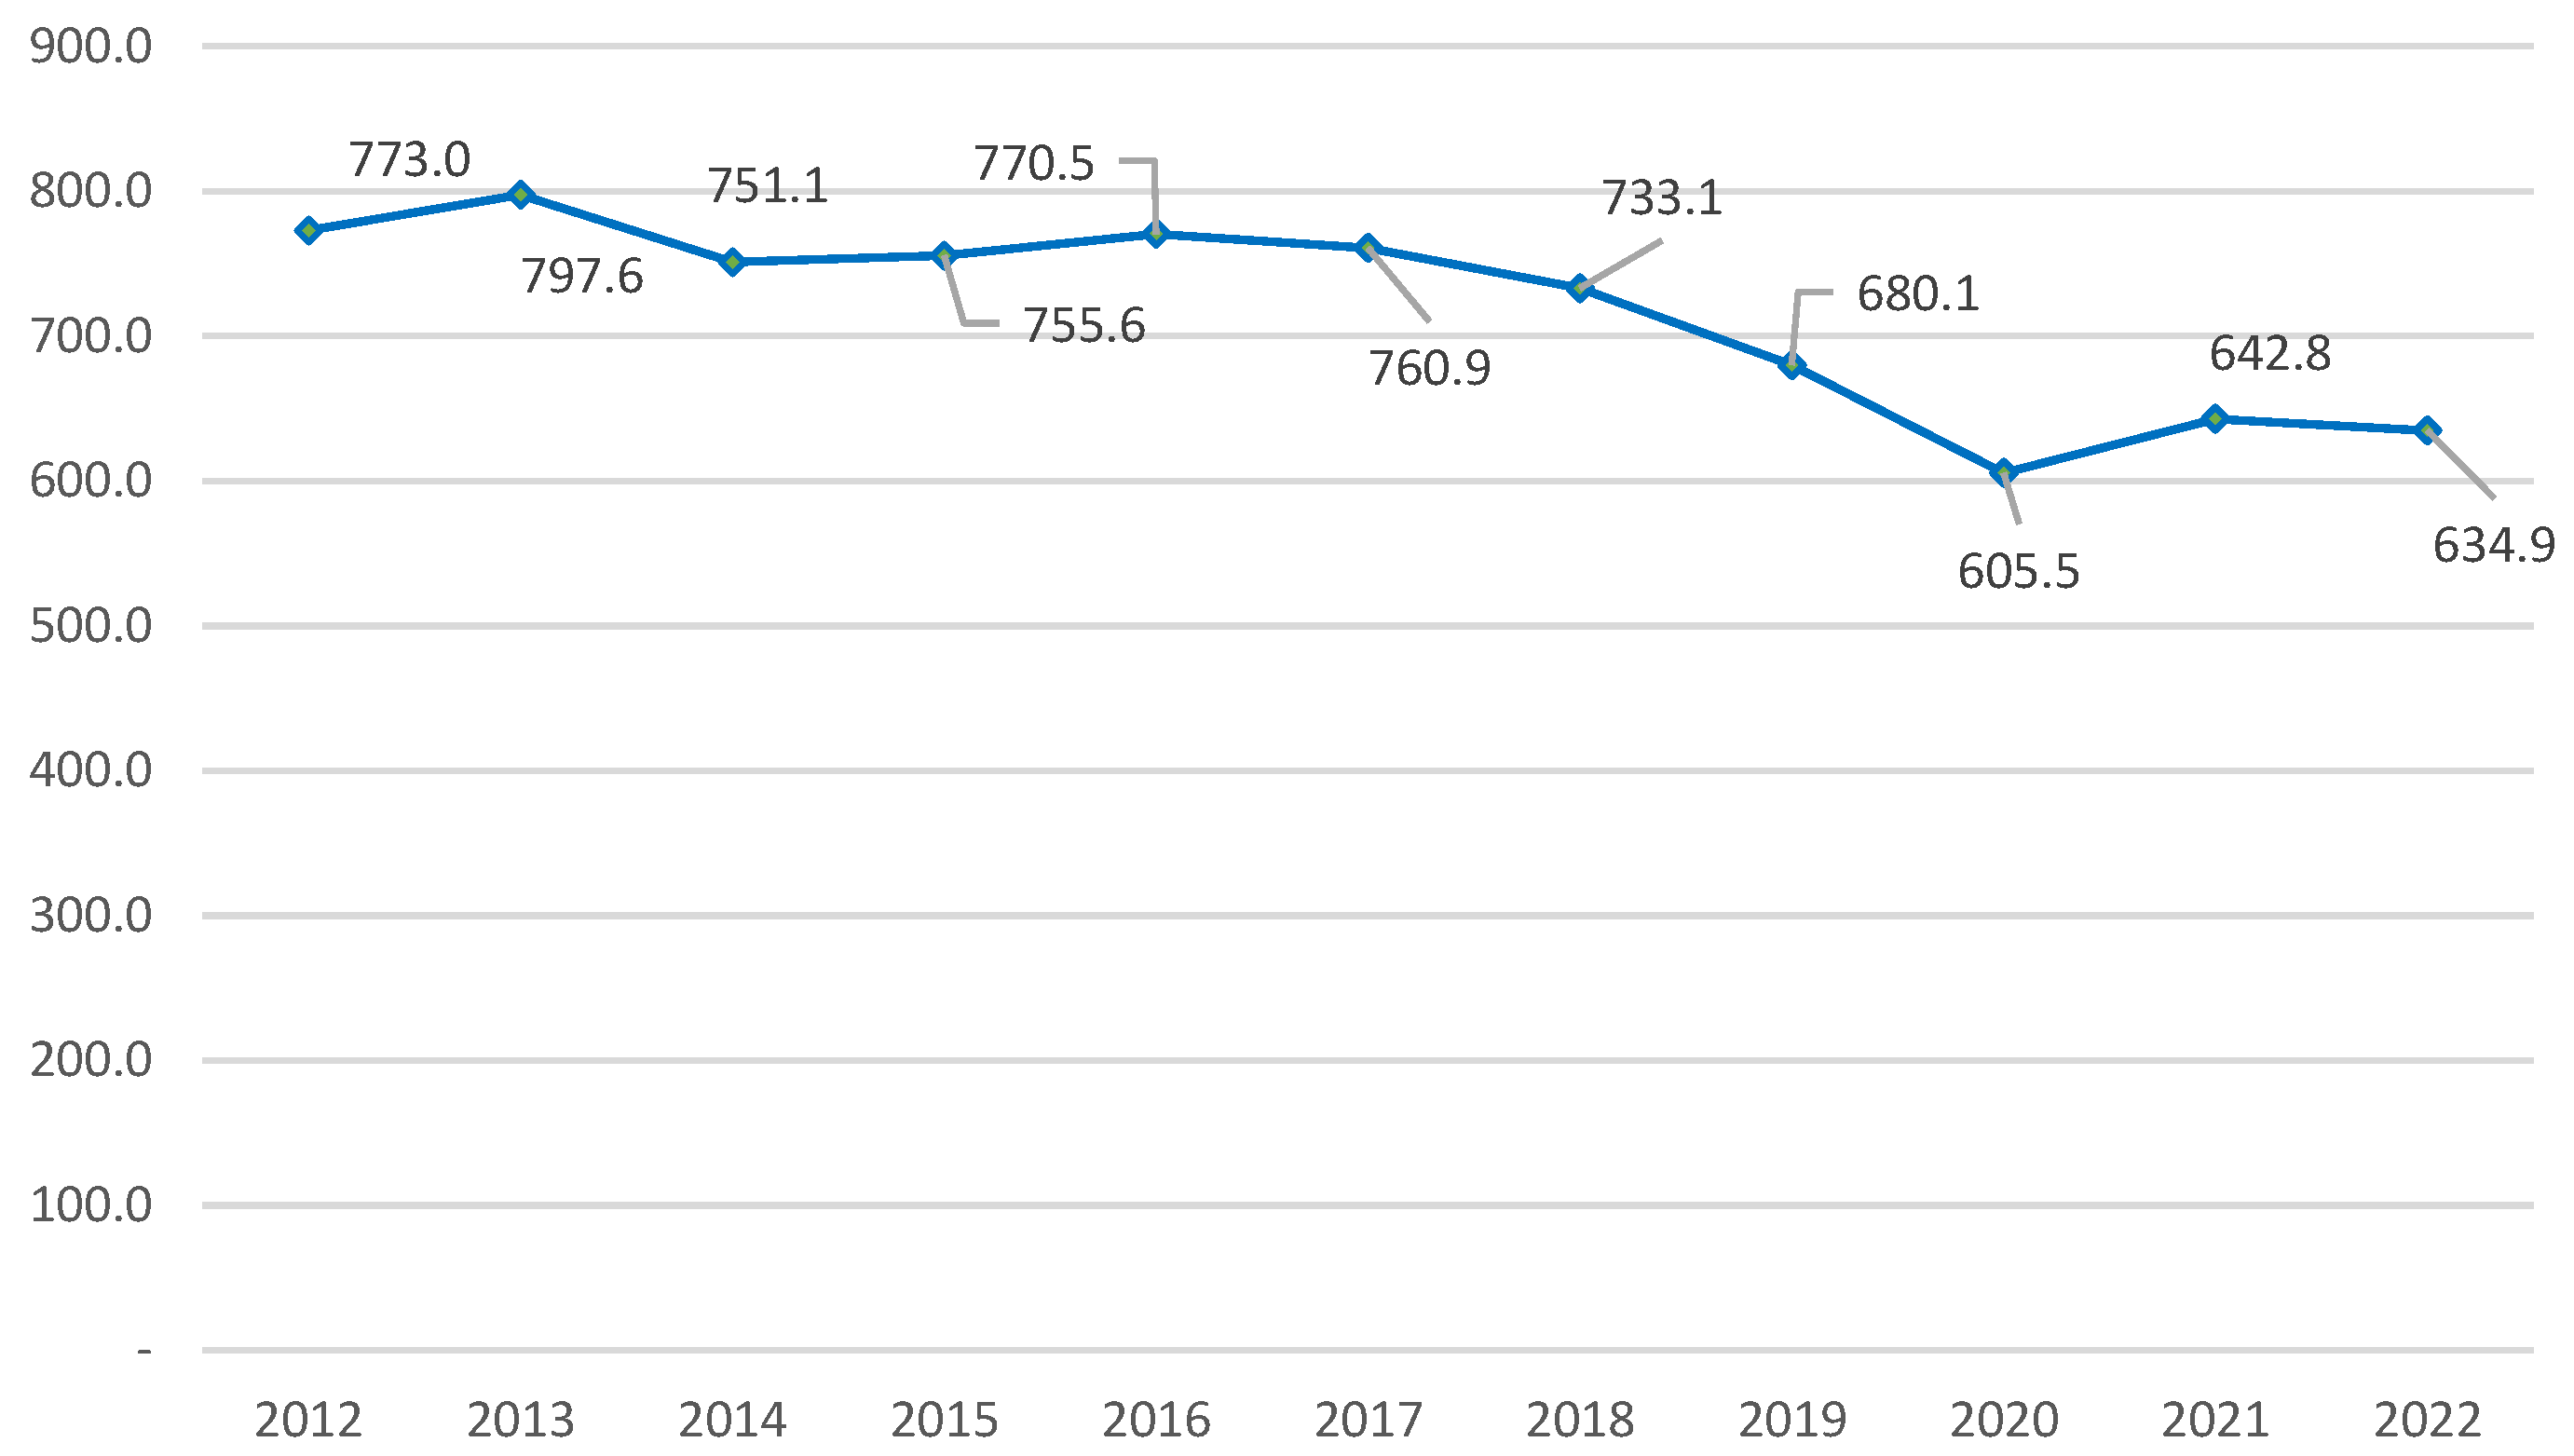
Figure 11.
Germany’s energy consumption structure from 2012 to 2022 (%).
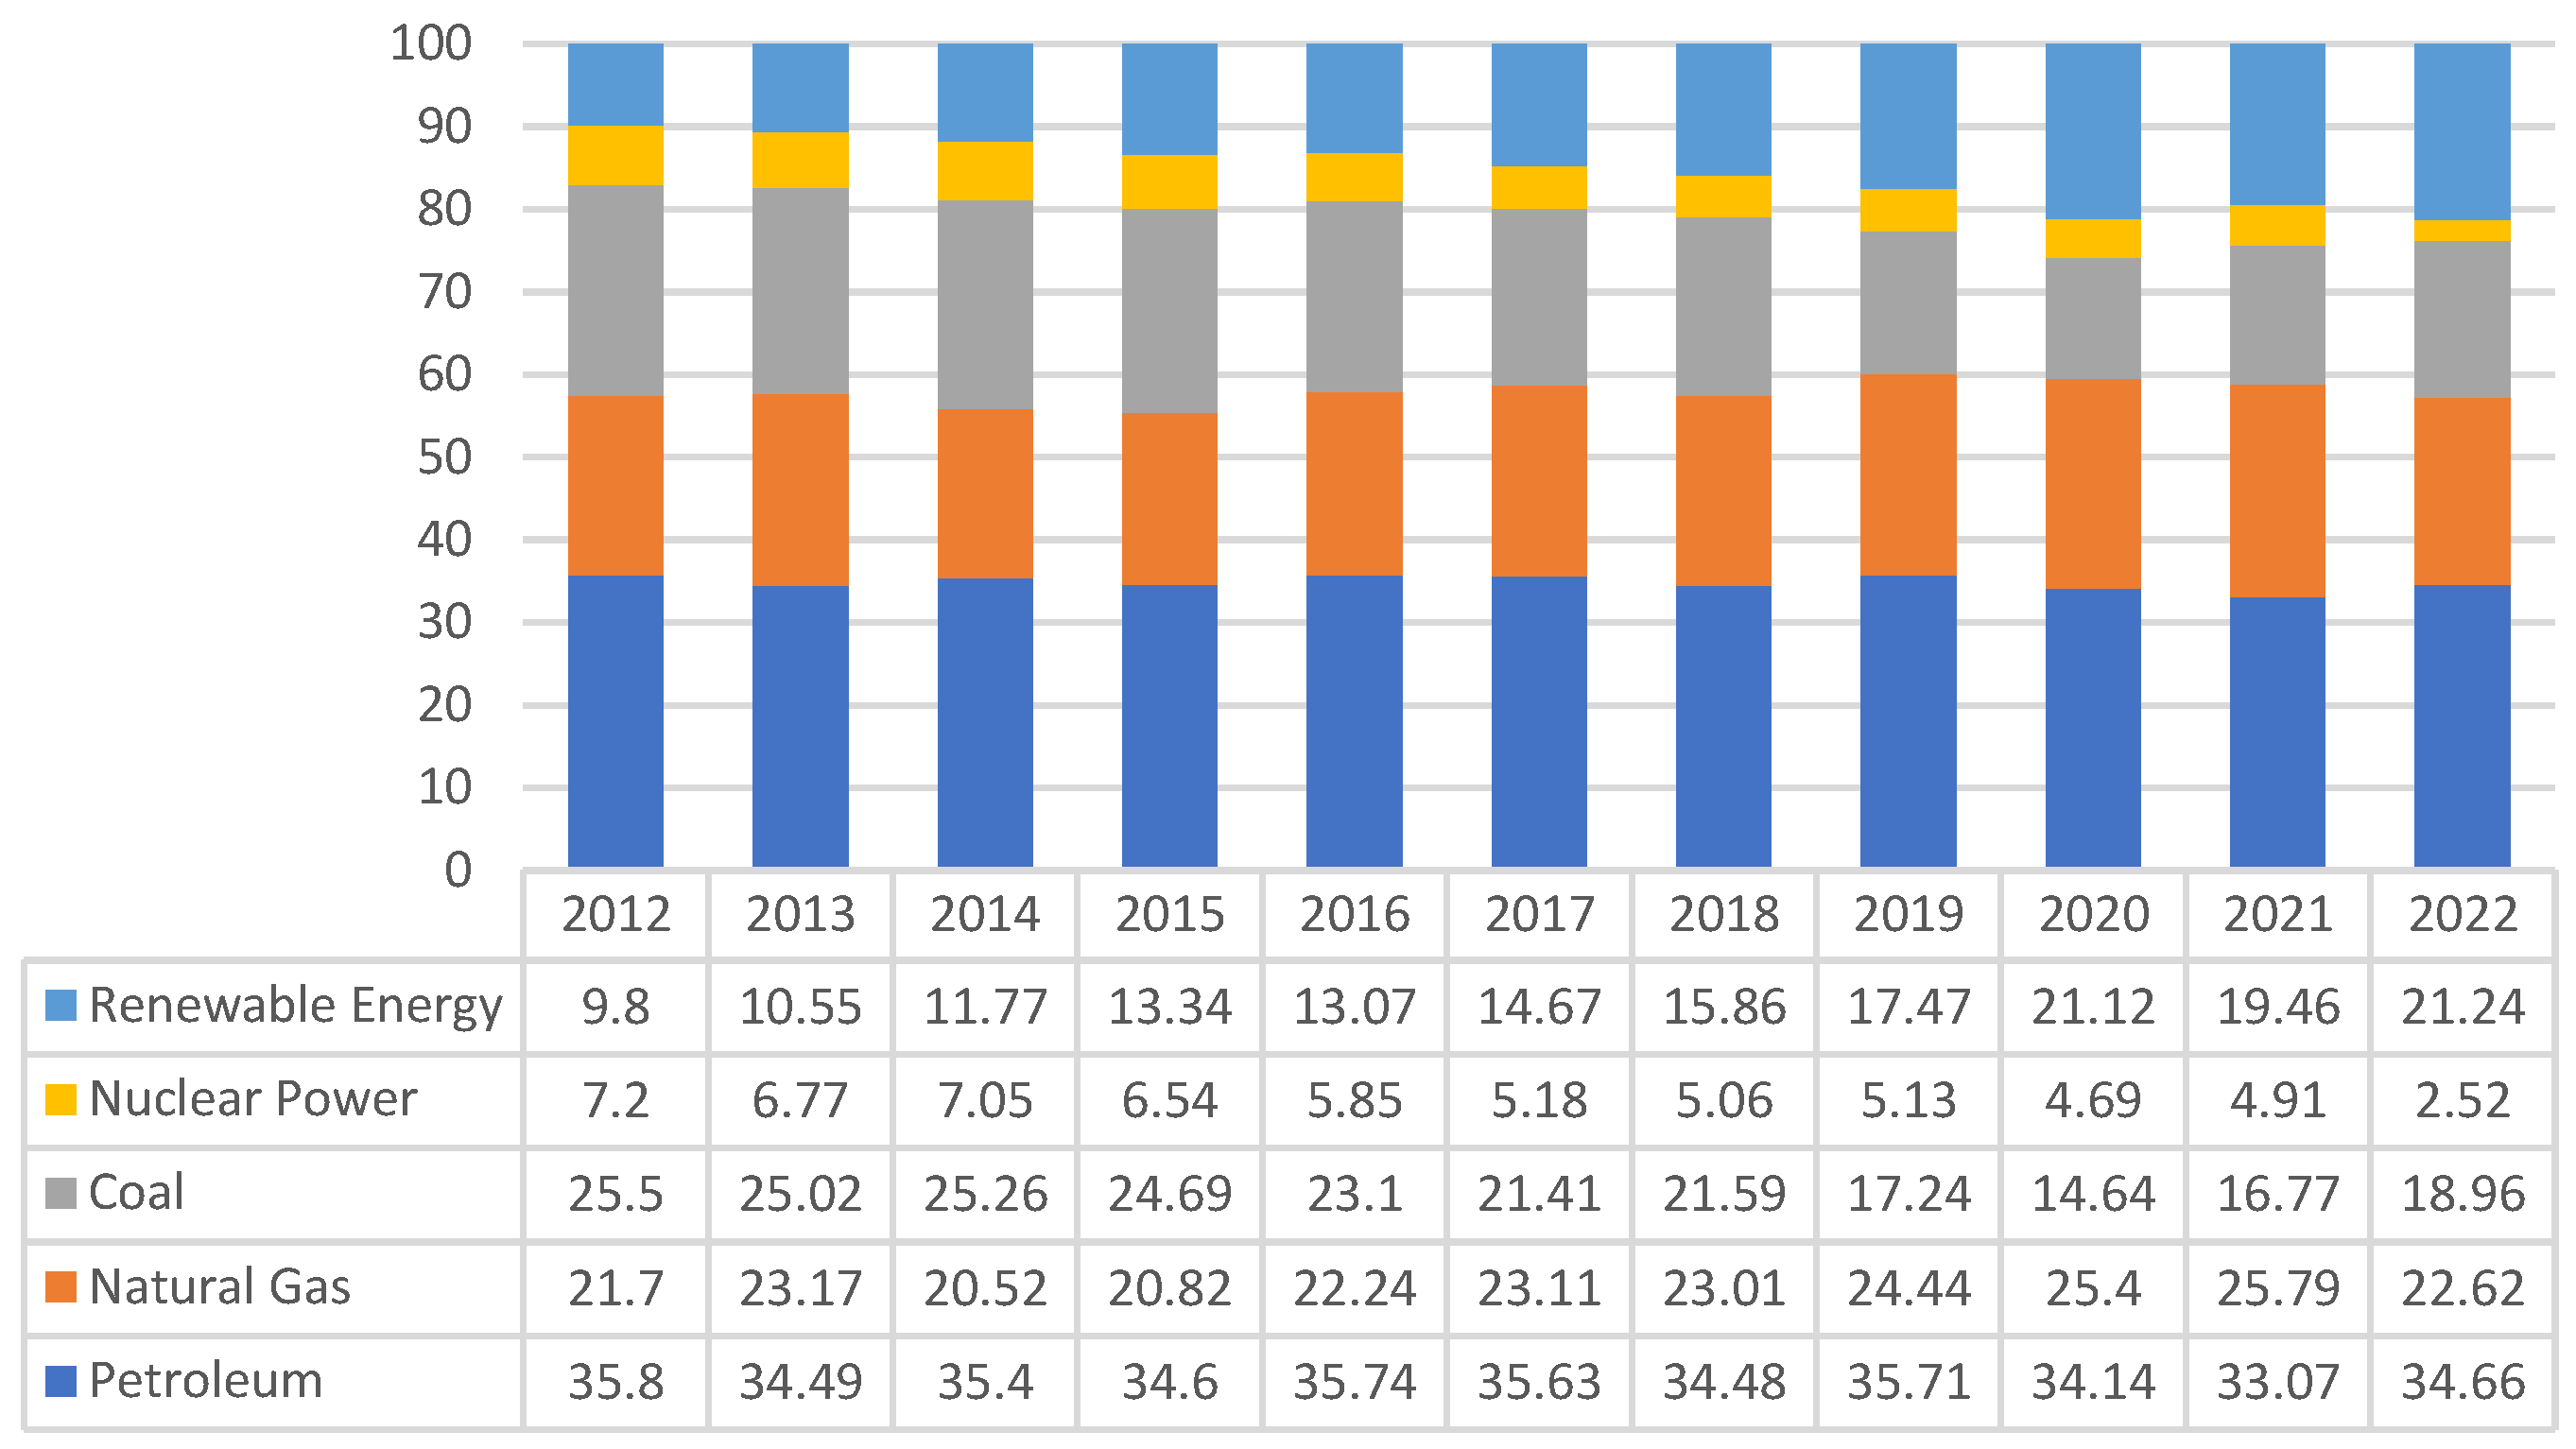
Figure 12.
France’s carbon dioxide emissions from energy, 2012 to 2022 (MtCO2e).
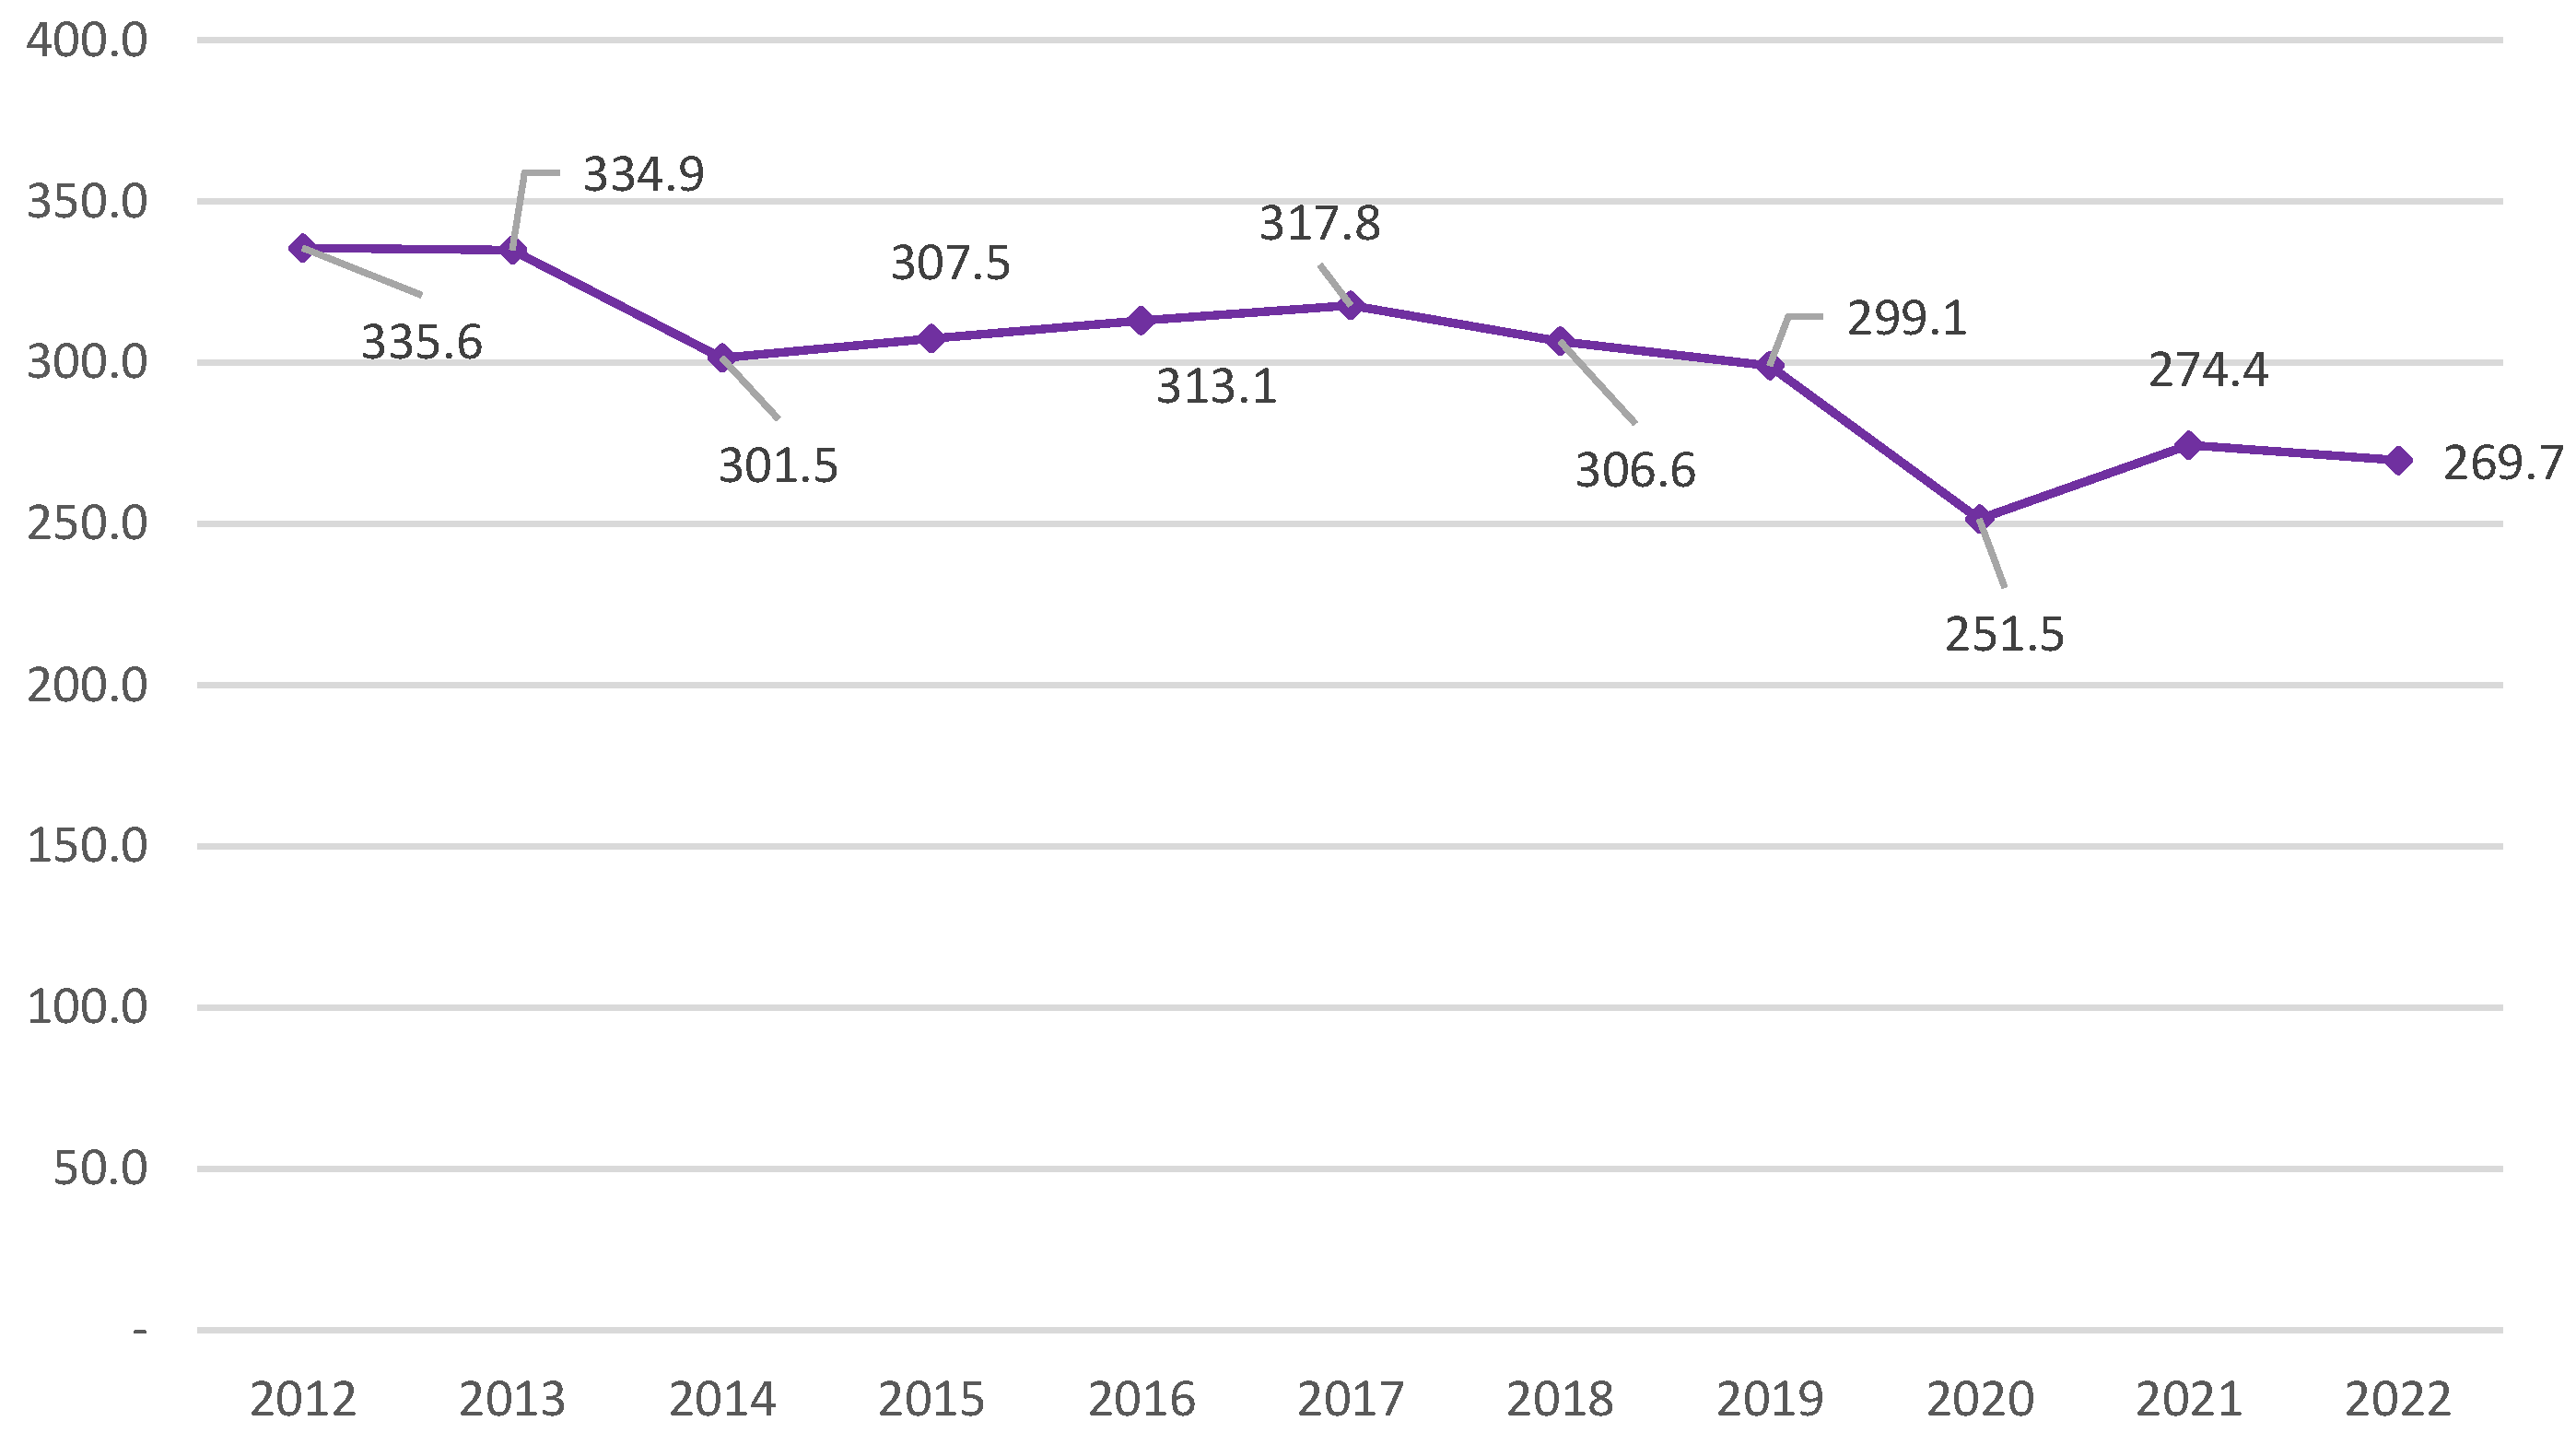
Figure 13.
France’s energy consumption structure from 2012 to 2022 (%).
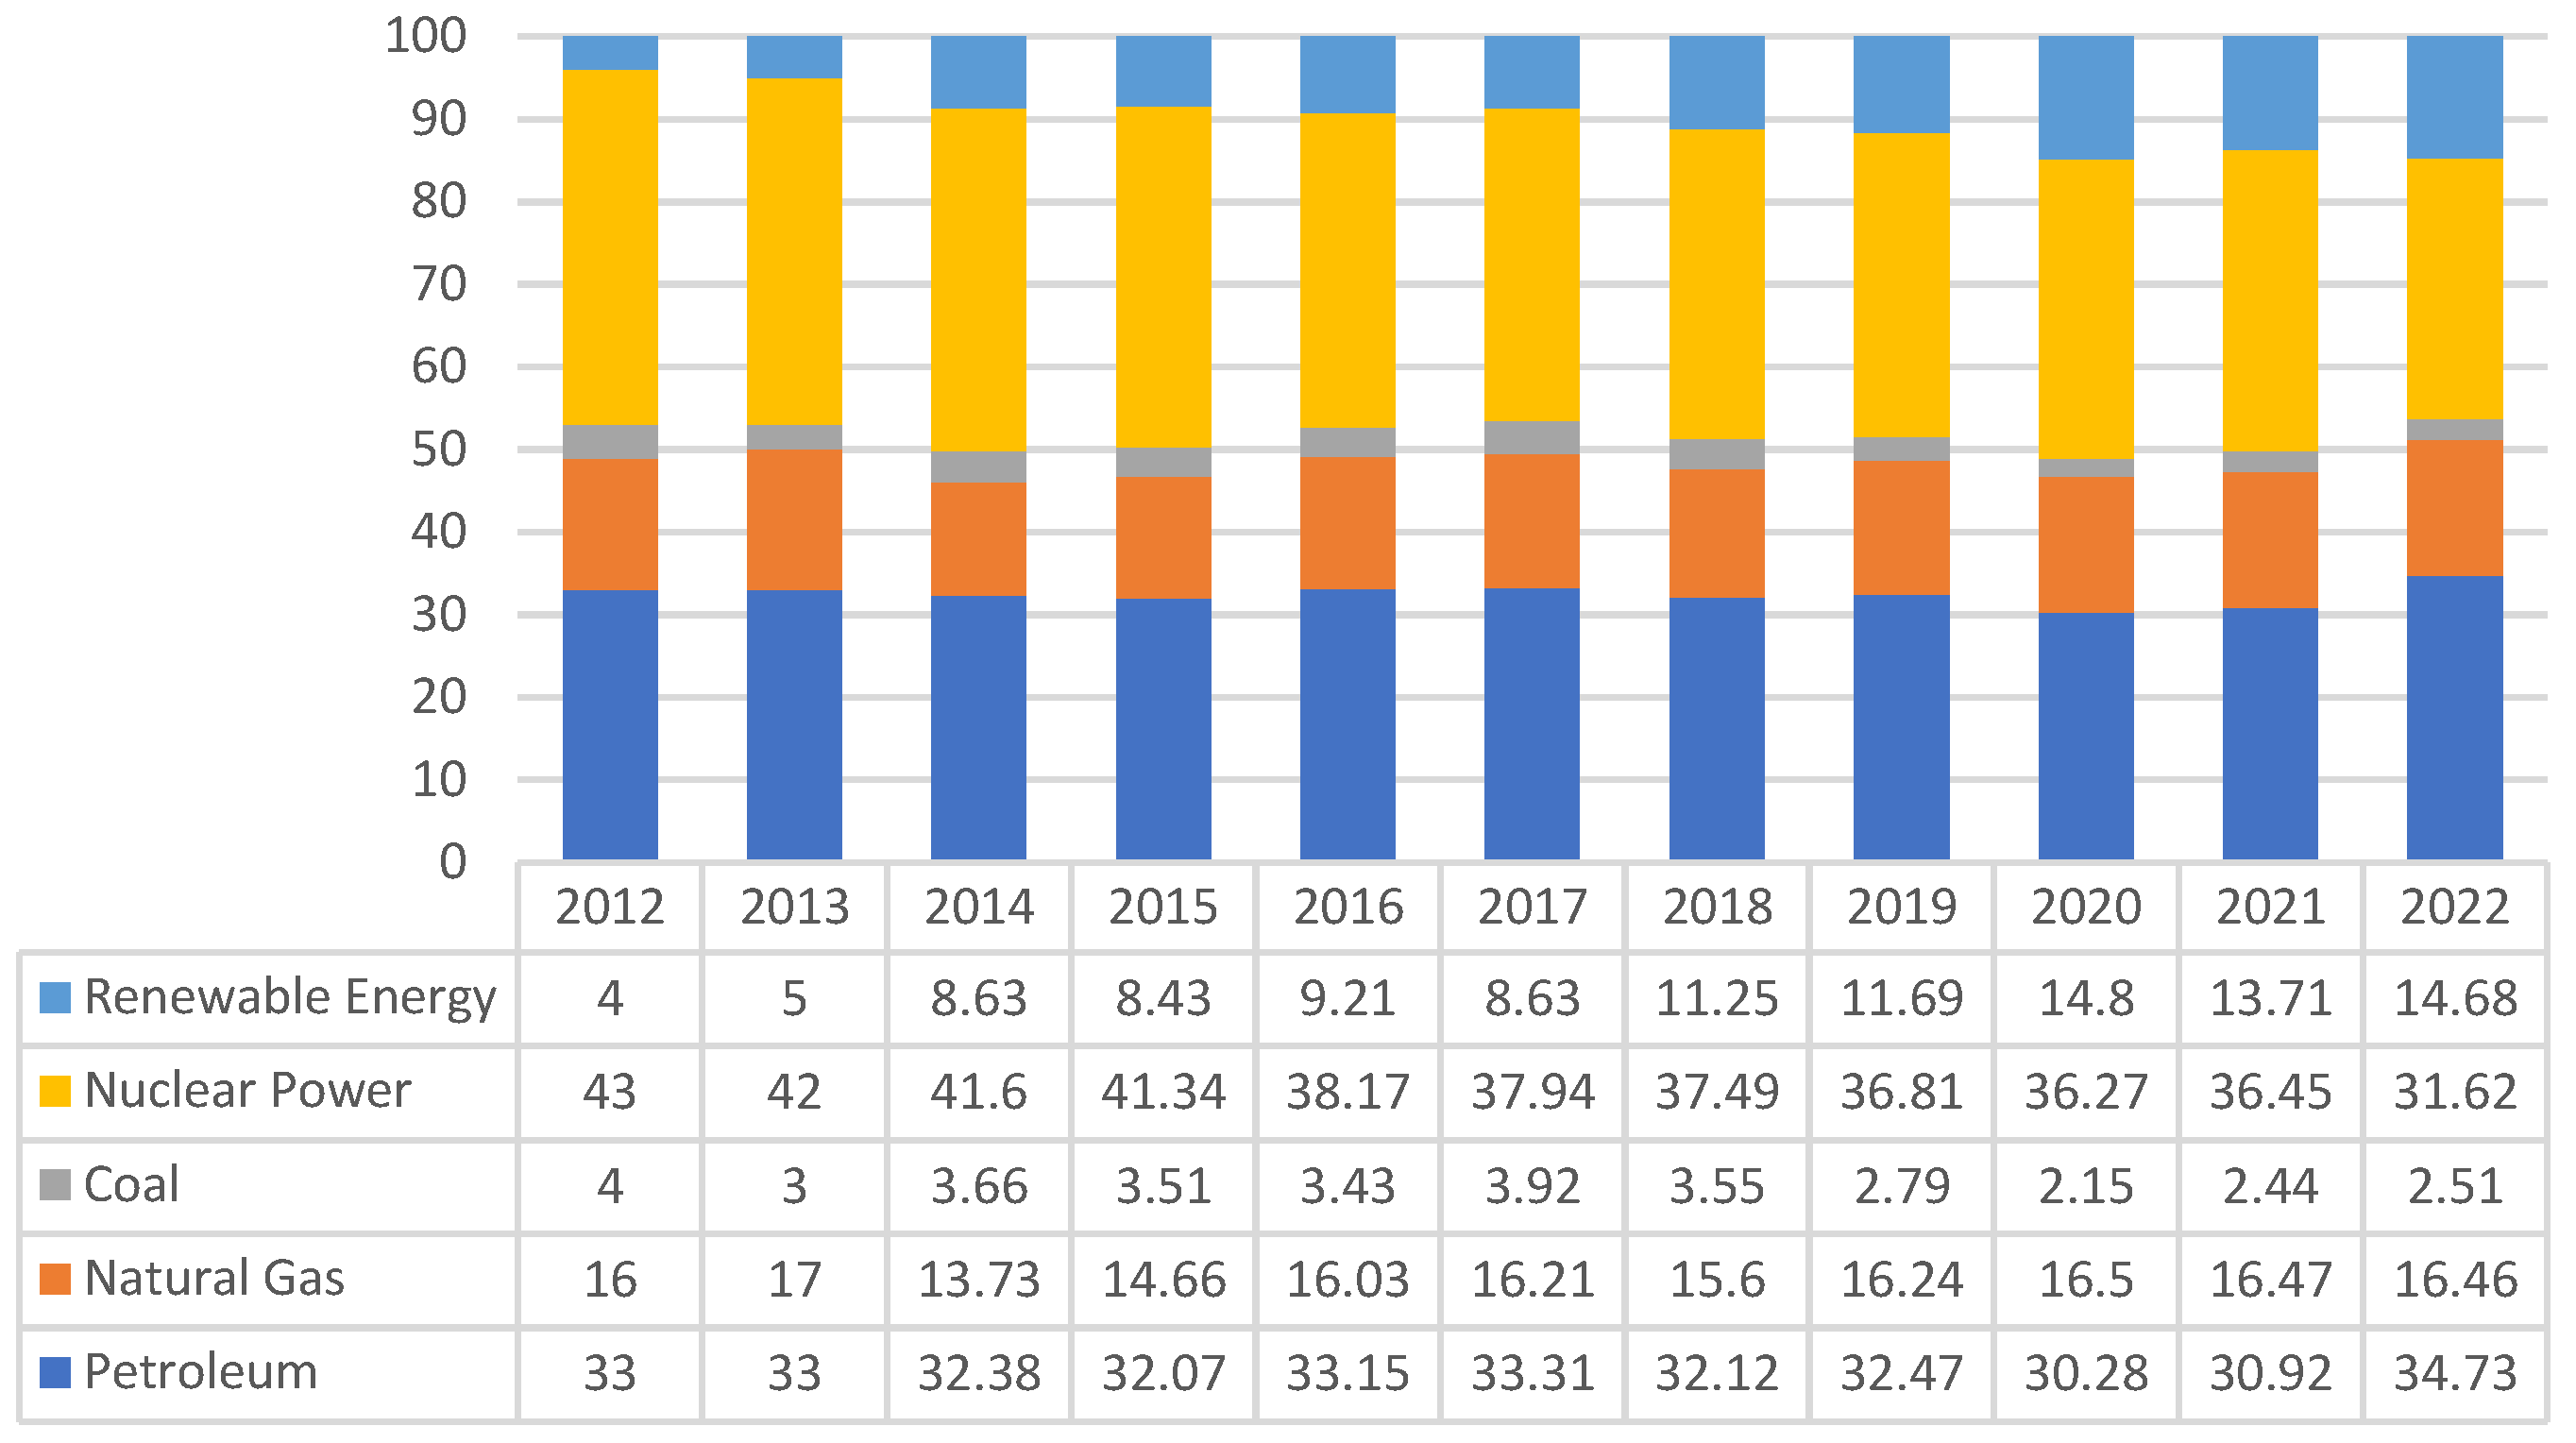

Table 1.
Basic overview of foreign legislation on climate change.
| Country | Legislation | Date of Enactment |
|---|---|---|
| South Africa | South African Climate Change Bill | 2023 |
| South Kora | Framework act on carbon neutrality and green growth with climate crisis | 2021 |
| Europe | "European Climate Law (Draft for Public Consultation)" | 2020 |
| Denmark | Danish Climate Bill | 2019 |
| German | German Federal Climate Protection Act | 2019 |
| Japan | Climate Change Adaptation Act | 2018 |
| France | French Green Growth and Energy Transition Law | 2015 |
| Finland | Ilmastolaki (Climate Act) | 2015 |
| Mexico | General Law on Climate Change | 2012 |
| European Union | European Green Deal | 2009 |
| South Korea | Framework Act on Low Carbon Green Growth | 2009 |
| Philippines | Climate Change Act of 2009 (Republic Act No. 9729 of 2009) | 2009 |
| United Kingdom | Climate Change Act 2008 | 2008 |
| New Zealand | New Zealand Climate Change Response Act 2002 | 2002 |
| Swiss Confederation | Swiss Federal Carbon Dioxide Reduction Act | 2000 |
| Japan | Act on Promotion of Global Warming Countermeasures | 2001 |
Table 2.
Carbon emission reduction ratios of the five countries from 2019 to 2022.
| Country | CO2 emissions | Carbon emission reduction ratio | |
|---|---|---|---|
| In 2019 | In 2022 | ||
| U.S. | 4981.6 | 4825.8 | 3.13 |
| U.K. | 381.3 | 344.6 | 9.62 |
| Japan | 1120.6 | 1065.7 | 4.90 |
| Germany | 680.1 | 634.9 | 6.65 |
| France | 299.1 | 269.7 | 9.83 |
| World | 34044.0 | 34374.1 | 0.97 |
1 Data Sources: 2023 Statistical Review of World Energy. 2 The formula for calculating the carbon emission reduction ratio is as follows: Carbon Emission Reduction Ratio = [(CO2 emissions in 2022 - CO2 emissions in 2019) / CO2 emissions in 2019] × 100%.
Disclaimer/Publisher’s Note: The statements, opinions and data contained in all publications are solely those of the individual author(s) and contributor(s) and not of MDPI and/or the editor(s). MDPI and/or the editor(s) disclaim responsibility for any injury to people or property resulting from any ideas, methods, instructions or products referred to in the content. |
© 2024 by the authors. Licensee MDPI, Basel, Switzerland. This article is an open access article distributed under the terms and conditions of the Creative Commons Attribution (CC BY) license (http://creativecommons.org/licenses/by/4.0/).
Copyright: This open access article is published under a Creative Commons CC BY 4.0 license, which permit the free download, distribution, and reuse, provided that the author and preprint are cited in any reuse.


