Submitted:
07 May 2024
Posted:
07 May 2024
You are already at the latest version
Abstract
The popular appreciation of dry white wines is most frequently directed to young wines. However, present consumption trends comprise the valorisation of aged dry white wines. Therefore, the present work was aimed at the sensory analysis of these wines with different ages to define their sensory space and to understand which factors drive their quality evaluation by experienced tasters (critics, oenologists and students). Individuals were asked to evaluate several synthetic and aesthetic attributes and to characterise the analytic sensory profile through a Check-All-That-Apply (CATA) methodology. The quality evaluations were differently correlated with wine synthetic parameters according to the taster group. For both critics and oenologists, overall quality scores were driven by persistence and complexity. Moreover, quality was also highly correlated with power for critics and with balance for oenologists. Quality scores were highly correlated with wine browning (absorbance at 420 nm) for critics. The tasting panel showed a homogeneous analytic description of aroma, taste and mouthfeel consistent with wine age. The different ages could be associated to a continuous sensory space characterised by a decreasing perception of freshness and increase in mature and mellowed descriptors. All wines shared an austere in-mouth perception elicited by their acidity, saltiness, bitterness, smoothness and dryness. The age prediction showed that most tasters failed to guess the age wines with more than roughly 13 years old, indicating that tasters were not familiar with the sensory features of white wines with 17 to 46 years old. In conclusion, experienced tasters consistently described the sensory space and recognised the high quality of aged dry white wines. Education programs may use the defined sensory spaces according to aging and to expand the range of quality perception by consumers.
Keywords:
white wines
; fine wines
; aging potential
; appreciation
; age prediction
; browning
; complexity
; quality.
1. Introduction
In wines, the meaning of ageing is concerned with the changes in chemical and aromatic composition that affect their sensory characteristics [1]. The most favourable type of aging in dry white wines is characterised by the loss of fresh fruitiness, and the development of aromatic nuances of honey, beeswax, straw, hay or nuts [2,3,4,5]. The yellow colour of an old white wine tends to vary from straw to amber [3,6]. The deviation from the favourable evolution is illustrated by the so-called atypical aging. In this process, the character of old wines is present in young wines leading to flavours of mothball, soap, rotten eggs, garlic or cooked vegetables, walnut/curry and bruised apple [5,7]. The distinction from wines with proper aging ability is not clear-cut since these aroma descriptors may also be found in developed top quality wines [8]. Thus, the thin line between proper and atypical aging justifies the examination of the respective distinctive sensory profiles.
The concept of sensory space, defined as the characteristic sensory features of a product shared by a group of individuals [9], appears to be appropriate to characterise wines difficult to distinguish. The approach has been applied to the concepts of varietal wines [10,11,12,13,14], regional characterisation [15] or “green” wines [16]. Concerning aging, most research has been applied to red wines aging bouquet [17,18]. Thus, the scarcity of research on aged white wines and the present market interest for these styles, justify an adequate definition of their sensory properties, including those with an aesthetic significance, characteristic of fine wines [19].
The approach to develop sensory conceptual spaces in wines includes three steps: 1) identification of the sensory concept; 2) perceptual evaluation of the sensory space; and 3) sensory space description [20]. The first step has been performed using a mental descriptive questionnaire [21]. In sequence, this work was aimed to assess and define the sensory space of aged white wines, including the so-called aesthetic attributes characteristic of fine wines.
2. Materials and Methods
2.1. Wine Samples
Eighteen commercial white wines with different ages and two commercial red and rosé wines, used as distractors, from different Portuguese regions were used in this study (Table 1). The white wines had between one and 47 years old, and the distractors had 47 (red) and 15 (rosé) years old. The producers kindly supplied the wine samples. Before sensory analysis, three experienced tasters of the laboratory staff tasted the wines to check occasional flaws.
2.2. Sensory Analysis
2.2.1. Tasting Panels
The study used three different experienced tasting panels. The first panel (critics) consisted of 9 wine critics and sommeliers (4 women and 5 men), aged between 26 and 72 years old (mean 52 years). The second panel (oenologists) consisted of 7 winemakers and oenology scholars (2 women and 5 men) aged between 28 and 61 years old (mean 49 years). These participants had more than 5 years of professional experience in wine tasting. The third panel (students) consisted of 14 oenology students (8 women and 6 men) from the second year of the Vitis Vinifera Master of Viticulture and Oenology Engineering (Instituto Superior de Agronomia, ISA), aged 22 to 40 years old (mean 27 years). Three sessions were held at the ISA Microbiology Laboratory. The participants were volunteers and informed that the tasting would be directed to assess aged white wines. Critics and oenologists tasted the wines on the 14th June 2021. The student session was carried out on the 9th July 2021.
2.2.2. Tasting Conditions
The tasting was divided into two parts, with 10 wines each. All samples were kept at a temperature of 19 ± 1ºC, and the tasting room had windows open for natural ventilation. The bottles were opened 30 minutes before pouring in transparent glasses (ISO 3591:1977) covered by glass Petri dishes. To limit carry-over effects and memory biases, samples were randomly distributed among tasters determined by a Williams Latin square design. The tasting sheet was divided into two parts (Supplementary Figure S1). The first part consisted of a score sheet for synthetic descriptors [22]. The second part corresponded to the taste/mouthfeel and aroma description using a Check-All-That-Apply (CATA) methodology. The attributes chosen for the CATA assessment were selected from a previous online survey [21]. Tasters could choose a maximum of 5 descriptors in in each taste/mouthfeel and aroma lists. After the CATA, respondents were asked to rate the quality and liking by drawing a line on a 9 cm unstructured scale anchored at both limits. The questionnaire ended with a question about the predicted age of the wine.
2.2.3. Data Analysis
The scores of the synthetic/aesthetic attributes were compared using one-way ANOVA by means of the Chi-square test (χ2) with α=0.05, since the score distribution was not normal. Therefore, the correlations among the attributes were obtained by using the non-parametric Kendall coefficient (tau-b). The analysis of the CATA was performed qualitatively since the data violated the test assumptions (i.e., no more than 20% of the expected counts were less than five and all the individual expected counts were one or greater). Furthermore, given the small sample size, both χ2 and alternatives tests had too low statistical power to detect statistically significant differences. Correspondence analysis (CA) was performed based on the contingency tables of the descriptors quoted more than 10% in, at least, one wine. Two cluster analysis were run, after data standardisation, using the Euclidean distance measure and the Ward.D clustering method, to obtain descriptor clusters (descriptors as rows and wines as columns) or wine clusters (wines as rows and descriptors as columns). Multiple Factorial Analysis (MFA) included the results of quality, colour (Abs 420 nm), age prediction and analytic descriptors. All analyses were performed using the using free statistical software Jamovi (version 1.8, www.jamovi.org).
3. Results and Discussion
3.1. Wine Synthetic and Aesthetic Scores
The comparison of the median scores given by all tasters to the synthetic and aesthetic attributes did not show differences among the wines (Table 2), reflecting the high individual variability in their assessment. In particular, the quality evaluation of the 20 tasted wines is shown in Figure 1, illustrating the unevenness of the scores. In certain wines, the scores varied more than 8 in a maximum scale of 10.
The younger white wines (WLi18 and WDo20) tended to be scored with lower values. The rosé and red distractor wines also tended to have lower classifications (Figure 1). This behaviour indicated that tasters penalized wines that were not consistent with aged white wines by previously being aware of the purpose of the tasting. Interestingly, wine WBe11 (2011 vintage) was also in the lower range of values, probably because its sensory features were consistent with a younger wine.
The variability in quality scores by experienced or expert tasters has been documented [23], demonstrating that subjects have a strong idiosyncratic appraisal of aesthetic judgements. Indeed, the comparison between the panels (Figure 2) showed a different quality assessment. Ballester at al. [23] speculated that high correlations among quality judgements may be found among individuals with the same academic background (e.g. winemakers). In the present work, the different background of critics or the different years of experience (oenologists and students) might explain the differences in quality evaluation, together with a different utilization of the scoring scale.
3.1.1. Effect of Experience on Quality Prediction
To understand more deeply, which factors might underlie the different quality evaluations of all tasted wines, correlations among the synthetic/aesthetic parameters were computed. The scores of all synthetic and aesthetic attributes are listed in Supplementary Table S1. When the responses of all tasters were merged, quality was highly correlated with persistence (linger) and complexity (Table 3). However, each tasting cohort contributed differently to this correlation. Indeed, critics associated quality with linger, power and complexity. Oenologists mostly associated quality with the number of flavours, balance, linger and complexity. The correlations obtained with students were all less strong than those of the more experienced cohorts were. Nevertheless, students showed higher correlations with balance and complexity. Overall, these results show that the evaluation of aged white wines is consistent with the definition of fine wines characterized by the valorization of aesthetic attributes such as complexity, persistence or balance [19]. The higher correlations obtained with balance than with harmonious probably reflect a semantic preference for balance that may be related with the concept of elegance [24].
Interestingly, quality was highly correlated with liking for critics and oenologists. These results demonstrate that, with experienced tasters, quality and liking are intrinsically related [25] being difficult to define if individual preferences are elicited by the aesthetic quality or if preferred wines must share higher aesthetic attributes, as hypothetised by Malfeito-Ferreira [26].
3.1.2. The Influence of Colour on the Quality of White Wines
Colour is a factor that can influence the quality perception when wines are tasted in transparent glasses. As widely recognized [27,28,29], experienced subjects rely on top-down mechanisms [30] to assess wine quality and colour is the first sensory feature to drive their responses. In particular, older white wines, with brownish colour, tend to be regarded as over-developed [31]. In this work, tasters were not asked to rate the colour since the absorbance at 420 nm provided an objective measure of browning. The positive correlations between quality and colour (Abs 420 nm) only for white wines are depicted in Figure 3.
The tasters were aware that were experiencing aged dry white wines. Therefore, some degree of browning would be expected to influence the results. Indeed, light yellow wines were considered young and tended to be less rated. Quality median scores lower than 3.5 were only given by critics to the less brownish wines (WMo16, WLi18, WDo20, see Table 1). Similarly, the highest browning values were not scored lower than 6 in quality by critics (WBa91, WPe00, WPe08). The lower correlation was obtained with students, indicating that they were not so influenced by colour as critics and oenologists, probably explained by their higher experience [32].
3.2. Definition of the Sensory Space of Aged Dry White Wines
3.2.1. Analytic Descriptions
The wines were subjected to sensory analysis using CATA to obtain an analytical description of aroma, taste and mouthfeel properties. The results of the 3 tasting cohorts were pooled and the results are presented in two contingency tables (Supplementary Tables S2 and S3). The tasters checked all the available aroma (17) and taste/mouthfeel (12) attributes at least once. Interestingly, tasters did not report any additional descriptor related with occasional over-development that would be expected since old wines were being tasted. A total of 11 aromas were used for the sequent Correspondence Analysis (CA), where 10 were cited at least 10% in one of the white wines and bruised apple was also included because of its relation with possible oxidation. Therefore, straw, caramel, wet/flint stone and curry were present in white wines but were not included, while spicy and earthy were not used since were characteristic of red and rosé wines. Regarding taste and mouthfeel descriptors, astringency, sourness and roughness were not used since shared low frequency of citation for all wines (<10%).
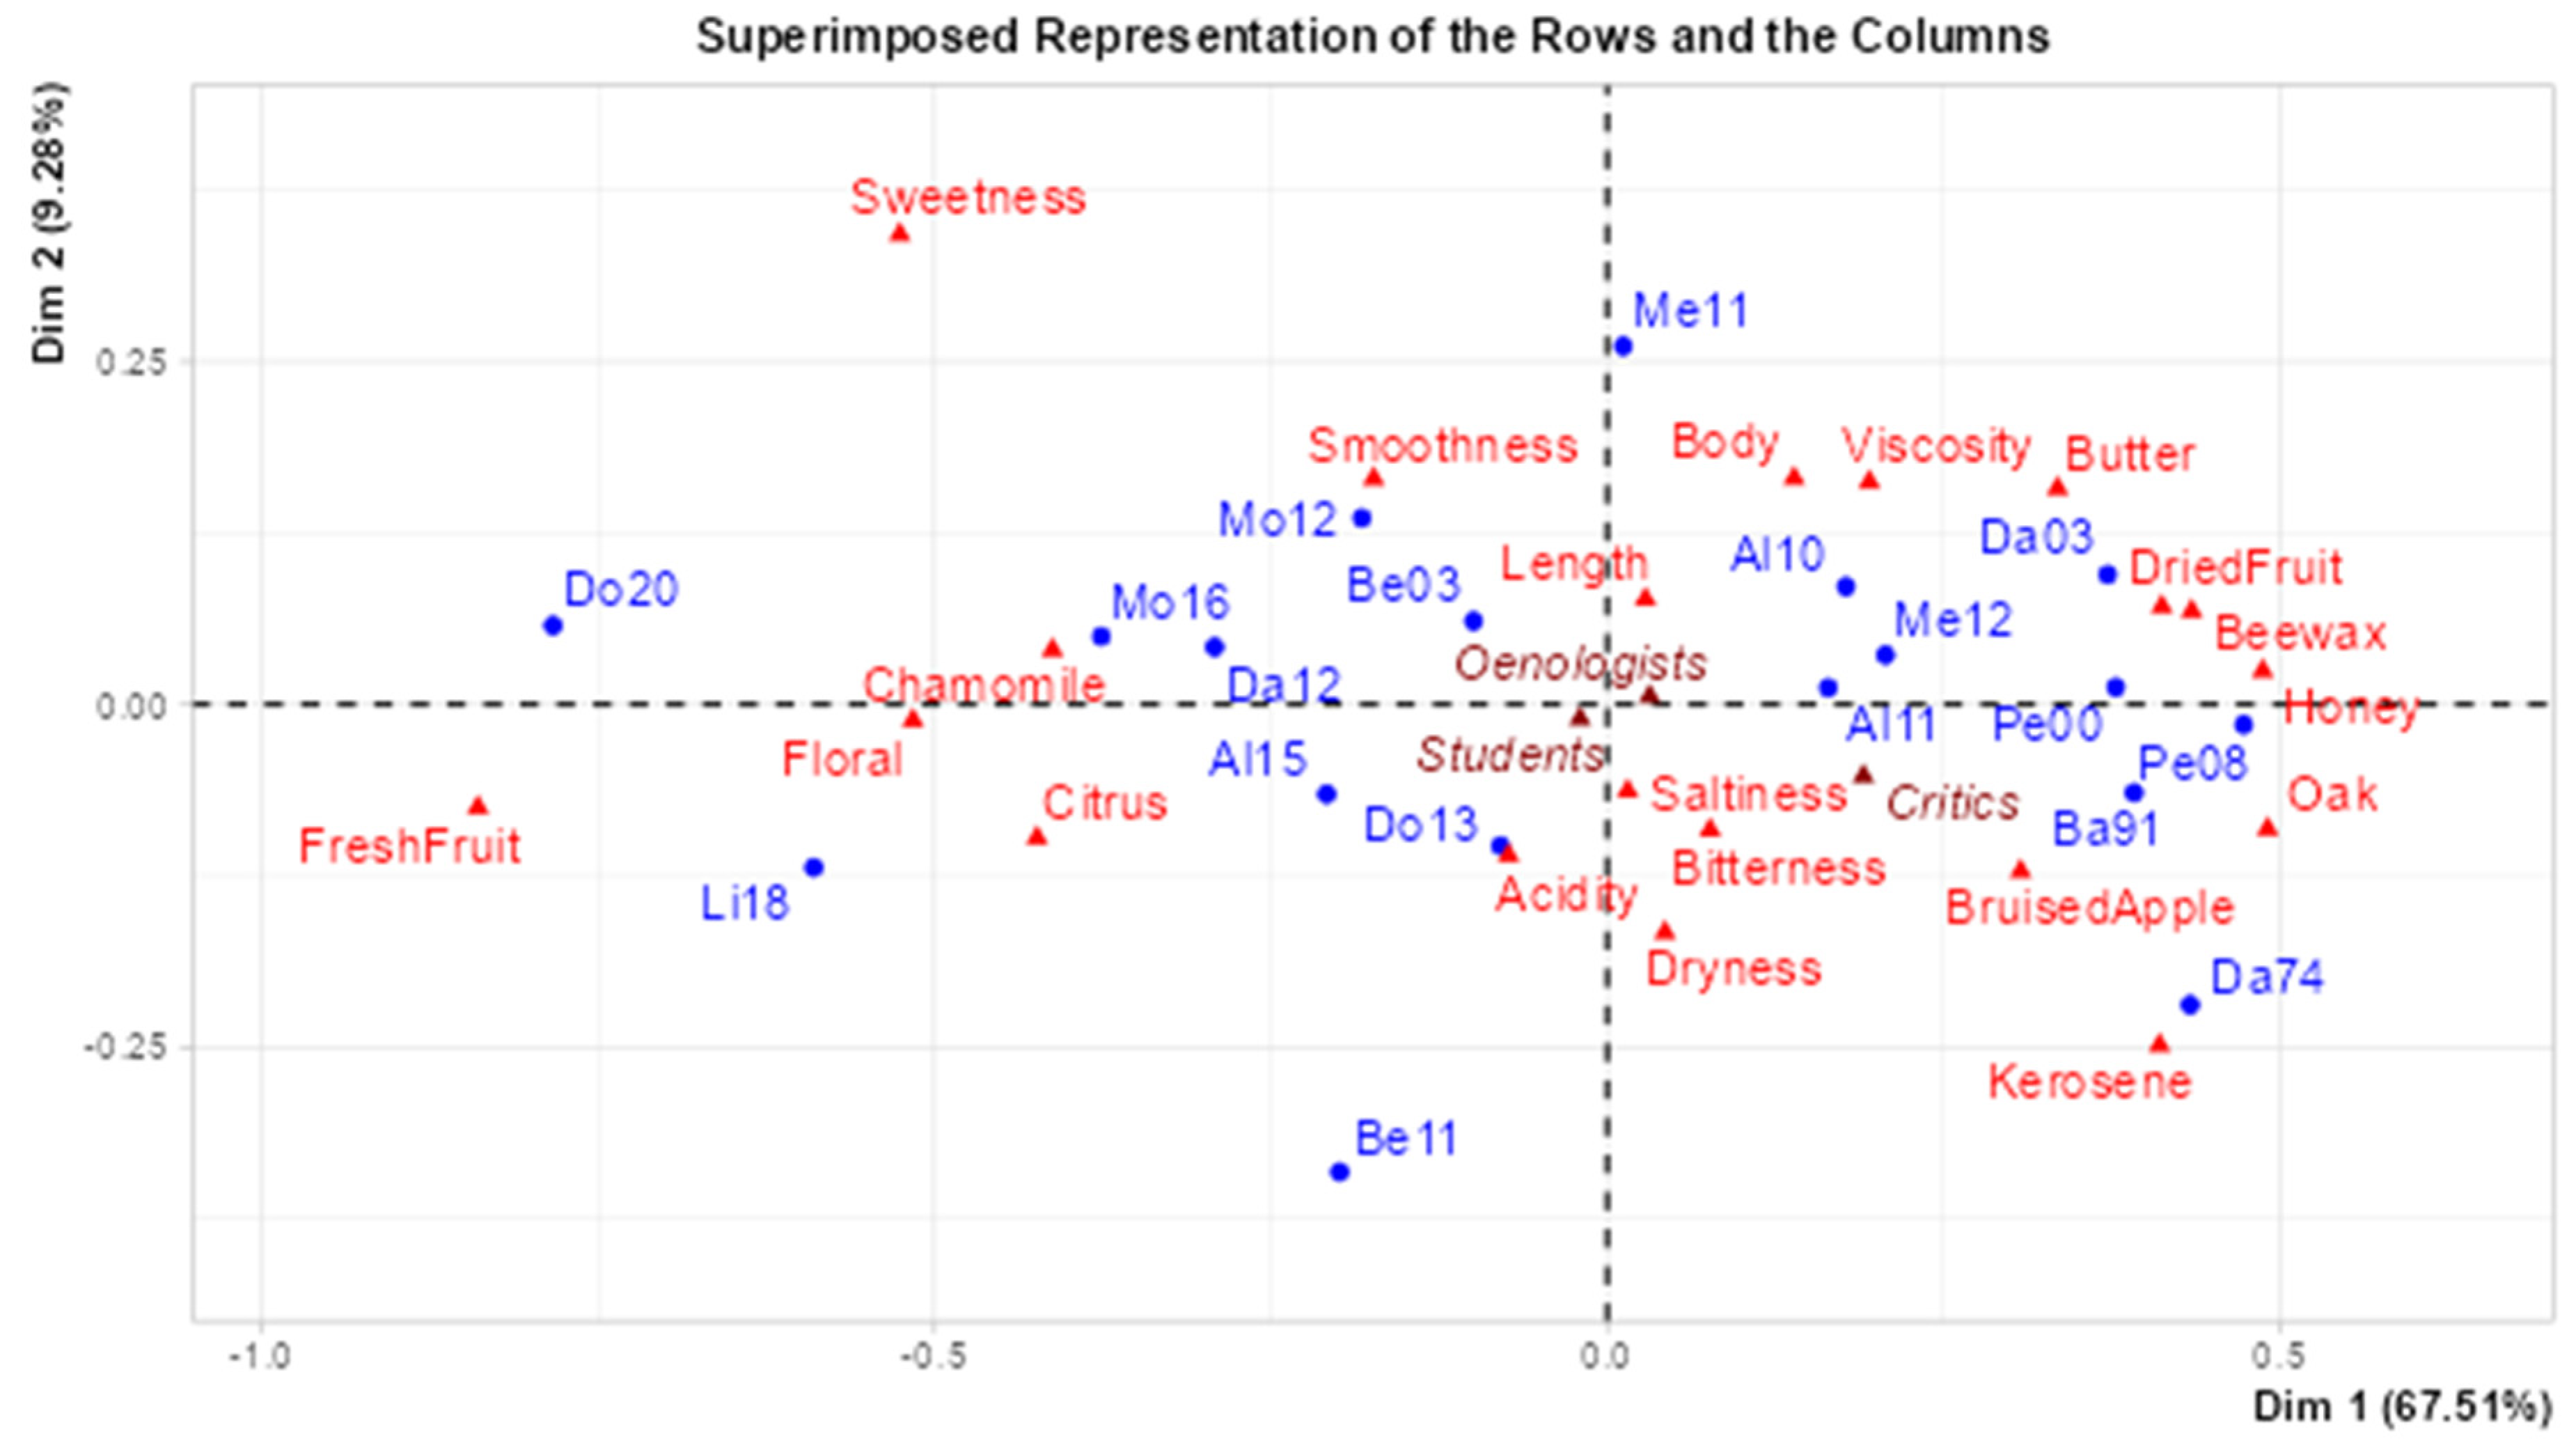
The CA, based on the contingency tables only for white wines, was run using the retained aroma, taste and mouthfeel descriptors (Figure 3). The Chi-square value of the CA was 675 with a high significance in the discrimination (df = 323, p < 0.001). The taste and mouthfeel descriptors were not run separately because the p-value was > 0.05 (results not shown), indicating that wine discrimination is mostly due to aroma descriptors. Indeed, CATA might not be practical regarding taste and mouthfeel properties [33]. The first two CA dimensions explained 76.79% of the variance which shows an adequate discriminant power elicited by aroma descriptors. The in-mouth perception more distant from the center of the plot was sweetness that may be explained by the effect of fruity and flowery aromas on the so-called phantom sweetness in dry wines [34].
The localization of the quality scores of the 3 panels as illustrative variables in the central zone of the plot indicates that quality evaluation did not contribute to the sensory analytic discrimination of the samples.
The proximity in the space cannot be interpreted as direct association between wines [35]. For instance, the closer position of Mo16 than Da12 to chamomile does not mean that it smells more to chamomile. Consequently, the map is not sufficient to conclude on the differences between products. The basic correct interpretation is that the farther out a wine lies on an axis, the more frequently that attribute is associated with that wine [35]. Thus, the CA biplot shows a clear distinction of the younger wines (Do20 and Li18), in the left part of the quadrant, from the older wines in the opposed quadrant (Da74, Pe08, Ba91, Pe00, Da03). The attributes placed closer to the center mean that are not exclusive of any wine (Length, Saltiness, Bitterness, Acidity). The overall sensory projections show that the samples covered adequately the sensory space correspondent to dry white wines with different ages.
Figure 3.
Correspondence Analysis of aroma, taste and mouthfeel descriptors of dry white wines. The median quality scores given by critics, oenologists and students were added as illustrative variables.
Figure 3.
Correspondence Analysis of aroma, taste and mouthfeel descriptors of dry white wines. The median quality scores given by critics, oenologists and students were added as illustrative variables.
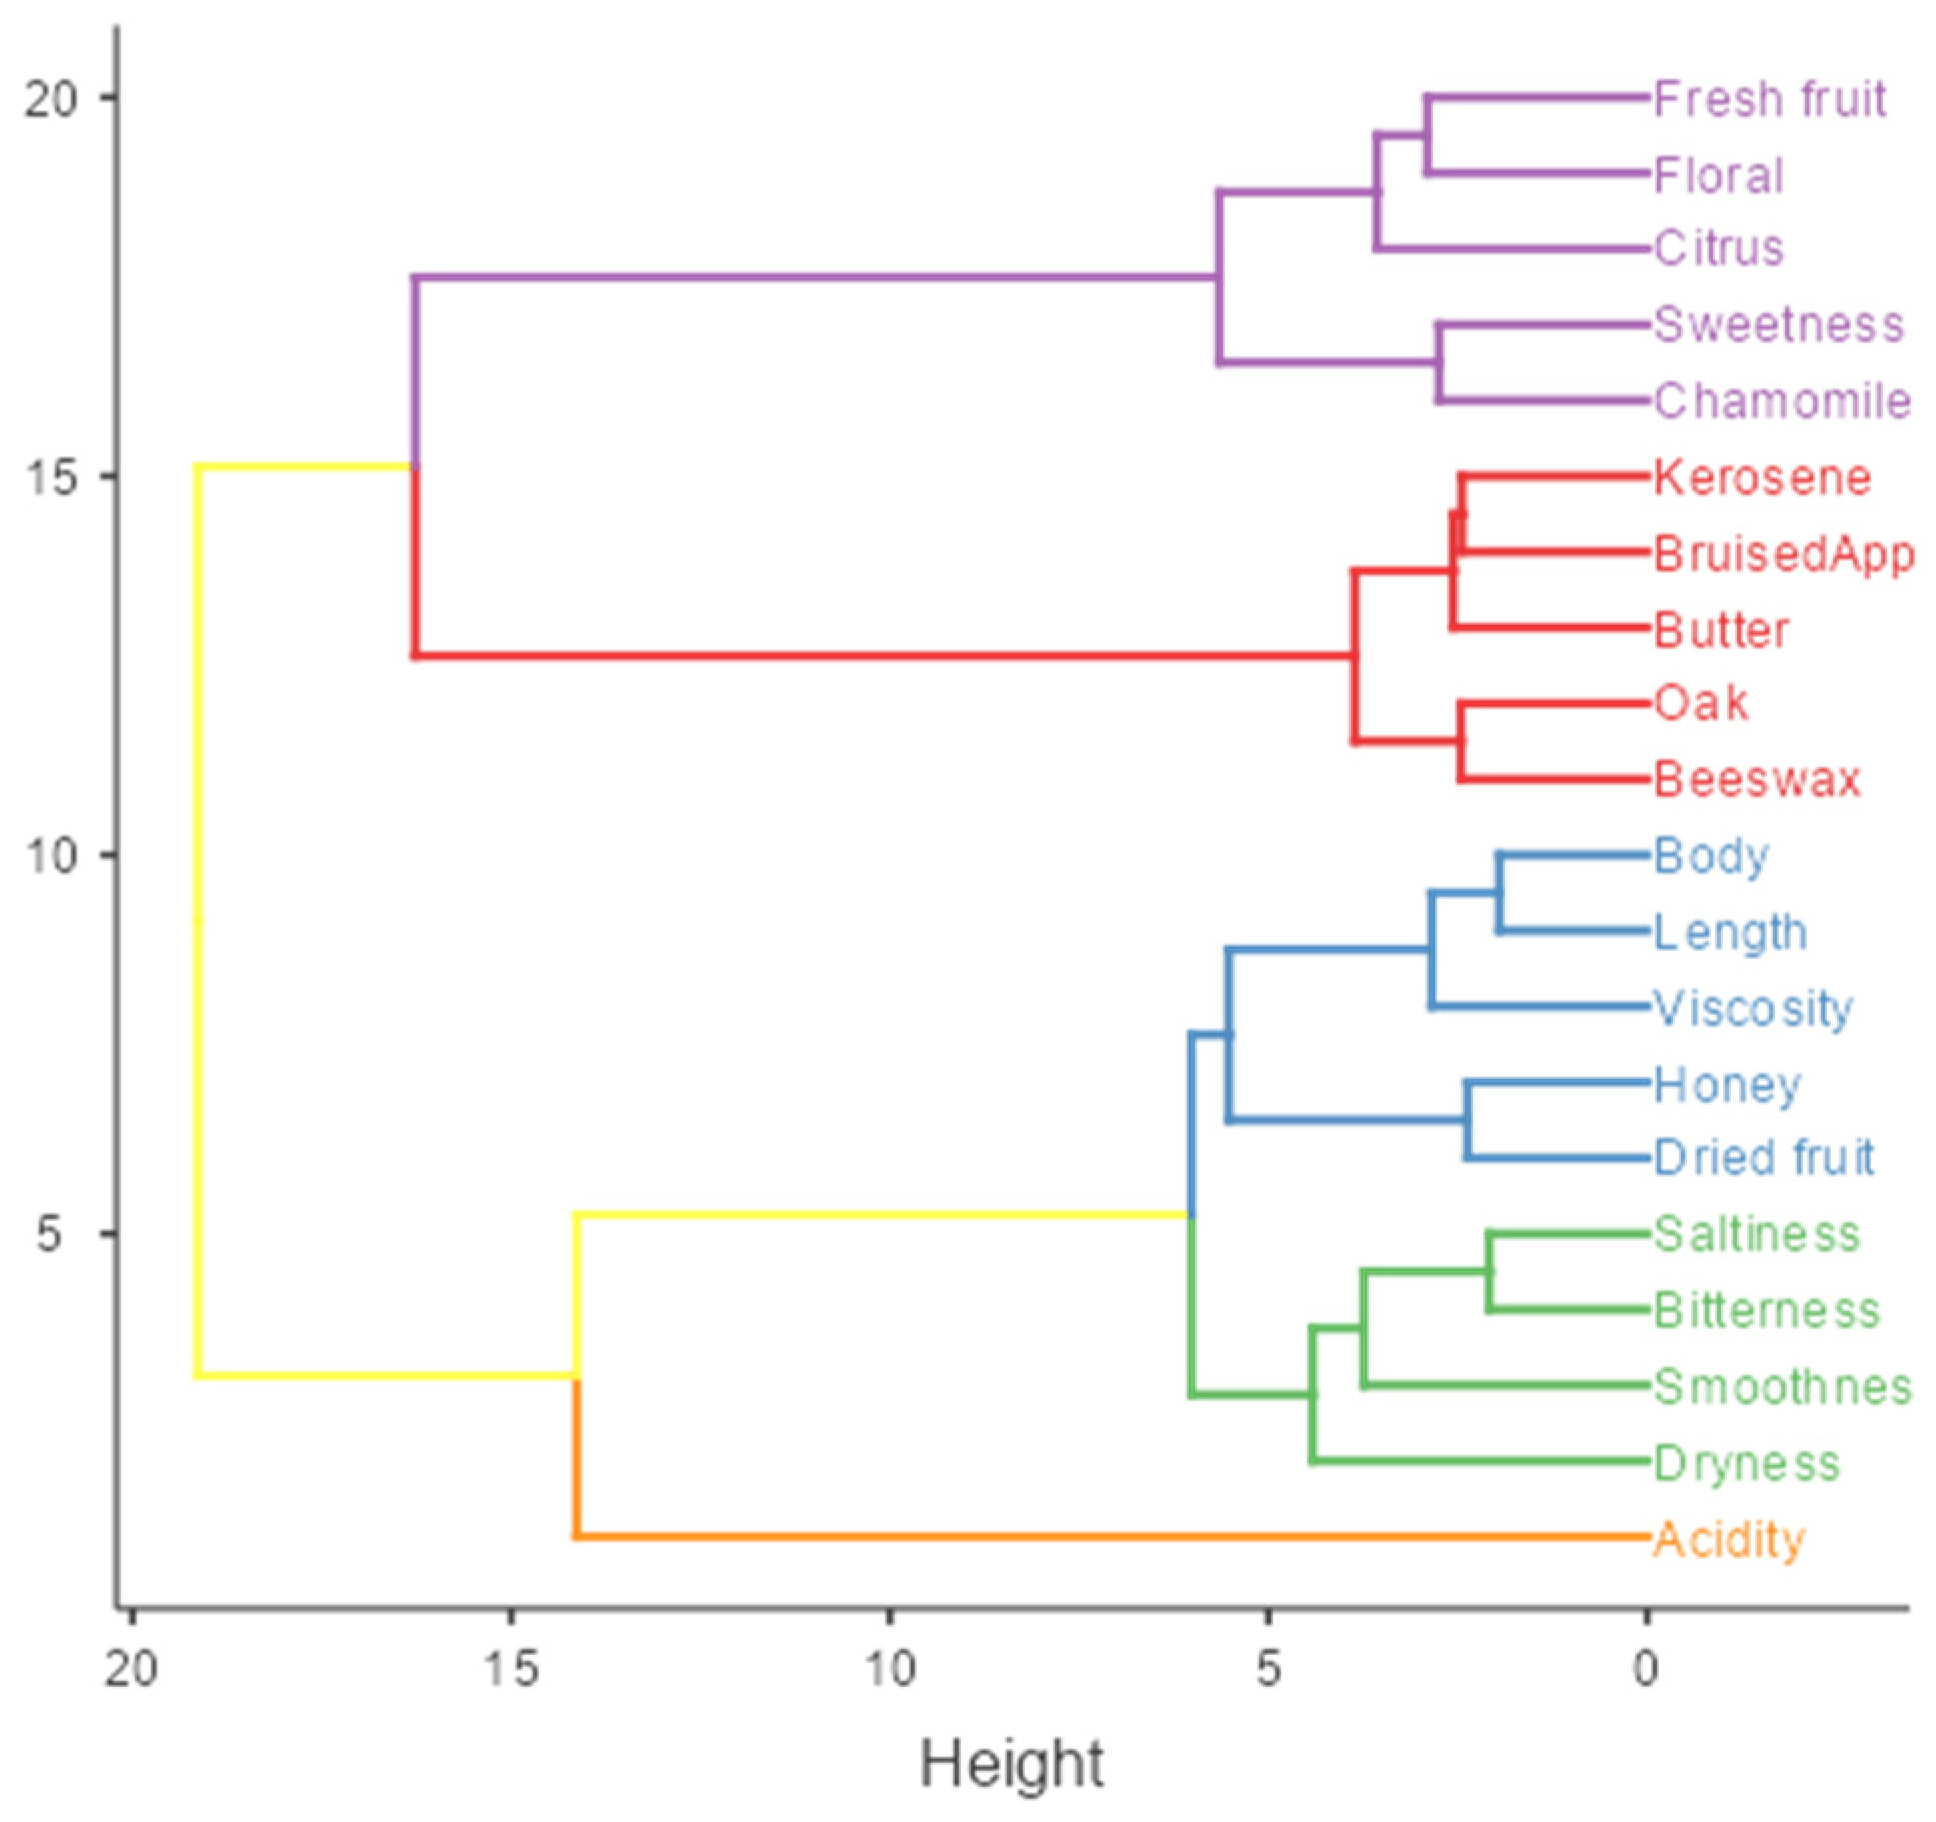
To understand the associations between the sensory descriptors, a cluster analysis was run and is depicted in Figure 4. The obtained clusters may be described consistently using a metaphor according to each dominant perception. Indeed, Freshness may be used to encompass the descriptors sweetness, fresh fruit, floral, citrus and chamomile, typical of young wines. Another cluster, coined as Mature, included the aromas of honey and dried fruit linked to body, length and viscosity. A third cluster included only aroma attributes (kerosene, bruised apple, butter, oak, beeswax), gathered under the overall perception of Mellowed wines [21]. The sensations of acidity and other in-mouth perceptions (saltiness, bitterness, smoothness and dryness) may be described under the umbrella of Austere, mostly used in popular wine press (e.g. www.wineenthusiast.com/basics/drinks-terms-defined/austere-wine-meaning, assessed on 5th May 2024). The frequency of citation of the descriptors in each sensory cluster is given in Table 4.
Figure 4.
Cluster dendogram of sensory descriptors elicited by dry white wines with different ages.
3.2.2. Predicted Age
The previous cluster analysis may also be applied to wines, according to their sensory description (Figure 5). The obtained 4 clusters correspond to different wines ages as perceived by the tasters. The results show that in 11 wines, the prediction differed by less than 3 years, comprising wines with real ages up to 12.5 years (Table 5). The difference in the prediction was higher for the older wines, being remarkable the case of WDa74, where the difference was roughly 36 years.
The prediction may be explained by the sensory conceptual space of the wines. Indeed, when wines were grouped according to their predicted age and to the frequency of citation of the clusters depicted in Figure 4, the output may be regarded as the sensory evolution of dry white wines during aging (Figure 6). As expected, this evolution was characterized by a decrease in the Freshness perception. Yet, some fresh fruitiness may be kept [8], accompanied by an increase in the evolved wine attributes, comprising Mature and Mellowed perceptual spaces. Interestingly, the Austere perception underlies all ages with a slight reduction with time. This behavior is consistent with the metaphor “mellowed by aging” proposed during the initial conceptual definition [21].
3.3. Overall Factors Affecting Quality Evaluation
The evaluation of the different factors that influence quality was performed by Multiple Factorial Analysis (MFA), using absorbance (420 nm), sensory descriptors and predicted age as variables. The first two components explained 68.7% of the variance (Supplementary Table S4). The variables contributing to the PCA are shown in Figure 7. The axes oppose the perception of Freshness (left position) to the perception of Mature (beeswax, oak) and Mellowed (dried fruit, honey, viscosity) wines. In the middle of the plan appears acidity, indicating that this attribute does not distinguishes younger from older wines. Even though, the onset of browning is regarded as a negative event [36], Figure 7 also shows that quality could be related to an acceptable degree of browning (Abs 420 nm). Therefore, the dry white wines most valorized by the tasters shared sensory attributes typical of older wines, within a predicted age range.
Figure 8 shows the discrimination of the dry white wines based on a priori grouping according to age perception. Wines were clearly separated, with younger samples in the lower left quadrant, mellowed wines in the lower right quadrant, while mature wines were placed in the higher quadrants.
3.4. Limitations of the Study
The fact that each cohort had a small number of tasters limited the significance of results regarding the effect of experience on the evaluation of synthetic factors affecting the aesthetic properties of the wines. In addition, a large variability of responses regarding synthetic/aesthetic attributes could probably be reduced by extensive training to calibrate the responses and by outlier deletion. However, no attempt was made to remove outliers since Parr [37] stated that this variability is intrinsic to sensory analysis and “not and error in the machine”. Nevertheless, the sensory analysis using CATA provided information that elicited a consistent definition of the aging sensory concept of dry white wines. The utilization of dark glasses would have reduced the top-down effects on sensory description but the intent was to check if brownish wines could be underscored, which did not occur. In addition, regarding the complex nature of wine ageing it would have been interesting to check the evolution of the sensory attributes with time after pouring wine in the glasses [38].
The experimental outputs obviously depend on the wines selected for the study. Even if the tasted samples covered the sensory range from younger to older wines, it would have been useful to have clearly substandard dark brown oxidized wines to establish the boundaries between not-faulty/faulty wines, which appear to be easier to define in whites rather than in red wines [39]. Another limitation concerns the use of other grape varieties, or wines from international regions known for their aging potential [40], to cover sensory features different from those of Portuguese wines.
4. Conclusions and Future Prospects
The results indicated that tasters with different degrees of expertise and experience properly valorized aged dry white wines. The variability in the assessment of properties with aesthetic value indicates that there is an idiosyncratic appreciation that underlie fine wine quality. In particular, critics and winemakers showed different quality inferences mainly regarding the contribution of power and balance. To these cohorts, liking was intrinsically related to quality evaluation. The influence of browning on quality evaluation was an indication of top-down processes that were more evident among the critics.
The utilization of CATA methodology enabled to evidence the attributes consistent with the sensory space of “wines mellowed by age”. The boundaries between younger and older wines were dependent on the decreasing perception of freshness and with the concomitant increase in the perception of maturity and mellowed flavours. A constant perception of austerity spanned the sensory continuum, which may be envisaged as the structure on which builds the aging potential of dry white wines.
Overall, this study demonstrated the fine wine quality attributes of aged dry white wines and contributed to the definition of the sensory space of “wines mellowed by age”. Wine education programs might use this defined sensory space together with the corresponding aesthetic attributes to expand the range of quality perception by consumers.
Supplementary Materials
The following supporting information can be downloaded at the website of this paper posted on Preprints.org, Figure S1: Tasting sheet used in the study; Table S1: Mean scores of colour (Abs 420 nm) and synthetic/aesthetic attributes given by the 3 tasting cohorts; Table S2: Contingency table of aroma analytical descriptors (those retained for Correspondence analysis are written in bold); Table S3: Contingency table of analytical taste and synthetic mouthfeel descriptors (those retained for Correspondence analysis are written in bold); Table S4: Eigenvalues and variance of the PCA elicited by the factors affecting quality evaluation.
Author Contributions
Conceptualization, M.F. and M.S.; methodology, M.F. and M.S.; software, M.E. and M.S.; validation, M.F.; investigation, M.E.; writing—original draft preparation, M.E. and M.S.; writing—review and editing, M.F.; supervision, M.F.. All authors have read and agreed to the published version of the manuscript.
Funding
This work was supported by national funds from the research unit UID/AGR/04129/2013 (LEAF – Linking, Landscape, Environment, Agriculture and Food Research Center) through Fundação para a Ciência e a Tecnologia (Portuguese Foundation for Science and technology – FCT).
Data Availability Statement
The data presented in this study are available on request from the corresponding author due to the absence of a data repository for this specific dataset.
Acknowledgments
The authors are grateful to the wine companies donating the tasted wines.
Conflicts of Interest
The authors declare no conflicts of interest.
References
- Linsenmeier, A. W.; Rauhut, D.; Sponholz. W. R. Ageing and flavour deterioration in wine. In Managing Wine Quality (2nd edition); Reynold, A. (Editor). Woodhead Publishing Limited: Cambridge, UK, 2022; pp. 559-594. [CrossRef]
- Fischer, U.; Roth, D.; Christmann, M. The impact of geographic origin, vintage and wine estate on sensory properties of Vitis vinifera cv. Riesling wines. Food Qual Prefer 1999, 10, 281-288. [CrossRef]
- Godden, P.; Francis, L.; Field, J.; Gishen, M.; Coulter, A.; Valente, P.; Hoj, P.; Robinson, E. Wine bottle closures: physical characteristics and effect on composition and sensory properties of a Semillon wine 1. Performance up to 20 months post-bottling. Aust J Grape Wine Res 2001, 7, 64-105. [CrossRef]
- Pons, A.; Lavigne, V.; Thibon, C.; Redon, P.; Loisel, C.; Dubourdieu, D.; Darriet, P. Impact of Closure OTR on the Volatile Compound Composition and Oxidation Aroma Intensity of Sauvignon Blanc Wines during and after 10 Years of Bottle Storage. J Agric Food Chem 2021, 69, 9883-9894. [CrossRef]
- Ballester, J.; Magne, M.; Julien, P.; Noret, L.; Nikolantonaki, M.; Coelho, C.; Gougeon, R.D. Sensory Impact of Polyphenolic Composition on the Oxidative Notes of Chardonnay Wines. Beverages 2018, 4, 19. [CrossRef]
- Skouroumounis, G.; Kwiatokowsky, M.; Francis, I.; Oakey, Y.; Capone, D.; Duncan, B.; Sefton, M.; Waters, E. The impact of closure type and storage conditions on the composition, colour and flavour properties of a Riesling and a wooded Chardonnay wine during five years' storage. Aust J Grape Wine Res 2005, 11, 369-377. [CrossRef]
- Gabrielli, M.; Fracassetti, D.; Romanini, E.; Colangelo, D.; Tirelli, A.; Lambri. M. Oxygen-induced faults in bottled white wine : A review of technological and chemical characteristics. Food Chem 2021, 348, 128922. [CrossRef]
- Blackman, J. W.; Hopfer, H.; Saliba, A. J.; Schmidtke, L. M.; Barril, C.; Scollary, G. R. Sensory characterization of Hunter Valley Semillon aged in bottle. Flav Fragang J 2014, 29, 340–349. [CrossRef]
- Dacremont, C.; Vickers, Z. Classification of cheeses according to their closeness to the cheddar cheese concept. J Sens Stud 1994, 9, 237-246. [CrossRef]
- Candelon, M.; Ballester, J.; Uscidda, N.; Blanquet, J.; Le Fur, Y. Sensory methodology developed for the investigation of Sciaccarello wine concept. OENO One 2004, 38, 147–154. [CrossRef]
- Ballester, J.; Dacremont, C.; Le Fur, Y.; Etiévant, P. The role of olfaction in the elaboration and use of the Chardonnay wine concept. Food Qual Prefer 2005, 16, 351-359.
- Loison, A.; Symoneaux, R.; Deneulin, P.; Thomas-Danguin, T.; Fant, C.; Guérin, L.; Le Fur, Y. Exemplarity measurement and estimation of the level of interjudge agreement for two categories of French red wines. Food Qual Prefer 2015, 40, 240-251.
- Schüttler, A.; Friedel, M.; Jung, R.; Rauhut, D.; Darriet, P. Characterizing aromatic typicality of Riesling wines: merging volatile compositional and sensory aspects. Food Res Int 2015, 69, 26-37. [CrossRef]
- Garrido-Bañuelos, G.; Ballester, J.; Buica, A.; Mihnea, M. Exploring the typicality, sensory space, and chemical composition of swedish solaris wines. Foods 2020, 9, 9081107. [CrossRef]
- Kustos, M.; Gambetta, J.; Jeffery, D.; Heymann, H.; Goodman, S.; Bastian, S. A matter of place: Sensory and chemical characterisation of fine Australian Chardonnay and Shiraz wines of provenance. Food Res Int 2020, 130, 108903. [CrossRef]
- Sáenz-Navajas, M. P.; Arias-Pérez, I.; Ferrero-del-Teso, S.; Escudero, A.; Ferreira, V.; Fernández-Zurbano, P.; Valentin, D. Access to wine experts’ long-term memory to decipher an ill-defined sensory concept: the case of green red wine. OENO One 2021, 55, 69–79. [CrossRef]
- Langlois, J.; Dacremont, C.; Peyron, D.; Valentin, D.; Dubois, D. Lexicon and types of discourse in wine expertise: The case of vin de garde. Food Qual Prefer 2011, 22, 491-498. [CrossRef]
- Picard, M.; Tempère, S.; de Revel, G.; Marchand, S. A sensory study of the ageing bouquet of red Bordeaux wines: A three-step approach for exploring a complex ofactory concept. Food Qual Prefer 2015, 42, 110–122. [CrossRef]
- Malfeito-Ferreira. M. Fine wine flavour perception and appreciation: Blending neuronal processes, tasting methods and expertise. Trend Food Sci Technol 2021, 115, 332–346. [CrossRef]
- Barbe, J.; Garbay, J.; Tempère, S. The sensory space of wines: From concept to evaluation and description. A review. Foods 2021, 10. [CrossRef]
- Sequeira, M.; Malfeito-Ferreira, M. Mental representation of the sensory space of dry white wines “mellowed” by ageing. OENO one 2024, submitted, under the first review round.
- Parr, W. V.; Grose, C.; Hedderley, D.; Maraboli, M. M.; Masters, O.; Araujo, L. D.; Valentin, D. Perception of quality and complexity in wine and their links to varietal typicality: An investigation involving Pinot noir wine and professional tasters. Food Res Int 2020, 137, 109423.
- Ballester, J.; Belascoin, M.; Gonzalez-Hernandez, M.; Parga-Dans, E.; Alonso González, P.; Saenz-Navajas, M.-P. Sensory attributes and quality perception of red natural wines: a comparative study in Spain and France. OENO One 2024, 58(1). [CrossRef]
- Shepherd, H.; Parr, W.; Lo Monaco, G; Heber Rodrigues, H. The meaning of the word elegance as a wine descriptor: Effect of expertise and wine type. Food Res Int 2023, 164, 112399. [CrossRef]
- Sackris, D.; Larsen, R. The Perniciousness of Higher-Order Evidence on Aesthetic Appreciation. Dialogue: Can Phil Rev 2023, 62, 303–322. [CrossRef]
- Malfeito-Ferreira, M. Fine wine recognition and appreciation: It is time to change the paradigm of wine tasting. Food Res Int 2023, 174, 113668. [CrossRef]
- Morrot, G.; Brochet, F.; Dubourdieu, D. The color of odors. Brain Lang 2001, 79, 309–320.
- Ballester. J.; Abdi. H.; Langlois. J.; Peyron. D.; Valentin, D. The odor of colors: Can wine experts and novices distinguish the odors of white. red. and rosé wines? Chemosensory Perception 2009, 2(4). 203–213. [CrossRef]
- Wang, Q. J.; Spence, C. Drinking through rosé-coloured glasses: Influence of wine colour on the perception of aroma and flavour in wine experts and novices. Food Res Int 2019, 126, 108678.
- Shepherd, G. M. Neuroenology: how the brain creates the taste of wine. Flavour 2015, 4(1). [CrossRef]
- Spence. C. Wine psychology: basic & applied. Cogn Research 2020, 5, 22. [CrossRef]
- Parr, W. V.; White, K. G.; Heatherbell, D. The nose knows: influence of colour on perception of wine aroma. J Wine Res 2003, 14, 79–101.
- Brand, J.; Panzer, V.; Buica, A. Wine quality drivers: A case study on South African Chenin Blanc and Pinotage wines. Foods 2020, 9, 805.
- Vitorino, G.; Mota, M.; Malfeito-Ferreira, M. Characterization of sensory perceptions elicited by white wine spiked with different aroma, taste and mouth-feel active molecules. J Vitic Enol 2021, 36, 2, 139 - 150. [CrossRef]
- Peltier, C.; Visalli, M.; Schlich, P. Canonical Variate Analysis of Sensory Profiling Data. J Sensory Stud 2015, 30, 316–328. doi: 10.1111/joss.12160.
- Kanavouras, A.; Coutelieris, F.; Karanika, E.; Kotseridis, Y.; Kallithraka. S. Colour change of bottled white wines as a quality indicator. OENO One 2020, 54, 543–551. [CrossRef]
- Parr, W. V. Demystifying wine tasting: Cognitive psychology's contribution. Food Res Int 2019, 124, 230–233. [CrossRef]
- Wang, Q. J.; Niaura, T.; Kantono, K. How does wine ageing influence perceived complexity? Temporal-Choose-All-That-Apply (TCATA) reveals temporal drivers of complexity in experts and novices. Food Qual Prefer 2021, 92, 104230. [CrossRef]
- Franco-Luesma, E.; Honoré-Chedozeau, C.; Ballester, J.; Valentin, D. Oxidation in wine: Does expertise influence the perception? LWT 2019, 116, 108511. [CrossRef]
- Bueno, M.; Culleré, L.; Cacho. J.; Ferreira, V. Chemical and sensory characterisation of oxidative behavior in different wines. Food Res Int 2010, 43, 1423–1428. [CrossRef]
Figure 1.
Distribution of quality scores given by critics, oenologists and students (Box plots: •, average; horizontal line, median; lower horizontal dash, 10% of the scores, higher horizontal dash, 90% of the scores; box, 25% and 50% of the scores, ♦, extreme scores).
Figure 1.
Distribution of quality scores given by critics, oenologists and students (Box plots: •, average; horizontal line, median; lower horizontal dash, 10% of the scores, higher horizontal dash, 90% of the scores; box, 25% and 50% of the scores, ♦, extreme scores).
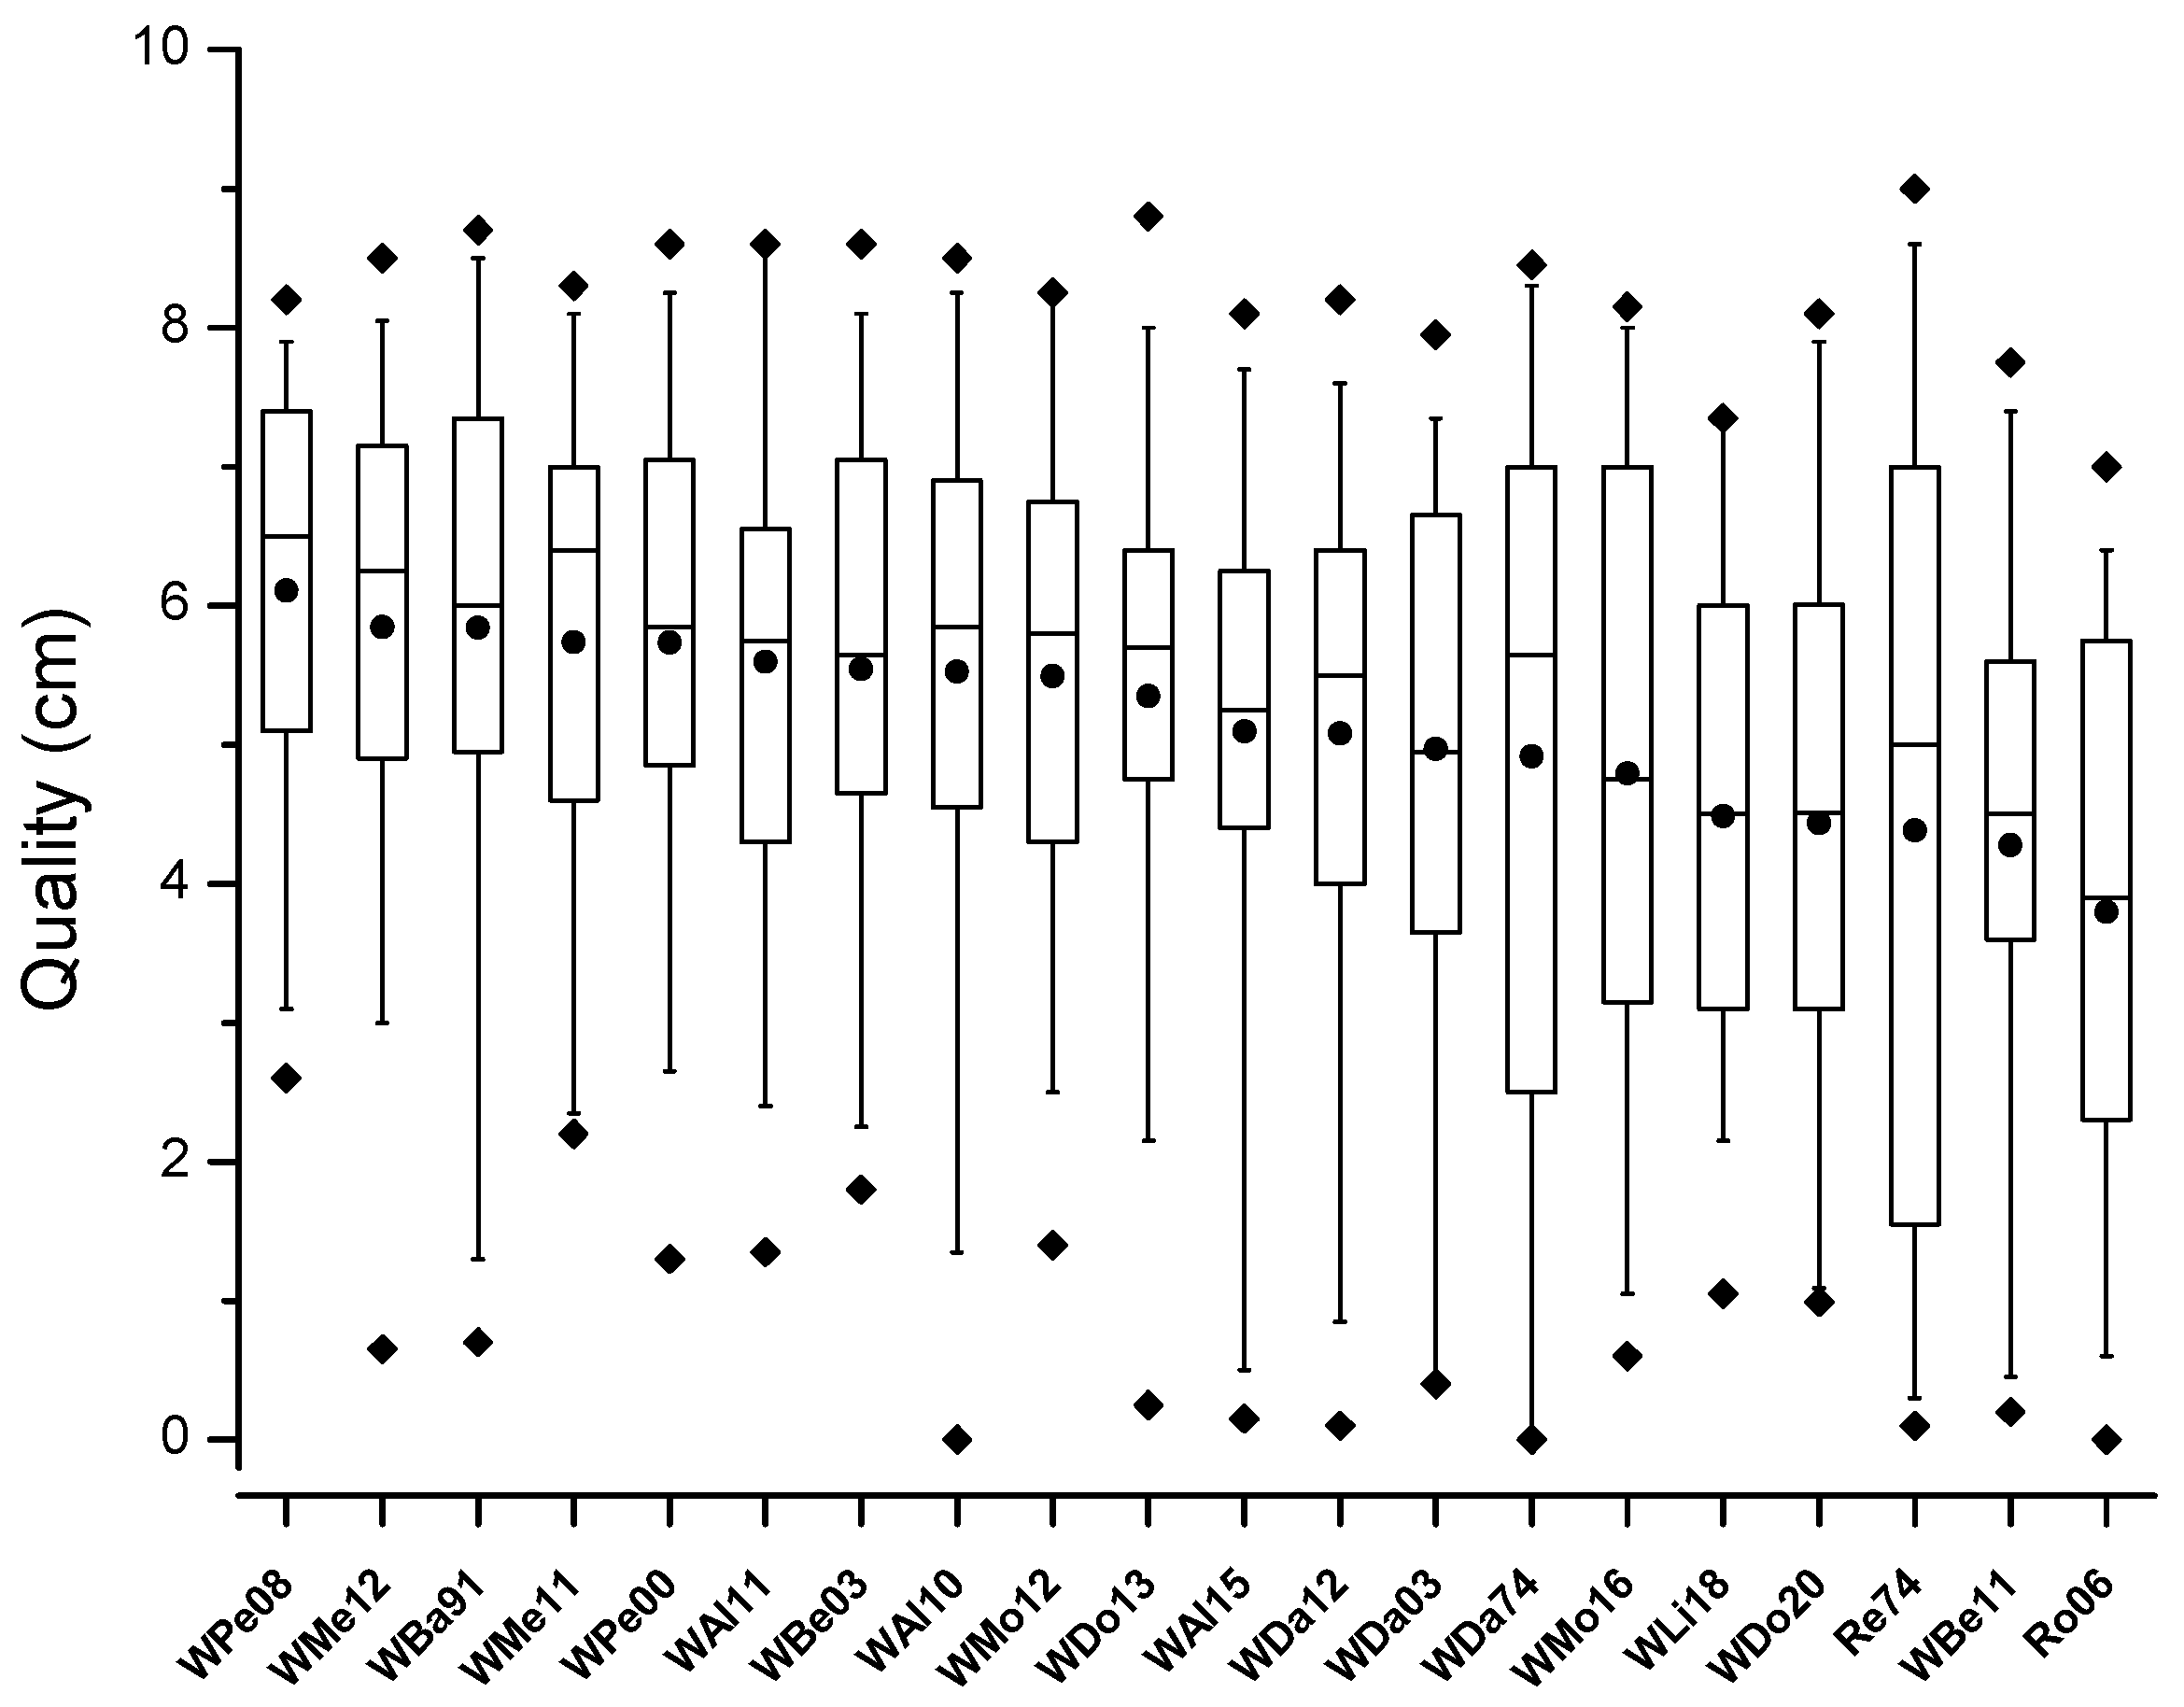
Figure 2.
Correlation between median quality scores of dry white wines among the three panels (A, tau-b = 0.033, p = 0.881; B, tau-b = 0.255, p = 0.152; C, tau-b = 0.098, p = 0.601).
Figure 2.
Correlation between median quality scores of dry white wines among the three panels (A, tau-b = 0.033, p = 0.881; B, tau-b = 0.255, p = 0.152; C, tau-b = 0.098, p = 0.601).
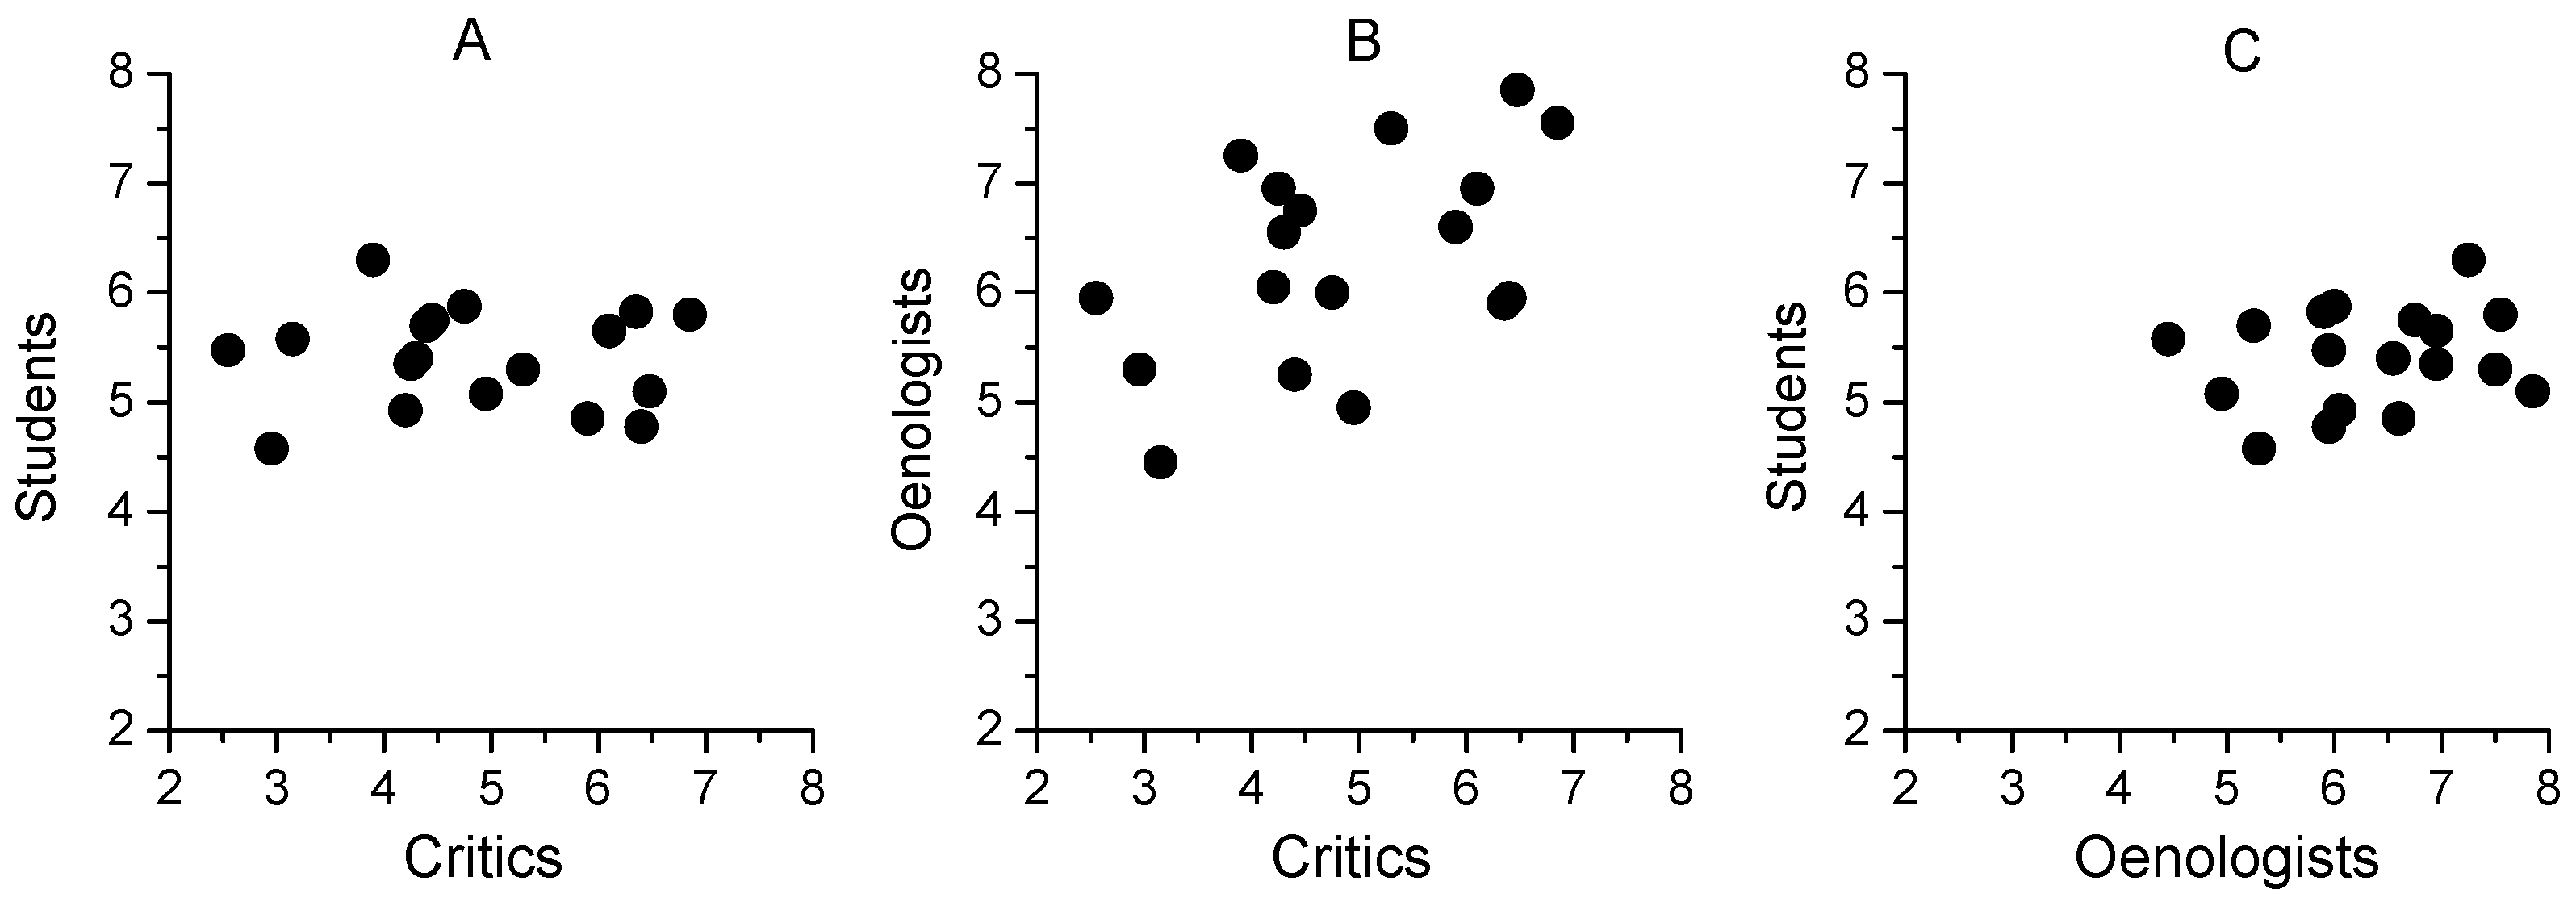
Figure 3.
Correlation between median quality scores and absorbance of dry white wines among the three panels (A, critics, tau-b =0 .686, p < 0.001; B, oenologists, tau-b = 0.438, p = 0.011; C, students, tau-b = 0.315, p = 0.069).
Figure 3.
Correlation between median quality scores and absorbance of dry white wines among the three panels (A, critics, tau-b =0 .686, p < 0.001; B, oenologists, tau-b = 0.438, p = 0.011; C, students, tau-b = 0.315, p = 0.069).
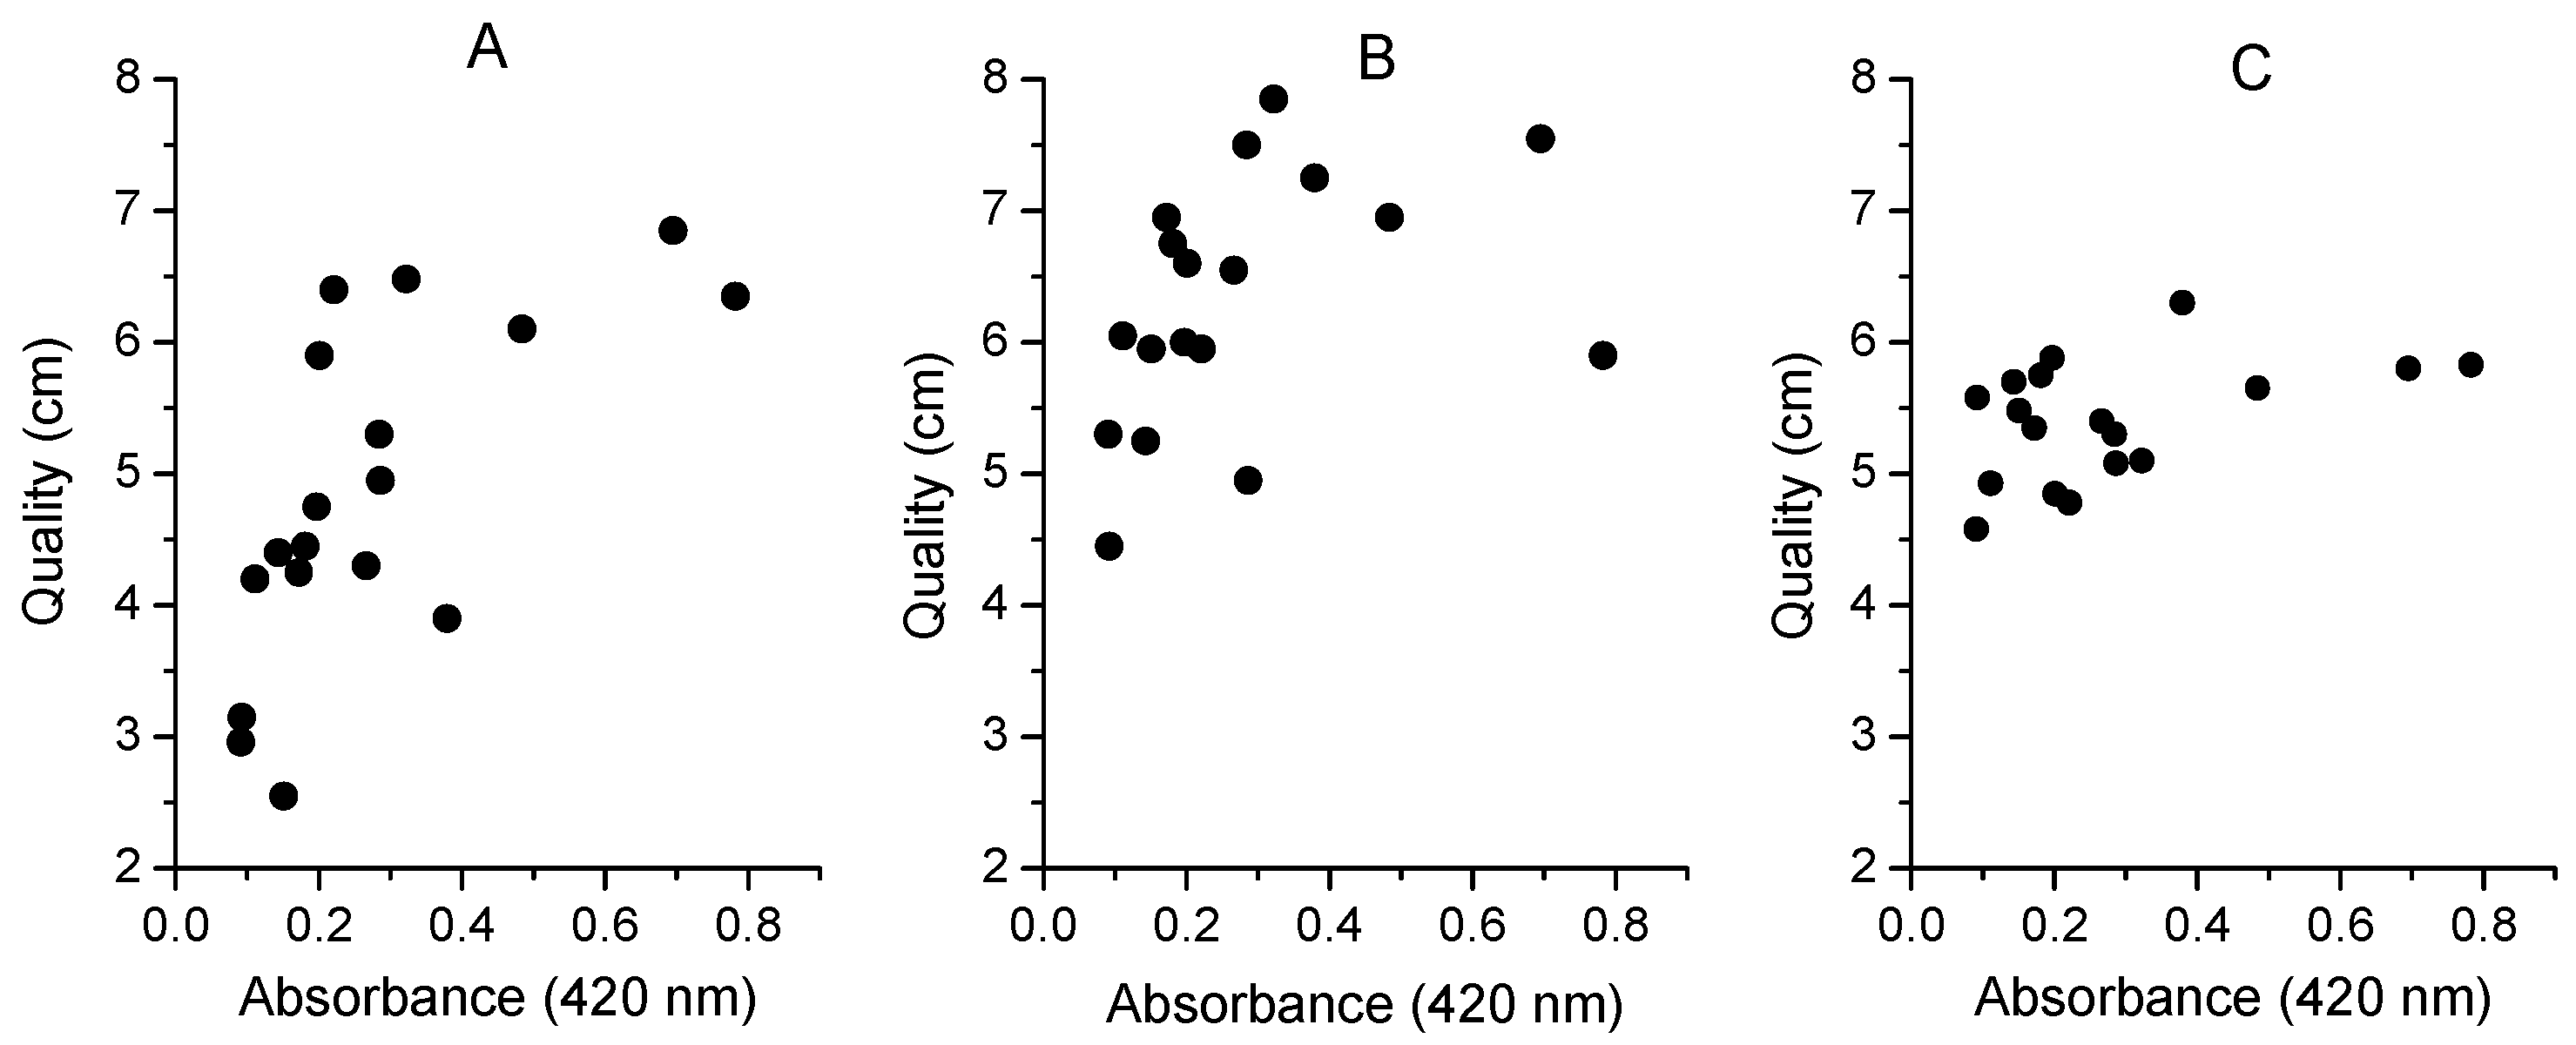
Figure 5.
Cluster dendogram grouping dry white wines with different ages according to their sensory description.
Figure 5.
Cluster dendogram grouping dry white wines with different ages according to their sensory description.
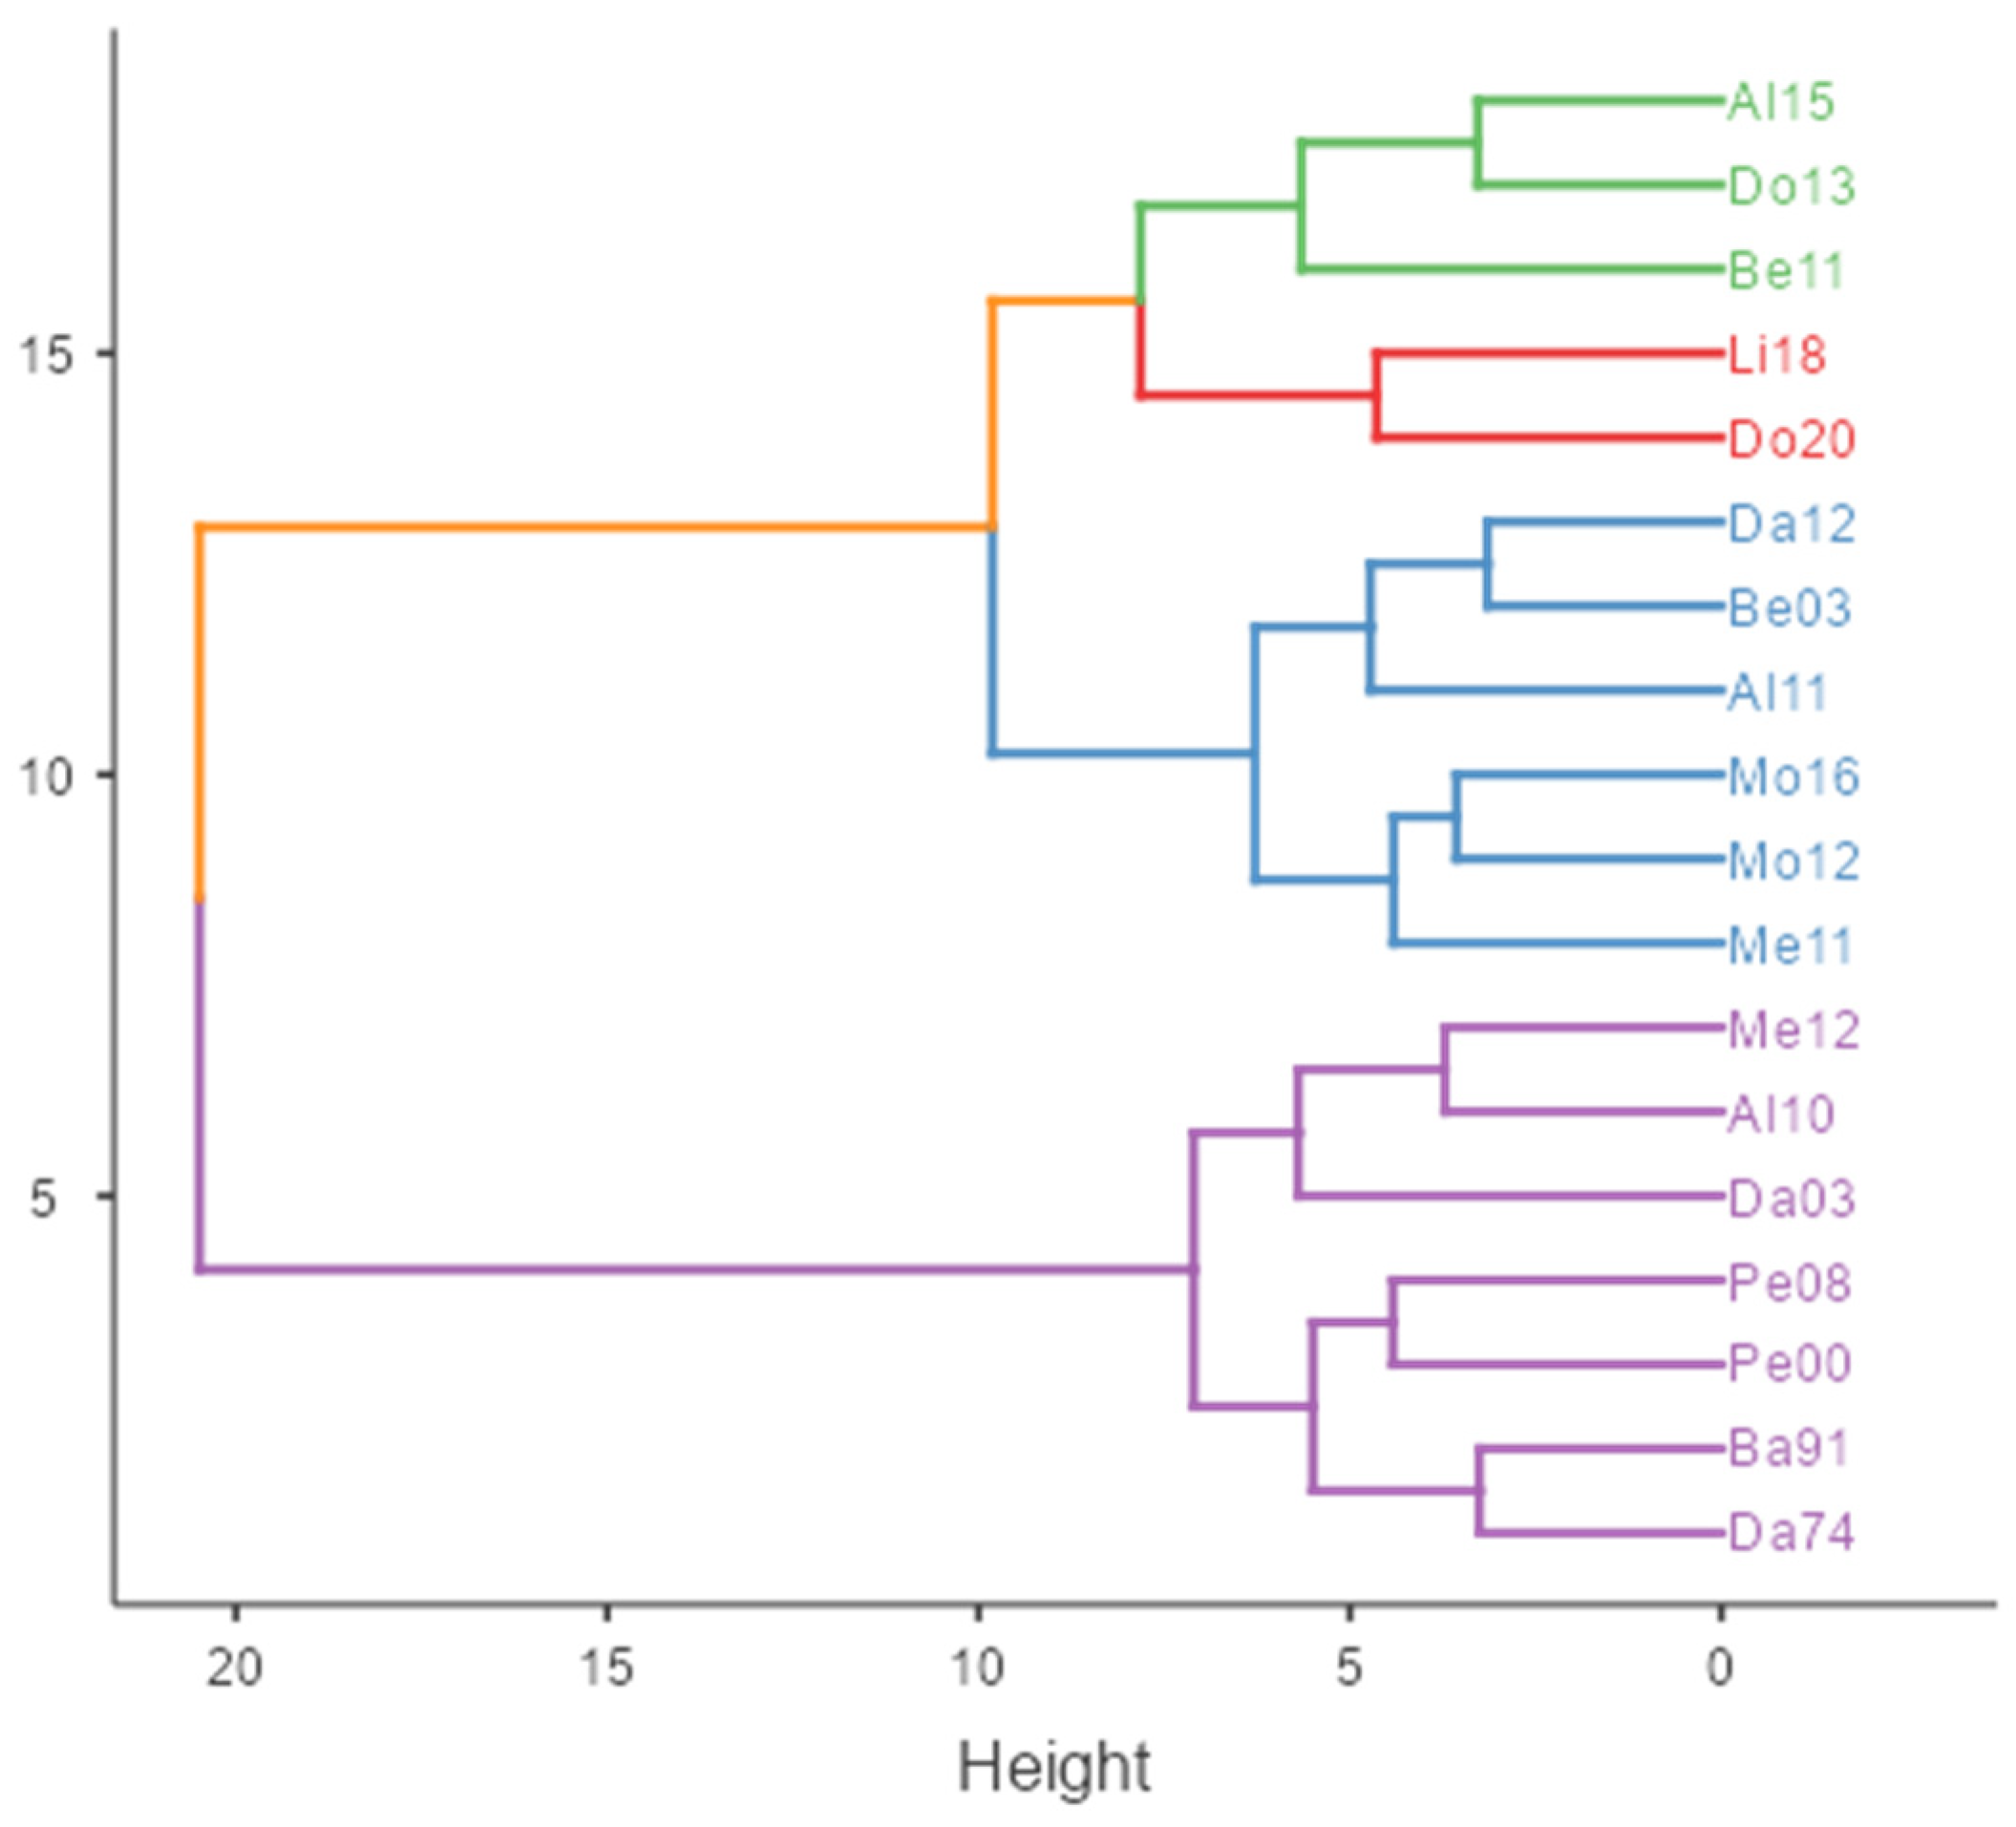
Figure 6.
Sensory characterisation of dry white wines grouped according to their predicted age.
Figure 7.
Multiple Factorial Analysis of dry white wines displaying the quantitative variables related to Colour (Abs 420 nm), Predicted Age, Sensory attributes and Quality.
Figure 7.
Multiple Factorial Analysis of dry white wines displaying the quantitative variables related to Colour (Abs 420 nm), Predicted Age, Sensory attributes and Quality.
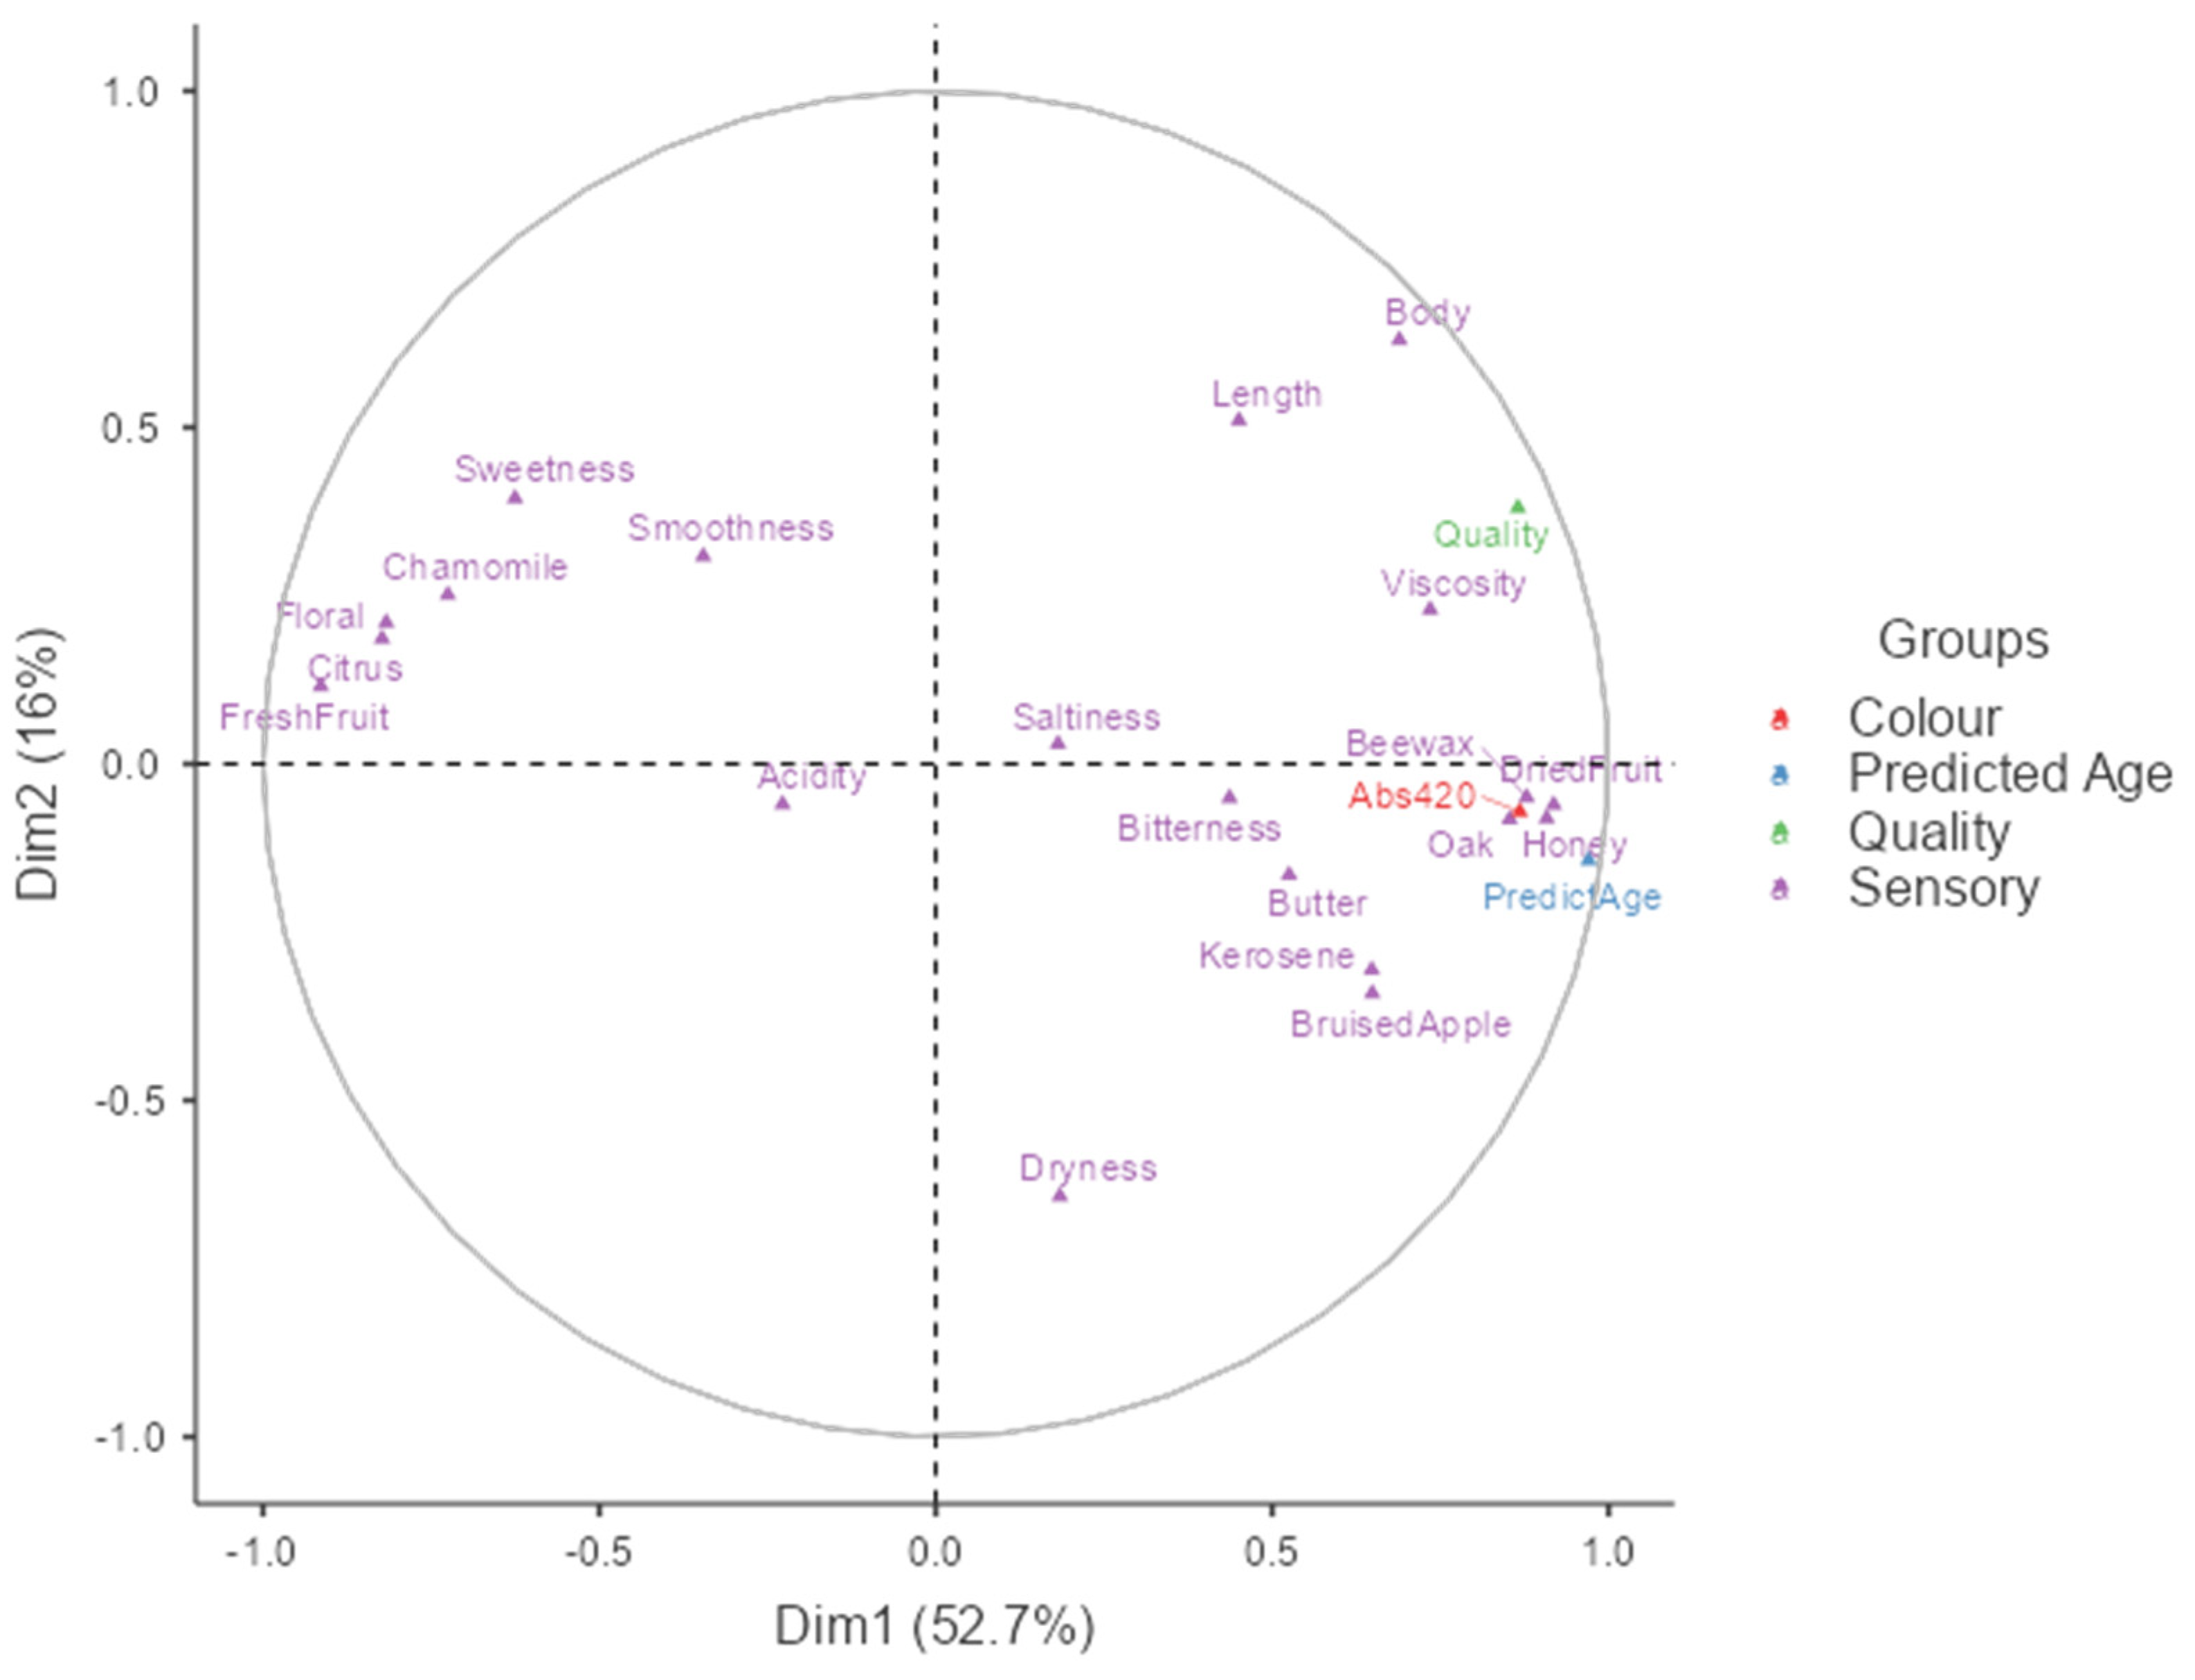
Figure 8.
Multiple Factorial Analysis of dry white wines grouped according to the age perception.
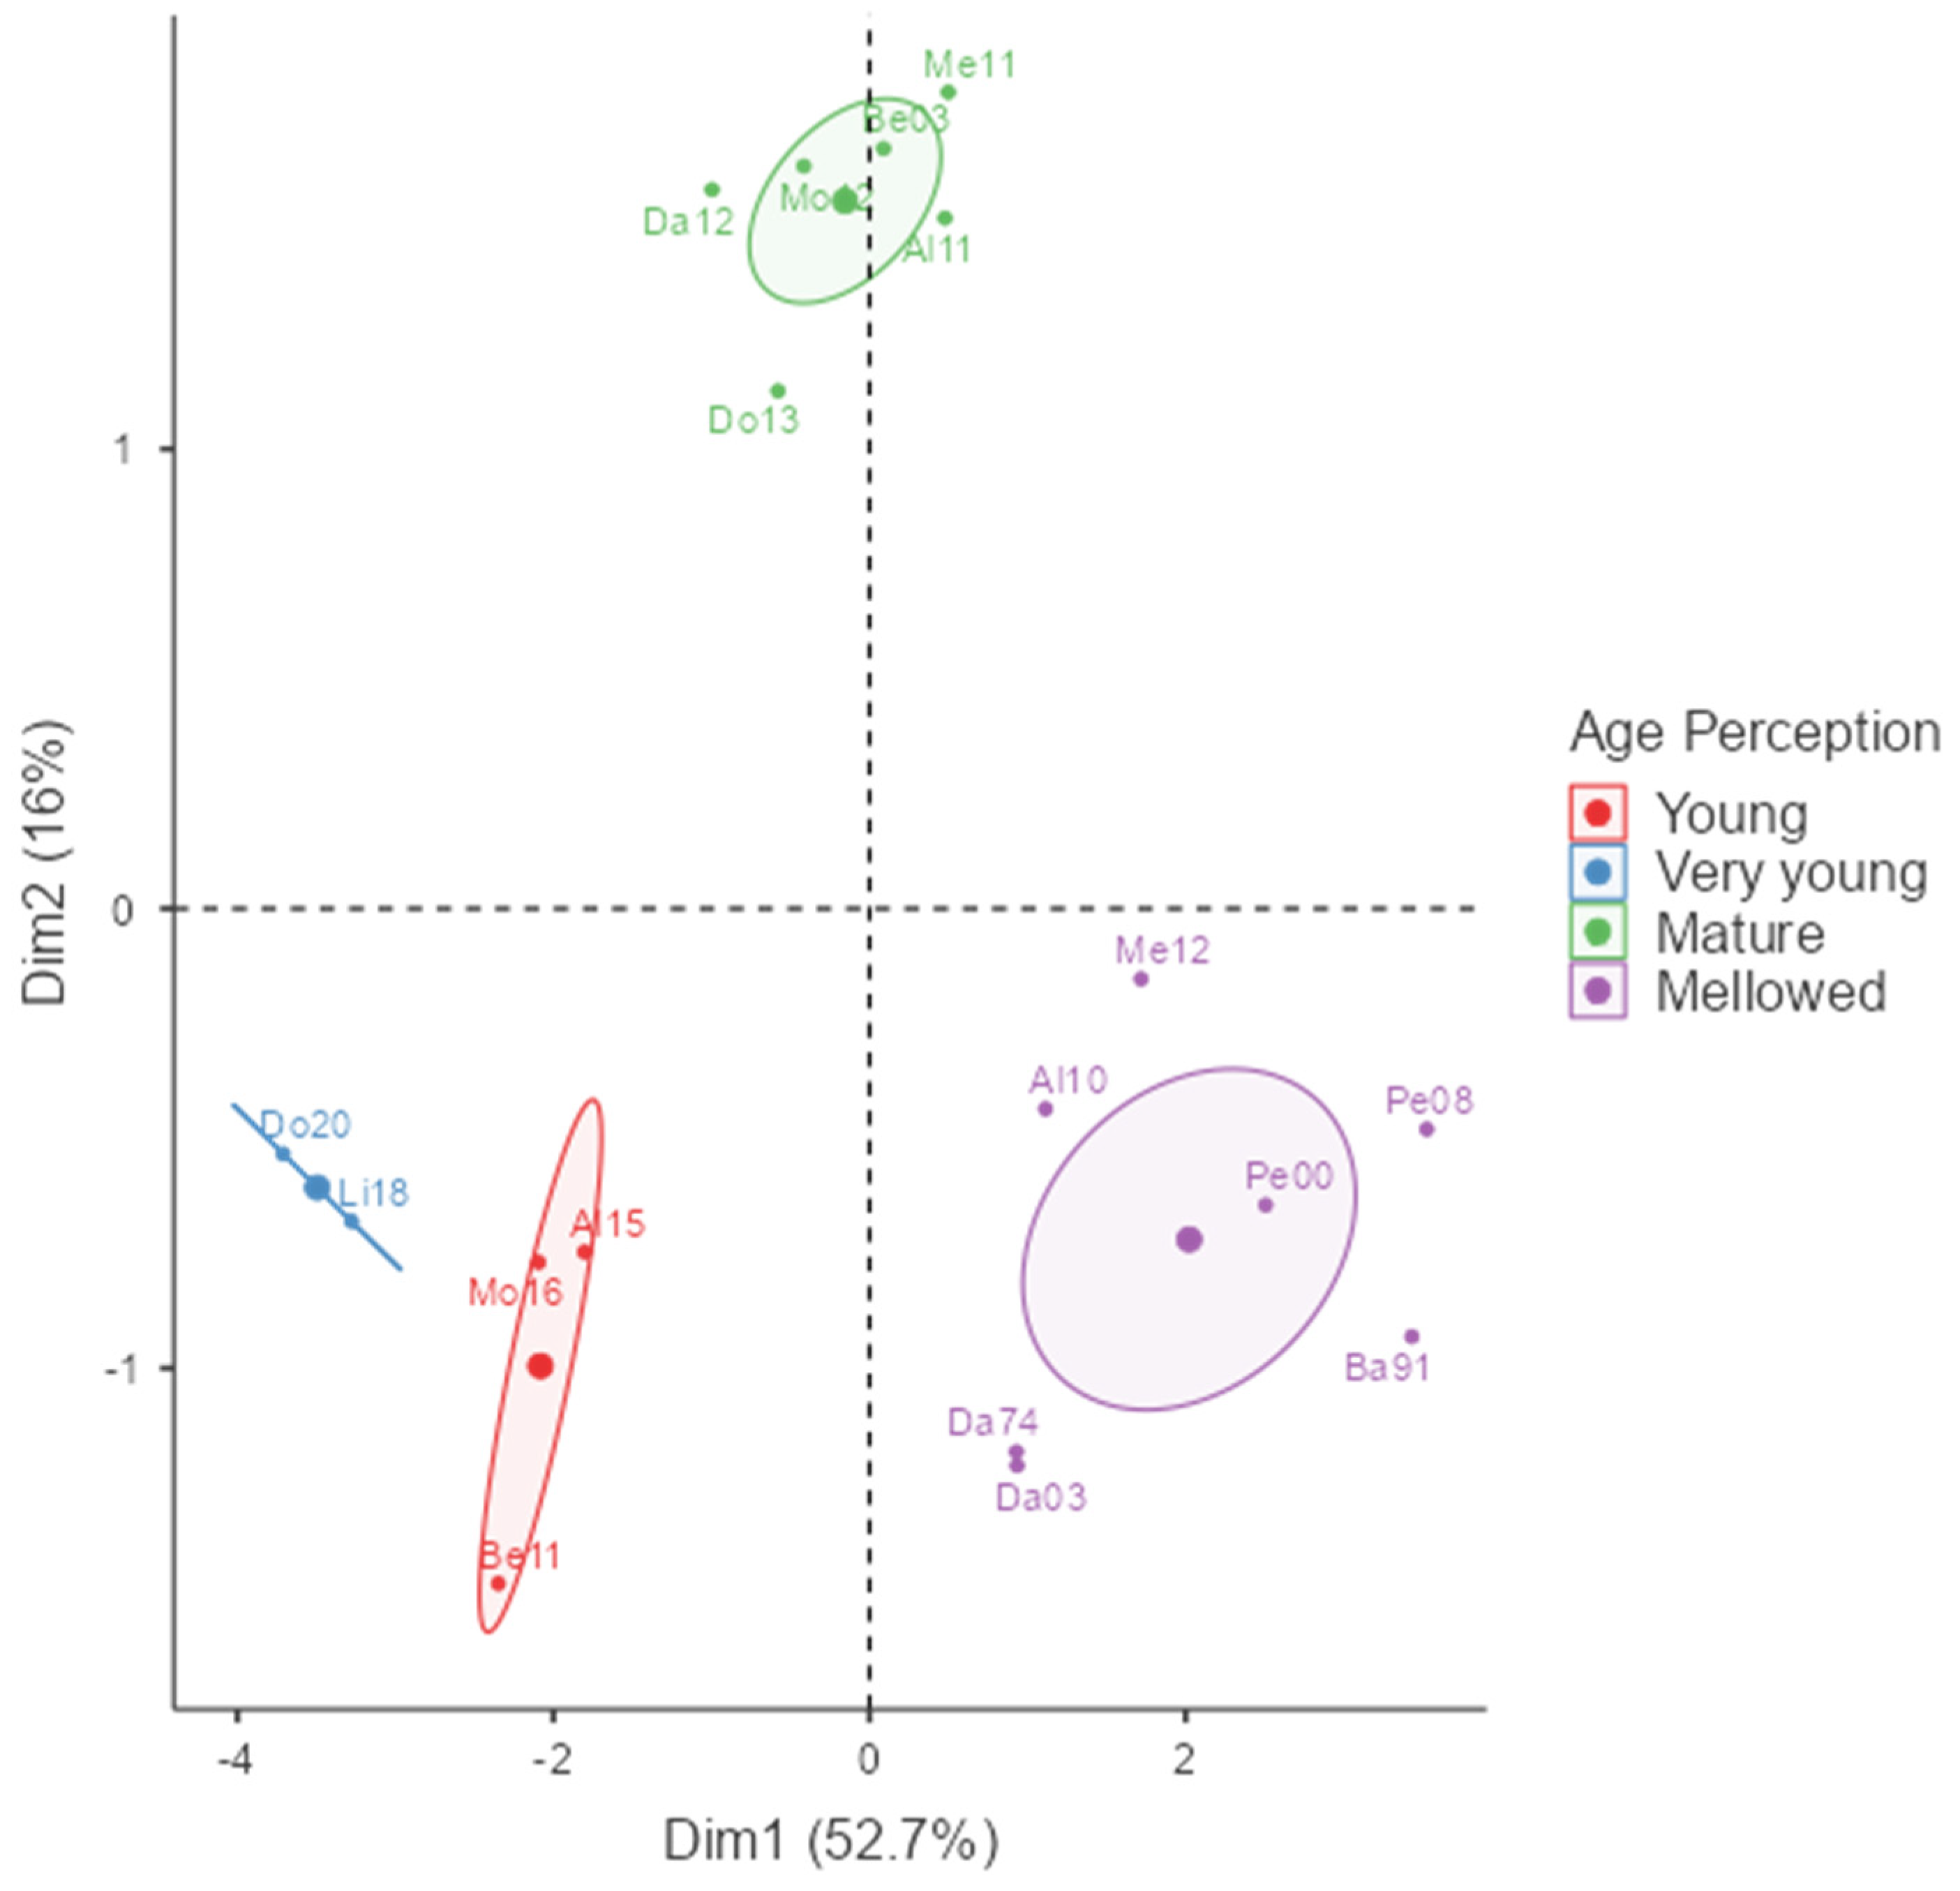

Table 1.
Origin and absorbance (420 nm) of the tasted wines.
| Code | Brand | Company | Region (sub-region) | Year | Absorbance |
|---|---|---|---|---|---|
| WDa74 | Branco Dão | CEVa Nelas | Dão | 1974 | 0.201 |
| WBa91 | Vinhas Velhas | Luís Pato | Bairrada | 1991 | 0.782 |
| WPe00 | Catarina | Bacalhôa | Península de Setúbal | 2000 | 0.484 |
| WDa03 | Casa de Santar | Sociedade Agrícola de Santar | Dão | 2003 | 0.286 |
| WBe03 | Quinta dos Termos | Quinta dos Termos | Beira Interior | 2003 | 0.284 |
| WPe08 | Pasmados | José Maria da Fonseca | Península de Setúbal | 2008 | 0.695 |
| WAl10 | Cartuxa | Fundação Eugénio de Almeida | Alentejo | 2010 | 0.221 |
| WAl11 | Dom Rafael | Herdade do Mouchão | Alentejo | 2011 | 0.266 |
| WBe11 | Quinta Vale do Ruivo | José Madeira Afonso | Beira Interior | 2011 | 0.111 |
| WMe11 | Alvarinho | Quinta do Soalheiro | Verde (Melgaço). | 2011 | 0.379 |
| WDa12 | Pedra Cancela | Lusovini | Dão | 2012 | 0.172 |
| WMo12 | Alvarinho | Palácio da Brejoeira | Verde (Monção) | 2012 | 0.181 |
| WMe12 | Alvarinho | Quinta do Soalheiro | Verde (Melgaço) | 2012 | 0.322 |
| WDo13 | Mau Feitio | Vinilourenço | Douro | 2013 | 0.197 |
| WAl15 | Sericaia | Ares Alentejanos | Alentejo | 2015 | 0.143 |
| WMo16 | Alvarinho | Palácio da Brejoeira | Verde (Monção) | 2016 | 0.151 |
| WLi18 | Quinta do Monte d'Oiro | Quinta do Monte D’Oiro | Lisboa | 2018 | 0.092 |
| WDo20 | Fraga da Galhofa (Moscatel Galego) | Vinilourenço | Douro | 2020 | 0.091 |
| Ro06 | Fraga da Galhofa (Rosé) | Vinilourenço | Douro | 2006 | 0.591 |
| Re74 | Periquita (Red) | José Maria da Fonseca | Península de Setúbal | 1974 | 4.939 |
a State wine research center in Nelas, Dão region.
Table 2.
Chi-square (χ²) values of the scores given to synthetic and aesthetic attributes by the tasting panels to all wines (df, degrees of freedom, significant p-values < 0.05).
Table 2.
Chi-square (χ²) values of the scores given to synthetic and aesthetic attributes by the tasting panels to all wines (df, degrees of freedom, significant p-values < 0.05).
| Attributes | χ² | df | p |
|---|---|---|---|
| Familiarity | 11.9 | 20 | 0.921 |
| Number of Flavours | 15.4 | 20 | 0.751 |
| Ease of Identification | 10.6 | 20 | 0.956 |
| Harmonious | 19.8 | 20 | 0.471 |
| Balance | 26.4 | 20 | 0.152 |
| Linger | 22.1 | 20 | 0.333 |
| Strong/powerful | 24.1 | 20 | 0.238 |
| Complexity | 27.0 | 20 | 0.134 |
| Liking | 29.6 | 20 | 0.076 |
| Quality | 26.1 | 20 | 0.161 |
Table 3.
Correlation (r) between the median quality scores and the rest of the synthetic descriptors and liking. Bold numbers indicate strong correlations using Kendall’s tau-b (> 0.600).
Table 3.
Correlation (r) between the median quality scores and the rest of the synthetic descriptors and liking. Bold numbers indicate strong correlations using Kendall’s tau-b (> 0.600).
| Tasting Panels |
Familiarity | Number of Flavours | Ease of Identification | Harmonious | Balance | Linger | Strong and Powerful | Complexity | Liking |
|---|---|---|---|---|---|---|---|---|---|
| Overall | 0.1931 | 0.4243 | 0.150 | 0.4673 | 0.5803 | 0.6313 | 0.5753 | 0.6623 | 0.7703 |
| Critics | 0.211 | 0.4742 | 0.206 | 0.3581 | 0.5052 | 0.6913 | 0.6003 | 0.7583 | 0.8743 |
| Oenologists | 0.063 | 0.6003 | 0.263 | 0.5893 | 0.7053 | 0.6743 | 0.4842 | 0.7263 | 0.8423 |
| Students | 0.026 | 0.201 | -0.058 | 0.4062 | 0.4802 | 0.185 | 0.180 | 0.5222 | 0.5222 |
1 p < 0.05, 2 p < 0.01, 3 p < 0.001.
Table 4.
Frequency of citation of the perceptual overall clusters.
| Clusters | Descriptors | Predicted age (years) | |||
|---|---|---|---|---|---|
| < 2 | 2-4 | 5-8 | 9-16 | ||
| Freshness | FreshFruit | 23 | 15 | 9 | 1 |
| Floral | 22 | 12 | 12 | 5 | |
| Citrus | 18 | 18 | 12 | 7 | |
| Sweetness | 12 | 7 | 8 | 3 | |
| Chamomile | 13 | 8 | 8 | 4 | |
| Total | 88 | 60 | 50 | 20 | |
| Mature | Kerosene | 1 | 5 | 5 | 8 |
| Bruised apple | 3 | 5 | 5 | 10 | |
| Butter | 3 | 3 | 5 | 8 | |
| Oak | 1 | 4 | 7 | 11 | |
| Beeswax | 2 | 5 | 8 | 12 | |
| Total | 10 | 22 | 28 | 49 | |
| Mellowed | Body | 7 | 7 | 15 | 14 |
| Length | 9 | 11 | 14 | 13 | |
| Viscosity | 4 | 9 | 12 | 12 | |
| Honey | 2 | 6 | 11 | 17 | |
| DriedFruit | 2 | 7 | 11 | 16 | |
| Total | 24 | 40 | 62 | 72 | |
| Austere | Saltiness | 10 | 11 | 12 | 11 |
| Bitterness | 9 | 10 | 10 | 12 | |
| Smoothness | 15 | 10 | 12 | 9 | |
| Dryness | 14 | 15 | 13 | 16 | |
| Acidity | 27 | 26 | 23 | 23 | |
| Total | 75 | 71 | 71 | 72 | |
Table 5.
Average age prediction of the white wines reported by the tasting cohorts.
| Clustera | Wine | Real age | Predicted age | Difference |
|---|---|---|---|---|
| Very young | WDo20 | 0.5 | 1.4 | -0.9 |
| WLi18 | 2.5 | 2.1 | 0.4 | |
| Young | WDo13 | 7.5 | 6.5 | 1.0 |
| WAl15 | 5.5 | 3.4 | 2.1 | |
| WBe11 | 9.5 | 3.7 | 5.8 | |
| Mature | WMe12 | 8.5 | 9.5 | -1.0 |
| WMo16 | 4.5 | 3.8 | 0.7 | |
| WAl11 | 9.5 | 8.3 | 1.2 | |
| WMe11 | 9.5 | 7.2 | 2.3 | |
| WDa12 | 8.5 | 5.0 | 3.5 | |
| WBe03 | 17.5 | 7.0 | 10.5 | |
| Mellowed | WAl10 | 10.5 | 10.7 | -0.2 |
| WPe08 | 12.5 | 13.8 | -1.3 | |
| WMo12 | 8.5 | 7.3 | 1.2 | |
| WPe00 | 20.5 | 13.6 | 6.9 | |
| WDa03 | 18.5 | 10.9 | 7.6 | |
| WBa91 | 29.5 | 16.3 | 13.2 | |
| WDa74 | 46.5 | 10.9 | 35.6 |
Disclaimer/Publisher’s Note: The statements, opinions and data contained in all publications are solely those of the individual author(s) and contributor(s) and not of MDPI and/or the editor(s). MDPI and/or the editor(s) disclaim responsibility for any injury to people or property resulting from any ideas, methods, instructions or products referred to in the content. |
© 2024 by the authors. Licensee MDPI, Basel, Switzerland. This article is an open access article distributed under the terms and conditions of the Creative Commons Attribution (CC BY) license (http://creativecommons.org/licenses/by/4.0/).
Copyright: This open access article is published under a Creative Commons CC BY 4.0 license, which permit the free download, distribution, and reuse, provided that the author and preprint are cited in any reuse.


