Submitted:
02 May 2024
Posted:
02 May 2024
You are already at the latest version
Abstract
In this work SiC-Ti3AlC2 and TiC-Ti3AlC2 composites produced by additive manufacturing are investigated. The fused granules fabrication (FGF) method as one of the material extrusion additive manufacturing (MEAM) technology is used to obtain composite samples. Composites with different ratios between components and different powder:polymer ratios are investigated. The technological features of the additive formation of composites are investigated, as well as their structure and properties. The optimal sintering temperature to form the best mechanical properties for both composites is 1300 °C. The composites have a regulatable porosity. Ti3AlC2 content, sintering temperature, and polymer content in the feedstock are the main parameters that regulates the porosity of FGF samples.
Keywords:
additive manufacturing
; fused granules fabrication
; MAX-phases
; ceramic composites
1. Introduction
Ceramic composites are growing rapidly in today’s world because they provide excellent high temperature properties, provide low coefficients of thermal expansion, and also exhibit high hardness, wear resistance, resistance to thermal cycling, ablation, and other properties [1,2,3]. In this regard, ceramic composites are often used as structural materials, while porous ceramic materials are increasingly being used.
TiC-based ceramics belong to high temperature structural materials and are used in various industries, including aviation and space. TiC has a high melting point (3140 °C) and low density (4.94 g/cm3), this why TiC is attractive as a high-temperature light-weight material. Also TiC ceramic has excellent properties such as high hardness (25.1 GPa), excellent low electrical resistance (68 ·cm), excellent thermal conductivity (21 W·m−1·K−1), high elastic modulus (410–450 GPa) [4,5,6]. Porous TiC have a high specific surface area, high porosity, small bulk density, high temperature resistance and corrosion resistance. Therefore, porous TiC can be used for filtration, separation, catalytic reaction, and for hydrogen storage [7].
SiC-based ceramics are also often used in high temperature applications because they exhibit high melting point, high strength, high thermal conductivity, high hardness (24 GPa), high stiffness, good chemical resistance, good electrical conductivity and remarkable wear resistance [8,9]. Therefore, SiC is often used as heating elements and also has tribological applications. Porous SiC-based materials are distinguished separately [10,11,12,13]. Such materials can be used for further impregnation with a solid lubricant phase during wear operation [14]. Cases of using porous SiC as filters, for example for chlorine, are also described [15].
MAX-phases are ternary carbides and nitrides with formula Mn+1AXn (n = 1, 2, and 3, M is an early transition metal, A is an A group element, and X is C and/or N) are promising materials because of the unique combination of both metals and ceramics properties [16]. The Ti2AlC3 MAX-phase is one of the most promising MAX-phases, since it has good prospects in many fields such as heat exchanger materials, high temperature structural materials, corrosion resistant components and electrical contact material [17]. All these fields are suitable both for TiC and SiC. It is difficult to obtain bulk products from the MAX-phase powders by powder metallurgy methods, in particular, due to the decomposition of the MAX-phase at elevated temperatures [18,19,20]. Due to the fact that the MAX-phase has a layered structure, and its high-temperature molding is impossible due to decomposition processes, products from the MAX-phase are predominantly porous. Using MAX-phase as a component in ceramic composites may be one of the ways to improve MAX-phase high-temperature stability [21,22].
This work investigates SiC-Ti3AlC2 and TiC-Ti3AlC2 composites produced by additive manufacturing. The fused granules fabrication (FGF) method as one of the material extrusion additive manufacturing (MEAM) technology is used. Composites use different ratios between components and different powder:polymer ratios. The technological features of the additive formation of composites are investigated, as well as their structure and properties.
2. Materials and Methods
2.1. Feedstock Preparation
To obtain ceramic compositions, mixtures of Ti3AlC2:SiC (TAC:SiC) and Ti3AlC2:TiC (TAC:TiC) powders were used in different volume ratios TAC:SiC and TAC:TiC (70:30, 50:50, 30:70). The powders used were Ti3AlC2 MAX-phase (Jiangsu XFNANO Materials Tech Co., Ltd, Jiangsu, China; 98% purity, d50 = 5 µm), SiC powder (DENSITEC L, SIKA, Oslo, Norway, d50 = 5 µm), and TiC powder (Reakhim, Smolensk, Russia; d50 = 5 µm). Mixing of the powders was carried out by the dry method in a turbula-type mixer (Turbula S2.0, Vibrotechnik JSC, Saint-Petersburg, Russia). The resulting mixtures were used to prepare feedstock and for spark plasma sintering.
A feedstock was prepared with the MC2162 polymer binder (Emery Oleochemicals, Dusseldorf, Germany). The MC2162 binder is a mixture of polyester and polyamide with a ratio of 1:5 by mass. The amount of polymer was 30, 35 and 40 vol.% for the studied compositions. The dry pre-mixture of powder mixtures with the polymer binder was prepared in a Z-blade mixer SPQ-10 (Welber, Moscow, Russia) with a 60 rev/min rotational speed and a mixing time of 6 h. Premixed material was then extruded in a single-screw extruder LE45–30 (Scientific, Saint-Petersburg, Russia) at 145 °C to obtain a homogeneous feedstock. The extruded filament was cooled and air dried, followed by granulation on a Meizlon MTE20 automated line (Jiangsu Meizlon on Machinery Co. LTD., Jiangsu, China).
2.2. Fabrication of Ceramic Composites
Bulk samples were produced in two ways: additive manufacturing (AM) using the fused granules fabrication (FGF) method and spark plasma sintering (SPS).
To obtain samples using the FGF method, a Bizon-2 3D printer (3DiY, Moscow, Russia) with a custom screw-based pellet-fed printing head was used. Bulk samples were obtained. Open source slicer OrcaSLicer was used to prepare 3D-models for 3D-printing. The printing parameters were varied to obtain a maximum printing density without macro size printing defects. Debinding was carried out in acetone. The debinding duration and process temperature were studied separately. During the debinding process, samples were removed from acetone, dried in a SNOL 7.2 muffle furnace (AB “UMEGA GROUP”, Lithuania, Utena) at 60 °C for 4 hours, then weighed on an OHAUS Adventurer Pro AV264C scale (OHAUS, USA, NJ, Parsippany). After debinding, samples were sintered in a Nabertherm RHTC 80-230/15 vacuum furnace (Nabertherm, Germany) at different temperatures (1250, 1300 and 1350 °C) with 4h dwell time. Heating rate of 5 °C/min was used with additional dwelling at 200, 400, 600 and 800 °C for 1 h.
Spark plasma sintering was performed using SPS 10–4 unit (GT Advanced Technologies, USA, NH, Hudson) at 1200, 1250 and 1300 °C at 50 MPa for 5 min. Cylindrical samples 6 grams each were sintered in crucibles with a diameter of 20 mm.
2.3. Characterization
To characterize the rheological properties of the feedstock, two parameters were used - Melt Flow Index (MFI), measured using Zwick/Cflow plastometer (ZwickRoell GmbH & Co. KG, Germany, Ulm) and Viscosimetry using CR-6000-10 capillary rheometer (Gotech Testing Machines Co. , LTD., Taichung, Taiwan). MFI determination was carried out in accordance with ASTM D1238, and viscometry in accordance with ASTM D3835.
The samples were studied by optical metallography (Axiovert 200-MAT, Carl Zeiss GmbH, Germany) and scanning electron microscopy (Apreo S, Thermo Fisher Scientific, Walthem, MA, USA). For the study, cross-sections were prepared on a disc grinding-polishing machine (Saphir 520, ATM Qness GmbH, Mammelzen, Germany) using SiC paper with a 400–1600 mesh size and diamond discs with a 2000–4000 mesh size.
The phase composition of the samples was studied using an XRD-7000S X-ray diffractometer (Shimadzu, Kioto, Japan) in the Bragg-Brentano configuration using CuK radiation with a long wavelength = 0.154 nm at X-ray tube parameters of 40 kV and 30 mA. For each of the samples, a spectrum was collected with the following parameters: scanning step - 0.0143°; sample scanning speed - 10°/min; range of angles in 2 - 10–90°.
The three-point bending test was performed on a Gotech Al-7000M setup (Gotech Testing Machines Co., LTD., Taichung, Taiwan) with one impact and two supporting rollers. The data collection with 124 Hz frequency was started by Gotech data acquisition at the minimum load on the sample (0.1 N). The loading rate was set up as 0.5 mm/min according to the ASTM E290. The span distance was equal to 22 mm, all samples were located under the middle point of the impact roller. The microhardness of the samples was measured on a microhardness tester (Duramin-500, Struers, Denmark) by the Vickers method (HV) at a load of 500 gf in accordance with ASTM E384.
3. Results and Discussion
3.1. Parameters of Additive Manufacturing
Selection of printing parameters is one of the most important stages in the formation of parts, since it is responsible for formation of non-defective structure and correct geometry of the part. In some cases, the post-processing of printed parts is impossible or very difficult, especially for products with complex geometries, which are advisable to produce using the additive manufacturing technologies. When forming objects, both monolithic and porous, it is important that there are no printing defects, such as delamination, discontinuities, voids and others. To maintain the geometry of the product, it is necessary to correctly calculate the printing algorithm. The calculation is performed automatically using a slicer software. When slicing, it is necessary to take into account the geometric parameters of the object and the printer. In particular, the diameter of the nozzle, the thickness of the layer, the amount of perimeter and others. It is also necessary to take into account the properties of the material (feedstock) - the rheological properties, the optimal printing temperature suitable for this particular material, the extrusion coefficient, which ensures the correct size of the printed in accordance with the 3D model, and other parameters.
The printing parameters are set in the slider software; the real meaning of many parameters remains unclear to the end user. From this point of view, the slicer is a black box for the user. Changes in a number of parameters in the slice are manifested in changes in the rotation speed of the motors (table and extruder). Thus, many parameters specified in the slider are interdependent, and their relationship is hidden from the user.
There are a number of empirical approaches to determining optimal printing parameters. Basically, they are set in the slicer and OrcaSlicer allows you to conduct a series of calibration printing sessions that allow you to identify and optimize printing parameters. Briefly, the procedure for selecting optimal parameters can be described as follows: first, the temperature is selected, since it depends on the polymer binder used. Then the extrusion coefficient is selected, that is, the extrusion value at which the diameter of the extruded line will coincide with the diameter specified in the slicer. And the last thing that is regulated is the flow, that is, the volumetric printing speed. The flow includes the head movement speed, extrusion speed, extrusion width, as well as other parameters responsible for print quality. If the temperature and extrusion ratio are selected correctly, the volumetric flow of the material can be calculated with sufficient accuracy.
The selection of the correct temperature was carried out at the feedstock development stage []. The optimal operating temperature is determined by the properties of the polymer binder. The operating temperature and maximum temperature of the polymer binder are determined by the manufacturer. In our case, when determining the MFI, a temperature of 150 °C was used. During printing experiments, this temperature also proved to be optimal. The extrusion coefficient is calculated on samples that are automatically generated in OrcaSlicer (Figure 1a).
The samples are rectangular plates in which the extrusion coefficient changes. It is necessary to select an extrusion coefficient at which there are no internal macrodefects and compliance with the external geometry of the part is achieved (there is no significant overextrusion). On the samples generated by the slicer, deviations from the specified value of the extrusion coefficient are written as a percentage. In this work, the coefficient 1.3 was used as the initial one (Figure 1c). Thus, the coefficient varied from 1.04 to 1.56 in increments of 0.065. It was found that with a coefficient value of 1.43 (sample +10, Figure 1d), the most dense structure in the cross section is formed. A further increase in extrusion leads to a significant sagging of the side edges, as well as a deterioration in the quality of the top surface. Low extrusion coefficient leads to a critical underextrusion (Figure 1b).
To determine the optimal flow, the standard OrcaSlicer test was used, which involved printing a calibration part in which the volumetric flow of material was varied at each layer (Figure 2). When preparing the test, the initial flow , the final flow , and the step along the flow are specified. After printing, the smoothest layer is visually found, in which there are no printing defects, in particular underextrusion or overextrusion. The height h from the substrate to the layer in millimeters is calculated, and the optimal flow f is calculated using the Formula (1).
To calibrate the flow, the parameters = 1 mm3/s, = 10 mm3/s, = 0.25 mm3/s were used. The test showed that the skips begin at a height h = 18 mm, which gives a flow value of f = 5.5 mm3/s. A 10% flux margin was used in the work, so a flux of f = 5.0 mm3/s was used. Setting the extrusion ratio and flow is enough for the slicer to form the remaining printing parameters. If high-precision printing of samples is necessary, it is necessary to additionally calibrate Pressure advance, Tolerance test and others, however, they do not affect the structure of bulk samples and were not studied in this work. The following fixed printing parameters were used in the work: nozzle diameter 0.8 mm, layer thickness 0.2 mm, table heating was not used. These parameters were used to print the sample (Figure 3).
3.2. Debinding
Debinding parameters must be selected individually for different materials. The main purpose of debinding is the complete removal of the soluble polymer binder. The polymer binder we use is soluble in acetone, which is why it is used for debinding. Obtaining dense, defect-free green samples is important for the debinding stage, since internal cavities when filled with acetone are difficult to free from acetone in the future. As a result, during the sintering process, acetone boils inside the sample, which leads to the formation of large macrodefects up to the complete destruction of the samples. At the stage of forming the green part, parameters for dense printing of the samples were selected, which improves the quality of the samples after debinding and prevent destruction.
The work carried out studies of the effect of acetone temperature on the debinding speed, and also investigated the required debinding time for complete removal of the binder in the samples. Debinding was studied in acetone at room temperature, in acetone heated up to 35 °C and 45 °C (Figure 4a). It was found that temperature accelerates debinding in the initial stages, after which the difference in the rate of binder removal is almost equalized. Thus, the option of debinding at room temperature is optimal, taking into account the absence of energy consumption for multi-day heating of acetone.
The decrease in mass over a 12-hour period varies with time (Figure 4b). The change in was calculated using Formula (2).
where is the mass value in the current time period, is the mass value in the previous time period. The resulting graph is a numerical derivative of the graph of mass changes during the debinding process. The resulting graph of the derivative is smooth, which indicates a uniform decrease in mass. After 108 hours (3.5 days) of debinding at all temperatures, the change in mass over a 12-hour cycle is less than 1%. After 132 hours (5.5 days) of debinding at all temperatures, the change in mass over a 12-hour cycle is less than 0.1%.
Monitoring of changes in mass during the debinding process was carried out on samples every 12 hours. Therefore, all samples were subject to a minimum number of 12-hour cycles required to remove <1% binder. For all samples, it took at least 7 cycles (84 hours or 3.5 days) to reach 1%. A higher binder removal rate is demonstrated by samples with a large amount of polymer (Powder:Polymer ratio = 60:40) and by samples with a large amount of TAC. The first group has a higher debinding rate due to the fact that more polymer is available for removal due to the small amount of powder. In such samples, the powders are less likely to prevent penetration into the sample and are less effective at retaining acetone inside during drying. Since TAC has a layered, angular morphology, samples with it has a lower bulk density and also allows the formation of larger polymer layers, which are more easily removed during the debinding process.
Taking into account the obtained dependence for all compositions and the fact that after 5.5 days the rate of mass change is less than 0.1% per 12 hours, during the experiment a fixed debinding time was used for all compositions - 6 days.
3.3. Structure, Phase Composition and Mechanical Properties
3.3.1. TiC-Containing Composites
The samples after debinding were sintered at different temperatures. The temperature range of 1200 – 1300 °C was used, since in this range the decomposition of the MAX phase begins, and TiC and SiC powder is sintered. The same sintering temperatures were chosen for SPS. The idea was to form a sintered skeleton and ensure that the sample did not collapse as a result of incorrect printing and debinding parameters.
In FGF TiC:TAC samples, after sintering, a structure with submicron sized elements is formed (Figure 6a,b). Submicron pores are visible on the fracture and on the cross-section. At low magnification, the polished section and the fracture are practically the same in morphology; the polished sample is matte and does not shine. The mechanics of sample wear during grinding and polishing is such that TiC particles are completely torn out of the sample, since their wear resistance to diamonds in the polishing paste is higher than the sintering strength in the skeleton. As a result of sintering, the TAC decomposes into TiC and Al, and tin is also released, which is used as an additive that suppresses the growth of the Ti2AlC phase during the synthesis of Ti3AlC2 [23]. Thus, the structure is represented mainly by TiC particles and preserved particles of the MAX phase.
The samples obtained by SPS retain much more of the MAX phase, which is clearly visible on the fracture surface of the samples (Figure 6c). With SPS, the sintering time is 5 minutes, but the intensity of the impact is higher, which is determined by the peculiarities of the technology. As a result, the density of the samples is higher - the porous structure as of FGF samples is not observed.
Despite the formed highly porous skeleton, the bending strength of FGF samples after sintering reaches 784 ± 9 MPa for compositions with excess TiC after sintering at 1300 °C (Figure 7). An increase in sintering temperature leads to an increase in bending strength for samples of all compositions. At the same time, samples with excess TAC have a bending strength of less than 40 MPa for all compositions and temperatures. As a result of the decomposition of TAC, TiC carbide is formed, which must undergo sintering to form a strong skeleton. Since the processes of decomposition of the MAX phase and sintering of TiC as a product of decomposition of the MAX phase are slower than the sintering of the original TiC, the strength of the sintered skeleton is lower. In addition, the sintering kinetics of TiC [24] is higher than the sintering kinetics of TAC [25], which increases the strength of a sample with a higher TiC content even without taking into account the decomposition of TAC.
If we consider samples with the same TiC:TAC ratio, sintered at the same temperature, it turns out that the less polymer in the initial feedstock, the higher the strength of the samples can be achieved. When forming a product from feedstock, macroscopic regions are inevitably formed that contain only polymer and no powder particles. After debinding, these areas turn into voids that are not filled with material. Sintering does not allow these voids to be completely filled, despite the fact that the shrinkage of the samples after sintering is comparable to the volume filled with the polymer. Thus, for samples with 30 vol.% polymer, the shrinkage of the sintered product relative to the green one is 24 ± 3%. For samples with 40 vol.% polymer – 29 ± 4%. Thus, the less polymer in the original feedstock and green part, the more dense the part with a stronger skeleton can be obtained.
3.3.2. SiC-Containing Composites
For SiC:TAC samples, feedstocks with only Powder:Polymer volume ratio = 70:30 were used, since lower powder load leads to the formation of high-porous samples which are very brittle for further investigation. Sintering of dense SiC samples is carried out at high temperatures - usually at least 1700 °C, the optimal range is 1900-2100 °C, and it is necessary to use additives to achieve high density [26,27,28]. It is possible to obtain porous SiC starting from a temperature of 1200 °C [29], while the structure and strength properties of the samples are significantly lower than those of densely sintered ones. However, the scope of application of such materials (catalyst supports, high-temperature filters and others) does not require high mechanical properties.
Like TiC:TAC composites, the morphology of the cross-section and the fracture surface are close to each other. SEM images (Figure 8) at low magnification show that there are no printing defects in the samples - there are no known macrodefects of FGF samples with incorrect printing modes. There are also no cracks that could form as a result of improper debinding procedure.
The microstructure of the samples is represented by micron SiC particles with submicron TiC satellites, as well as micron TAC particles. The main skeleton of the sample is formed by SiC particles, while TAC and its decomposition products are distributed along the boundaries of the skeleton particles and increase its strength. In samples obtained by the SPS method, as in TiC:TAC composites, more initial particles of the MAX phase are present, and the structure is less porous.
XRD phase analysis shows (Figure 9) four main phases present in the material - the initial components (TAC and SiC) and the decomposition products of TAC (TiC and Sn). The Sn phase is actually a Sn-Al solid solution based on Sn. Since there is no TiC in the reagents in the SiC:TAC composite, all TiC detected by XRD is a product of TAC decomposition. Judging by the XRD patterns, the decomposition of TAC is at its initial stage and a large amount of the original TAC phase is present in the composite. The ratio of SiC to other components corresponds to that calculated for the original samples.
The greater the open porosity of the resulting materials, the more TAC was used in the initial feedstock (Figure 10). In addition to the difference in sintering kinetics, as in the case of TiC, the SiC:TAC composite adds the mutual chemical inertness of SiC and TAC. Cases of mutual interaction in the Ti3AC2 system (A= Al, Si) are considered in the literature [30,31]. It is indicated that the Ti-Si bond in such compounds is stronger than the Ti-Al bond. Thus, when free Si and Ti3AlC2 interact, the formation of Ti3SiC2 should be expected. Since the Gibbs free energy at 1300 °C (1573 K) for SiC [32] is much lower than for Ti3AlC2 [33], the transition of Si to the MAX phase is thermodynamically impossible under equilibrium or quasi-equilibrium conditions. In this work, XRD also does not reveal the formation of the Ti3SiC2 phase, as well as the decomposition products of SiC. The main contribution to the strength properties of the composite comes from the sintering of the SiC skeleton. Sintering of TiC is slower and requires higher sintering temperatures, but increases the strength of the sintered skeleton if TAC does not limit contact between SiC particles.
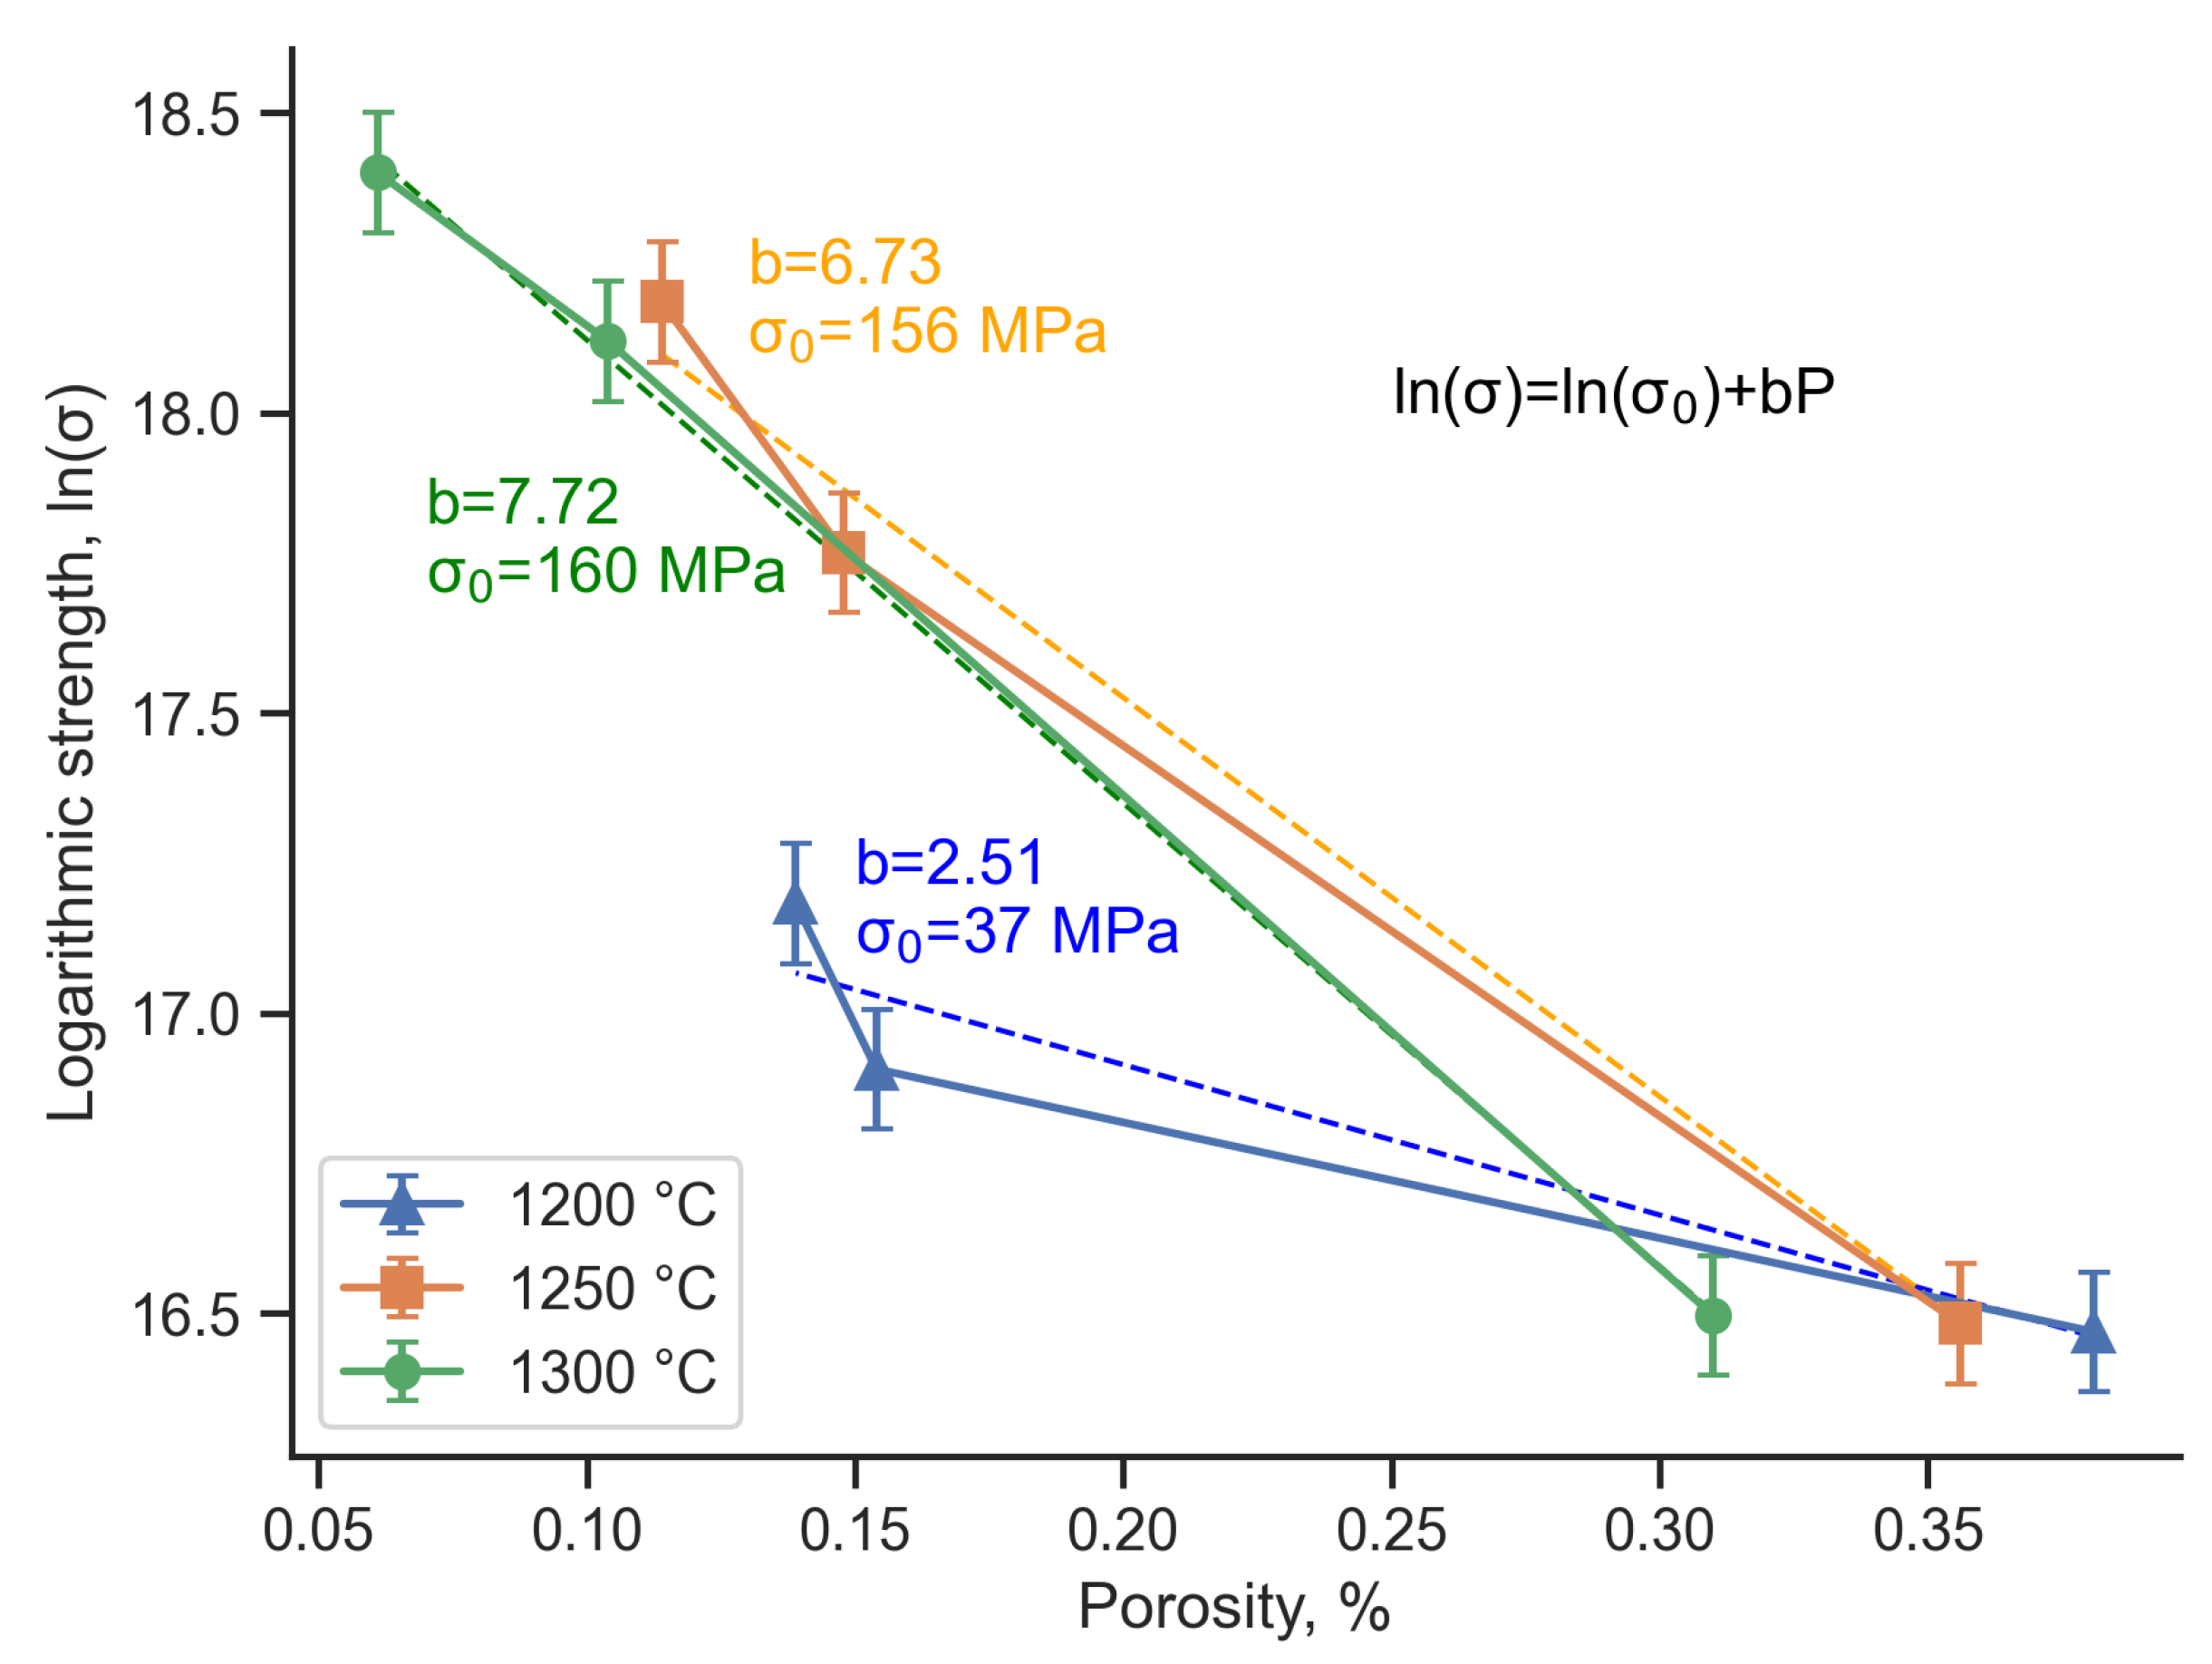
A decrease in the porosity of the composite leads to an increase in its flexural strength (Figure 10). In this case, the sintering temperature has a greater effect on strength than on porosity. The flexural strength of the composite with TAC excess does not exceed 20 MPa for all sintering temperatures. With increasing SiC content and increasing temperature, the sintering kinetics increases, which increases the strength and reduces the porosity of the composite. Thus, the use of TAC in this case can be considered as an additional factor in adjusting the porosity of the composite along with the main factors - sintering temperature and polymer content in the feedstock. The resulting strength-porosity relationship can be approximated using the minimum solid area model [34,35,36], which is described by the formula 3:
Where is the measured strength of porous structure, is the calculated strength of nonporous structure, P is the measured porosity, and b is a parameter determined by pore characteristics and particles stacking type. In this work, it is assumed that a change in the initial composition will continue to have the same effect on porosity as in the studied range, since the author of the model assumes a constant composition. This assumption is acceptable since we do not consider various factors influencing porosity separately, but observe the general trend of its change. However, in the future, we plan to construct a larger number of experimental points for additional verification.
The results obtained indicate that temperature significantly affects the strength properties of the composite (Figure 11). A change in coefficient b also indicates a change in packing during the sintering process, depending on temperature. For samples sintered at 1300 °C, the calculated of the non-porous state is 156 MPa, which is comparable with the literature data [37,38,39]. For samples sintered at 1200 °C, the calculated is 37 MPa, which is a low value for SiC-based composites, and is primarily due to the low intensity of sintering at this temperature.
4. Conclusions
- -
- FGF-samples of TiC:TAC and SiC:TAC composites were succesfully printed without any macroscopic printing defects. Minimum debinding time for samples with mm cross-section that is enough to remove 99% of polymer is 84 hours. The optimal sintering temperature to form the best mechanical properties for both TiC:TAC and SiC:TAC composites is 1300 °C.
- -
- Both SiC:TAC and TiC:TAC samples are porous and the more TAC is in the sample the more porous it is. Thus, TAC content, sintering temperature, and polymer content in the feedstock are the main parameters that regulates the porosity of FGF samples.
Author Contributions
Conceptualization M.K.; Methodology, M.K., G.K. and E.R.; Formal analysis, E.R.; Investigation, M.K., G.K. and E.R.; Resources, M.K.; Data curation, E.R.; Writing – original draft, M.K., G.K. and E.R.; Visualization, M.K.; Project administration, M.K. All authors have read and agreed to the published version of the manuscript.
Funding
The research was performed with the financial support of a grant from the Russian Science Foundation (Project No. 22-79-00086), https://rscf.ru/en/project/22-79-00086/ (accessed on 19 April 2024).
Data Availability Statement
The data presented in this study are available on request from the corresponding author. The data are not publicly available due to ethical reasons.
Conflicts of Interest
The authors declare no conflicts of interest.
References
- Ni, D.; Cheng, Y.; Zhang, J.; Liu, J.X.; Zou, J.; Chen, B.; Wu, H.; Li, H.; Dong, S.; Han, J.; others. Advances in ultra-high temperature ceramics, composites, and coatings. Journal of Advanced Ceramics 2022, 11, 1–56. [Google Scholar] [CrossRef]
- Sun, J.; Ye, D.; Zou, J.; Chen, X.; Wang, Y.; Yuan, J.; Liang, H.; Qu, H.; Binner, J.; Bai, J. A review on additive manufacturing of ceramic matrix composites. Journal of Materials Science & Technology 2023, 138, 1–16. [Google Scholar]
- Qinglong, A.; Jie, C.; Weiwei, M.; Ming, C. Machining of SiC ceramic matrix composites: A review. Chinese Journal of Aeronautics 2021, 34, 540–567. [Google Scholar]
- Wei, S.; Xu, B.Q.; Bin, Y.; Sun, H.Y.; Song, J.X.; Wan, H.L.; Dai, Y.N. Preparation of TiC powders by carbothermal reduction method in vacuum. Transactions of Nonferrous Metals Society of China 2011, 21, 185–190. [Google Scholar]
- Zhang, H.; Li, F.; Jia, Q.; Ye, G. Preparation of titanium carbide powders by sol–gel and microwave carbothermal reduction methods at low temperature. Journal of Sol-Gel Science and Technology 2008, 46, 217–222. [Google Scholar] [CrossRef]
- Nguyen, V.H.; Delbari, S.A.; Asl, M.S.; Van Le, Q.; Shokouhimehr, M.; Namini, A.S.; Mohammadi, M. Microstructure–property correlation in nano-diamond and TiN added TiC-based ceramics. Ceramics International 2021, 47, 449–460. [Google Scholar] [CrossRef]
- Ishizaki, K.; Komarneni, S.; Nanko, M. Porous Materials: Process technology and applications; Vol. 4, Springer science & business media, 2013.
- Choyke, W.; Pensl, G. Physical properties of SiC. Mrs Bulletin 1997, 22, 25–29. [Google Scholar] [CrossRef]
- Snead, L.L.; Nozawa, T.; Katoh, Y.; Byun, T.S.; Kondo, S.; Petti, D.A. Handbook of SiC properties for fuel performance modeling. Journal of nuclear materials 2007, 371, 329–377. [Google Scholar] [CrossRef]
- Ishizaki, K.; Komarneni, S.; Nanko, M. Porous Materials: Process technology and applications; Vol. 4, Springer science & business media, 2013.
- Taslicukur, Z.; Balaban, C.; Kuskonmaz, N. Production of ceramic foam filters for molten metal filtration using expanded polystyrene. Journal of the European Ceramic Society 2007, 27, 637–640. [Google Scholar] [CrossRef]
- Sun, B.; Fan, T.; Zhang, D. Porous TiC ceramics derived from wood template. Journal of Porous Materials 2002, 9, 275–277. [Google Scholar] [CrossRef]
- Gringoz, A.; Glandut, N.; Valette, S. Electrochemical hydrogen storage in TiC0. 6, not in TiC0. 9. Electrochemistry Communications 2009, 11, 2044–2047. [Google Scholar] [CrossRef]
- Sang, K.; Lü, Z.; Jin, Z. A study of the SiC-L composite ceramics for self-lubrication. Wear 2002, 253, 1188–1193. [Google Scholar] [CrossRef]
- Gao, F.; Lu, J.; Liu, W. Tribological behavior of carbide-derived carbon coating on SiC polycrystal against SAE52100 steel in moderately humid air. Tribology Letters 2007, 27, 339–345. [Google Scholar] [CrossRef]
- Barsoum, M.W. The MN+ 1AXN phases: A new class of solids: Thermodynamically stable nanolaminates. Progress in solid state chemistry 2000, 28, 201–281. [Google Scholar] [CrossRef]
- Barsoum, M.W. The MN+ 1AXN phases: A new class of solids: Thermodynamically stable nanolaminates. Progress in solid state chemistry 2000, 28, 201–281. [Google Scholar] [CrossRef]
- Li, S.B.; Zhai, H.X.; Bei, G.P.; Zhou, Y.; Zhang, Z.L. Synthesis and microstructure of Ti3AlC2 by mechanically activated sintering of elemental powders. Ceramics international 2007, 33, 169–173. [Google Scholar] [CrossRef]
- Wang, X.; Zhou, Y. Stability and selective oxidation of aluminum in nano-laminate Ti3AlC2 upon heating in argon. Chemistry of materials 2003, 15, 3716–3720. [Google Scholar] [CrossRef]
- Pang, W.K.; Low, I.M.; Sun, Z.M. In situ high-temperature diffraction study of the thermal dissociation of Ti3AlC2 in vacuum. Journal of the American Ceramic Society 2010, 93, 2871–2876. [Google Scholar] [CrossRef]
- Ruan, M.M.; Feng, X.M.; Ai, T.T.; Yu, N.; Hua, K. Microstructure and mechanical properties of TiC/Ti3AlC2 in situ composites prepared by hot pressing method. Materials Science Forum. Trans Tech Publ, 2015, Vol. 816, pp. 200–204.
- Chen, W.; Chen, J.; Zhu, M.; Zheng, J.; Ma, N.n.; Liu, X.; Chen, Z.; Huang, Z. Fabrication of SiC ceramics with invariable value resistivity in the range of 20–400℃ using MAX phase-Ti3AlC2 additives. Journal of the European Ceramic Society 2021, 41, 6248–6254. [Google Scholar] [CrossRef]
- Mingxing, A.; Hongxiang, Z.; Yang, Z.; Zhaoyun, T.; Zhenying, H.; Zhili, Z.; Shibo, L. Synthesis of Ti3AlC2 powders using Sn as an additive. Journal of the American Ceramic Society 2006, 89, 1114–1117. [Google Scholar] [CrossRef]
- Vasanthakumar, K.; Bakshi, S.R. Effect of C/Ti ratio on densification, microstructure and mechanical properties of TiCx prepared by reactive spark plasma sintering. Ceramics International 2018, 44, 484–494. [Google Scholar] [CrossRef]
- Panigrahi, B.B.; Gracio, J.J.; Chu, M.C.; Cho, S.J.; Reddy, N.S. Powder Synthesis, Sintering Kinetics, and Nickel-Activated Pressureless Sintering of Ti3AlC2. International Journal of Applied Ceramic Technology 2010, 7, 752–759. [Google Scholar] [CrossRef]
- Omori, M.; Takei, H. Pressureless sintering of SiC. Journal of the American Ceramic Society 1982, 65, c92–c92. [Google Scholar] [CrossRef]
- Raju, K.; Yoon, D.H. Sintering additives for SiC based on the reactivity: A review. Ceramics International 2016, 42, 17947–17962. [Google Scholar] [CrossRef]
- TANAKA, H. Sintering of silicon carbide and theory of sintering. Journal of the Ceramic Society of Japan 2002, 110, 877–883. [Google Scholar] [CrossRef]
- Chi, W.; Jiang, D.; Huang, Z.; Tan, S. Sintering behavior of porous SiC ceramics. Ceramics International 2004, 30, 869–874. [Google Scholar] [CrossRef]
- Zhou, Y.; Sun, Z.; Wang, X.; Chen, S. Ab initio geometry optimization and ground state properties of layered ternary carbides Ti3MC2 (M= Al, Si and Ge). Journal of Physics: Condensed Matter 2001, 13, 10001. [Google Scholar]
- Zhang, H.; Wang, S. First-principles study of Ti3AC2 (A= Si, Al)(0 0 1) surfaces. Acta Materialia 2007, 55, 4645–4655. [Google Scholar] [CrossRef]
- Kleykamp, H. Gibbs energy of formation of SiC: A contribution to the thermodynamic stability of the modifications. Berichte der Bunsengesellschaft für physikalische Chemie 1998, 102, 1231–1234. [Google Scholar] [CrossRef]
- Zhu, C.C.; Zhu, J.; Wu, H.; Lin, H. Synthesis of Ti 3 AlC 2 by SHS and thermodynamic calculation based on first principles. Rare Metals 2015, 34, 107–110. [Google Scholar] [CrossRef]
- Rice, R. Evaluation and extension of physical property-porosity models based on minimum solid area. Journal of materials science 1996, 31, 102–118. [Google Scholar] [CrossRef]
- Rice, R. Comparison of physical property-porosity behaviour with minimum solid area models. Journal of Materials Science 1996, 31, 1509–1528. [Google Scholar] [CrossRef]
- Li, J.; Lin, H.; Li, J. Factors that influence the flexural strength of SiC-based porous ceramics used for hot gas filter support. Journal of the European Ceramic Society 2011, 31, 825–831. [Google Scholar] [CrossRef]
- Salvo, M.; Rizzo, S.; Casalegno, V.; Handrick, K.; Ferraris, M. Shear and bending strength of SiC/SiC joined by a modified commercial adhesive. International Journal of Applied Ceramic Technology 2012, 9, 778–785. [Google Scholar] [CrossRef]
- Vargas-Gonzalez, L.; Speyer, R.F.; Campbell, J. Flexural strength, fracture toughness, and hardness of silicon carbide and boron carbide armor ceramics. International Journal of Applied Ceramic Technology 2010, 7, 643–651. [Google Scholar] [CrossRef]
- Gulden, T. Mechanical Properties of Polycrystalline β-SiC. Journal of the American Ceramic Society 1969, 52, 585–590. [Google Scholar] [CrossRef]
Figure 1.
Slicered calibration model (a) and cross-sections of samples, obtained with extrusion coefficient 1.04 (b), 1.30 (c) and 1.43 (d)
Figure 1.
Slicered calibration model (a) and cross-sections of samples, obtained with extrusion coefficient 1.04 (b), 1.30 (c) and 1.43 (d)
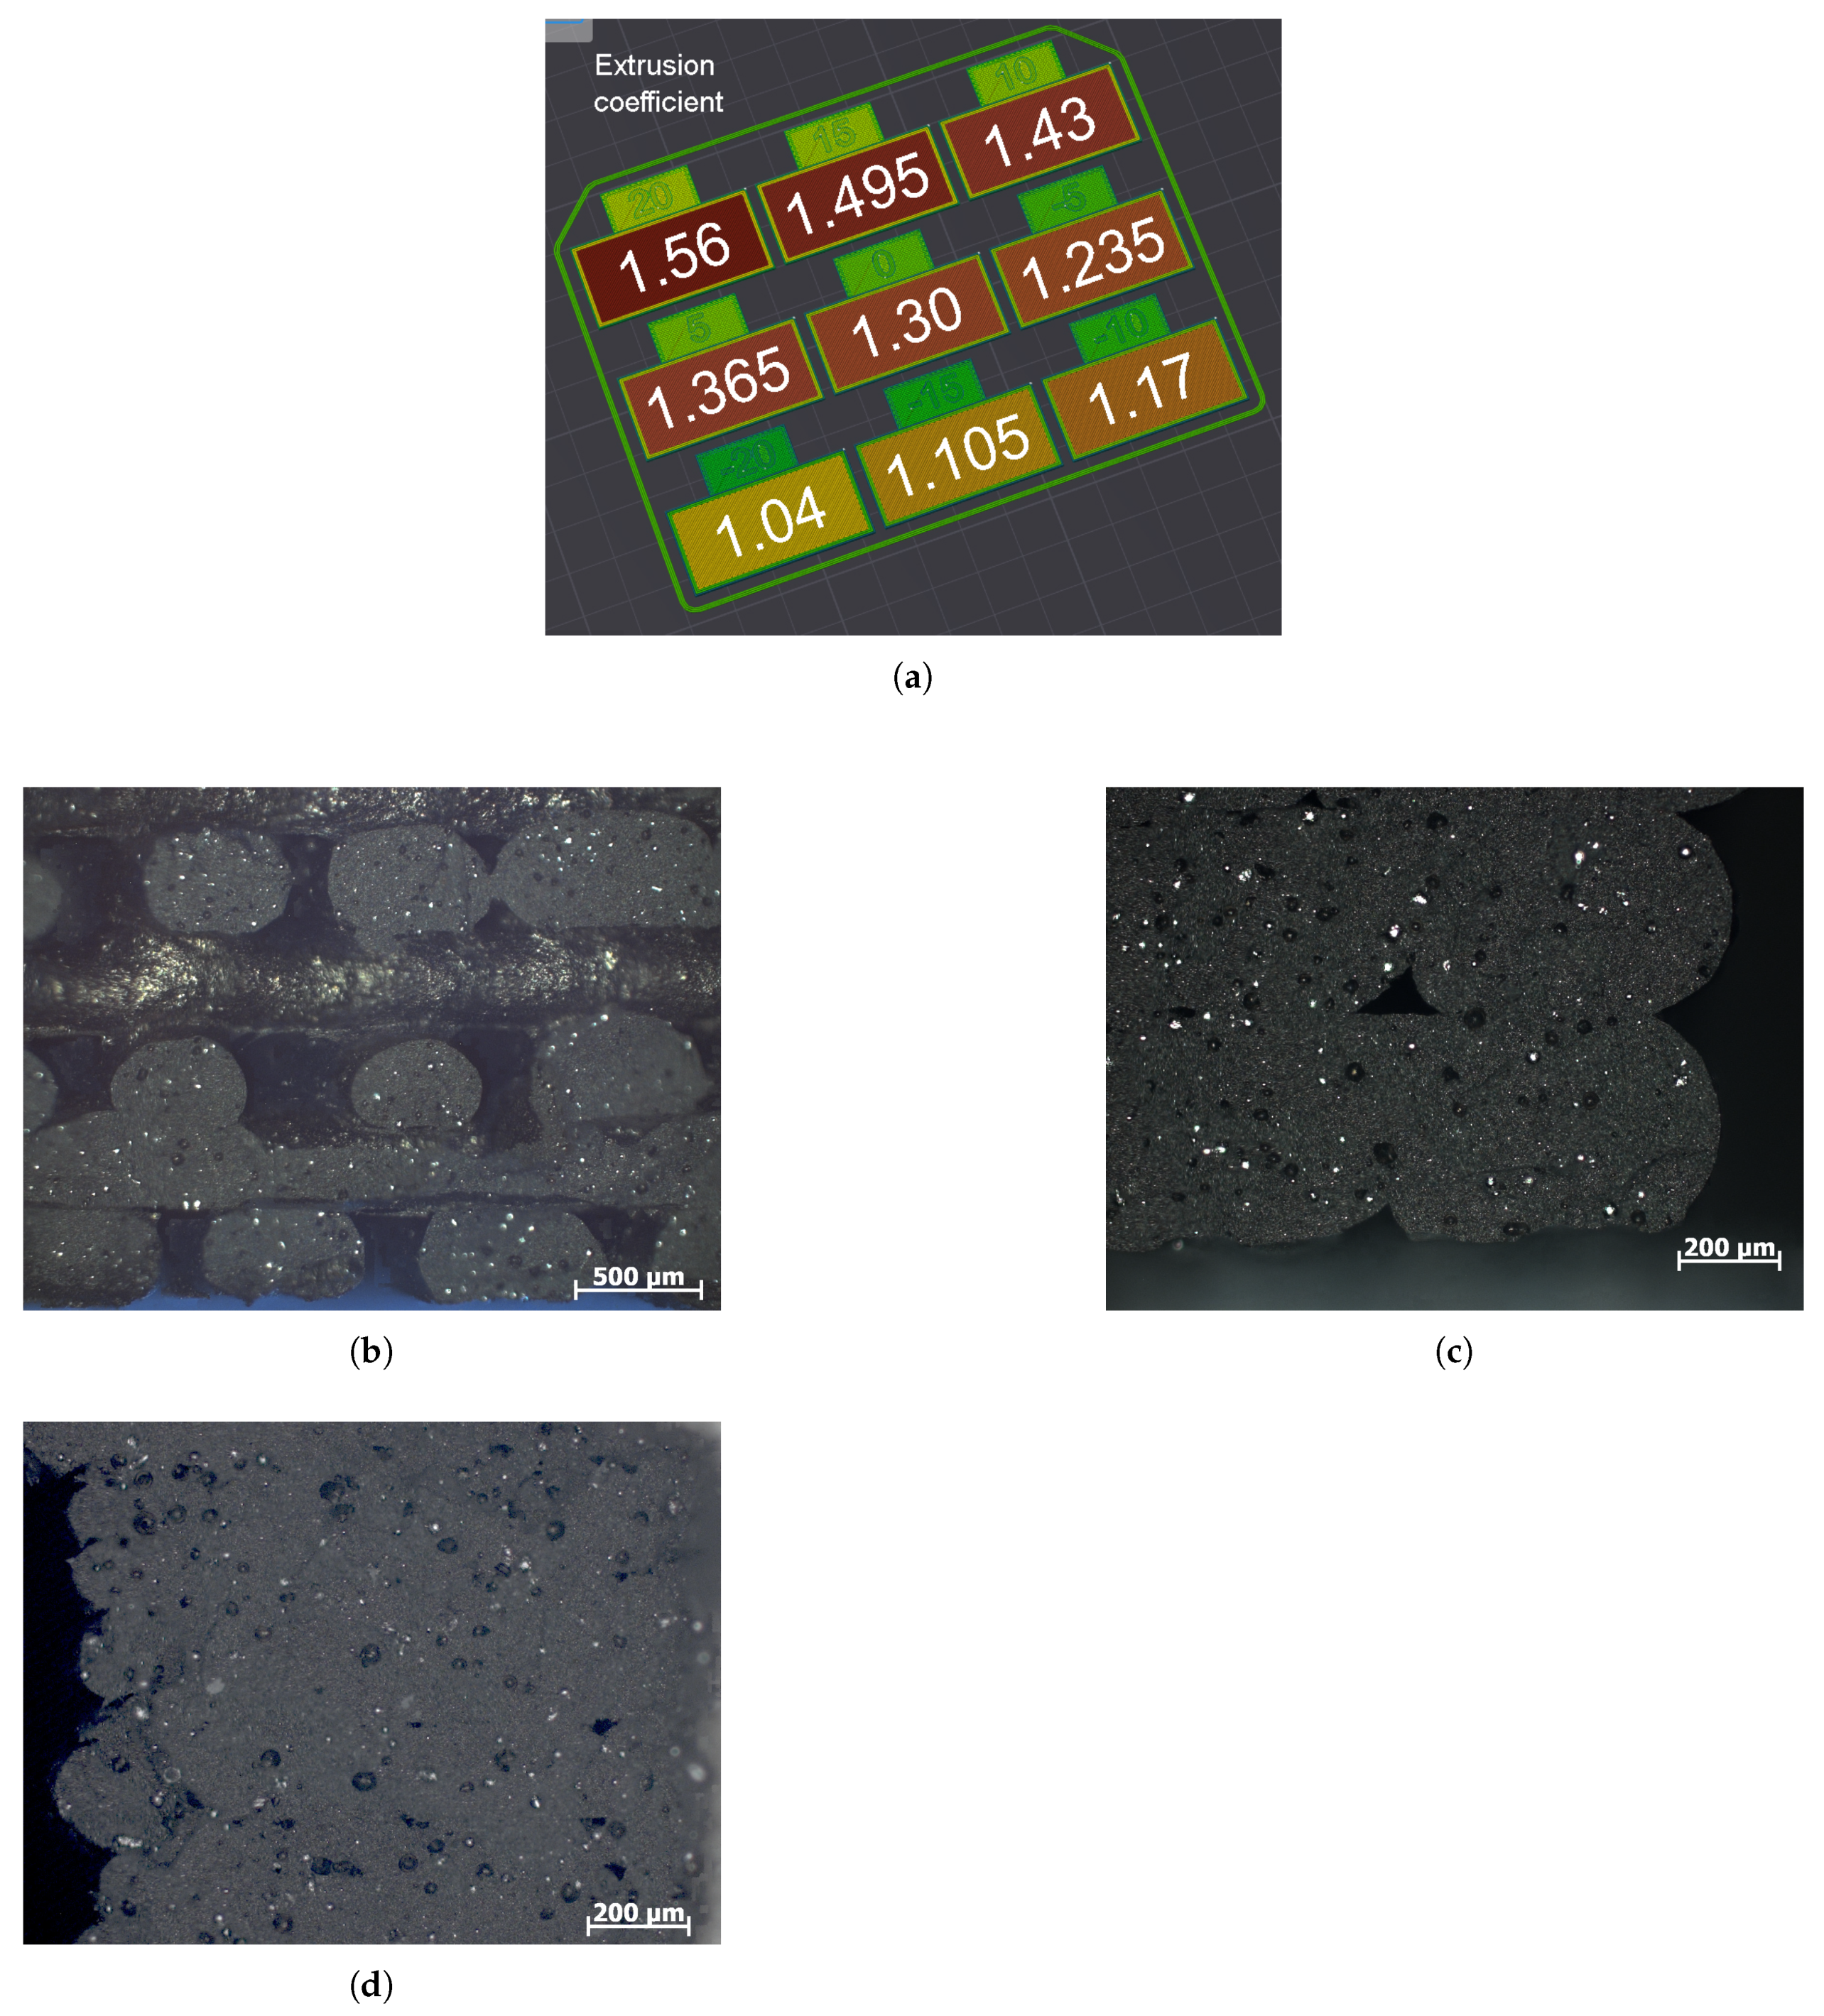
Figure 2.
Flow calibration model
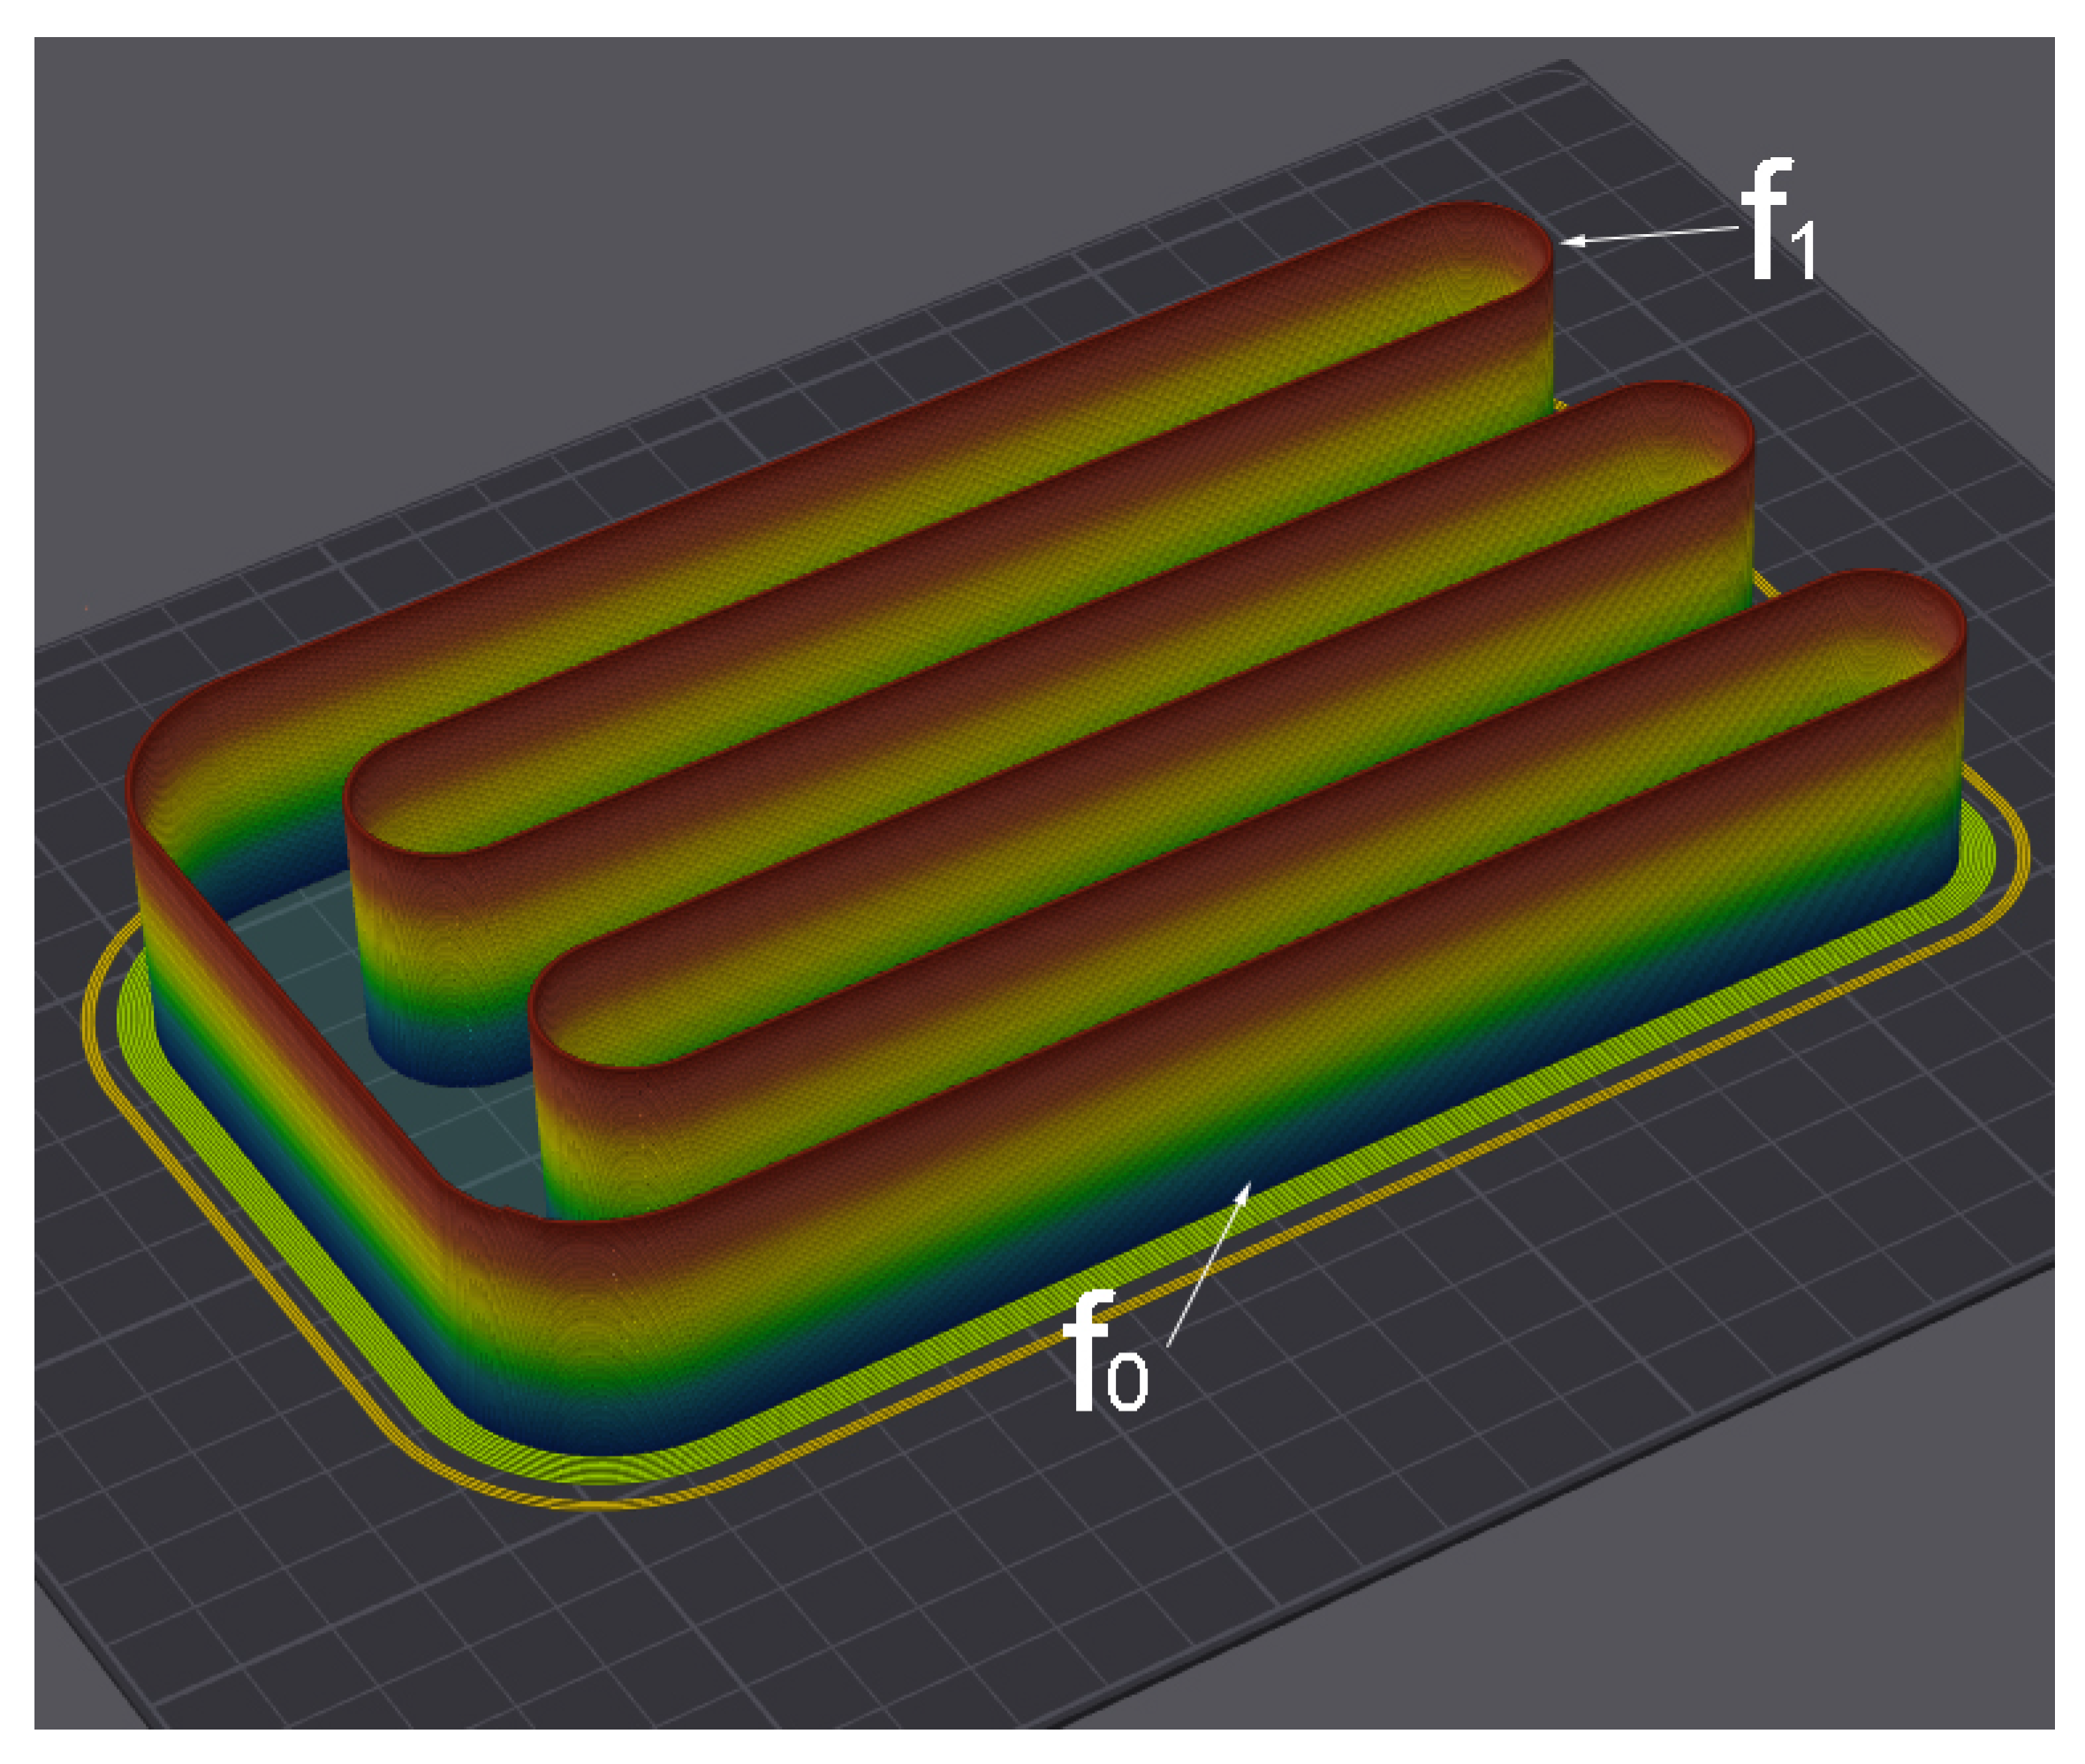
Figure 3.
Green sample obtained by FGF-technology
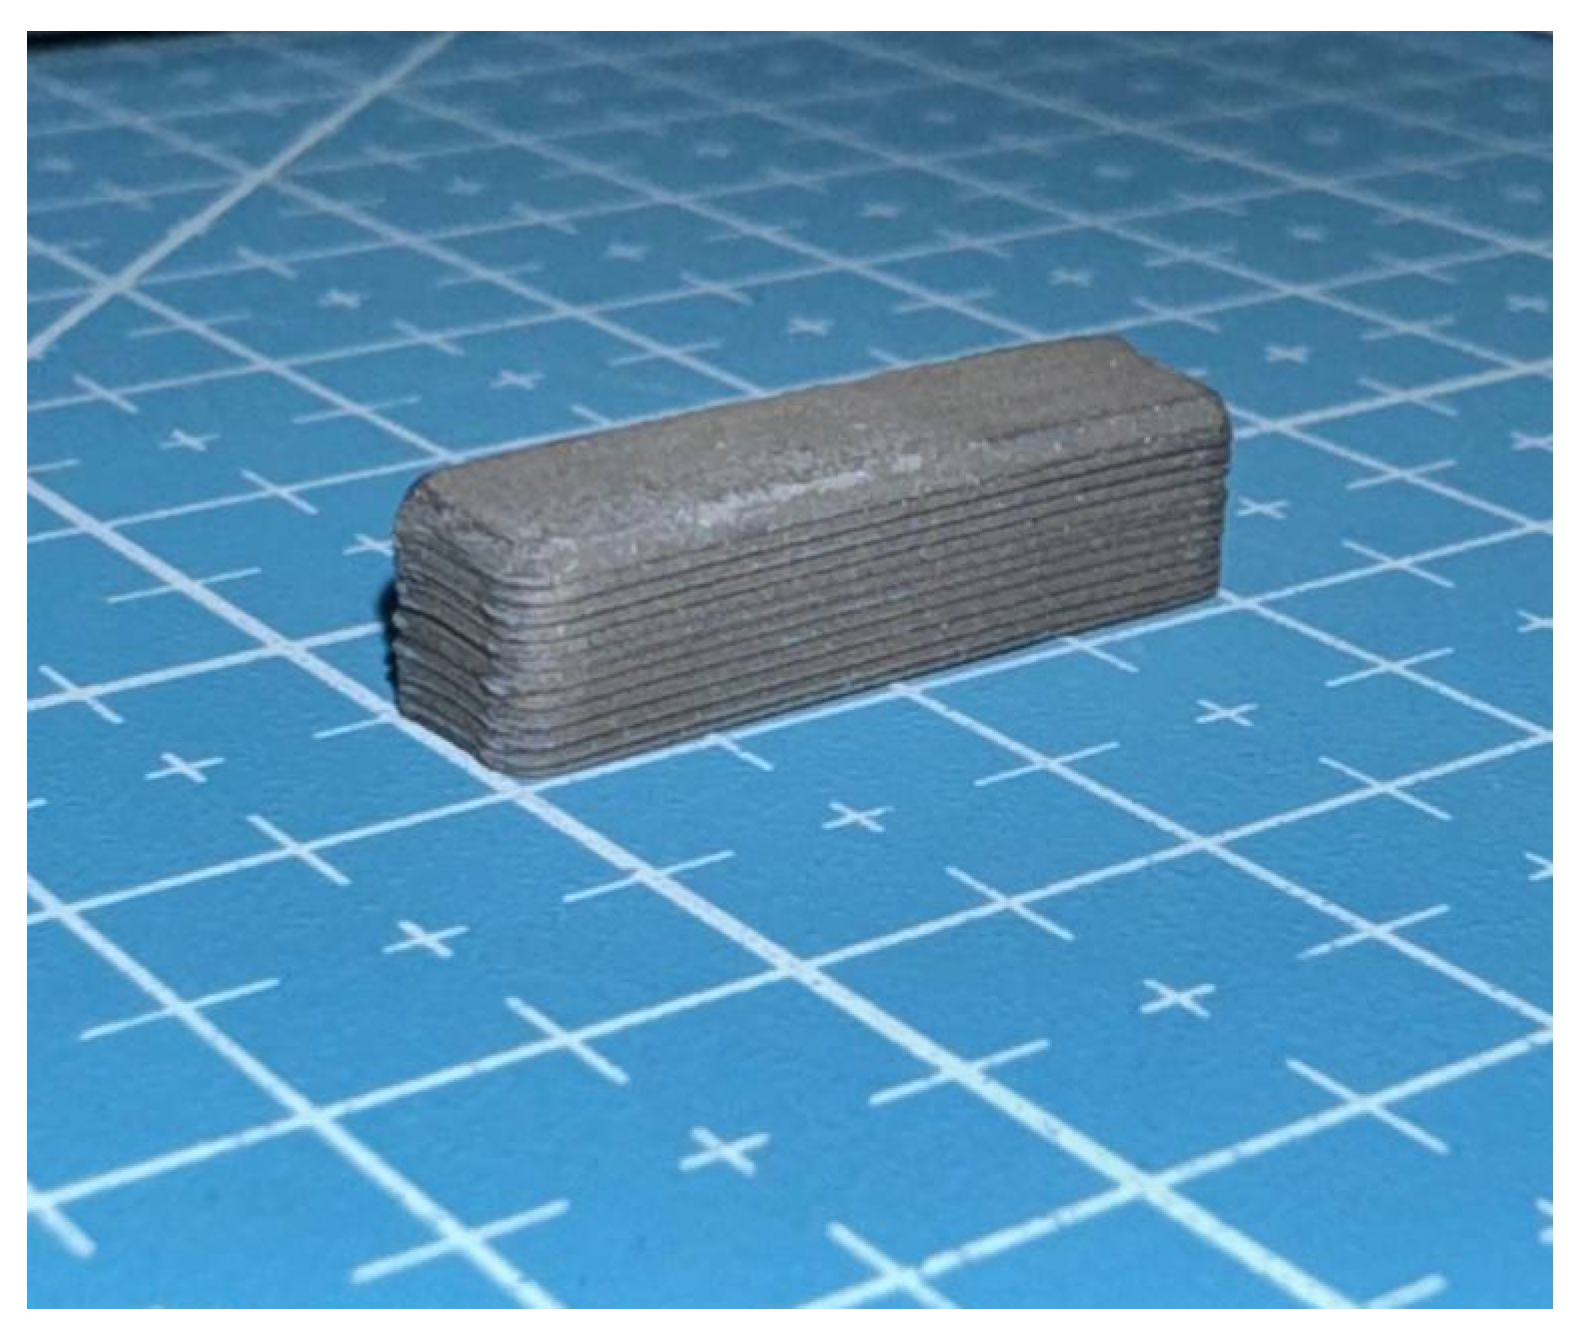
Figure 4.
Polymer reduction during debinding (a) and mass change (b) at different temperatures for samples with TiC:TAC = 70:30, Powder:Polymer = 70:30
Figure 4.
Polymer reduction during debinding (a) and mass change (b) at different temperatures for samples with TiC:TAC = 70:30, Powder:Polymer = 70:30
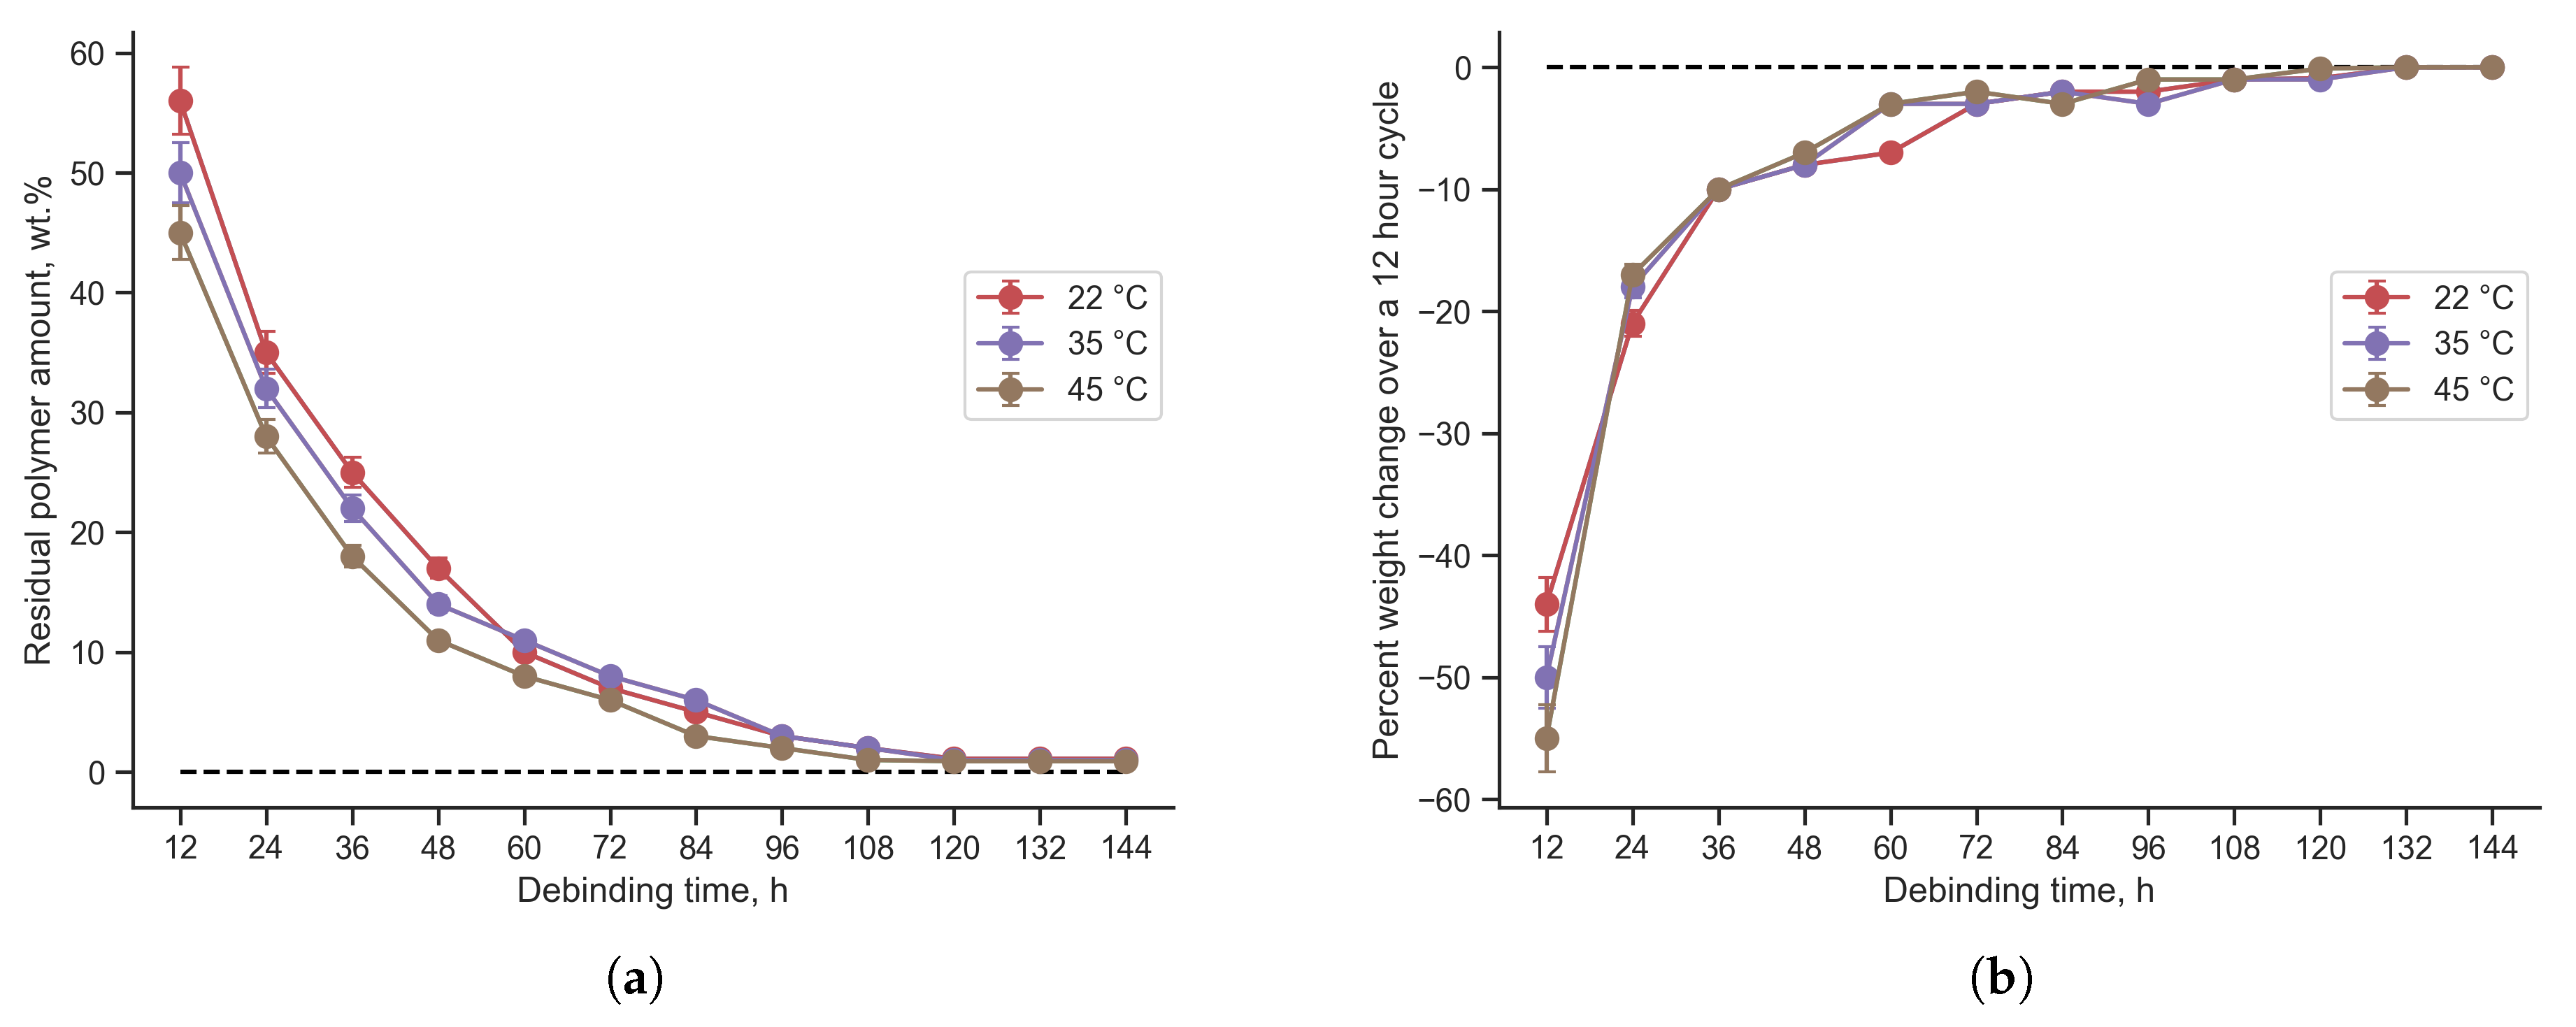
Figure 5.
Minimum debinding time required to bring the binder content to less than 1%
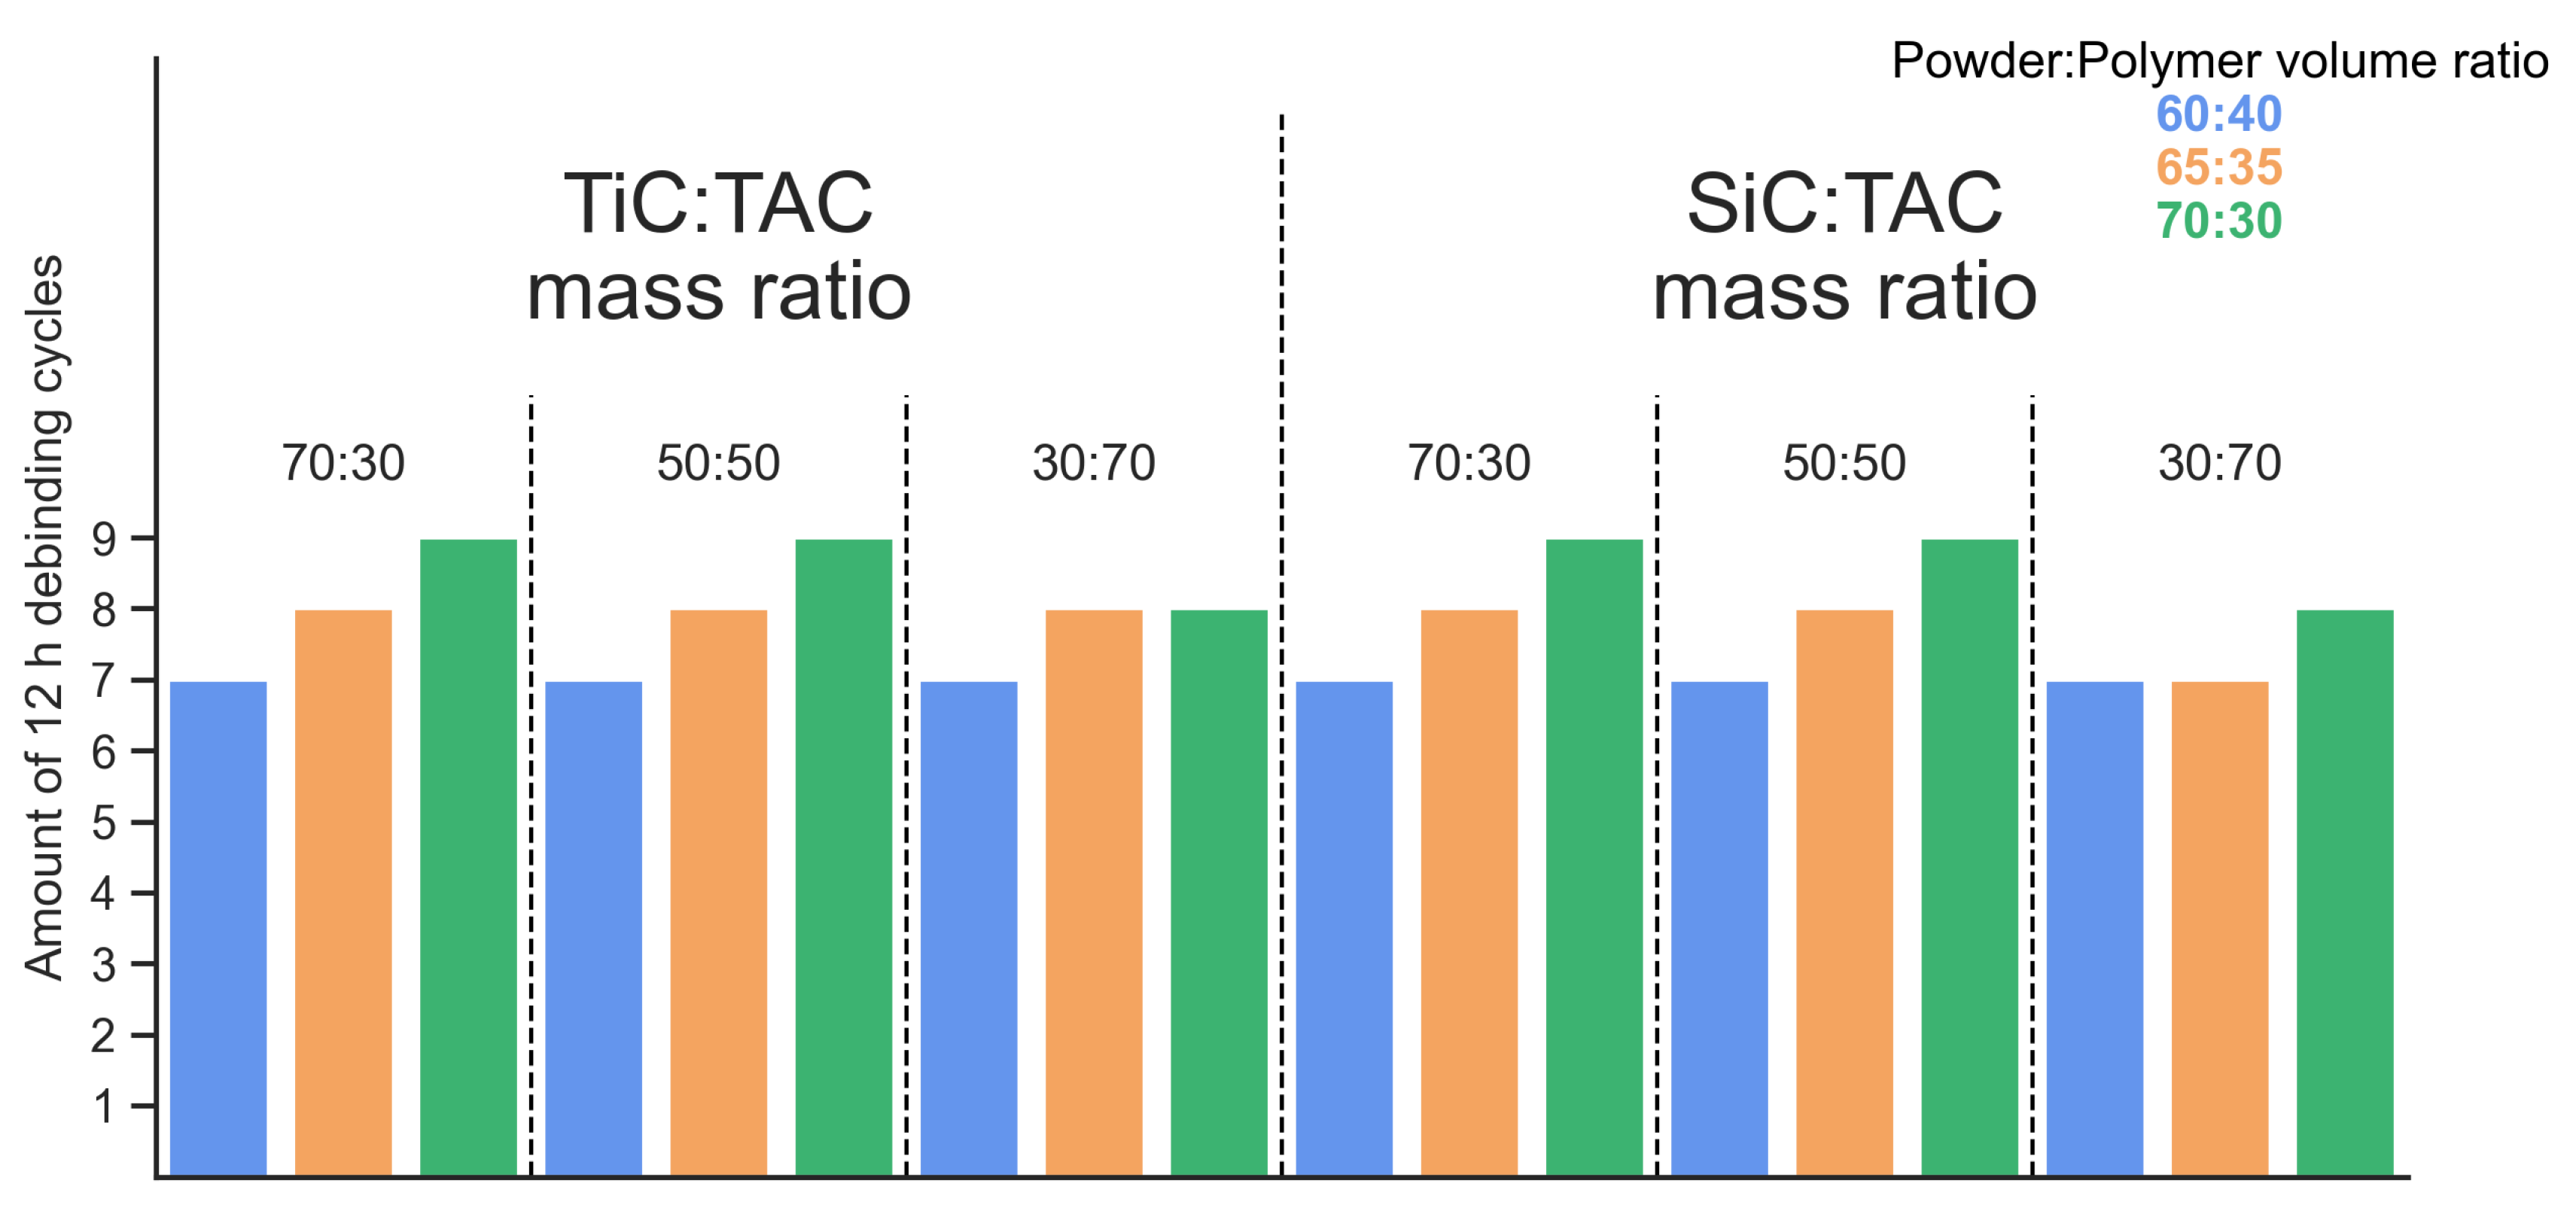
Figure 6.
Fracture surface (a, c) and cross-section (b) of the FGF (a, b) and SPS (c) samples of TiC:TAC = 70:30
Figure 6.
Fracture surface (a, c) and cross-section (b) of the FGF (a, b) and SPS (c) samples of TiC:TAC = 70:30
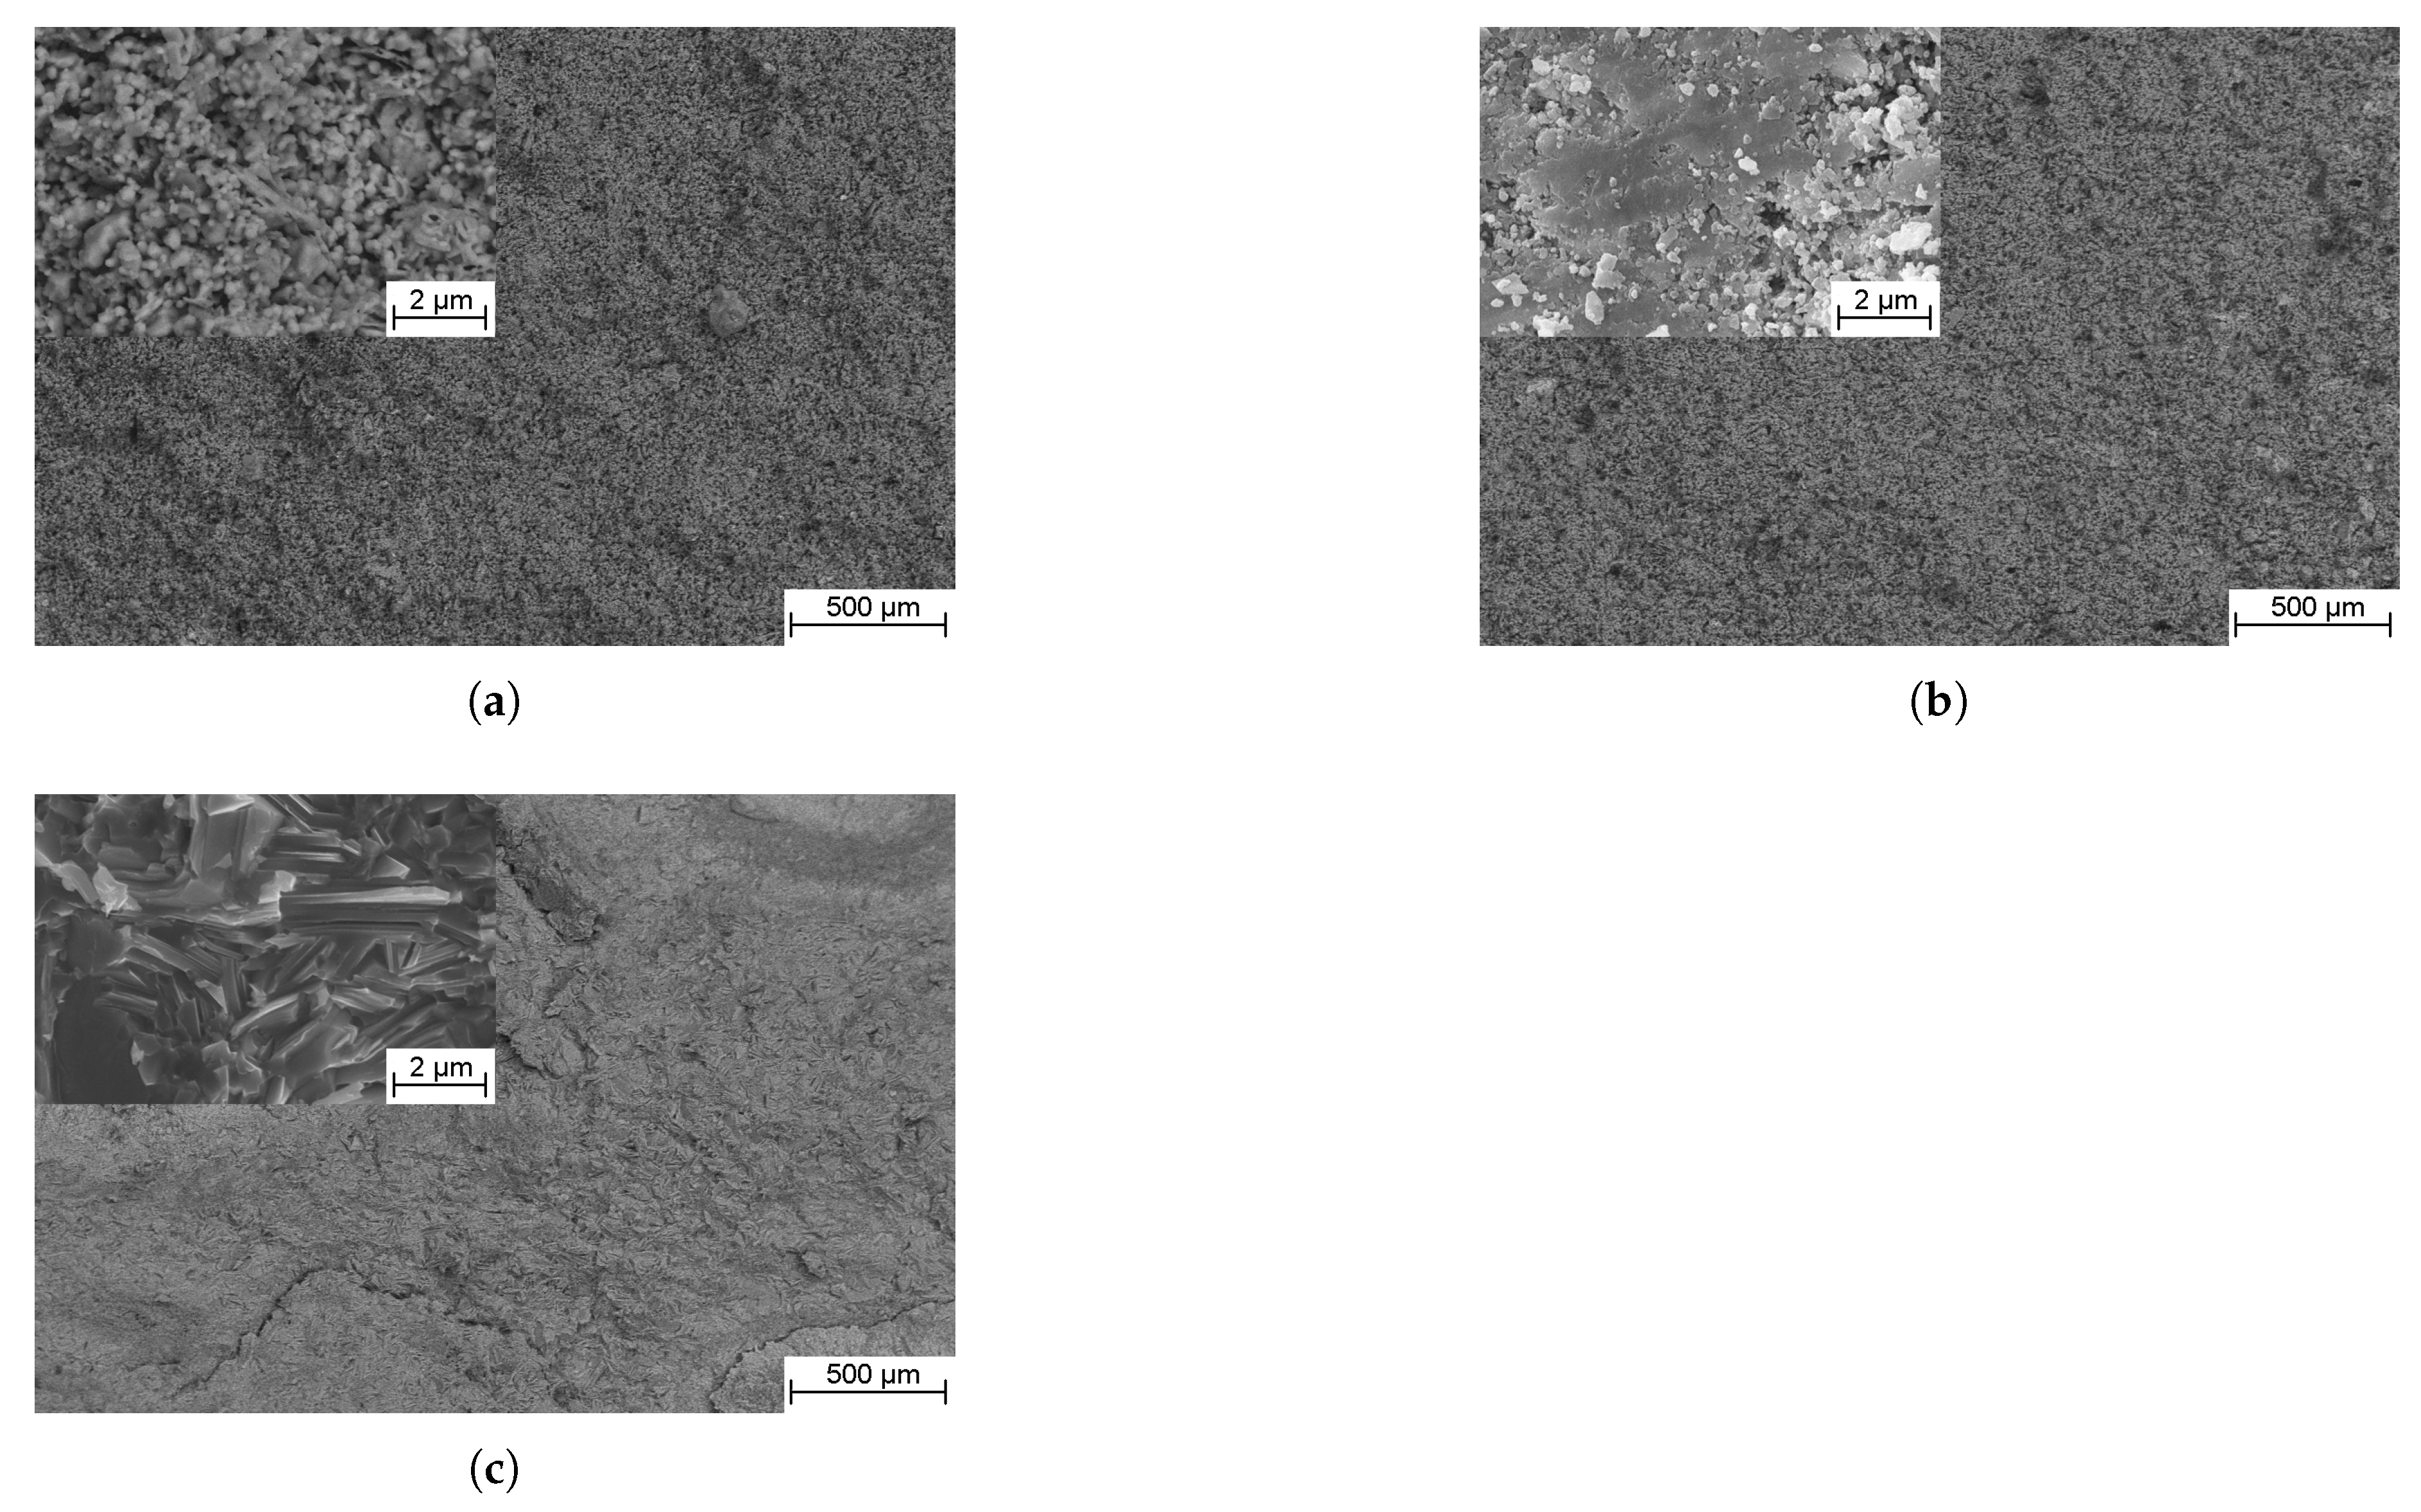
Figure 7.
Bending strength of samples with different TiC:TAC and Powder:Polymer ratio, sintered at 1250 °C (a) and 1300 °C (b)
Figure 7.
Bending strength of samples with different TiC:TAC and Powder:Polymer ratio, sintered at 1250 °C (a) and 1300 °C (b)
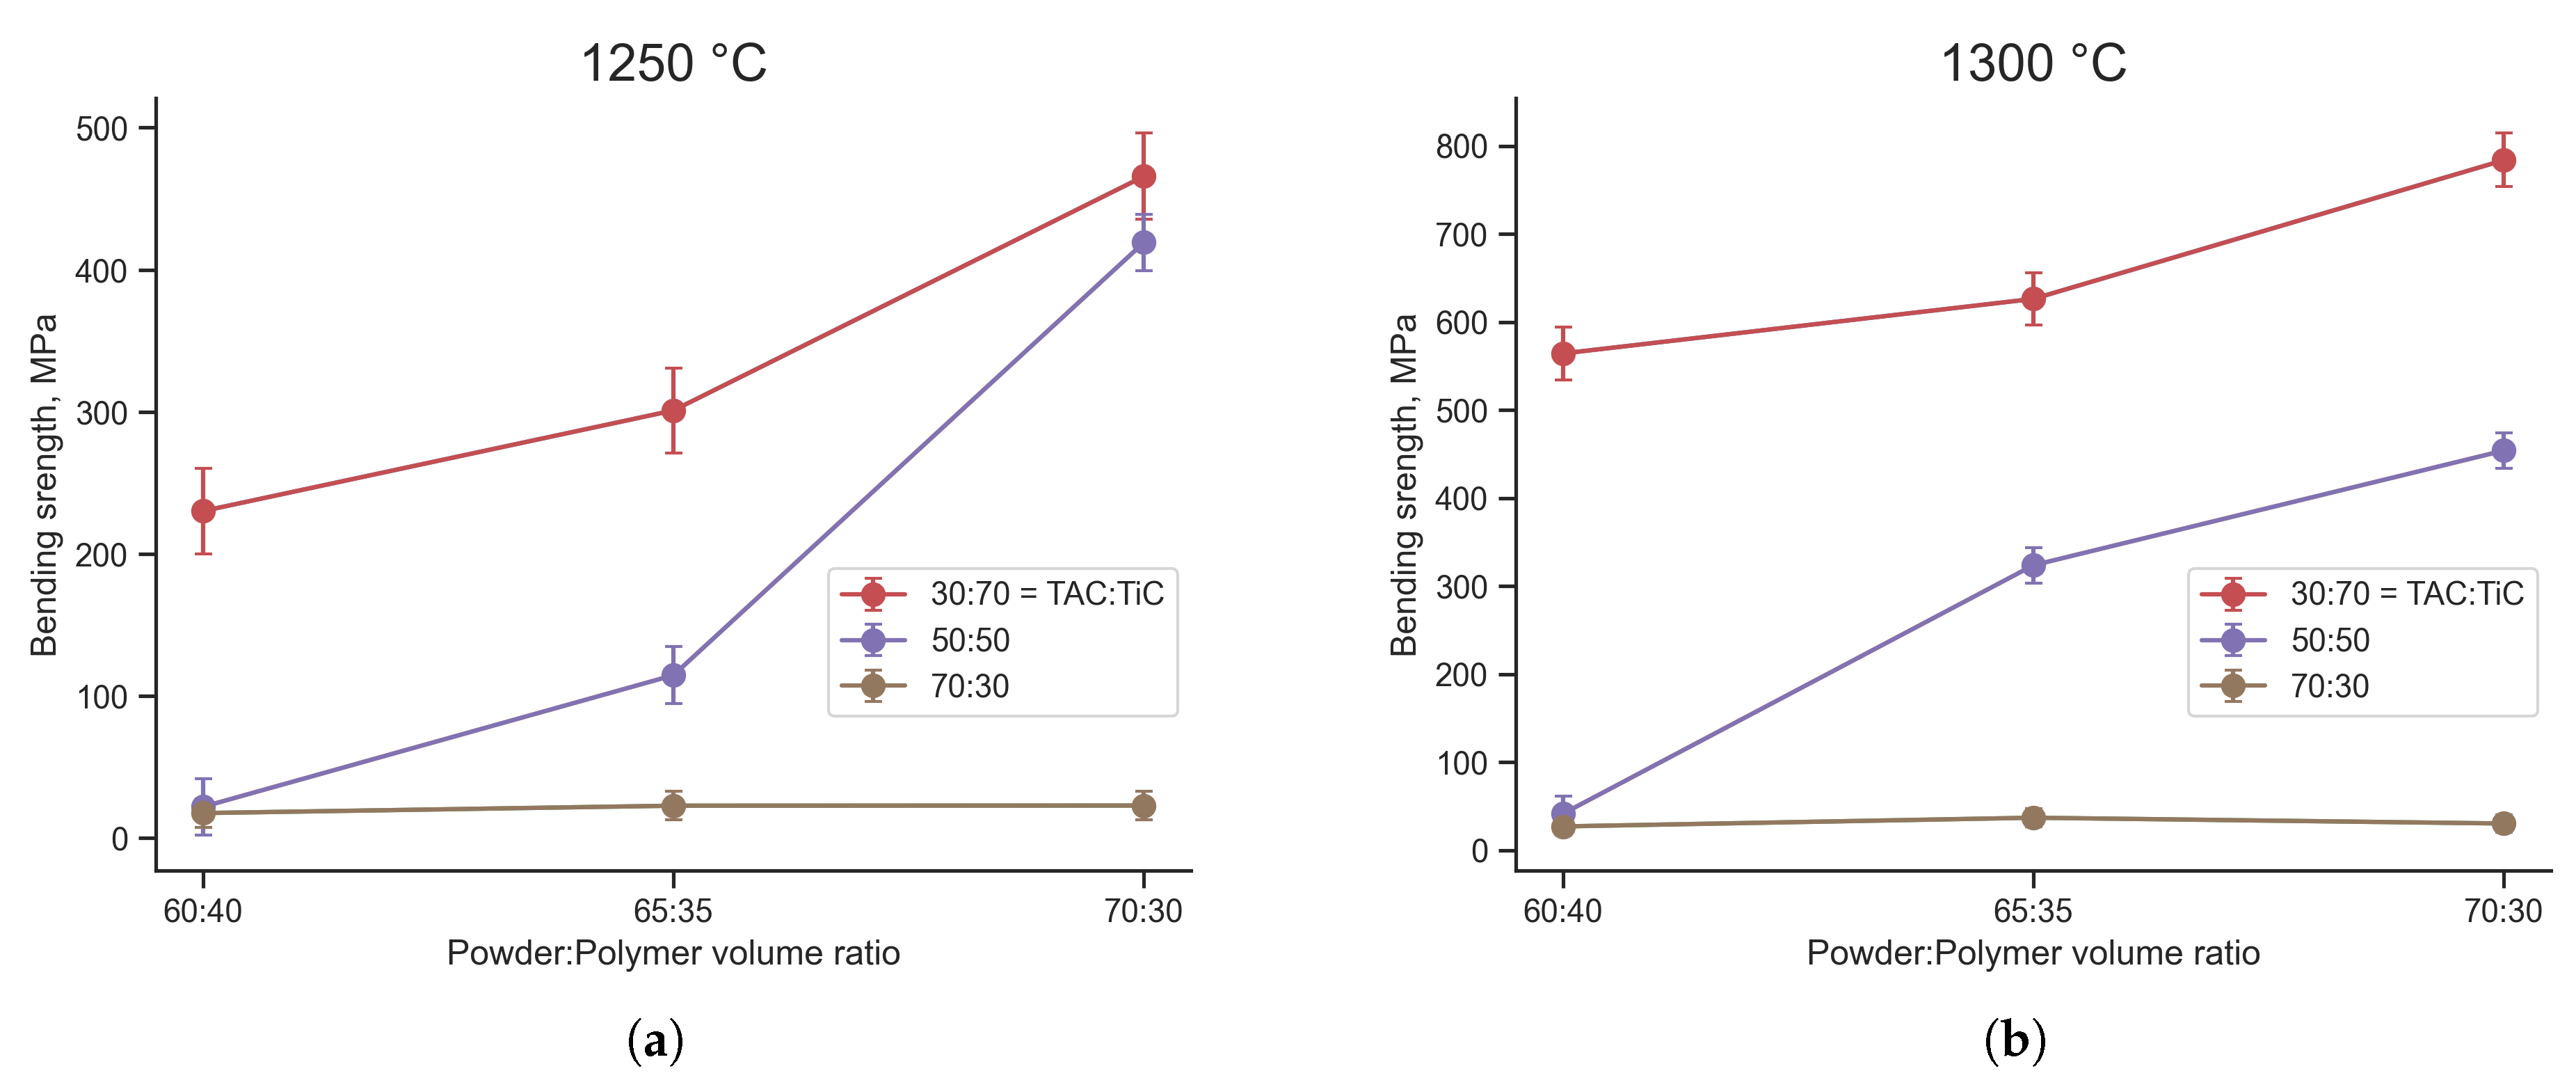
Figure 8.
Fracture surface (a, c) and cross-section (b) of the FGF (a, b) and SPS (c) samples of SiC:TAC = 70:30
Figure 8.
Fracture surface (a, c) and cross-section (b) of the FGF (a, b) and SPS (c) samples of SiC:TAC = 70:30
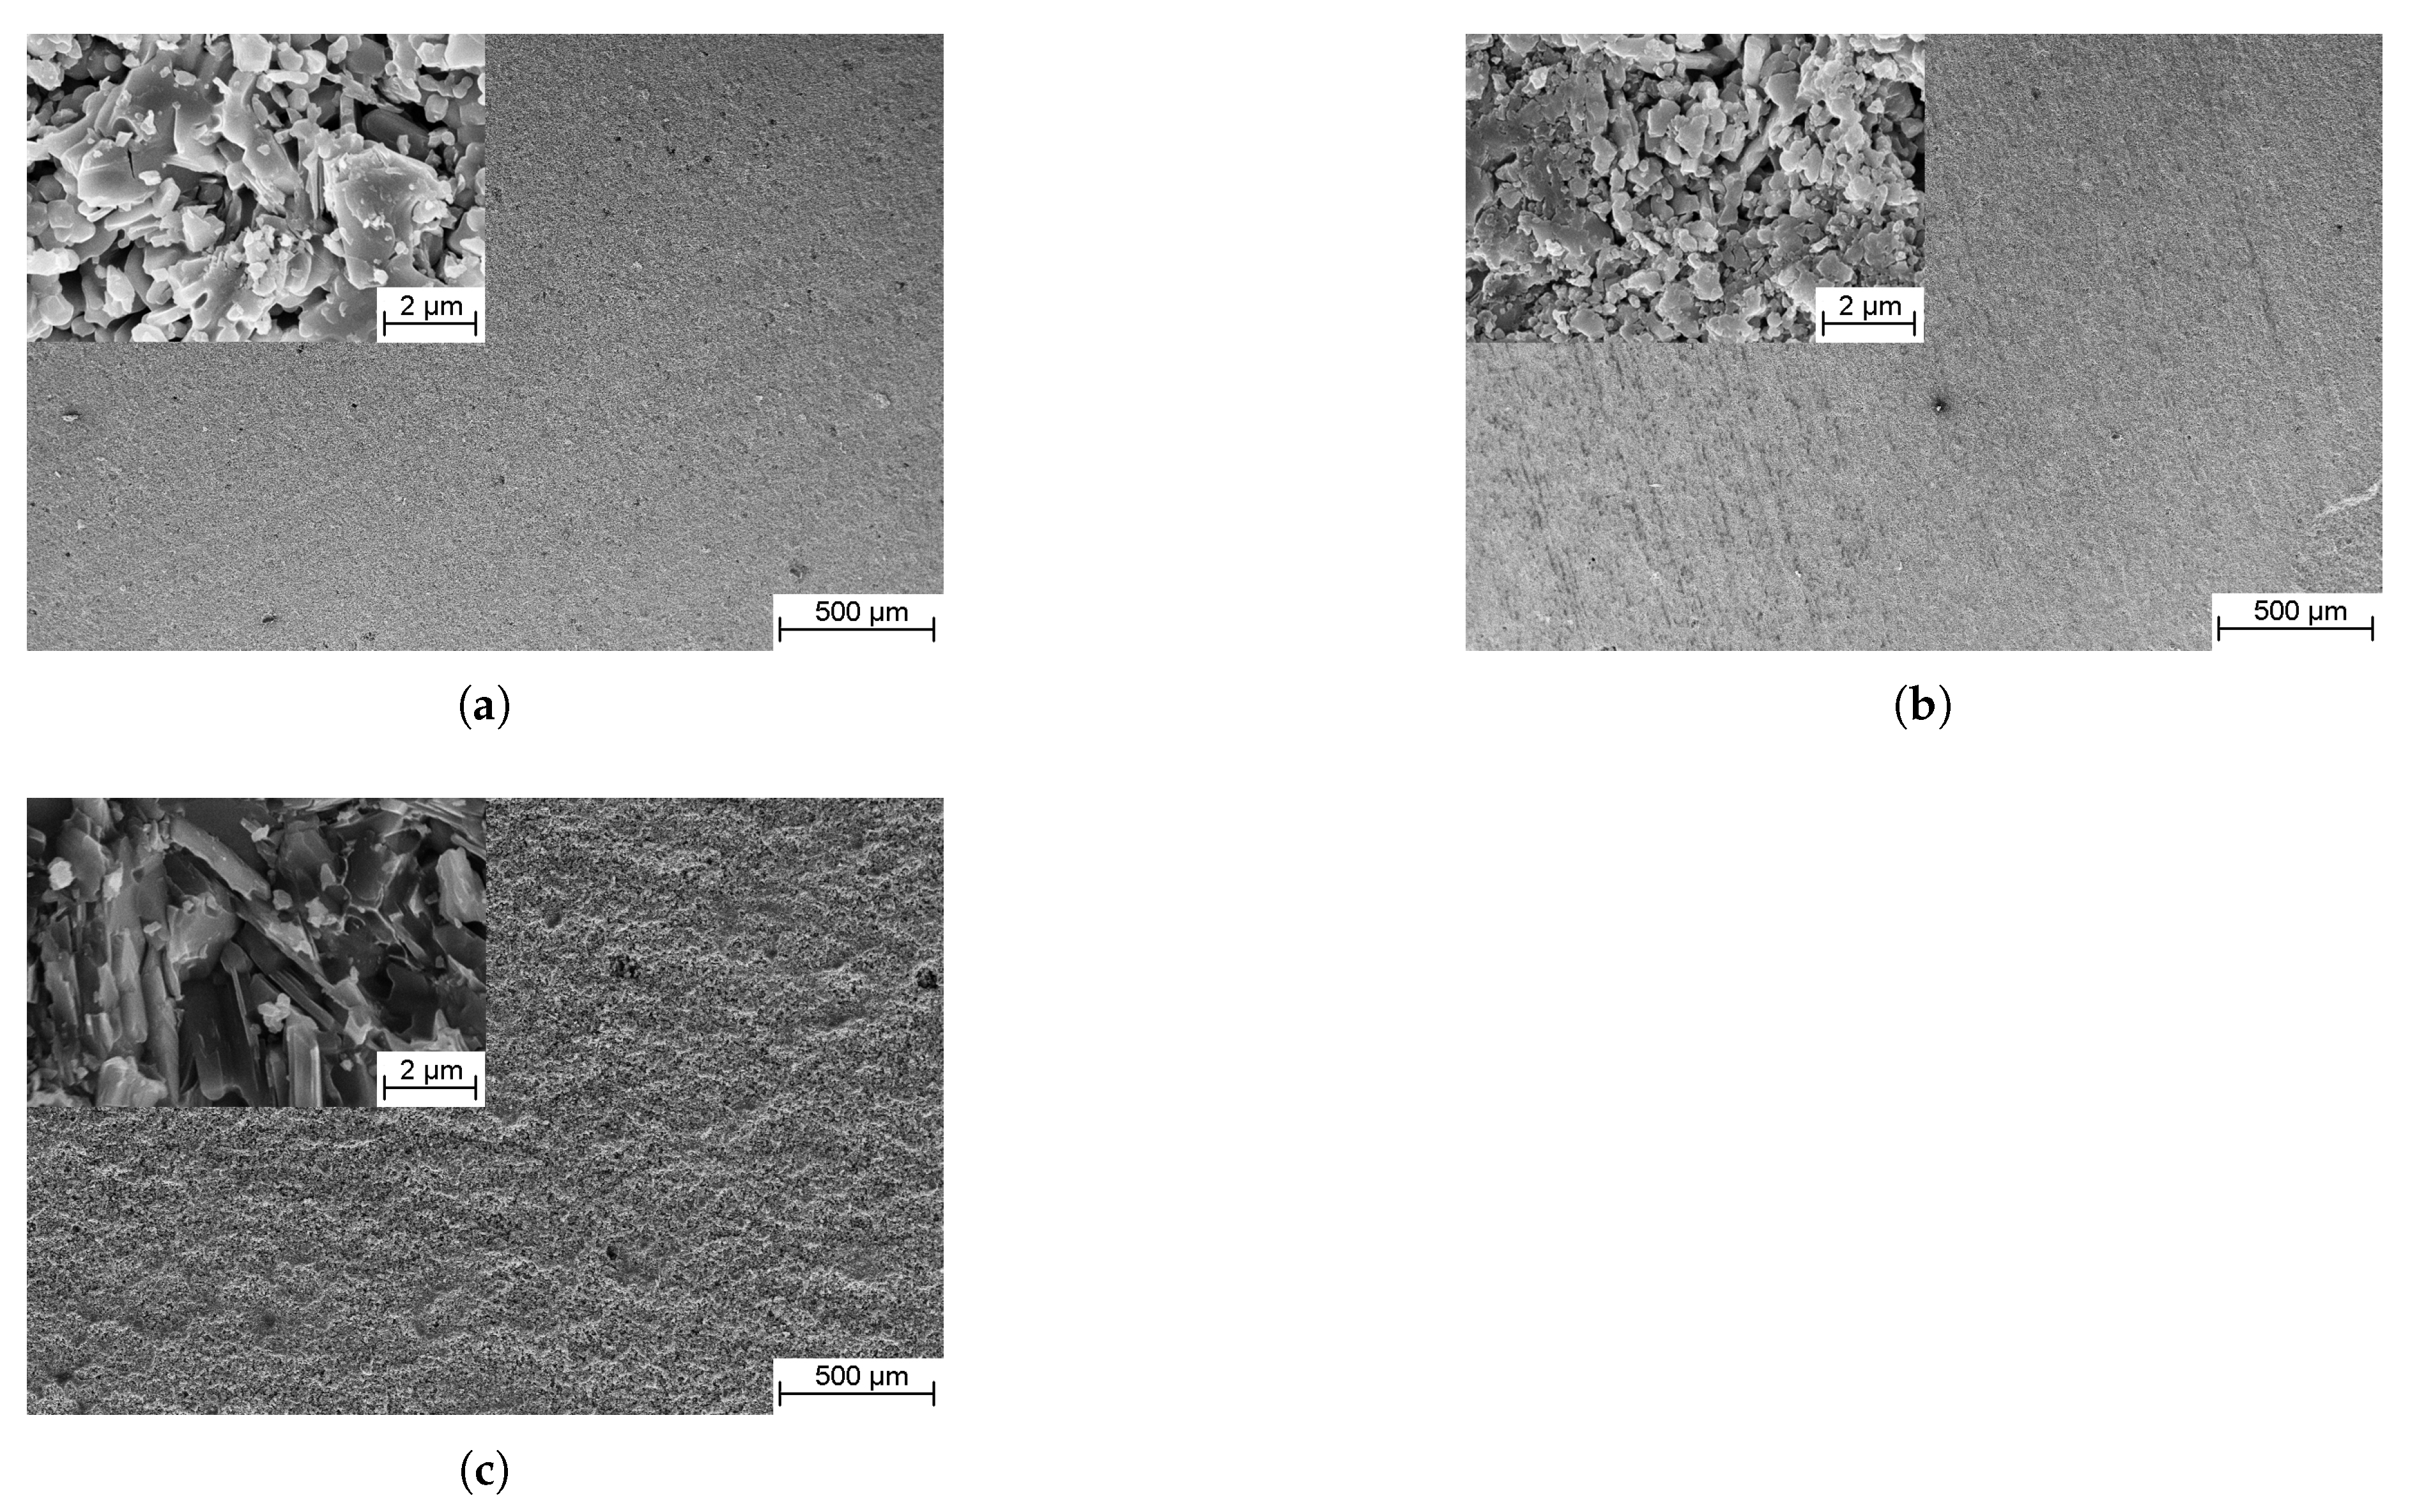
Figure 9.
XRD spectra of SiC:TAC sapmles, sintered at 1300 °C with different SiC:TAC ratio
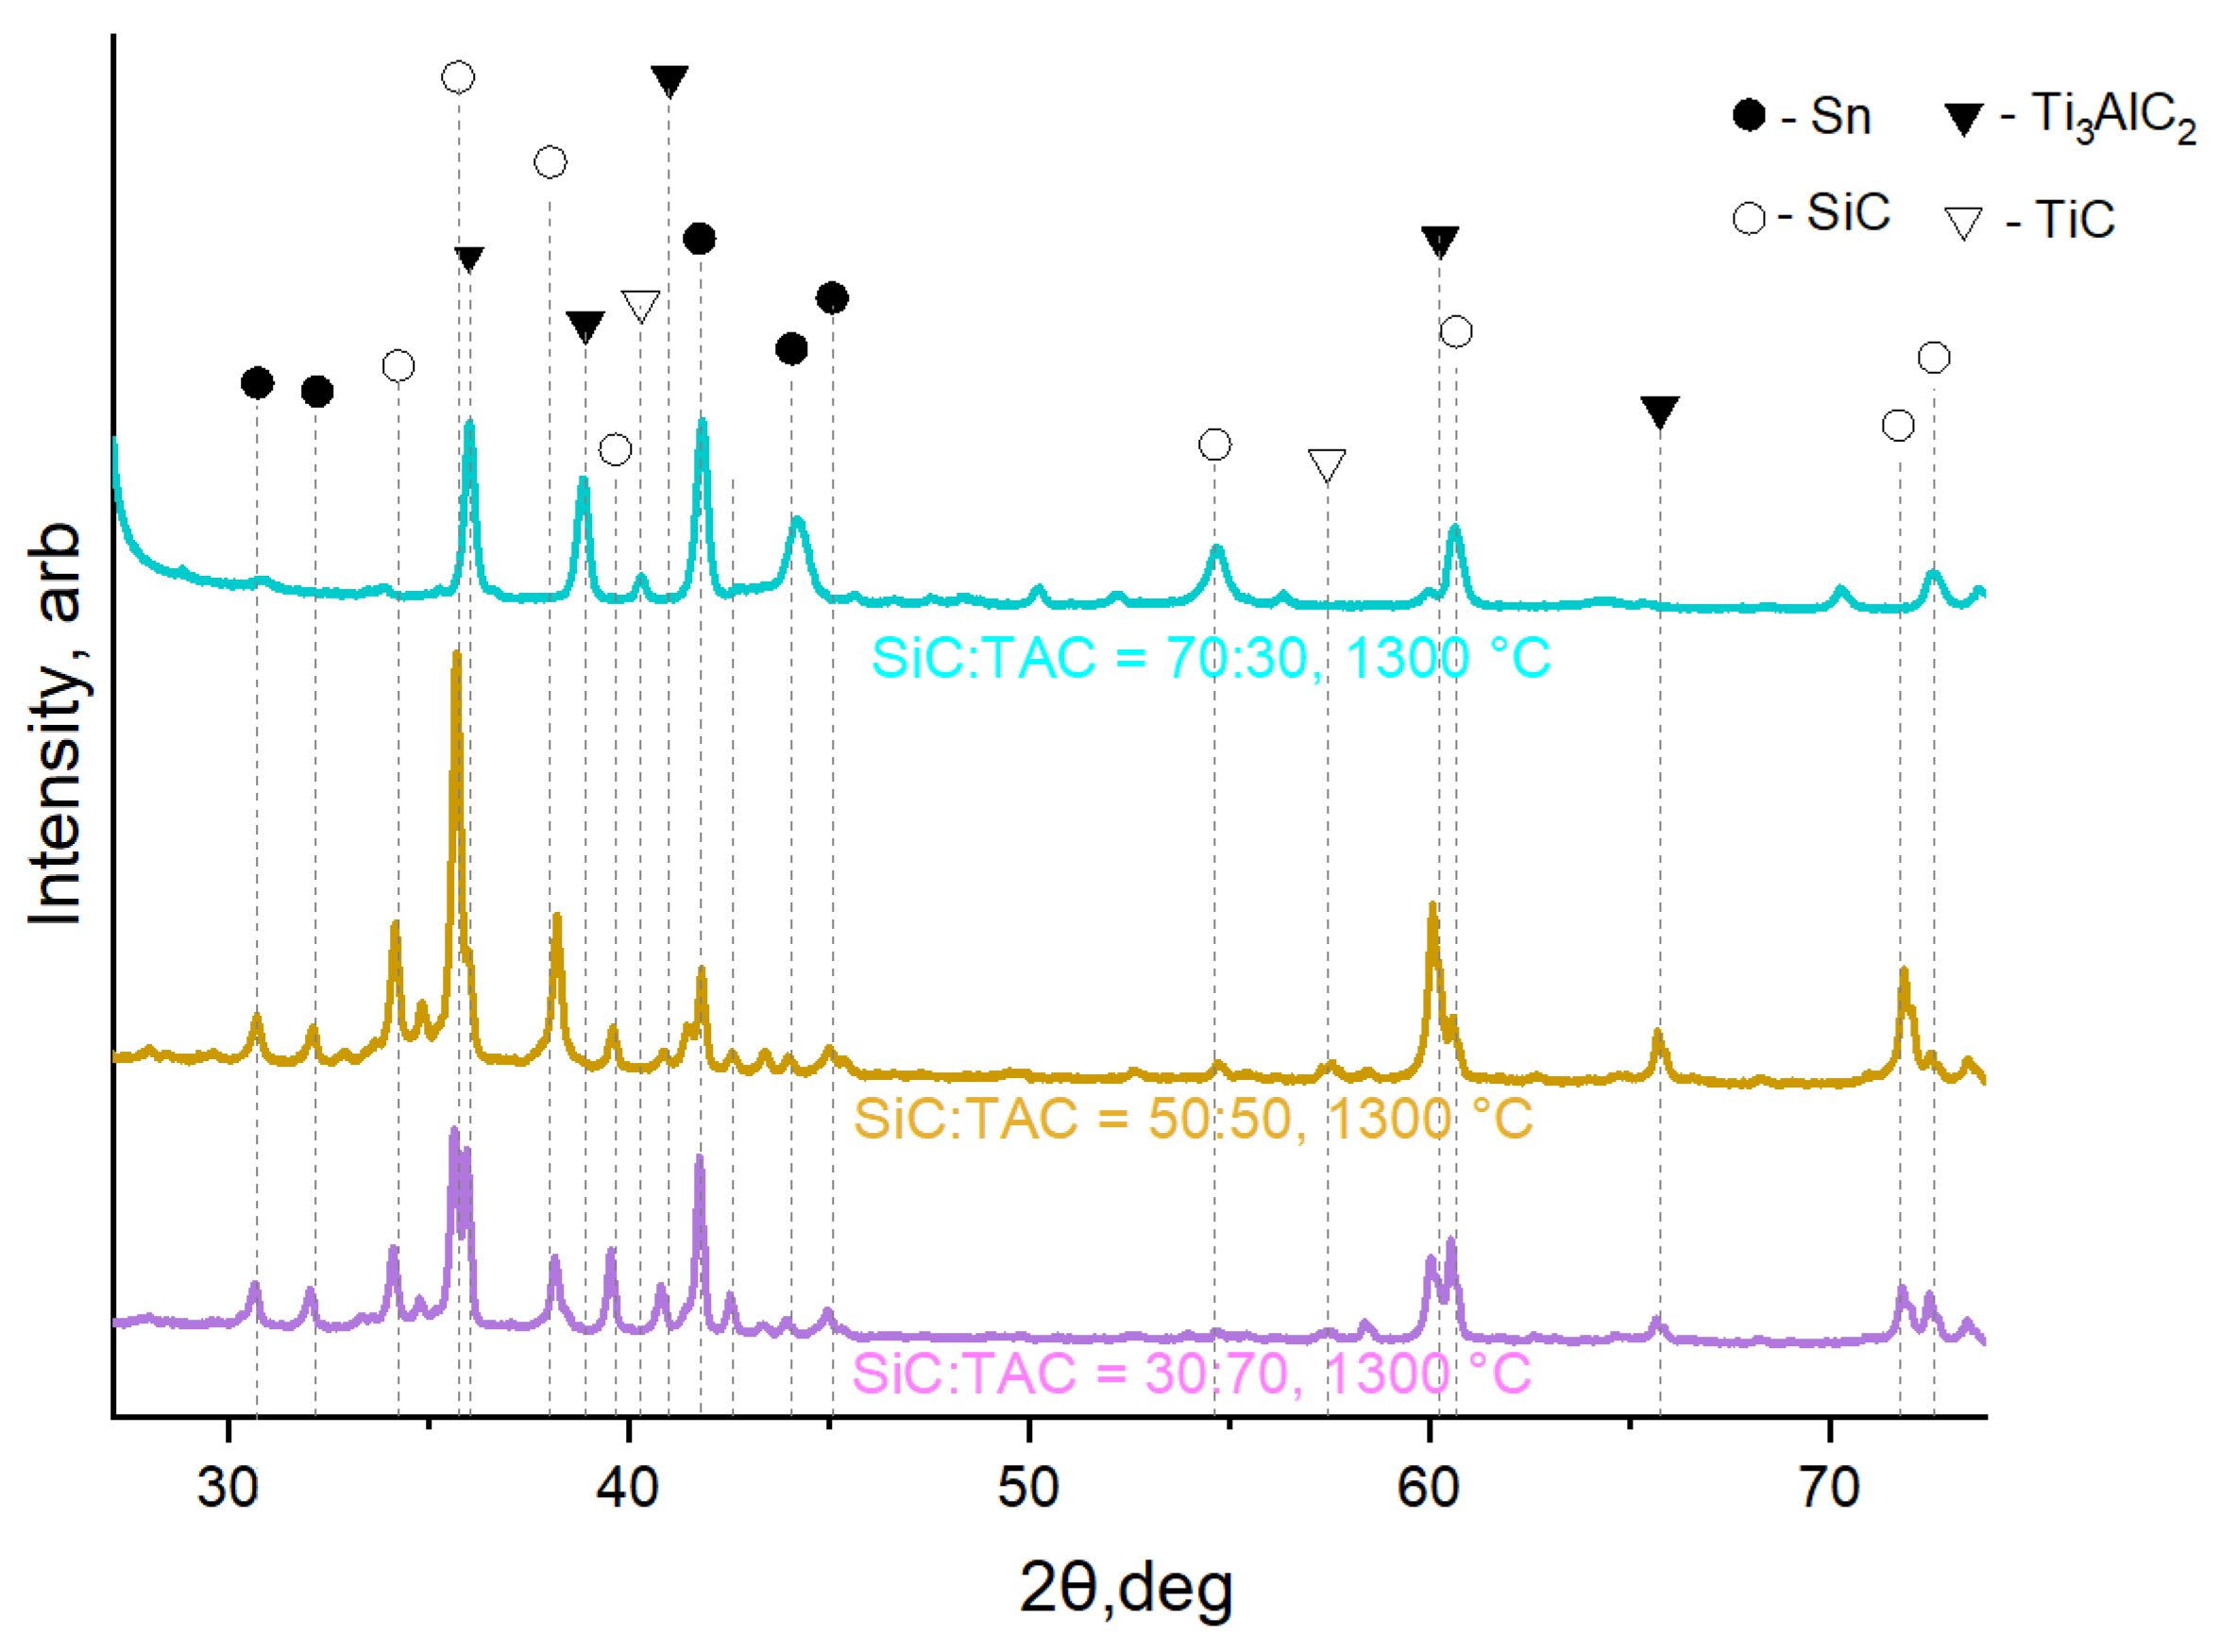
Figure 10.
Bending strength and open porosity of the SiC:TAC samples, sintered at different temperatures
Figure 10.
Bending strength and open porosity of the SiC:TAC samples, sintered at different temperatures
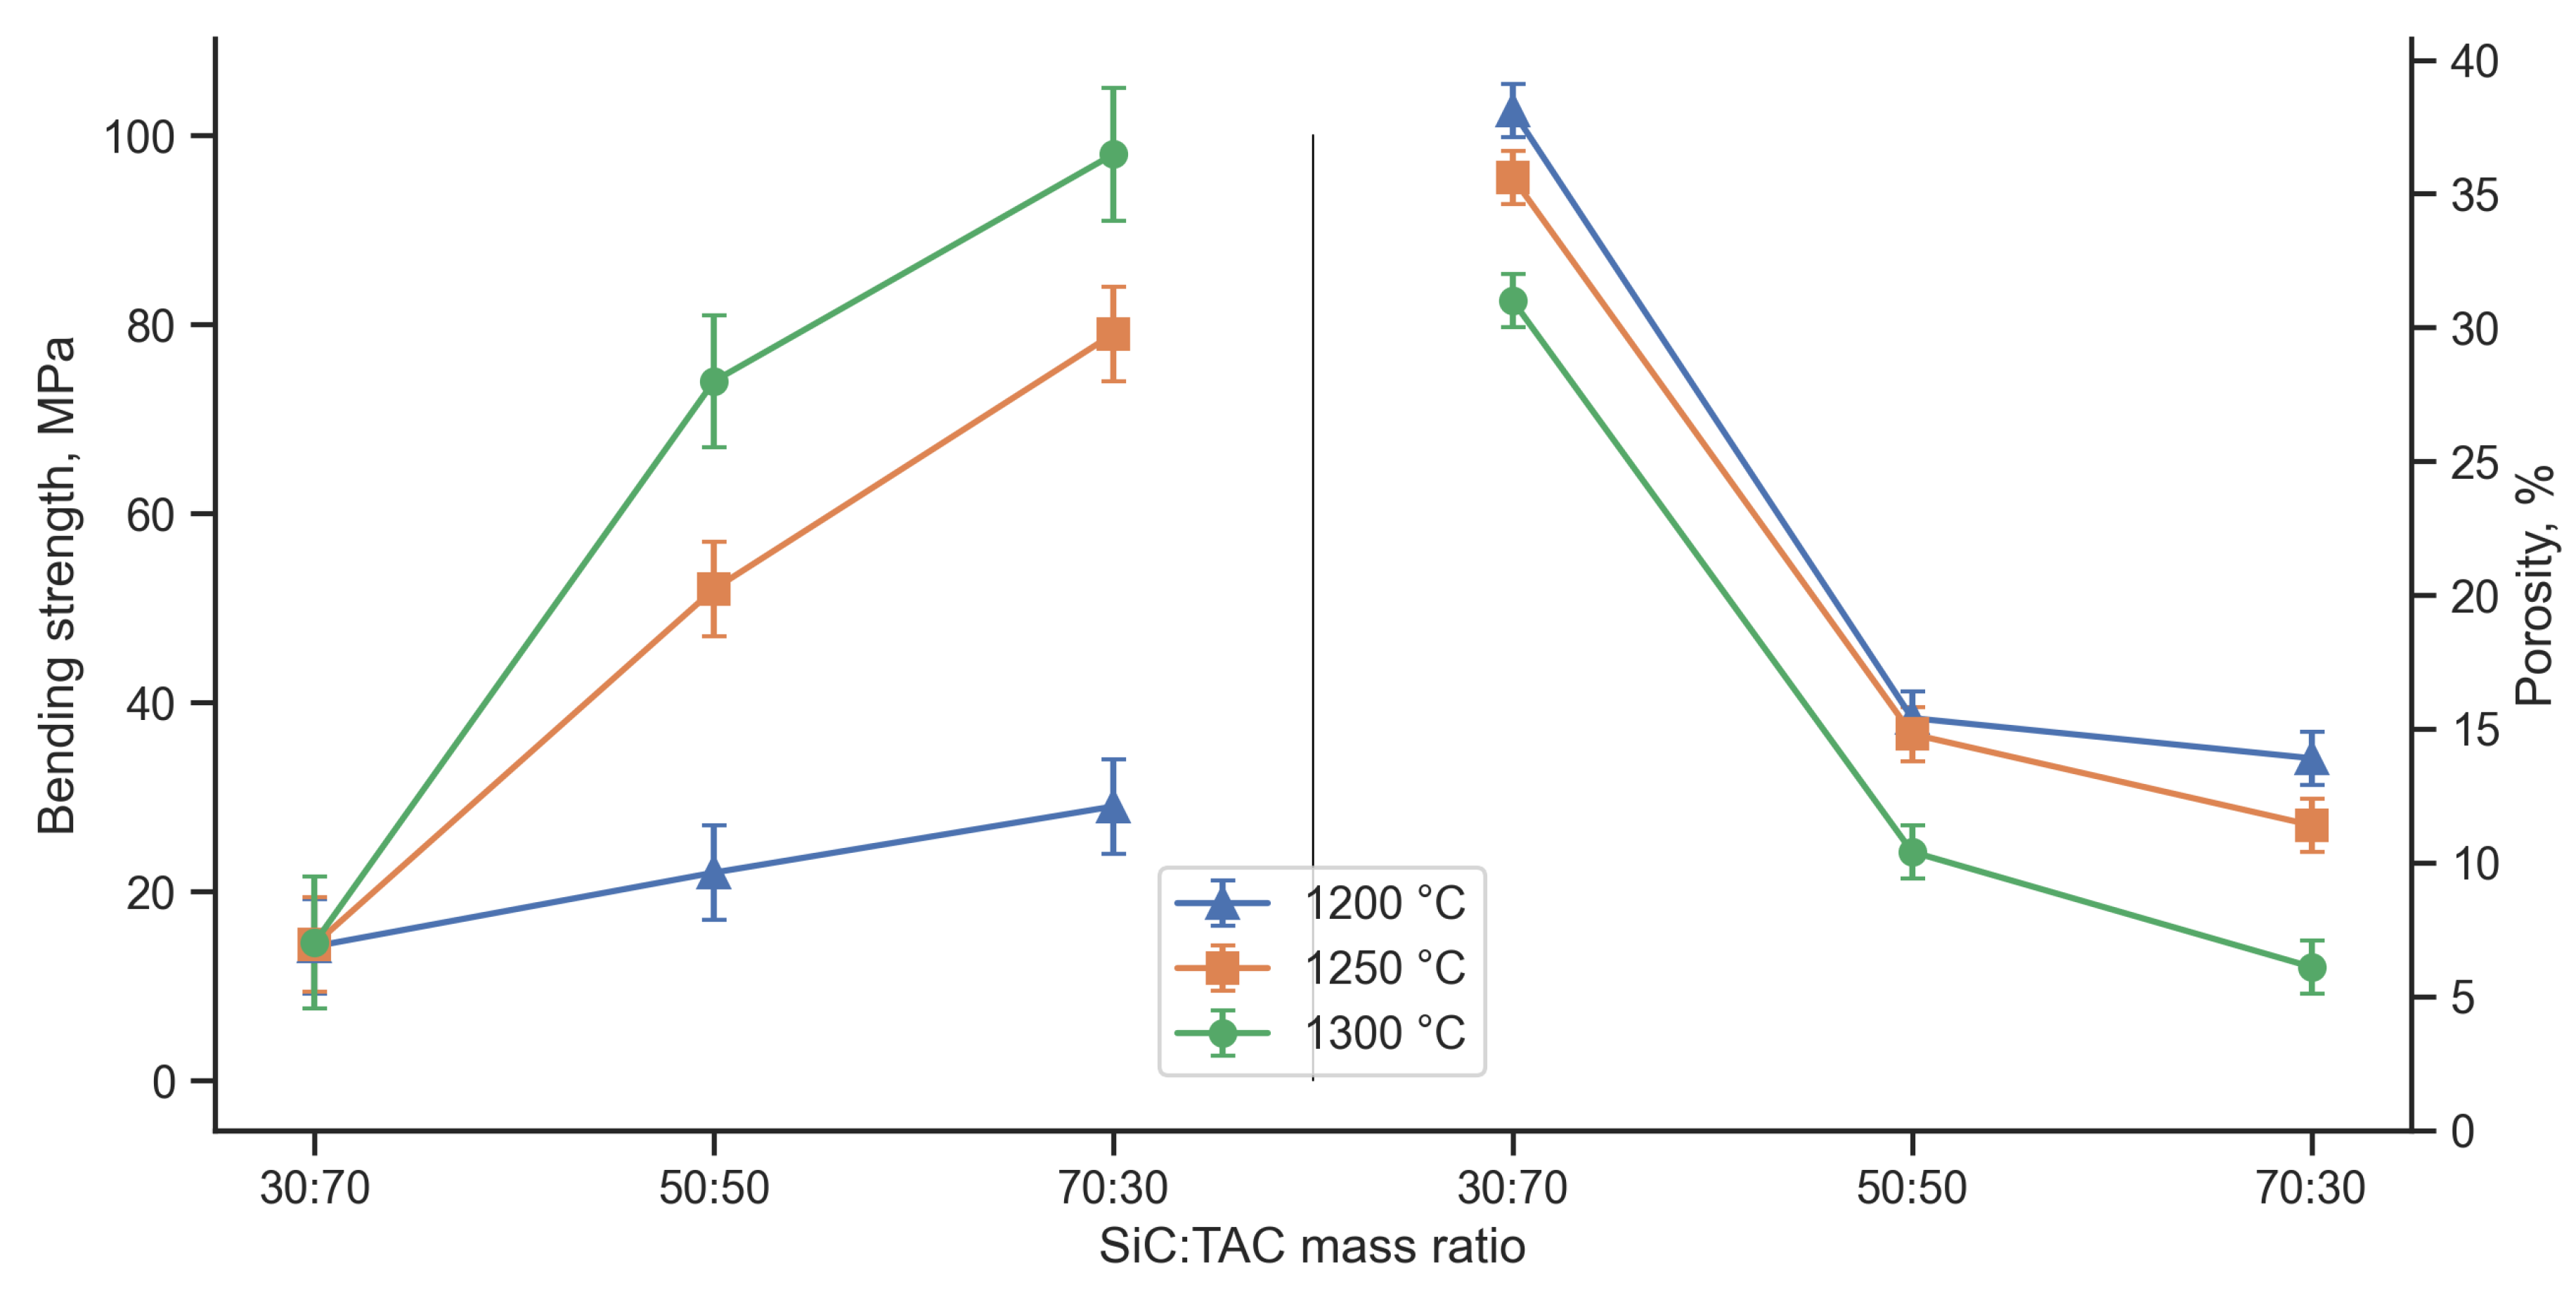
Figure 11.
Strength-porosity relationship of SiC:TAC samples, sintered at different temperatures
Disclaimer/Publisher’s Note: The statements, opinions and data contained in all publications are solely those of the individual author(s) and contributor(s) and not of MDPI and/or the editor(s). MDPI and/or the editor(s) disclaim responsibility for any injury to people or property resulting from any ideas, methods, instructions or products referred to in the content. |
© 2024 by the authors. Licensee MDPI, Basel, Switzerland. This article is an open access article distributed under the terms and conditions of the Creative Commons Attribution (CC BY) license (http://creativecommons.org/licenses/by/4.0/).
Copyright: This open access article is published under a Creative Commons CC BY 4.0 license, which permit the free download, distribution, and reuse, provided that the author and preprint are cited in any reuse.


