Submitted:
30 April 2024
Posted:
30 April 2024
You are already at the latest version
Abstract
In the field of visualization, understanding users’ analytical process is important to determine the effectiveness of a designed visualization application. To understand the users’ analytical process, numerous studies have been performed to capture and analyze user interactions. Although many studies have emphasized the importance of analyzing user interactions to understand users’ analytical reasoning processes, few have successfully linked these interactions to users’ reasoning processes. This paper introduces an approach that bridges this gap by correlating semantic user interactions with analysis decisions through an interactive wire transaction analysis system and a visual state transition matrix. With the designed analysis system, interactive analysis can be performed to evaluate financial fraud in wire transactions. It also allows the mapping of captured user interactions and analytical decisions back onto the visualization, revealing users’ distinct results. The visual state transition matrix further aids to help understanding users’ analytical flows, revealing their decision-making processes. Classification machine learning algorithms are applied to assess the effectiveness of our approach in understanding analysts’ strategies by connecting them to their decisions. From the study, we observed an average of 72% accuracy in clearly classifying the semantic user interactions. For classifying individual decisions, we observed an average of 70% classification accuracy. This emphasizes the importance of capturing semantic user interactions to understand users’ analytical processes. Overall, it is determined that the proposed approach not only enhances the understanding of analytical behaviors but also offers a robust approach for evaluating user interactions in visualization tools.
Keywords:
Visual Analytics
; Semantic User Interactions
; Machine Learning
1. Introduction
In the past, numerous visualization applications have been developed to help people solve various analytical problems. However, understanding the extent to which these systems aid in solving analytical problems poses a notable research challenge because of the difficulty of understanding users’ analytical reasoning processes performed with the systems. In the visualization community, researchers have dedicated themselves to identifying potential avenues for research, particularly focusing on understanding their rationales (i.e., internal reasoning processes) by linking them with conducted user interactions. Among various proposed approaches, eye-tracking devices have emerged as a promising method for analyzing user interactions and understanding how users process visual elements. Despite its potential, integrating user interactions with eye-tracking data to analyze visual processing remains a significant challenge, as linking them directly to the actual eye-tracked data can often lead to misleading conclusions [1]. As an alternative, researchers [2,3] have explored evaluating semantic data generated through user interactions. They specifically assessed how captured interactions reflect users’ reasoning by analyzing the interactions alongside the corresponding semantic information. They also emphasized the importance of connecting user interaction logs to the underlying reasoning in the analytical process.
Often, in solving analytical problems, we observe disparities in the analysis decisions made by experts [4]. This may be because they apply different analytical strategies based on their individual experience and knowledge. Similar results may appear when utilizing visualization applications to solve complex analytical problems. Due to the possible discrepancies in conclusions, elucidating the rationale behind their analysis decisions is critical, but provided challenging. Integrating experts’ diverse analytical steps into visualization would benefit and upgrade existing visualization applications to the next level because it provides details about how they reached the agreed or disagreed conclusions. Thus, analyzing users’ interactions in visualization applications is critical to understanding their intentions by connecting them to their reasoning processes, and eventually evaluating the effectiveness of the applications.
This paper presents a methodology designed to understand analysts’ user interactions within a visualization system. We analyze semantic user interactions to gain insights into the users’ analytical processes and decisions. Furthermore, we integrate captured user interactions into the visualization to highlight the analytical procedures performed. Instead of merely representing captured user interactions, our approach focuses on interpreting these interactions by evaluating their analytical processes. Specifically, we employed Markov Chain [5] to understand the analysts’ user interactions by treating them as distinct states. An visual state transition matrix is created to assist in comprehending the flow of user interactions and their underlying reasoning process. Most importantly, we evaluate the analysts’ semantic user interactions by linking them directly to their decision-making processes. To validate the effectiveness of this methodology, we utilized several classification algorithms: Multinomial Naive Bayes, Support Vector Classifier, Random Forest, Logistic Regression, and Gradient Boosting. These tools are employed to confirm the effectiveness of our analysis by classifying the semantic user interactions according to their corresponding decisions.
This paper organized into seven sections. Initially, we review prior research on understanding user interactions within visualization systems. Subsequently, we introduce the designed visualization system, emphasizing the importance of tracking and utilizing semantic user interactions. In Section 5, we present our proposed method for representing captured semantic user interactions using a Markov chain model. Following this, we discuss the results of the classification evaluation conducted to understand these interactions. We conclude the paper with a discussion of our findings and directions for future work.
2. Previous Work
2.1. Using Eyetracking Devices to Understand User Interactions in Visualizations
There is growing evidence that user characteristics such as cognitive abilities and personality traits can significantly impact users’ visualization experience [6,7]. These factors not only affect overall experience and task performance but also influence how effectively users can process relevant elements within a visualization. To better assist individual users during visualization tasks, more recent research has shifted its focus towards user-adaptive visualization approaches that can dynamically determine relevant user characteristics and provide appropriate interventions tailored to these characteristics [8,9,10]. Among different tools to collect user characteristics, eye-tracking has been widely used to understand various aspects of human cognition and human-computer interaction. It has emerged as a valuable tool to analyze how users perceive and understand interactive visualization systems [11]. Eye tracking data provides insights into information search activity, the relevance of search results, and the complexity of the search. It also provides a valuable metric to infer the users’ intrinsic cognitive processes [6]. Existing research has leveraged eye-tracking data for a variety of user interactions. For example, Conati et al. [8] examined whether eye-tracking and interaction data could effectively capture various cognitive abilities relevant to processing information visualizations. They conducted a comprehensive comparison of user models based on eye-tracking data, interaction data, and a combination of both. The findings revealed that eye-tracking data yielded the most precise predictions, although interaction data still demonstrated the potential to outperform a baseline. That is, adaptation for interactive visualizations could be facilitated when eye-tracking is not feasible or when eye-tracking data for a particular user is too noisy. The study also demonstrated that interaction data exhibited superior predictive accuracy for several cognitive abilities at the beginning of the task compared to eye-tracking data. Lastly, they presented the value of multimodal user models by combining eye-tracking data and interaction data to enhance the prediction of cognitive abilities. Alam and Jianu [11] introduced a novel approach to collect and analyze eye-tracking information in data space (what on the screen users are looking at) rather than image space (where on the screen users are looking). Most eye-tracking data is gathered and analyzed as gaze coordinates within the spatial framework of the visual stimuli being observed. These analyses primarily concentrate on identifying the specific locations on the screen where users direct their gaze. However, such approaches demand considerable manual effort and are impractical for studies encompassing numerous subjects and complex visual stimuli. They demonstrated the effectiveness of this approach in collecting data during extended sessions involving open-ended tasks and interactive content.
Blascheck et al. [12] provided an overview of visualization techniques for eye-tracking data and outlined their functionality. Drawing from an analysis of 90 papers focusing on eye-tracking data visualization, they developed a taxonomy categorizing studies into three primary classes: point-based visualization techniques, areas of interest (AOI)-based visualization techniques, and hybrid visualization techniques combining both approaches. Additionally, they further categorized the papers on a secondary level based on the type of data represented: temporal, spatial, or spatio-temporal. Landesberger et al. [13] also introduced a comprehensive taxonomy within the domain of visual analytics. Visual analytics encompasses various forms of interaction, including information visualization, reasoning, and data processing. However, existing taxonomies for interaction techniques in these fields are separate and fail to cover the entirety of the visual analytics domain. Additionally, they use distinct terminology, complicating the analysis of their scope and overlap. The unified taxonomy addresses these limitations by encompassing all areas of visual analytics (visualization, reasoning, and data processing). Each area consists of two main subcategories: changes in the data and changes in the respective representation. Changes in the data pertain to alterations affecting the presented or underlying dataset, while changes in representation involve other forms of interaction. Changes in the data are further subdivided into two categories: changes affecting the selection of the dataset and changes to the dataset introduced by the user. This taxonomy provides a comprehensive framework for understanding and categorizing interaction techniques in visual analytics. Spiller et al. [6] proposed a computational model aimed at predicting users’ success in visual search when interacting with an information visualization from sequential eye gaze data. Three deep learning models designed for time series classification were used to analyze data collected from 60 participants engaging with both circular and organizational graph visualizations. The findings showed that the MLSTM-FCN (Multivariate Long Short Term Memory Fully Convolutional Network) model significantly outperformed both the ResNet and Fully Convolutional Network (FCN) models, as well as the baseline classifier (Logistic Regression). However, the ResNet and FCN models did not demonstrate notably superior performance compared to the baseline classifier.
An innovative user-adaptive visualization system was introduced by Steichen et al. [7] capable of predicting various properties of visualization tasks (such as task type, complexity, and difficulty), user performance (measured by task completion time), and individual cognitive abilities (including perceptual speed, visual working memory, and verbal working memory) based on eye gaze behavior. A user study was conducted, wherein participants were tasked with completing a series of visualization tasks using both bar graphs and radar graphs. Their findings indicated that, across each classification task, predictions based on gaze behavior outperformed a baseline classifier. This suggests that user eye gaze behavior offers valuable insights into visualization tasks and cognitive abilities. Interestingly, for most predictions, the classification accuracy was significantly higher even in the early stages of visualization usage, highlighting the potential of eye gaze behavior as an early indicator of user characteristics and task outcomes. Detailed analysis of each classification experiment also revealed that different features are most informative depending on the objective of the classification and the characteristics of the task or user. This underscores the potential for systems to adapt to individual differences. Muller et al. [14] examined the effectiveness of three commonly employed visualization approaches for comprehension of hierarchical data: treemap, icicle plot, and node-link diagram. They conducted a laboratory experiment during which participants were assigned to various tasks using different visualization techniques. And user performance was measured in terms of correctness and time and tracked eye movements. The findings suggest that both the node-link diagram and icicle plot demonstrated strong performance, whereas the treemap only surpassed chance level in one relatively straightforward task. Despite eye-tracking analyses indicating that the treemap effectively draws visual attention by optimizing screen-space usage, this did not translate into improved user performance. Blascheck et al. [10] presented a novel approach for assessing interactive visualization systems by collecting, synchronizing, and analyzing eye tracking, interaction, and think-aloud data simultaneously. The authors discussed challenges and potential solutions in triangulating user behavior using multiple sources of evaluation data. Experiments, utilizing both textual and visual analyses, indicated that this approach is most effective when data sources are temporally aligned using eye fixations and Area of Interests (AOI).
2.2. Capturing and Analyzing Semantic User Interactions in Visualizations
Semantic user interactions refer to interactions between users and systems where the system can understand and respond to the meaning or semantics of user actions or queries [3]. Analyzing these interactions is important as it provides valuable insights into diverse aspects of user behavior and cognitive processes. This includes understanding their reasoning, identifying personality traits, and reducing cognitive load. Moreover, semantic user interactions can facilitate personalization, enabling systems to customize responses and recommendations according to individual user preferences and requirements [15,16]. Norambuena et al. [17] proposed a mixed multi-model semantic interaction (3MSI) model designed for narrative maps to support analysts in their sensemaking processes. This method integrates semantic interaction with narrative extraction and visualization to create an interactive AI narrative sensemaking framework capable of learning from analyst interactions. To assess the performance of the 3MSI models, the authors conducted both a quantitative simulation-based evaluation and a qualitative evaluation involving case studies and expert feedback. The findings indicated that the proposed model effectively supports incremental formalism for narrative maps. Additionally, expert feedback suggested that the SI model for narrative maps holds potential value for analysts in their sensemaking processes. Batch et al. [18] introduced uxSENSE, a visual analytics system leveraging machine learning techniques to extract user behavior from audio and video recordings. The proposed method extracts multi-modal features of human behavior, including user sentiment, actions, posture, spoken words, and other relevant features, from such recordings. These extracted features are then utilized to support user experience (UX) and usability professionals in their analysis of user session data through interactive visualization. The authors conducted five expert reviews where UX professionals utilized the tool to comprehend a usability session. Based on the feedback received from UX experts, they identified critical interface adjustments while confirming the importance of machine learning-supported human-computer interaction. Endert et al. [3] presented a novel design concept, called semantic interaction, which combines the foraging abilities of statistical models with the spatial synthesis abilities of analysts. They presented ForceSPIRE, a visual analytics tool, to showcase the implementation of semantic interaction using machine learning techniques for visual analytic interaction. Through a use case study, the authors illustrated how semantic interaction has the potential to integrate the sensemaking loop, resulting in a smoother analytic process.
While interactive visualizations are becoming increasingly popular for general public use, little is known about how individuals discover the interactive functionality such as what they can do with these visualizations and what interactions are available. In the study conducted by Blascheck et al. [19], participants engaged in a lab-based experiment where their eye movements were tracked, interaction logs were recorded, and video and audio recordings were captured. Through analysis of this comprehensive dataset, the authors uncovered various exploration strategies participants employed to discover the functionality of the visualizations. Understanding these exploration strategies has led to several promising ideas for improving the discoverability of features in interactive visualizations. These suggestions include: inviting interaction, providing entry points, leveraging spatial organization, combating oscillation, supporting transitions, and scaffolding complex interactions. Endert et al. [20] presented findings from a user study that investigated the effectiveness of semantic interaction in a visual analytic prototype, named ForceSPIRE. This prototype utilizes semantic interaction to facilitate users in exploring, investigating, and gaining insights from text document collections represented in a spatial layout. The authors demonstrated that, through semantic interaction, the system captures users’ analytical reasoning by adjusting keyword weighting, allowing users to avoid direct parameter manipulation, and assisting users in collaboratively creating spatial representations based on their reasoning and intuition. Wall et al. [16] investigated the utilization of visualizing a user’s interaction history as a means to mitigate potential biases influencing the decision-making process. They employed the interaction traces technique, wherein a user’s previous interactions with data influence the visual representations in the interface. A series of experiments were conducted to assess the effectiveness of interaction history interventions on behavior and decision-making, with the aim of raising awareness of potential biases. While the experiments produced varied results, the study concluded that interaction traces, especially when presented in a summative format, could lead to behavioral changes or enhance awareness of potential unconscious biases.
Ottley et al. [21] introduced a framework designed to anticipate future interactions based on past observations. By utilizing clicks as indicators of attention, the authors developed a hidden Markov model that represents evolving attention as a sequence of unobservable states. This system can automatically infer elements of interest from passive observations of user clicks, enabling precise predictions of future interactions. To validate their approach, a user study was conducted using a crime map. The findings demonstrated that the model achieved prediction accuracies ranging from 92% to 97%. Additionally, further analysis revealed that high prediction accuracy could typically be attained after just three clicks. Xu et al. [22] conducted an extensive review of research within the data visualization and visual analytics domain, particularly focusing on the examination of user interaction and provenance data. They introduced a typology categorizing areas of application (why), encoding techniques (what), and analysis methodologies (how) of provenance data. Six fundamental motivations for analyzing provenance data were identified: 1) understanding the user, 2) evaluation of system and algorithms, 3) adaptive systems, 4) model steering, 5) replication, verification, and re-application, and 6) report generation and storytelling. Regarding the types of provenance data analyzed, four common encoding schemes were suggested: 1) sequential, 2) grammatical, 3) model-based, and 4) graphical. Lastly, the authors identified five analysis methods commonly applied to analyze provenance data: 1) classification models, 2) pattern analysis, 3) probabilistic models/prediction, 4) program synthesis, and 5) interactive visual analysis.
3. Understanding Semantic User Interactions with Visualization
Previously, user studies [2,23] were conducted to investigate the user interaction behaviors of financial analysts using a visual analytics system known as WireVis [24]. Experts were engaged in analysis studies with the system to understand their interaction patterns while evaluating wire transactions. The system utilized a synthetic dataset that contains multiple suspicious scenarios, including incompatible keywords (e.g., "baby food" and "IT consulting"), the transition of keywords (e.g., from "baby food" to "gems"), unusually high transaction amounts for local stores, continuous money transfer with a small amount, and unexpectedly large transactional amounts transferred over time. The analysts’ interactions within the system were captured and analyzed [23]. When an analyst highlights a particular wire transaction or keywords during an investigation, such interactions are recorded as semantic user interactions, indicating specific information observed by the user. At the same time, the analyst’s general patterns to investigate financial transactions can be assessed to determine their overall strategy. This includes the frequencies of observing semantic information. For example, if an analyst repeatedly highlights specific keywords, those captured keywords are emphasized to reflect the analyst’s focus on those particular activities. The effectiveness of using semantic user interactions to comprehend experts’ operational and strategic analyses was assessed by analyzing captured think-aloud transcriptions and semantic user interactions [2].
However, during the evaluation of analysts’ user interactions and analysis decisions, we found that they often had contradictory opinions (such as suspicious, not-suspicious, or inconclusive) regarding certain wire transactions. As their decisions are made based on their experiences, it becomes challenging to identify the reasons behind their conclusions. Performing an in-depth analysis of user interactions is crucial for understanding why they lead to divergent opinions (i.e., decisions) among users. We believe that it is possible to gain insights by evaluating and connecting these interactions to their decisions. To achieve this, we designed a highly interactive wire transaction analysis system (Figure 1). The system consists of two tools - (A) a wire transaction analysis tool and (B) an investigation tracing tool. The wire transaction analysis tool is an extended version of the original financial visual analytics system (WireVis), initially designed to assist analysts in identifying fraudulent financial activities by analyzing financial wire transfers (also known as wire transactions). The wire transaction analysis tool has multiple views (C) a heatmap view, (D) a strings and beads view, and (E) a keyword relation view. The heatmap view presents a grid-based representation of accounts and keywords, while the strings and beads view illustrates time-based transactions involving accounts or clusters of accounts. Lastly, the keyword relation view depicts relationships among keywords associated with wire transactions. The investigation tracing tool (B) is designed to represent users’ decisions regarding wire transactions. It consists of (F) a PCA projection view and (G) a data view. In the PCA projection view, all wire transactions are presented after applying principal component analysis (PCA) [25]. In the view, details about accounts, keywords, and actual accounts are listed in information panels and positioned left, top, and right, respectively. A further explanation of the system’s functionality is provided in the subsequent subsections.
3.1. Wire Transaction Analysis
The wire transaction analysis tool is designed to support analysts in conducting interactive analysis on wire transactions. We used the same synthetic dataset used in the studies [2,23] to create the visualization tool. As mentioned above, this dataset includes wire transfers (i.e., wire transactions) which represent electronic money transfers from one financial account to another. Wire transfers can occur either domestically, within the same country, or internationally, between different countries. These transactions leave traces of funds transferred from one financial account (referred to as account A) to another (referred to as account B). Each wire transaction encompasses details such as the sender and receiver’s account information and the amount of money transferred. Additionally, keywords are assigned to each transaction to reflect fundamental information related to the involved accounts. For instance, if account A is associated with a pharmaceutical company, the keyword "pharmaceutical" is tagged to the transaction. Similarly, if the funds are transferred to account B, which belongs to a toy manufacturing company, the keyword "toy" is tagged. The dataset includes 249 wire transactions involving 181 accounts and 29 keywords. Examples of these keywords include "Raw Materials," "Hardware & Machinery," "South Africa," "Electronics," "Pharmaceuticals", and among others.
With the wire transaction analysis tool (Figure 1(A)), analysts can perform interactive analyses to detect financial frauds on wire transactions across multiple views. In the heatmap view, users examine patterns in a hierarchical arrangement of bins. Each bin represents a cluster of grouped accounts, categorized based on keyword frequencies and transaction occurrences. In the view, keywords are displayed at the top, and transaction occurrences are shown along the left side of a vertical bar. Highlighting a bin illuminates the corresponding wire transactions and their associated keywords across all views. By default, the strings and beads view illustrates general trends in wire transactions as strings. Highlighting a bin in the heatmap view causes the corresponding transactions to appear as beads in the strings and beads view. At the same time, related keywords are highlighted by generating connected lines in the keyword relation view. The basic functionalities of this tool have been designed by mirroring the WireVis system’s design so that analysts can initiate multiple user interactions on wire transactions with related financial accounts and keywords that represent each transaction’s information. For further details, please refer to the original paper by Chang et al. [24].
3.2. User Investigation Tracing
The investigation tracing tool (Figure 1(B)) is designed as an ad-hoc tool to provide detailed information about wire transactions and users’ decisions. It consists of two views (F) a PCA projection view and (G) a data view. Those two views are internally connected. Thus, any user interactions with one view are immediately reflected in another view (brushing & linking) to support interactive analysis of wire transactions.
PCA projection view: The PCA projection view displays detailed information about all wire transactions. In this view, wire transactions are represented as rectangular-shaped glyphs. To project the transactions, computed two principal components (the first and second most dominant eigenvectors) are used to map each wire transaction onto a 2D space. Detailed information about the transactions is represented in the information panels - top (keywords), left (accounts), and right (amounts). When the user highlights a wire transaction, its corresponding information becomes visible in the information panels as connected polylines. For instance, if a wire transaction is made from account A to account B, detailed information about the transaction, such as the amount of money transferred and related keywords, is highlighted to reveal the flow of funds between the two accounts. Figure 1(F) shows an example when the user highlights a wire transaction between accounts 44 and 119. Multiple connected polylines appear to show related information about the transaction. Each polyline represents the amount of money transferred and its corresponding keywords, emphasizing its interdependence with other financial accounts and wire transactions. If multiple wire transactions are made by one account, all related transactions and their information are highlighted. Information closely related to the selected wire transaction is highlighted with orange polylines. Additionally, other information, such as wire transactions originating from the same account, is highlighted to assist the user in understanding the patterns of wire transactions, represented with bluish polylines. Analyzing multiple wire transactions originating from the same account is crucial, particularly when investigating potential fraudulent incidents involving that account. It’s important to display the interconnected links of all wire transactions from the same account because it helps analysts evaluate the transactional trail between accounts A and B. Since multiple wire transactions can generate densely connected polylines, users can selectively enable or disable the relationships among wire transactions by utilizing the check buttons located beside or above each information panel.
The PCA projection view supports multiple user interactions such as highlighting, selecting, zooming, and panning. These functionalities are very useful to assist analysts in building and validating a hypothesis with evidence. For instance, users have the ability to select or highlight wire transactions or information displayed in the information panels. If a user wishes to perform an analysis focusing on keyword investigation, they can highlight or select interesting keywords to construct a potential keyword group. This enables the user to investigate financial activities associated with that specific group of keywords. Additionally, users can investigate specific accounts to examine their overall activities using the account information panel. This feature is useful when users want to assess each account’s overall transactions as part of a preliminary investigation to identify any potentially fraudulent accounts. With the selection user interaction technique, users can conduct comparative investigations on multiple wire transactions or accounts. For example, if users want to compare the activities of certain accounts, they can enable the selection technique to display their activities as connected polylines. This allows them to directly evaluate similarities and differences by analyzing visual patterns. In this view, numerous wire transactions are depicted as small glyphs. Therefore, zooming and panning serve as effective user interaction techniques to examine detailed information about wire transactions. To facilitate these interactions, multiple buttons are arranged at the bottom of the view. The three information panels are closely connected to provide supplementary details about wire transactions. Since PCA is often utilized to identify patterns and possible outliers in various types of data [26], this PCA projection view can help users gain a deeper understanding of wire transactions. The zooming user interaction facilitates the examination of specific wire transactions, allowing users to closely analyze their patterns and trends within the zoomable 2D space. At the same time, users can view their investigation results (e.g., suspicious, not-suspicious, or inconclusive) on wire transactions within the view. Specifically, all investigators’ results are represented inside each glyph as colored cells. The investigation result is promptly added within the corresponding glyph whenever the user concludes an investigation on a specific wire transaction. This functionality is useful as it enables users to track the progress of their investigation and view other analysts’ conclusions on wire transactions. For a detailed explanation of how the investigation results are embedded in the view, please refer to Section 4.3.
Data view: The data view presents all wire transactions in the dataset using a parallel coordinates visualization. The dataset includes eight dimensions, including sending and receiver accounts, the amounts of the transactions, date information (year, month, and day), number of keywords, and actual keywords related to each transaction. To reduce the dimensions of the dataset using PCA, all categorical data have been converted to possible decimal formats. Since PCA assumes linearity across all variables, when datasets contain attributes with both continuous and discrete values, unwanted discrete variables are excluded selectively from the principal component analysis calculation. However, in this study, we employed PCA to capture variations associated with different categories. This approach is beneficial for understanding data sparsity, particularly when identifying transaction frequencies associated with related keywords at specific times of the day or year. A binary encoding technique is applied to convert categorical variables into binary bit patterns. This process generates m binary bit patterns corresponding to the total number of keywords. Initially, all bit patterns are set to "0." Depending on the keywords present in each transaction, the corresponding bit is mapped to a binary number "1." Subsequently, the mapped binary patterns are converted to decimal numbers, representing unique keyword identification numbers. While binary encoding is effective for preserving the information of each categorical variable, it often results in too many feature dimensions. Therefore, we considered the option of converting the binary representations to decimal numbers, allowing each categorical variable to be represented by a single numerical value. In the data view, check boxes are positioned at the bottom of each variable axis, supporting the option to enable or disable them for inclusion in PCA computation.
4. Tracking Semantic User Interactions
4.1. Initiating User Interactions
The wire transaction analysis tool captures semantic user interactions. The system includes multiple menu buttons located alongside each tool to support initiating and capturing user interactions. In the interactive wire transaction analysis system, various menu buttons are provided to assist users in analyzing financial data interactively. Table 1 illustrates the available menu buttons and their corresponding meanings. Each menu button enables the initiation of multiple user interactions. The wire transaction analysis tool has twelve menu buttons, facilitating the initiation of new user interactions and tracking internal semantic user interactions. For instance, by enabling the navigation button  , the user can navigate through the hierarchical clusters in the heatmap view. The heatmap view provides valuable insights by illustrating hierarchical clusters based on the occurrence of transactions of accounts and frequencies of keywords. This allows users to navigate through accounts by assessing the frequencies of transactions and keywords. Given the limited scale of the strings and beads view, users often encounter difficulty in evaluating actual transaction amounts. Therefore, a menu button
  is added to support the switch between the heatmap view and the strings and beads view, enabling users to view the representation on a larger scale. If users want to perform a comparative analysis, they can select multiple visual element(s) using selection tools
  . In particular,
  is designed to facilitate users in creating an arbitrary range of boundaries to select multiple items. When users find suspicious evidence on wire transactions, they can add text
  and drawing
  annotations. Users can enter an investigation decision (either suspicious, not-suspicious, or inconclusive) using
  . Subsequently, these entered investigation outcomes are incorporated into the investigation tracing tool.
, the user can navigate through the hierarchical clusters in the heatmap view. The heatmap view provides valuable insights by illustrating hierarchical clusters based on the occurrence of transactions of accounts and frequencies of keywords. This allows users to navigate through accounts by assessing the frequencies of transactions and keywords. Given the limited scale of the strings and beads view, users often encounter difficulty in evaluating actual transaction amounts. Therefore, a menu button is added to support the switch between the heatmap view and the strings and beads view, enabling users to view the representation on a larger scale. If users want to perform a comparative analysis, they can select multiple visual element(s) using selection tools . In particular, is designed to facilitate users in creating an arbitrary range of boundaries to select multiple items. When users find suspicious evidence on wire transactions, they can add text and drawing annotations. Users can enter an investigation decision (either suspicious, not-suspicious, or inconclusive) using . Subsequently, these entered investigation outcomes are incorporated into the investigation tracing tool.The tool also supports multi-touch user interactions, which are particularly useful in collaborative multi-touch table environments [27]. Users can create and share multiple workspaces using the workspace creation and rotation buttons  . Although creating additional workspaces may not always be effective in a desktop environment [27], this feature can still be valuable for users who need to manage multiple investigation results in a temporary workspace. It provides a convenient method for handling and tracking various investigation sessions to increase flexibility in organizing the analysis process. Moreover, tracing the wire transactions is supported by enabling the toggle button as multiple wire transactions are often made in each account
  .
.  is embedded in each information panel to support toggling the representation of connected polylines for the highlighted wire transaction(s) to accounts, keywords, and transaction amounts. Figure 1(B) demonstrates an example of displaying polylines based on the user’s interaction of highlighting a wire transaction in the PCA projection view. Since this view is designed as a scalable interface, it enables users to navigate the view freely by initiating zooming
  and panning
  . As previously mentioned, all wire transactions are represented as small glyphs. Therefore, detailed information about wire transactions becomes accessible when users interact with the glyphs, for example through highlighting, selecting, or zooming. However, visual clutter may occur when a high volume of transactions results in densely packed polylines. This clutter can lead to confusion, making it challenging for users to understand the meaning of the visual representation clearly. Zooming and panning interactions are effective in helping users comprehend or interact effectively with the represented information. The wire transaction analysis tool enables users to classify each transaction as suspicious, not suspicious, or inconclusive.
  highlights all wire transactions with recorded investigation decisions within the PCA projection view. Additionally, activating the button
  displays all recorded investigation results, organizing them into clusters that emphasize the analysis decisions of each individual user.
. Although creating additional workspaces may not always be effective in a desktop environment [27], this feature can still be valuable for users who need to manage multiple investigation results in a temporary workspace. It provides a convenient method for handling and tracking various investigation sessions to increase flexibility in organizing the analysis process. Moreover, tracing the wire transactions is supported by enabling the toggle button as multiple wire transactions are often made in each account . is embedded in each information panel to support toggling the representation of connected polylines for the highlighted wire transaction(s) to accounts, keywords, and transaction amounts. Figure 1(B) demonstrates an example of displaying polylines based on the user’s interaction of highlighting a wire transaction in the PCA projection view. Since this view is designed as a scalable interface, it enables users to navigate the view freely by initiating zooming and panning . As previously mentioned, all wire transactions are represented as small glyphs. Therefore, detailed information about wire transactions becomes accessible when users interact with the glyphs, for example through highlighting, selecting, or zooming. However, visual clutter may occur when a high volume of transactions results in densely packed polylines. This clutter can lead to confusion, making it challenging for users to understand the meaning of the visual representation clearly. Zooming and panning interactions are effective in helping users comprehend or interact effectively with the represented information. The wire transaction analysis tool enables users to classify each transaction as suspicious, not suspicious, or inconclusive. highlights all wire transactions with recorded investigation decisions within the PCA projection view. Additionally, activating the button displays all recorded investigation results, organizing them into clusters that emphasize the analysis decisions of each individual user.4.2. Capturing User Interactions
Capturing user interactions is crucial for understanding user behaviors and gaining valuable insights. Previous research, as discussed in Section 2, has extensively explored ways to capture user analysis processes in visualizations by utilizing eye-tracking devices or systematically recording user interactions. Although eye-tracking devices are effective in analyzing user interactions within computer-generated 3D environments [28], they often require additional post-evaluation and analysis procedures to align the captured data with the visualization. Therefore, researchers in the visualization community have often considered capturing both low- and high-level user interactions [29]. Low-level user interactions represent mouse actions like clicks, dragging, and scrolling, directly affecting the manipulation of the visualization interface. On the other hand, high-level user interactions, including zooming, panning, and toggling, involve conceptual engagements that connect users’ low-level actions with visual elements, facilitating a deeper comprehension of these elements. To evaluate users’ intentions while using a visual analytics system, we considered capturing semantic user interactions, which indicate the meaning of what the user is interacting with. For instance, if a user investigates a wire transaction involving account number 80 (i.e, Account 80 → Account 10, $8675.0, 2015-04-12, Financial Service), the user might move a mouse cursor (i.e., highlighting) over the transaction to access detailed information, including a receiver account, keywords, and transaction amount. This mouse interaction is captured as a low-level interaction. Simultaneously, its underlying meaning, "the user highlighted on the transaction (Account 80 → Account 10, $8675.0, 2015-04-12)," is captured as a semantic user interaction.
4.3. Connecting Investigation Results to User Interactions
When analyzing wire transactions for potential financial fraud, financial analysts typically classify each transaction as suspicious, not suspicious, or inconclusive based on the information available during the investigation. As mentioned previously, the wire transaction analysis tool is internally linked with the investigation tracing tool, allowing for the immediate display of investigators’ decisions within the visualization. Specifically, when an analyst investigates a specific wire transaction and records an investigation result in the wire transaction analysis tool, this decision is promptly reflected in the investigation tracing tool. Figure 2 shows analysts’ conclusions using different color attributes: suspicious (brown), (B) not-suspicious (blue), or (C) inconclusive (green). Each visual glyph, represented as a rectangle, corresponds to a wire transaction. A rectangle outlined with no colored cells indicates that no investigation has been conducted on that transaction yet. If analysts have investigated a specific transaction, its corresponding glyph is depicted as a rectangular grid cell filled with their analysis decisions. The size of each grid cell varies depending on the number of investigation results accumulated in the system. Large grid cell size indicates a greater number of results. Thus, a denser grid cell is generated when numerous investigation results exist. By default, the investigation tracing tool displays all expert analysts’ decisions and their interaction logs, including semantic-level interactions, collected from the study [2]. Figure 2(A) and (B) show analysis sessions where only one analyst has provided an investigation result, whereas Figure 2(C) illustrates a case where two analysts have analyzed a wire transaction and concluded that it is not suspicious. This functionality plays a crucial role in helping users understand the varying analyses of others since analysts frequently hold conflicting opinions. Figure 2(D) demonstrates a scenario where six analysts evaluated the same wire transaction and arrived at different conclusions. Three analysts deemed the transaction suspicious, while the other three considered it inconclusive. These assessments were based on the data available within the system. Unfortunately, their decisions cannot be confirmed or refuted due to a lack of ground truth information. However, examining their approaches is crucial to understanding the distinctive analytical paths that led them to different conclusions. To facilitate this analysis, we developed a visual state transition matrix to explore semantic user interactions. Details are provided in Section 5.
5. Analyzing Semantic User Interactions
Examining semantic user interactions is crucial for comprehending how analysts have reached their conclusions while utilizing visualization systems. In the visualization community, numerous researchers have investigated the relationship between user interactions and their reasoning and thinking processes. This analysis is commonly regarded as a cognitive process, wherein users interpret the meaning of visually represented elements. We believe that users develop hypotheses while engaging in interactive visual analysis to identify potential financial fraud in wire transactions. These hypotheses are then tested through continued interactions with the system, ultimately leading to conclusions that classify transactions as suspicious, not suspicious, or inconclusive. Analyzing the captured semantic user interactions helps us to understand users’ intents during synthesis (hypothesis generation). This analysis provides valuable insights into their cognitive processes and aids in reconstructing their internal thinking models.
Semantic user interactions are continuously captured during interactions with the visualization system. To analyze the flow of these interactions, we utilize a Markov chain model. This mathematical model describes sequences of potential events or states, where each future state is determined solely by the current state, independent of the events that preceded it. In our study, we hypothesized that future user interactions are primarily influenced by current or past interactions during visual analysis. We further assumed that each user interaction represents a distinct state, corresponding to a specific condition or situation within the analysis. To test this hypothesis, we constructed a visual state transition matrix to illustrate a sequential model of user interactions. Specifically, we defined a state space by following Markov chain as a state space, a transition matrix, and an initial state or initial distribution as follows,
- State Space (): A set of states that represent the changes in the current visual representation generated by user interactions. For example, in our visualization system, the state space is defined . Each state is created whenever the user initiates a semantic user interaction. It can be clusters, accounts, keywords, or a combination of clusters and keywords or accounts.
- Transition Matrix (): This is defined as a square matrix to describe the probabilities of moving from one state to another. Depending on the size n of the state space, will be matrix, where the entry gives the probability of transitioning from state i to state j in one step (called transition probabilities).
- Initial State or Initial Distribution (): This describes the starting (i.e., initial) state of the analysis. Since each state is mapped to transition from one state to another, the probability distribution over the initial states is set to zero. Transitional distribution is measured by examining the duration of time the user spends in the current state.
With the Markov chain, a transition matrix (P, also known as a stochastic matrix) is created to represent all possible transitions between states. To represent distinct states, n binary bits are generated using a binary encoding technique. The size of the transition matrix P can be represented as , where denotes the set of all real-valued matrices with dimensions . The dimension n is determined by the sizes of hierarchy cluster nodes (C), bank accounts (A), keywords (K), and transactions (T), calculated as . This arrangement is adopted because all financial data are organized as cells along the cluster IDs and keywords in the heatmap view. In our dataset, a transition matrix is created. Each row i of the matrix satisfies the condition , ensuring that the user’s current state transitions to another state in the next step.
Figure 3 represents a visual state transition matrix that illustrates an analyst’s semantic user interactions. Changes in transactional states, as reflected by user interactions, are highlighted with connected spline-curved polylines. Red arrow indicators are embedded within the polylines to facilitate understanding of transitions within the matrix. In the matrix, the current and future state is represented along the rows (y-axis) and the columns (x-axis), respectively. The total time spent, denoted as , in each row () and column () is displayed along the matrix’s edges. A reddish triangle marks that the analyst began investigating the cell, specifically CID:4 Singapore, in the heatmap view. An inverted bluish triangle denotes the ending state, indicating that the analyst has completed investigating the keyword ’Brazil’ in the keyword relation view. The transition matrix is designed as a zoomable user interface, supporting user interactions such as zooming and panning. This allows the user to navigate the matrix freely by zooming in and out as needed. The figure shows that the analyst initiated the analysis of wire transactions from CID:187 (located in the top left corner) and quickly transitioned to explore related keywords, such as ’Singapore,’ ’India,’ ’Minerals & Gems’ (located in the center). The magnified region in the figure represents the duration the analyst spent analyzing clusters (CIDs: 178, 187, 193, 199) associated with the keywords - ’Arts & Crafts,’ ’India,’ and ’Minerals & Gems’). The probability of transitioning from state i to state j is presented along with the total time the analyst spent within each state. For example, the analyst spent about 0.55 and 0.98 seconds analyzing CID:187 and CID:193 with the keyword ’India,’ respectively. Since the analyst only investigated certain states based on their interests, many states remain unexplored. Given the large size of the state transaction matrix (), comprehending the analyst’s transition movements clearly is not easy. Therefore, a hiding feature has been added to render all unexplored states invisible in the transition matrix.
Figure 4 represents the transition matrix after unexplored states have been hidden, resulting in a reduced transition matrix. This adjustment makes the flow of user interactions much clearer and easier to follow. It shows that the analyst began the analysis from the cluster associated with the keyword ’Singapore’ (indicated by the reddish triangle). By examining the duration of time spent in each state, we observed that the analyst devoted considerable time to analyzing wire transactions involving the keywords ’India’ and ’Brazil.’ In particular, the analyst spent nearly 984 seconds (700 seconds + 284 seconds) evaluating clusters related to the keyword ’India’ (as highlighted in the cells on the right side of the matrix). Additionally, the bluish rectangular cell indicates that the analyst spent the longest duration, approximately 1142 seconds, evaluating the wire transactions containing the ’Brazil’ keyword.
6. Evaluating Semantic User Interactions
As discussed earlier, capturing semantic user interactions is crucial for understanding the user’s analytical procedures within a visualization system. However, interpreting these interactions is not easy due to their complex and varied nature. For instance, each interaction involves multiple dimensions, such as the timing, sequence, and context of actions, which can differ significantly from one user to another. Additionally, designing a standardized framework for analyzing these interactions is challenging because visualization tools are often tailored to specific domains. Therefore, we utilized a machine learning-based analysis to determine whether these interactions can be classified and grouped into identifiable clusters based on outcomes. Specifically, we used the semantic user interaction dataset generated as part of the study [2,23]. The dataset includes sixty analysis sessions by ten analysts, denoted as , where each represents a distinct analysis session and indicates individual semantic user interactions within that session. Each session concludes with a decision , categorized as suspicious, not-suspicious, or inconclusive. The series of user interactions within each session consists of textual information that captures the user’s analytical flow in the visualization. To analyze these interactions, we applied natural language processing (NLP), treating each interaction as a discrete data element that emphasizes the user’s action within the visualization.
6.1. Data Vectorization
Since the captured semantic user interactions consist solely of textual information, data quantization is necessary to analyze them using statistical techniques. To this end, two common vectorization techniques used in text data analysis - Bag-of-Words (BOW) and Term Frequency-Inverse Document Frequency (TF-IDF) [30] - are employed to convert data into numerical representations. The BOW technique generates numerical vectors by counting tokenized words from the user interactions. For instance, the semantic user interactions, depicted in Figure 4, are quantitatively analyzed by conducting a frequency analysis as follows:
where A and K represent the account and keyword ID number, respectively. B indicates the bead ID number in the string and beads view. and denote the sender and receiver account in a wire transaction, respectively. The power value represents the frequency of each semantic information analyzed by the analyst. In detail, indicates that she evaluated the account 4 three times in the heatmap view. means that the keyword identifier observed by the analysis 28 times. Since each bead in the string and beads view is connected to a wire transaction, the same number of frequencies (i.e., observed 15 times) appears in the beads and transactions. Based on this frequency information, each semantic user interaction is converted into a vector, where each dimension corresponds to a unique semantic user interaction. The value in each dimension represents the frequency. As previously discussed, not all states in the transition matrix are traversed by analysts, resulting in sparse vectors that contain many dimensions with zero values, indicating states that were not visited. From the analysis of the ten analysts’ semantic user interactions, a vector size of 1136 is created by aggregating all captured semantic user interactions. Since the analysts have made decisions across the sixty analysis sessions, a vectorized dataset with dimensions is subsequently created.
TF-IDF is also considered because it is widely used in text analysis to compute the frequency and importance of each term in a document. In this study, TF-IDF is employed to transform the semantic user interactions into numerical feature vectors. Each analyst’s analysis session is treated as a collection of terms for which TF-IDF values are computed. Thus, each session is represented as a vector of TF-IDF values corresponding to the terms it contains. Specifically, Term Frequency (TF) is calculated to determine the frequency of each term within a session as , where denotes the occurrences of term t in each analysis session S. The denominator, , indicates the total number of terms that appear in S. Inverse Document Frequency (IDF) assesses the importance of each term in all analysis sessions using , where N represents the total number of analysis sessions (i.e., in this study). denotes the number of sessions containing the term t. Then, TF-IDF is calculated by multiplying TF and IDF to represent the importance of each term in each analysis session as . Utilizing TF-IDF is effective because it not only evaluates the frequency of the terms within each analysis session but also weights them according to their distinctiveness across all sessions. This helps to identify terms that are particularly relevant to a specific session and distinctive within the context of all sessions. Like the BOW technique, TF-IDF generates feature vectors with the same dimensions . This similarity in dimensions arises because the same set of unique tokens (i.e., terms), representing semantic user interaction states, is used in both the BOW and TF-IDF techniques.
6.2. Data Oversampling
The dataset is highly imbalanced, consisting of 27 suspicious, 21 not-suspicious, and 12 inconclusive analysis sessions. If machine learning algorithms are applied to imbalanced data, the results might not be reliable because computation accuracy tends to be biased towards the majority class. Consequently, the performance in accurately analyzing the minority class (i.e., inconclusive analysis sessions) can be diminished. Furthermore, if a machine learning model is designed with imbalanced data, it may exhibit increased false positives and negatives. To address the imbalance problem, researchers have proposed various undersampling and oversampling techniques [31]. Although both techniques are good for handling imbalanced data, we utilized an oversampling technique because of the relatively small size of the dataset. Specifically, Synthetic Minority Over-sampling Technique (SMOTE) [32] is used to oversample the representation of the minority class in the vectorized data. SMOTE balances the class distribution by randomly selecting an instance from the minority class . For each selected instance, k nearest neighbors of an instance are selected as . Then, a synthetic instance is created by following , where l is randomly chosen from from and is a random value . With SMOTE, the dataset is balanced to include an equal total of 27 instances across all analysis sessions.
6.3. Classifying Analysis Sessions
To analyze the semantic user interactions in the analysis sessions, we applied five classification algorithms: Multinomial Naive Bayes (MultinomialNB), Support Vector Classifier (SVC), Random Forest (RF), Logistic Regression (LR), and Gradient Boosting (GB). Each algorithm brings unique advantages, allowing for a comprehensive examination of the data through effective classification.
MultinomialNB is a probabilistic classification algorithm that uses Bayes’ theorem. It assumes feature independence, indicating no relationship between features. Thus, it utilizes multinomial distribution to compute the probability of observing counts or frequencies of different categories (terms) in a fixed number of independent trials. Since it is designed to analyze discrete data, it is commonly utilized in text data analysis. In our study, we utilized MultinomialNB to compute the probability of the vectorized semantic user interactions, where is the prior probability of decision and is the likelihood of the feature vector . Given an analysis decision during training, is computed as: , where is the probability of observing the i-th term under decision . Each term’s frequency contributes to the likelihood calculation. Given a new feature vector , MultinomialNB calculates the posterior probability of each decision using Bayes’ theorem as , where is computed as the sum of the likelihoods of under each decision weighted by the respective prior probabilities.
SVC identifies support vectors as an optimal hyperplane separating the feature space classes. Although it is computationally intensive, it is good for analyzing large, complex data. For the given vectorized data, it finds a hyperplane in n-dimensional space as , W is the normal vector to the hyperplane. X and b are feature vector and bias, respectively. As a constrained optimized problem, it maximizes margin while minimizing classification errors. To find the optimal decision boundary for the vectorized semantic user interaction data, Radial Basis Function (RBF) kernel is used to determine the nonlinear decision boundary, where is a parameter for the RBF kernel used to define the influence of a single data point in each training. In our study, is used.
As an ensemble technique, RF is a computationally intensive algorithm because it constructs multiple decision trees to determine the optimal classification. It uses bootstrapping aggregation to generate random samples to decrease the variance of a model. Thus, it provides better results than the traditional decision tree algorithm (i.e., creating a single decision tree). However, interpreting the results can be difficult because of the complexity of the ensemble of multiple decision trees. LR is a binary classification technique and uses a logistic function to evaluate a given instance by evaluating its probabilities. Since we have three decisions as classes, multinomial LR is used. It predicts the probability with softmax function that a given observation belongs to each decision class, where is the coefficient vector for class and is the feature vector. The log-likelihood function is used to estimate the coefficient vector for all classes to find the optimal best fit for the function. Lastly, as an ensemble learning technique, GB builds a sequence of weak models (decision trees) and combines them to form a strong model iteratively. It minimizes loss to the target value as , L is the loss function applied to gradients and is the predicted value. For the loss function, we used a logarithmic loss function to do the classification with the vectorized features.
Table 2 shows a performance difference with the classification algorithms to classify analysts’ decisions. 5-fold cross-validation was employed to assess the performances. Overall, we observed similar results across different vectorized data. This may be because of the repeated patterns in the captured semantic user interaction data. Although TF-IDF assigns weights to the semantic user interaction states based on the measured TF and IDF values, the presence of numerous repeated patterns causes the results from the TF-IDF vectorized data to be closely similar to those obtained using the BOW vectorized data. Among the five algorithms, MultinomialNB showed superior performance across all metrics - accuracy, precision, recall, and F1-score. On the contrary, Gradient Boosting (GB) exhibited relatively lower performance but showed minor variances in the measured scores.
We also evaluated performance differences depending on analysis decisions of suspicious (S), not-suspicious (N), and inconclusive (I) (see Table 3). Average performance differences were measured to understand the effectiveness of classifying analysts’ decisions. With MultinomialNB and GB, we found higher scores in all metrics for classifying I decisions. However, other classification algorithms showed distinctive results. With SVC, we found that accuracy and recall scores were high in classifying the S decisions. However, precision and F1-score showed high scores in I decisions. Similar to SVC results, we found high scores of precision and F1-scores in classifying I decisions with RF. We also noticed that N decisions showed high scores in accuracy and recall when applying RF. When utilizing LR, accuracy, recall, and F1-score showed high performances in I decisions. But, precision scores showed high performances for N decisions. Thus, if classification accuracy is important for understanding the analysts’ I decisions, utilizing MultinomianlNB, LR, and GB should be considered. However, since most analysts’ goal is to determine whether analyzed wire transactions become suspicious (S) or not-suspicious (N), using SVC and RF become the most important classification algorithms for evaluating captured semantic user interactions. The classification results indicate that we can successfully classify the user interactions depending on their decisions. Most importantly, MultinomianlNB showed the highest accuracy (about 96%) to classify I decisions. SVC and RF also performed well in classifying S and N decisions by showing the accuracies of 92% and 81%, respectively. These results emphasize that semantic user interactions can be utilized to understand users’ analytical processes by connecting them to their decisions. Furthermore, integrating the captured user interactions into a visualization can guide users in solving analytical problems. Thus, this study result provided us with a possible future direction for understanding the effectiveness of integrating the previously captured semantic user interactions to improve users’ overall performance in solving any given visual analytical problems. Since it requires extensive user studies, we leave this as our future work.
7. Conclusion and Future Works
In this paper, we explored semantic user interactions within a visualization system designed for analyzing financial fraud in wire transactions. Since financial analysts can utilize this system to assess whether transactions are suspicious, understanding the procedures they employ during their analysis is crucial for gaining insights into how they approach decision-making. By capturing and examining semantic user interactions, we can better understand the analysts’ analytical processes and the reasoning behind their decisions. This understanding is essential for evaluating the effectiveness of the visualization tools and enhancing decision support in financial fraud analysis. Since financial analysts’ decisions are diverse and occasionally contradict each other, tracing their user interactions is vital for understanding their reasoning and assessing the effectiveness of the visualization tools employed. To analyze captured semantic user interactions, we utilized a Markov chain model to create a visual state transition matrix. It supports tracing each user’s performed analytical approaches to their decisions. To explore the possibility of linking user interactions to decision-making processes, we applied five classification algorithms. The results, with an average classification accuracy of about 70%, demonstrated the effectiveness of our method in clarifying analysts’ analytical decisions through the analysis of semantic interactions.
For future works, we plan to test our proposed approach by collecting more semantic user interaction data. Additionally, we plan to assess the significance of incorporating both low- and high-level user interactions to deepen our understanding of users’ analytical procedures when utilizing visualization applications to solve analytical problems. We also intend to employ a deep learning technique, RNN (recurrent neural network) [33]. It handles sequential data more effectively, such as text, speech, and time series. Since the captured user interactions are sequential data generated by each user, RNN would be useful for effectively analyzing the interaction data. Furthermore, we plan to extend our research to include the integration of captured user interactions into the visualization tools and evaluate the impact of such integration on the tools’ effectiveness in assisting users with solving analytical problems.
Author Contributions
Conceptualization, D.H.J.; methodology, D.H.J. and S.Y.J.; software, D.H.J; validation, D.H.J., B.K.J. and S.Y.J.; formal analysis, D.H.J, B.K.J. and S.Y.J.; writing—original draft preparation D.H.J, B.K.J. and S.Y.J.; writing—review and editing, D.H.J, B.K.J. and S.Y.J.; visualization, D.H.J.; funding acquisition, D.H.J and S.Y.J. All authors have read and agreed to the published version of the manuscript.
Funding
This material is based upon work supported by the Army Research Office (Grant No. W911NF-23-1-0217) and the National Science Foundation (Grant No. 2107451). The views and conclusions contained in this document are those of the authors and should not be interpreted as representing the official policies, either expressed or implied, of the National Science Foundation, the Army Research Office, or the U.S. Government. The U.S. Government is authorized to reproduce and distribute reprints for Government purposes notwithstanding any copyright notation herein.
Institutional Review Board Statement
Not applicable.
Informed Consent Statement
Not applicable.
Data Availability Statement
Dataset available on request from the authors.
Conflicts of Interest
The authors declare no conflicts of interest. The funders had no role in the design of the study; in the collection, analyses, or interpretation of data; in the writing of the manuscript; or in the decision to publish the results.
Appendix A
Appendix A.1
The appendix is an optional section that can contain details and data supplemental to the main text. For example, explanations of experimental details that would disrupt the flow of the main text, but nonetheless remain crucial to understanding and reproducing the research shown; figures of replicates for experiments of which representative data is shown in the main text can be added here if brief, or as Supplementary data. Mathematical proofs of results not central to the paper can be added as an appendix.
Appendix B
All appendix sections must be cited in the main text. In the appendixes, Figures, Tables, etc. should be labeled starting with `A’, e.g., Figure A1, Figure A2, etc.
References
- Valtakari, N.V.; Hooge, I.T.C.; Viktorsson, C.; Nyström, P.; Falck-Ytter, T.; Hessels, R.S. Eye tracking in human interaction: Possibilities and limitations. Behavior Research Methods 2021, 53, 1592–1608. [Google Scholar] [CrossRef] [PubMed]
- Dou, W.; Jeong, D.H.; Stukes, F.; Ribarsky, W.; Lipford, H.R.; Chang, R. Recovering reasoning processes from user interactions. IEEE Comput. Graph. Appl. 2009, 29, 52–61. [Google Scholar] [CrossRef] [PubMed]
- Endert, A.; Fiaux, P.; North, C. Semantic interaction for visual text analytics. In Proceedings of the Proceedings of the SIGCHI conference on Human factors in computing systems; 2012; pp. 473–482. [Google Scholar]
- Jeong, D.H.; Ji, S.Y.; Ribarsky, W.; Chang, R. A state transition approach to understanding users’ interactions. In Proceedings of the 2011 IEEE Conference on Visual Analytics Science and Technology (VAST); 2011; pp. 285–286. [Google Scholar] [CrossRef]
- Meyn, S.; Tweedie, R. Markov Chains and Stochastic Stability, first ed.; Springer, 1996.
- Spiller, M.; Liu, Y.H.; Hossain, M.Z.; Gedeon, T.; Geissler, J.; Nürnberger, A. Predicting Visual Search Task Success from Eye Gaze Data as a Basis for User-Adaptive Information Visualization Systems. ACM Transactions on Interactive Intelligent Systems 2021, 11, 1–25. [Google Scholar] [CrossRef]
- Steichen, B.; Conati, C.; Carenini, G. Inferring Visualization Task Properties, User Performance, and User Cognitive Abilities from Eye Gaze Data. ACM Transactions on Interactive Intelligent Systems 2014, 4, 1–29. [Google Scholar] [CrossRef]
- Conati, C.; Lallé, S.; Rahman, M.A.; Toker, D. Comparing and Combining Interaction Data and Eye-tracking Data for the Real-time Prediction of User Cognitive Abilities in Visualization Tasks. ACM Transactions on Interactive Intelligent Systems 2020, 10, Article–12. [Google Scholar] [CrossRef]
- Blascheck, T.; Ertl, T. Towards analyzing eye tracking data for evaluating interactive visualization systems. In Proceedings of the Proceedings of the Fifth Workshop on Beyond Time and Errors: Novel Evaluation Methods for Visualization, 2014, p. 70–77.
- Blascheck, T.; John, M.; Koch, S.; Bruder, L.; Ertl, T. Triangulating user behavior using eye movement, interaction, and think aloud data. In Proceedings of the Proceedings of the Ninth Biennial ACM Symposium on Eye Tracking Research & Applications, 2016, p. 175–182.
- Alam, S.S.; Jianu, R. Analyzing Eye-Tracking Information in Visualization and Data Space: From Where on the Screen to What on the Screen. IEEE Transactions on Visualization and Computer Graphics 2017, 23, 1492–1505. [Google Scholar] [CrossRef] [PubMed]
- Blascheck, T.; Kurzhals, K.; Raschke, M.; Burch, M.; Weiskopf, D.; Ertl, T. Visualization of Eye Tracking Data: A Taxonomy and Survey. COMPUTER GRAPHICS forums 2017, 36, 260–284. [Google Scholar] [CrossRef]
- von Landesberger, T.; Fiebig, S.; Bremm, S.; Kuijper, A.; Fellner, D.W. Interaction Taxonomy for Tracking of User Actions in Visual Analytics Applications. Handbook of Human Centric Visualization; Springer, 2014.
- Muller, N.H.; Liebold, B.; Pietschmann, D.; Ohler, P.; Rosenthal, P. Visualizations for Hierarchical Data: Analyzing User Behavior and Performance with Eye Tracking. International Journal on Advances in Software 2017, 10, 385–396. [Google Scholar]
- Dai, H.; Mobasher, B. Integrating Semantic Knowledge with Web Usage Mining for Personalization. 2009.
- Wall, E.; Narechania, A.; Coscia, A.J.; Paden, J.; Endert, A. Left, Right, and Gender: Exploring Interaction Traces to Mitigate Human Biases. IEEE Transactions on Visualization and Computer Graphics 2021, PP, 1–1. [Google Scholar] [CrossRef] [PubMed]
- Keith Norambuena, B.F.; Mitra, T.; North, C. Mixed Multi-Model Semantic Interaction for Graph-based Narrative Visualizations. In Proceedings of the Proceedings of the 28th International Conference on Intelligent User Interfaces, 2023, pp. 866–888.
- Batch, A.; Ji, Y.; Fan, M.; Zhao, J.; Elmqvist, N. uxSense: Supporting User Experience Analysis with Visualization and Computer Vision. IEEE Transactions on Visualization and Computer Graphics, 2023; 1–15. [Google Scholar] [CrossRef]
- Blascheck, T.; Vermeulen, L.M.; Vermeulen, J.; Perin, C.; Willett, W.; Ertl, T.; Carpendale, S. Exploration Strategies for Discovery of Interactivity in Visualizations. IEEE Transactions on Visualization and Computer Graphics 2019, 25, 1407–1420. [Google Scholar] [CrossRef] [PubMed]
- Endert, A.; Fiaux, P.; North, C. Semantic Interaction for Sensemaking: Inferring Analytical Reasoning for Model Steering. IEEE Transactions on Visualization and Computer Graphics 2012, 18, 2879–2888. [Google Scholar] [CrossRef] [PubMed]
- Ottley, A.; Wan, R.G.R. Follow The Clicks: Learning and Anticipating Mouse Interactions During Exploratory Data Analysis. In Proceedings of the Eurographics Conference on Visualization (EuroVis); 2019; pp. 41–52. [Google Scholar]
- Xu, K.; Ottley, A.; Walchshofer, C.; Streit, M.; Chang, R.; Wenskovitch, J. Survey on the Analysis of User Interactions and Visualization Provenance. Computer Graphics Forum 2020, 39, 757–783. [Google Scholar] [CrossRef]
- Jeong, D.H.; Dou, W.; Lipford, H.; Stukes, F.; Chang, R.; Ribarsky, W. Evaluating the relationship between user interaction and financial visual analysis. In Proceedings of the Visual Analytics Science and Technology, 2008. VAST ’08. IEEE Symposium on, 2008, pp. 83 –90.
- Chang, R.; Ghoniem, M.; Kosara, R.; Ribarsky, W.; Yang, J.; Suma, E.; Ziemkiewicz, C.; Kern, D.; Sudjianto, A. WireVis: Visualization of Categorical, Time-Varying Data From Financial Transactions. In Proceedings of the Visual Analytics Science and Technology, 2007. VAST ’07. IEEE Symposium on, 2007, pp. 155–162.
- Jolliffe, I.T. Principal Component Analysis; Springer Series in Statistics; Springer-Verlag: New York, 2002. [Google Scholar] [CrossRef]
- Gewers, F.L.; Ferreira, G.R.; Arruda, H.F.D.; Silva, F.N.; Comin, C.H.; Amancio, D.R.; Costa, L.D.F. Principal Component Analysis: A Natural Approach to Data Exploration. ACM Comput. Surv. 2021, 54. [Google Scholar] [CrossRef]
- Jeong, D.H.; Ji, S.Y.; Suma, E.A.; Yu, B.; Chang, R. Designing a collaborative visual analytics system to support users’ continuous analytical processes. Human-centric Computing and Information Sciences 2015, 5, 5. [Google Scholar] [CrossRef]
- Adhanom, I.B.; MacNeilage, P.; Folmer, E. Eye Tracking in Virtual Reality: a Broad Review of Applications and Challenges. Virtual Reality 2023, 27, 1481–1505. [Google Scholar] [CrossRef] [PubMed]
- Endert, A.; Chang, R.; North, C.; Zhou, M. Semantic Interaction: Coupling Cognition and Computation through Usable Interactive Analytics. IEEE Computer Graphics and Applications 2015, 35, 94–99. [Google Scholar] [CrossRef]
- Li, Q.; Peng, H.; Li, J.; Xia, C.; Yang, R.; Sun, L.; Yu, P.S.; He, L. A Survey on Text Classification: From Traditional to Deep Learning. ACM Trans. Intell. Syst. Technol. 2022, 13. [Google Scholar] [CrossRef]
- He, H.; Ma, Y. Imbalanced Learning: Foundations, Algorithms, and Applications, 1st ed.; Wiley-IEEE Press, 2013.
- Chawla, N.V.; Bowyer, K.W.; Hall, L.O.; Kegelmeyer, W.P. SMOTE: synthetic minority over-sampling technique. J. Artif. Int. Res. 2002, 16, 321–357. [Google Scholar] [CrossRef]
- Lalapura, V.S.; Amudha, J.; Satheesh, H.S. Recurrent Neural Networks for Edge Intelligence: A Survey. ACM Comput. Surv. 2021, 54. [Google Scholar] [CrossRef]
Figure 1.
An interactive wire transaction analysis system consisting of two tools - (A) a wire transaction analysis tool and (B) an investigation tracing tool. Similar to the original system (WireVis), the wire transaction analysis tool consists of multiple views - (C) heatmap view, (D) strings and beads view, and (E) keyword relation view. The system allows the user to analyze and investigate wire transactions. The investigation tracing tool has been added to support understanding the user’s analysis decisions. It has two views (F) a PCA Projection view and (G) a data view. The tool shows additional information about wire transactions regarding the money flows with keywords and amounts.
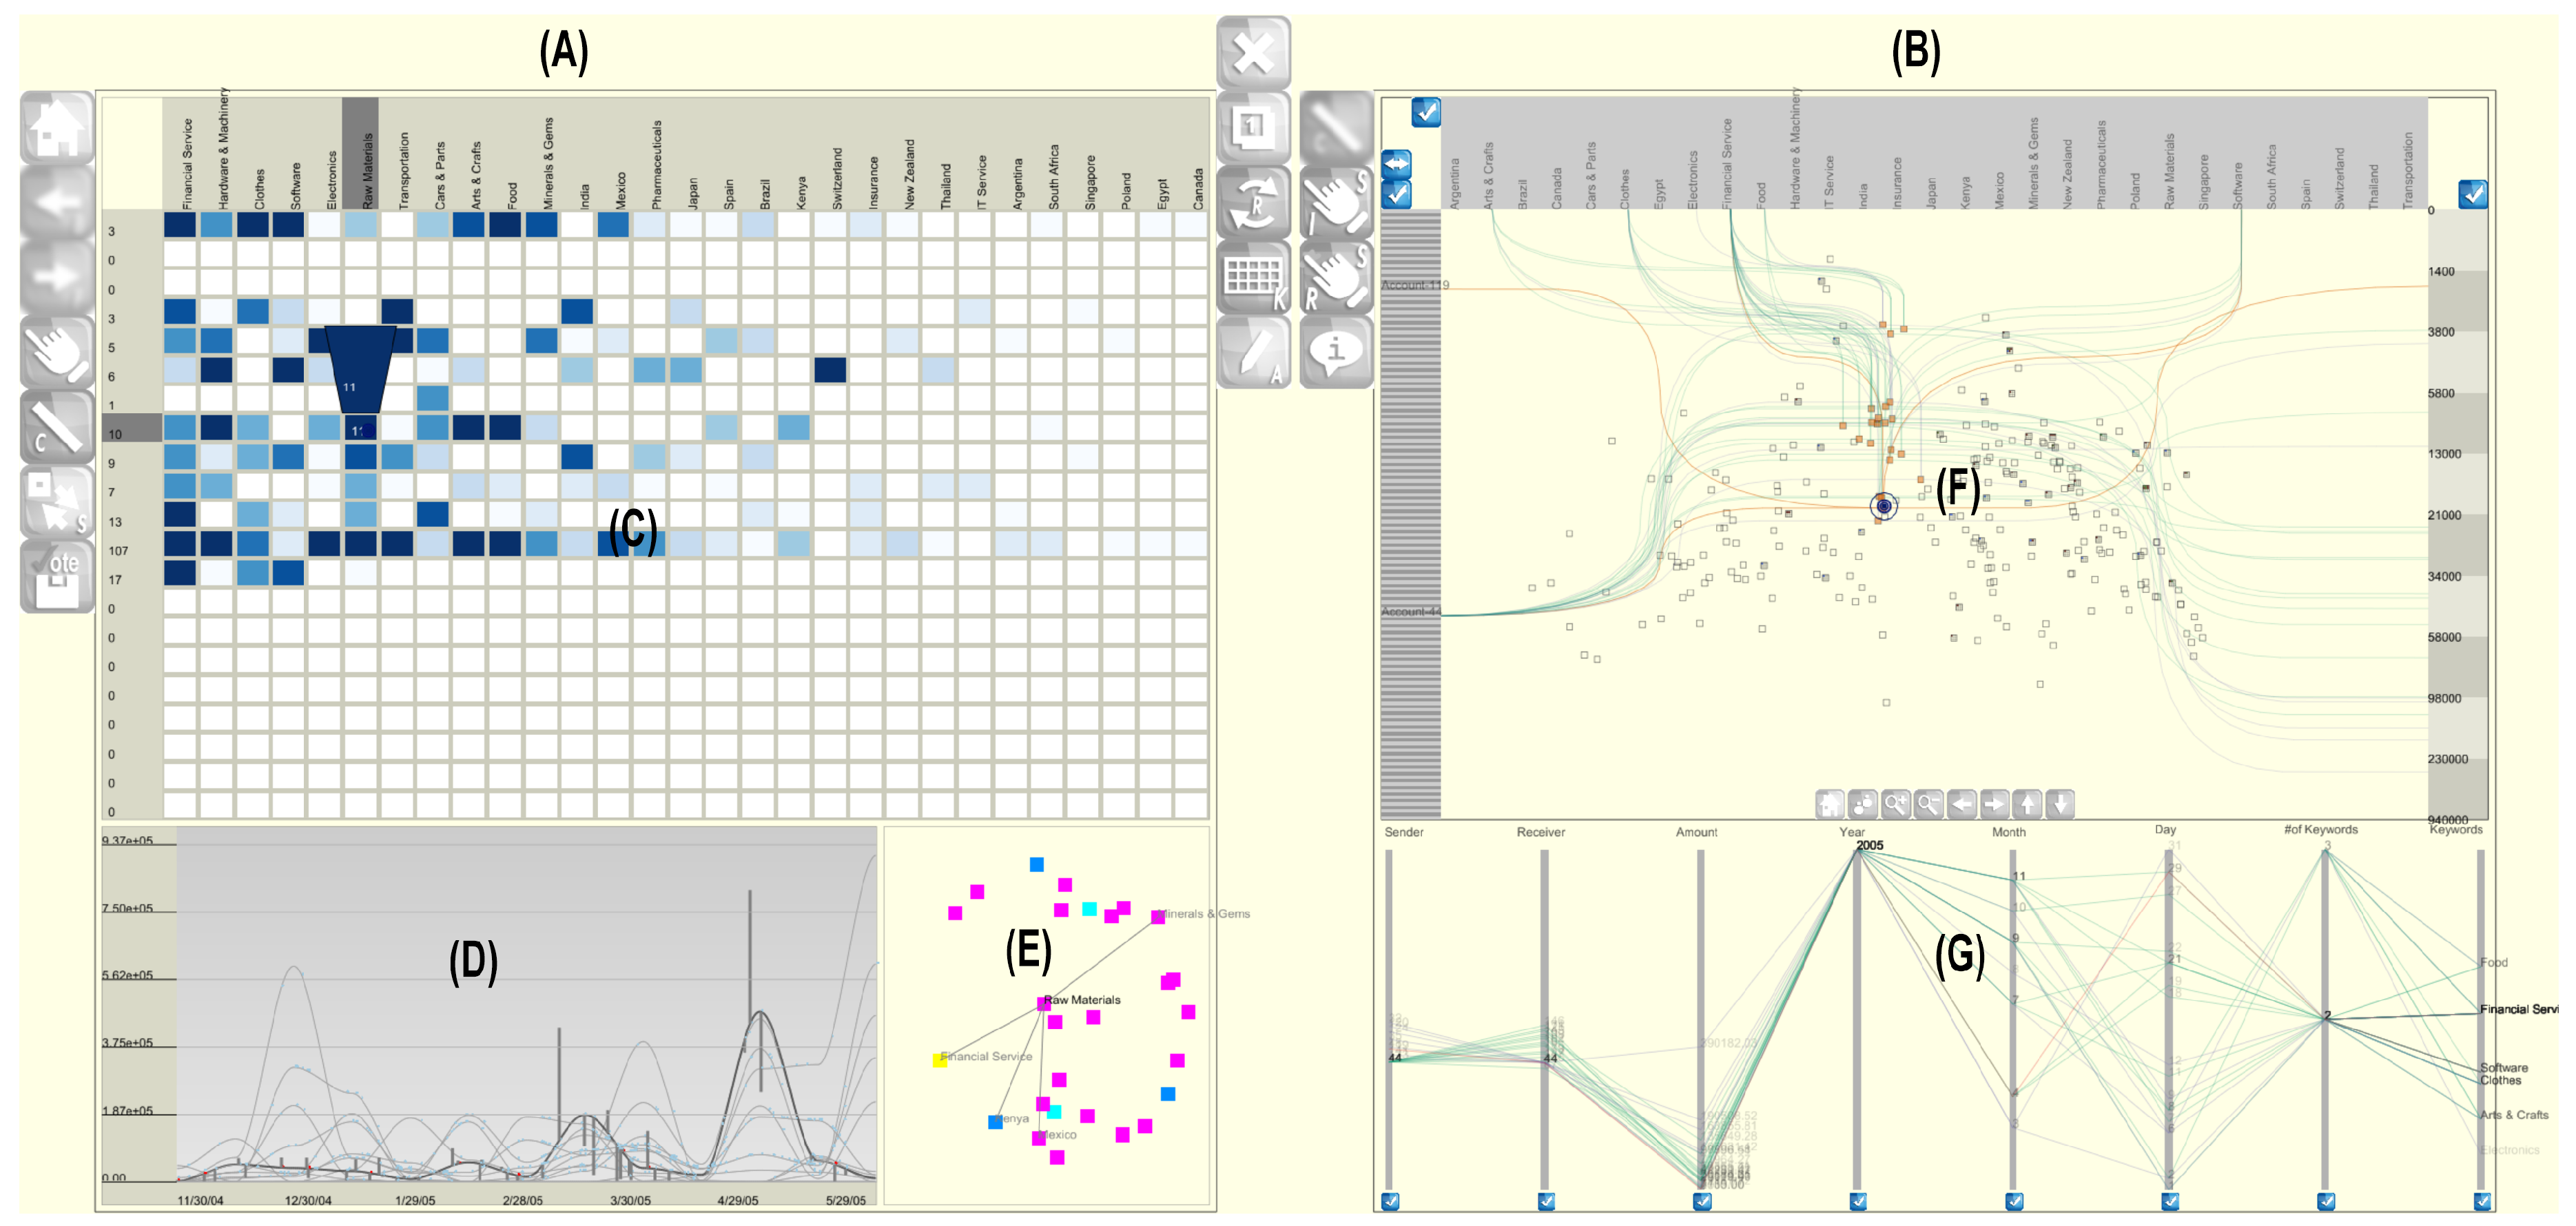
Figure 2.
In the investigation tracing tool, all analysts’ investigation results are highlighted with different color attributes - (A) suspicious, (B) not-suspicious, and (C) inconclusive. (D) Analysts arrive at different conclusions regarding wire transactions as either suspicious or inconclusive.
Figure 2.
In the investigation tracing tool, all analysts’ investigation results are highlighted with different color attributes - (A) suspicious, (B) not-suspicious, and (C) inconclusive. (D) Analysts arrive at different conclusions regarding wire transactions as either suspicious or inconclusive.
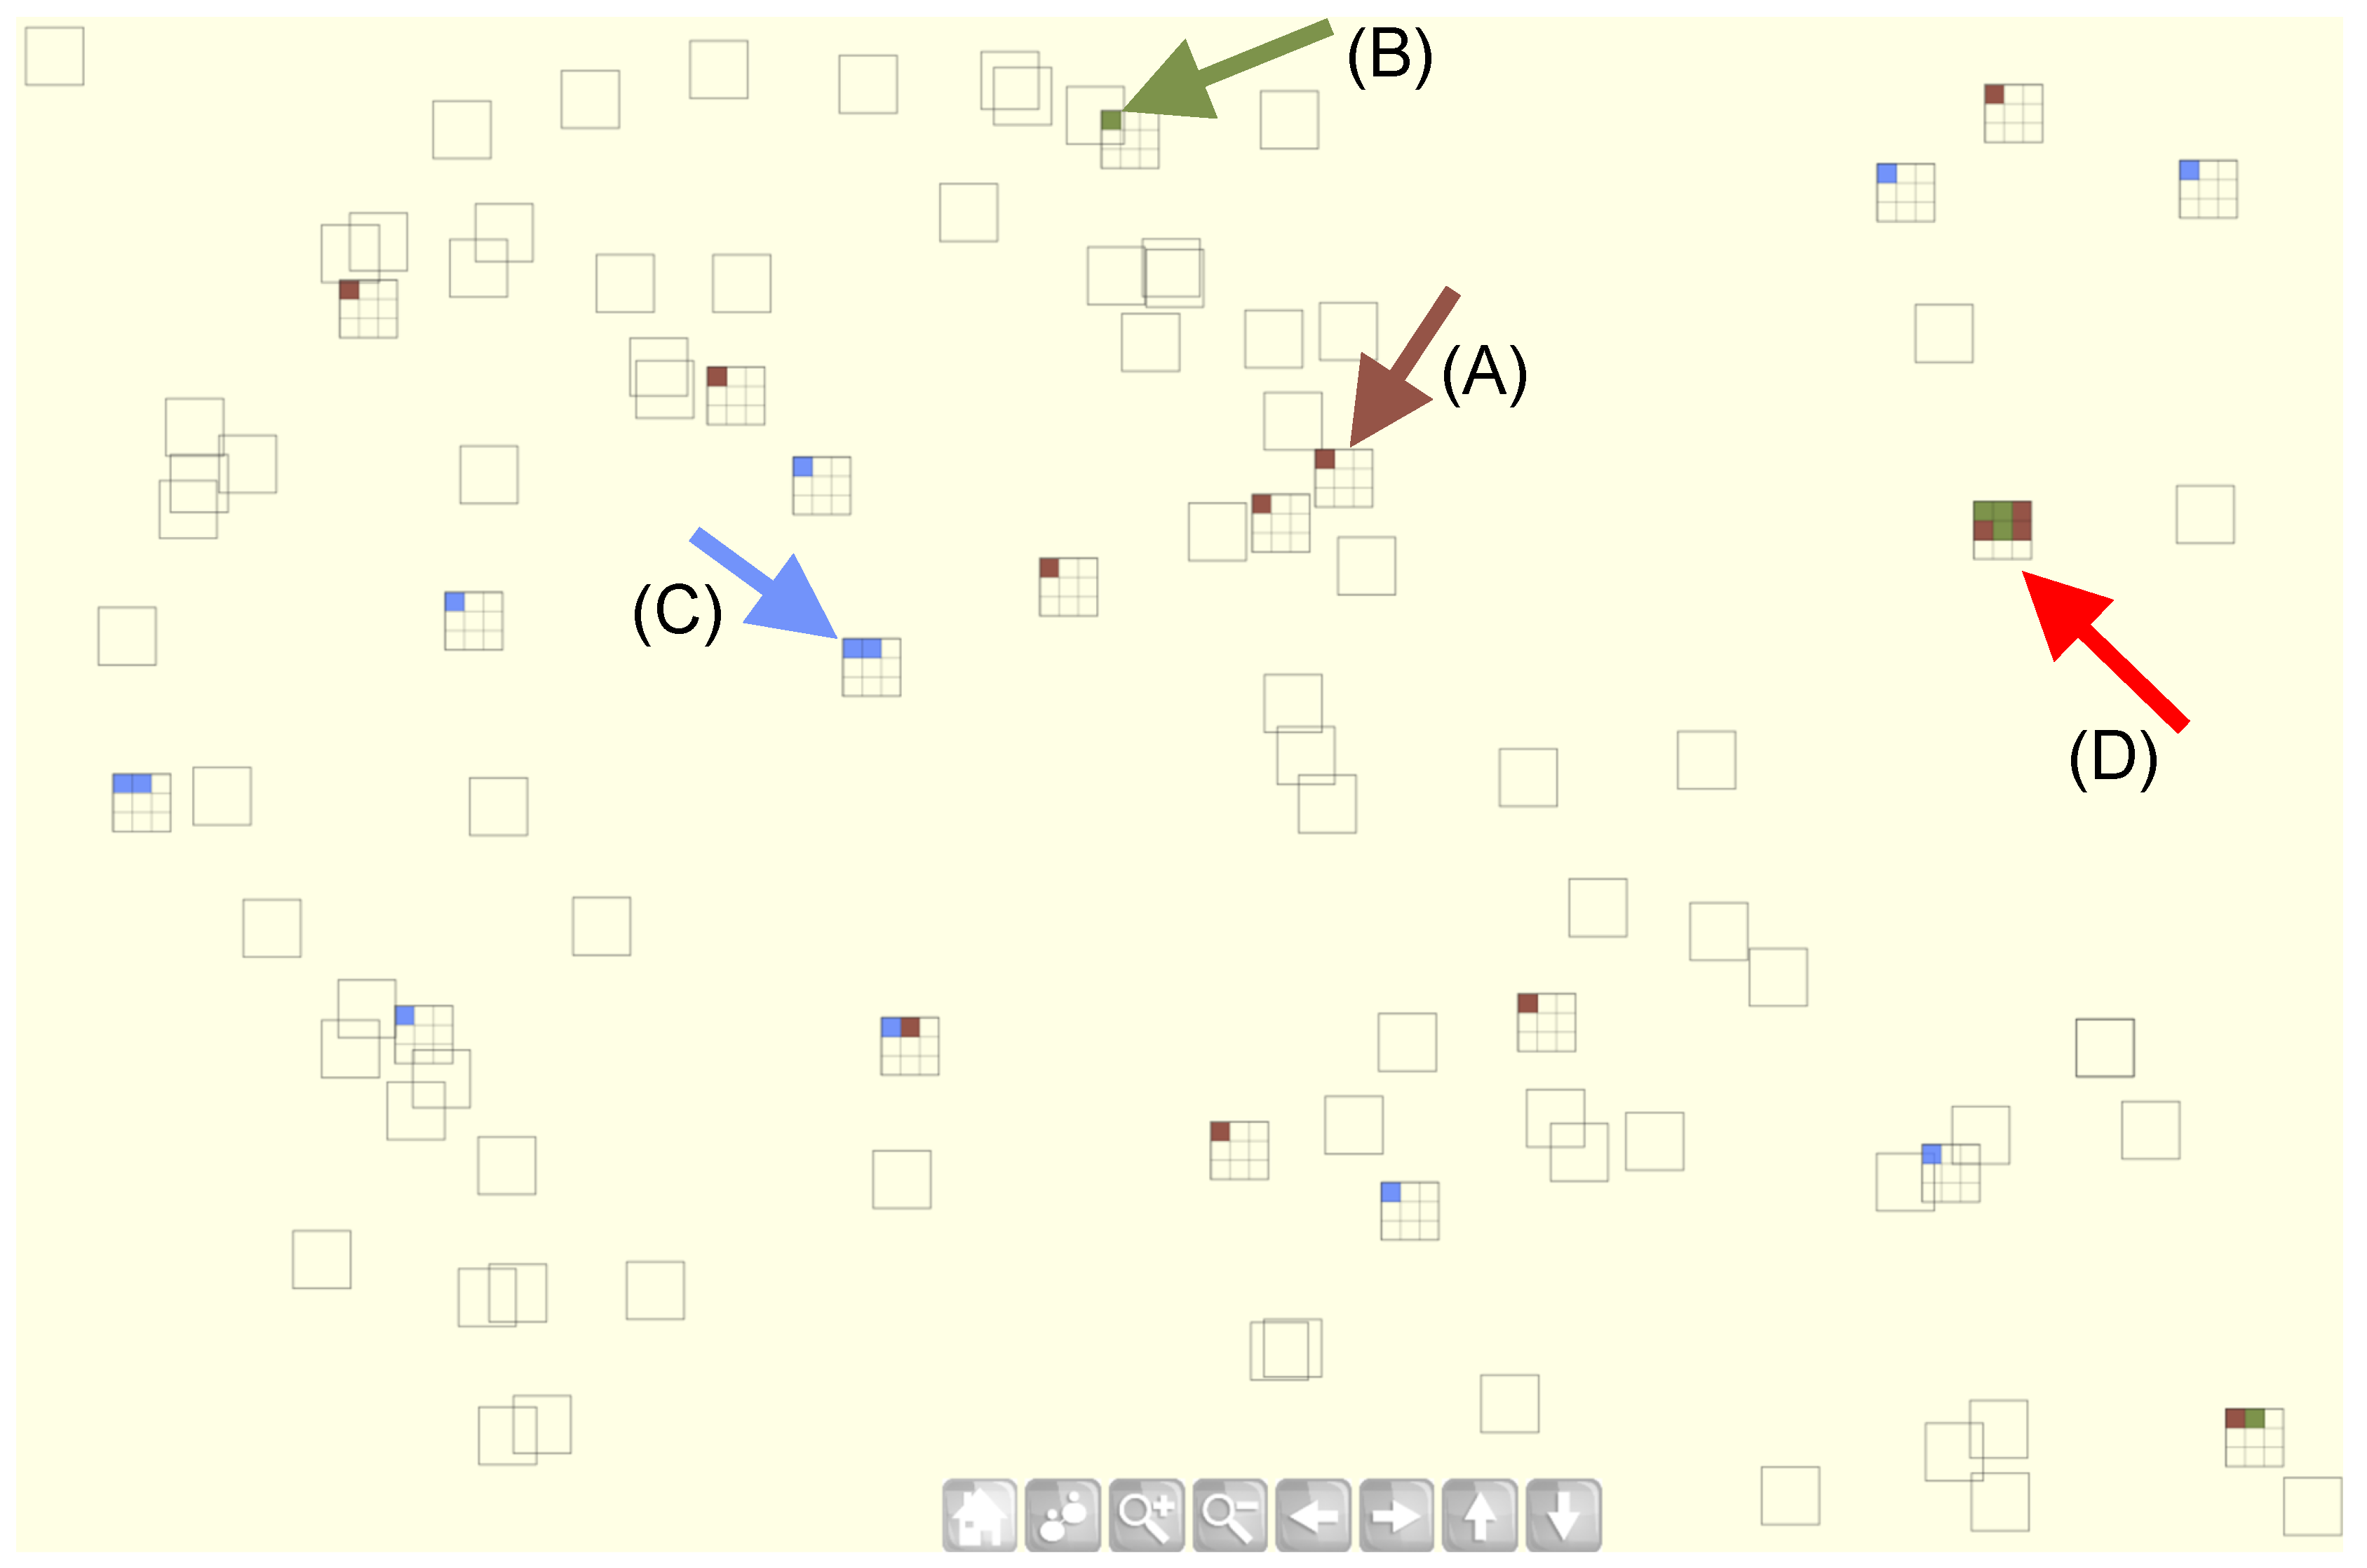
Figure 3.
Visual state transaction matrix representing an analyst’s semantic user interactions.
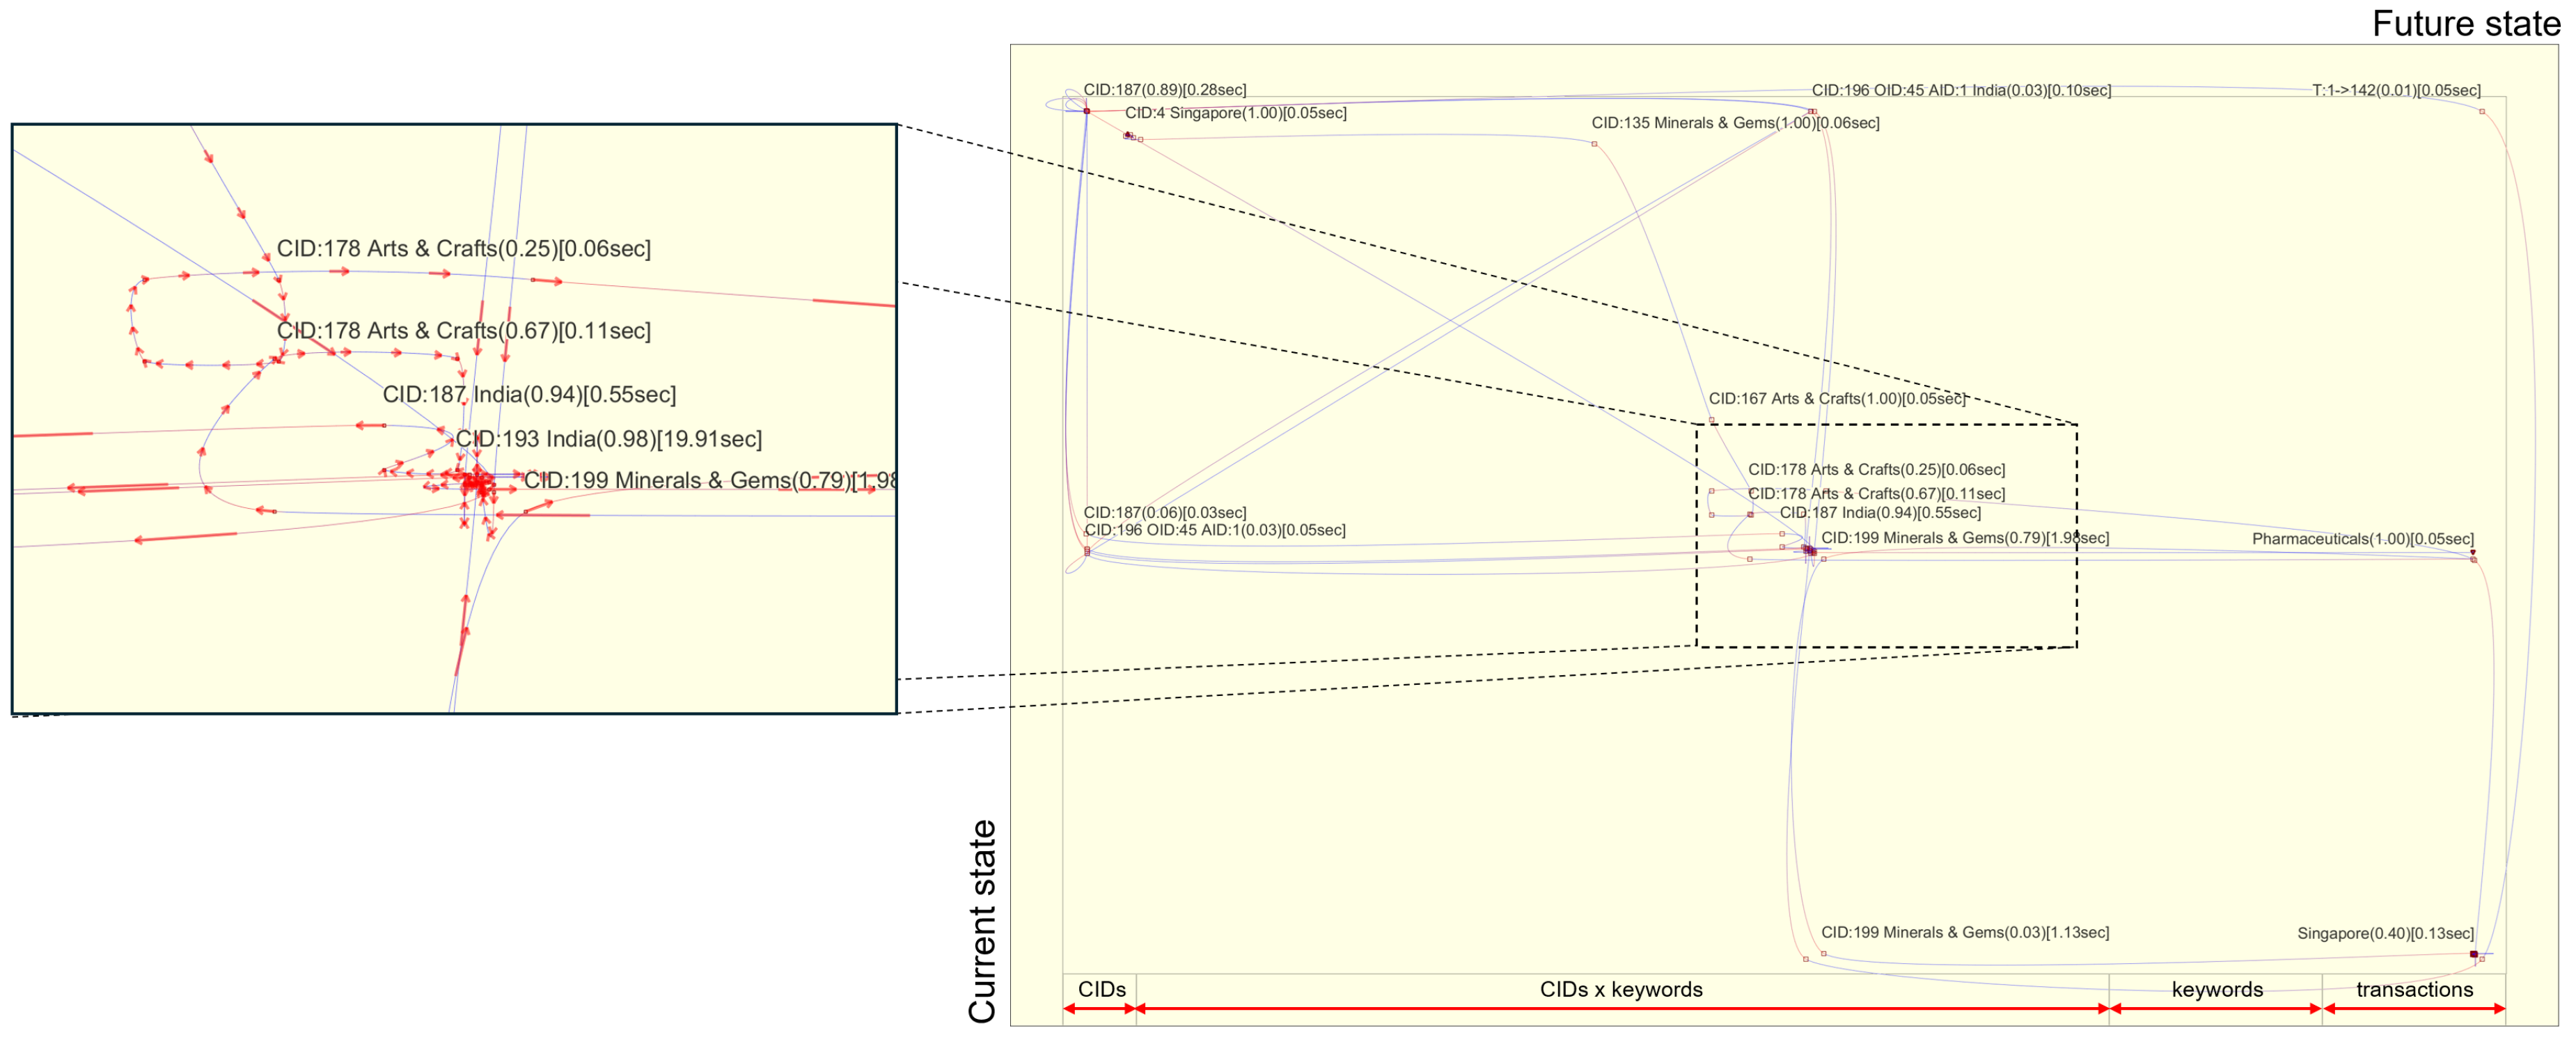
Figure 4.
Visual state transaction matrix after hiding unexplored states. Each cell represents the probability of transitioning to each state, along with the amount of time the user spent within the state. A reddish triangle indicates the beginning state, while an inverted blue triangle denotes the ending state. The cell where the user spends the most time is highlighted in blue.
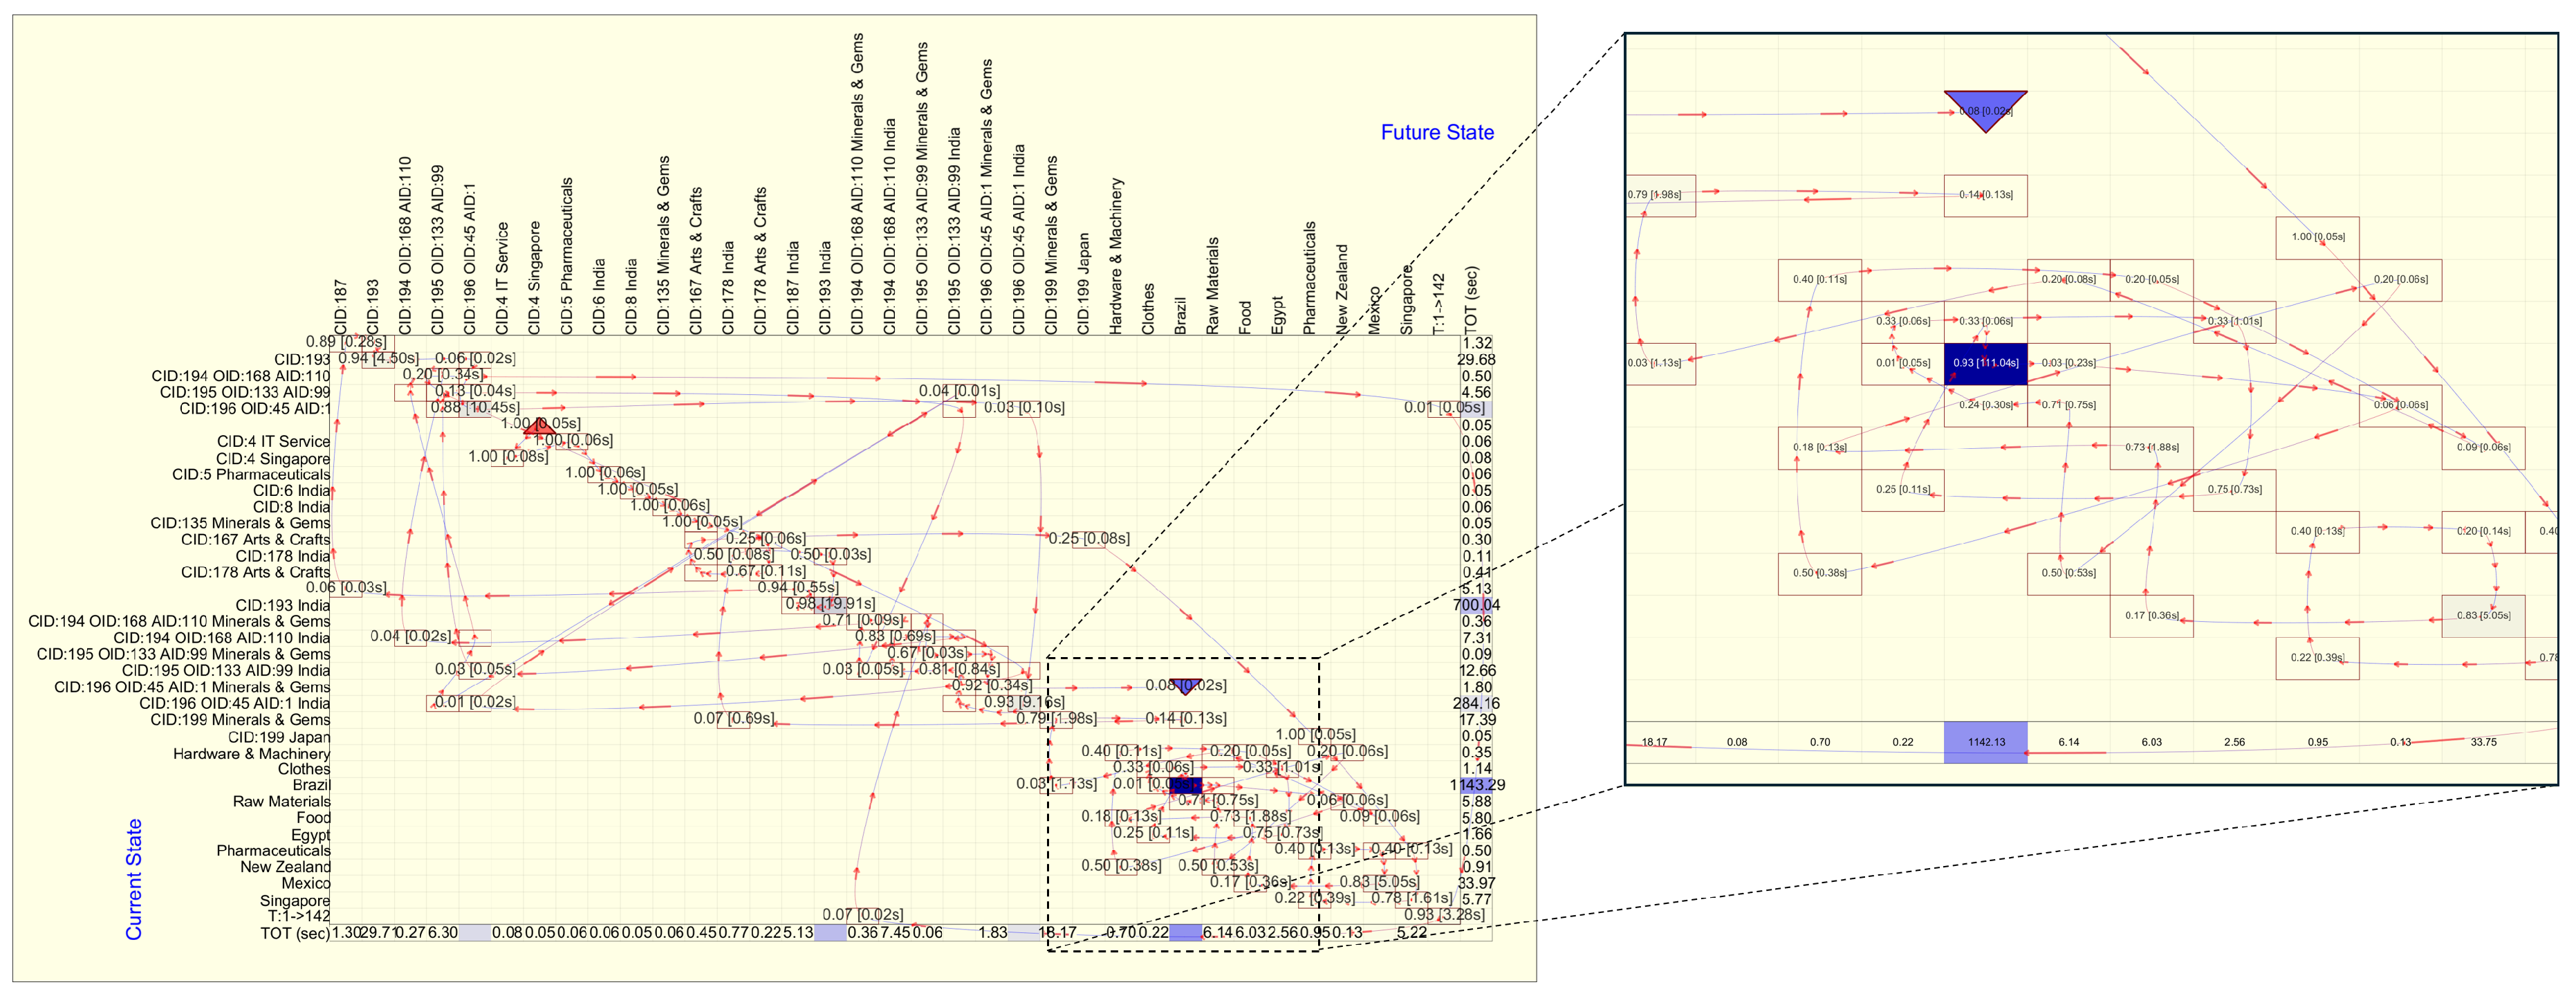

Table 1.
Menu buttons supported in the system with their meanings.
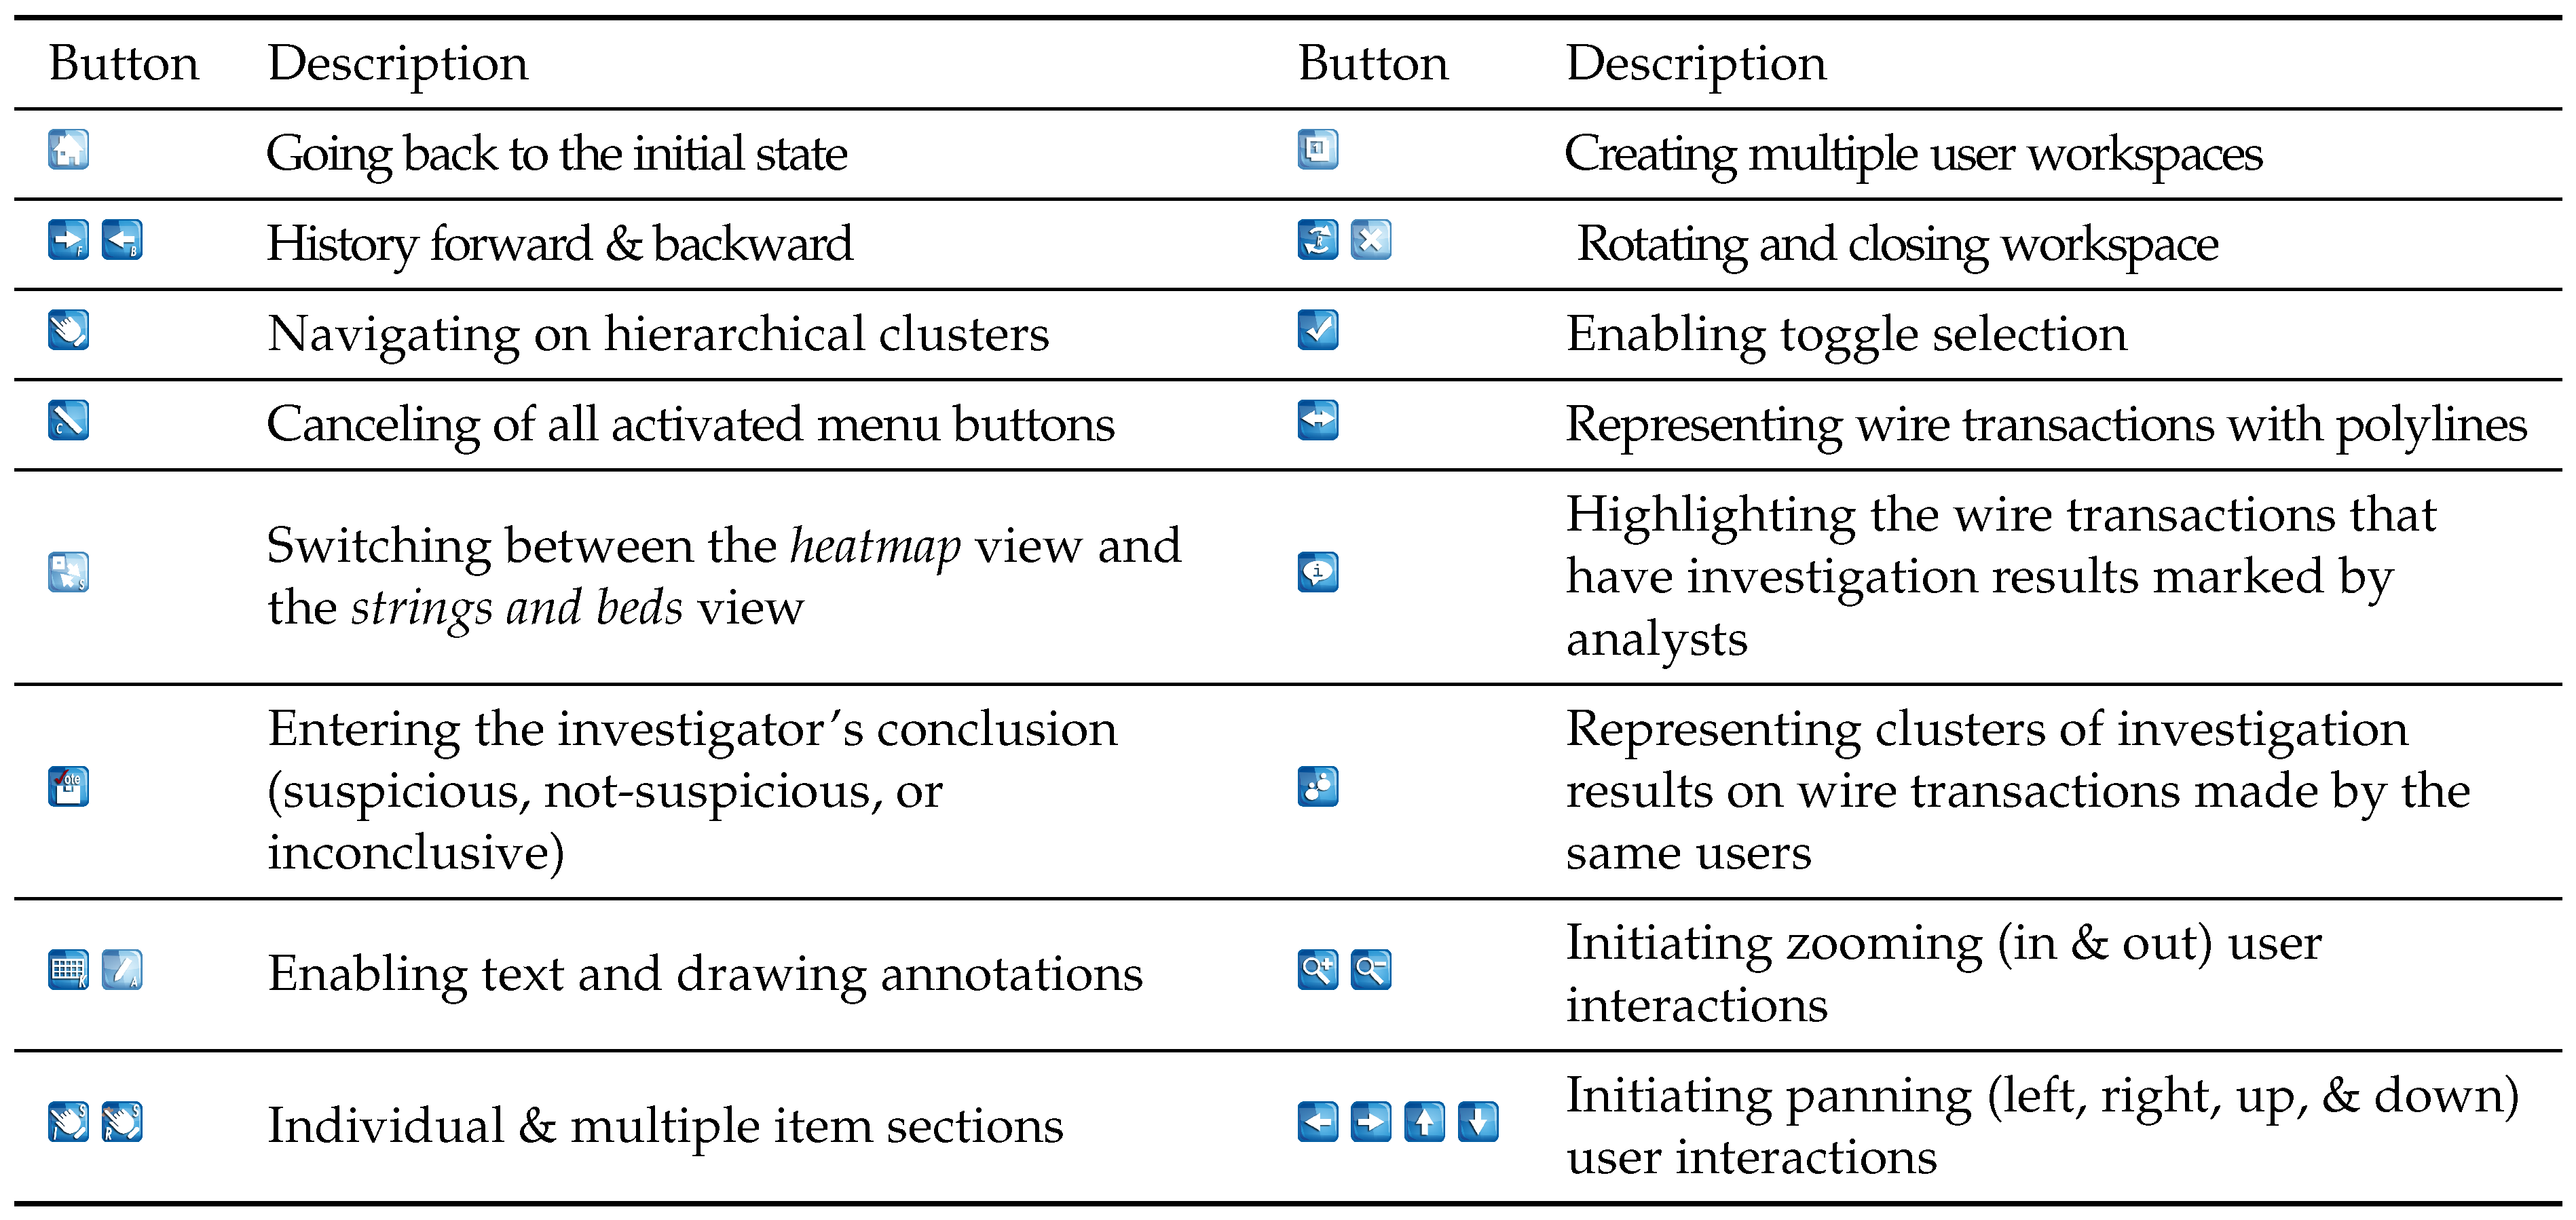
Table 2.
Average performance difference ± standard deviation using two vectorized data (BOW and TF-IDF) with five classification algorithms.
Table 2.
Average performance difference ± standard deviation using two vectorized data (BOW and TF-IDF) with five classification algorithms.
| Data Type | Metric | MultinomialNB | SVC | RF | LR | GB |
|---|---|---|---|---|---|---|
| BOW | Accuracy | 0.79 ± 0.11 | 0.67 ± 0.09 | 0.74 ± 0.08 | 0.74 ± 0.12 | 0.64 ± 0.04 |
| Precision | 0.80 ± 0.11 | 0.77 ± 0.08 | 0.76 ± 0.08 | 0.75 ± 0.13 | 0.65 ± 0.05 | |
| Recall | 0.79 ± 0.11 | 0.66 ± 0.09 | 0.74 ± 0.07 | 0.74 ± 0.12 | 0.64 ± 0.04 | |
| F1-score | 0.79 ± 0.11 | 0.64 ± 0.11 | 0.74 ± 0.07 | 0.72 ± 0.13 | 0.64 ± 0.05 | |
| TF-IDF | Accuracy | 0.79 ± 0.11 | 0.67 ± 0.09 | 0.69 ± 0.11 | 0.74 ± 0.12 | 0.63 ± 0.04 |
| Precision | 0.80 ± 0.11 | 0.77 ± 0.08 | 0.73 ± 0.10 | 0.75 ± 0.13 | 0.65 ± 0.05 | |
| Recall | 0.79 ± 0.11 | 0.66 ± 0.09 | 0.69 ± 0.10 | 0.74 ± 0.12 | 0.63 ± 0.04 | |
| F1-score | 0.79 ± 0.11 | 0.64 ± 0.11 | 0.67 ± 0.11 | 0.72 ± 0.13 | 0.63 ± 0.05 |
Table 3.
Average performance differences ± standard deviation for five classification algorithms with BOW and TF-IDF vectorized data on analysis decisions.
Table 3.
Average performance differences ± standard deviation for five classification algorithms with BOW and TF-IDF vectorized data on analysis decisions.
| Data Type | Metric | Decision* | MultinomialNB | SVC | RF | LR | GB |
|---|---|---|---|---|---|---|---|
| BOW | Accuracy | I | 0.96 ± 0.08 | 0.64 ± 0.25 | 0.81 ± 0.11 | 0.93 ± 0.09 | 0.81 ± 0.02 |
| N | 0.77 ± 0.15 | 0.43 ± 0.21 | 0.81 ± 0.13 | 0.81 ± 0.13 | 0.67 ± 0.07 | ||
| S | 0.64 ± 0.19 | 0.92 ± 0.16 | 0.37 ± 0.11 | 0.47 ± 0.22 | 0.45 ± 0.16 | ||
| Precision | I | 0.83 ± 0.09 | 0.96 ± 0.08 | 0.75 ± 0.17 | 0.74 ± 0.1 | 0.80 ± 0.12 | |
| N | 0.79 ± 0.19 | 0.80 ± 0.27 | 0.66 ± 0.11 | 0.76 ± 0.21 | 0.63 ± 0.2 | ||
| S | 0.79 ± 0.13 | 0.55 ± 0.09 | 0.72 ± 0.28 | 0.75 ± 0.17 | 0.54 ± 0.05 | ||
| Recall | I | 0.96 ± 0.08 | 0.64 ± 0.25 | 0.81 ± 0.11 | 0.93 ± 0.09 | 0.81 ± 0.02 | |
| N | 0.77 ± 0.15 | 0.43 ± 0.21 | 0.81 ± 0.13 | 0.81 ± 0.13 | 0.67 ± 0.07 | ||
| S | 0.64 ± 0.19 | 0.92 ± 0.16 | 0.37 ± 0.11 | 0.47 ± 0.22 | 0.45 ± 0.16 | ||
| F1-score | I | 0.88 ± 0.07 | 0.73 ± 0.18 | 0.77 ± 0.09 | 0.82 ± 0.09 | 0.80 ± 0.06 | |
| N | 0.78 ± 0.16 | 0.52 ± 0.21 | 0.71 ± 0.06 | 0.77 ± 0.14 | 0.63 ± 0.08 | ||
| S | 0.69 ± 0.13 | 0.68 ± 0.09 | 0.49 ± 0.16 | 0.56 ± 0.19 | 0.48 ± 0.12 | ||
| TF-IDF | Accuracy | I | 0.96 ± 0.08 | 0.64 ± 0.25 | 0.85 ± 0.08 | 0.93 ± 0.09 | 0.81 ± 0.02 |
| N | 0.77 ± 0.15 | 0.43 ± 0.21 | 0.85 ± 0.08 | 0.81 ± 0.13 | 0.63 ± 0.13 | ||
| S | 0.64 ± 0.19 | 0.92 ± 0.16 | 0.44 ± 0.17 | 0.47 ± 0.22 | 0.41 ± 0.14 | ||
| Precision | I | 0.83 ± 0.09 | 0.96 ± 0.08 | 0.78 ± 0.19 | 0.74 ± 0.1 | 0.79 ± 0.13 | |
| N | 0.79 ± 0.19 | 0.80 ± 0.27 | 0.72 ± 0.17 | 0.76 ± 0.21 | 0.57 ± 0.09 | ||
| S | 0.79 ± 0.13 | 0.55 ± 0.09 | 0.72 ± 0.16 | 0.75 ± 0.17 | 0.52 ± 0.07 | ||
| Recall | I | 0.96 ± 0.08 | 0.64 ± 0.25 | 0.85 ± 0.08 | 0.93 ± 0.09 | 0.81 ± 0.02 | |
| N | 0.77 ± 0.15 | 0.43 ± 0.21 | 0.85 ± 0.08 | 0.81 ± 0.13 | 0.63 ± 0.13 | ||
| S | 0.64 ± 0.19 | 0.92 ± 0.16 | 0.44 ± 0.17 | 0.47 ± 0.22 | 0.41 ± 0.14 | ||
| F1-score | I | 0.88 ± 0.07 | 0.73 ± 0.18 | 0.80 ± 0.11 | 0.82 ± 0.09 | 0.79 ± 0.07 | |
| N | 0.78 ± 0.16 | 0.52 ± 0.21 | 0.76 ± 0.09 | 0.77 ± 0.14 | 0.58 ± 0.07 | ||
| S | 0.69 ± 0.13 | 0.68 ± 0.09 | 0.54 ± 0.18 | 0.56 ± 0.19 | 0.45 ± 0.11 |
* I: Inconclusive, N: Non-suspicious, and S: Suspicious.
Disclaimer/Publisher’s Note: The statements, opinions and data contained in all publications are solely those of the individual author(s) and contributor(s) and not of MDPI and/or the editor(s). MDPI and/or the editor(s) disclaim responsibility for any injury to people or property resulting from any ideas, methods, instructions or products referred to in the content. |
© 2024 by the authors. Licensee MDPI, Basel, Switzerland. This article is an open access article distributed under the terms and conditions of the Creative Commons Attribution (CC BY) license (http://creativecommons.org/licenses/by/4.0/).
Copyright: This open access article is published under a Creative Commons CC BY 4.0 license, which permit the free download, distribution, and reuse, provided that the author and preprint are cited in any reuse.


