
Submitted:
29 April 2024
Posted:
30 April 2024
You are already at the latest version
Abstract
Background: Obesity is a global health crisis with a rapidly increasing prevalence among university students. Medical students are a unique population that may be at a higher risk of obesity due to the demanding nature of their studies and the associated stress.
Objective: This study aimed to determine the prevalence of overweight, obesity, and the associated risk factors among medical students at Jazan University in Saudi Arabia.
Methods: A cross-sectional study was conducted among 228 medical students from their 2nd to 6th academic years at the Faculty of Medicine, Jazan University. A self-administered questionnaire was used to collect data regarding sociodemographic characteristics, physical activity, dietary habits, comorbidities, medication use, family history, and lifestyle factors. Anthropometric measurements including height, weight, and waist circumference were recorded. Chi-square test and binary logistic regression were used to identify the risk factors associated with obesity.
Results: The prevalence of overweight and obesity among the participants was 13.3% and 15% respectively. Hence, the combined prevalence of overweight and obesity is 28.3%. The mean weight was 63.39 ± 18.93 kilograms, and the mean height was 163.48 ± 9.78 centimeters. On the other hand, 17.3% of participants had underweight whereas 54.4% had normal BMI. Most of the participants (61%) did not engage in regular exercise. A high proportion consumed fruits (82.9%) and vegetables (58.8%) 3 or fewer days per week, and 84.2% consumed 3 or fewer meals per day. Fast food consumption more than 3 days per week was reported by 42.1% of participants. Obesity was not significantly associated with sociodemographic factors, physical activity, dietary habits, comorbidities, medication use, or family histories. However, those with a monthly family income of 15,000-24,999 riyals had significantly lower odds of obesity than those in the lowest income group (OR 0.230, p = 0.045).
Conclusion: The prevalence of overweight and obesity among medical students at Jazan University is high. Although no significant associations were found between obesity and most risk factors, this study highlights the need for interventions that promote healthy lifestyles among medical students. Further research is needed to identify effective strategies for preventing and managing obesity in this population.
Keywords:
Overweight
; Obesity
; Prevalence
; Risk factors
; Medical students
; Jazan University
; Physical activity
; Dietary habits
1. Introduction
Overweight and obesity are complex, multifaceted chronic conditions that have become global health crises [1,2,3].
The World Health Organization (WHO) defines overweight and obesity as excessive accumulation of body fat that poses health risks [4]. The recommended tool for categorizing obesity is Body Mass Index (BMI), with a BMI between 25 and 30 Kg/m2 indicating overweight and a BMI above 30 Kg/m2 indicating obesity [5,6].
The global prevalence of obesity is escalating at an alarming rate, with projections suggesting that by 2030, up to 57.8% of the world's adult population could be either overweight or obese [4,5].
University years are a particularly challenging period for obesity, as the transition from high school often involves changes in physical activity and eating habits that can lead to weight gain [7]. Research in the Arab region has shown that rapid socio-cultural changes due to economic growth have significantly impacted dietary patterns, contributing to the rising rates of overweight and obesity in countries such as Saudi Arabia [8]. Additionally, psychological stress associated with college life, especially in medical schools, has been identified as another critical factor in the development of obesity [9,10].
Obesity is a complex issue with multiple contributing factors, including diet, genetics, physical activity, physiology, and behavior [10.11]. Healthcare professionals are expected to be role models for healthy living, but studies have shown that obesity is a problem among medical students and healthcare workers in many countries [12,13].
Studies have demonstrated a high prevalence of obesity among university students. Peltzer et al. found that the overall prevalence of overweight and obesity among university students in low- and middle-income countries is 22.4% and 5.0%, respectively [14]. Another study conducted in Saudi Arabia by Al-Rethaiaa et al. reported that the prevalence of overweight and obesity among male university students was 21.8% and 15.7%, respectively [8].
Several risk factors have been associated with obesity in university students. Al-Nakeeb et al. found that physical inactivity, sedentary behavior, and unhealthy dietary habits were significant predictors of overweight and obesity among university students in the United Arab Emirates [15]. Similarly, Musaiger et al. reported that lack of physical activity, consumption of fast foods, and prolonged screen time were associated with obesity among university students in Kuwait [16].
Medical students are a unique population that may be at a higher risk of obesity due to the demanding nature of their studies and the associated stress [17]. Alzahrani et al. found that the prevalence of overweight and obesity among medical students in Saudi Arabia was 25.2% and 17.5%, respectively [18]. The study also identified several risk factors for obesity, including male sex, lack of physical activity, and consumption of fast food [18].
Despite the high prevalence of obesity among university students, few studies have investigated its prevalence and risk factors among medical students in Saudi Arabia. A study at Shaqra University showed that 8.8% of medical students were underweight, 46.5% had a normal BMI, 25.4% were overweight, and 19.3% were obese. These findings indicated that more than half of the participants had abnormal BMI values [19]. Interestingly, the study found that fast food consumption did not have a significant effect on obesity, whereas regular exercise significantly reduced obesity [19]. However, to our knowledge, no study has investigated the prevalence and risk factors of obesity among medical students at Jazan University.
Therefore, this study aimed to determine the prevalence of overweight and obesity and the associated risk factors among medical students at Jazan University, Saudi Arabia. Understanding the prevalence and risk factors of obesity in this population is crucial for developing targeted interventions and preventive strategies to promote healthy lifestyles and reduce the burden of obesity-related diseases.
2. Methods
2.1. Study Design and Setting
This cross-sectional study was conducted among medical students at the Faculty of Medicine, Jazan University, Saudi Arabia in the period from January to March 2024. The Faculty of Medicine at Jazan University is one of the leading medical schools in the region, with diverse student bodies representing various socioeconomic and cultural backgrounds.
2.2. Study Population and Sampling
The study population consisted of medical students from the 2nd to 6th academic years. The sample size was determined using a single-population proportion formula, considering a 95% confidence interval, 5% margin of error, and an estimated obesity prevalence of 50% to obtain the maximum sample size. The calculated sample size was further increased by 10% to account for potential non-responses or incomplete data, resulting in a final sample size of 228 participants.
A stratified random sampling technique was employed to ensure proportional representation for each academic year. The student roster from each year was obtained from the faculty administration, and the participants were randomly selected using a computer-generated random number list. Selected students were invited to participate in the study, and those who provided informed consent were included.
2.3. Data Collection
Data was obtained utilizing a validated questionnaire derived from various prior studies. The questionnaire employed is a self-administered online tool comprising five distinct sections. The initial section encompasses socio-demographic information and incorporates variables such as age, gender, marital status, place of residence, academic achievement, socioeconomic status, and monthly income. The second section captures measurements related to Body Mass Index (BMI) and waist circumference. Height and weight measurements were utilized to calculate the BMI, with BMI values falling below 18.5 kg/m2 indicating underweight, values between 18.5 and 24.9 kg/m2 indicating normal weight, values between 25 and 29.9 kg/m2 indicating overweight, and values equal to or exceeding 30 kg/m2 indicating obesity. [19,20,21] Waist circumference measurements are based on the guidelines set forth by the International Diabetes Federation, with waist circumference values ≤ 90 cm for males and ≤ 80 cm for females classified as waist 1, values between 90 and 102 cm for males and 80 and 88 cm for females classified as waist 2, and values exceeding 102 cm for males and exceeding 88 cm for females classified as waist 3. The third section is specifically designed to gather data about physical activity and is adapted from the concise version of the International Physical Activity Questionnaire (IPAQ-short version). The fourth section is structured to collect data concerning dietary patterns and is adapted from questions employed in the Food Frequency Questionnaire (FFQ). Lastly, the fifth section entails the collection of data on comorbid conditions such as diabetes mellitus (DM), hypertension, and dyslipidemia. [20,21].
A pilot study was conducted among ten medical students who were not included in the main study to test the questionnaire's clarity, comprehensibility, and reliability. The internal consistency of the questionnaire was assessed using Cronbach's alpha, and a value of 0.75 or higher was considered satisfactory. Based on the pilot study results, minor modifications were made to the questionnaire to improve its clarity and flow.
2.4. The Final Questionnaire Consisted of the Following Sections
- Sociodemographic characteristics: age, gender, marital status, residence, academic year, socioeconomic status, and monthly income.
- Physical activity: regular exercise, type, and intensity of physical activity.
- Dietary habits: fruit and vegetable consumption, meal frequency, fast food intake, and sugar-sweetened beverage consumption.
- Comorbidities included hypertension, diabetes mellitus, and hyperlipidemia.
- Medication use: corticosteroids, beta blockers, antidiabetics, antipsychotics, and antidepressants.
- Family history: obesity, diabetes mellitus, and hypertension.
- Lifestyle factors: Smoking (cigarettes or shisha) and khat chewing.
- Academic Performance: Current Grade Point Average (GPA).
2.5. Data Management and Analysis
Data were entered, cleaned, and analyzed using the Statistical Package for Social Sciences (SPSS) version 24.0. Descriptive statistics, including frequencies, percentages, means, and standard deviations, were used to summarize sociodemographic characteristics, anthropometric measurements, physical activity, dietary habits, comorbidities, medication use, family history, and lifestyle factors.
The prevalence of obesity was calculated as the proportion of participants with a BMI ≥ 30 kg/m2. BMI was calculated as the weight in kilograms divided by the height in meters squared (kg/m2). Participants were classified according to the World Health Organization's BMI categories: underweight (BMI < 18.5 kg/m2), normal weight (BMI 18.5-24.9 kg/m2), overweight (BMI 25-29.9 kg/m2), class 1 obesity (BMI 30-34.9 kg/m2), class 2 obesity (BMI 35-39.9 kg/m2), and class 3 obesity (BMI ≥ 40 kg/m2). Waist circumference was measured at the midpoint between the lower margin of the last palpable rib and the top of the iliac crest using a non-stretchable measuring tape (Seca 201, Germany). Measurements were taken to the nearest 0.1 cm, with participants standing and breathing normally. Waist circumference was categorized according to gender-specific cut-offs: normal (< 80 cm for females, < 90 cm for males), increased risk (80-88 cm for females, 90-102 cm for males), and substantially increased risk (> 88 cm for females, > 102 cm for males).
The chi-squared test was used to assess the association between categorical variables (sociodemographic factors, physical activity, dietary habits, comorbidities, medication use, family history, and lifestyle factors) and obesity. The significance level was set at P < 0.05. Binary logistic regression analysis was conducted to identify the risk factors for obesity. Variables with a p-value < 0.2 in the bivariate analysis were included in the multivariate logistic regression model. Adjusted odds ratios (AORs) and 95% confidence intervals (CIs) were calculated to determine the strength of the association between risk factors and obesity. Statistical significance was set at P < 0.05.
2.6. Ethical Considerations
The study protocol was approved by the Research Ethics Committee of the Faculty of Medicine of Jazan University. All participants provided informed consent before enrollment in the study. The study was conducted in accordance with the Declaration of Helsinki and the ethical principles for medical research involving human subjects. Participants' confidentiality and anonymity were maintained throughout the study. Each participant was assigned a unique identification number and personal information was not collected. Completed questionnaires and anthropometric data were stored securely with access restricted to the research team. Participants were informed of their right to withdraw from the study at any time without consequences.
3. Results:
The sociodemographic characteristics and anthropometric measurements of the 228 university students are shown in Table 1. Most participants were between 18 and 22 years of age (139, 61.0%), female (126, 55.3%), unmarried (212, 93.0%), and evenly split between rural (114, 50.0%) and urban (114, 50.0%) areas. Most were in their 2nd to 5th year of study, earned less than 2000 riyals monthly (180, 78.9%), and had grade point averages above 4.5 (141, 61.8%). The average monthly family income was commonly between 8000 and 14,999 riyals (53, 23.2%) and between 15,000 and 24,999 riyals (61, 26.8%).
In terms of BMI, 54.4% (123) had a normal BMI, while 65.1% (148) of the students had normal or healthy waist circumferences. The mean weight was 63.39 ± 18.93 kilograms, and the mean height was 163.48 ± 9.78 centimeters. Underweight (39, 17.3%), overweight (30, 13.3%), and obesity (34, 15%) were also reported.
This study also investigated the exercise habits of the participants, as shown in Figure 1. The results revealed that most students (61%, n = 139) did not engage in regular exercise, while only 39% (n = 89) reported exercising regularly. Among the participants who reported exercising regularly (n = 89), this study further explored the duration of their weekly exercise. The results showed that 43.6% (n = 48) of these students exercised for less than two and a half hours per week, while 30% (n = 33) exercised for two and a half hours per week. Interestingly, 26.4% (n = 29) of the regularly exercising participants reported engaging in physical activity for more than two and a half hours per week.
The study also investigated the dietary habits of the participants, focusing on their consumption of fruits, vegetables, fast food, and sugar-sweetened soft drinks as well as their daily meal frequency (Figure 2). When asked how often they consumed fruit per week, 189 out of 228 respondents (82.9%) said three or fewer days. Only 39 out of 228 (17.1%) participants reported eating fruits for more than three days per week. Regarding vegetable consumption, 134 out of 228 (58.8%) said they eat vegetables three or fewer days per week, while 94 out of 228 (41.2%) consumed them for more than 3 days. In terms of the number of meals eaten daily, 192 of 228 (84.2%) reported eating three or fewer meals per day, with only 36 of 228 (15.8%) eating more than three meals daily. When asked about weekly fast-food consumption, 132 out of 228 (57.9%) said they eat fast food three or fewer days per week, compared to 96 out of 228 (42.1%) who eat it more than three days. Finally, 155 out of 228 (68%) reported drinking sugar-sweetened soft drinks three or fewer days per week, while 73 out of 228 (32%) drank them more than three days weekly.
A survey was conducted to collect data on health conditions, medication use, and family history. Regarding comorbidities, 8 (3.5%) reported having high blood pressure, 10 (4.4%) had diabetes, and 22 (9.6%) suffered from high blood fat levels. In terms of medication use, 14 (6.1%) were taking corticosteroids, beta-blockers, antidiabetics, antipsychotics, or antidepressants. When asked about family history, 72 (31.6%) had a first-degree relative with obesity, 96 (42.1%) had a family history of diabetes, and 107 (46.9%) had relatives with high blood pressure. Regarding lifestyle factors, 14 (6.1%) currently smoked cigarettes or shisha, while only three (1.3%) chewed khat.

Table 2.
Comorbidities, medication, and family history.
| Factors | N | % | |
| Do you suffer from high blood pressure? |
Yes | 8 | 3.5% |
| No | 220 | 96.5% | |
| Do you suffer from diabetes? | Yes | 10 | 4.4% |
| No | 218 | 95.6% | |
|
Do you suffer from high blood fat levels? |
Yes | 22 | 9.6% |
| No | 206 | 90.4% | |
| Are you currently using a medication that belongs to any of the following drug classes? (Corticosteroids, B-blockers, antidiabetics, antipsychotics, antidepressants) | Yes | 14 | 6.1% |
| No | 214 | 93.9% | |
| Do you have a family (first-degree relative) history of obesity? | Yes | 72 | 31.6% |
| No | 156 | 68.4% | |
| Do you have a family history (diabetes) of first-degree relatives? | Yes | 96 | 42.1% |
| No | 132 | 57.9% | |
| Do you have a family history (blood pressure) of first-degree relatives? | Yes | 107 | 46.9% |
| No | 121 | 53.1% | |
| Do you smoke (cigarettes or shisha)? | Yes | 14 | 6.1% |
| No | 214 | 93.9% | |
| Do you chew (use) khat? | Yes | 3 | 1.3% |
| No | 225 | 98.7% | |
Table 3 presents the potential relationships among obesity, sociodemographic characteristics, and physical activity. The prevalence of obesity was 18.0% in 18–22 year olds, 11.0% in 22–26 year olds, and 28.6% in those over 26 years old (p = 0.247). By sex, 18.6% of males and 13.5% of females were obese (p = 0.290). Marital status showed little difference, with 12.5% of married and 16.0% of unmarried individuals being obese (p = 0.755). Regarding residence, 14.0% of the rural and 17.5% of the urban participants were obese (p = 0.468). Across academic levels, the obesity prevalence ranged from 10.5% in 6th years to 20.7% in 3rd years (p = 0.746). Family income was not significantly associated, with obesity prevalence highest in those earning <4000 riyals (31.6%) and lowest in those earning 15,000–24,999 riyals (9.8%) (p = 0.273). Personal monthly income showed an 8.3% obesity prevalence in those earning >2000 riyals compared to 17.8% in those earning less (p = 0.111). Finally, 14.6% of regular exercisers were obese versus 16.5% of non-exercisers (p = 0.695). None of the sociodemographic factors or physical activity levels showed a statistically significant association with obesity (all p >0.05).
Table 4 analyzes the relationship between obesity and dietary habits among the 228 participants. Regarding weekly fruit consumption, 15.9% of those eating fruits ≤3 days/week were obese, compared to 15.4% of those eating fruits >3 days/week (p = 0.939). Regarding weekly vegetable intake, 16.4% of those eating vegetables ≤3 days/week were obese and 14.9% of those eating vegetables >3 days/week (p = 0.756). For the number of meals per day, obesity prevalence was 15.6% in those eating ≤3 meals/day and 16.7% in those eating >3 meals/day (p = 0.875). Analyzing weekly fast food consumption, 14.4% of those eating ≤3 days/week were obese, compared to 17.7% of those eating >3 days/week (p = 0.498). Regarding the weekly intake of sugary drinks, 16.1% of those drinking them ≤3 days/week were obese, and 15.1% of those drinking them >3 days/week (p = 0.838). Finally, a family history of obesity showed no significant association, with 16.7% of those with a family history of obesity compared to 15.4% without (p = 0.805). This study found no statistically significant associations between obesity prevalence and any of the dietary habits examined, including fruit and vegetable consumption, meal frequency, fast food intake, sugary drink intake, or family history (all p-values >0.05).
Table 5 shows the potential associations between obesity and health conditions, medication use, and education level in 228 participants. Regarding comorbidities, a similar proportion of those with high blood pressure were obese (25.0%) compared to those without high blood pressure (15.5%), but the difference was not statistically significant (p = 0.615). Regarding diabetes, 30.0% of those with diabetes were obese versus 15.1% of those without diabetes (p = 0.197). High blood fat levels showed a non-significant association, with 27.3% of those with high fat levels being obese compared to 14.6% without obesity (p = 0.129). Medication use had an intriguing pattern, with none (0%) of those on corticosteroids, beta-blockers, antidiabetics, antipsychotics, or antidepressants being obese, compared to 16.8% of non-users being obese (p = 0.134). Finally, education level measured by GPA demonstrated no significant association with obesity (p = 0.975).
Binary logistic regression analysis was conducted to identify sociodemographic and physical activity-related risk factors for obesity among participants (Table 6). Compared to the reference group of 18–22-yyear-olds, the odds of obesity were lower in 22–26-yyear-olds (OR 0.422) but higher in those over 26 years (OR 1.915), although these age differences were not statistically significant (p > 0.05). Females had 50% lower odds of obesity than males (OR 0.500, p = 0.103). Unmarried participants had twice the odds of obesity versus married participants (OR 2.046, p = 0.445). Urban residence was associated with a non-significant 41.6% greater odds of obesity than rural residence (OR 1.416, p = 0.387). Across academic levels, the odds of obesity were elevated in 3rd years (OR 1.715) and 5th years (OR 1.553) but lowered in 4th years (OR 0.964) and 6th years (OR 0.995); however, none of these reached statistical significance (p > 0.05). Those with monthly family incomes of 15,000–24,999 riyals had significantly lower odds of obesity (OR 0.230, p = 0.045) than the lowest-income group. Regular exercisers had 31.7% greater odds of obesity than did non-exercisers (OR 1.317, p = 0.509).
Binary logistic regression analysis assessed dietary habits and family history as potential risk factors for obesity among 228 participants (Table 7). Compared to eating fruits ≤3 days/week, eating them >3 days/week was not associated with significantly greater odds of obesity (OR 1.008, p = 0.989). Eating vegetables >3 days/week was associated with lower odds of obesity versus eating ≤3 days/week (OR 0.881), but this was not statistically significant (p = 0.758). Eating >3 meals per day did not significantly impact obesity odds compared to eating ≤3 meals per day (OR 1.081, p = 0.890). Those who ate fast food >3 days/week had 1.368 times higher odds of obesity compared to those eating it ≤3 days/week (p = 0.439). Drinking sugary drinks >3 days/week was associated with lower obesity odds than drinking ≤3 days/week (OR 0.810, p = 0.625). Having a family history of obesity did not significantly affect the odds of developing obesity (OR 0.899, p = 0.785).
4. Discussion
This study aimed to determine the prevalence of obesity and its associated risk factors among medical students at Jazan University, Saudi Arabia. The findings revealed that the combined prevalence of overweight and obesity among the participants was 28.3%. This rate is comparable to the prevalence of obesity among medical students at other Saudi Arabian universities. For instance, a study conducted at Shaqra University found that 25.4% and 19.3% of medical students were overweight and obese respectively [19]. However, the prevalence of overweight and obesity in the present study was higher than that reported among university students in low- and middle-income countries (22%) [14]. Moreover, the prevalence of obesity in the present study is consistent with what was found among male university students in Saudi Arabia (15.7%) [8].
Research conducted among university students in developing countries reveals a notable prevalence of overweight and obesity. In Africa, for instance, studies have reported rates of 10% in Nigeria, ranging from 25.3% to 59.4% in Egypt, and between 10.8% and 24% in South Africa. Similarly, in Asia, rates of 20.8% have been observed in Bangladesh, ranging from 2.9% to 14.3% in China, and between 20% and 30.1% in Malaysia. In India, it ranges from 11% to 37.5%. In Latin America, Colombia has reported rates between 12.4% and 16.7%, while Mexico's prevalence stands at 31.6%. The Middle East and Near East regions have also shown significant rates, with Oman reporting 28.2%, Kuwait reporting 42%, Iran reporting 12.4%, and Turkey ranging from 10% to 47.4% [14]. More recently Younis et al reported a combined prevalence of overweight and obesity of 65% among healthcare workers in the Gaza Strip [20].
The wide variations of the prevalence rates of overweight and obesity observed in the present study compared to similar previous studies may be attributed to various factors including the differences in the sample characteristics, methodological variations, increased awareness and behavior change, and environmental factors can all contribute to the disparities in prevalence rates.
This study investigated the relationship between obesity and various sociodemographic factors, physical activity, dietary habits, comorbidities, medication use, and family history. Although no statistically significant associations were found between obesity and most of these factors, this study highlighted some important trends and patterns. Regarding physical activity, the study found that the majority of students (61%) did not engage in regular exercise. This finding is consistent with previous studies that have reported high rates of physical inactivity among university students in Saudi Arabia and other Arab countries [15,16]. Physical inactivity is a well-established risk factor of obesity and other chronic diseases [10,11]. Therefore, promoting regular physical activity among medical students should be a priority in obesity prevention and management.
The dietary habits of participants were also assessed. A high proportion of students consumed fruits (82.9%) and vegetables (58.8%) three or fewer days per week, and 84.2% ate three or fewer meals per day. Moreover, 42.1% of the participants reported consuming fast food more than three days per week. These dietary patterns are similar to those reported in other studies of university students in Saudi Arabia and the Middle East [8,16]. Unhealthy dietary habits, such as low fruit and vegetable intake, skipping meals, and frequent consumption of fast food, have been associated with an increased risk of obesity and related metabolic disorders [10,11].
Although the present study did not find significant associations between obesity and comorbidities, medication use, or family history, these factors should not be overlooked. Previous research has shown that obesity is associated with an increased risk of hypertension, diabetes, and dyslipidemia [22,23,24]. Additionally, certain medications, such as corticosteroids and antipsychotics, have been linked to weight gain and obesity [25,26]. Family history is also an important risk factor for obesity, as genetic and environmental factors can contribute to the development of this condition [27,28].
In the present study a considerable proportion of participants, specifically 17.3%, fell under the category of underweight. This finding underscores the importance of addressing not only overweight and obesity but also the issue of insufficient weight, as it can also have adverse health implications.
Universities and colleges have the unique opportunity to promote healthy behaviors among students. Unhealthy lifestyles are common among college students, emphasizing the importance of implementing comprehensive health education programs [29]. Tackling obesity among medical and healthcare students is especially crucial, as they are the future healthcare providers and represent role models for their communities.
The present study has several strengths, including the use of a validated questionnaire and the inclusion of a diverse sample of medical students from different academic years. However, it has some limitations. The cross-sectional design did not allow for the establishment of causal relationships between obesity and the investigated risk factors. Additionally, the study relied on self-reported data for some variables, such as BMI, dietary habits, and physical activity, which may have been subject to recall bias.
On the other hand, this study’s findings have important implications for public health and medical education. The high prevalence rate of abnormal BMI (45.6%) and unhealthy lifestyle behaviors among medical students in the present study highlights the need for targeted interventions to promote healthy eating and regular physical activity in this population. Medical schools should integrate nutrition and physical activity education into their curricula and provide supportive environments that encourage healthy lifestyle choices [18,29]. Moreover, addressing the mental health and well-being of medical students is crucial, as psychological stress has been associated with an increased risk of obesity [30,31].
Future research should employ a longitudinal design to better understand the temporal relationships between obesity and its risk factors among medical students. Qualitative studies may also provide valuable insights into the barriers and facilitators of healthy lifestyle behaviors in this population. Additionally, researchers should evaluate the effectiveness of interventions designed to prevent and manage obesity in medical students.
5. Conclusion
This study found a high prevalence of obesity among medical students at Jazan University. While no statistically significant associations were identified between obesity and most of the examined risk factors, such as physical activity, dietary habits, comorbidities, medication use, or family history, the findings underscore the importance of promoting healthy lifestyles in this population. High rates of physical inactivity and poor dietary patterns such as infrequent fruit and vegetable consumption, skipping meals, and frequent fast-food intake were observed among the students. Despite their medical education, many students exhibit unhealthy behaviors that could increase their risk of developing obesity and related chronic diseases. This study highlights the need for comprehensive interventions tailored to the unique challenges faced by medical students to encourage regular exercise, balanced nutrition, and overall well-being. Further research is warranted to explore the potential sociocultural, psychological, and academic factors that influence obesity risk in this group. By addressing obesity during their formative years, medical schools can equip future healthcare professionals with the knowledge and habits necessary to serve as effective role models for healthy lifestyles in their communities.
Funding
We did not receive any external funding.
Acknowledgments
We would like to express our sincere gratitude to all medical students at Jazan University who participated in this study and generously shared their time and experience. We also extend our appreciation to the Faculty of Medicine at Jazan University for their support and cooperation throughout the research. We are also grateful to the research assistants who diligently assisted with data collection.
Conflicts of interest
The authors declare no conflicts of interest.
Appendix A. The Questionnaire
Sociodemographic data:
Age group
18-22 
22-26
>26
Gender
Male
Female
Marital status
Married
Unmarried
Residence:
Rural area
Urban area
Academic grade
2nd year
3ed year
4th year
5th year
6th year
Socio-economic status
Low
Medium
High
Monthly income
<2,000 SR
>2,000 SR
Anthropmetric measurements
What is your current BMI?
< 18.5 (Underweight)
18.5-24.9 (Normal)
25-29.9 (Overweight)
≥ 30-34.9 (Class 1 Obesity)
≥ 35-39.9 (Class 2 Obesity)
≥ 40 (Class 3 Obesity)
What is your current waist circumference?
< 80 cm
80-88
> 88
< 90
90-102
>102
Physical activity:
Do you exercise regularly (Are you physically active or not)?
Yes
No
If Yes:
-Light
-Moderate
-Vigorous
Diet:
What is your rate of fruit consumption in a week?
≤3 days
>3 days
What is your rate of vegetable consumption in a week?
≤3 days
>3 days
How many meals do you have per day?
≤3
>3
How many days do you usually eat fast food every week?
≤3
>3
How many days do you drink sugar-sweetened soft drinks?
≤3
>3
Comorbidities, Drugs, Family History.
Have you ever been told to have hypertension?
Yes
No
Have you ever been told to have DM?
Yes
No
Have you ever been told to have hyperlipidemia?
Yes
No
Are you currently using a drug that belongs to any one of the following classes of medications? (Corticosteroids, B-blockers, Antidiabetics, Antipsychotics, Antidepressants)
Yes
No
Do you have a family history of obesity?
Yes
No
Do you have a family history of DM?
Yes
No
Do you have a family history of Hypertension?
Yes
No
Do you smoke (cigarettes or shisha)?
Yes
No
Do you chew (use) Khat?
Yes
No
What is your current (Grade point average) GPA?
< 3
3-4.5
> 4.5
References
- Hruby, A.; Hu, F.B. The Epidemiology of Obesity: A Big Picture. PharmacoEconomics 2015, 33, 673–689. [Google Scholar] [CrossRef]
- Laine, C.; Wee, C.C. Overweight and Obesity: Current Clinical Challenges. Ann. Intern. Med. 2023, 176, 699–700, Erratum in: Ann Intern Med. 2023 Jul;176(7):1016. PMID: 36913692. [Google Scholar] [CrossRef]
- Wee, C.C. Using Body Mass Index to Identify and Address Obesity in Asian Americans: One Size Does Not Fit All. Ann. Intern. Med. 2022, 175, 1606–1607. [Google Scholar] [CrossRef]
- Obesity and overweight. Accessed: March 28, 2024. https://www.who.int/news-room/fact-sheets/detail/obesity-and-overweight.
- Defining Adult Overweight & Obesity | Overweight & Obesity | CDC. Accessed: March 28, 2024. https://www.cdc.gov/obesity/basics/adult-defining.html.
- Shah, N.S.; Luncheon, C.; Kandula, N.R.; Khan, S.S.; Pan, L.; Gillespie, C.; Loustalot, F.; Fang, J. Heterogeneity in Obesity Prevalence Among Asian American Adults. Ann. Intern. Med. 2022, 175, 1493–1500. [Google Scholar] [CrossRef] [PubMed]
- Kriaucioniene, V.; Raskiliene, A.; Petrauskas, D.; Petkeviciene, J. Trends in Eating Habits and Body Weight Status, Perception Patterns and Management Practices among First-Year Students of Kaunas (Lithuania) Universities, 2000–2017. Nutrients 2021, 13, 1599. [Google Scholar] [CrossRef] [PubMed]
- Al-Rethaiaa, A.S.; Fahmy, A.-E.A.; Al-Shwaiyat, N.M. Obesity and eating habits among college students in Saudi Arabia: a cross sectional study. Nutr. J. 2010, 9, 39. [Google Scholar] [CrossRef]
- Phelan, S.M.; Burgess, D.J.; Puhl, R.; Dyrbye, L.N.; Dovidio, J.F.; Yeazel, M.; Ridgeway, J.L.; Nelson, D.; Perry, S.; Przedworski, J.M.; et al. The Adverse Effect of Weight Stigma on the Well-Being of Medical Students with Overweight or Obesity: Findings from a National Survey. J. Gen. Intern. Med. 2015, 30, 1251–1258. [Google Scholar] [CrossRef] [PubMed]
- Harding, J.L.; Backholer, K.; Williams, E.D.; Peeters, A.; Cameron, A.J.; Hare, M.J.; E Shaw, J.; Magliano, D.J. Psychosocial stress is positively associated with body mass index gain over 5 years: Evidence from the longitudinal AusDiab study. Obesity 2013, 22, 277–286. [Google Scholar] [CrossRef]
- Lin, X.; Li, H. Obesity: Epidemiology, Pathophysiology, and Therapeutics. Front. Endocrinol. 2021, 12, 706978. [Google Scholar] [CrossRef]
- Čadek, M.; Täuber, S.; Lawrence, B.J.; Flint, S.W. Effect of health-care professionals’ weight status on patient satisfaction and recalled advice: a prospective cohort study. EClinicalMedicine 2023, 57, 101855. [Google Scholar] [CrossRef]
- Khamseh, M.E.; Emami, Z.; Iranpour, A.; Mahmoodian, R.; Amouei, E.; Tizmaghz, A.; Moradi, Y.; Baradaran, H.R. Attitude and Belief of Healthcare Professionals Towards Effective Obesity Care and Perception of Barriers; An Updated Systematic Review and Meta-analysis. Int. J. Infect. Dis. 2023, 26, 529–541. [Google Scholar] [CrossRef]
- Peltzer, K.; Pengpid, S.; Samuels, T.A.; Özcan, N.K.; Mantilla, C.; Rahamefy, O.H.; Wong, M.L.; Gasparishvili, A. Prevalence of Overweight/Obesity and Its Associated Factors among University Students from 22 Countries. Int. J. Environ. Res. Public Heal. 2014, 11, 7425–7441. [Google Scholar] [CrossRef]
- Al-Nakeeb, Y.; Lyons, M.; Collins, P.; Al-Nuaim, A.; Al-Hazzaa, H.; Duncan, M.J.; Nevill, A. Obesity, Physical Activity and Sedentary Behavior Amongst British and Saudi Youth: A Cross-Cultural Study. Int. J. Environ. Res. Public Heal. 2012, 9, 1490–1506. [Google Scholar] [CrossRef] [PubMed]
- Musaiger, A.O.; Al-Kandari, F.I.; Al-Mannai, M.; Al-Faraj, A.M.; Bouriki, F.A.; Shehab, F.S.; Al-Dabous, L.A.; Al-Qalaf, W.B. Perceived barriers to weight maintenance among university students in Kuwait: the role of gender and obesity. Environ. Health Prev. Med. 2014, 19, 207–214. [Google Scholar] [CrossRef] [PubMed]
- Haneef, S.; Almuammar, S. Prevalence and Associations of Night Eating Syndrome Among Medical Students in Saudi Arabia. Psychol. Res. Behav. Manag. 2024, ume 17, 529–535. [Google Scholar] [CrossRef]
- Alzahrani, S.H.; Malik, A.A.; Bashawri, J.; Shaheen, S.A.; Shaheen, M.M.; Alsaib, A.A.; Mubarak, M.A.; Adam, Y.S.; Abdulwassi, H.K. Health-promoting lifestyle profile and associated factors among medical students in a Saudi university. SAGE Open Med. 2019, 7. [Google Scholar] [CrossRef]
- Ahmad A, Elbadawi NE, Osman MS, Elmandi EM: The Prevalence and Risk Factors of Obesity among Medical Students at Shaqra University, Saudi Arabia. Ann Med Health Sci Res. 2020, 10:903+.
- Younis, J.; Jiang, H.; Fan, Y.; Wang, L.; Li, Z.; Jebril, M.; Ma, M.; Ma, L.; Ma, M.; Hui, Z. Prevalence of overweight, obesity, and associated factors among healthcare workers in the Gaza Strip, Palestine: A cross-sectional study. Front. Public Heal. 2023, 11, 1129797. [Google Scholar] [CrossRef] [PubMed]
- Oo, A.M.; Al-Abed, A.-A.A.A.; MarLwin, O.; Kanneppady, S.S.; Kanneppady, S.K. PREVALENCE OF OBESITY AND ITS ASSOCIATED RISK FACTORS AMONG POST- BASIC RENAL CARE NURSING STUDENTS. Malays. J. Public Heal. Med. 2019, 19, 177–183. [Google Scholar] [CrossRef]
- Yamada, T.; Kimura-Koyanagi, M.; Sakaguchi, K.; Ogawa, W.; Tamori, Y. Obesity and risk for its comorbidities diabetes, hypertension, and dyslipidemia in Japanese individuals aged 65 years. Sci. Rep. 2023, 13, 1–10. [Google Scholar] [CrossRef] [PubMed]
- Ramos-Arellano, L.E.; Matia-Garcia, I.; Marino-Ortega, L.A.; Castro-Alarcón, N.; Muñoz-Valle, J.F.; Salgado-Goytia, L.; Salgado-Bernabé, A.B.; Parra-Rojas, I. Obesity, dyslipidemia, and high blood pressure are associated with cardiovascular risk, determined using high-sensitivity C-reactive protein concentration, in young adults. J. Int. Med Res. 2020, 48. [Google Scholar] [CrossRef]
- Powell-Wiley, T.M.; Poirier, P.; Burke, L.E.; Després, J.-P.; Gordon-Larsen, P.; Lavie, C.J.; Lear, S.A.; Ndumele, C.E.; Neeland, I.J.; Sanders, P.; et al. Obesity and Cardiovascular Disease: A Scientific Statement From the American Heart Association. Circulation 2021, 143, e984–e1010. [Google Scholar] [CrossRef] [PubMed]
- Wharton, S.; Raiber, L.; Serodio, K.J.; Lee, J.; Christensen, R.A. Medications that cause weight gain and alternatives in Canada: a narrative review. Diabetes, Metab Syndr Obes. 2018; 11, 427–438. [Google Scholar] [CrossRef]
- Dayabandara, M.; Hanwella, R.; Ratnatunage, S.; Seneviratne, S.; Suraweera, C.; de Silva, V. Antipsychotic-associated weight gain: management strategies and impact on treatment adherence. Neuropsychiatr. Dis. Treat. 2017, ume 13, 2231–2241. [Google Scholar] [CrossRef]
- Tirthani E, Said MS, Rehman A: Genetics and Obesity. 2024.
- Albuquerque, D.; Nóbrega, C.; Manco, L.; Padez, C. The contribution of genetics and environment to obesity. Br. Med Bull. 2017, 123, 159–173. [Google Scholar] [CrossRef] [PubMed]
- Sarwer, D.B.; Polonsky, H.M. The Psychosocial Burden of Obesity. Endocrinol. Metab. Clin. North Am. 2016, 45, 677–688. [Google Scholar] [CrossRef] [PubMed]
- K, I.J.; Asharaf, H.; Thimothy, G.; George, S.; Jose, J.; Paily, R.; Josey, J.; Sajna, S.; Radhakrishnan, R. Psychological impact of obesity: A comprehensive analysis of health-related quality of life and weight-related symptoms. Obes. Med. 2024, 45. [Google Scholar] [CrossRef]
- Almutairi, K.M.; Alonazi, W.B.; Vinluan, J.M.; Almigbal, T.H.; Batais, M.A.; Al Odhayani, A.; Alsadhan, N.; Tumala, R.B.; Moussa, M.; Aboshaiqah, A.E.; et al. Health promoting lifestyle of university students in Saudi Arabia: a cross-sectional assessment. BMC Public Health 2018, 18, 1093. [Google Scholar] [CrossRef]
Figure 1.
The exercise habits of the participants.
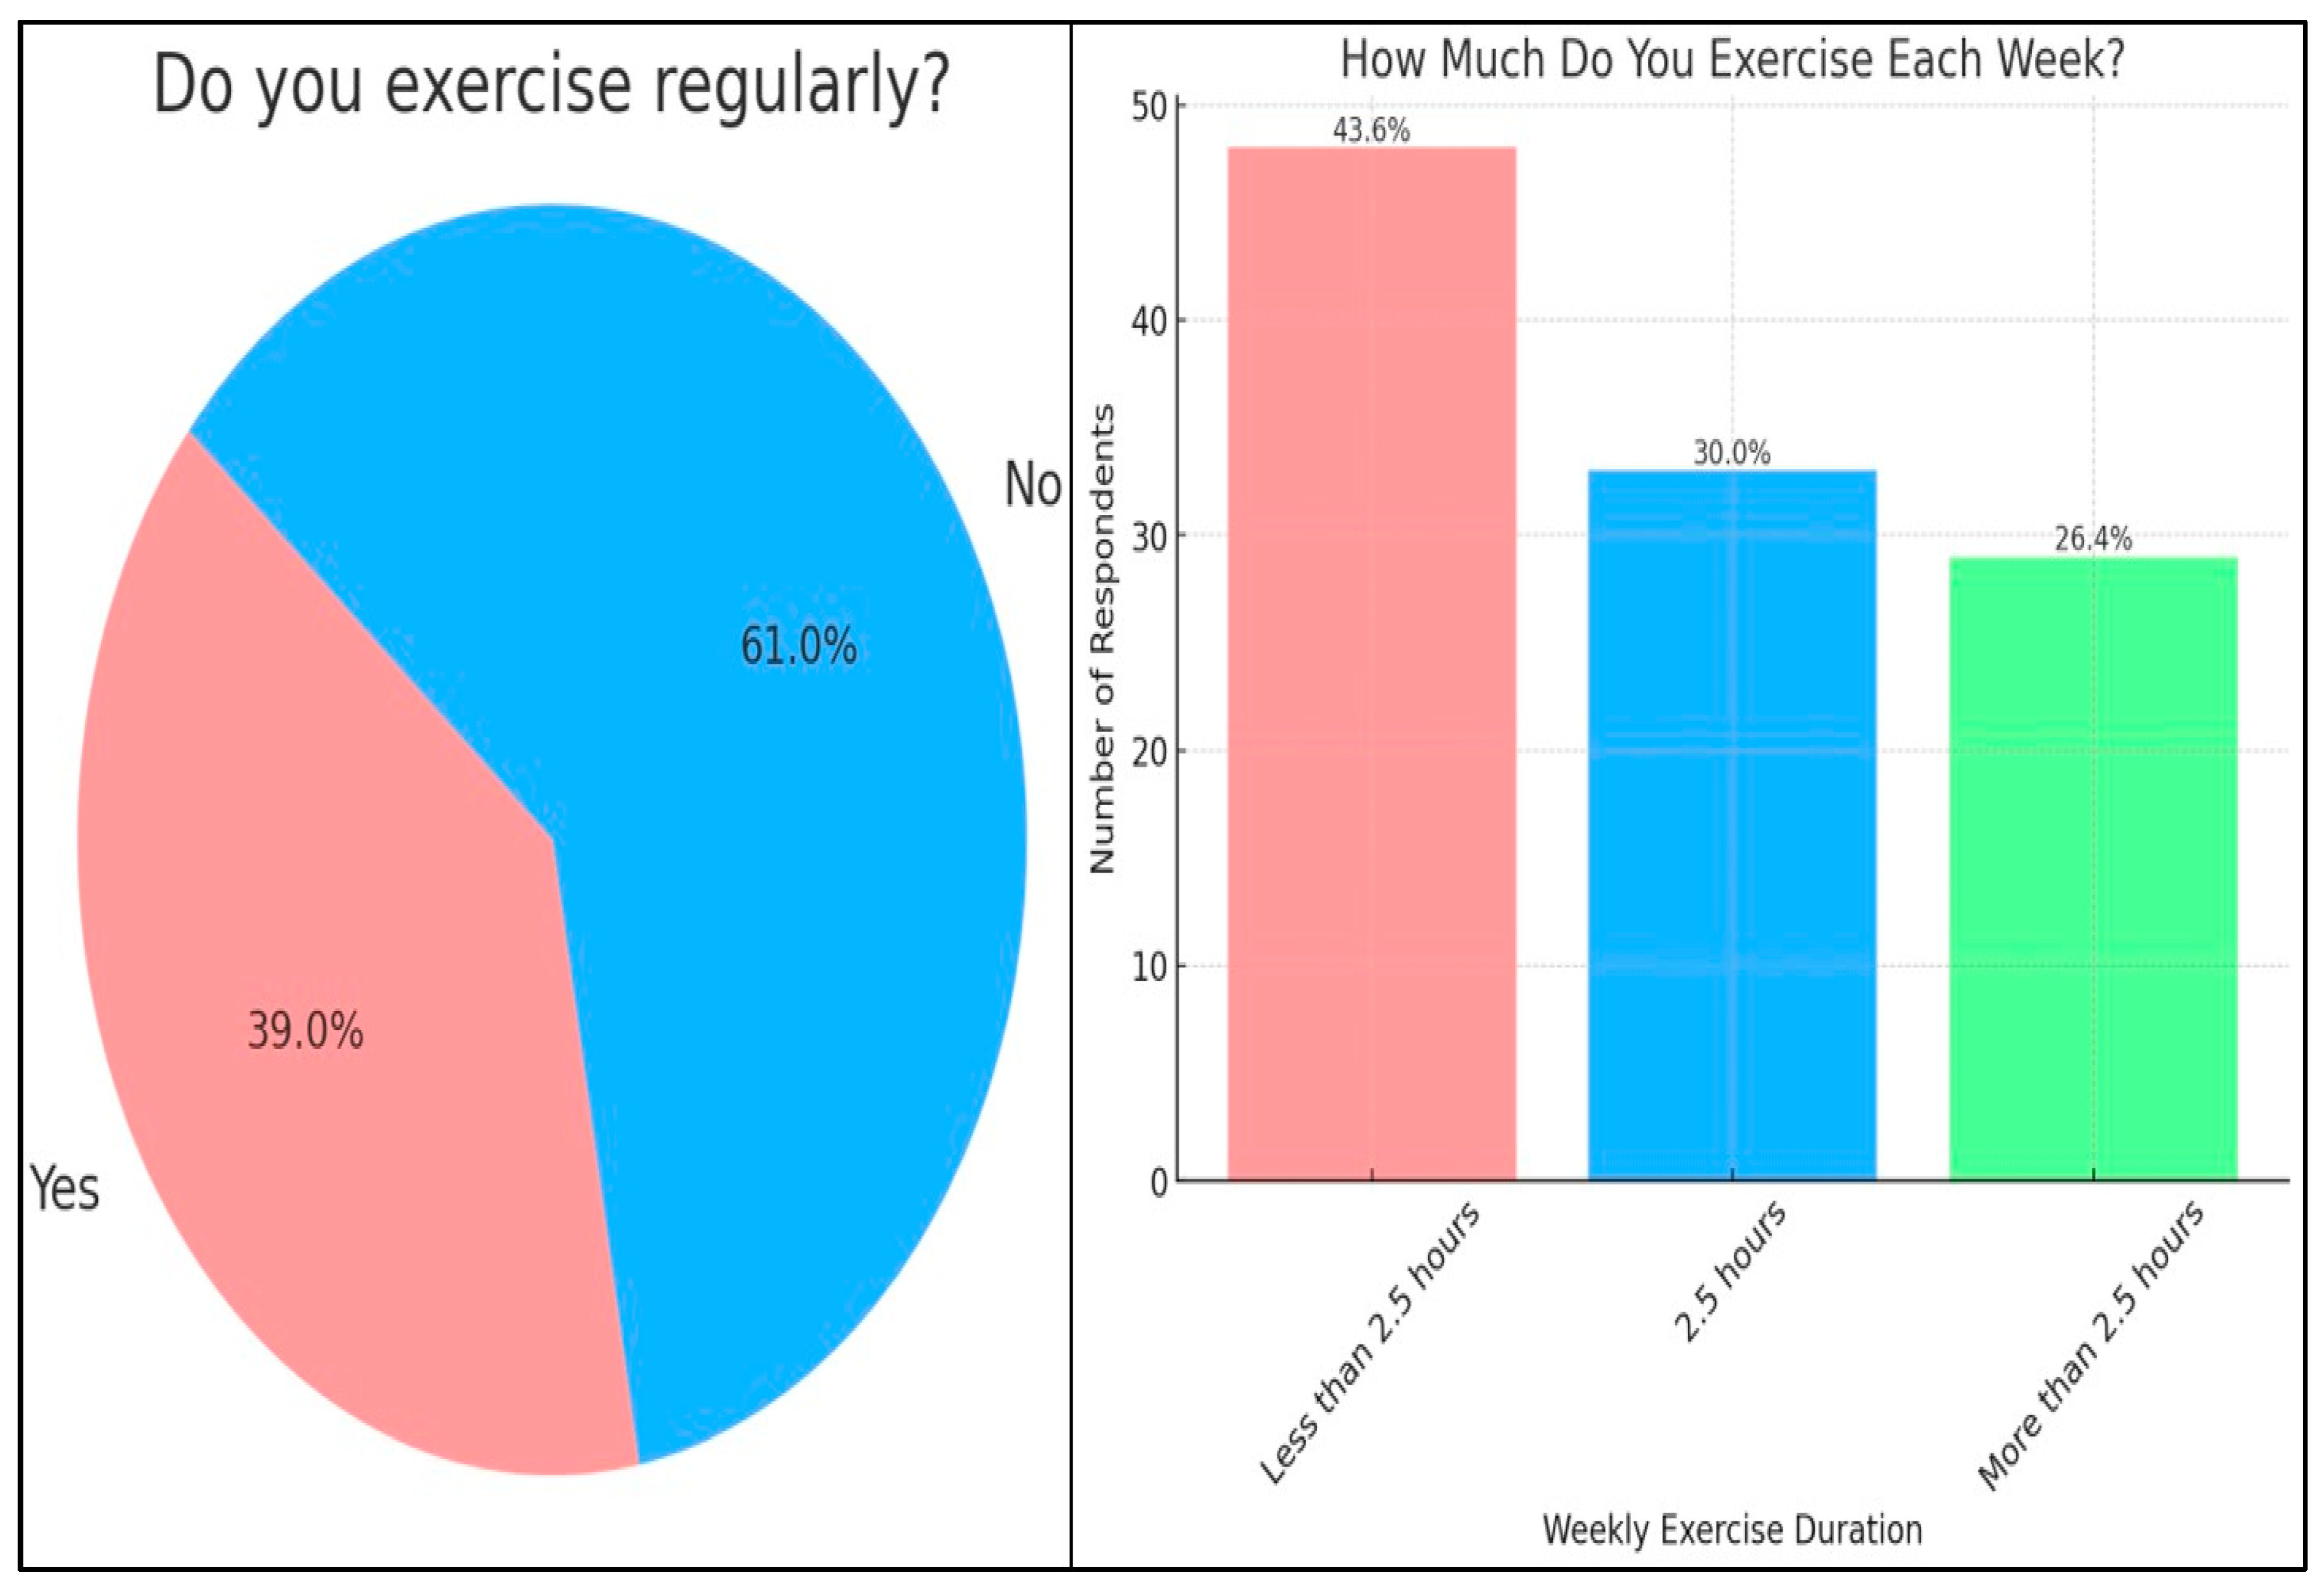
Figure 2.
Dietary habits of the participants.
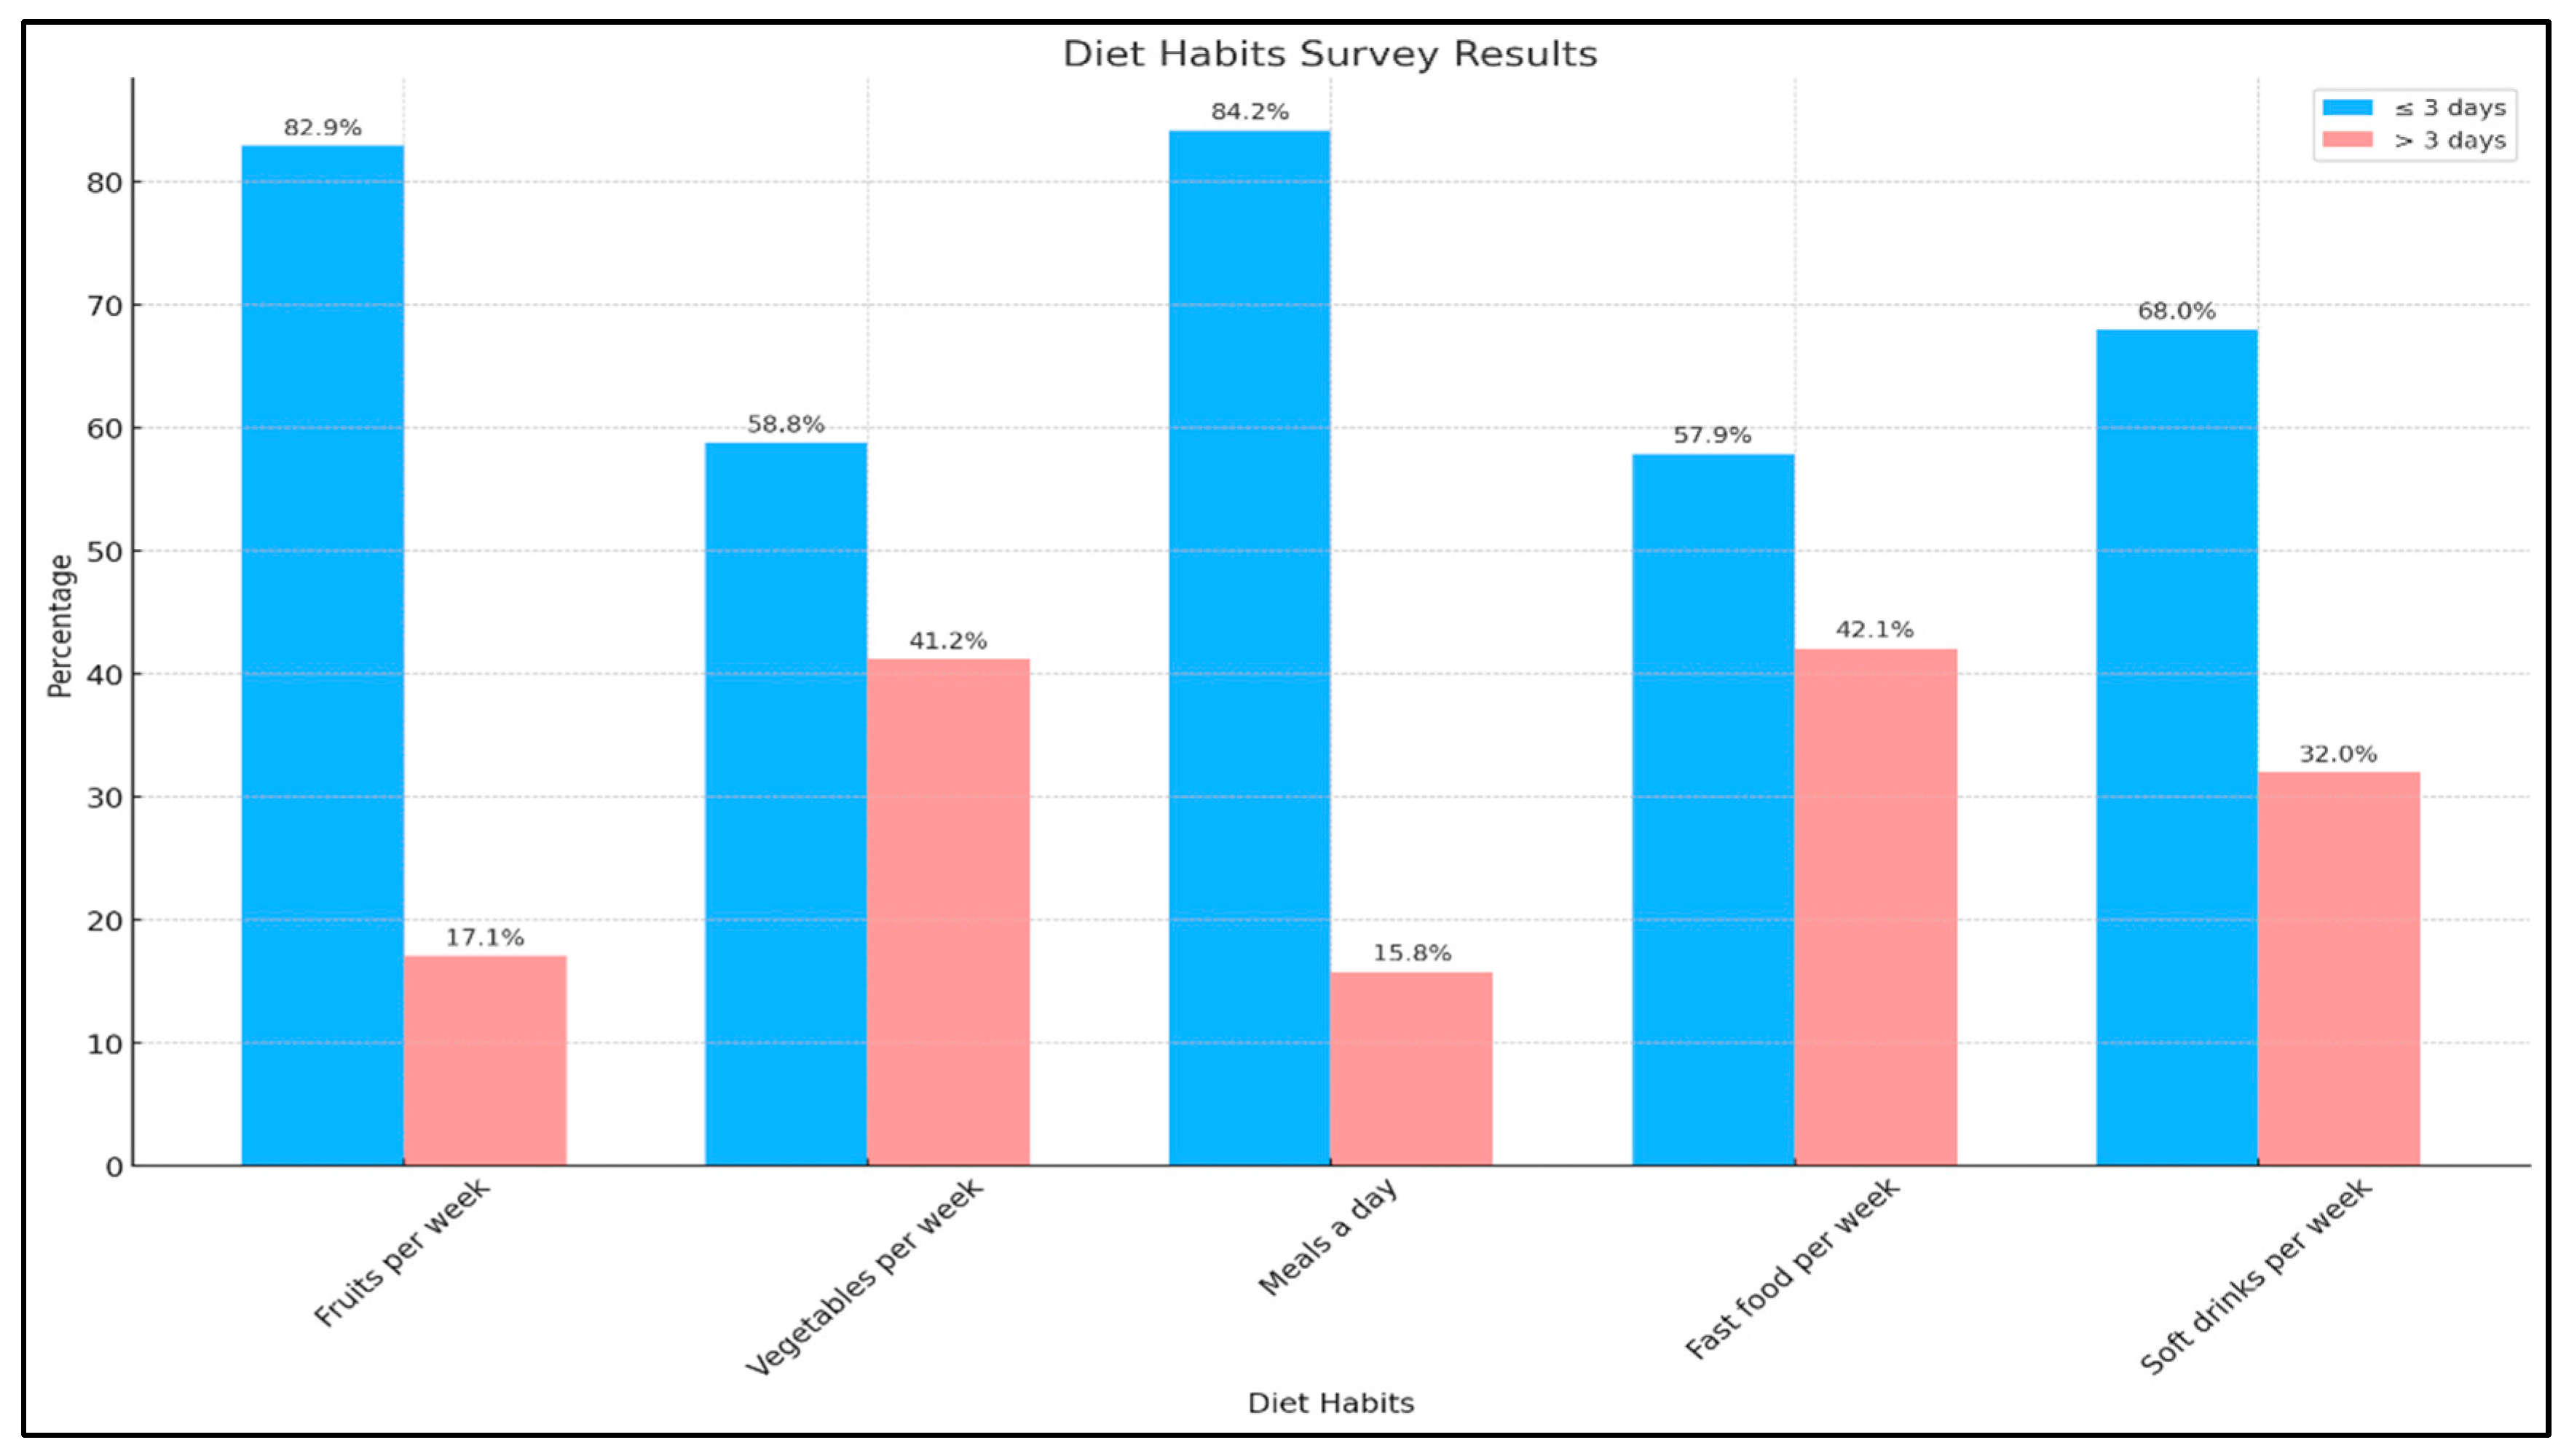
Table 1.
Sociodemographic characteristics of the participants.
| Sociodemographic characteristics | N | % | |
|---|---|---|---|
| Age group | 18-22 years old | 139 | 61.0% |
| 23-26 years old | 82 | 36.0% | |
| Above 26 years | 7 | 3.1% | |
| Gender | Male | 102 | 44.7% |
| Female | 126 | 55.3% | |
| Marital status | Married | 16 | 7.0% |
| Unmarried | 212 | 93.0% | |
| Residence | Rural area | 114 | 50.0% |
| Urban Area | 114 | 50.0% | |
| Academic level | 2nd year | 68 | 29.8% |
| 3rd year | 58 | 25.4% | |
| 4th year | 21 | 9.2% | |
| 5th year | 43 | 18.9% | |
| 6th year | 38 | 16.7% | |
| Monthly family income (in riyals) | Less than 4,000 | 19 | 8.3% |
| 4,000-7,999 | 25 | 11.0% | |
| 8,000-14,999 | 53 | 23.2% | |
| 15,000-24,999 | 61 | 26.8% | |
| More than 25,000 | 70 | 30.7% | |
| Monthly income of the student (in riyals) | Less than 2,000 | 180 | 78.9% |
| More than 2,000 | 48 | 21.1% | |
| What is your current GPA? | Less than 3 | 11 | 4.8% |
| 3-4.5 | 76 | 33.3% | |
| More than 4.5 | 141 | 61.8% | |
| BMI | Less than 18.5 | 39 | 17.3% |
| 18.5-24.9 | 123 | 54.4% | |
| 25-29.9 | 30 | 13.3% | |
| 30-34.9 | 20 | 8.8% | |
| 35-39.9 | 9 | 4.0% | |
| 40 and above | 5 | 2.2% | |
| waist circumference | Less than 80cm | 94 | 41.2% |
| 80-88cm | 73 | 32.0% | |
| More than 88cm | 28 | 12.3% | |
| Less than 90cm | 22 | 9.6% | |
| 90-102cm | 5 | 2.2% | |
| More than 102cm | 6 | 2.6% | |
| Weight(kg); Mean and SD | 63.39 ± 18.93 | ||
| Length (in cm); Mean and SD | 163.48 ± 9.78 | ||
Table 3.
Chi-square of obesity with sociodemographic factors and levels of physical activity.
| Sociodemographic factors | Obesity | p-value | ||||
|---|---|---|---|---|---|---|
| Not Obese | Obese | |||||
| N | N% | N | N% | |||
| Age group |
18-22 years old | 114 | 82.0% | 25 | 18.0% | 0.247 |
| 22-26 years old | 73 | 89.0% | 9 | 11.0% | ||
| Above 26 years | 5 | 71.4% | 2 | 28.6% | ||
| Gender |
Male | 83 | 81.4% | 19 | 18.6% | 0.290 |
| Female | 109 | 86.5% | 17 | 13.5% | ||
| Marital status |
Married | 14 | 87.5% | 2 | 12.5% | 0.755 |
| Unmarried | 178 | 84.0% | 34 | 16.0% | ||
| Residence |
Rural area | 98 | 86.0% | 16 | 14.0% | 0.468 |
| Urban Area | 94 | 82.5% | 20 | 17.5% | ||
| Academic level |
2nd year | 58 | 85.3% | 10 | 14.7% | 0.746 |
| 3rd year | 46 | 79.3% | 12 | 20.7% | ||
| 4th year | 18 | 85.7% | 3 | 14.3% | ||
| 5th year | 36 | 83.7% | 7 | 16.3% | ||
| 6th year | 34 | 89.5% | 4 | 10.5% | ||
| Monthly family income (in riyals) |
Less than 4,000 | 13 | 68.4% | 6 | 31.6% | 0.273 |
| 4,000-7,999 | 21 | 84.0% | 4 | 16.0% | ||
| 8,000-14,999 | 44 | 83.0% | 9 | 17.0% | ||
| 15,000-24,999 | 55 | 90.2% | 6 | 9.8% | ||
| More than 25,000 | 59 | 84.3% | 11 | 15.7% | ||
| Monthly income of the student (in riyals) |
Less than 2,000 | 148 | 82.2% | 32 | 17.8% | 0.111 |
| More than 2,000 | 44 | 91.7% | 4 | 8.3% | ||
| Do you exercise regularly? | Yes | 76 | 85.4% | 13 | 14.6% | 0.695 |
| No | 116 | 83.5% | 23 | 16.5% | ||
Table 4.
Chi-square of obesity with the dietary habits of the participants.
| Dietary habits | Obesity | p-value | ||||
|---|---|---|---|---|---|---|
| Not Obese | Obese | |||||
| N | N% | N | N% | |||
| How often do you consume fruits per week? |
Less than or equal to 3 days | 159 | 84.1% | 30 | 15.9% | 0.939 |
| More than 3 days | 33 | 84.6% | 6 | 15.4% | ||
| How often do you consume vegetables per week? |
Less than or equal to 3 days | 112 | 83.6% | 22 | 16.4% | 0.756 |
| More than 3 days | 80 | 85.1% | 14 | 14.9% | ||
| How many meals do you eat a day? |
Less than or equal to three days | 162 | 84.4% | 30 | 15.6% | 0.875 |
| More than 3 days | 30 | 83.3% | 6 | 16.7% | ||
| How many days do you usually eat fast food each week? |
Less than or equal to 3 days | 113 | 85.6% | 19 | 14.4% | 0.498 |
| More than 3 days | 79 | 82.3% | 17 | 17.7% | ||
| How many days a week do you drink sugar-sweetened soft drinks? |
Less than or equal to 3 days | 130 | 83.9% | 25 | 16.1% | 0.838 |
| More than 3 days | 62 | 84.9% | 11 | 15.1% | ||
| Do you have a family (first-degree relative) history of obesity? | Yes | 60 | 83.3% | 12 | 16.7% | 0.805 |
| No | 132 | 84.6% | 24 | 15.4% | ||
Table 5.
Chi-square of obesity with comorbidities, medications, and educational factors.
| Factors | Obesity | p-value | ||||
|---|---|---|---|---|---|---|
| Not Obese | Obese | |||||
| N | N% | N | N% | |||
| Do you suffer from high blood pressure? |
Yes | 6 | 75.0% | 2 | 25.0% | 0.615 |
| No | 186 | 84.5% | 34 | 15.5% | ||
| Do you suffer from diabetes? |
Yes | 7 | 70.0% | 3 | 30.0% | 0.197 |
| No | 185 | 84.9% | 33 | 15.1% | ||
| Do you suffer from high blood fat levels? |
Yes | 16 | 72.7% | 6 | 27.3% | 0.129 |
| No | 176 | 85.4% | 30 | 14.6% | ||
| Are you currently using a medication that belongs to any of the following drug classes? (Corticosteroids, B-blockers, antidiabetics, antipsychotics, antidepressants) | Yes | 14 | 100.0% | 0 | 0.0% | 0.134 |
| No | 178 | 83.2% | 36 | 16.8% | ||
| What is your current GPA? | Less than 3 | 9 | 81.8% | 2 | 18.2% | 0.975 |
| 3-4.5 | 64 | 84.2% | 12 | 15.8% | ||
| More than 4.5 | 119 | 84.4% | 22 | 15.6% | ||
Table 6.
Binary logistic regression to assess sociodemographic and physical activity-related risk factors for obesity.
Table 6.
Binary logistic regression to assess sociodemographic and physical activity-related risk factors for obesity.
| Variable | B | S.E. | Wald | df | Sig. | Exp(B) |
|---|---|---|---|---|---|---|
| Age group | 18-22 years (Reference category) | |||||
| 22-26 years | -.863 | .637 | 1.834 | 1 | .176 | .422 |
| >26 years |
.650 | 1.140 | .325 | 1 | .569 | 1.915 |
| Gender | Male (Reference Category) | |||||
| Female |
-.693 | .425 | 2.651 | 1 | .103 | .500 |
| Marital status | Married (reference category) | |||||
| Unmarried |
.716 | .937 | .583 | 1 | .445 | 2.046 |
| Residence | Rural area (Reference category) | |||||
| Urban area |
.348 | .402 | .750 | 1 | .387 | 1.416 |
| Academic level | 2nd year (Reference category) | |||||
| 3rd year | .539 | .514 | 1.101 | 1 | .294 | 1.715 |
| 4th year | -.036 | .767 | .002 | 1 | .962 | .964 |
| 5th year | .440 | .736 | .358 | 1 | .550 | 1.553 |
| 6th year |
-.005 | .874 | .000 | 1 | .996 | .995 |
| Monthly family income (in riyals) | Less than 4,000 riyal (Reference category) | |||||
| 4,000-7,999 riyal | -.662 | .838 | .623 | 1 | .430 | .516 |
| 8,000-14,999 riyal | -.658 | .701 | .880 | 1 | .348 | .518 |
| 15,000-24,999 riyal | -1.469 | .733 | 4.019 | 1 | .045 | .230 |
| More than 25,000 riyal |
-.836 | .714 | 1.372 | 1 | .241 | .433 |
| Monthly income of student | Less than 2,000 riyal (Reference category) | |||||
| More than 2,000 riyal |
-.858 | .598 | 2.057 | 1 | .152 | .424 |
| Do you exercise regularly? | Yes (Reference category) | |||||
| No | .276 | .417 | .436 | 1 | .509 | 1.317 |
Table 7.
Binary logistic regression to determine dietary and familial risk factors for obesity.
| Risk factors | B | S.E. | Wald | df | Sig. | Exp(B) |
|---|---|---|---|---|---|---|
| How often do you consume fruits per week? | Less than or equal to three days (Reference category) | |||||
| More than 3 days |
.008 | .580 | .000 | 1 | .989 | 1.008 |
| How often do you consume vegetables per week? | Less than or equal to three days (Reference category) | |||||
| More than 3 days |
-.127 | .411 | .095 | 1 | .758 | .881 |
| How many meals do you eat a day? | Less than or equal to three meals per day (Reference category) | |||||
| More than 3 meals |
.078 | .563 | .019 | 1 | .890 | 1.081 |
| How many days do you usually eat fast food each week? | Less than or equal to three days (Reference category) | |||||
| More than 3 days |
.314 | .405 | .600 | 1 | .439 | 1.368 |
| How many days a week do you drink sugar-sweetened soft drinks? | Less than or equal to three days (Reference category) | |||||
| More than 3 days |
-.211 | .432 | .239 | 1 | .625 | .810 |
| Do you have a family (first-degree relative) history of obesity? | Yes (Reference category) | |||||
| No | -.107 | .392 | .074 | 1 | .785 | .899 |
Disclaimer/Publisher’s Note: The statements, opinions and data contained in all publications are solely those of the individual author(s) and contributor(s) and not of MDPI and/or the editor(s). MDPI and/or the editor(s) disclaim responsibility for any injury to people or property resulting from any ideas, methods, instructions or products referred to in the content. |
© 2024 by the authors. Licensee MDPI, Basel, Switzerland. This article is an open access article distributed under the terms and conditions of the Creative Commons Attribution (CC BY) license (https://creativecommons.org/licenses/by/4.0/).
Copyright: This open access article is published under a Creative Commons CC BY 4.0 license, which permit the free download, distribution, and reuse, provided that the author and preprint are cited in any reuse.


