

Submitted:
25 April 2024
Posted:
25 April 2024
You are already at the latest version
Abstract
Soil secondary salinization has seriously affected the greenhouse vegetable production in China. To improve the secondary salinization greenhouse soil and enhance the soil physical-chemical properties in an eco-environmental way, different organic amendments (straw, straw biochar, Trichoderma bio-organic manure, commercial organic manure) were applied using pot experiment for 60 day to comprehensively screen the optimal remediation method. In this study, soil nutrient condition and salt movement were assessed, and predictive models using multi-linear regression (MLR) and Random Forest (RF) were developed to estimate soil salinization parameters. The findings indicated a significant decrease in soil salt content following the application of organic materials compared to the control treatment. Specifically, the addition of straw at a rate of 250g/kg resulted in a 59.38% reduction in soil salt levels after 60 days (P < 0.05). Furthermore, the main salt ions exhibited dynamic changes over the course of the experiment, with reductions observed in Na+, Ca2+, Cl-, and NO3- content under the 250 g/kg straw treatment by 83.63%, 74.67%, 63.26%, 59.07%, respectively, compared to CK (P < 0.05). In addition, the SO42- content under 125 g/kg commercial organic manure amendment reduced by 48.94%, respectively (P < 0.05). Contrary to expectations, the addition of organic materials significantly increased the levels of total nutrients (N/P/K) and available potassium (AK) and phosphorus (AP) in the soil. Specifically, the addition of straw at a rate of 250 g/kg resulted in increases of 18.02%-87.38% in total potassium (TK), 66.67%-200% in total phosphorus (TP), and 142.87%-367.8% in AK after a period of sixty days (P < 0.05). Ultimately, the treatment involving the addition of 250 g/kg of straw demonstrated the most pronounced impact on the physical and chemical properties of the soil. The random forest method shows promise in accurately predicting soil salt and soil sodium adsorption ratio (SAR)indicators, thereby providing a valuable tool for estimating soil properties.
Keywords:
secondary salinized soil
; organic materials
; salt ions
; soil nutrients
; random forest model
; multi-linear regression model
1. Introduction
Soil secondary salinization in greenhouse is recognized as a significant problem for agricultural production. The overuse of mineral fertilizer and irrigation in conjunction with elevated temperatures, humidity, and evaporation rates in greenhouse environments has resulted in the accumulation of salt ions in the topsoil layer [1,2]. This phenomenon can lead to significant secondary salinization, ultimately impeding vegetable cultivation and causing environmental contamination[3]. Techniques to remediate and improve the saline soil have been rapidly developed such as regional water–salt regulation[4,5], organic amendments[6,7,8], plant growth-promoting microorganisms application [9], and the cultivation of salt-tolerant plant species[10]. Additionally, organic amendment can improve the plant growth and soil quality, which acts as a potent candidate for amelioration of saline soils.
Common organic amendments usually include organic manure, straw, biochar, bio-organic manure and so on. Application of organic manure is an effective approach for significantly decreasing soil salt content[11].Chen et al. [12]also noted that low dose of organic manure addition is conducive to maintain the soil phosphorus effectiveness. Otherwise, over-addition of the organic manure has a risk of exacerbating soil secondary salinization[13]. As an important organic fertilizer prepared by agricultural wastes, crop straw is rich in nitrogen, phosphorus, and potassium elements which can not only add soil nutrients, but also regulate soil water and soil movement. For example, Shao et al. [14] reported that addition of straw reduced soil electrical conductivity (EC), sodium adsorption ration(SAR), and degree of soil alkalization (ESP) by 10.90%, 8.95%, and 13.78%, respectively, in a paddy salinization soil (P < 0.05). Nonetheless, the effect of straw application on saline soil improvement was significantly affected by the amount of additive. Zhang et al. [15] indicated that straw with different addition had discriminative effect on saline soil. Moreover, straw with 18 t/ha significantly increased the flux of salt leaching (FL) compared to straw with 6 t/ha by 33% after three years, respectively (P < 0.05). Biochar, a charcoal-like material with large surface area and high cation exchange capability, has been reported as a practical and economical option to improve the soil physical-chemical properties, as well as contribute to reducing salt stress in greenhouse soil saline condition[16]. Li et al. [17] indicated that the application of cotton straw biochar significantly enhanced the total nitrogen (TN), AP, AK content under a field experiment (P < 0.05). Moreover, the increasing biochar dosage addition had greater effect on soil TN, AP, and AK content with the increase of time. Therefore, further study is still needed to explore the dynamic rules of biochar on greenhouse secondary salinized soil under parameters such as different raw materials and application rate. Bio-organic manure has a great potential to improve soil properties and crop productivity through increased essential nutrients (especially, N and P), stable soil structure and improve soil biodiversity to enhance plants’ salinity tolerance. Yu et al. [18] indicated that the tendency of soil available nutrient (N/P/K) improvement was significantly influenced by the type and additive amount of bio-organic manure.
Fairly recently, the random forest (RF) method has attracted attention and has been successfully used to estimate soil properties. Bokde et al.[19] assessed the performances of different machine learning (MLR and RF) models in estimating soil (TDC) content. The outcome showed better performance of the RF model on the accuracy with the training and validation datasets. Various physicochemical soil properties such as soil nutrient and soil salt ions can be used as predictors for the prediction of soil salt degree, SAR and ESP by using MLR and RF models.
In general, most of the studies have concentrated on the improvement of a certain type of organic additives. To comprehensively evaluate the effects of organic amendments (straw, biochar, commercia organic manure, and Trichoderma bio-organic manure) with different doses by controlling the transport of soil water and salt under the same secondary salinization greenhouse soil environment, an indoor 60 day pot experiment was carried out. It will be helpful to guide the adoption of organic amendments in secondary salinization greenhouse soil.
2. Method
2.1. Experimental Materials
The secondary salinization greenhouse soil was collected at a depth of 20 cm in Shangshi Agriculture Farm (31°52′N,121°91′E), Shanghai, China. The soils which water content 40% were sieved through a 20 mm mesh following airdried. A 60 day pot experiment was designed with nine treatments and three replications for each treatment in 20℃. The pot was made of brown plastic with the dimensions of 17.6*12*27 cm. Three kilogram of dried soil weight was put into each pot. The treatments were set as follows: T1 (straw 250 g/kg), T2(straw 125 g/kg), T3 (straw biochar 80 g/kg), T4 (straw biochar 40 g/kg), T5 (Trichoderma bio-organic manure 250 g/kg), T6 (Trichoderma bio-organic manure 125 g/kg), T7 (commercial organic manure 250 g/kg), T8 (commercial organic manure 125 g/kg), and CK (no organic materials added control). The rice straw,rice straw biochar, Trichoderma bio-organic manure, and the commercial organic manure were provided by Zhuanghang Experiment Station in Shanghai, Shanghai Shike Biological Technological Co., Shanghai Dajing Biological Engineering Co., and Shanghai Yuanjian Organic Fertilizer Factory, respectively. The soil was thoroughly mixed with a 1-cm rice straw and other organic amendments powder prior to the commencement of the experiment. Soil samples were collected at 7thd, 30thd, and 60thd to represent short-term, medium-term, and long-term conditions, respectively. The basic properties of the soil samples were then analyzed following appropriate pretreatment procedures.
2.2. Determination Indexes and Methods
Soil physicochemical properties including soil total, available nutrients and soil salt ions were measured by Lu.[20]. The pH (1:5 soil-to-water ratio) were determined with a glass electrode conductivity meter. The soluble ions were extracted with deionized water at 1:5 ratio of soil to water for 3 minutes. HCO3− were determined using the double indicator neutralization method. Cl− were determined by AgNO3 titration method. SO42− by BaSO4 titration method. NO3- was analyzed by the Mo-Sb colorimetric method with a spectrophotometer. K+, Na+, Ca2+ and Mg2+ by flame spectrometry method. The Kjeldahl method was used to measure soil available nitrogen. The Mo-Sb colorimetric method was used to measure soil available phosphorus, which was extracted with 0.5 M NaHCO3. FP6450 flame photometer was used to measure soil available potassium, which was extracted with 1.0 M NH4OAC (pH=7).
SAR and ESP were calculated according to a previous method [21], as shown in equations:
Where CEC is the cation exchange capacity.
2.3. Model Construction and Prediction
2.3.1. Multiple Linear Regression (MLR) Model
Multiple linear regression (MLR) is a traditional statistical technique and used to assess the precision of the soil salinity prediction with multiple variables. It helps to selected suitable relationships between soil characteristics and the nutrient factors [22]. The multiple regression procedures are the following linear equation:
where y is the predicted value (dependent variable); x1 to xi are the predictor values (independent variables); a is the value of Y when all the independent variables (x1 through xi) are zero; and b1 through bi are the estimated regression coefficients.
2.3.2. Random Forest Model (RF)
Random Forest can be used to solve regress problems in secondary salinized soil prediction which can integrate multiple decision trees to make predictions [23,24]. As an efficient learning machine, RF has the advantages of easy modeling construction, fast calculating speed, and minimum computational cost. This method generates numbers of randomized and independent decision trees to produce the optimal results by voting. Finally, all the predictions from each tree are aggregated into one tree. This study used 14 explanatory attributes to predict soil salinization, based on the available data. The attributes include Na+, Ca2+, Cl-, NO3-, SO42-, AK, AP, TK, TP, AN, and TN. We set the number of decision trees (ntree), the number of split nodes (mtry) and the minimum child node size as100,2 and 1, respectively.
Random Forest (RF) and Multiple linear regression (MLR) models can be built by the soil salinized parameters to predict the salinization trend of the greenhouse secondary soil. Soil salinity, soil SAR and soil ESP were selected as the target variables. Soil soluble salt ions and soil nutrients were selected as predictor variables. The dataset was divided into a 70% training set and a 30% test set. Two basic parameters were considered to evaluate the model: the determination coefficient (R2), root mean square error (RMSE).
2.4. Data Analysis
SPSS software (version 22.0) was used to analyze the statistically significant differences of the soil physical chemical properties between the treatments by one-way ANOVA. Figures and tables were drawn using Origin 2021and R studio 4.1.3.
3. Result
3.1. Analysis of Soil Salt Content
Soil salts of each treatment showed a decreasing trend along with cultivation time as shown in Table 1. Both soil salt content and SAR significantly reduced under all organic amendments within sixty days, respectively, compared to CK treatment. The soil salt content significantly reduced by 41.03 % under T2, T3, and T4 treatments at 7thd compared to CK, respectively, as well as reduced under T1 by 51.43 %, 59.38 % at 30th d and 60thd compared to CK, respectively (P<0.05). The Soil SAR under T1 treatment exhibited more significant decrease than other treatments by 69.94% at 60thd (P<0.05). In addition, soil ESP reduced under all organic amendments at 60thd, which decreased mostly under T1 treatment by 51.39% (P<0.05).
3.2. Analysis of Soil Total and Quick Nutrients
Different organic amendments had significant positive impacts on the soil nutrient contents, as shown in Table 2 and Table 3. All organic amendments increased soil TN content at 7thd, 30thd, and 60thd, respectively, compared to the CK treatment(P<0.05). Similarly, TP notably increased under all organic amendments at 60thd, respectively, compared to CK. T1 treatment increased soil TN, TP, TK mostly by 171.43%, 150.00%, 88.57% and 187.50%, 166.67%, 95.16% both at 30thd and 60thd days (P<0.05). TN was increased mostly by 216.67% at 60thd (P<0.05).
AK increased mostly under T1 by 95.35%、386.93%、367.88% at 7th d ,30th d , 60th d (P<0.05). Except for biochar treatment, AP increased under all organic amendments at 7thd, respectively, compared to CK (P<0.05). On the contrast, AP increased under all organic amendments both at 30thd and 60thd, respectively, compared to CK, with AP increased mostly under T6 by 361.00% at 7thd, increased mostly under T3 by 337.28% at 30thd,increased mostly under T8 by 309.87% at 60thd (P<0.05). The AN significantly reduced under straw treatment at 60thd, respectively, compared to CK (P<0.05). However, both Trichoderma bio-organic manure and organic manure treatment all significantly increased AN content (P<0.05). AN reduced under biochar treatment both at 7thd and 60thd, otherwise increased at 30thd. AN increased mostly under T5 by 92.80%、91.58% at 7thd ,30thd, increased mostly under T6 by 249.06% at 60thd (P<0.05).
3.3. Analysis of the Changes of the Contents of Major Cations in Soil
As depicted in Table 4, the contents of major soil cations (Na+/Mg2+/Ca2+/K+) performed differently with four organic amendments addition. Under organic amendments addition, the concentration of Na+, Mg2+ and Ca2+ reduced initially, while K+ content kept increasing with time in 60 days. Na+ content was significantly reduced under all organic amendments at 7thd, 30thd, and 60thd, respectively, compared to CK (P<0.05). The Na+ content decreased mostly under T2 treatment at 7thd and decreased mostly under T1 both at 30th d, and 60thd. Except for straw treatment, Mg2+ content increased under all organic amendments at 7thd, respectively, compared to CK (P<0.05). However, there was no significant difference in Mg2+ content among treatments. Mg2+ content significantly reduced under T3、T5、T7、T8 treatment at 30th d, respectively, compared to CK, with Mg2+ reduced mostly under T8 treatment by 39.66% (P<0.05). Except for T2 treatment, Mg2+ content reduced under all organic amendments at 60thd, respectively, compared to CK, with Mg2+ reduced mostly under T6 treatment by 57.99% (P<0.05). Ca2+ content significantly increased under all organic amendments at 7th d, respectively, compared to CK, with Ca2+ increased mostly under T4 treatment by 47.23% (P<0.05). Ca2+ content significantly reduced under all organic amendments both at 30thd, and 60thd, respectively, compared to CK, with Ca2+ reduced mostly under T1 treatment by 57.97% and 74.67% (P<0.05). K+ content significantly reduced under all organic amendments at 60thd, respectively, compared to CK. Except for T4 treatment (P<0.05). K+ content increased under all organic amendments at 30thd, respectively, compared to CK (P<0.05). In addition, K+ content under straw treatment increased mostly by 408.63% within 60thd (P<0.05).
3.4. Analysis of Changes in Soil Major Anion Content
The activities of soil major anion contents were reduced when four organic amendments addicted under different dosage levels in secondary salinized soil (Table 5). Compared with CK, soil Cl-, SO42-, and HCO3- contents showed a decreasing trend in each treatment group within 60thd. Both Cl- and SO42- content reduced under all organic amendments at 7thd, 30thd, and 60thd, respectively, compared to CK(P<0.05), with Cl- content reduced mostly under T2 treatment (P<0.05), as well as reduced mostly under T1 treatment both at 30thd, and 60thd, with SO42- content reduced mostly under T4, T6 and T8 treatment by 29.49%, 45.72%, and 48.94% at 7thd, 30thd, and 60thd (P<0.05). NO3- content reduced under straw and biochar treatment at7thd, 30thd, and 60thd (P<0.05), respectively, compared to CK, with NO3- content reduced mostly under T2 treatment at 7thd and reduced mostly under T1 treatment both at 30thd, and 60thd. HCO3- content reduced under only T4 and T5treatment at 7thd, respectively, compared to CK (P<0.05). On the contrary, HCO3- content reduced under all organic amendments both at 30thd, and 60thd, respectively, compared to CK (P<0.05). HCO3- content decreased mostly under T5 treatment by 47.66% at 30thd, as well as decreased mostly under T3 treatment by 57.08% at 60thd (P<0.05).
3.5. Prediction and Validation of Soil Salinization Parameters
A coloration plot was shown in Figure 1 to visually represent the correlations between soil nutrients and soil salt parameters. The rows and columns represent different indicates and the depth of the color represent the strength of the relationship between them. Spearman’s correlation was conducted to explore the relationship between soil nutrients and soil salinization (Figure 1). Soil total nutrients (N/P/K) and AK were negatively correlated with the soil ESP and SAR. In addition, there was also a negatively correlated between soil Na+, Ca2+, Mg2+, Cl-, NO3-, SO42-, HCO3- and soil TN, TP, AK, which suggested that soil nutrients can be affected by soil salt component.
Additionally, the prediction accuracy of MLR and RF models were presented in Figure 2 and Figure 3. The RF model presented a better accuracy (R2) and least error (RMSE) in predicting the soil salt and SAR compared to that of the performance of MLR model. Besides, during both RF and MLR models, the training set achieved a better performance under soil salt and SAR indicate than the test set. The R2 under both training set and test set in soil salt and SAR indicates are 0.98,0.99 ,0.91,0.87, respectively, in RF model. While, the MLR model performed a lower level, which were 0.92, 0.91, 0.51, 0.67, respectively. On the contrary, the RMSE of RF model which were 0.01, 0.02, 2.16,7.74 had a lower value compared to that of MLR model which were 0.02, 0.04, 3.74, 15.41 in soil salt and SAR, both under training set and test set. In addition, under the training set, the ESP achieved a better performance in RF model than that in MLR model. However, the result of test set performed differently which the accuracy in the test set is better than the training set. Both under training set and test set, the R2 in RF and MLR models were 0.97, 0.63, 0.72, 0.77, respectively. the RMSE both under training set and test set in RF and MLR models are 0.87, 2.86, 2.1, 1.84, respectively.
4. Discussion
The research site was situated in a coastal region, where mismanagement of irrigation and fertilization has resulted in soil exhibiting both primary and secondary salinization. The predominant leaching salt ions identified in this study were SO42-, Cl-, and Na+ , aligning with previous findings by Zhang et al. [25]. The implementation of organic amendments to enhance infiltration and leaching of salts has proven to be an effective method for mitigating secondary salinization in greenhouse soils. Specifically, that the application of straw, biochar, Trichoderma bio-organic manure, and organic manure were all found to significantly contribute to soil desalination on greenhouse secondary salinized soil through a pot experiment in 60 days. Biochar holds various of functional groups such as hydroxyl and carboxyl, which can provide a suitable choice for the adsorption of huge salts ions and strengthen salt leaching capacity in soil additionally, thus mitigating the salinity of soil[26]. Straw which can improve soil porosity and aeration can act as an effective barrier to prevent salt in the deep soil layers moving upward through a capillary process[27]. Soil porosity differences was the main reason to influence soil hydraulic conductivity that the thicker straw barrier layer had greater effect on water content[15]. Moreover the effect of blocking soil capillary increased with straw mulching, which prevented water loss below the straw layer during evaporation, thus decreasing salt accumulation in surface soil[28]. Soil salinity is closely connected with soil microbial community diversity, composition and structure[11]. It was indicated that the application of different organic manures significantly increased the Shannon index of the soil bacterial and fungal community by improving the contents of soil nutrients, water-holding capacity and soil aeration[29]. Moreover, the application of organic manures also improve the growth of beneficial salt-tolerant bacteria in salinized soil[30]. In addition, The release of carbon dioxide, hydrogen ions (H+) and organic acids from the breakdown of the organic amendment under the decomposition of microorganisms swap out the insoluble ions and decreased pH value which causing the water to flow out faster and increasing the soil column’s desalination efficiency[31,32]. Moreover, organic manure effect to inhibit salt accumulation was poor, which may be due to the generation of salts in the composting process of bio-organic fertilizer[33].
In this study, it was confirmed that soil salt content reduced under organic amendments mainly due to SO42-, Cl-, and Na+ decreased. Among them, straw and biochar were more effective in reducing Na+ content. Straw returning increased the content of soil humus to increase the soil cation exchange capacity, which can promote exchangeable cations such as Ca2+ and Mg2+ to replace Na+ at the exchange sites[34,35]. This result indicates that the more both straw and biochar addition, the greater effect for Na+ decreasing, similarly to the results found in previous study [36,37]. Furthermore, Na+ decreased while Ca2+ increased under organic amendments application at 7thd. Organic compounds can be oxidized by microbial activity, which releases protons (H+) to the solution, thus decreasing the soil pH value and promoting Ca2+ release additionally. Soil Ca2+ is an essential element for crop growth and can exchange the mineral Na+. Moreover, at the same time, the decrease of Na+ content was also accompanied by the decrease of Cl- due to the synergistic transport properties of Na+ and Cl-[38]. Additionally, biochar can trap excess Na+ in soil and release Ca2+ to reduce both Na+ and Cl- contents[39].The results of the present study showed that SO42- content decreased significantly (P<0.05) under biochar application, similarly to the results found in the previous study [40]. As for the soil SO42- content, four organic amendments may reduce it by enhancing the water-holding capacity and soil aeration to strength ions leaching capacity[11,41,42]. In addition, organic amendments can promote nitrate assimilation and reduce nitrification, as well as microbial immobilization of available N enhanced under wide C/N ratio straw addition, thus reducing soil nitrogen loss[43,44].
The result showed that total nutrient content increased through the use of four organic amendments in the salinized soil. While there was no significant difference in soil total nutrients improvement. The soil available nutrients (AN, AP, and AK) increased significantly (P<0.05) under biochar, Trichoderma bio-organic manure, and bio-organic manure addition after 60 days. Similar results[45,46,47,48] were also found by previous study. On the one hand, Biochar acts as a good nutrient carrier and provider which can supply essential soil mineral nutrients (such as K+,Ca2+, and Mg2+) and aromatic group to promote soil stability[49]. On the other hand, biochar has advantages of porous structures, wide surface area, and high ion exchange ability that reduce the loss of soil available nutrients[50]. It was reported that Trichoderma organic manure consists of compost and specific microorganisms with unique functions, which can increase the number of soil nitrogen-fixing bacteria and fungi, have shown positive effects on soil AN elevation[18]. Additionally, Organic manure continuously provides plants with vital nutrients including N, P, and K through decomposition and mineralization of microorganisms[33].The present study revealed that soil AP and AK increased under straw addition, which is similar to that of Zhao et al. [51] The concentration of K+ increased by straw decomposition can be considered as a key mechanism to promote crop growth and counteract saline-sodic stress, moreover increased soil AK content[52]. However, soil AN decreased under straw addition, it may be due to soil C/N ratio increased which promote the bacterial and fungal community structure, moreover, enhance the residues as more accessible and faster decomposable to soil microorganisms[53].
The RF and MLR tools have been identified as valuable supplementary methods to conventional soil property monitoring[54]. Previous research has utilized MLR and RF models for assessing species diversity spatial variability, optimizing crop selection, and establishing relationships between environmental factors and soil properties[24,55,56]. The results of the study indicated that the RF model outperformed the MLR model in terms of accuracy when applied to both the training and validation datasets, consistent with Wang et al.[57] This can be attributed to the effectiveness of soluble major ions complex as a predictor for soil salinity. Additionally, the performance of the MLR model was found to be more suitable in cases of multicollinearity, which was observed due to the high correlation among soluble salt ions[58]. However, both two models performed normal when predicting the soil ESP.
5. Conclusion
The present study investigated the impact of straw, biochar, Trichoderma bio-organic manure, and organic manure as recommended materials on salt distribution in a secondary salinized soil using a pot experiment. It was observed that soil salt content remarkably decreased, as well as soil total nutrients (TN/TP/TK) and available nutrients (AP/AK) content increased under all organic amendments after 60 days compared to CK treatment (P<0.05), with a gradual decrease over time. Among the various organic amendments, straw with a dose of 250 g/kg showed the most significant improvement in soil physical-chemical properties in greenhouse secondary saline soil, which reduce soil salt content most at 59.38% after 60 days (P<0.05) and increase soil TP, TK, AK most by 200%, 87.38%, 37.88% after 60 days (P<0.05). Furthermore, the RF model demonstrated superior accuracy (R2) of 0.98, 0.99, 0.91, and 0.87 in both training and test sets, as well as a least error (RMSE) of 0.92, 0.91, 0.51, and 0.67 in predicting soil salinity and SAR compared to the performance of MLR model. Both models exhibited similar performance in predicting soil ESP. In general, this research elucidates the correlation between soil salts and nutrients following the application of organic amendments, offering insights for sustainable agricultural practices.
Author Contributions
Writing—original draft preparation, H.Z. (Hanlin Zhang), F.Z. and Y.Z.; visualization, Z.M. and B.L; writing—review and editing, methodology, Z.M. and B.L.; software, X.Z. and S.L.; data curation, H.Z. (Haiyun Zhang) and J.Z.; investigation, Y.H., X.M., F.Z. and Z.M.; conceptualization, supervision and funding acquisition, H.Z. (Hanlin Zhang) and W.L. All authors have read and agreed to the published version of the manuscript.
Funding
This research was supported by the Domestic cooperation project of Science and Technology Commission of Shanghai Municipality (23015820900) and the Outstanding Team Program of Shanghai Academy of Agricultural Science [Grant No. Hu-Nong-Ke-Zhuo 2022 (008)].
Data Availability Statement
The data presented in this study are available on request from the corresponding author.
Acknowledgments
The authors also would like to express their appreciation to staff for their contributions to the execution of this research. All staff have read and agreed to the published version of the manuscript.
Conflicts of Interest
The authors declare that they have no known competing financial interests or personal relationships that could have appeared to influence the work reported in this paper.
References
- Guan, Y.P.; Jiang, N.; Wu, Y.X.; Yang, Z.Z.; Bello, A.; Yang, W. Disentangling the Role of Salinity-Sodicity in Shaping Soil Microbiome along a Natural Saline-Sodic Gradient. Science of The Total Environment 2021, 765, 142738. [Google Scholar] [CrossRef] [PubMed]
- Zhang, Z.L.; Sun, D.; Tang, Y.; Zhu, R.; Li, X.; Gruda, N.; Dong, J.L.; Duan, Z.Q. Plastic Shed Soil Salinity in China: Current Status and next Steps. Journal of Cleaner Production 2021, 296, 126453. [Google Scholar] [CrossRef]
- Sun, H.W.; Wei, C.; Xu, W.S.; Yang, J.Z.; Wang, X.G.; Qiu, Y.F. Characteristics of Salt Contents in Soils under Greenhouse Conditions in China. Environ Sci Pollut Res 2019, 26, 3882–3892. [Google Scholar] [CrossRef]
- Heng, T.; Liao, R.K.; Wang, Z.H.; Wu, W.Y.; Li, W.H.; Zhang, J.Z. Effects of Combined Drip Irrigation and Sub-Surface Pipe Drainage on Water and Salt Transport of Saline-Alkali Soil in Xinjiang, China. J. Arid Land 2018, 10, 932–945. [Google Scholar] [CrossRef]
- Du, L.; Zheng, Z.C.; Li, T.X.; Zhang, X.Z. Effects of Irrigation Frequency on Transportation and Accumulation Regularity of Greenhouse Soil Salt during Different Growth Stages of Pepper. Scientia Horticulturae 2019, 256, 108568. [Google Scholar] [CrossRef]
- Yang, L.; Bian, X.G.; Yang, R.P.; Zhou, C.L.; Tang, B.P. Assessment of Organic Amendments for Improving Coastal Saline Soil. Land Degrad Dev 2018, 29, 3204–3211. [Google Scholar] [CrossRef]
- Xiao, M.; Liu, G.M.; Jiang, S.G.; Guan, X.W.; Chen, J.L.; Yao, R.J.; Wang, X.P. Bio-Organic Fertilizer Combined with Different Amendments Improves Nutrient Enhancement and Salt Leaching in Saline Soil: A Soil Column Experiment. Water 2022, 14, 4084. [Google Scholar] [CrossRef]
- Chen, X..D; Yaa, O.-K.; Wu, J.G. Effects of Different Organic Materials Application on Soil Physicochemical Properties in a Primary Saline-Alkali Soil. Eurasian Soil Sci. 2020, 53, 798–808. [Google Scholar] [CrossRef]
- Etesami, H.; Maheshwari, D.K. Use of Plant Growth Promoting Rhizobacteria (PGPRs) with Multiple Plant Growth Promoting Traits in Stress Agriculture: Action Mechanisms and Future Prospects. Ecotoxicology and Environmental Safety 2018, 156, 225–246. [Google Scholar] [CrossRef]
- Atzori, G.; De Vos, A.C.; Van Rijsselberghe, M.; Vignolini, P.; Rozema, J.; Mancuso, S.; Van Bodegom, P.M. Effects of Increased Seawater Salinity Irrigation on Growth and Quality of the Edible Halophyte Mesembryanthemum Crystallinum L. under Field Conditions. Agricultural Water Management 2017, 187, 37–46. [Google Scholar] [CrossRef]
- Mao, X.X.; Yang, Y.; Guan, P.B.; Geng, L.P.; Ma, L.; Di, H.J.; Liu, W.J.; Li, B.W. Remediation of Organic Amendments on Soil Salinization: Focusing on the Relationship between Soil Salts and Microbial Communities. Ecotoxicology and Environmental Safety 2022, 239, 113616. [Google Scholar] [CrossRef] [PubMed]
- Chen, M.M.; Zhang, S.R.; Wu, L.P.; Fei, C.; Ding, X.D. Organic Fertilization Improves the Availability and Adsorptive Capacity of Phosphorus in Saline-Alkaline Soils. J Soil Sci Plant Nutr 2021, 21, 487–496. [Google Scholar] [CrossRef]
- Abebe, T.G.; Tamtam, M.R.; Abebe, A.A.; Abtemariam, K.A.; Shigut, T.G.; Dejen, Y.A.; Haile, E.G. Growing Use and Impacts of Chemical Fertilizers and Assessing Alternative Organic Fertilizer Sources in Ethiopia. Applied and Environmental Soil Science 2022, 2022, 1–14. [Google Scholar] [CrossRef]
- Shao, X.W.; Ran, C.; Gao, D.P.; Liu, W.Y.; Guo, L.Y.; Bai, T.Q.; Geng, Y.Q. Straw and Nitrogen Amendments Improve Soil, Rice Yield, and Roots in a Saline Sodic Soil. Rhizosphere 2022, 24, 100606. [Google Scholar] [CrossRef]
- Zhang, H.Y.; Pang, H.C.; Zhao, Y.G.; Lu, C.; Liu, N.; Zhang, X.L.; Li, Y.Y. Water and Salt Exchange Flux and Mechanism in a Dry Saline Soil Amended with Buried Straw of Varying Thicknesses. Geoderma 2020, 365, 114213. [Google Scholar] [CrossRef]
- Cui, Q.; Xia, J.B.; Yang, H.J.; Liu, J.T.; Shao, P.S. Biochar and Effective Microorganisms Promote Sesbania Cannabina Growth and Soil Quality in the Coastal Saline-Alkali Soil of the Yellow River Delta, China. Science of The Total Environment 2021, 756, 143801. [Google Scholar] [CrossRef] [PubMed]
- Li, W.D.; Wang, H.J.; Zhong, M.T.; Song, J.H.; Shi, X.Y.; Tian, T.; Wang, J.G.; Zhu, Y.Q.; Jiang, M.H. Effects of Straw Return and Biochar Application on Soil Nutrients and Osmotic Regulation in Cotton Under Different Soil Salinity Levels. Appl. Ecol. Env. Res. 2023, 21, 957–974. [Google Scholar] [CrossRef]
- Yu, Y.N.; Wu, H.Y.; Wang, P.X.; Ding, M.Y.; Ma, X.C.; Jiang, S.Q.; Cai, F.; Shen, Q.R.; Chen, W. Effect of Trichoderma-enriched Biofertilizers on Cabbage Cultivation in Coastal Saline Soil. Acta Pedologica Sinica 2022, 59, 1112–1124. (in Chinese). [Google Scholar]
- Bokde, N.D.; Ali, Z.H.; Al-Hadidi, M.Th.; Farooque, A.A.; Jamei, M.; Maliki, A.A.A.; Beyaztas, B.H.; Faris, H.; Yaseen, Z.M. Total Dissolved Salt Prediction Using Neurocomputing Models: Case Study of Gypsum Soil Within Iraq Region. IEEE Access 2021, 9, 53617–53635. [Google Scholar] [CrossRef]
- Lu, R.K.; Agriculture Soil Chemical Analysis Beijing: China Agricultural Science and Technology Press, 2000. (in Chinese).
- Chi, C.M.; Zhao, C.W.; Sun, X.J.; Wang, Z.C. Estimating Exchangeable Sodium Percentage from Sodium Adsorption Ratio of Salt-Affected Soil in the Songnen Plain of Northeast China. Pedosphere 2011, 21, 271–276. [Google Scholar] [CrossRef]
- Abdel-Fattah, M.K. Linear Regression Models to Estimate Exchangeable Sodium Percentage and Bulk Density of Salt Affected Soils in Sahl El-Hossinia, El-Sharkia Governorate, Egypt. Communications in Soil Science and Plant Analysis 2019, 50, 2074–2087. [Google Scholar] [CrossRef]
- Lin, L.X.; Liu, X.X. Mixture-Based Weight Learning Improves the Random Forest Method for Hyperspectral Estimation of Soil Total Nitrogen. Computers and Electronics in Agriculture 2022, 192, 106634. [Google Scholar] [CrossRef]
- Tolani, M.; Bajpai, A.; Balodi, A.; Sunny; Wuttisittikulkij, L.; Kovintavewat, P. Analysis & Estimation of Soil for Crop Prediction Using Decision Tree and Random Forest Regression Methods. In Proceedings of the 2022 37th International Technical Conference on Circuits/Systems, Computers and Communications (ITC-CSCC), July 5 2022; IEEE: Phuket, Thailand; pp. 752–755. [Google Scholar]
- Zhang, L.; Investigation on secondary salinization of cultivated vegetable soil in Shanghai suburban County and improvement of S3-1 strain and vegetables. Master, Shanghai Normal University, 2018. (in Chinese).
- Yang, A.Z.; Akhtar, S.S.; Li, L.; Fu, Q.; Li, Q.F.; Naeem, M.A.; He, X.Y.; Zhang, Z.; Jacobsen, S.-E. Biochar Mitigates Combined Effects of Drought and Salinity Stress in Quinoa. Agronomy 2020, 10, 912. [Google Scholar] [CrossRef]
- Chen, S.; Zhang, Z.Y.; Wang, Z.C.; Guo, X.P.; Liu, M.H.; Hamoud, Y.A.; Zheng, J.C.; Qiu, R.J. Effects of Uneven Vertical Distribution of Soil Salinity under a Buried Straw Layer on the Growth, Fruit Yield, and Fruit Quality of Tomato Plants. Sci. Hortic. 2016, 203, 131–142. [Google Scholar] [CrossRef]
- Cao, J.S.; Liu, C.M.; Zhang, W.G.; Guo, Y.L. Effect of Integrating Straw into Agricultural Soils on Soil Infiltration and Evaporation. Water Science and Technology 2012, 65, 2213–2218. [Google Scholar] [CrossRef]
- Dong, L.; Zhang, W.T.; Xiong, Y.W.; Zou, J.Y.; Huang, Q.Z.; Xu, X.X.; Ren, P.; Huang, G.H. Impact of Short-Term Organic Amendments Incorporation on Soil Structure and Hydrology in Semiarid Agricultural Lands. International Soil and Water Conservation Research 2022, 10, 457–469. [Google Scholar] [CrossRef]
- Zhao, X.Y.; Ma, F.; Feng, C.J.; Bai, S.W.; Yang, J.X.; Wang, L. Complete Genome Sequence of Arthrobacter Sp. ZXY-2 Associated with Effective Atrazine Degradation and Salt Adaptation. Journal of Biotechnology 2017, 248, 43–47. [Google Scholar] [CrossRef]
- Kitila, K.; Chala, A.; Workina, M. Effect of Gypsum and Compost Application in Reclaiming Sodic Soils at Small Scale Irrigation Farm in Bora District of East Shewa Zone, Oromia, Ethiopia. agw 2020, 08, 28–44. [Google Scholar] [CrossRef]
- Mehdi, S.M. Site-specific phosphorus management with inorganic fertilizer and municipal solid waste compostapplication in salt affected soil. PAKJAS 2018, 55, 103–110. [Google Scholar] [CrossRef]
- Zhu, Y.; Shao, T.Y.; Zhou, Y.J.; Zhang, X.; Gao, X.M.; Long, X.H.; Rengel, Z. Periphyton Improves Soil Conditions and Offers a Suitable Environment for Rice Growth in Coastal Saline Alkali Soil. Land Degrad Dev 2021, 32, 2775–2788. [Google Scholar] [CrossRef]
- Chen, X.D.; Wu, J.G.; Opoku-Kwanowaa, Y. Effects of Returning Granular Corn Straw on Soil Humus Composition and Humic Acid Structure Characteristics in Saline-Alkali Soil. Sustainability 2020, 12, 1005. [Google Scholar] [CrossRef]
- Huang, X.R.; Li, H.; Li, S.; Xiong, H.L.; Jiang, X.J. Role of Cationic Polarization in Humus-Increased Soil Aggregate Stability. Eur. J. Soil Sci. 2016, 67, 341–350. [Google Scholar] [CrossRef]
- Yao, T.X.; Zhang, W.T.; Gulaqa, A.; Cui, Y.F.; Zhou, Y.M.; Weng, W.N.; Wang, X.; Liu, Q.T.; Jin, F. Effects of Peanut Shell Biochar on Soil Nutrients, Soil Enzyme Activity, and Rice Yield in Heavily Saline-Sodic Paddy Field. J Soil Sci Plant Nutr 2021, 21, 655–664. [Google Scholar] [CrossRef]
- Zhao, Y.G.; Li, Y.Y.; Wang, J.; Pang, H.C.; Li, Y. Buried Straw Layer plus Plastic Mulching Reduces Soil Salinity and Increases Sunflower Yield in Saline Soils. Soil and Tillage Research 2016, 155, 363–370. [Google Scholar] [CrossRef]
- Wang, Z.; Sun, Z.J.; El-Sawy, S.; Wang, Z.J.; He, J; Han, L.; Zou, B.T. Effects of Enteromorpha prolifera Biochar and Wood Vinegar Co-application on Takyric Solonetz Improvement and Yield of Oil Sunflower. Environmental science 2021, 42, 6078–6090. [Google Scholar] [CrossRef]
- Ibrahim, M.E.H.; Adam Ali, A.Y.; Elsiddig, A.M.I.; Zhou, G.; Nimir, N.E.A.; Agbna, G.H.D.; Zhu, G. Mitigation Effect of Biochar on Sorghum Seedling Growth under Salinity Stress. PAK.J.BOT. 2021, 53. [Google Scholar] [CrossRef] [PubMed]
- Zhang, P.; Bing, X.; Jiao, L.; Xiao, H.; Li, B.X.; Sun, H.W. Amelioration Effects of Coastal Saline-Alkali Soil by Ball-Milled Red Phosphorus-Loaded Biochar. Chemical Engineering Journal 2022, 431, 133904. [Google Scholar] [CrossRef]
- Peng, Y.Y.; Zhang, H.; Lian, J.S.; Zhang, W.; Li, G.H.; Zhang, J.F. Combined Application of Organic Fertilizer with Microbial Inoculum Improved Aggregate Formation and Salt Leaching in a Secondary Salinized Soil. Plants 2023, 12, 2945. [Google Scholar] [CrossRef] [PubMed]
- Ran, C.; Gao, D.P.; Bai, T.Q.; Geng, Y.Q.; Shao, X.W.; Guo, L.Y. Straw Return Alleviates the Negative Effects of Saline Sodic Stress on Rice by Improving Soil Chemistry and Reducing the Accumulation of Sodium Ions in Rice Leaves. Agriculture, Ecosystems & Environment 2023, 342, 108253. [Google Scholar] [CrossRef]
- Zhou, W.; Jones, D.L.; Hu, R.; Clark, I.M.; Chadwick, D.R. Crop Residue Carbon-to-Nitrogen Ratio Regulates Denitrifier N2O Production Post Flooding. Biol Fertil Soils 2020, 56, 825–838. [Google Scholar] [CrossRef]
- Zhang, Y.F.; Dou, S.; Zhang, D.D.; Ndzelu, B.S.; Ma, R.; Ye, S.F. Study on Degradation Mechanism of Corn Straw by Different Fungi in Non-soil Environment. Appl. Ecol. Env. Res. 2022, 20, 3551–3568. [Google Scholar] [CrossRef]
- Zhu, L.; Jia, X.; Li, M.X.; Wang, Y.; Zhang, J.P.; Hou, J.Q.; Wang, X.L. Associative Effectiveness of Bio-Organic Fertilizer and Soil Conditioners Derived from the Fermentation of Food Waste Applied to Greenhouse Saline Soil in Shan Dong Province, China. Applied Soil Ecology 2021, 167, 104006. [Google Scholar] [CrossRef]
- Lashari, M.S.; Ye, Y.X.; Ji, H.S.; Li, L.Q.; Kibue, G.W.; Lu, H.F.; Zheng, J.F.; Pan, G.X. Biochar-Manure Compost in Conjunction with Pyroligneous Solution Alleviated Salt Stress and Improved Leaf Bioactivity of Maize in a Saline Soil from Central China: A2-Year Field Experiment: Effect of Biochar-Manure Compost on Salt-Stressed Maize. J. Sci. Food Agric. 2015, 95, 1321–1327. [Google Scholar] [CrossRef] [PubMed]
- Zhang, H.; Gao, J.L.; Yu, X.F.; Ma, D.L.; Hu, S.P.; Shen, T.A. Effect of Deep Straw Return under Saline Conditions on Soil Nutrient and Maize Growth in Saline–Alkali Land. Agronomy 2023, 13, 707. [Google Scholar] [CrossRef]
- Freire, M.H.D.C.; Sousa, G.G.D.; Viana, T.V.D.A.; Lessa, C.I.N.; Costa, F.H.R. Soil Chemical Attributes under Combinations of Organic Fertilizing and Water Salinity. Pesqui. Agropecu. Trop. 2023, 53, e75156. [Google Scholar] [CrossRef]
- Farhangi-Abriz, S.; Ghassemi-Golezani, K. Changes in Soil Properties and Salt Tolerance of Safflower in Response to Biochar-Based Metal Oxide Nanocomposites of Magnesium and Manganese. Ecotoxicology and Environmental Safety 2021, 211, 111904. [Google Scholar] [CrossRef]
- Huang, M.Y.; Zhang, Z.Y.; Zhai, Y.M.; Lu, P.R.; Zhu, C. Effect of Straw Biochar on Soil Properties and Wheat Production under Saline Water Irrigation. Agronomy 2019, 9, 457. [Google Scholar] [CrossRef]
- Zhao, W.; Zhou, Q.; Tian, Z.Z.; Cui, Y.T.; Liang, Y.; Wang, H.Y. Apply Biochar to Ameliorate Soda Saline-Alkali Land, Improve Soil Function and Increase Corn Nutrient Availability in the Songnen Plain. Science of The Total Environment 2020, 722, 137428. [Google Scholar] [CrossRef] [PubMed]
- Dang, K.; Ran, C.; Tian, H.; Gao, D.P.; Mu, J.M.; Zhang, Z.Y.; Geng, Y.Q.; Zhang, Q.; Shao, X.W.; Guo, L.Y. Combined Effects of Straw Return with Nitrogen Fertilizer on Leaf Ion Balance, Photosynthetic Capacity, and Rice Yield in Saline-Sodic Paddy Fields. Agronomy 2023, 13, 2274. [Google Scholar] [CrossRef]
- Liu, Z.X.; Liu, J.J.; Yu, Z.H.; Yao, Q.; Li, Y.S.; Liang, A.Z; Zhang, W.; Mi, G.; Jin, J.; Liu, X.B; et al. Long-Term Continuous Cropping of Soybean Is Comparable to Crop Rotation in Mediating Microbial Abundance, Diversity and Community Composition. Soil and Tillage Research 2020, 197, 104503. [Google Scholar] [CrossRef]
- Suleymanov, A.; Gabbasova, I.; Komissarov, M.; Suleymanov, R.; Garipov, T.; Tuktarova, I.; Belan, L. Random Forest Modeling of Soil Properties in Saline Semi-Arid Areas. Agriculture 2023, 13, 976. [Google Scholar] [CrossRef]
- Li, X.T.; Chen, Y.D.; Lv, G.H.; Wang, J.L.; Jiang, L.M.; Wang, H.F.; Yang, X.D. Predicting Spatial Variability of Species Diversity with the Minimum Data Set of Soil Properties in an Arid Desert Riparian Forest. Front. Plant Sci. 2022, 13, 1014643. [Google Scholar] [CrossRef] [PubMed]
- Wu, T.J.; Luo, J.C.; Dong, W.; Sun, Y.W.; Xia, L.G.; Zhang, X.J. Geo-Object-Based Soil Organic Matter Mapping Using Machine Learning Algorithms with Multi-Source Geo-Spatial Data. IEEE J. Sel. Top. Appl. Earth Observations Remote Sensing 2019, 12, 1091–1106. [Google Scholar] [CrossRef]
- Wang, S.J.; Chen, Y.H.; Wang, M.G.; Li, J. Performance Comparison of Machine Learning Algorithms for Estimating the Soil Salinity of Salt-Affected Soil Using Field Spectral Data. Remote Sensing 2019, 11, 2605. [Google Scholar] [CrossRef]
- Andrade Foronda, D.; Colinet, G. Prediction of Soil Salinity/Sodicity and Salt-Affected Soil Classes from Soluble Salt Ions Using Machine Learning Algorithms. Soil Systems 2023, 7, 47. [Google Scholar] [CrossRef]
Figure 1.
Correlation between soil nutrients and soil salt parameters.
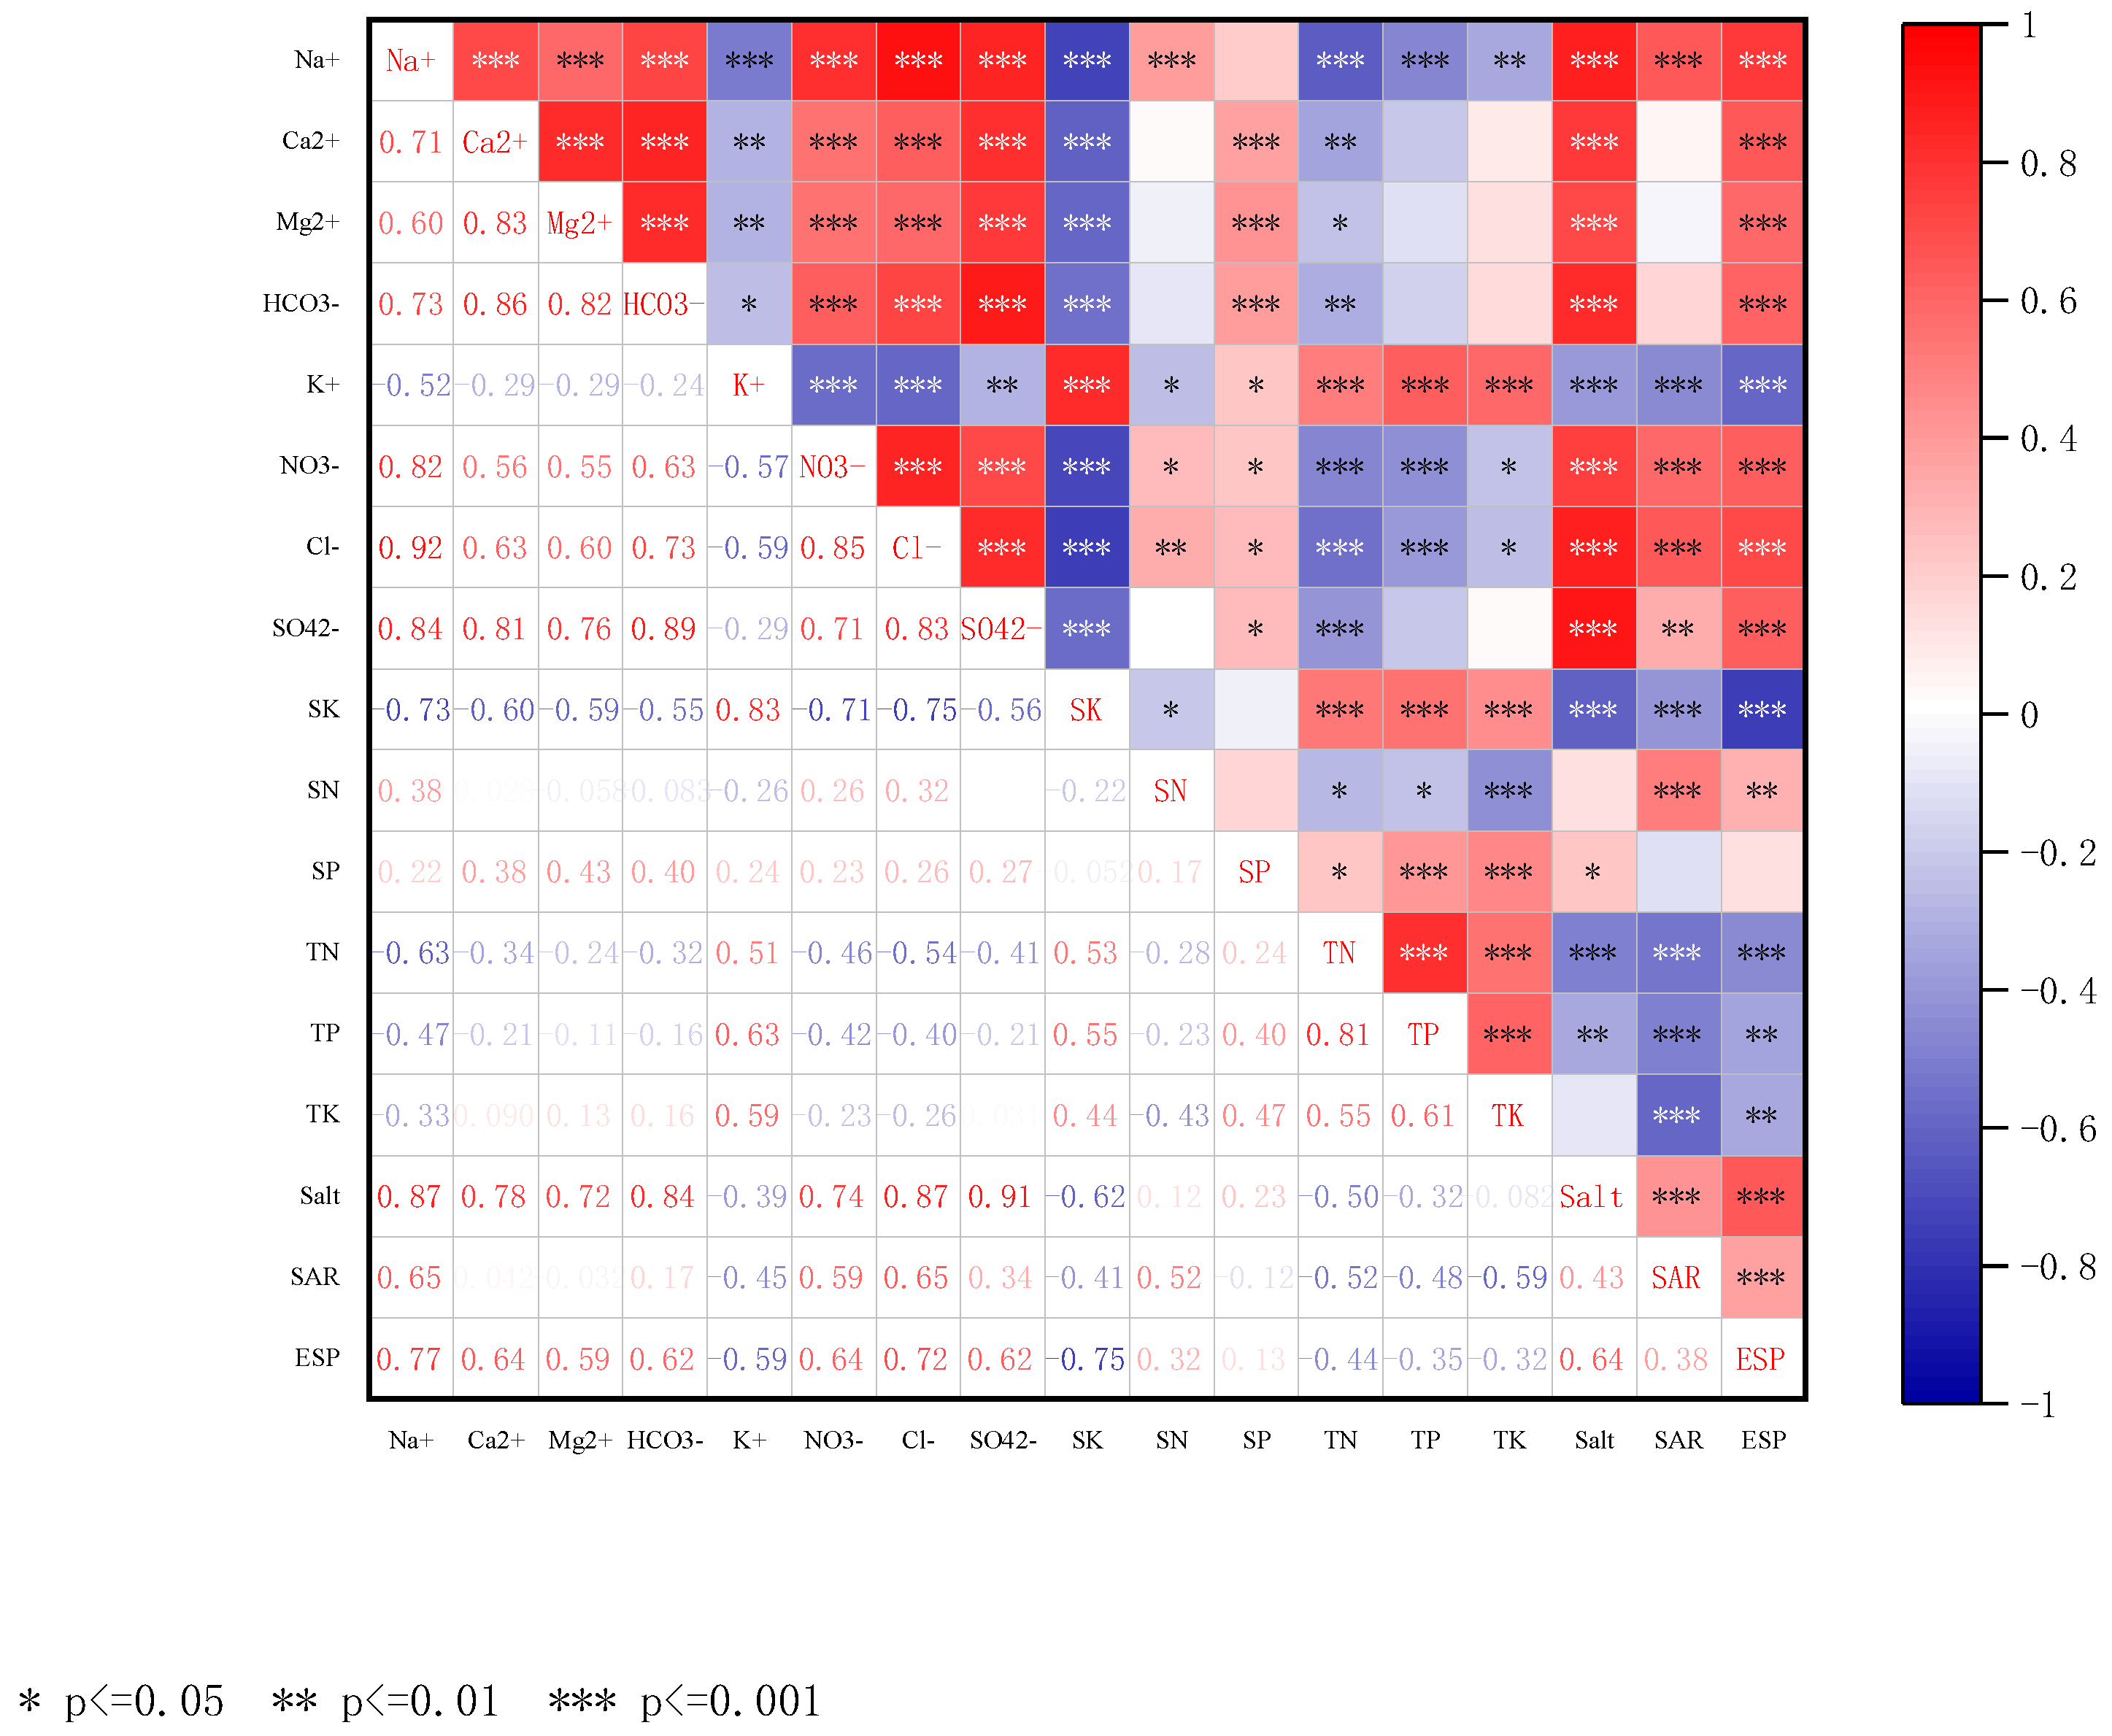
Figure 2.
Relationship between the observed and predicted value tendency in MLR model. a) soil salt; b) soil SAR; c) soil ESP.
Figure 2.
Relationship between the observed and predicted value tendency in MLR model. a) soil salt; b) soil SAR; c) soil ESP.
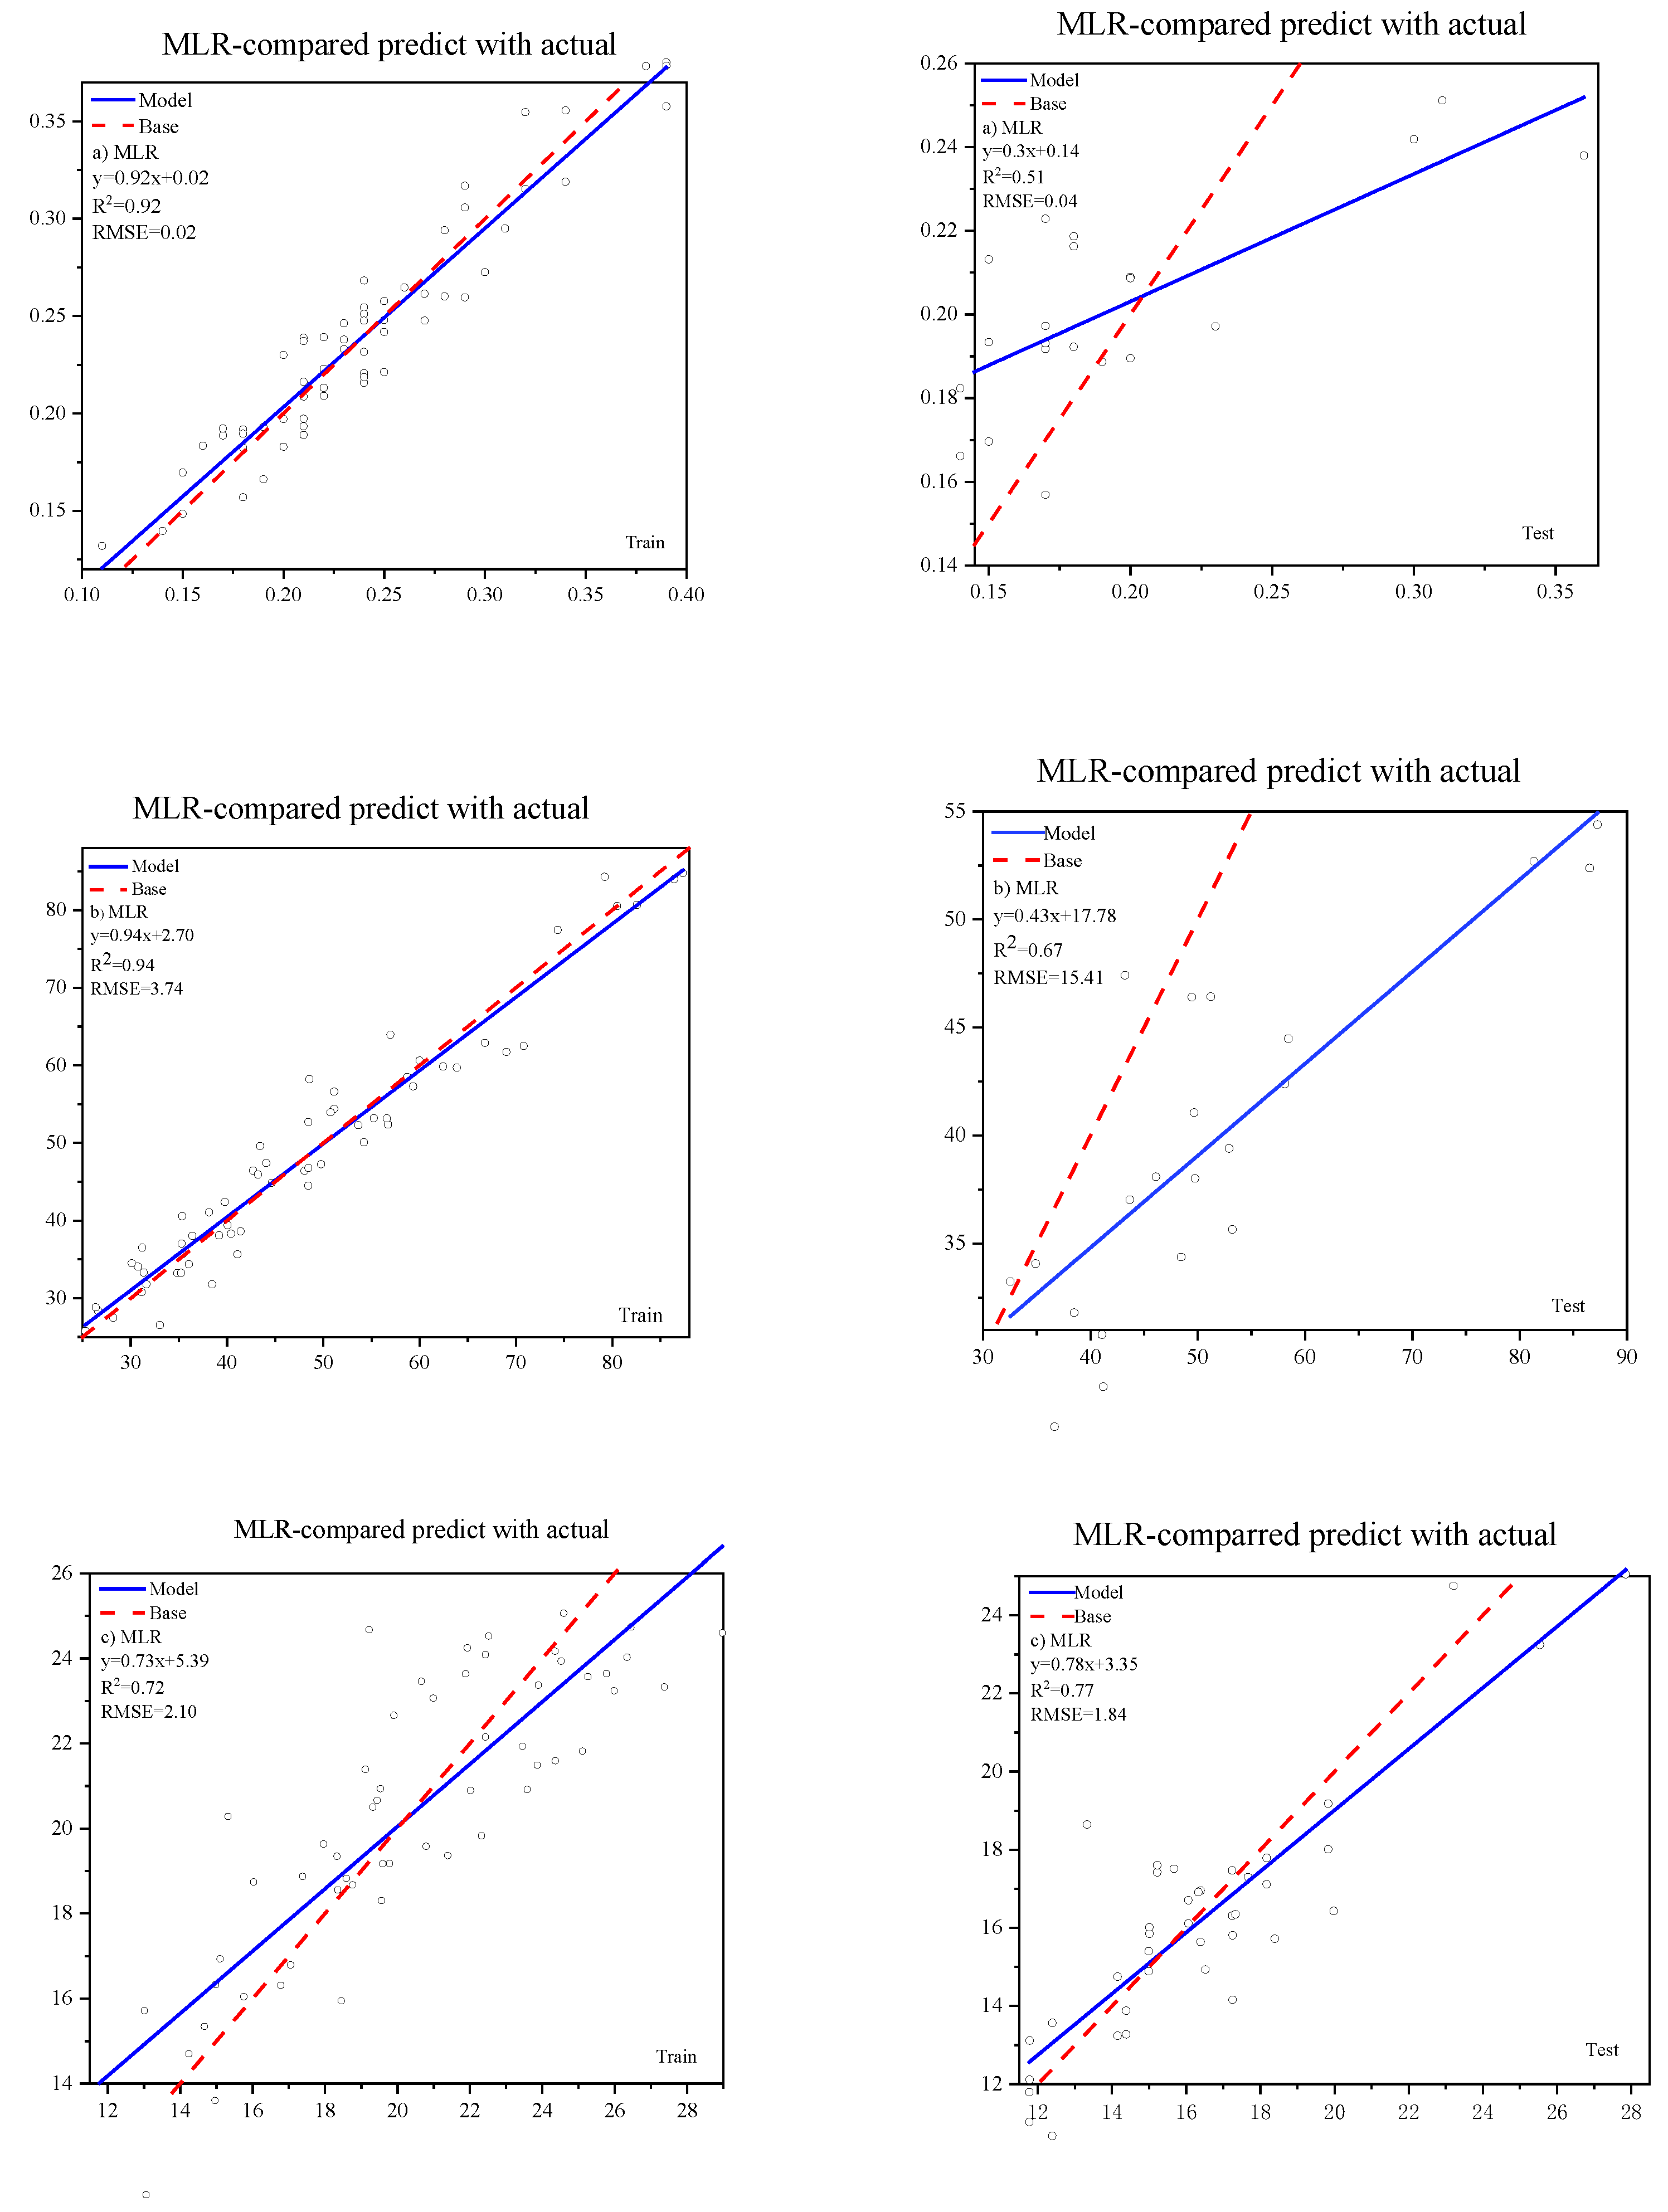
Figure 3.
Relationship between the observed and predicted value tendency RF model. a) soil salt; b) soil SAR; c) soil ESP.
Figure 3.
Relationship between the observed and predicted value tendency RF model. a) soil salt; b) soil SAR; c) soil ESP.
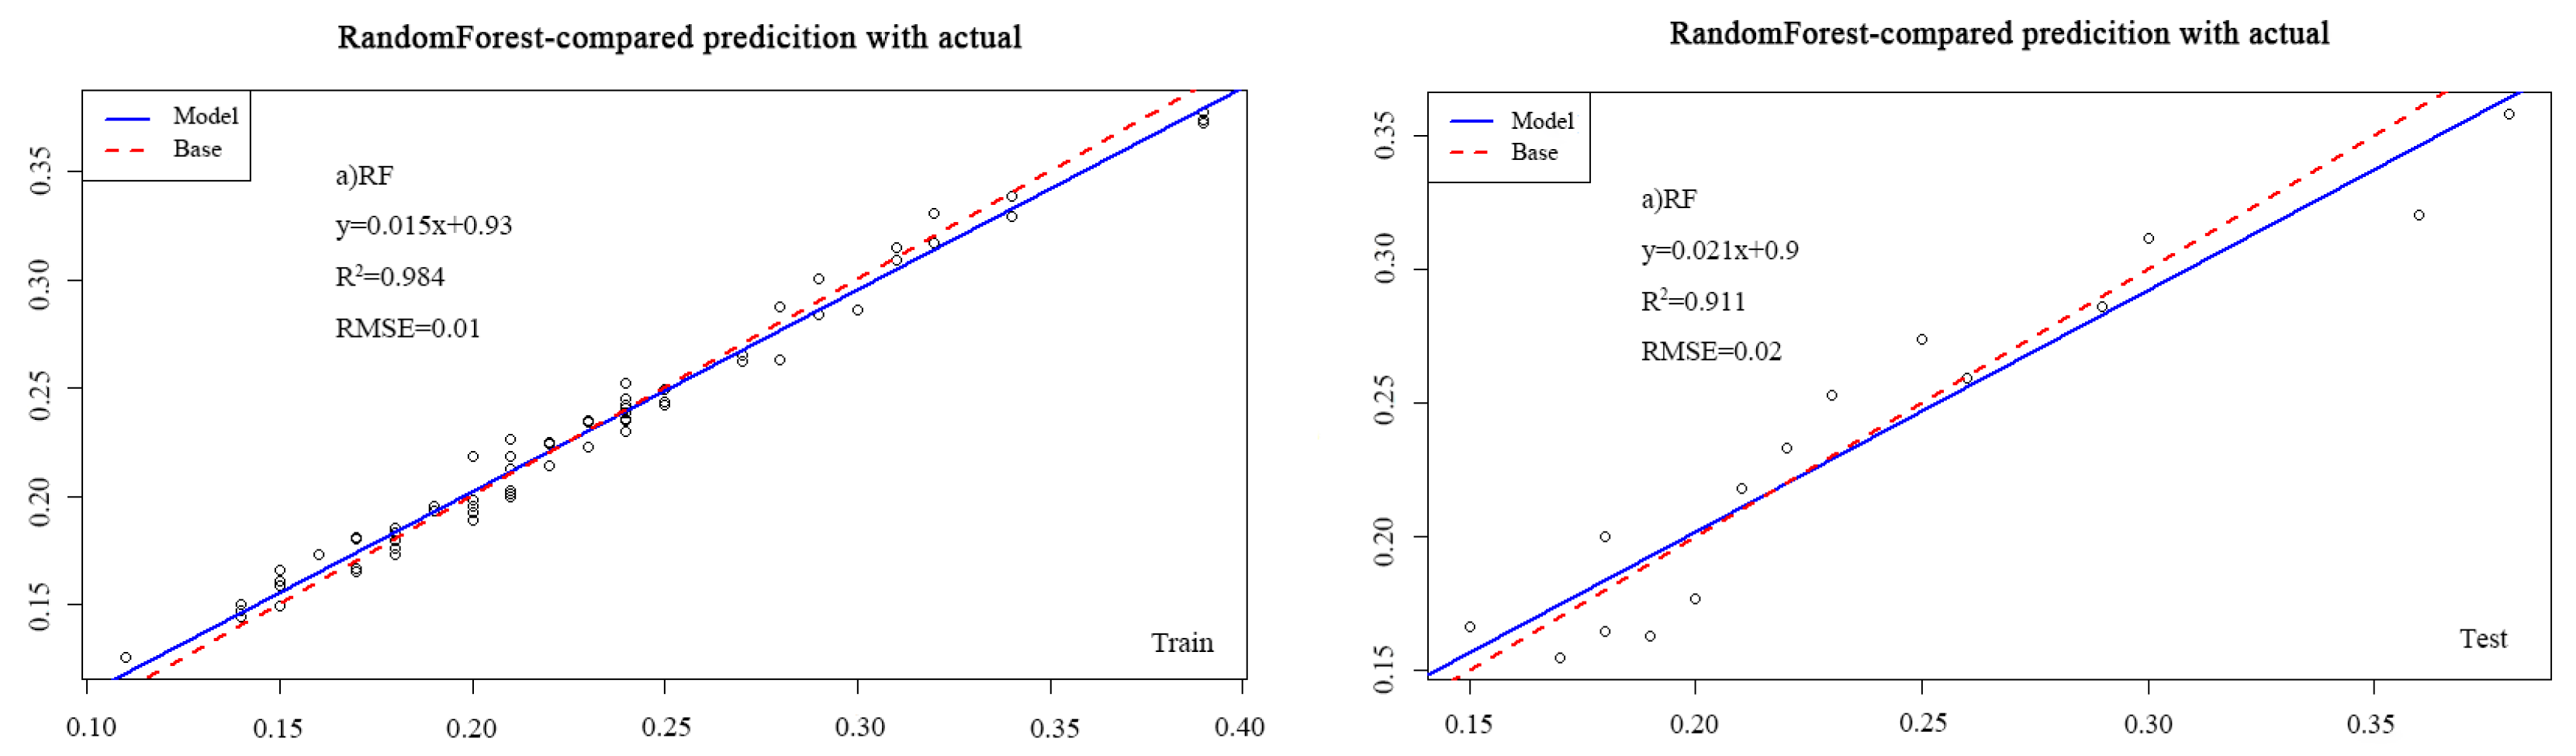
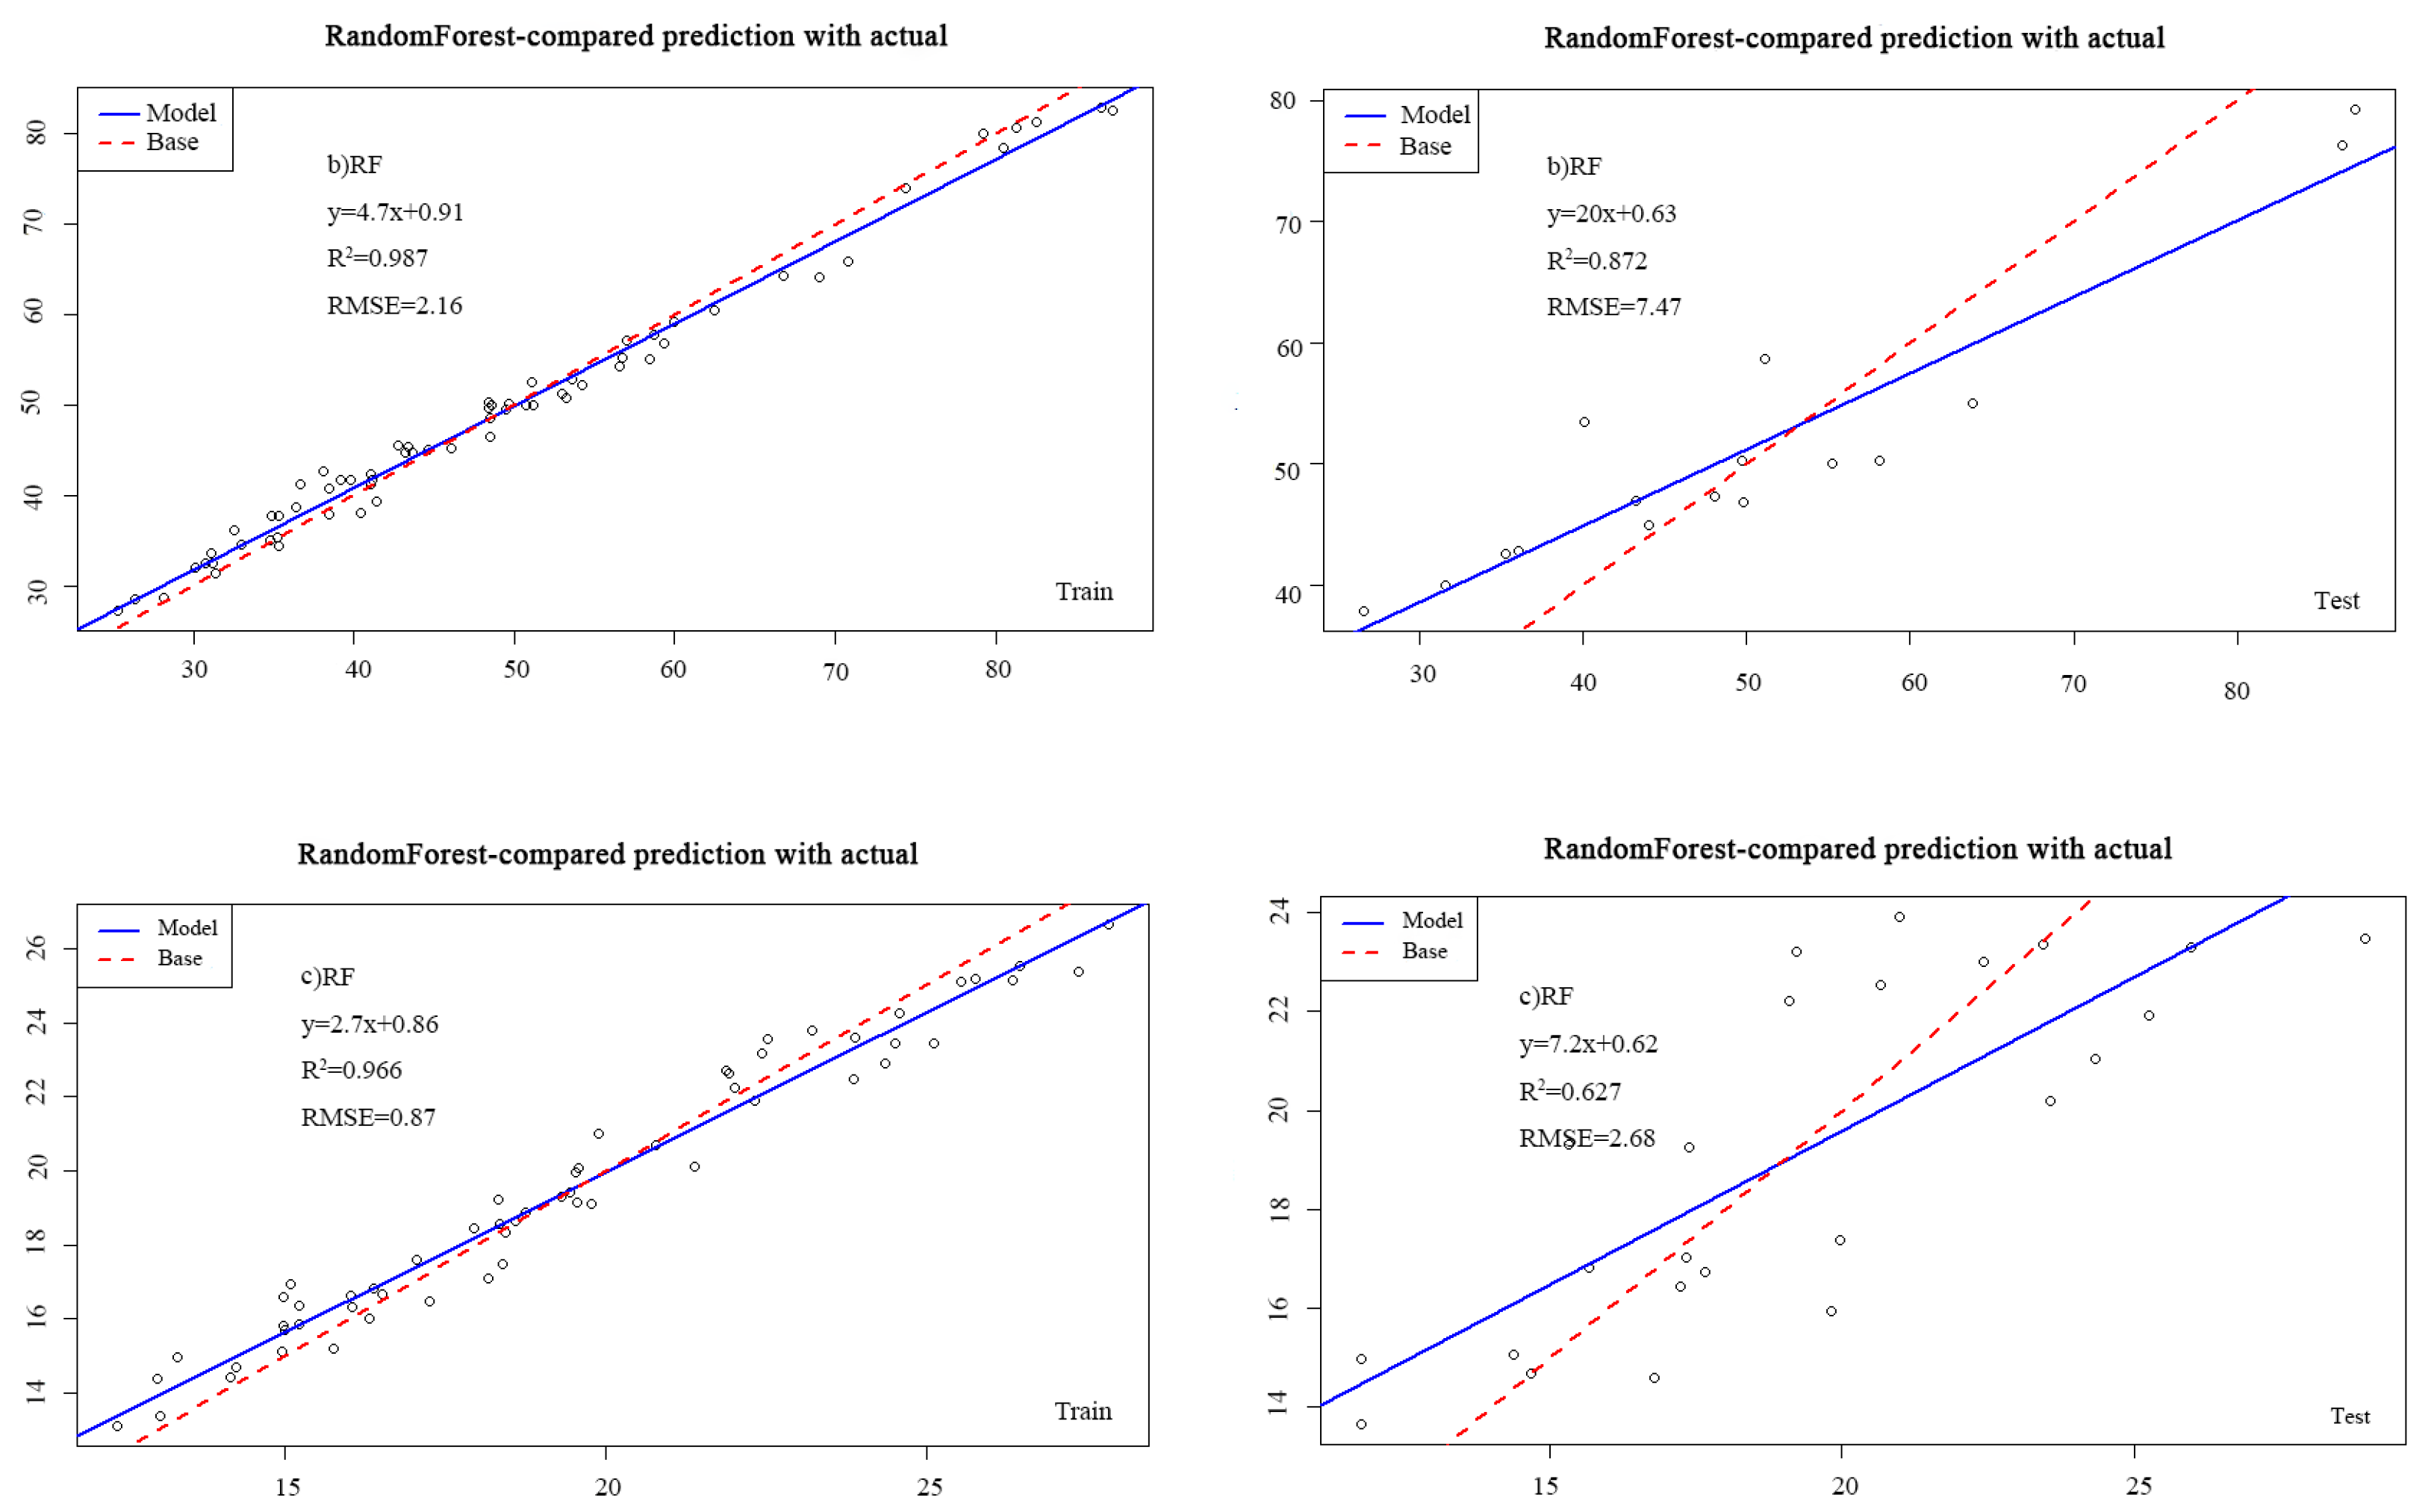

Table 1.
Soil salt parameters in different treatments.
| Salt (g/kg) |
SAR | ESP (%) |
||||||||
|---|---|---|---|---|---|---|---|---|---|---|
| 7d | 30d | 60d | 7d | 30d | 60d | 7d | 30d | 60d | ||
| T1 | 0.26±0.02cd | 0.17±0.02e | 0.13±0.02c | 32.23±2.26ef | 32.63±2.37e | 26.61±1.47f | 20.9±2.63a | 15.74±1.06cd | 12.41±0.65d | |
| T2 | 0.23±0.02d | 0.21±0.01bcde | 0.19±0.03b | 30.42±3.39f | 39.06±3.26de | 34.59±4.21ef | 21.11±2.81a | 14.07±0.99d | 13.44±1.44cd | |
| T3 | 0.23±0.02d | 0.19±0.02de | 0.15±0.02bc | 37.46±3.15def | 49.11±4.82cd | 36.17±4.41def | 23.18±2.07a | 17.55±1.82cd | 15.75±1.3bcd | |
| T4 | 0.23±0.02d | 0.23±0.01bcd | 0.19±0.01b | 38.74±2.04def | 45.47±3.73cd | 38.78±2.28cde | 22.66±3.57a | 16.18±1.97cd | 16.87±1.14bc | |
| T5 | 0.28±0.03bcd | 0.19±0.02cde | 0.16±0.02bc | 43.76±4.44cd | 52.48±3.49c | 48.45±4.78bc | 23.51±2.68a | 19.91±1.34bc | 18.49±1.3b | |
| T6 | 0.26±0.02cd | 0.18±0.02de | 0.17±0.02bc | 43.1±5.17cde | 55.56±4.39bc | 53.6±4.23b | 24.61±2.72a | 21.83±2.31a | 17.94±1.81b | |
| T7 | 0.29±0.02bc | 0.24±0.01bc | 0.16±0.01bc | 52.1±4.22bc | 64.89±5.48b | 46.26±3.12bcd | 22.23±2.23a | 18.7±0.96bc | 16.41±1.23bc | |
| T8 | 0.32±0.03b | 0.25±0.02b | 0.21±0.02b | 57.43±5.76b | 64.26±6.41b | 53.11±4.69b | 22.13±3.08a | 17.1±1.65cd | 14.74±1.24bcd | |
| CK | 0.39±0.01a | 0.35±0.04a | 0.32±0.03a | 80.43±6.05a | 84.57±6.59a | 88.52±6.26a | 25.15±3.58a | 24.91±2.1a | 25.53±2.32a | |
Significant differences among treatments are indicated by different lower-case letters following the mean values (P < 0.05)要附上表中简称的解释,其他表一样的.
Table 2.
Soil total nutrient content in different treatments.
| Total-N (g/kg) |
Total-P (g/kg) |
Total-K (g/kg) |
||||||||
|---|---|---|---|---|---|---|---|---|---|---|
| 7d | 30d | 60d | 7d | 30d | 60d | 7d | 30d | 60d | ||
| TI | 0.19±0.02a | 0.23±0.01a | 0.16±0.01abc | 0.2±0.03a | 0.24±0.02a | 0.18±0.02a | 2.64±0.1a | 2.42±0.22a | 2.08±0.16a | |
| T2 | 0.17±0.02ab | 0.21±0.02ab | 0.15±0.02abcd | 0.19±0.02ab | 0.22±0.02ab | 0.16±0.02ab | 2.42±0.25ab | 2.31±0.36ab | 1.95±0.14ab | |
| T3 | 0.12±0.01cd | 0.15±0.02cd | 0.19±0.02a | 0.09±0.01de | 0.14±0.02e | 0.14±0.01abc | 1.58±0.27cd | 1.86±0.17bc | 1.71±0.16abc | |
| T4 | 0.1±0.01d | 0.13±0.02d | 0.18±0.02ab | 0.1±0.01de | 0.12±0.01ef | 0.13±0.02bc | 1.55±0.22cd | 1.78±0.13c | 1.64±0.11abc | |
| T5 | 0.15±0.01bc | 0.17±0.02cd | 0.14±0.01bcd | 0.16±0.02abc | 0.19±0.02bc | 0.13±0.02bc | 1.7±0.23cd | 1.53±0.11cd | 1.38±0.14cd | |
| T6 | 0.14±0.02bc | 0.18±0.01bc | 0.13±0.02cd | 0.14±0.02bcd | 0.18±0.02cd | 0.12±0.01c | 1.72±0.14cd | 1.48±0.06cd | 1.31±0.13cd | |
| T7 | 0.13±0.01cd | 0.15±0.02cd | 0.12±0.02cd | 0.13±0.03cd | 0.16±0.02de | 0.11±0.02c | 1.88±0.25cd | 1.8±0.16c | 1.55±0.31bcd | |
| T8 | 0.12±0.01cd | 0.15±0.02cd | 0.11±0.02d | 0.12±0.03cde | 0.15±0.02de | 0.1±0.02c | 1.99±0.23bc | 1.72±0.28cd | 1.51±0.27bcd | |
| CK | 0.07±0.01e | 0.08±0.01e | 0.06±0.01e | 0.08±0.01e | 0.09±0.01f | 0.06±0.01d | 1.4±0.12d | 1.24±0.12d | 1.11±0.16d | |
Significant differences among treatments are indicated by different lower-case letters following the mean values (P < 0.05).
Table 3.
Soil available nutrient content in different treatments.
| Available-N (mg/kg) |
Available-P (mg/kg) |
Available-K (mg/kg) |
||||||||
|---|---|---|---|---|---|---|---|---|---|---|
| 7d | 30d | 60d | 7d | 30d | 60d | 7d | 30d | 60d | ||
| TI | 37.33±7.25f | 34.17±6.55e | 39.46±6.35e | 50.32±8.55cde | 43.39±7.5ab | 22.79±4.13a | 280±20a | 373.33±41.63a | 436.67±30.55a | |
| T2 | 41.69±6.37f | 40.83±5.72e | 45.65±8.23de | 55.8±15.11bcd | 36.18±4.94ab | 23.85±3.5a | 216.67±25.17b | 320±26.46ab | 373.33±37.86b | |
| T3 | 75.11±14.85ef | 63.54±11.44de | 85.13±11.25cd | 32.57±8.03def | 52.78±6.64a | 19.73±3.36a | 93.33±5.77de | 206.27±25.17cd | 266.67±15.28cd | |
| T4 | 90.58±16.23de | 60.87±12.36de | 86.18±14.95cd | 26.14±6.41ef | 39.65±4.81ab | 16.93±3.15a | 66.67±11.55e | 193.33±15.28cd | 226.67±23.09d | |
| T5 | 197.41±29.62a | 165.74±26.51a | 136.49±20.59b | 81.31±10.59ab | 31.89±5.01b | 20.56±4.39a | 153.33±15.28bcd | 220±36.06cd | 293.33±25.17cd | |
| T6 | 148.5±17.88bc | 113.58±20.44bc | 190.69±24.93a | 90.08±7.78a | 42.38±5.97ab | 21.77±4.62a | 166.67±20.82bc | 186.67±20.82d | 256.67±15.28cd | |
| T7 | 178.56±24.69ab | 160.11±18.77a | 159.26±25.33ab | 69.7±14.89abc | 50.02±10.99ab | 24.24±4.83a | 216.67±49.33b | 260±30bc | 320±36.06bc | |
| T8 | 126.6±14.32cd | 133.79±20.26ab | 90.6±16.64c | 74.55±14.39abc | 46.59±8.33ab | 27.42±5.59a | 196.67±35.12bc | 233.33±15.28cd | 293.33±32.15cd | |
| CK | 102.39±16.39de | 86.51±14.71cd | 54.63±7.66cde | 19.54±3.85f | 12.07±2.31c | 6.69±1.56b | 143.33±15.28cd | 76.67±11.55e | 93.33±15.28e | |
Significant differences among treatments are indicated by different lower-case letters following the mean values (P < 0.05).
Table 4.
Analysis of the soil cation contents under different treatments.
| Na+(mg/kg) | Mg2+(mg/kg) | Ca2+(mg/kg) | K+(mg/kg) | |||||||||||
|---|---|---|---|---|---|---|---|---|---|---|---|---|---|---|
| 7d | 30d | 60d | 7d | 30d | 60d | 7d | 30d | 60d | 7d | 30d | 60d | |||
| TI | 380.75±12.16f | 212.85±8.7f | 134.76±12.43g | 31.61±3.88a | 21.91±3.63abc | 17.74±1.88cde | 247.85±10.17a | 62.43±6.89f | 34.03±6.1e | 224.71±5.77a | 278.51±14.33a | 267.51±10.65a | ||
| T2 | 358.21±8.73f | 292.07±9.62e | 241.18±15.18ef | 33.53±4.69a | 27.85±2.69ab | 23.04±2.41ab | 237.18±9.28ab | 83.69±9.01cde | 74.81±5.05bc | 197.91±8.59b | 252.48±8.4a | 283.61±11.4a | ||
| T3 | 438.4±15.4e | 328.21±10.25d | 227.85±10.77f | 37.62±5.64a | 19.92±1.79bc | 16.13±1.97de | 240.18±12.48ab | 67.01±5.01ef | 61.1±5.49cd | 91.69±11.52ef | 97.69±7.64cd | 115.74±13.73de | ||
| T4 | 459.74±10.24e | 343.43±13.8de | 266.51±8.97de | 35.43±4.55a | 25.03±3.43abc | 21.93±1.83bc | 249.18±10.2a | 88.36±7.59bcd | 72.14±5.06bcd | 67.01±5.35g | 83.03±9.97de | 97.69±5.54e | ||
| T5 | 517.22±9.83d | 357.75±14.21cd | 298.08±16.92cd | 44.09±6.78a | 20.9±2.63bc | 14.49±1.24ef | 233.85±7.74ab | 72.14±5.46def | 57.76±4.62d | 97.69±7.64f | 114.48±15.42c | 134.76±12.43cd | ||
| T6 | 492.4±13.68d | 375.48±10.96c | 325.76±20.93c | 41.55±5.54a | 22.83±3.8abc | 11.28±1.27f | 227.7±5.44ab | 68.01±3.66ef | 60.76±5.69cd | 114.48±18.6de | 122.82±18.03c | 146.51±10.12bc | ||
| T7 | 595.66±14.93c | 492.4±9.45b | 302.21±12.93cd | 39.23±4.56a | 17.85±1.8c | 15.41±1.18def | 217.75±5.42bc | 98.69±4.22bc | 68.01±4.57bcd | 127.68±7.51cd | 166.58±10.91b | 158.35±15.53bc | ||
| T8 | 632.38±14.77b | 511.55±10.26b | 376.76±11.69b | 37.64±5.58a | 21.1±2.79bc | 19.69±1.52bcd | 198.58±9.63c | 104.48±9.37b | 79.48±5.35b | 148.52±8.25c | 155.19±9.25b | 174.35±12.69b | ||
| CK | 816.02±9.43a | 799.34±20.87a | 786.37±19.55a | 34.71±4.21a | 29.58±3.51a | 26.85±2.03a | 169.25±6.63d | 148.52±8.25a | 134.35±10.38a | 77.14±3.97fg | 62.43±6.89e | 55.76±4.89f | ||
Significant differences among treatments are indicated by different lower-case letters following the mean values (P < 0.05).
Table 5.
Soil anion content under different treatments.
| Cl-(mg/kg) | SO42-(mg/kg) | NO3-(mg/kg) | HCO3-(mg/kg) | ||||||||||||
|---|---|---|---|---|---|---|---|---|---|---|---|---|---|---|---|
| 7d | 30d | 60d | 7d | 30d | 60d | 7d | 30d | 60d | 7d | 30d | 60d | ||||
| TI | 513.69±9.7f | 324.43±11.92g | 287.73±11.09d | 495.69±12.51cd | 316.55±10.67d | 305.88±10.49c | 48.42±4.73c | 34.89±4.12d | 22.45±2.85e | 217.34±13.42a | 95.03±6.75e | 78.31±6.79cd | |||
| T2 | 465.4±10.37g | 419.76±12.28f | 379.15±9.03c | 439.69±9.59fg | 415.02±8.14b | 353.1±10.81b | 46.08±5.16c | 37.59±4.73cd | 31.59±3.16de | 199.68±25.35ab | 147.18±14.24b | 102.48±11.39b | |||
| T3 | 474.4±8.17g | 534.33±11.4d | 372.74±13.79c | 423.02±14.56fg | 314.88±20.62d | 297.4±9.16c | 46.76±2.04c | 47.83±5.82bc | 43.78±5.72bc | 171.25±12.54abc | 113.07±10.83cde | 66.68±5.92d | |||
| T4 | 543.07±12.04e | 594.37±13.21c | 398.47±11.98bc | 417.69±11.91g | 382.48±14.17c | 305.86±12.42c | 52.41±3.5bc | 53.23±3.93b | 42.78±5.93bc | 139.85±21.22c | 136.19±12.85bc | 87.91±8.73bcd | |||
| T5 | 643.22±8.13d | 521.04±11.3de | 413.88±13.84b | 479.74±7.18de | 343.43±13.8d | 279.07±9.18cd | 48.43±5.46c | 49.91±4.42bc | 29.85±2.58de | 153.01±12.13bc | 93.69±9.01e | 86.14±6.03bcd | |||
| T6 | 664.71±9.84d | 501.02±13.3e | 396.71±13.04bc | 452.4±11.76ef | 311.69±15.05d | 298.07±5.58c | 59.43±3.82abc | 51.83±4.44b | 34.59±4.79cd | 173.1±18.82abc | 98.69±4.22e | 87.47±4.25bcd | |||
| T7 | 715.26±8.84c | 636.38±14.37b | 366.76±11.02c | 513.22±12.79c | 424.4±10.18b | 267.18±11.79d | 57.43±5.76bc | 49.55±4.96bc | 36.26±3.12cd | 198.34±20.39ab | 108.41±6.95de | 81.47±6.35bcd | |||
| T8 | 745.61±8.33b | 608.38±13.6bc | 416.76±15.6b | 543.66±13.63b | 445.4±12.49b | 333.88±10.3b | 64.1±7.17ab | 57.17±6.37ab | 47.78±3.82ab | 208.17±16.91a | 128.47±10.97bcd | 98.47±8.98bc | |||
| CK | 872.37±9.89a | 814.71±16.1a | 783.13±14.49a | 592.38±12.83a | 574.22±11.47a | 523.22±9.7a | 71.76±6.55a | 68.57±6.34a | 54.85±3.34a | 214.5±15.3a | 179.01±10.64a | 155.35±12.29a | |||
Significant differences among treatments are indicated by different lower-case letters following the mean values (P < 0.05).
Disclaimer/Publisher’s Note: The statements, opinions and data contained in all publications are solely those of the individual author(s) and contributor(s) and not of MDPI and/or the editor(s). MDPI and/or the editor(s) disclaim responsibility for any injury to people or property resulting from any ideas, methods, instructions or products referred to in the content. |
© 2024 by the authors. Licensee MDPI, Basel, Switzerland. This article is an open access article distributed under the terms and conditions of the Creative Commons Attribution (CC BY) license (http://creativecommons.org/licenses/by/4.0/).
Copyright: This open access article is published under a Creative Commons CC BY 4.0 license, which permit the free download, distribution, and reuse, provided that the author and preprint are cited in any reuse.