

Submitted:
23 April 2024
Posted:
24 April 2024
You are already at the latest version
Abstract
Refractive index measurements have been an important task for a long time because that index plays an essential role in describing the optical properties of a material. Many methods have been developed to perform that task. Some of them use interferometry to achieve high precision, however these configurations are complicated. Some measure the critical angle using simple structures, but the accuracy is not satisfactory because it is difficult to judge the exact critical angle with intensity variations. Here we propose several new schemes based on measuring the polarization change in the total internal reflection. The proposed method has the merits of simple structure and easy incident angle determination that gives the maximum phase change. Additionally, it is possible to find the material dispersion by measuring the wavelength dependence of the polarization ellipticity. Some useful formulas relating the refractive index with the maximum phase change are obtained. This work can provide valuable alternatives for index measurement.
Keywords:
refractive index measurement
; total internal reflection
; polarization change
; material dispersion
1. Introduction
Refractive indexing is one of the most important characteristic parameters of optical materials, especially for transparent ones. It is defined as the ratio of the velocity of light in a vacuum and in the material. Many methods based on various principles [1] have been proposed to measure the refractive index of a material or liquid, such as prism coupling [2], interferometry [3], ellipsometry [4], Brewster angle [5], and holography [6]. One method uses the total internal reflection (TIR) to achieve that measurement goal. Usually there are two categories utilizing TIR. The first measures the critical angle of a material by detecting the reflection or refraction intensity variation across the critical angle [7-9]. The refractive index can then be calculated via the relationship between the critical angle and the refractive index. Some useful refractometers such as the Pulfich type utilize this principle [10]. The advantages of the -measurement method are the following: simple structure, low cost, and easy handling. However, its disadvantages lie mainly in the time-consumption and lower precision because it take times to scan the incident angle. The reflected light intensity variation across the critical angles is difficult to judge precisely [8]. The second method measures the phase shift carried by the reflected beam after TIR, and for that purpose a phase meter [11] or an interferometer [12] are needed. Contrary to the -measurement method, the advantages of the -measurement method are high-precision and time-saving because angle-scanning is not needed. Usually these configurations are more complicated or require sophisticated skills to perform the task. Of course, the cost is generally higher.
In this work we propose several different approaches to measure the refractive index based on measuring the TIR polarization changes. The first method derives the analytical equation between the refractive index and the incident angle to give the maximum phase change. Once that angle is measured by varying the incident angle experimentally, the refractive index can be calculated. The second method measures the polarization ellipticity for any incident angle. The refractive index can then be obtained using the relationship derived between them. Finally a new way to measure the material dispersion is also suggested. The details and merits of these schemes will be stated in the next section.
The structure of the work is as follows. Section 1 is the introduction. Section 2 includes 4 subsections. The first reviews a conventional scheme that is a good contrast for the second method provided by us. The third and the forth subsections suggest two other configurations with different merits. Conclusions and discussion are presented in Section 3.
2. Theory and Numerical Results
As mentioned in the introduction, there are many different ways to determine the refraction index of a transparent material. Here we review a famous historic method [13] because it is a good contrast with our method.
2.1. Method by Measuring Minium Angular Deviation of a Prism
Figure 1a. shows a typical dispersing prism with an apex angle and refractive index n1 (at a specified wavelength of the incident light). A paralell light beam is incident from the left with an inciedent angle at the first interface of the prism. It leaves the second interface with an angle, which is deviated from its original incident direction with a angular deviation . The symbols and indicate the refraction angle and the incident angle for the first and second refraction of the two interfaces, respectively. From the geometry of the prism triangle, we have
Using some algebra and manipulation, we find that the angular deviation can be written as a function of and only. When reaches its minimum , the ray traverses the prism symmetrically, that is, parallel to its base (). Under that situation, we have
where m in the subscript indicates the minimum value for minimum , as shown in Figure 1(b).
Appling Snell’s law at the first refraction and assuming the medium around the prism is air or vacuum with refractive index = 1.0, the prism’s refractive indexis
Thus, by varying to find and knowing , the refractive index of the prism can be determined. Figure 1b shows the angular deviation versus the incident for the case of = 600 and n = 1.5; the minimum is 37.20 at the incident angle = 48.60.
2.2. Method Measuring the Maximum Phase Change in TIR
Now we consider another schme proposed by us to measure the refractive index. Figue 2 illustrates a situation that a light beam is incident into a transparent semi-circle cylinder (or a semi-sphere) with refractive index n1 and that of the surrounding medium is with . It is well known that when the incident angle is larger than the critical angle , the total internal reflection (TIR) occurs. As TIR exists, the light beam reflects back into the same material without refracting into the medium. Here the semi-circle shape is chosen for convenience of discussion. The TIR on the top interface without considering the refraction at the boundaries of the material (i.e. when the light wave goes in and leaves the material). It is further assumed that some anti-reflection coating is applied to the boundaries (except the top surface), thus all of the incident power aimed at the center of the semi-circle with angle is reflected and leaves the material with the same angle without taking the Fresnel loss at the boundaries into account. We also know that under TIR, the reflected light wave will gain different phase change for different polarizations as follows [10]
where and are the phase changes for p and s polarizations, respectively and is the refractive index ratio of and , which is less than 1. Figure 2(b) shows (blue line) and(red line) versus for the case of and (n = 2/3) with the critical angle . The phase changes start from zero at and increase monotonically to 1800 when reaches 900, and is larger than in the whole interval. Because the phase differences exist for the two polarizations, there is a polarization change if the incident wave polarization is not parallel with one of the polarizations. For example, as shown in Figure 3(a), if an incident wave is linearly polarized 450 with respect to the x axis, its polarization state will be an elliptical polarization after the TIR. The ellipticity depends on the incident angle and refractive index ratio . This feature is used as a quarter wave plate that transforms a linear polarization into a circular polarization, called a Fresnel rhomb [10]. It’s advantage over the traditional birefringent wave plate, is that it is much less wavelength sensitive. The phase difference is defined as and it can be written as
Figure 3(b) shows for the case of n = 2/3 ( and ). Note that at the two incident angles 50.230 or 53.260, reaches 450; thus after two TAR reflections, the total phase change accumulated is 900 (i.e. quarter wave), which is the Fresnel rhomb principle. It is also interesting to find that there is a maximum for the ; in this case it is for , where the (M) in the subscript indicates maximum. By differentiating the right side of Equation (6) with respected to and setting it to zero to find , we can have
Equation (7) is of value because it gives analytical results for and . It is intersiting to compare Figure 3(b) with Figure 1(b), where both have extreme incident angle values for giving minimum deviation angle or maximum phase change. It is natural to expect this property can be used to measure a unknown refractive index as in the prism case. Since the phase change leads to polarization state change, we need to modify the configuration properly to detect it. Considering Figure 4(a), without ploting the hemi-circle boundary, there are two polarizers are added outside the material and the Jones matrixes [14] are empolyed to analyzed the polarization change. As shown in the figure, the light wave is incident along z direction. There are two polarizers P1 and P2 which make the angle and respect to their local x coordinate respectively. The Jones matrix’s indicated in the bottom of the figure for P1, TIR, and P2 are , , and ,respectively. Since we need to polarize the light beam at to gain , we can assume, without losing generality, the Jones vector of the incident light field is , a unit vector also polarized at and the T in the superscript is a transport operation. Using the cascade matrixes manipulation, the output field is
Finally we can get the output intensity as follows
It is noted that when of P2 is at the angle of 450 or 1350, the output intensities are, denoted as or , respectively
Taking measurement as an example, if we keep increasing the incident angle from , and detect the intensity , it reaches its maximum when , as seen from Figure 3(b) and Equation (10). This behavior is shown in Figure 5.
Consequently, by varying the incident angle, the maximum of can be reached to determine , and the right half of the Equation (7) can be used to calculate n as
Since is the refractive index ratio, we need to know the of the surrounding medium. If we take for air, the material’s refractive index is . Comparing with the scheme that determines the refractive index by finding the critical angle, which is not easy to determine exactly. This method works well by finding , which should be easier to determine more precisely because this angle is usually not close to the critical angle.
2.3. Method for Measuring Ellipticity of TIR (without Scanning the Incident Angle)
In last section we successfully find the refractive index by looking for the incident angle that gives maximum phase change in TIR. This is similar to the method in section 2.1 that looks for the incident angle that gives the minimum deviation angle. In this section we would like to introdue another possibility in which no incident angle scanning is necessary. This method may be considered an advanced or improved version. This scheme can be seen by examining Equation (6), giving that phase change only depends on the incident angle and the index ratio. Thus it is possible to find if can be find for a given without using a phase meter or an interferometer. Let us show how it proceeds.
As shown in Figure 4 and Equation (10), this configuration can be used to measure and by simply rotating the of P2 to 45 and 135 degrees, respectively. Note that by taking the square root of the ratio / and using Equation (6), we have
where is the ellipticity of the polarization ellipse shown in Figure 3(a). The ellipticity is defined as the ratio of short axis to the long axis of the polarization ellipse of the field, which is the ratio of field amplitude taken at 135 and 45 degrees, respectively. After finding at any selected incident angle , the refractive index ratio, from Equation (12) is obtained as
Thus, the material refractive index can be determined. The advantage of this method is that we do not need to vary the incident angle to find n. However, it is suggested to select the incident angle carefully to have a larger value (i.e. bigger ) , in order to increase the signal intensity or S/N ratio.
2.4. Dispersion Measurement with Polychromatic Light
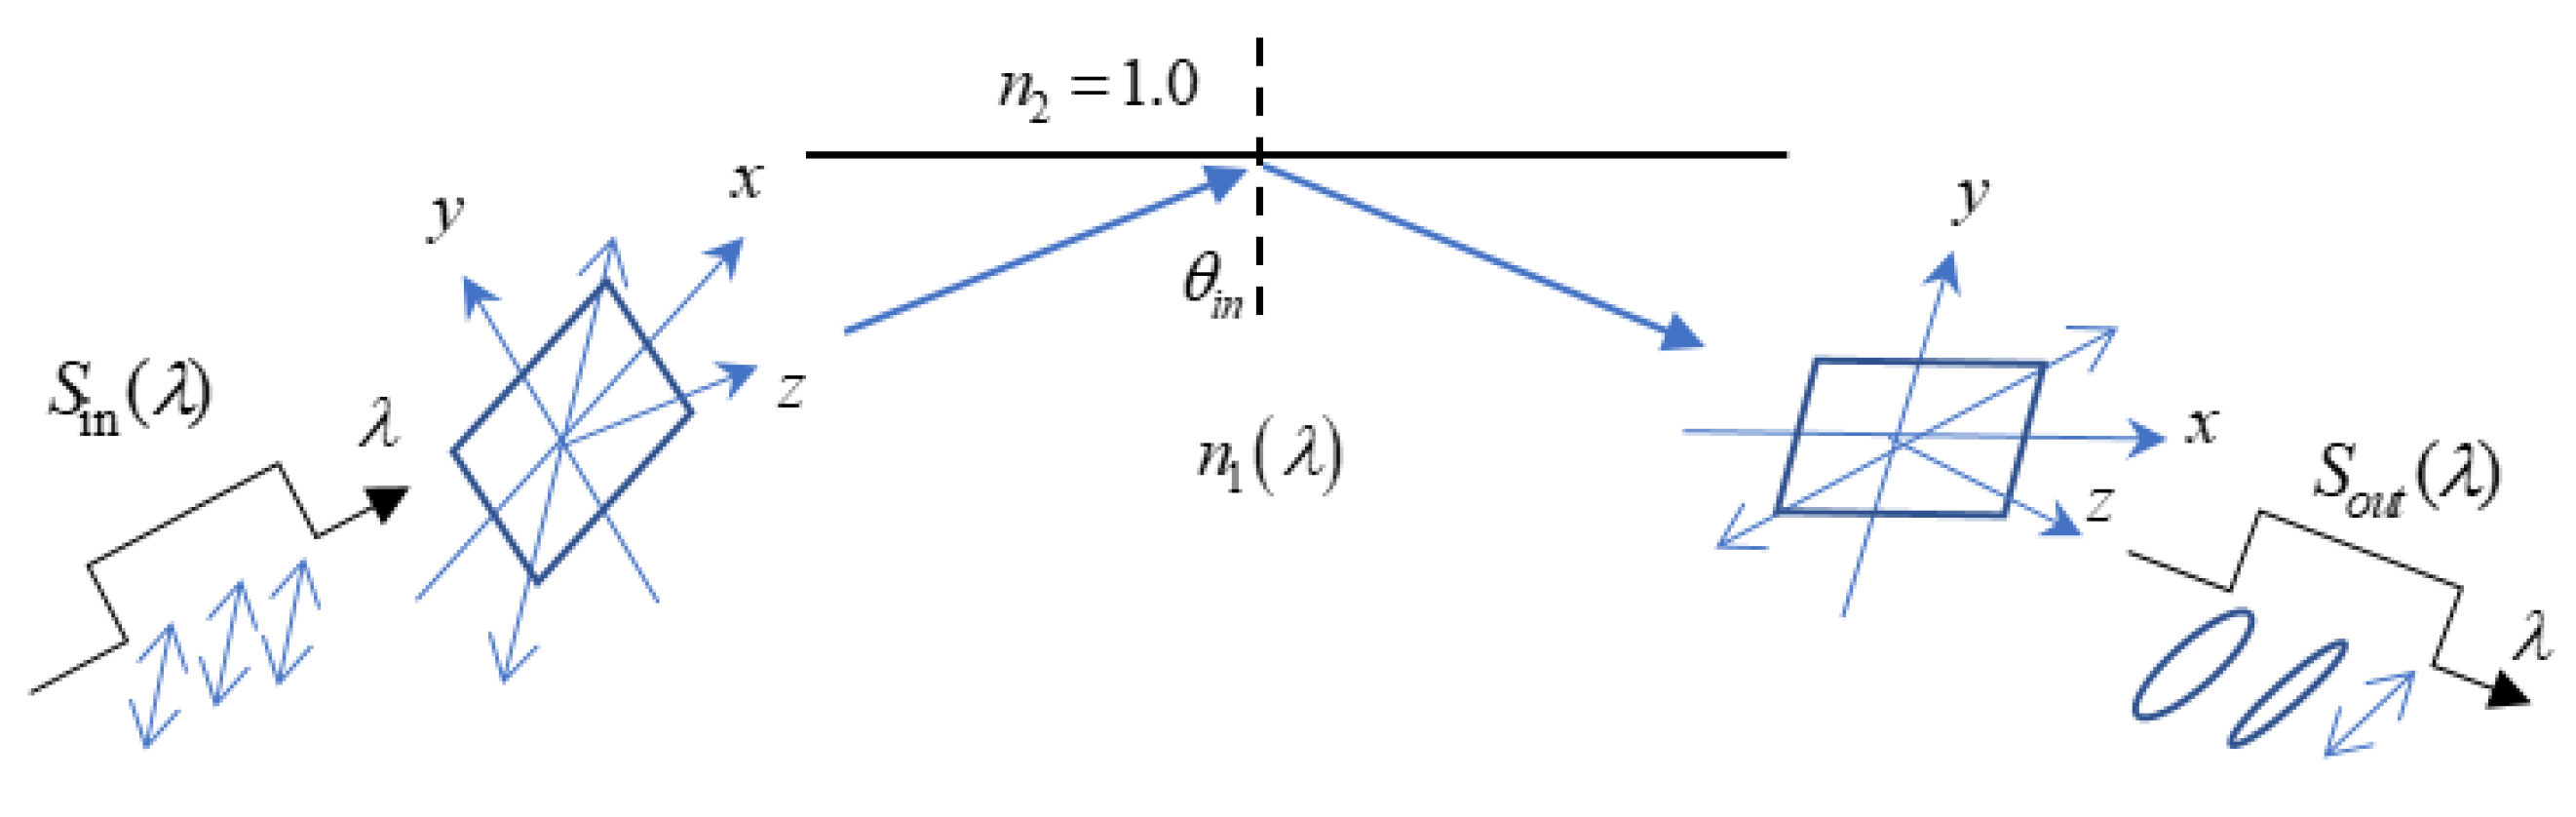
In the last section we present a scheme getting the refractive index by finding ellipticity of the polarization. Here we would like to show how to use this feature to obtain the dispersion of the material by employing a polychromatic source [15]. It is known that material dispersion is a protery such that the refractive index depends on the wavelength of the incident light wave, i.e. refractive index is actualy a function of wavelengthe , written as from now on. Considering that we can prepare an incident flat-top spectrumin the dispersion interval of interest from to , as shown in Figure 6. As illustrated in Figure 7, it is incident into a material with and with ; thus the index ratio is . Initially this spectrum is polarized at 450 as in last section; however, because of the material dispersion, each wavelength component experiences different amount of the polarization change. Consequently, the output spectrum has different ellipticity of polarization ellipse for different wavelengths, as shown in the right of the figure. Similarly as done in last section, this time a spectrometer is utilized to detect by setting the polarization angle of P2 to 45 and 135 degree, and they are denoted as and respectively. The ellipticity dependence of , as seen in Equation (12), is the square root of the ratio of, that is
Consequently, as in Equation (13), the dispersion of the material is
3. Conclusions and Discussion
Several original schemes were proposed to measure the refractive index n of a material based on the TIR. After reviewing the traditional prism method by looking for the minimum-deviation incident angle, our first scheme illustrated how n can be determined by measuring the maximum-phase-change angle. This can be achieved because a valuable relationship between the incident angle and n is established when the maximum-phase-change occurs. Compared to the prism method, the advantage of the proposed method is that the apex angle is not needed. The second method we suggested determines the refractive index by measuring the TIR polarization ellipticity at an arbitrary incident angle. The merit of this method is that it can save time because the incident angle does not need to be scanned. Another advantage is that since the ellipticity comes from the intensity ratio at two different output polarization angles. We do not need to worry about the absolute value of the intensity, which may be affected by some factors such as the partial reflection at the material boundaries or the absorption of the polarizers. The third method determines the material dispersion with a polychromatic light by measuring the polarization ellipticity wavelength dependence. This is a simple way to obtain the material dispersion information. Although incident angle scanning is not required, it is still suggested to select it close to the in order to have a larger ellipticity value.
Finally we may say something about the accuracy or the precision of above mention schemes. Our methods depend on how accurately or precisely the angle or a specified angle can be measured; thus the uncertainty comes mainly from the precision of the rotation stage varying or selecting the incident angle. The second uncertainty may come from the precision of the detector or the sensor used that judges if the the maximum of is reached in the first method. In the second method it is the accuracy of the polarization ellipticity (i.e. the intensity values of and ) affecting that of the index measurement. In the third scheme, a spectrometer is utilized measuring the spectrum to infer the dispersion message; thus the accuracy of the spectrometer should be taken into account. To sum up, this work introduced some advantageous schemes to measure the refractive index or material dispersion, which should be of interests to the related fields.
Author Contributions
Conceptualization, J.-P.C. and P.H.; methodology, C.-M.T.; validation, J.-H.W.; data curation, C.-M.T.; writing—original draft preparation, J.-P.C.; writing—review and editing, P.H.; andfunding acquisition P.H.
Funding
This work was supported by the Ministry of Science and Technology (MOST) of Taiwan under contract number MOST 111-2221-E-005-033-MY2.
Acknowledgments
The authors are grateful for all the support and discussion from Prof. Silvano and Prof. Merlo in University of Pavia. Also we would like to express our thanks for the support from National Chung Hsing University.
Conflicts of Interest
The authors declare no conflicts of interest.
References
- Singh, S. Refractive index measurement and its applications. Phys. Scr. 2002, 65, 167–180. [Google Scholar] [CrossRef]
- Cardin, J. and Leduc, D. Determination of refractive index, thickness, and the optical losses of thin films from prism-film coupling measurements. Appl. Opt. 2008, 47, 894–900.
- Choi, H.J.; Lim, H.H.; Moon, H.S.; Eom, T.B.; Ju, J.J.; Cha, M. Measurement of refractive index and thickness of transparent plate by dual-wavelength interference. Opt. Express 2010, 18, 9429–9434. [Google Scholar] [CrossRef] [PubMed]
- Pedinoff, M.E.; Braunstein, M.; Stafsudd, O.M. Refractive indices of ir materials: 10.6-_m ellipsometer measurements. Appl. Opt. 1977, 16, 2849–2856.
- Hu, Y.; Lv, J.; Hao, Q. Refractive Index Measurement of Glass with Arbitrary Shape Based on Brewster’s Law and a Focusing Probe Beam. Sensors 2021, 21, 2421. [Google Scholar] [CrossRef] [PubMed]
- Ash, W. M. ans Kim, M. K. Digital holography of total internal reflection. Opt. Express 2008, 16, 9811–9820. [Google Scholar]
- Keuren, E.R.V. Refractive index measurement using total internal reflection. Am. J. Phys. 2005, 73, 611–614. [Google Scholar] [CrossRef]
- Calhoun, W.R.; Maeta, H.; Roy, S.; Bali, L.M.; Bali, S. Sensitive real-time measurement of the refractive index and attenuation coefficient of milk and milk-cream mixtures. J. Dairy Sci. 2010, 93, 3497–3504. [Google Scholar] [CrossRef] [PubMed]
- Li, H. and Xie, S. Measurement method of the refractive index of biotissue by total internal reflection. Appl. Opt. 1996, 35, 1793–1795. [Google Scholar] [PubMed]
- Iizuka, K. Elements of Photonics, Wiley, 2002, v1. p. 164, 137, 138.
- Chiu, M.H.; Lee, J.Y.; Su, D.C. Refractive-index measurement based on the effects of total internal reflection and the uses of heterodyne interferometry. Appl. Opt. 1997, 36, 2936–2939. [Google Scholar] [CrossRef] [PubMed]
- Zhou, Y.; Zou, H.; Zhong, L.; Li, J.; Li, B.; Tian, J.; Lu, X. Dynamic refractive index distribution measurement of dynamic process by combining dual-channel simultaneous phaseshifting interferometry and total internal reflection. Scientific Reports, 2018, 8:15231.
- Hecht, E. Optics, 4th ed. Addison Wesley, 2002, p. 188.
- Teich, M. and Saleh, B. Fundamentals of Photonics, 2nd ed. Wiley, 2007, p. 203.
- Han, P. “Spatial–Spectral Correspondence Relationship for Mono—Poly chromatic Light Diffraction,” in Progress in Optics, T.D. Visser, Ed.; Elsevier: Amsterdam, The Netherlands, 2018 Volume 63, pp. 33–87.
Figure 1.
(a) Schematic and notations for a prism scheme. (b) Angular deviation versus the incident
for the case of α= 600 and n1 = 1.5.
Figure 1.
(a) Schematic and notations for a prism scheme. (b) Angular deviation versus the incident
for the case of α= 600 and n1 = 1.5.
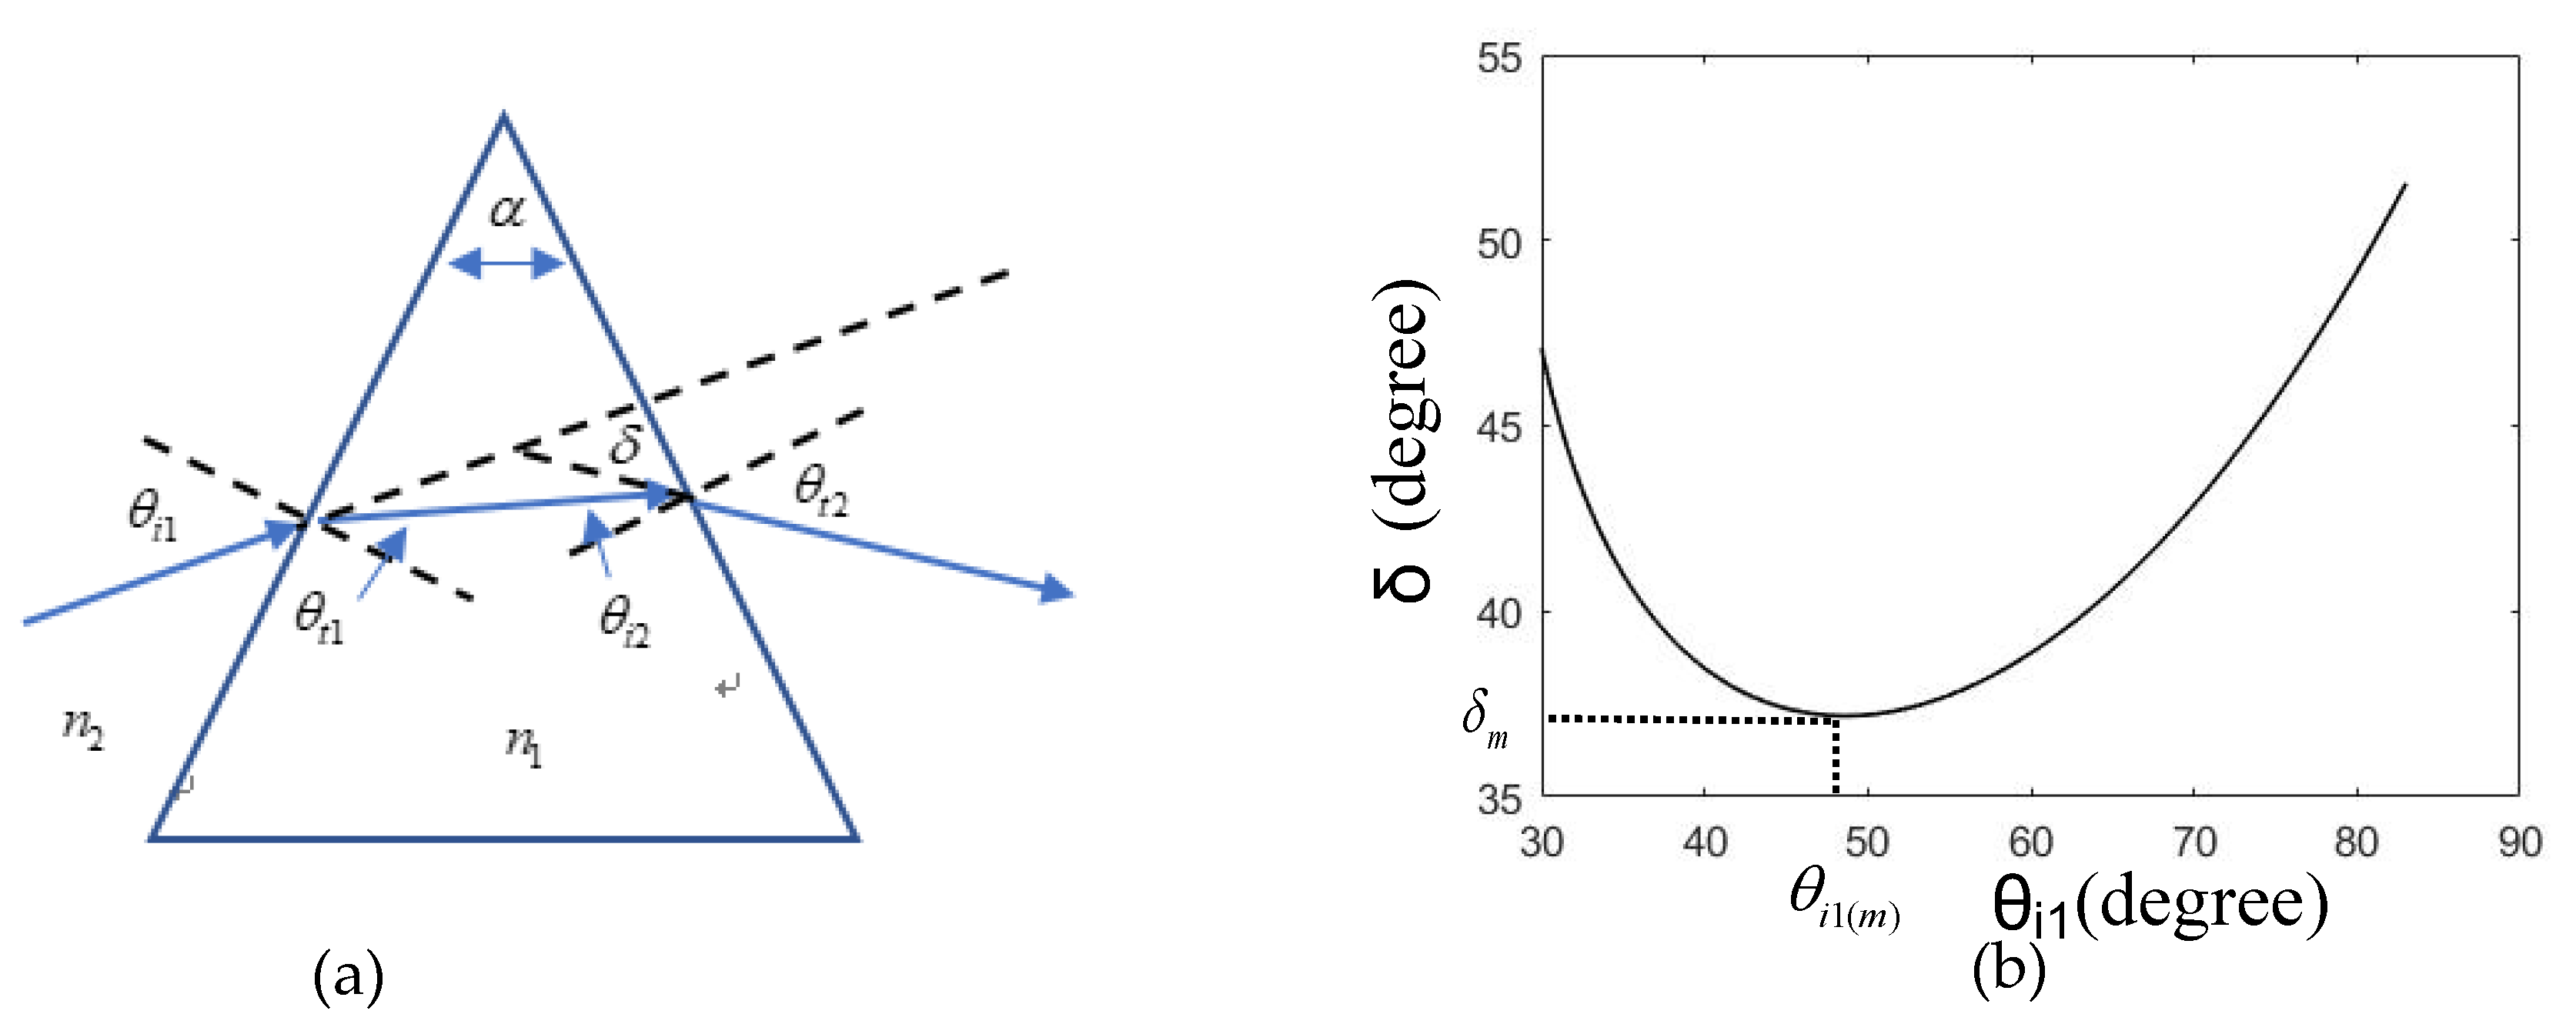
Figure 2.
(a) Schematic and notations for a transparent semi-circle cylinder with TIR. (b) Plot for phase
vs. incident angle for the two polarizations under TIR.
Figure 2.
(a) Schematic and notations for a transparent semi-circle cylinder with TIR. (b) Plot for phase
vs. incident angle for the two polarizations under TIR.
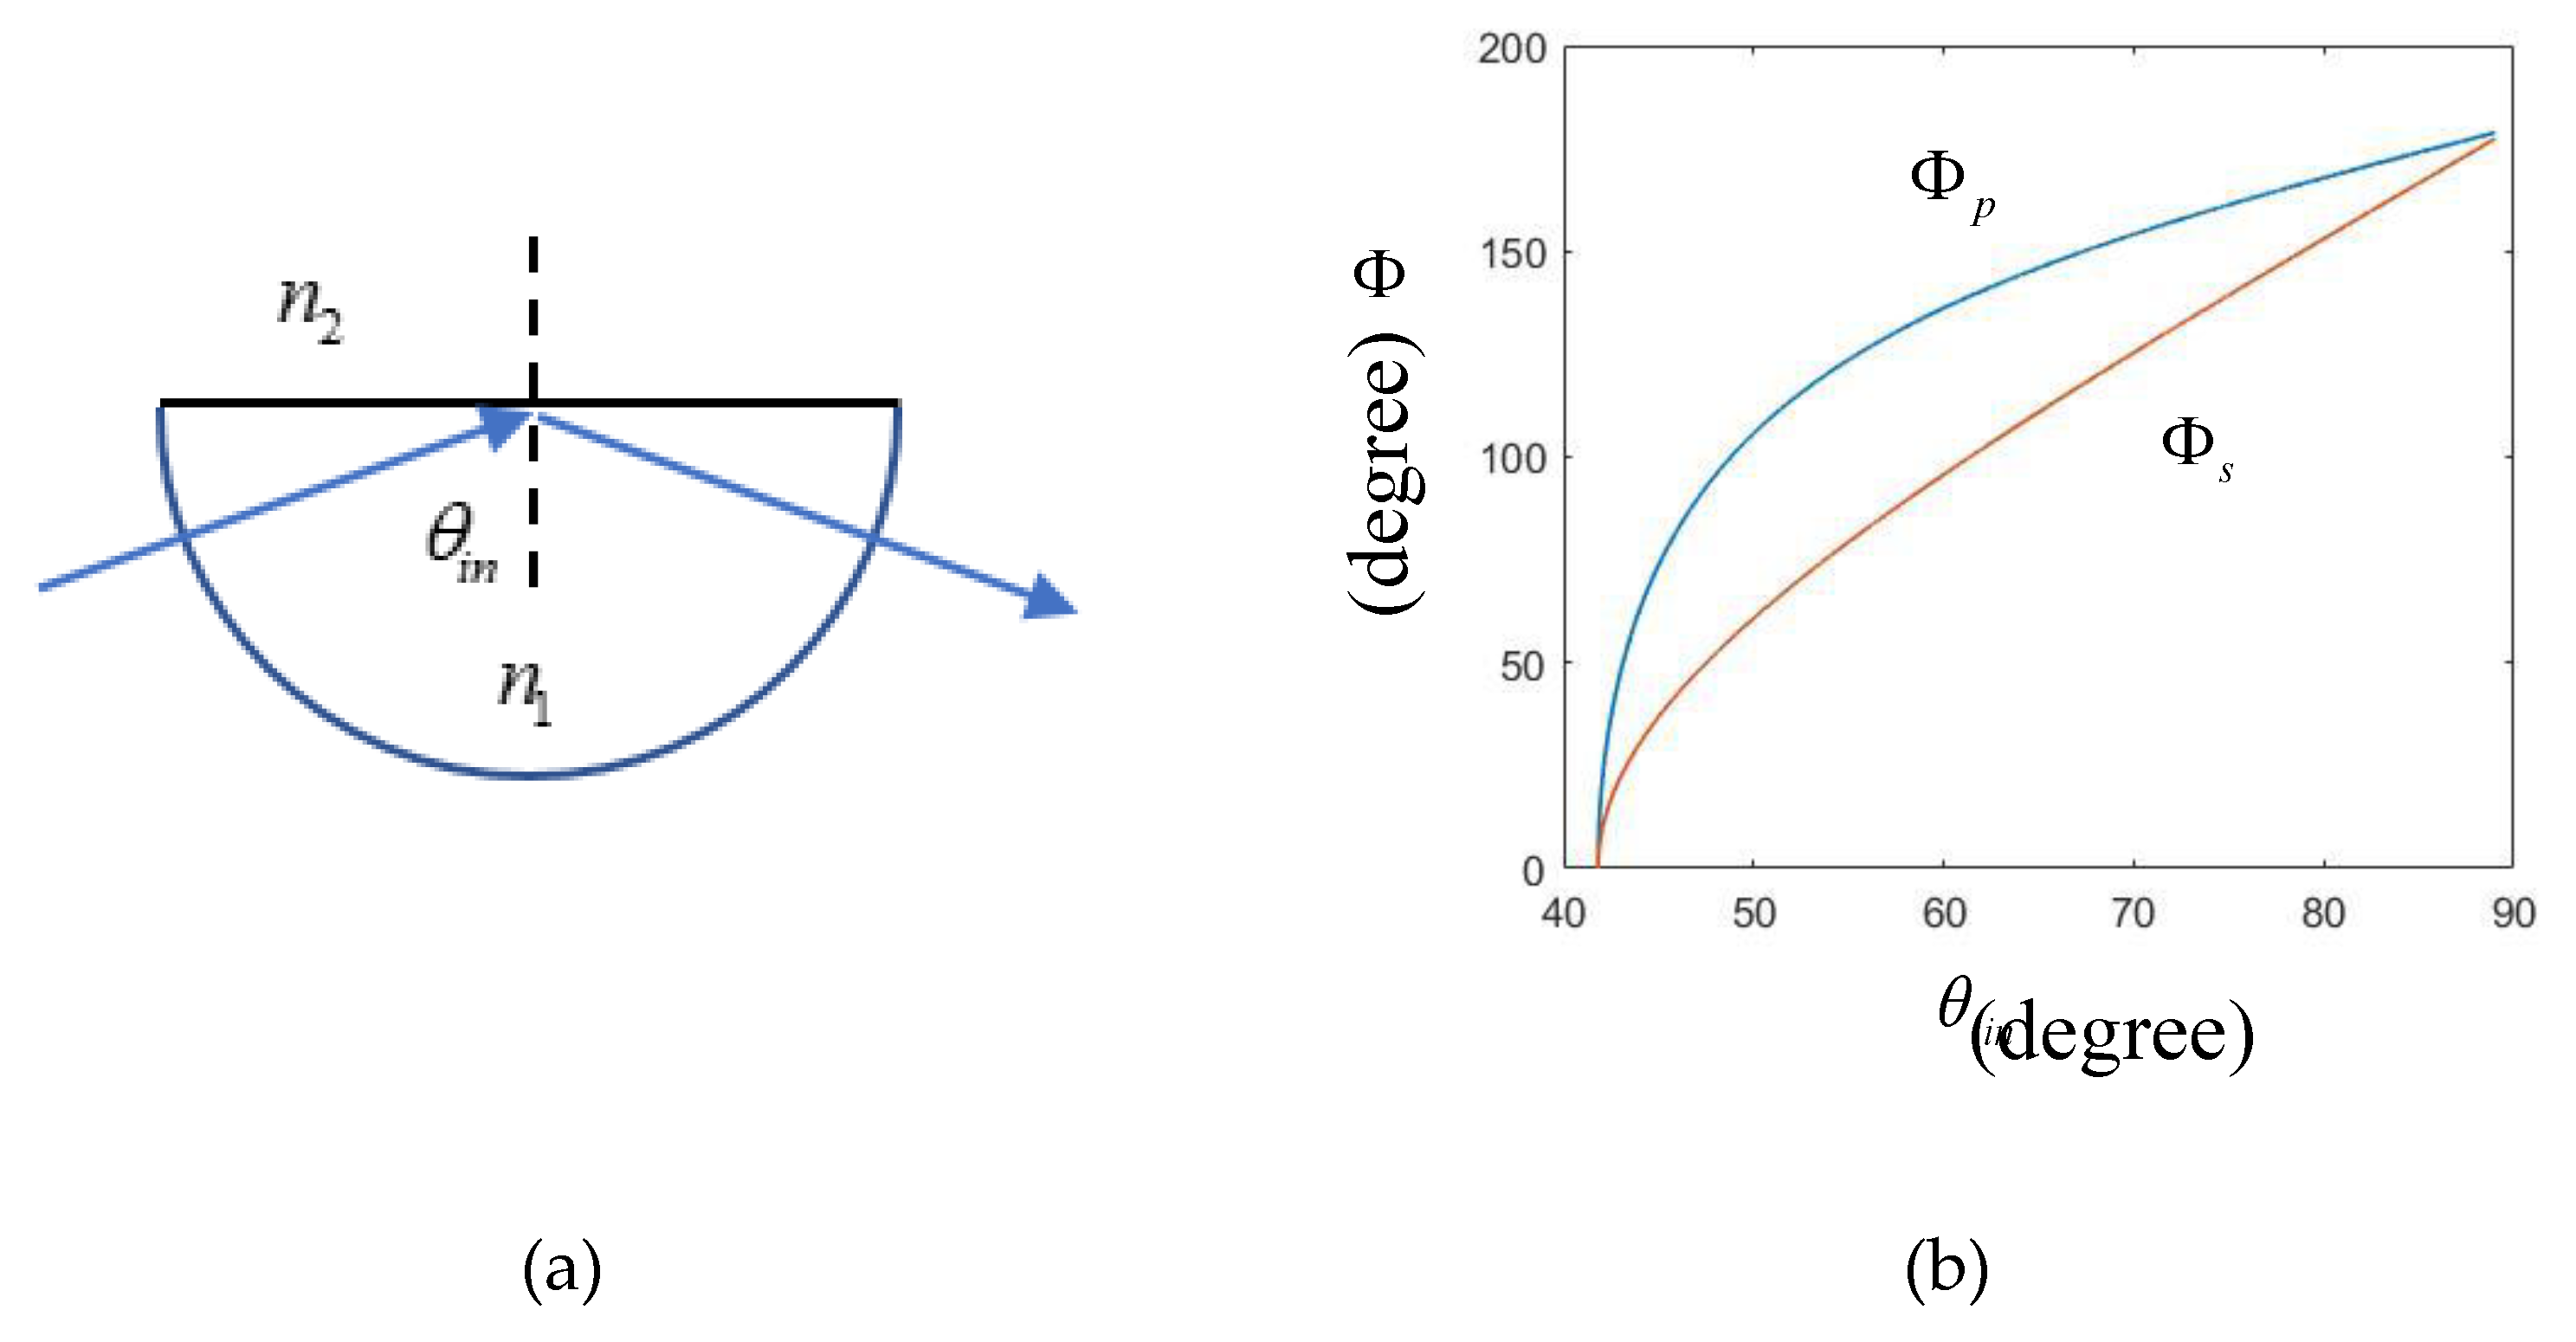
Figure 3.
(a) Schematic for the polarization state change, from a linear one to an ellipitical one, after
TIR. (b) Plot for phase difference vs. incident angle under TIR. The wave is propogating along z
direction, and y and x are the parallel (p-polarization) and vertical (s-polarization) directions
respectively.
Figure 3.
(a) Schematic for the polarization state change, from a linear one to an ellipitical one, after
TIR. (b) Plot for phase difference vs. incident angle under TIR. The wave is propogating along z
direction, and y and x are the parallel (p-polarization) and vertical (s-polarization) directions
respectively.
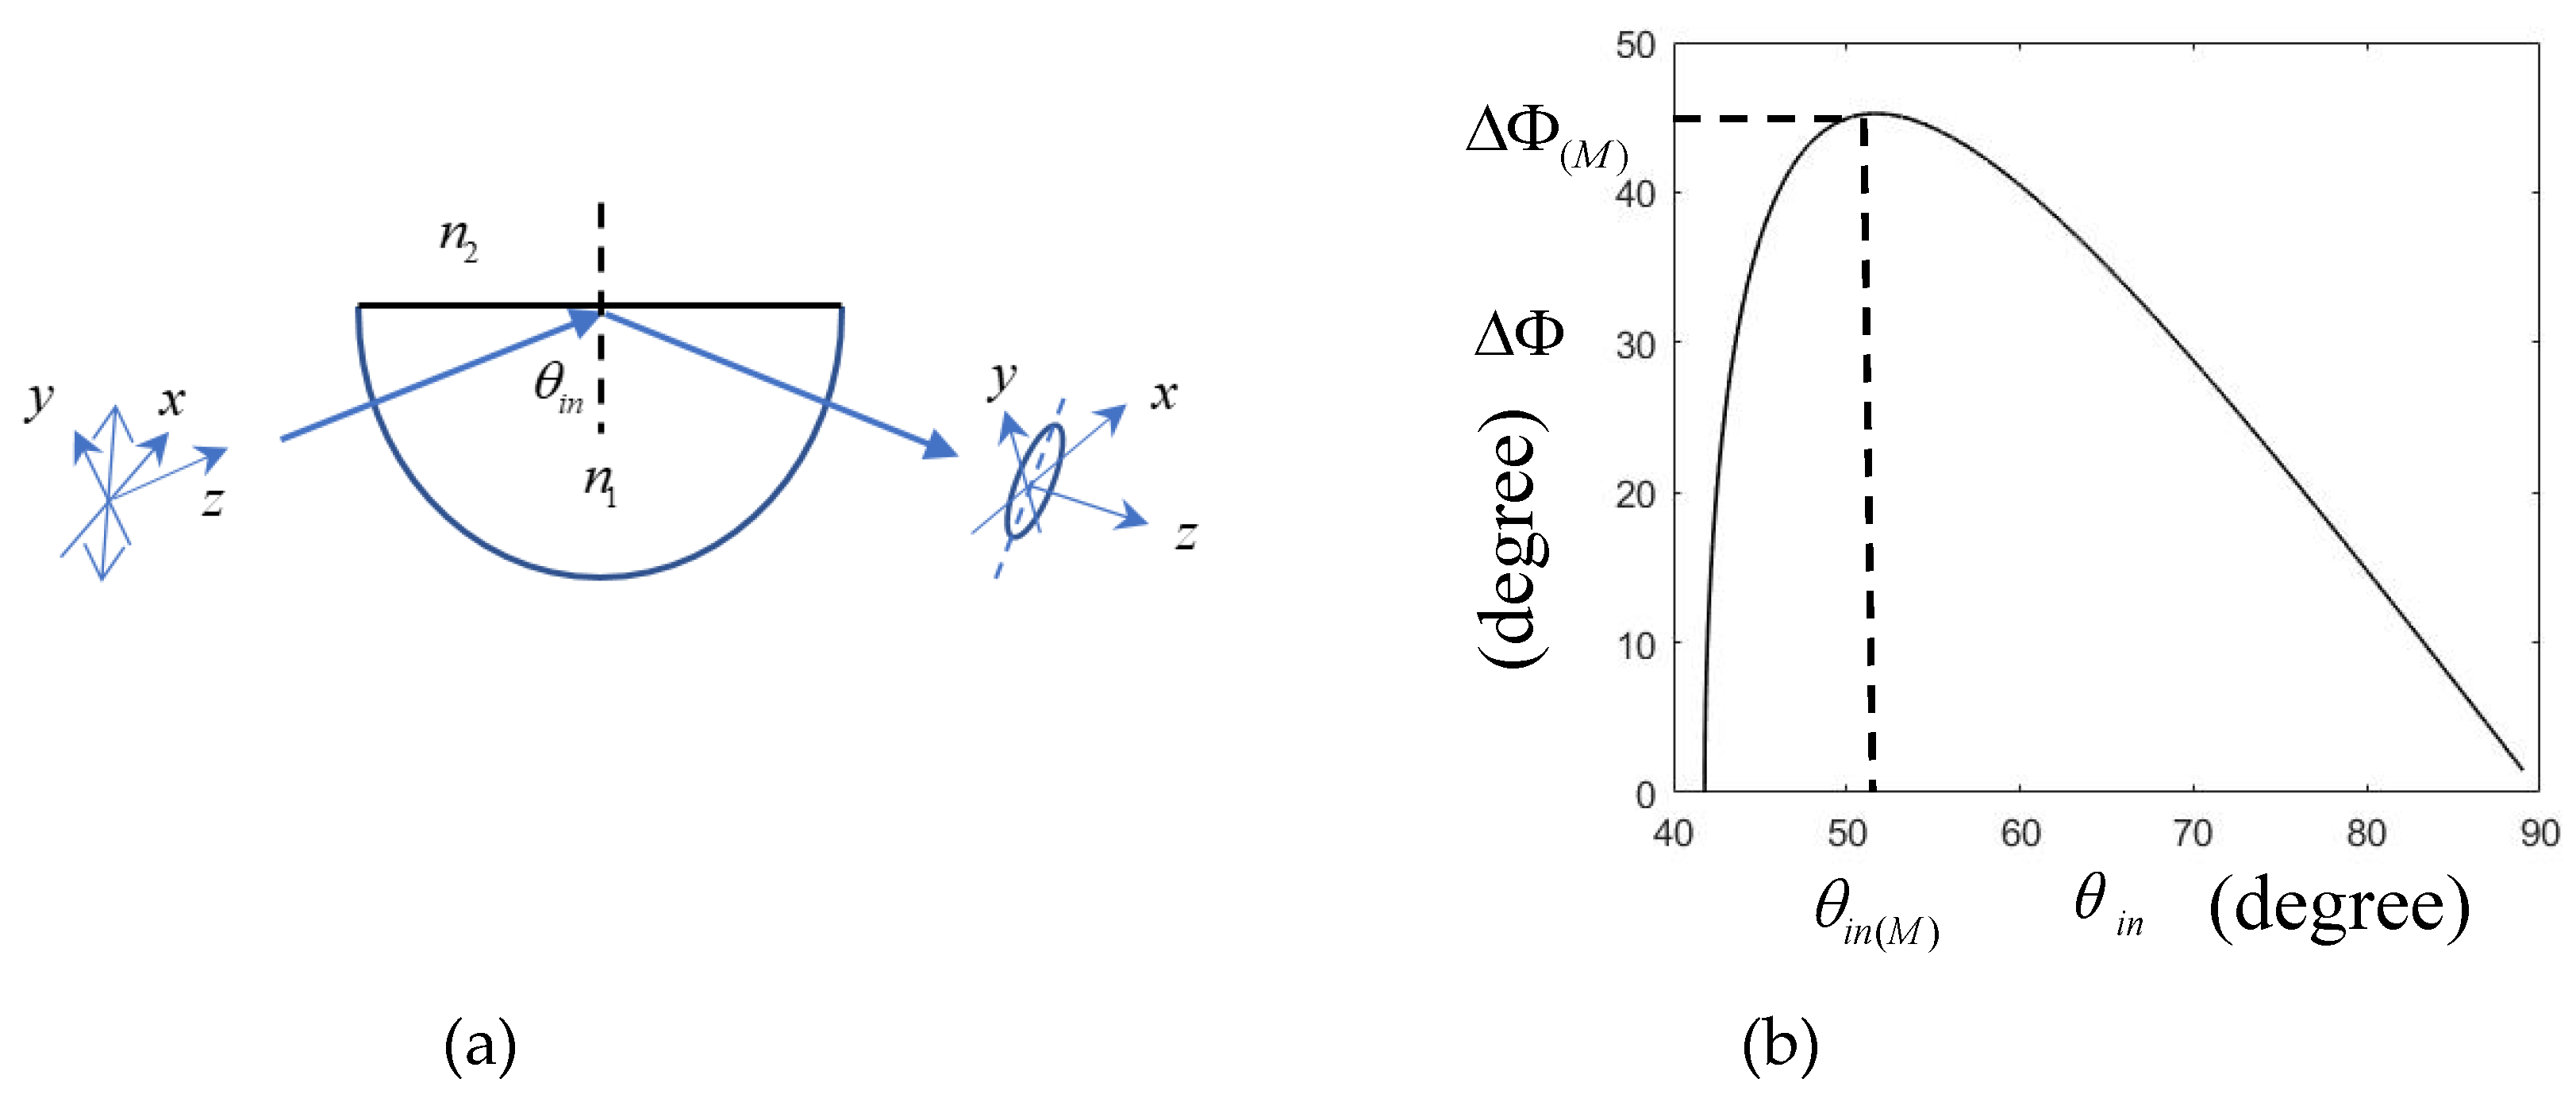
Figure 4.
Configuration, coordinates, and Jones matrices of each element.
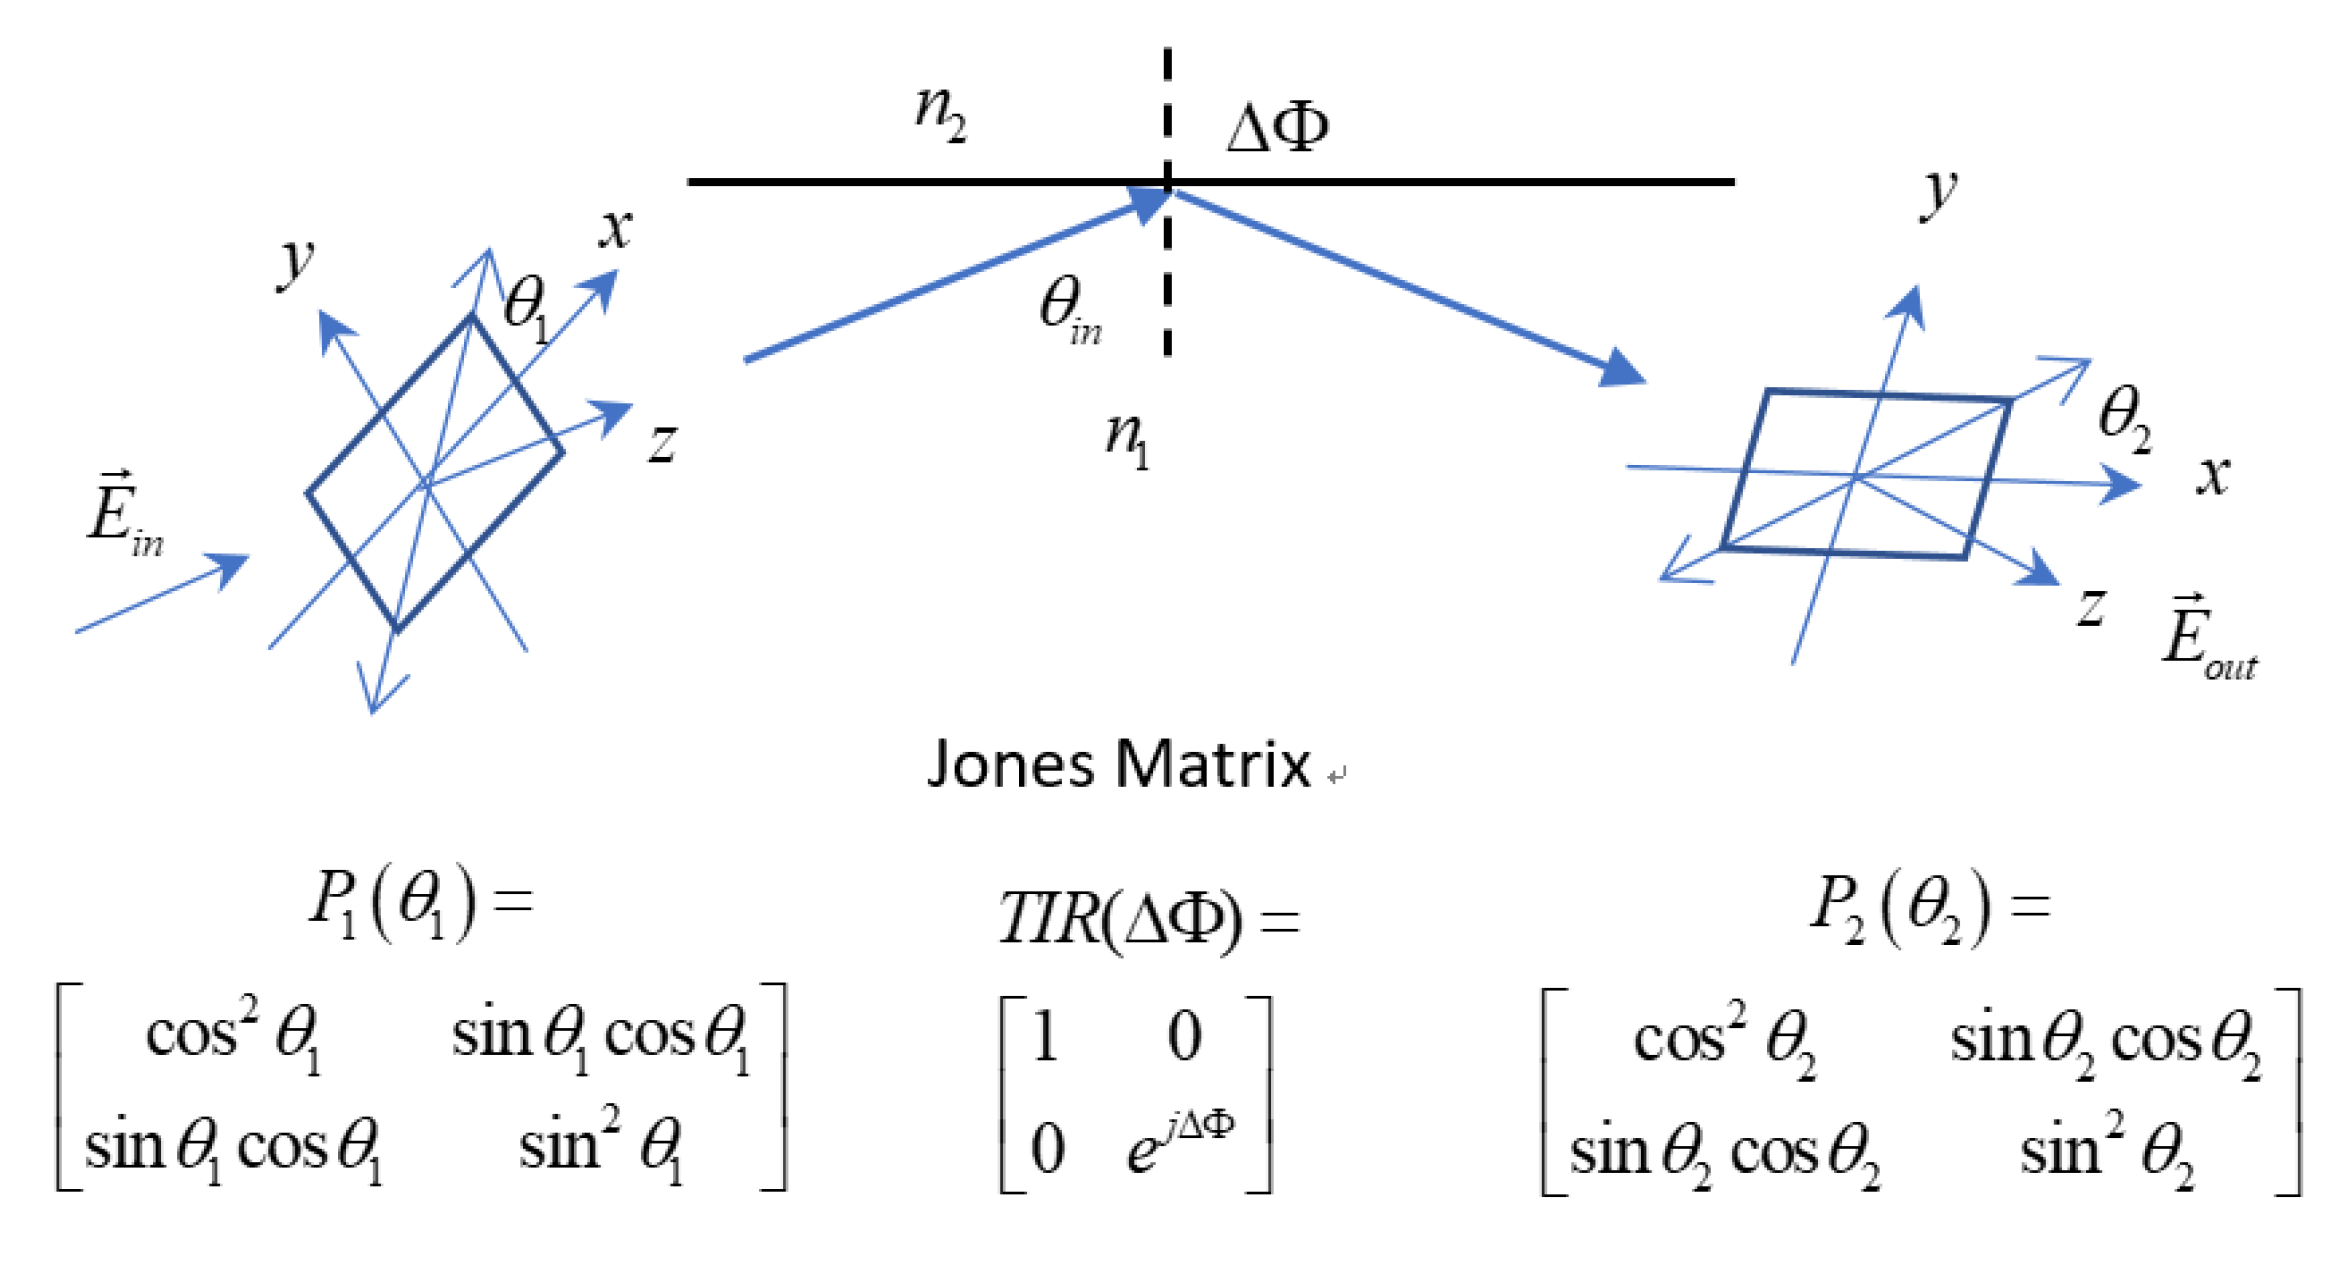
Figure 5.
Plot of output intensity versus for the case of n = 2/3.
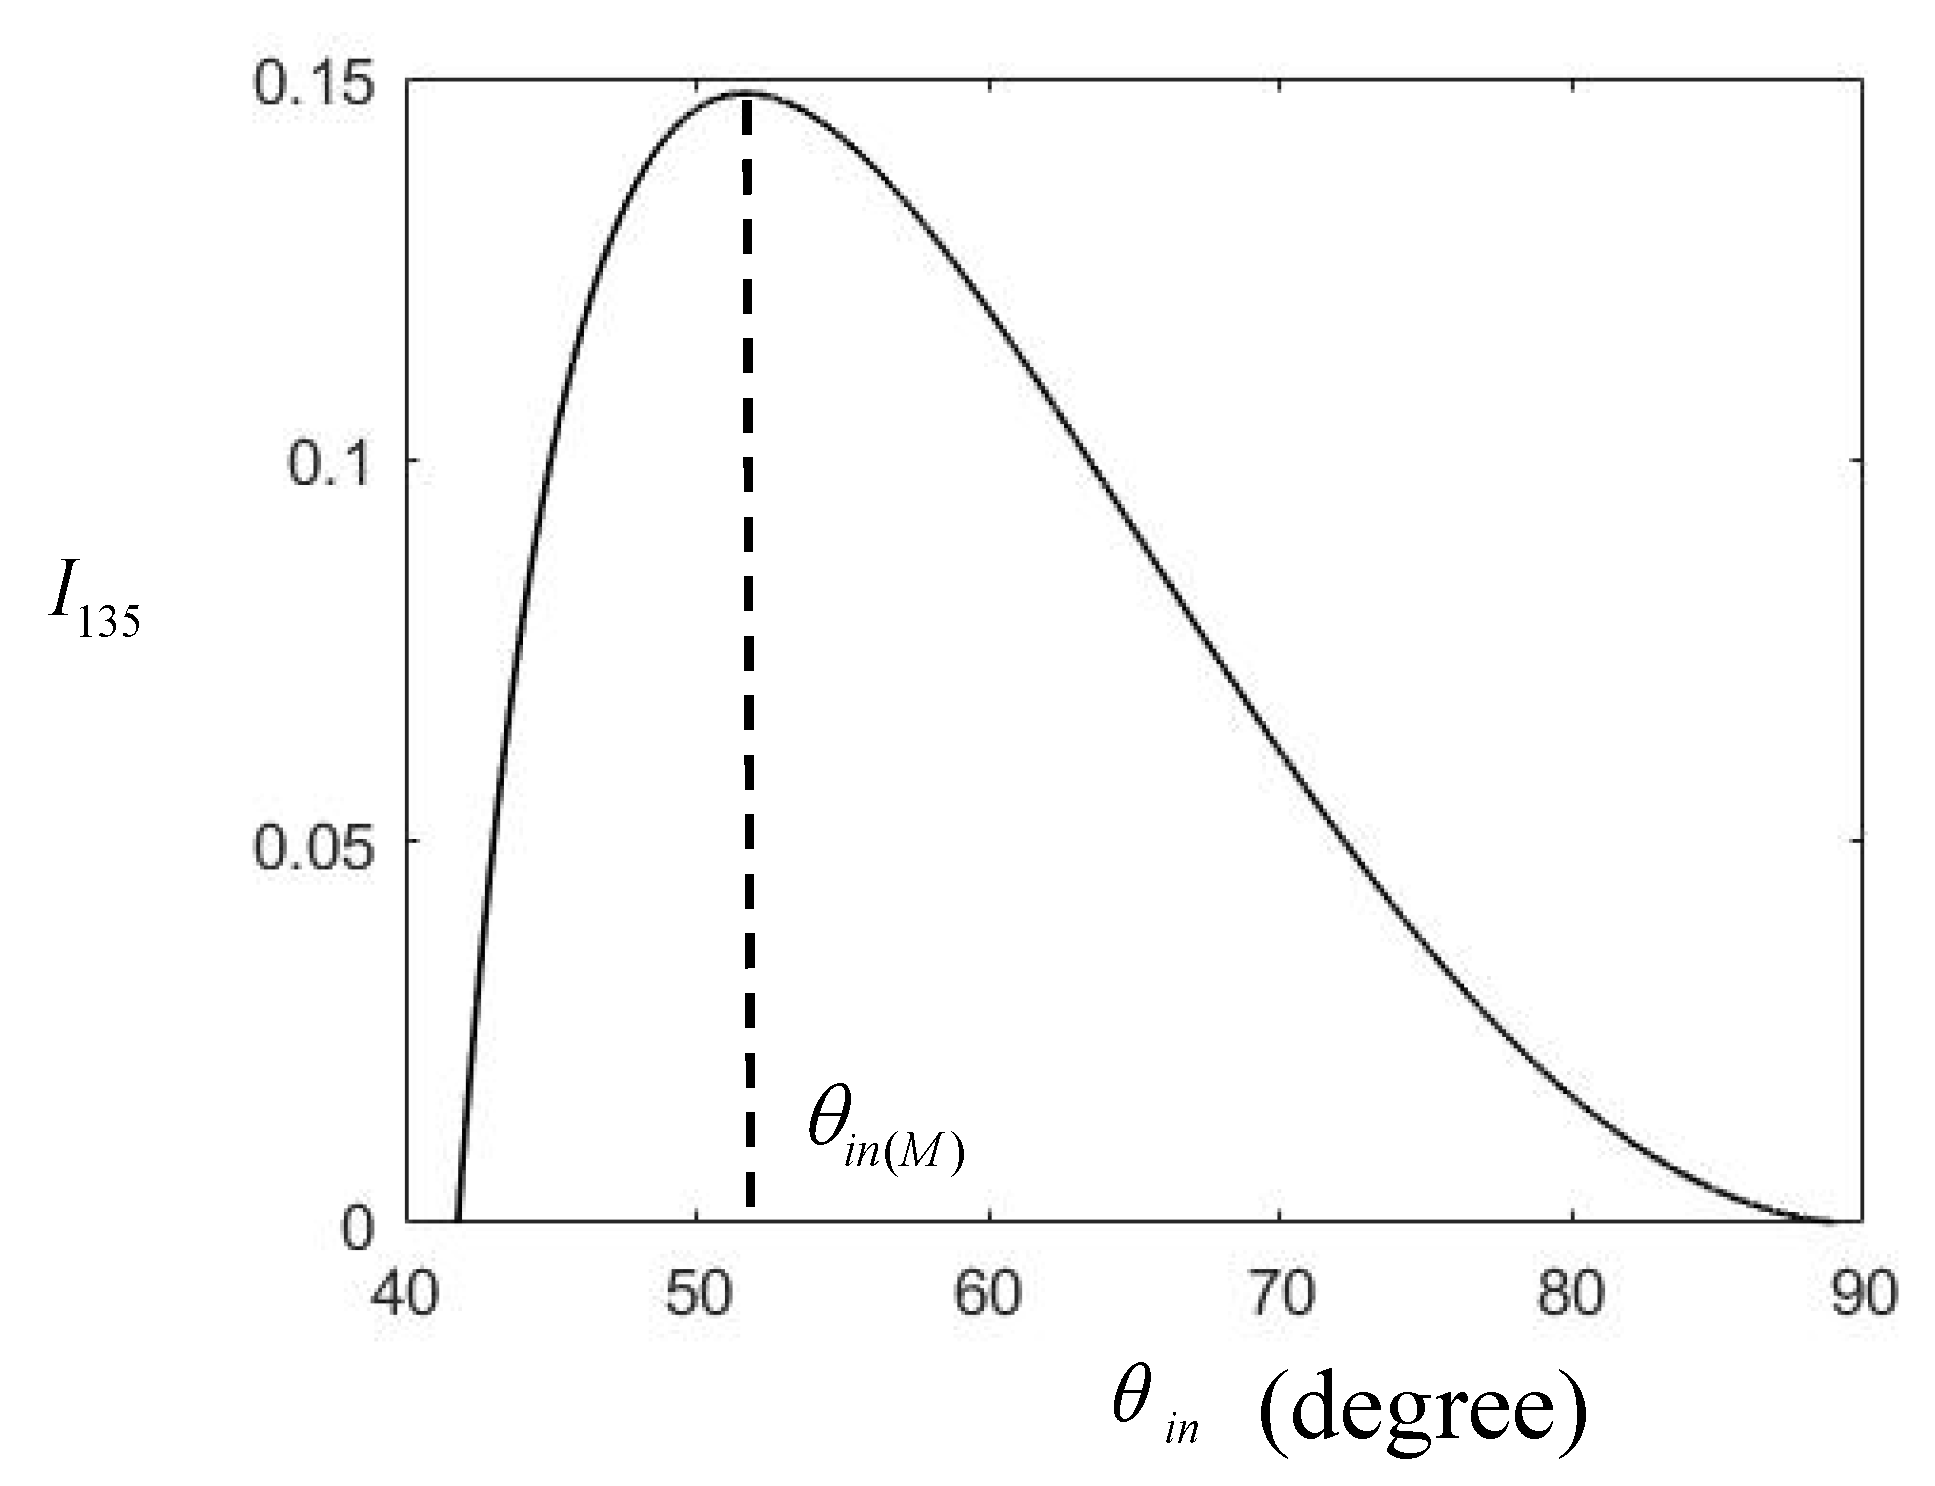
Figure 6.
An incident spectrum with a flat-top distribution.
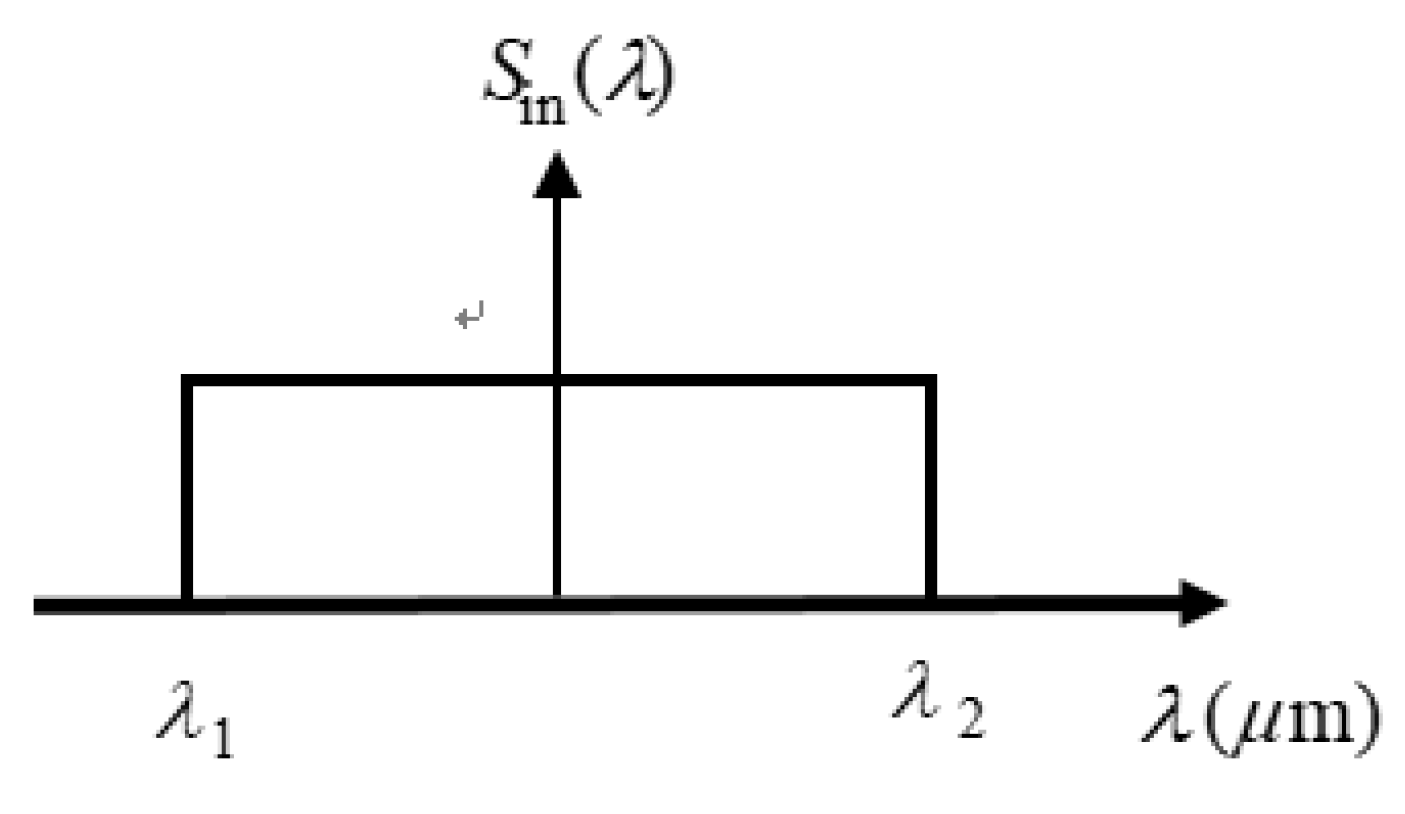
Figure 7.
Schematic for the illustration of polarization ellipse change for different spectrum wavelenght components.
Figure 7.
Schematic for the illustration of polarization ellipse change for different spectrum wavelenght components.
Disclaimer/Publisher’s Note: The statements, opinions and data contained in all publications are solely those of the individual author(s) and contributor(s) and not of MDPI and/or the editor(s). MDPI and/or the editor(s) disclaim responsibility for any injury to people or property resulting from any ideas, methods, instructions or products referred to in the content. |
© 2024 by the authors. Licensee MDPI, Basel, Switzerland. This article is an open access article distributed under the terms and conditions of the Creative Commons Attribution (CC BY) license (http://creativecommons.org/licenses/by/4.0/).
Copyright: This open access article is published under a Creative Commons CC BY 4.0 license, which permit the free download, distribution, and reuse, provided that the author and preprint are cited in any reuse.