
Submitted:
19 April 2024
Posted:
23 April 2024
You are already at the latest version
Abstract
The influence of the secondary process of evaporation of the reaction product on the kinetics of interaction of gases (O2, Cl2, NH3, H2O and N2H4 vapors) with the surface of some metals (Cr, Pb, Si, Ge) and compounds (BN, SiO2, SiC) is discussed. Also is considered the case when the growth of the scale is preceded by the process of gas etching of the metal surface. A general equation is given that describes the scale growth-evaporation kinetic (sample mass change - time) curves during the interaction of gases with the surface of metals and compounds. Special cases of parabolic, cubic and fourth degree processes are discussed.
Keywords:
Kinetics of oxidation
; Scale evaporation
; Mass change
1. Introduction
This work is a continuation of [1], where the role of reduction of the reaction surface and evaporation of scale in the process of oxidation of FeCr and FeCrAl alloys is considered. Here we will consider in more detail the influence of the secondary process of evaporation (sublimation) on the formal kinetics (mass change - time) of the interaction of gases (O2, Cl2, NH3, H2O and N2H4 vapors) with some metals and compounds. We used data from various works collected in [2], the results of the indicated author, as well as your data.
The process of scale formation with simultaneous evaporation is called the Tedmon’s process [3] (althoug such cases were discussed a little earlier [4,5]). This model is used when the overall kinetics is determined by the diffusion of ions in the scale (volume diffusion) rather than by the rate of the chemical reaction itself. In this case, the kinetics is parabolic [6–13]. With short-circuit diffusion, cubic kinetics takes place [6–11], and in the case of local electric fields and space charges, the kinetic law of the fourth degree is implemented. Kinetic data with the latter mechanism are also presented in number of works [6,7,17,18].
All of the above is clearly shown in the kinetic dependences of the mass gain, when the following happens: the mass of the sample first monotonically increases with deceleration, reaches a maximum, and then, when the rates of growth and evaporation are equalized, begins to decrease (Figure 1). Here, curve 1 shows the total mass change (M) of the metal-scale system, and curve 2, plotted graphically on its basis (excluding the contribution of evaporation), corresponds to the increase of mass (m) due to the reacted gas: m=M+vmt, where vm is the evaporation rate to the metal component of the scale, t is the time. The section OA (OA1) corresponds to the gradual growth of scale, and the straight section AB (A1B1) corresponds to the stationary regime, when the amounts of the formed and evaporating products are equalized (the first gradually decreases due to diffusion limitation, while the second is constant in an isothermal process). In this case, the layer reaches its maximum mass (thickness). The slope of the straight line AB corresponds to the rate of the mass decrease of the sample: vm=tgβ. (Here we consider the coordinate systems t - m and t - M; the coordinate system tW – W is considered further.)
The rate of mass increase due to the reacted gas in the general case is:
where n=2, 3 or 4; dm/dt (at point t=0,m=0)=tgα is rectilinear constant; is the power-law constant; vg is the speed of the system mass reduction due to the gas component of the evaporating part of the scale. Its integral form is as follows:
where k=/, is the maximum mass gain of the system at the expense of active gas.
Boundary condition for solving of Eq.(2) for different n: t=0,m=0.
The Tedmon-Wajsel equation (n=2) in our notation will be:
For n=3 and 4 we will have:
respectively [17]. For the total mass change will be:
M=m-vmt.
Such containing maxima curves were obtained in a number of works [19–29] and works collected in [2]. Here we will look at graphs in which this maximum is clearly expressed and from which reliable information can be obtained (some graphs, which are not considered here, give unrealistic values of kinetic parameters).
2. Discussion
2.1. Kinetic Curves of the Total Mass Change, Having a Maximum
As mentioned above, kinetic curves containing a maximum are presented in many works. Most of them are curves corresponding to parabolic kinetics (n=2); there is little data for n=4; but for n=3 we did not find such data (if we do not consider the curve presented in Figure 4a), although cubic processes (with curves without maxima) are considered in a fairly large number of works.
Figure 2 shows the data of [20,21]. To determine n, we can use the formula [17]:
where q=vm/vg, p=(vm+vg)/vg=q+1. The tangents of the curves in Figure 2 virtually coincide with ordinate axis at the origin of the coordinates: . In this case formula (7) is simplified as follows:
.
According to formula (8) for [21] it turns out n2.02, and for [20] n3.75, that are approaching to 2 and 4. Corresponding empirical expressions are: t15.707ln(1-0.554m)8.693m and t28.885{[0.577arctg((1.424m)/(0.822m+2)0.167ln((1-0.822m)2(+0.822m+1))]}--23.75m, where m is in mg/cm2 and t is in hours. The curves constructed using these equations on the scale used in Figure 2 practically coincide with the experimental curves.
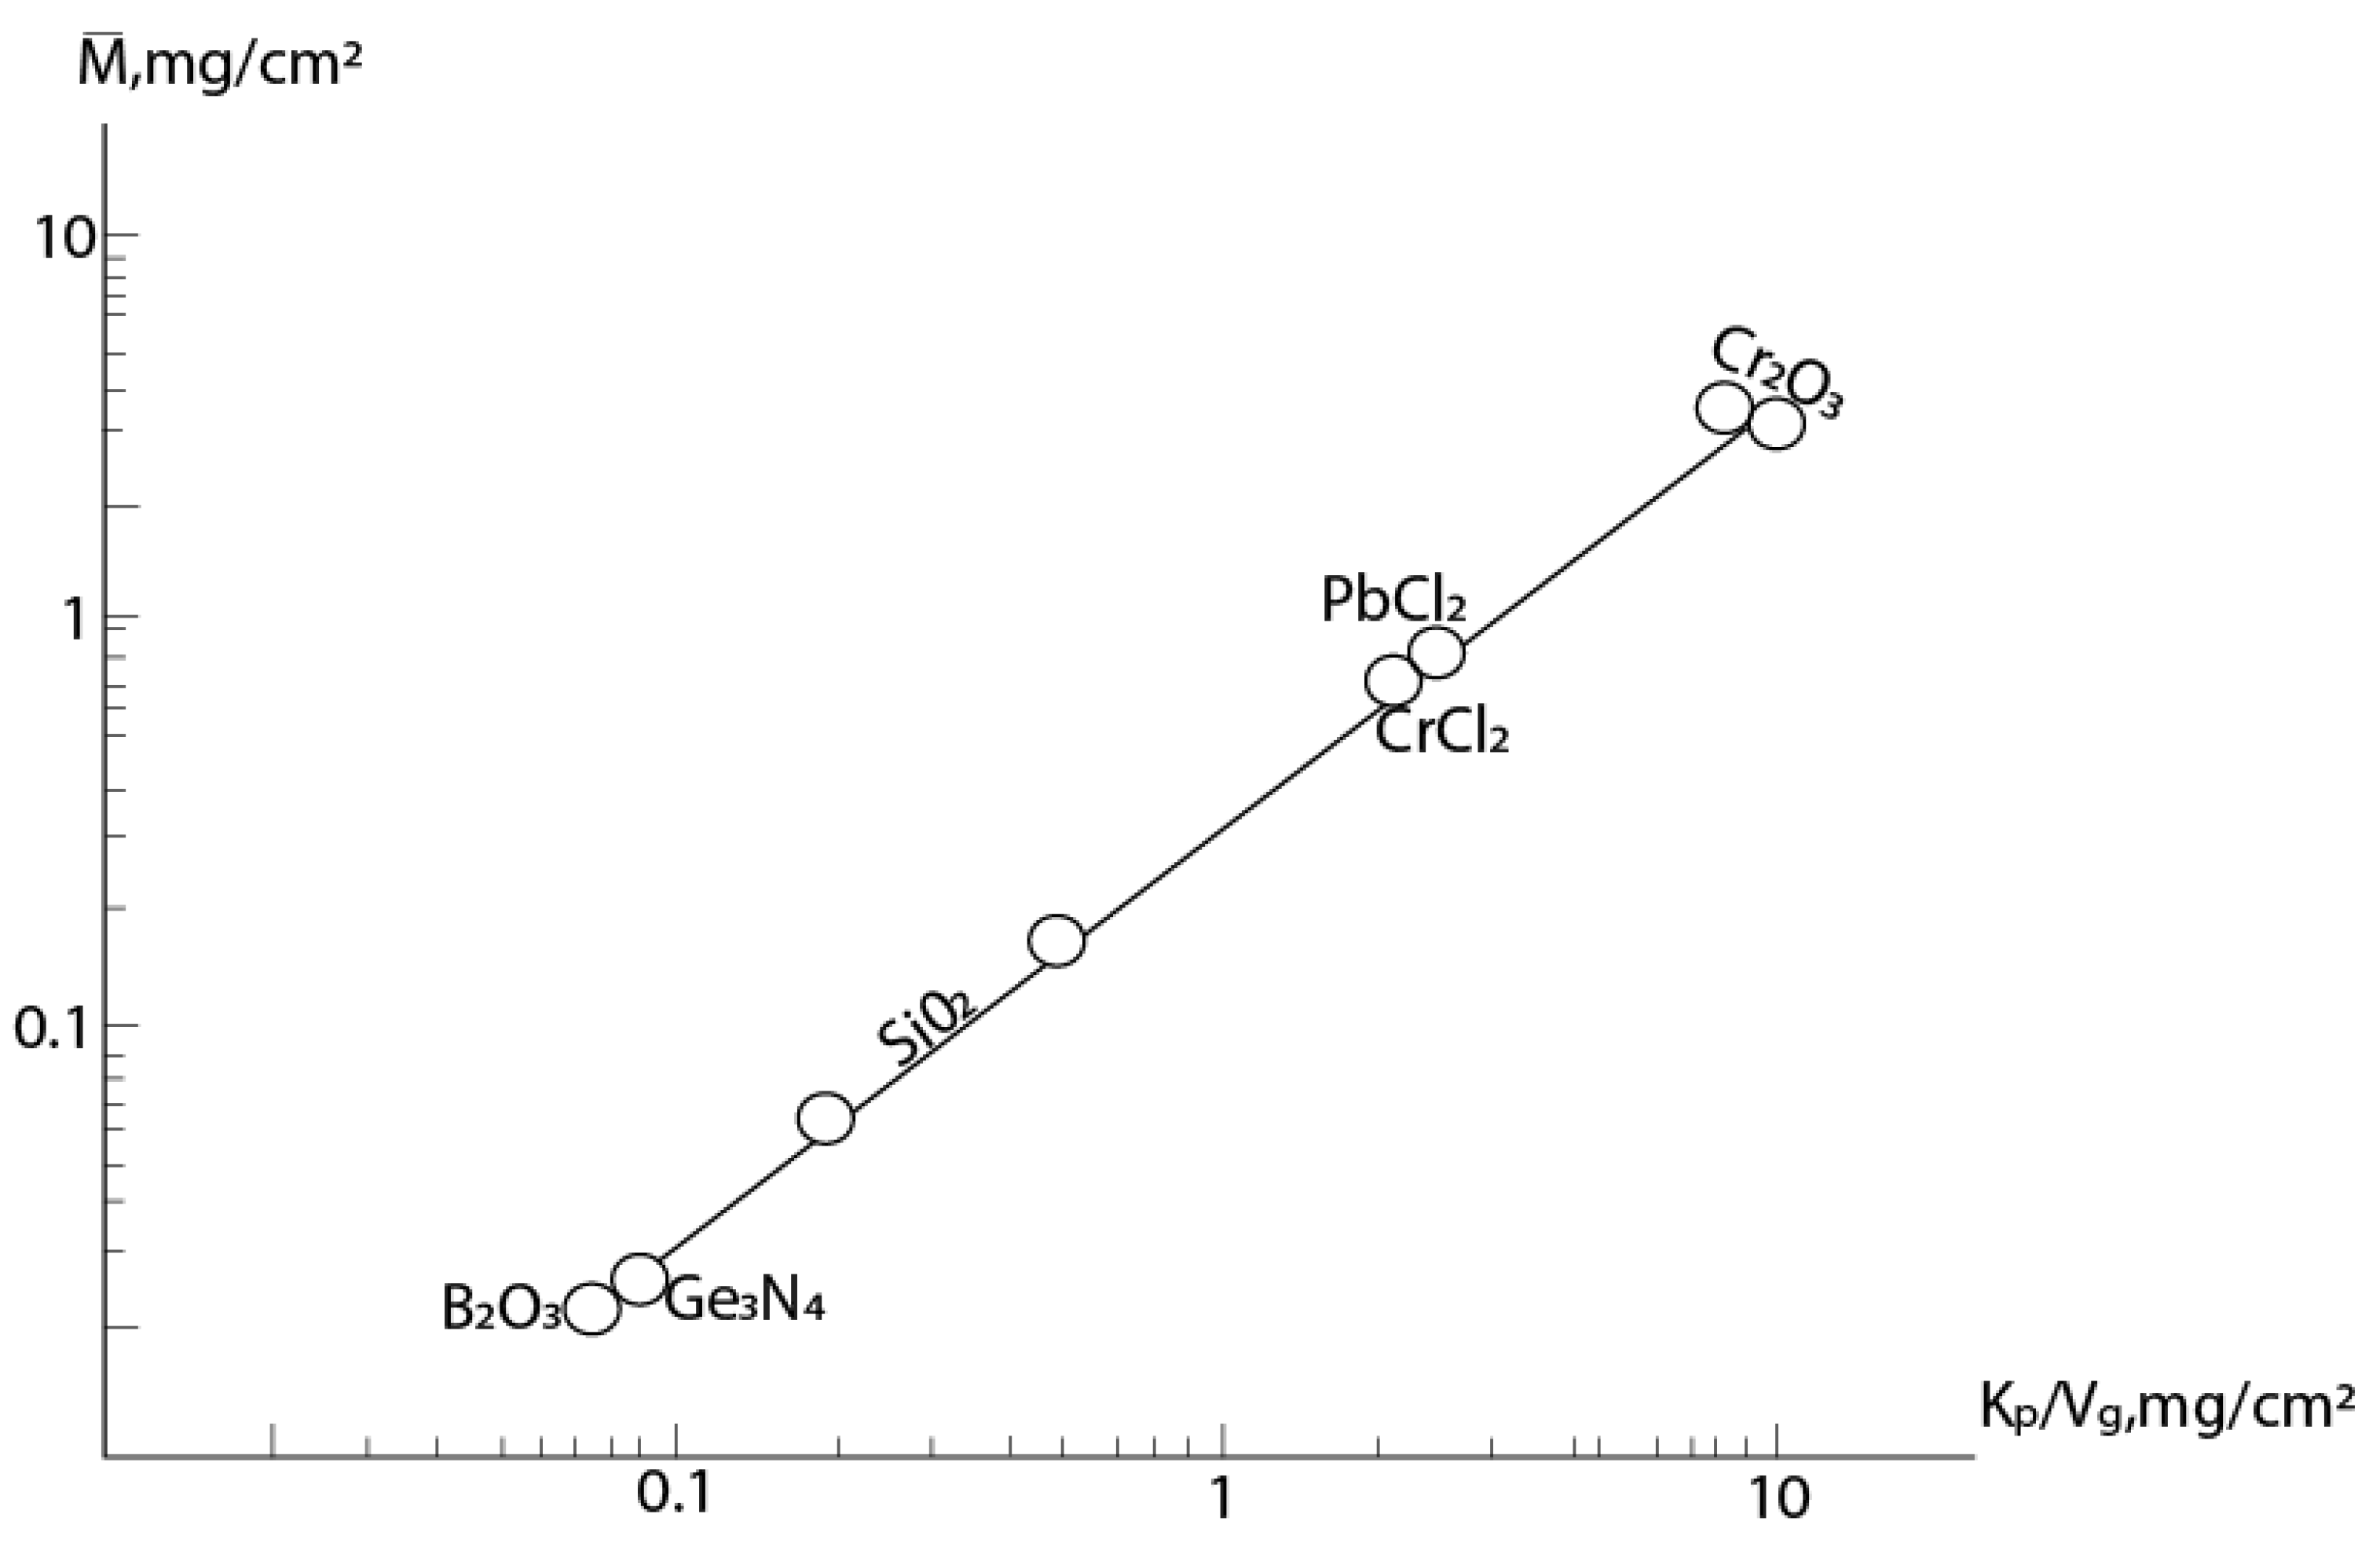
Figure 3 shows the dependence in coordinates (kp/vg, ) for different samples from [2]. The following reactions are considered here: 2Cr+3O2=Cr2O3, Pb+Cl2 = PbCl2, Si+O2 = SiO2, SiC+2O2 = SiO2 + CO2, Si3N4+3O2 = 3SiO2+2N2 and 4BN+3O2 = 2B2O3 +2N2 (for all reactions the kinetics are parabolic: kp - power-law constant at n=2). We have added data for reactions Cr+2HCl=CrCl2+H2 [21] and 3Ge+4NH3=Ge3N4+6H2 [29] also with parabolic kinetics. This data fit well into this dependence (see figure).
2.2. Consideration of Preliminary Mass Reduction
In some cases the growth of scale is preceded by other processes, for example, gas etching of the surface of the metal or alloy (initial section of curve 1 in coordinate system t-W (Figure 1)). In this case, to describe the m – t dependence, it is necessary to solve the differential equation (1) with the boundary condition t = 0, m = m0. For n=2, 3 and 4 these solutions have the form:
PH2O/PNH3); and (c) with N2H4 (PN2H4=2103Pa) at 720oC – (1) dependences W – t, (2) – dependences m – t; 2’ – calculated curves (in the scale of the figure (c), the experimental and calculated curves practically coincide with each other). .
Figure 4.
Kinetic dependences of interaction of Ge: with NH3+H2O at (a) P=2%, 820oC, (b) P=5%, 800oC, (P PH2O/PNH3); and (c) with N2H4 (PN2H4=2∙103Pa) at 720oC – (1) dependences W – t, (2) – dependences m − t; 2’ – calculated curves (in the scale of the figure (c), the experimental and calculated curves practically coincide with each other). .
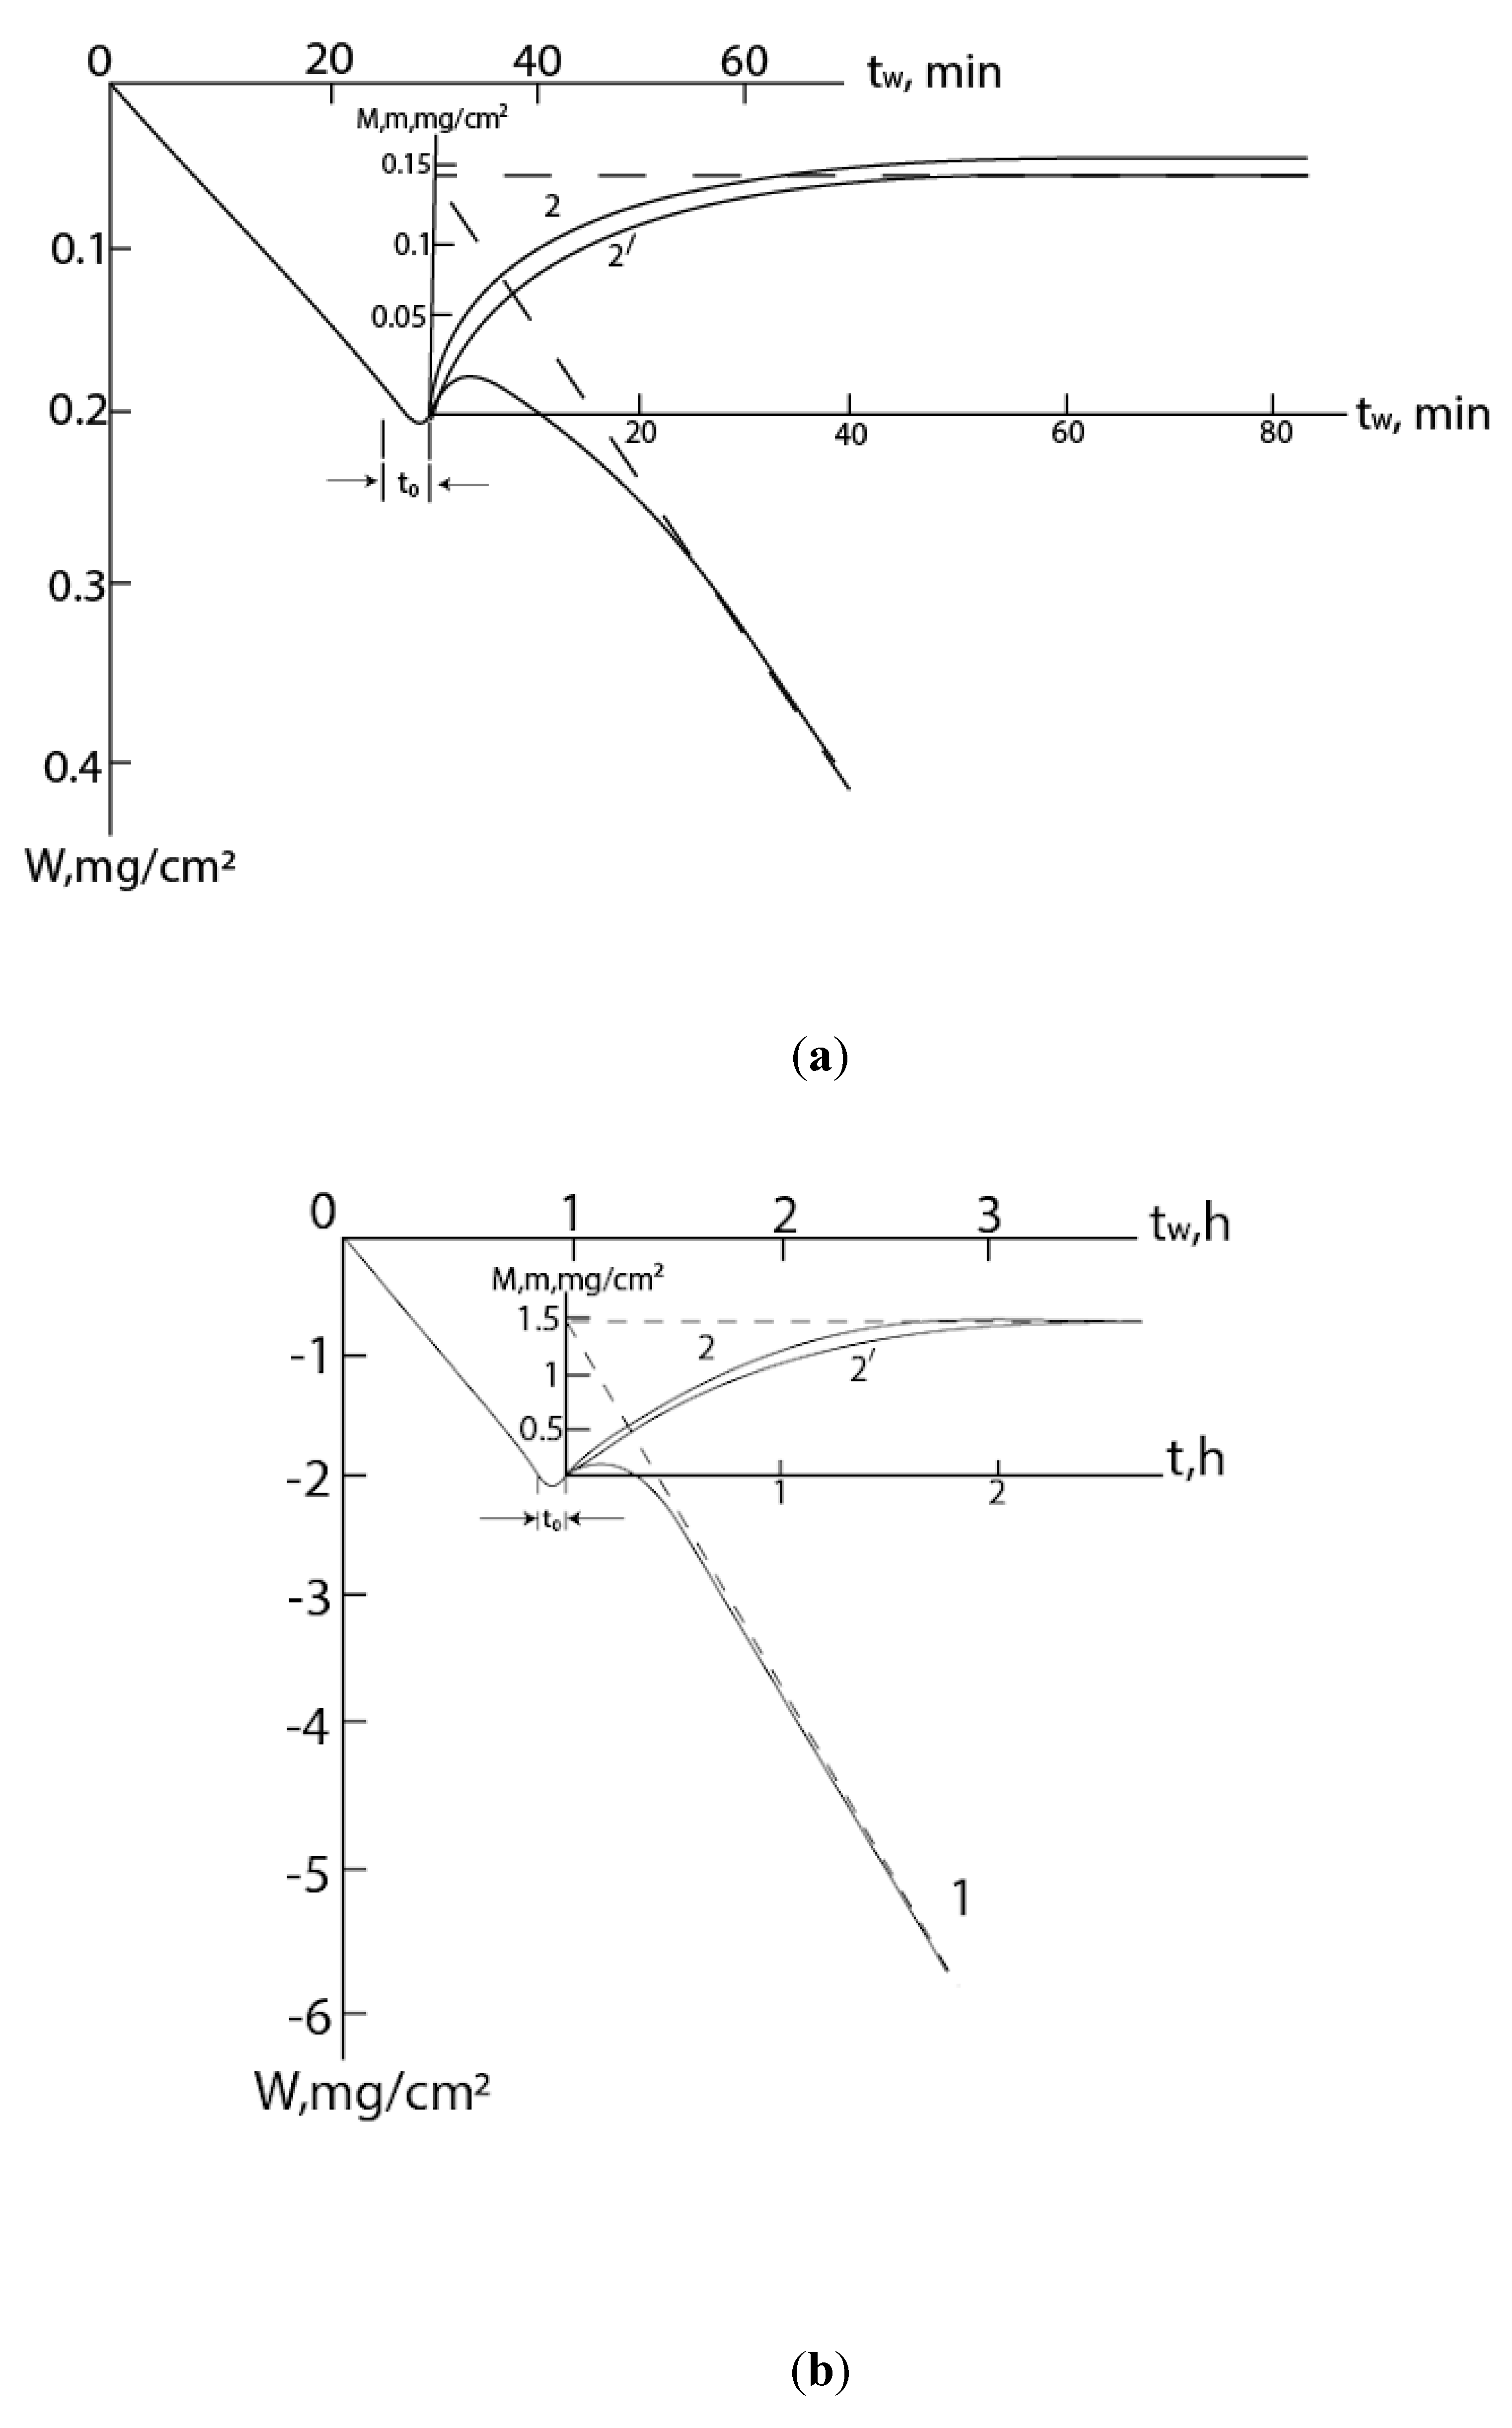
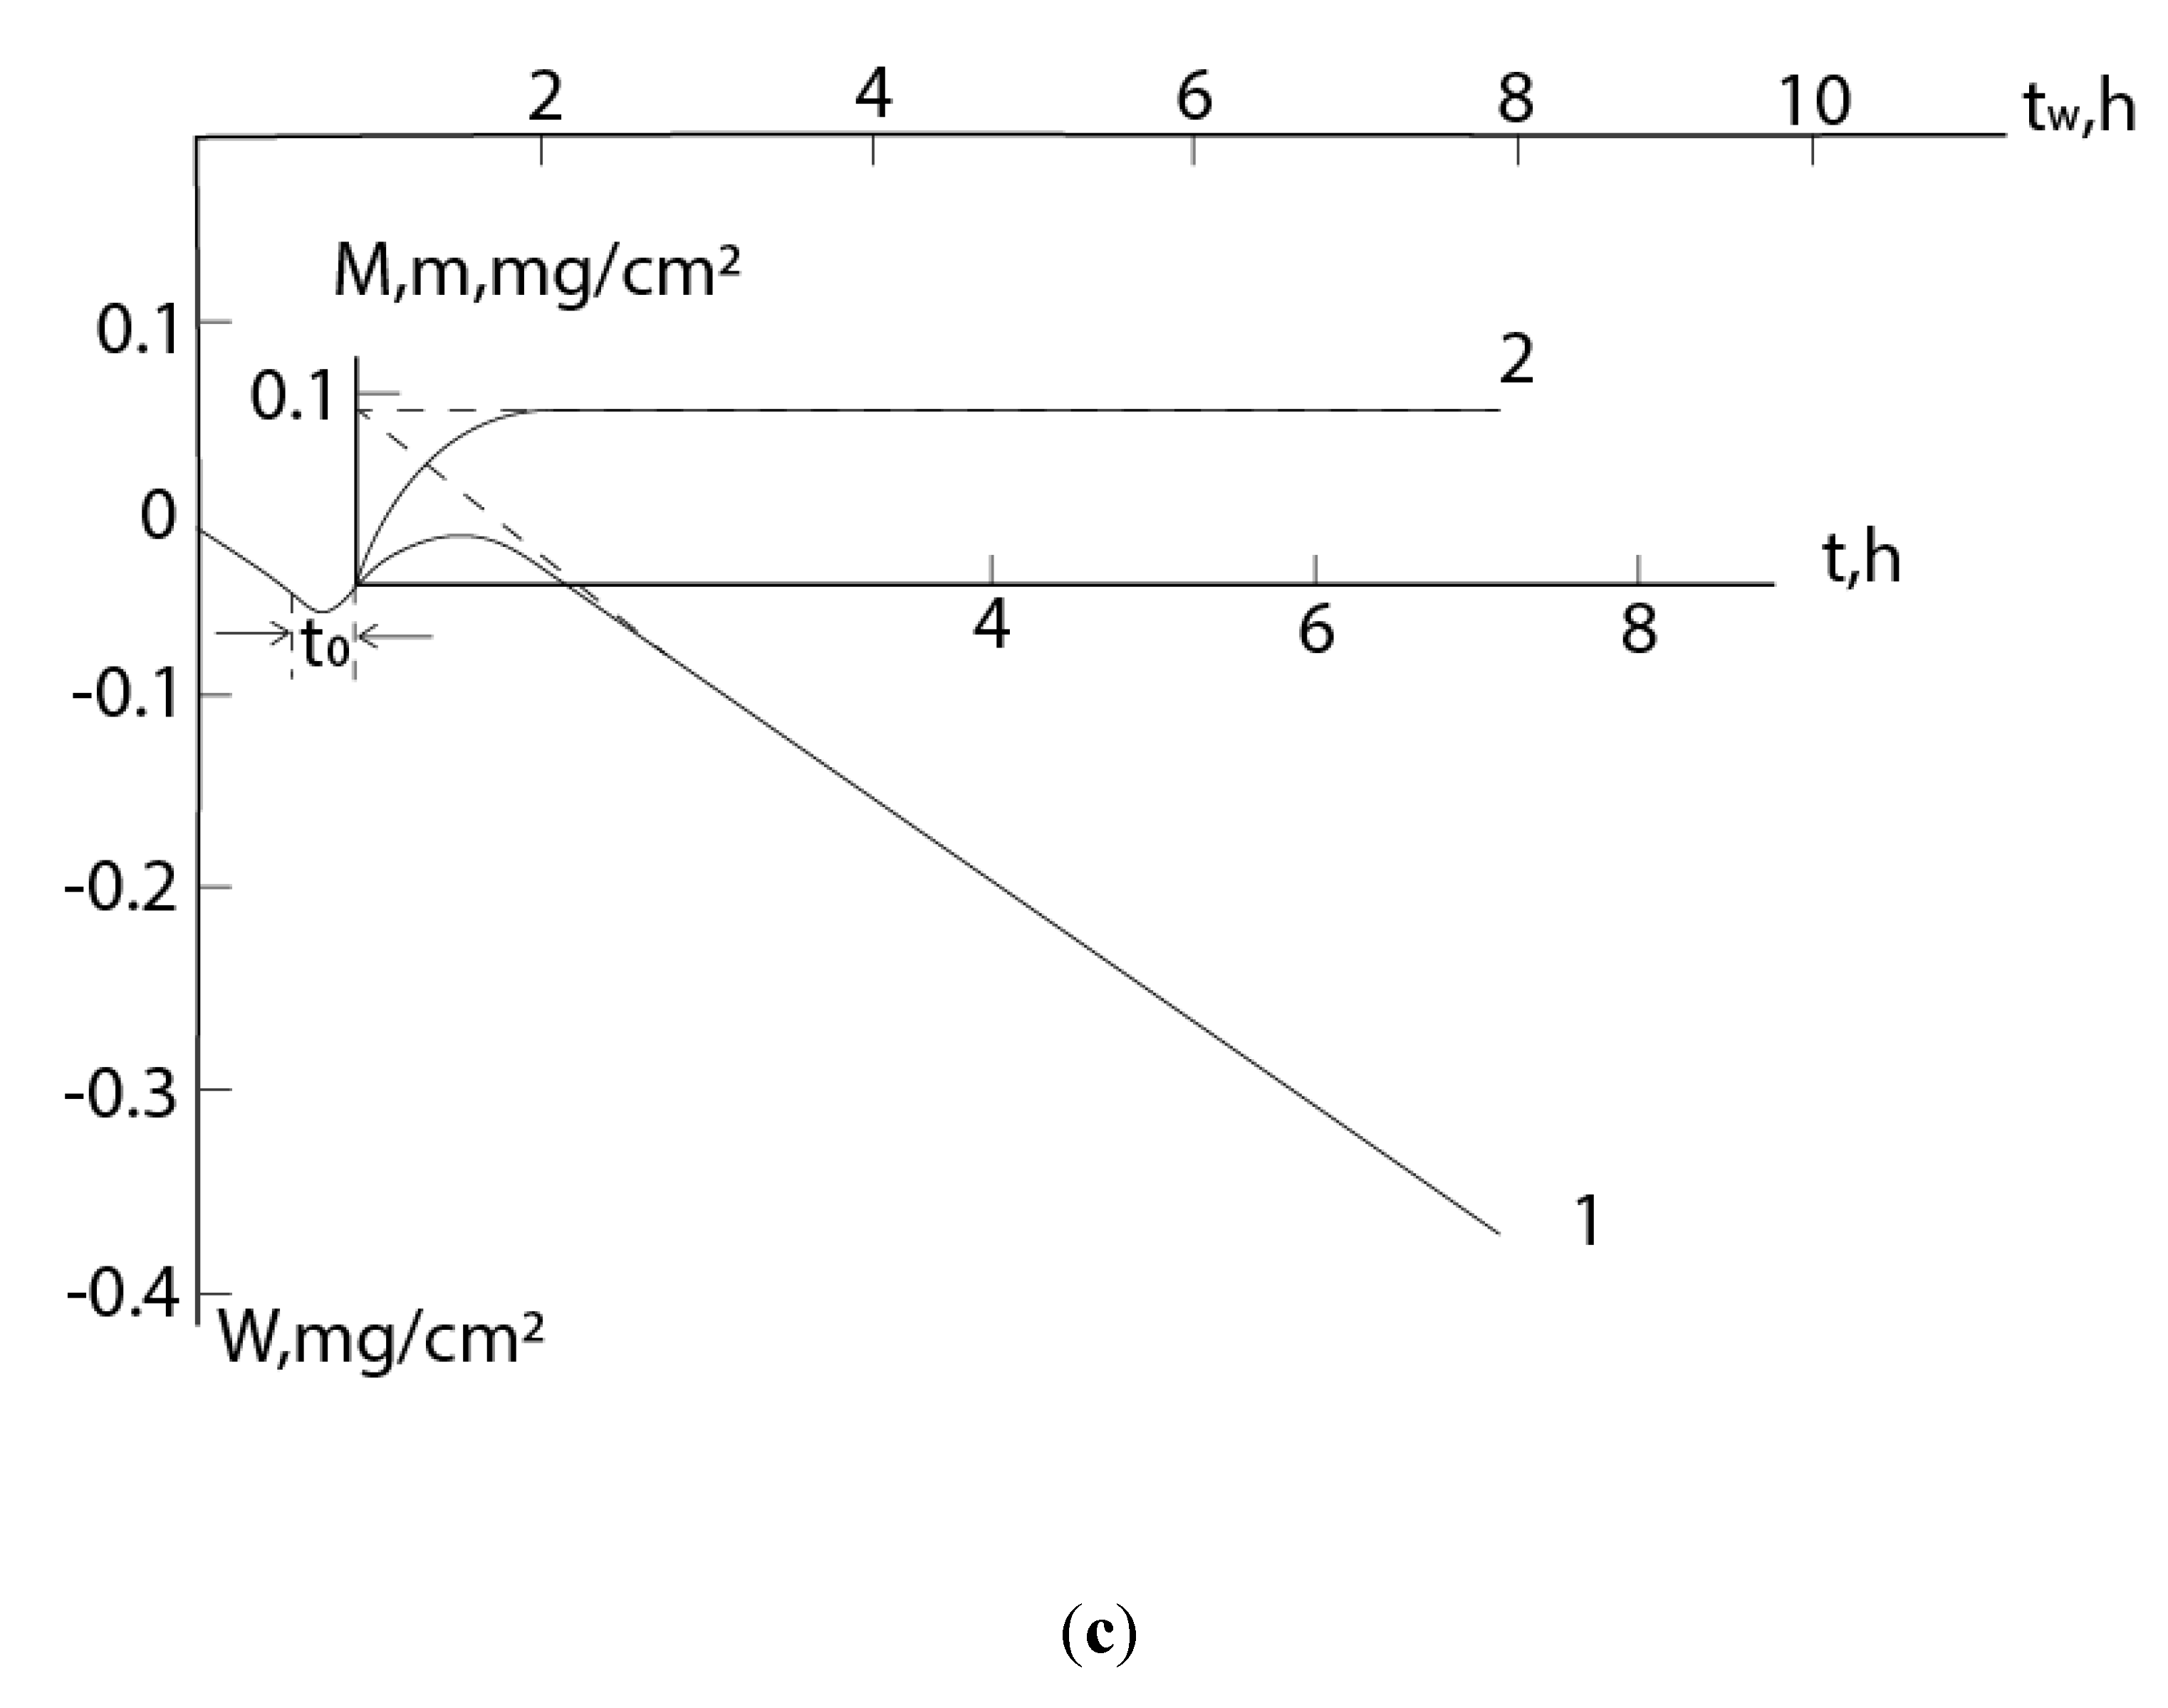
On these curves, the initial decrease of mass is due to the etching of the germanium surface by water vapor, which is contained in small quantities also in concentrated hydrazine (volatile GeO is formed here: GeO+H2O=GeO+H2) [30]. Also it is obvious that the formation of nitride on the germanium surface will begin before the zero point in the t - m coordinate system. But from the presented model it follows that the m - t dependences are convex in the positive direction. Time shifts betveen equations (3) and (9), (4) and (10), (5) and 11) are:
According to the experimental data presented in Figure 4, one can estimate t0≈3 min, 0.14 h, and 0.33 h, respectively with Figures (a), (b) and (c). Then the values of m0 will be ≈0.3, 0.05 and 0.03 mg/cm2. As you can see, m0 makes up (20-34)% of corresponding mmax (0.145, 1.42, 0.092 mg/cm2, respectively) and this cannot be ignored when conducting an experiment using the gravimetric method.
3. Conclusions
A general equation is given that describes the scale growth-evaporation kinetic (sample mass change - time) curves during the interaction of gases with the surface of metals and compounds. Special cases of parabolic, cubic and fourth degree processes are discussed. Equations are also given for the case when scale formation is preceded by the process of gas etching of the metal surface.
Acknowledgments
This review is dedicated to the memory of Dr. V.A. Arslambekov, one of the first researchers of the Tedmon’s process.
Conflicts of Interest
The author declare no conflicts of interest.
Appendix
In Figure 4 the m – t dependencies are plotted according to corresponding empirical expressions of Eqs(3)-(5):
References
- Nakhutsrishvili I. Oxidation kinetics of FeCr and FeCrAl alloys: Influence of secondary processes. Johnson Mattey Techn. Rev., in press.
- Smialek J.L. (2023) Simplified paralinear oxidation analyses. High Temp. Corros. Materials, 99 (5/6) 1-27.
- Tedmon C.S. (1966) The Effect of oxide volatilization on the oxidation kinetics of Cr and Fe-Cr alloys. Electrochem. Soc., 113 (8) 766-768.
- Wajszel D. (1963) A method for calculating paralinear constants for the formation of volatile scale. Electrochem. Soc., 110 (6) 504-505.
- Аrslambekov V.A. In Book Механизм взаймoдействия металлoв с газами. Мoсква, Наука. 1966, 174 p.
- Krejčí J., Vrtílková V., Gajdoš P. and Rada D. (2017) Proposal of new oxidation kinetics for sponge base E110 cladding tubes material. Nuclear Sci. Technol., 3, 18.
- Carrette F., Guinard L. and Pieraggi B. Kinetics of corrosion products release from nickel-base alloys corroding in primary water conditions. A new modeling of release, Int. Conf. Water Chemistry in Nuclear Reactor System. 2002, 22-26 April, Avignon, France, 1.
- Stringer J. (1972) The functional form of rate curves for high-temperature oxidation of dispersion-containing alloys forming Cr2O3 scales. Oxidat. Metals, 5, 49-58.
- Yong Y., Benton B.E., Howell M. and Bell G. (2018) High-temperature oxidation kinetics of sponge-based E110 cladding alloy. Nucl. Materials, 499, 595-612.
- Smeltzer W.W., Haering R.R. and Kirkaldy J.S. (1961) Oxidation of metals by short circuit and lattice diffusion of oxygen. Acta Metallurgica, 9 (9) 880-885.
- Atkinson H.V. (1985) A review of the role of short-circuit diffusion in the oxidation of nickel, chromium, and nickel-chromium alloys. Oxidat. Metals, 24, 177-197.
- Pourbahari B. and McDermid J.R. (2023) Oxidation kinetics of Fe-(2-10) Mn-xSb alloys during annealing. Materialia, 27, 101698.
- Feng J., Tang J., Chu M. et al. (2022) Effect of Cr2O3 on the kinetics mechanism and microstructure of pellet during oxidation roasting process. Steel Res., 94 (5) 2200735.
- Aghaeian S., Nourouzi F., Sloof W.G. et al. (2023) Predicting the parabolic growth rate constant for high-temperature oxidation of steels using machine learning models. Corrosion Sci., 221, 111309.
- Abd-El-Nabey B.A., El-Housseiny S., Abdel-Gaber A.M. and Mohamed M.E. (2023) Kinetics of oxidation of metals in the air at room temperature using EDX. Results in Chem., 5, 100876.
- Estupinan-Lopez F., Orquiz-Muela C., Gaona-Tiburcio C. et al. (2023) Oxidation kinetics of Ti-6Al-4V alloys by conventional and electron beam additive manufacturing. Materials,16 (3) 1187.
- Nakhutsrishvil, I. (2020) Study of growth and sublimation of germanium nitride using the concept of Tedmon’s kinetic model. Oriental J. Chem., 36 (5) 850-854.
- Liu T.K. and Bautista R.G. (1981) Prediction of the global volatilization rate of gas-metal-alloy reaction systems—Method of calculation. Oxidat. Metals, 16, 243-252.
- Jones E.S., Mosher J.F., Speiser R. and Spretnak J.W. (1958) Oxidation of molybdenum. Corrosion, 14 (1) 20-26.
- Davis H.H., Graham H.C. and Kverens I. (1971) Oxidation behavior of Ni-Cr-1ThO2 alloys at 1000 and 1200°C. Oxidat. Metals, 3, 431-451.
- IharaY., Ohgame H., Sakiyama K. and Hashimoto K. (1983) The corrosion behaviour of chromium in hydrogen chloride gas and gas mixtures of hydrogen chloride and oxygen at high temperatures. Corrosion Sci., 23 (2) 167-181.
- Smialek J. and Jacobson N.S. Oxidation of high-temperature aerospace materials, In Book: High Temperature Materials and Mechanisms, 2014, 95.
- Nelson A.T., Sooby E.S., CimY.-J. et al. (2014) High temperature oxidation of molybdenum in water vapor environments. Nucl. Materials, 448 (1/3) 441-447.
- Pujilaksono, B.; Jonsson, T.; Halvarsson, M. et al. Paralinear Oxidation of Chromium in O2 + H2O Environment at 600–700 °C. Oxidat. Metals. 2008, 70, 163.
- Wang,G.; Liu, Y.; Zhang, J. et al. Reaction of CVD BN ceramics in water vapor at 1023–1173 K using different kinetic model. Ceramic Soc. Japa.n. 2014, 12, 889.
- Kruk, A; Gil, A.; Lech, S. et al. Multiscale characterization of an oxide scale formed on the creep-resistant ATI 718Plus superalloy during high-temperature oxidation. Materials. 2021, 14, 6327.
- Dryepondt, S.N.; Pint, B.A.; Maziasz, P.J. New creep-resistant cast alloys with improved oxidation resistance in water vapor at 650–800°C. Frontniers in Materials. 2015, 2, 55.
- Peng, J.; Pillai, R.; Romedenne, M. et al. Data analytics approach to predict high-temperature cyclic oxidation kinetics of NiCr-based alloys. Materials Degradat. 2021, 5, 41.
- Nakhutsrishvili, I. Some formal aspects of Tedmon’s kinetics: Growth and sublimation of Ge3N4. Technical Sci. & Technol. 2016, 5, 19.
- Aronishidze, M.; Nakhutsrishvili, I.; Vardosanidze, Z. et al. Some aspects of gas etching of monocrystalline germanium surface. Prooc. Georgian Acad. Sci., ser. chem. 2015, 41, 361.
Figure 1.
Schematic representation of the kinetic curves of the total mass change (1) and its increase due to the reacted gas (2); (,) – coordinates of Mmax.
Figure 1.
Schematic representation of the kinetic curves of the total mass change (1) and its increase due to the reacted gas (2); (,) – coordinates of Mmax.
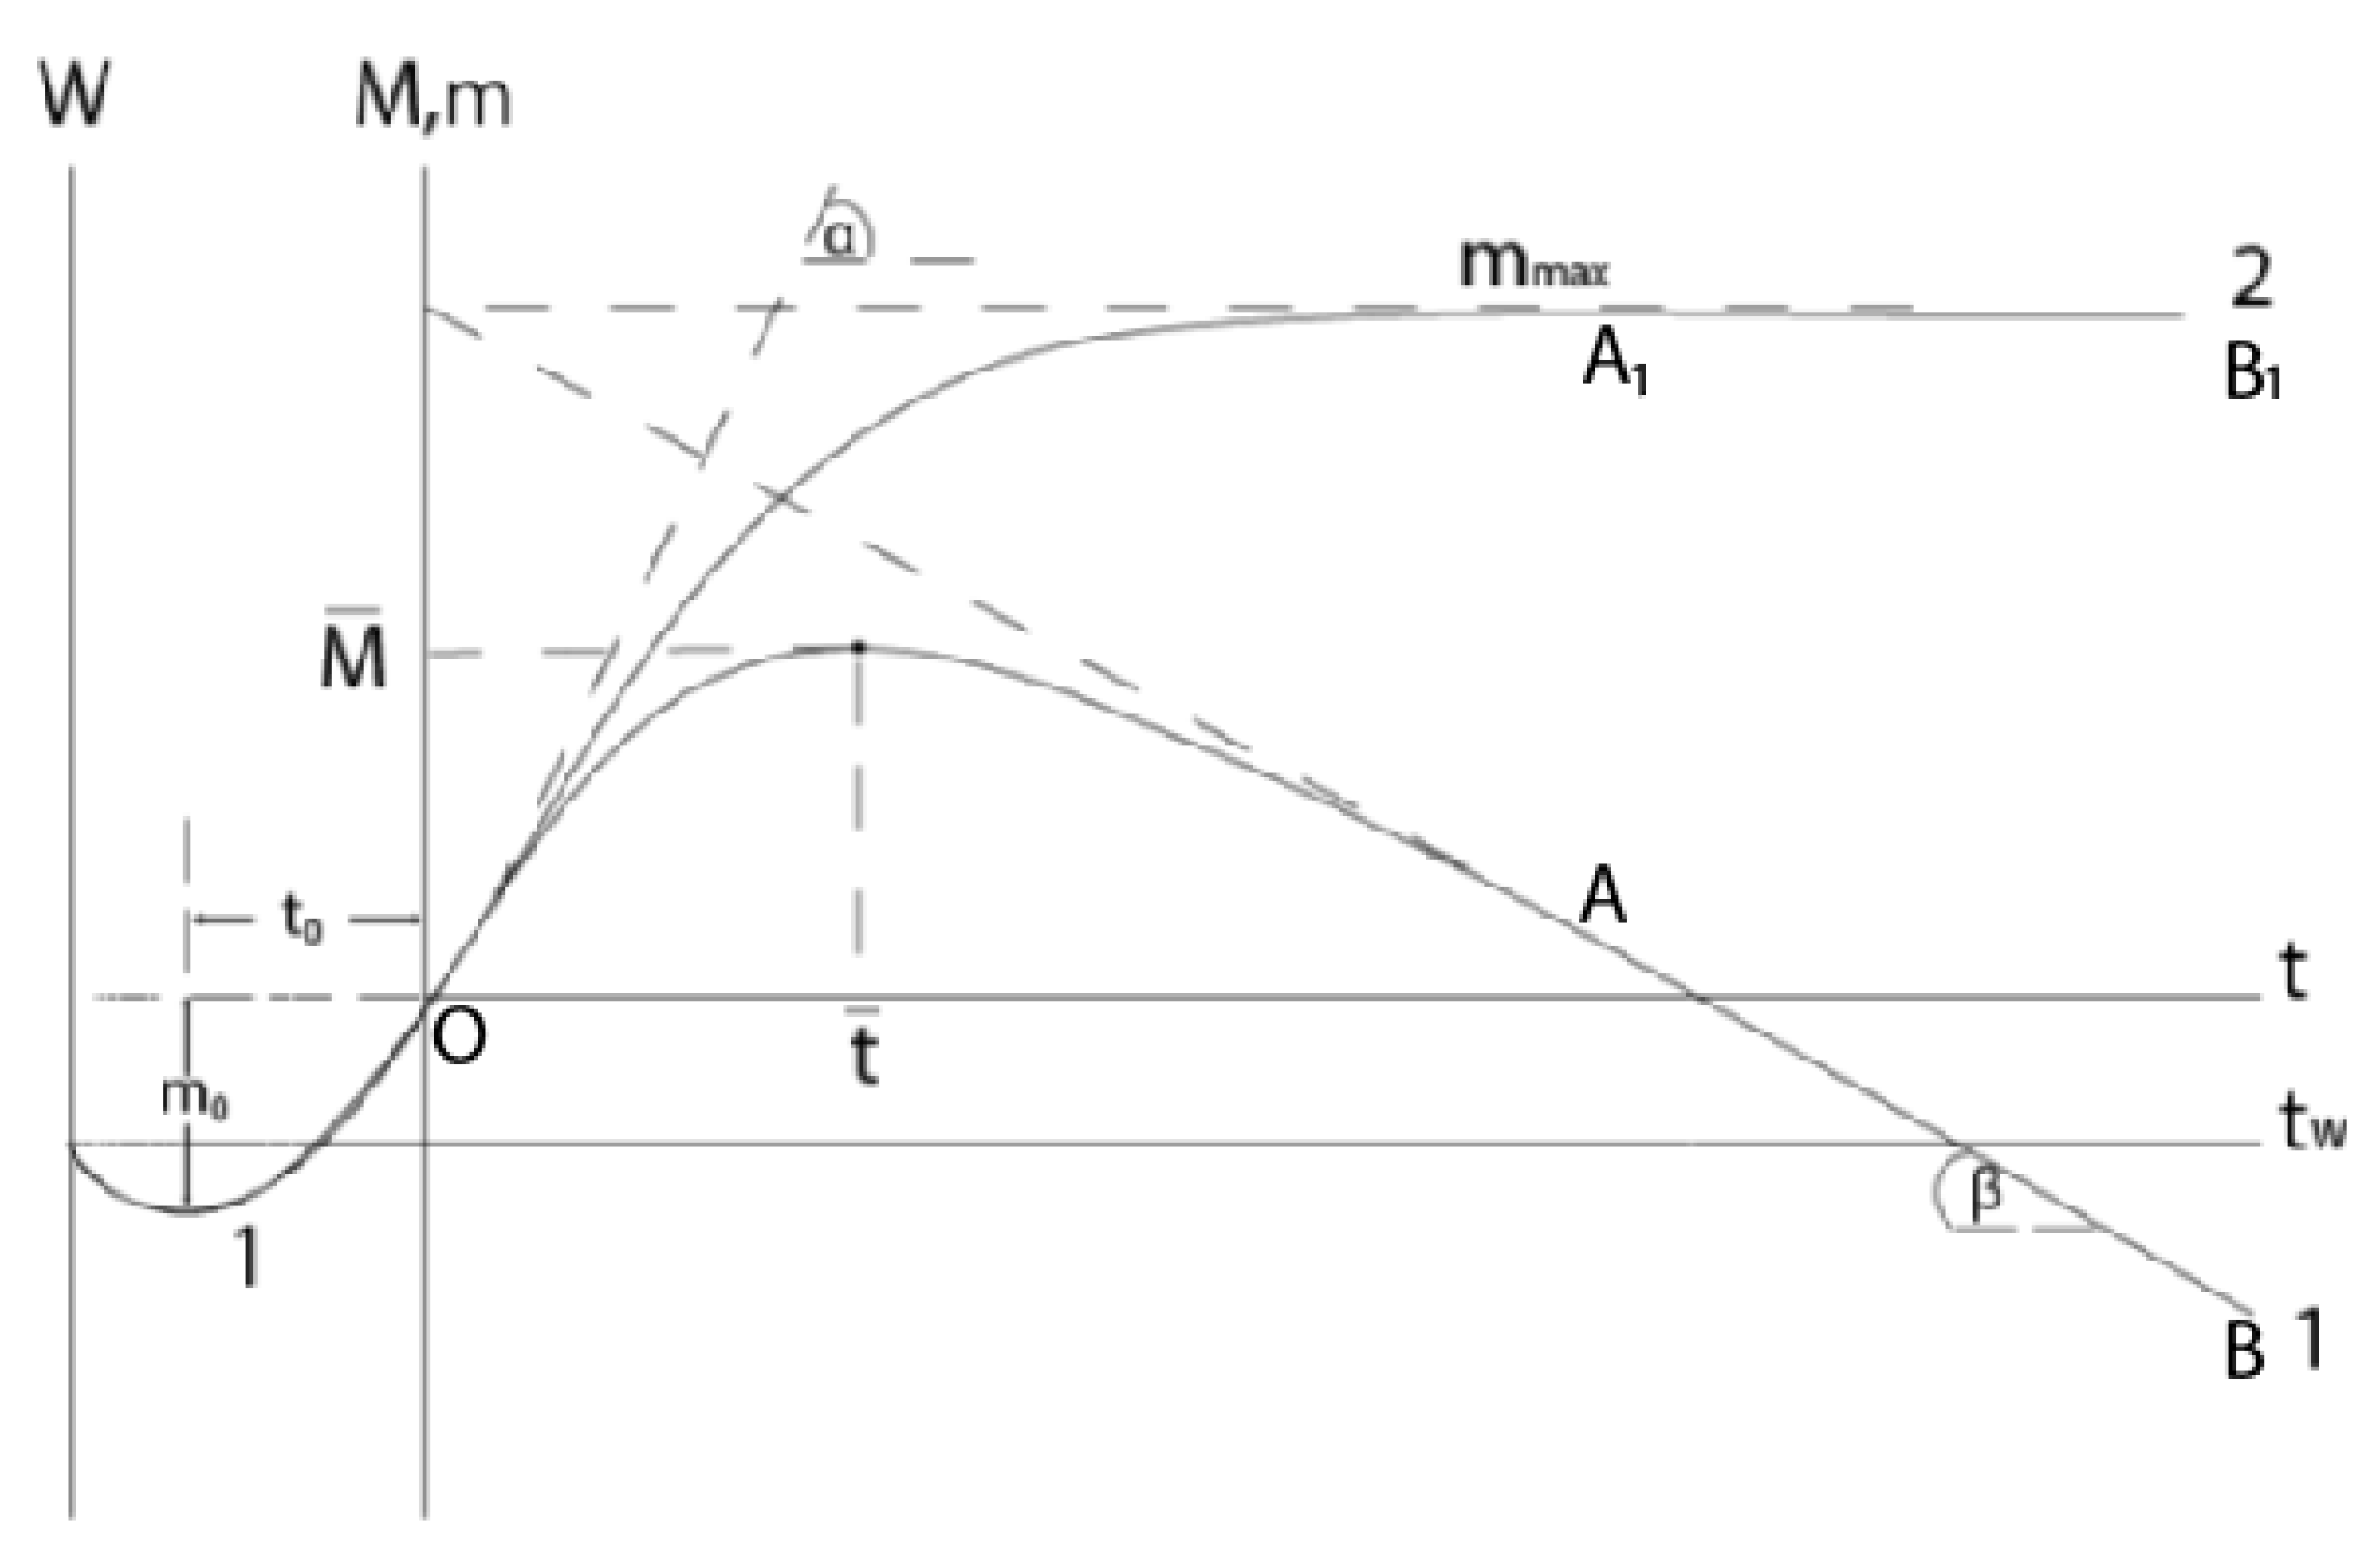
Figure 2.
Kinetic curves: (1) for reaction Cr+2HCl=CrCl2+H2 at 750oC [21] and (2) 4Cr+3O2=2CrO3 at 1200oC [20]; 1’,2’ – dependences m – t.
Figure 2.
Kinetic curves: (1) for reaction Cr+2HCl=CrCl2+H2 at 750oC [21] and (2) 4Cr+3O2=2CrO3 at 1200oC [20]; 1’,2’ – dependences m – t.
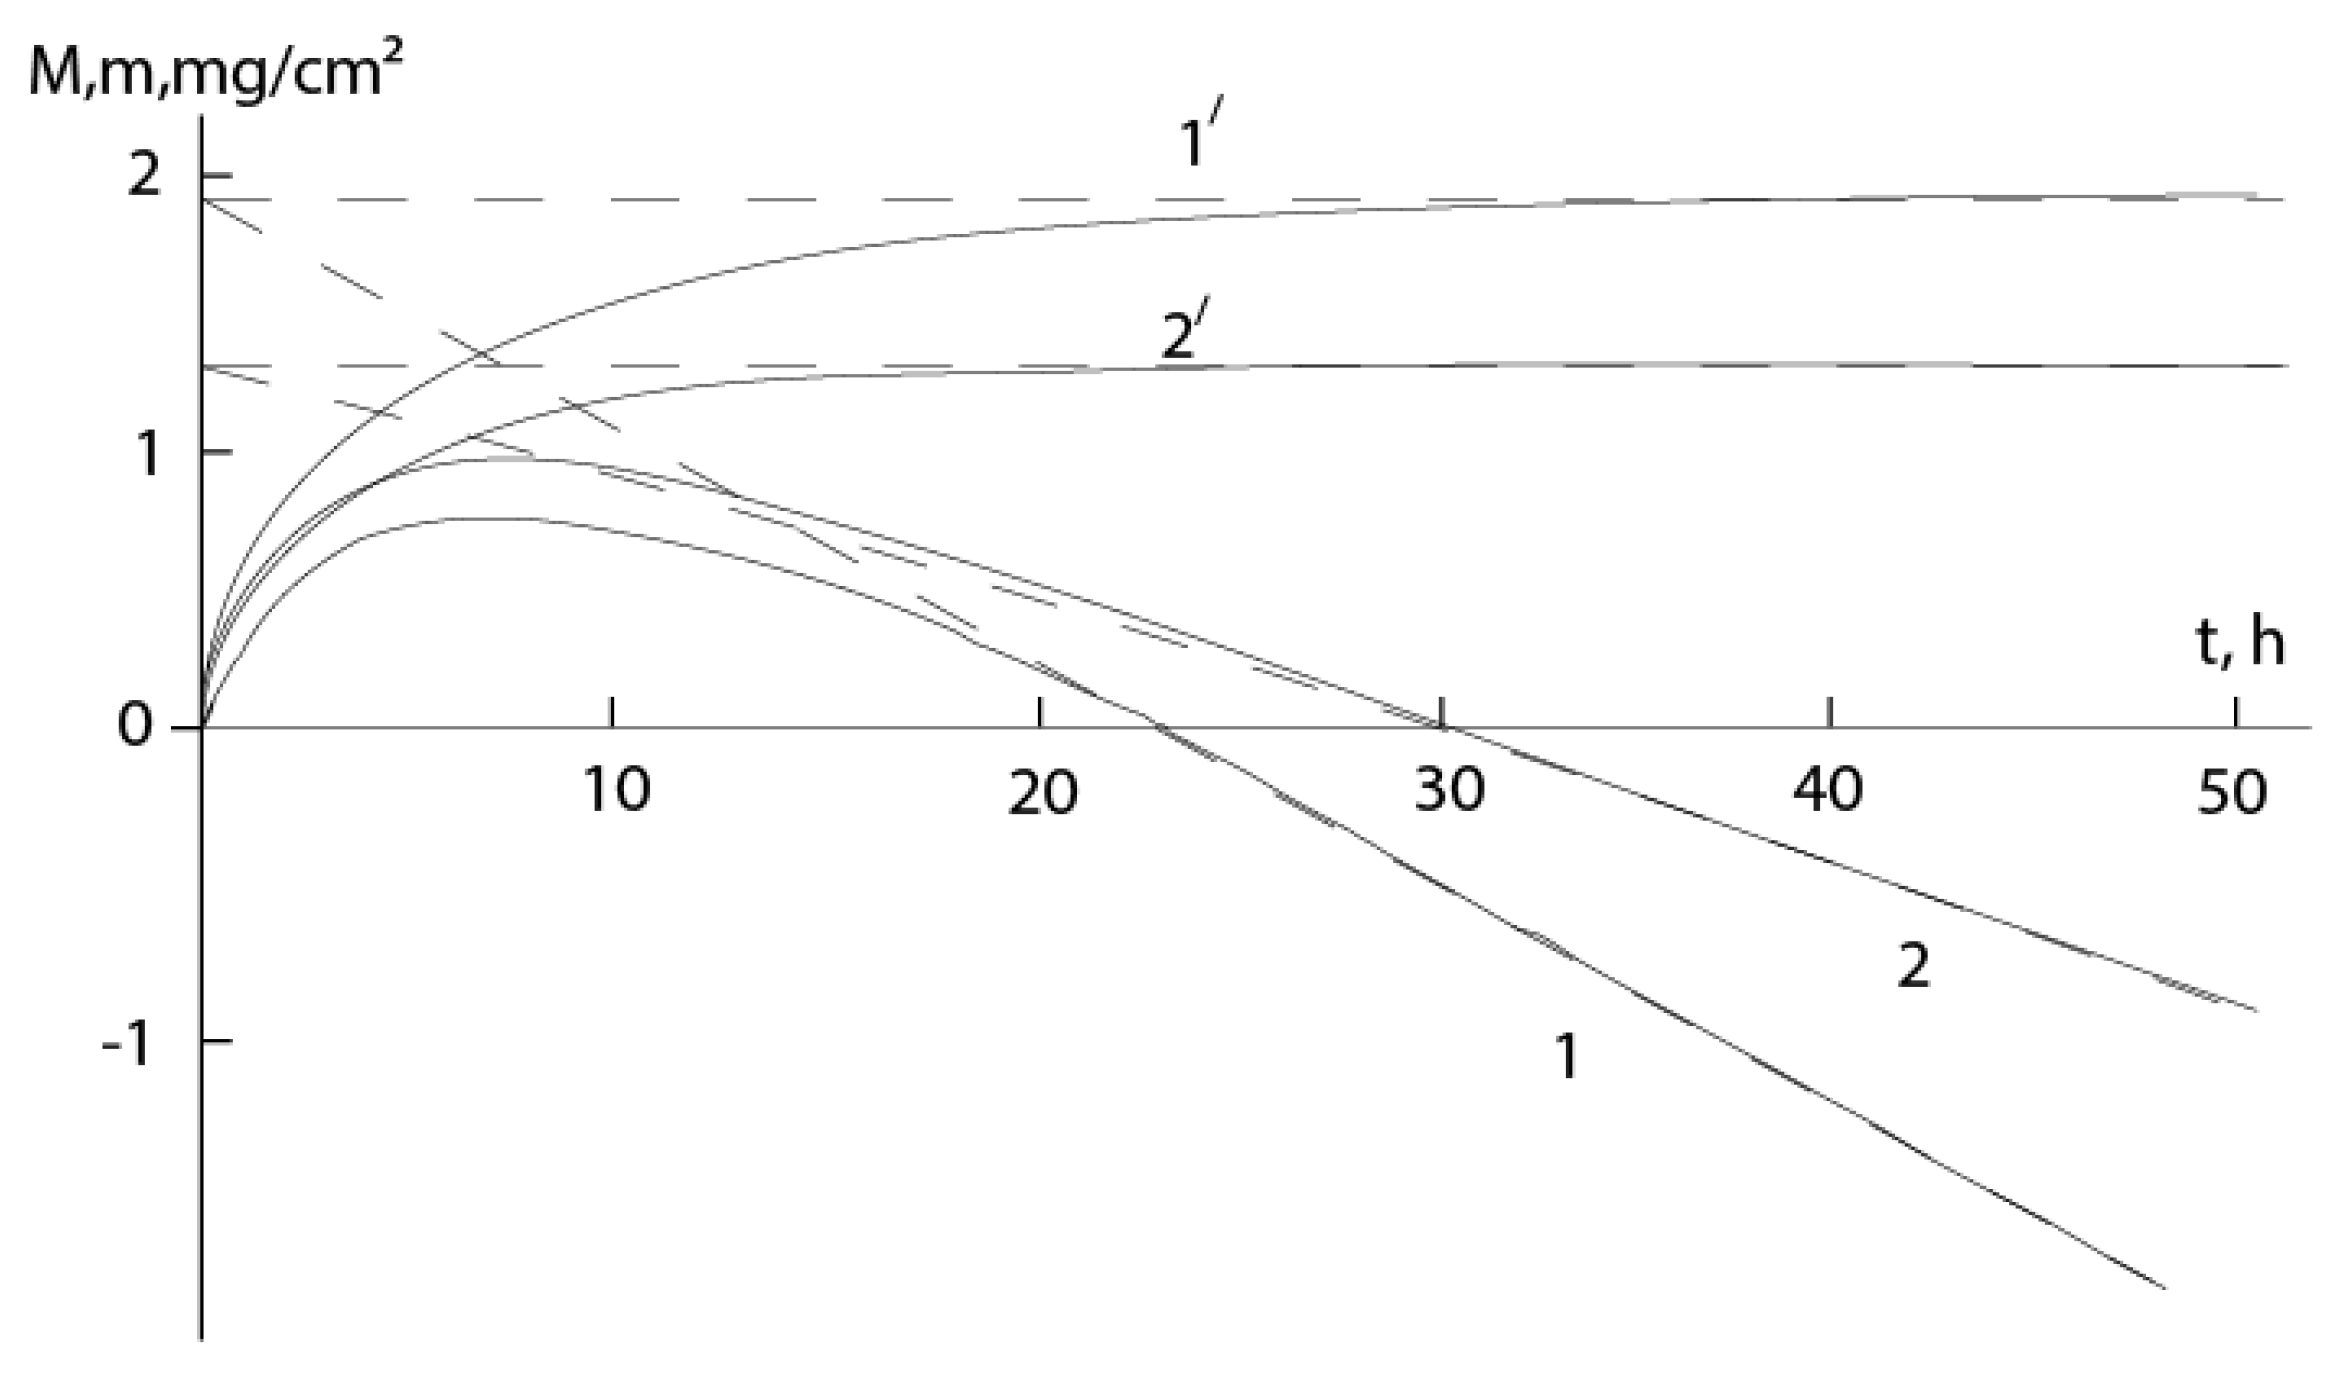
Figure 3.
Dependence – kp/vg for different samples.
Disclaimer/Publisher’s Note: The statements, opinions and data contained in all publications are solely those of the individual author(s) and contributor(s) and not of MDPI and/or the editor(s). MDPI and/or the editor(s) disclaim responsibility for any injury to people or property resulting from any ideas, methods, instructions or products referred to in the content. |
© 2024 by the authors. Licensee MDPI, Basel, Switzerland. This article is an open access article distributed under the terms and conditions of the Creative Commons Attribution (CC BY) license (http://creativecommons.org/licenses/by/4.0/).
Copyright: This open access article is published under a Creative Commons CC BY 4.0 license, which permit the free download, distribution, and reuse, provided that the author and preprint are cited in any reuse.


