
Submitted:
22 April 2024
Posted:
23 April 2024
You are already at the latest version
Abstract
The rebound behaviors of rubber balls based on ethylene-propylene-diene monomer (EPDM) / chlorinated butyl rubber (CIIR) blends were investigated systematically. A novel method was proposed to characterize the damping capacity of the EPDM/CIIR blends. The damping capacity can be represented by the rebound height of rubber balls, and lower rebound height corresponds to better damping capacity. A mathematical model expressed by an equation obtained through theoretical derivation has been proposed to predict the rebound height of the rubber balls. The energy dissipation rate (EDR) defined by the ratio of the height loss to the rebound time was proposed to further characterize the damping capacity. The EDR value shows the highest for the pure CIIR and lowest for the pure EPDM, showing a decrease trend with the increase of EPDM content in the rubber blends. By comparison one can obtain that the damping capacity of the EPDM/CIIR blends decreases with the decrease of external excitation, the conclusion of which plays a key role in the formulation design of viscoelastic damping rubber materials.
Keywords:
damping capacity
; energy dissipation rate
; EPDM/CIIR blend
; characterization method
1. Introduction
Rubber materials play an essential role in modern technologies, and damping is one of the most critical applications [1,2,3]. Experimental testing methods are significant in the research of damping materials [4,5,6]. The following are the relevant theories and testing methods proposed in the industry.
The damping performance of rubber materials is an important characterization index, and the Kelvin Vogt, Maxwell, and Zener linear viscoelastic models can characterize the damping performance of materials with very few parameters. However, these models are only theoretical models proposed under ideal conditions and cannot effectively reflect the mechanism of energy dissipation.
P. A. L. S. Martins first proposed The Martins’s model to fit experimental data. The fitting accuracy of the experimental stress–strain relation to the theoretical one, for both soft tissues and silicone-rubber (typically nonlinear) is evaluated. D Huri established the material constants for Mooney-Rivlin and Yeoh model. Three term Yeoh model showed better agreement with the test data than the one term formula. Beomkeun Kim Compared Neo-Hookean model, Mooney-Rivlin model, and Ogden model. The research is shown that Mooney-Rivlin model and Ogden model can be used for Chloroprene Rubber in the specific ranges for Isotropic Hyperelastic model. FA Denliv proposed a Data driven hyperelasticity approach for the constitutive modeling of rubberlike materials. It enables direct use of experimental data for the construction of the stress-strain response with out need of a specific analytical expression for the strain energy density function.
In 1972, Wright used a sinusoidal force to excite beams in free-free conditions and measured the displacement using a contactless optical probe. Damping is then measured by recording the oscillation decay [11].
Guild and Adams believed that the clamping pressure of the coil on the beam might introduce cracks during the test of the instrument used by Adams and Bacon, thereby increasing the damping capacity and causing errors [13]. They propose two new apparatuses, one for free-free vibration and one for cantilever vibration. The coil clamp was improved to be stiffer to exclude spurious contributions to damping. Specific Damping Capacity (SDC) was calculated using Adams and Bacon’s same method, and the trends of the two methods were found to be similar.
After verification, Talbot and Woodhouse found that laminate theory can accurately predict elastic behavior and generalized it to the prediction of damping characteristics, but the accuracy is only 30% [14].
The mechanism of modal damping at work in laminated FRP (fiber-reinforced polymer) composite panels was studied by Maheri. It was shown that the extent of the variation of modal damping over a range of modes and boundary conditions is generally a function of the extent of the variation of the laminate’s stiffness concerning direction [15]. In a follow-up study, the same effect was observed [16].
D.G.Fradkin first defined the damping function D.F. to quantitatively analyze the relationship between molecular structure and damping capacity, which is defined as . Later, M.C.O.Chang et al. used the area LA under the linear loss modulus E”-T curve and the area under the loss factor tanδ-T curve TA to describe the damping capacity of the material [17,18].
In this work, the effect of different raw rubber ratios on the vulcanization characteristics and damping capacity was studied, and a phenomenological method to characterize the damping capacity of rubber was proposed according to the rebound behavior of rubber balls, expecting to provide a new method for the characterization of damping materials.
2. Experimental
2.1. Materials
The EPDM (ethylene content, 48 wt%; ENB content, 4.1 wt%; Mooney viscosity ML [1 + 4] 125 °C, 28) used in this research was supplied by Mitsui Chemical, Japan. Chlorinated butyl rubber (CIIR, CBK 139, with isoprene content of 0.5 ~ 2.5 mol% and chlorine content of 1.25 wt%) was provided by Exxon Mobil Corporation. Carbon black N550 was offered by Cabot Co., Ltd. Paraffin oil was supplied by Sunoco Petroleum, and the density at 15 °C is 0.899 g/cm3, the relative molecular weight is 720, the aromatic carbon mass fraction is 0.05, the naphthenic carbon mass fraction is 0.28 and the alkane carbon mass fraction is 0.67. Zinc oxide, stearic acid, and sulfur were provided by Rhein Chemie Co., Ltd. Anti-aging agent 4020 (N-1,3-dimethylbutyl-N’-phenyl-p-phenylenediamine) and accelerator DM (2,2’-dibenzothiazoledisulfde) were obtained from commercial sources.
2.2. Experimental Formula
The experimental formula is shown in Table 1.
2.3. Sample Preparation
The ingredients were weighed according to Table 1 with the filling factor of 0.8. EPDM/CIIR blends were first mixed in an internal mixer (RM-200C, Harbin Hapu Electric Technology Co., Ltd.) at 55 °C for 1 min with a rotor speed of 60 rpm. Then, additives except crosslinking agents were added and mixed for 0.5 min. And then, half of the carbon black and softener were added and mixed for 1min. The remaining carbon black and softener were added and mixed for 3.5 min. The total mixing time was kept at 6 min. The blends were taken out of the mixer and processed into sheets at 50 °C with crosslinking agents on a laboratory two-roll mill (BL-6175-AL, Baolun Precision Testing Instrument Co., Ltd.) with a roller speed ratio of 1:1.2 and then kept at room temperature for 24 h before curing. Curing time was determined by a Moving Die Rheometer (MDR2000, ALPHA Technologies, America). The rubber balls with a diameter of 30 mm were cured under the pressure of 10 MPa at 175 °C with the optimal curing time.
2.4. Characterization Methods
The vulcanization characteristics of the rubber blends at 175℃ was measured with MDR test. The relationship between the loss factor (tanδ) and the measurement frequency was measured by a dynamic thermomechanical analyzer (GABO Explor®500N, NETZSCH, Germany).
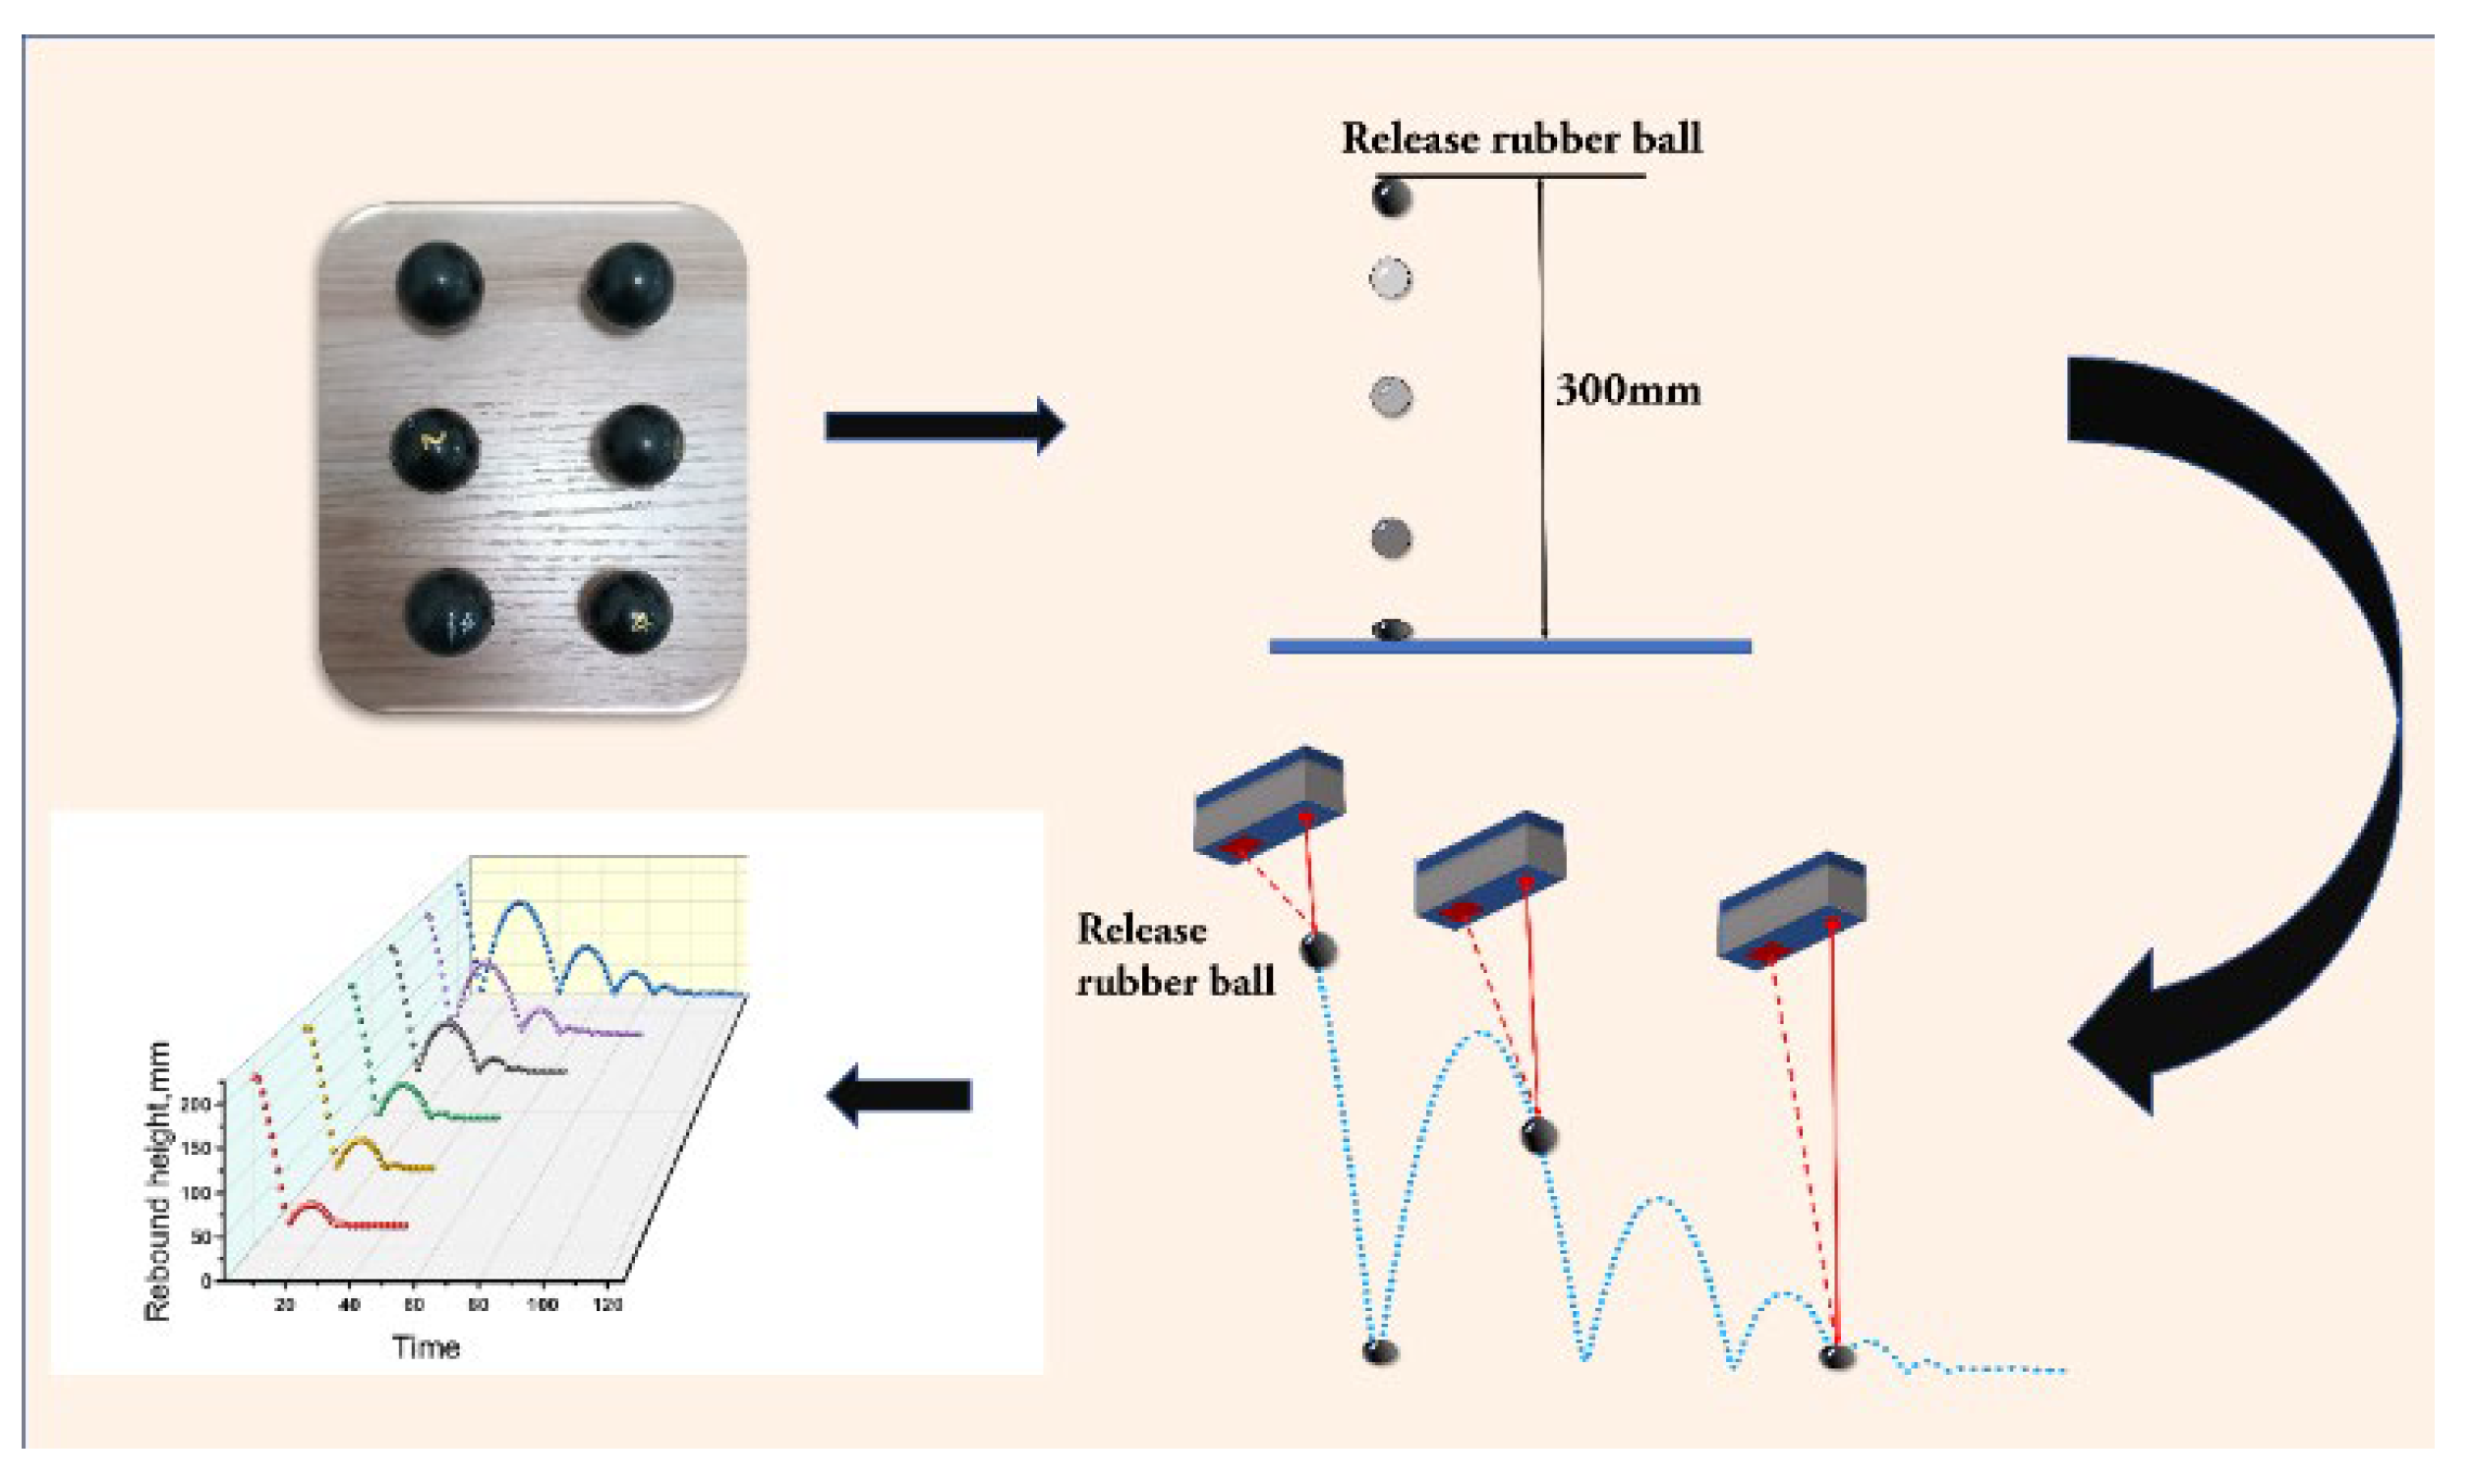
The prepared ball was placed 300mm away from the ground below the laser displacement sensor (HG-C1000, Panasonic Shenshi Electronics (Suzhou) Co., Ltd.), and the laser displacement sensor was used to collect the displacement information of the rubber ball. The schematic diagram of the device and the rubber ball rebound behavior testing process is shown in Figure 2. The diameter of the rubber ball is 30mm. The laser displacement sensor samples 98 times per second, that is, the interval between the two points collected by the sensor is 1/98 s.
3. Results and Discussions
3.1. Curing Characteristics
The combination of more than two different rubbers are frequently used which can improve the deficiencies of existing rubber performance [19,20,21,22,23]. The vulcanization characteristics of EPDM/CIIR blends are shown in Figure 1.
As can be seen from Figure 1, CIIR has the fastest curing speed (minimum t90 value) but the lowest torque value. On the contrary, EPDM has the highest torque value but quite slow curing speed. It is one of the main purposes of blending CIIR and EPDM to simultaneously obtain higher curing speed and torque, which can be beneficial to improve the performance of terminal products.
3.2. Damping Characteristics
Damping Mechanism of Rubber Materials
The conformation and conformational entropy change significantly when the macromolecular rubber chain is subjected to force, and part of the energy input from the outside is stored. At the same time, the macromolecular chains rub against each other when they move under the action of external force, converting energy into heat and dissipating it to the outside world. The dissipation of this energy is called damping capacity. Therefore, when the energy input into the system from the outside is known, it is only necessary to measure the energy stored in the system and subtract the energy stored in the system from the energy input from the outside to obtain the energy lost by the system.
The gravitational potential energy of a rubber ball of mass m at height h0 is,
m—mass of the rubber ball
g—gravitational acceleration
h0—the height of the rubber ball when it is released
hi—the nth rebound height of the rubber ball
The gravitational potential energy transforms into kinetic energy when the rubber ball falls. The rubber ball will undergo macroscopic deformation due to the action of external force once the ball touched the ground. Microscopically, the macromolecule segments are forced to move, resulting in the friction occurring between adjacent molecular chains. For the filled rubber system, there are frictions contributed from the interaction of molecular chain and filler and of filler and filler [24]. Due to the internal friction of the rubber ball, it can only reach the height of h1 (h1 < h0) when it rebounds upward from the ground. At this time, the gravitational potential energy of the rubber ball becomes,
Therefore, during the first rebound, the energy loss of the rubber ball is,
Therefore, the energy loss of a rubber ball in a rebound process is directly proportional to the difference between the initial and final height. The rubber ball will then repeat the above process until it stops due to energy depletion.
Figure 2 shows the rebound experimental device of the rubber ball, which is composed of a laser sensor connecting to a computer. A rubber ball is placed under the sensor and the released rubber ball will move vertically up and down reciprocally. At the same time, the device captures the motion track of the rubber ball and displays it on the computer.
Figure 2.
Schematic diagram of rubber ball rebound experiment process and experimental device.
The rebound behaviors of EPDM/CIIR blends are shown in Figure 3. The curve on the left of the wave peak represents the process of the rubber ball rebounding back from the ground to reach the highest point, and the curve on the right of the wave peak represents the process of the rubber ball falling from the highest point to reach the ground. Hence, the number of wave peaks indicates the rebound times of the rubber ball. In the end, the curve becomes a straight line, meaning that the rubber ball has been completely stationary, and the value of the vertical coordinate at this time indicates the diameter of the rubber ball. Two key points need to be emphasized here. Firstly, the release height of the ball is 300mm, which has exceeded the range of the sensor, and Figure 3 only shows the data from 0 to 200mm. Secondly, the horizontal coordinate of Figure 3 indicates the sampling point (which actually means the movement time of the ball), rather than the lateral movement of the ball during the rebound process. In summary, the rebound height, the number of rebound times, and the rebound time (the time experienced by the rubber ball from falling to a complete stop) of the rubber ball can be obtained from Figure 3.
The Deformation Process of Rubber Ball
It is necessary to analyze the deformation process of the rubber ball in contact with the ground because the energy dissipation occurs in this process.
σ(t)—Stress in the rubber ball during deformation
ε(t)—Strain in the rubber ball during deformation
F(t)—The force on the rubber ball during the deformation
A—Area of the rubber ball in contact with the ground during deformation
x(t)—Travel distance of rubber ball vertices
d—Diameter of rubber ball
Figure 4 shows the deformation process of the rubber ball. The rubber ball experiences a negative acceleration a(t) when it contacts the ground. The force acting on the rubber ball is F(t). Equation (4) can be obtained according to Newton’s formula,
The force F(t) causes strain ε(t) and stress σ(t) of the rubber ball. When it is linearly deformed. The following Equation (5) is obtained where A(t) is the contacting area between the ball and ground.
E(t)—Modulus of rubber balls
The acceleration a(t) corresponds to the second-order derivative of the deformation distance, which has the following Equation (6),
Deformation of strain ε(t) is approximately obtained by the ratio of the deformation distance at the top of the rubber ball to the diameter of the ball, as depicted in Equation (7),
Equations (4)–(7) constitute a description of the deformation motion of the rubber ball when it contacts the ground.
By substituting Equation (5) and (6) into Equation (7) one can obtain Equation (8), which can be solved when both E(t) and A(t) are known. E(t) varies with the type and proportion of the constituents in the rubber ball, and the magnitude of modulus E(t) affects the change of contact area A(t). The lower the modulus E(t), the larger the deformation of the rubber ball and thus the larger the contact area. The Equation (8) can be solved by the contact area A(t) and the modulus E(t), i.e., the deformation frequency of the rubber ball on contacting the ground. This means that the deformation frequencies of rubber balls differ for different materials even if the rubber balls are released at the same height. In summary, the rebound height of the rubber ball indicates the damping capacity of the rubber under a specific external excitation (the magnitude of the excitation is determined by the release height of the rubber ball), rather than the damping capacity at a specific frequency.
Additionally, the first rebound height of the pure EPDM ball is the highest, while the pure CIIR ball is the lowest (Figure 3). The rebound height decreases with the increase of CIIR content, indicating that the pure CIIR ball dissipates the most energy in the deformation process and has the greatest damping capacity due to the dense side methyl groups in the molecular chains of chlorobutyl rubber. The intense friction and strong energy dissipation between the CIIR molecular chains occur under external action. For the case of EPDM, however, the small number of methyl groups in the highly regular molecular chains result in less energy dissipation under external force, and thus the rebound height of the EPDM ball is the largest.
There are two ways to solve Equation (8). The first one is the finite element method, which is discussed in detail in the paper by R. Weiss. The second approach is to use constants to approximate the time-related parameters. Wrana analyzed the deformation process of a rubber ball in contact with the ground. The contact area A(t) and the modulus E(t) were hypothesized as constant values and the frequency of the periodic deformation of the rubber ball was further derived, as shown in Equation (9).
ω—The frequency of the periodic deformation
E0—Young’s modulus of rubber materials
ρ—Density of rubber balls
d—Diameter of rubber ball
The frequency of the deformation of the rubber ball is related to E0, ρ and d. The rebound height of the rubber ball can be predicted by combining the master curve of the material at 20 °C and bringing the relevant parameters into Equation (9).
The method of approximating the variables as constants allowed the researchers to obtain the rebound height of the rubber ball only over a relatively wide range of frequency. In this paper, we propose a method to predict the rebound height of rubber balls from another perspective.
3.3. Prediction of the Rebound Height
According to the literature [25], when the rubber ball falls at the same height, the energy dissipated can be approximated as a loss factor tanδ with the following Equation (10).
Then, Equation (11) is readily obtained by transforming Equation (10).
Multiplying both sides of Equation (11) by x one can obtain Equation (12).
Obviously, the following Equation (13) must be true.
Hence, Equation (14) is obtained by adding Equation (12) to (13).
Equation (15) is then obtained from simple transformation of Equation (14).
Among them, making
x—Mass fraction of rubber 1 in the raw rubber system of the blends.
y—Mass fraction of rubber 2 in the raw rubber system of the blends.
tanδ1 and tanδ2—Loss factors of rubber 1 and 2 at the same frequency, respectively.
tanδ3—Loss factor of blends composed of rubber 1 and 2.
Δh1 and Δh2 —The height differences before and after the rubber 1 and 2 ball rebound, respectively.
Equation (16) describes the loss factor of the blends as a function of the loss factor of the pure rubber.
The loss factors of pure rubber and blends were tested at frequency from 1 Hz to 100 Hz at room temperature. The loss factors of the rubber blends were predicted and compared according to Equation (16). The results are shown in Figure 5.
The loss factors of the rubber blends with EPDM content of 20wt%, 40wt%, 60wt% and 80wt% were predicted and correlated with frequency. The predicted values follow the same tendency with the experimental results even though they keep slightly higher than the measured data. In the same way, ∆h of the rubber ball should also follow the corresponding law. Thus, Equation (17) can be obtained.
By a simple conversion, it can be deduced that the rebound height of the rubber ball also conforms to Equation (17), and thus Equation (18) is obtained.
hi—First rebound height of the rubber ball with EPDM content i in the raw rubber system.
hE—The first rebound height of pure EPDM ball.
hC—The first rebound height of pure EPDM ball.
x—Mass fraction of EPDM in raw rubber i.
y—Mass fraction of CIIR in the raw rubber (1-i).
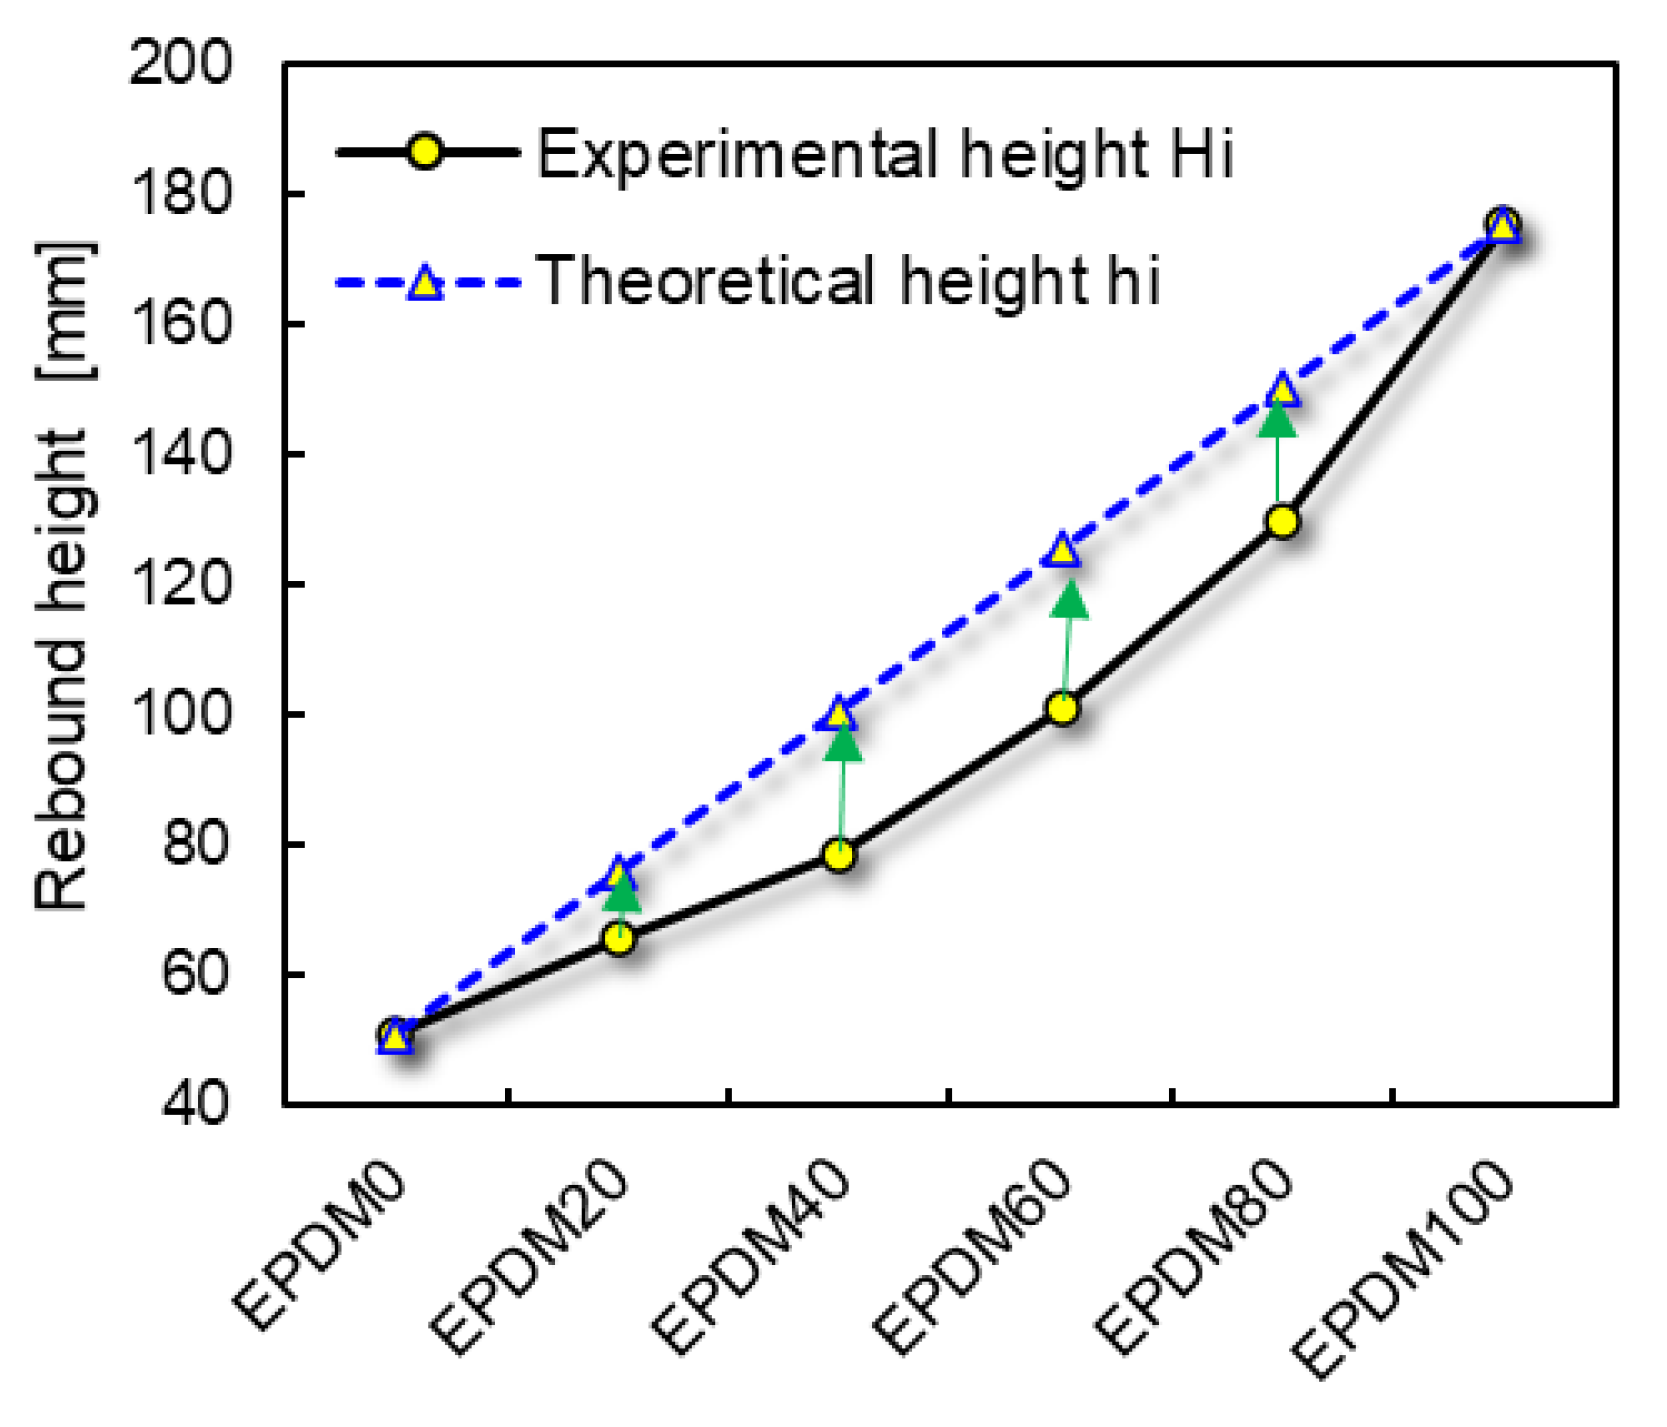
The rebound heights of the theoretical (hi) and measured (Hi) values and the difference between Hi and hi for the rubber balls are listed in Table 2.
The difference of the theoretical and measured rebound heights (hi-Hi) firstly increases and then decreases with the increase of EPDM content in the raw rubber system. In other words, the larger the difference between the two rubber ratios, the lower the error of the Equation (18).
The deviation of the theoretical rebound height can be explained by the following reasons. The migration of the vulcanizing agent due to the different solubility in EPDM and CIIR leads to a change in the crosslinking density of the two rubber phases in blends compared with that of the pure rubber [26]. The rubber phase with high solubility to the vulcanizing agent moves to a higher glass transition temperature (Tg) because the crosslinking density becomes larger, the chain segment movement becomes more impeded and the free volume is thus further reduced. The Tg of the other rubber phase moves to lower temperatures, hence the damping capacity of the rubber blend changes.
Thus, Equation (18) presupposes that the crosslinking density of the two rubber phases in the rubber ball with EPDM content i is the same as that of the respective single rubber. In this work, the different solubility of the vulcanizing agent in the two rubber leads to changes in the crosslinking density of the two rubber phases in the blends, which causes changes in the damping properties [27]. This is the reason for the deviation of the measured rebound height from the theoretical calculation. Therefore, a modified Equation (19) is obtained by adding a correction term c into Equation (18) as following.
c denotes the difference between the theoretical dynamic mechanical properties and the actual dynamic mechanical properties of the material with EPDM content i. In this experiment, the predicted loss factor is smaller than the actual one.
As discussed above, we have got the knowledge that the rebound height represents the damping capacity of the rubber ball under specific excitation (the value of the excitation is determined by the release height of the rubber ball). In other words, each ball receives the same excitation when it falls at the same height. The deformation frequencies, however, are varied with the rubber balls of different blending ratios. In addition, it is difficult to determine the value of the correction term c based on the frequency-dependent measurement data at room temperature because the deformation frequency of the ball is hard to determine.
Figure 6.
Theoretical and measured rebound heights of the rubber ball.
In order to determine the value of c, the method of taking the average value is adopted in this paper.
Assume that,
Then, Equation (21) is obtained.
Actually, the correction term c is determined by various factors, the nature of rubber and formulations for examples, and thus it reveals various values for different kinds of rubber blends which will be discussed in detail in the follow-up work. Equation (21) provides a simple method to predict the damping capacity of a rubber that is measured by the rebound height and plays a key role in the formulation design of viscoelastic damping rubber materials.
3.4. Rebound Time of the Rubber Ball
The maximum heights of the rubber balls rebounding to the highest point at the first time are different for various rubber blends, and hence the deformation frequency and external excitation of the ball falling to the ground again are different, resulting in a series of different rebound heights subsequently (Figure 7). The peaks indicate the highest rebound points of the rubber balls. The difference between the horizontal coordinates of the nth peaks of different balls represent the difference of the time elapsed(∆t) between the two balls when they reach the highest point for the nth time.
As shown in Figure 7 again, the distance between the two peaks increases with the increase of the rebound times of the rubber ball. It means that the rubber balls based on different rubber blends experience different rebounding time even though the number of rebounds is identical. Therefore, the rebound time of rubber balls is also an important parameter to characterize the damping capacity of materials. The shorter the rebound time, the faster the rubber ball dissipates energy, that is, the better the damping capacity.
The difference between the initial height of the rubber ball and the ith rebound height (h0–hi) is defined as the height loss. What is noteworthy is that the height loss and the rebound time take no account of the specific bouncing process. The Energy Dissipation Rate (EDR) of the rubber ball can thus be defined and obtained from dividing the height loss by the rebound time (Figure 8).
The changes of EDR with time for the rubber balls based on different rubber blends are described in Figure 8. By longitudinally comparing EDR values of each sample with time we can find that both the EDR of the rubber ball and the time interval between each two data points decrease gradually. It can be concluded that the damping capacity decreases with the decrease of external excitation of the rubber ball when it falls within 300mm, and the time interval between two adjacent rubber balls reaching the highest point becomes smaller due to the gradual decrease of the rebound height during the bouncing process. It also indicates from Figure 8 that the EDR value shows the highest for the pure CIIR and lowest for the pure EPDM, showing a decrease trend with the increase of EPDM content in the rubber blends.
4. Conclusions
The damping mechanism, rebound behavior and deformation process of the rubber ball in contact with the ground are analyzed in detail. The rebound height represents the damping capacity of the rubber blends under a specific external excitation, the magnitude of which is determined by the release height of the rubber ball rather than the specific frequency. Under the experimental conditions, the determined damping capacity shows the highest value for the pure CIIR and the lowest value for the pure EPDM, revealing better damping performance with more CIIR content in the rubber blends. The prediction model is proposed and modified in the form of the equation to predict the rebound height of the rubber blends-based balls. The correction term in the equation represents the difference between the theoretical and the actual dynamic mechanical properties, which is caused by the difference in solubility of the vulcanization system in the two rubber phases.
The introduction of energy dissipation rate (EDR), defined by combining the height loss with the rebound time, can be employed to characterize the damping capacity of the rubber blends. The rubber products with more CIIR content would cause more energy loss and exhibit more effective in damping capacity.
Declaration of competing interest
The authors declare that they have no known competing financial interests or personal relationships that could have appeared to influence the work reported in this paper.
Data availability
Data will be made available on request.
Acknowledgments
This work was supported by China Automotive Technology & Research Center Co. Ltd. and the Key Laboratory of Rubber-Plastics of Ministry of Education.
References
- C. Huang, J. Yao, T. Zhang, Y. Chen, H. Jiang, D. Li, Damping applications of ferrofluids: a review, J. Magn. 22 (2017) 109-121. [CrossRef]
- C. Liu, J.F. Fan, Y.K. Chen. Design of regulable chlorobutyl rubber damping materials with high-damping value for a wide temperature range, Polym. Test. 79 (2019) 106003. [CrossRef]
- N. Choudhary, D. Kaur, Vibration damping materials and their applications in nano/micro-electro-mechanical systems: a review, J. Nanosci. Nanotechno. 15 (2015) 1907-1924. [CrossRef]
- M. Zatarain, C. Villasante, A. Sedano, R. Bueno, New light and highly-damped bonded structures for noise and vibration reduction, Cirp Ann. 53 (2004) 345-348. [CrossRef]
- T. Shoyama, K. Fujimoto, Direct measurement of high-frequency viscoelastic properties of pre-deformed rubber, Polym. Test. 67 (2018) 399-408. [CrossRef]
- M. Matsubara, T. Komats, R. Takara, M. Kobayashi, S. Furuta, K. Uesugi, A. Nagatani, S. Kawamura, D. Tajiri, Dynamic observation of a damping material using micro X-ray computed tomography coupled with a phase-locked loop, Polym. Test. 117 (2023) 107810. [CrossRef]
- Martins P, Natal Jorge R M, Ferreira A J M. A comparative study of several material models for prediction of hyperelastic properties: Application to silicone-rubber and soft tissues[J]. Strain, 2006, 42(3): 135-147.
- Huri D, Mankovits T. Comparison of the material models in rubber finite element analysis[C]//IOP Conference Series: Materials Science and Engineering. IOP Publishing, 2018, 393(1): 012018.
- Kim B, Lee S B, Lee J, et al. A comparison among Neo-Hookean model, Mooney-Rivlin model, and Ogden model for chloroprene rubber[J]. International Journal of Precision Engineering and Manufacturing, 2012, 13: 759-764.
- Denli F A, Kaliske M, Açan A K, et al. Data driven constitutive modelling of rubberlike materials[C]//Constitutive Models for Rubber XII: Proceedings of the 12th European Conference on Constitutive Models for Rubber (ECCMR 2022), September 7–9, 2022, Milano, Italy. CRC Press, 2022: 105.
- G.C. Wright, The dynamic properties of glass and carbon fibre reinforced plastic beams, J. Sound Vib. 21 (1972) 205-212. [CrossRef]
- F.J. Guild, R.D. Adams, A new technique for the measurement of the specific damping capacity of beams in flexure, J.Phys E Scientific Ins. 14 (1981) 355. [CrossRef]
- R.D. Adams, D.G.C. Bacon, Measurement of the flexural damping capacity and dynamic Young’s modulus of metals and reinforced plastics, J. Phys. D Appl. Phys. 6 (1973) 27. [CrossRef]
- J.P. Talbot, J. Woodhouse, The vibration damping of laminated plates, Compos. Part A-Appl. S. 28 (1997) 1007-1012. [CrossRef]
- M.R. Maheri, The effect of layup and boundary conditions on the modal damping of FRP composite panels, J. Compos. Mater. 45 (2011) 1411-1422. [CrossRef]
- J.Q. Li, Y. Narita, Analysis and optimal design for the damping property of laminated viscoelastic plates under general edge conditions, Compos. Part-B: Eng. 45 (2013) 972-980. [CrossRef]
- J.J. Fay, D.A. Thomas, L.H. Sperling, Evaluation of the area under linear loss modulus-temperature curves, J. Appl. Polym. Sci. 43 (1991) 1617-1623. [CrossRef]
- X.H. Shi, X.J. Yuan, X.H. Guo, F.Q. Zeng, G.Y. Liu, A new way to investigate the damping properties of NR/CIIR blends characterized by the rebound behaviors, Polym. Advan. Technol. 33 (2022) 3522-3531. [CrossRef]
- A. Nihmath, M.T. Ramesan, Development of novel elastomeric blends derived from chlorinated nitrile rubber and chlorinated ethylene propylene diene rubber, Polym. Test. 89 (2020) 106728. [CrossRef]
- Vayyaprontavida Kaliyathan, K.M. Varghese, A.S. Nair, S. Thomas, Rubber–rubber blends: A critical review, Prog. Rubber Plast. Re. 36 (2020) 196-242.
- S.C. Ambilkar, B.P. Kapgate, A. Das, S. Mandal, P.K. Maji, S. Singh, R. Kasilingam, R.S. Gedam, C. Das, Precise role of zirconia to boost up the mechanical, thermal, viscoelastic, dielectric, and chemical resistance properties of natural rubber-nitrile rubber blend, Eur. Polym. J. 194 (2023) 112163. [CrossRef]
- Q.N. Huang, Y. Liu, S.M. Li, M,Y. Zhu, T.F. Hao, Z.P. Zhou, Y.J. Nie, Blending polar rubber with polyurethane to construct self-healing rubber with multiple hydrogen bond networks, Polymer 246 (2022) 124768. [CrossRef]
- A.V. Kaliyathan, A.V. Rane, M. Huskic, M. Kunaver, N. Kalarikkal, D. Rouxel, S. Thomas, Carbon black distribution in natural rubber/butadiene rubber blend composites: Distribution driven by morphology, Compos. Sci. Technol. 200 (2020) 108484. [CrossRef]
- Z. Liu, Y. Wang, G. Huang, J. Wu, Damping characteristics of chlorobutyl rubber/poly (ethyl acrylate)/piezoelectric ceramic/carbon black composites, J. Appl. Polym. Sci. 108 (2008) 3670-3676.
- M. Doi, Introduction to polymer physics, Oxford university press: 1996.
- Thitithammawong, C. Nakason, K. Sahakaro, J.W.M. Noordermeer, Multifunctional peroxide as alternative crosslink agents for dynamically vulcanized epoxidized natural rubber/polypropylene blends, J. Appl. Polym. Sci. 111 (2009) 819-825. [CrossRef]
- X. Lu, X.J. Li, M. Tian, Preparation of high damping elastomer with broad temperature and frequency ranges based on ternary rubber blends, Polym. Advan. Technol. 25 (2014) 21-28. [CrossRef]
Figure 1.
Vulcanization characteristics of EPDM/CIIR blends: (a) curing curves; (b) optimal curing time t90.
Figure 1.
Vulcanization characteristics of EPDM/CIIR blends: (a) curing curves; (b) optimal curing time t90.
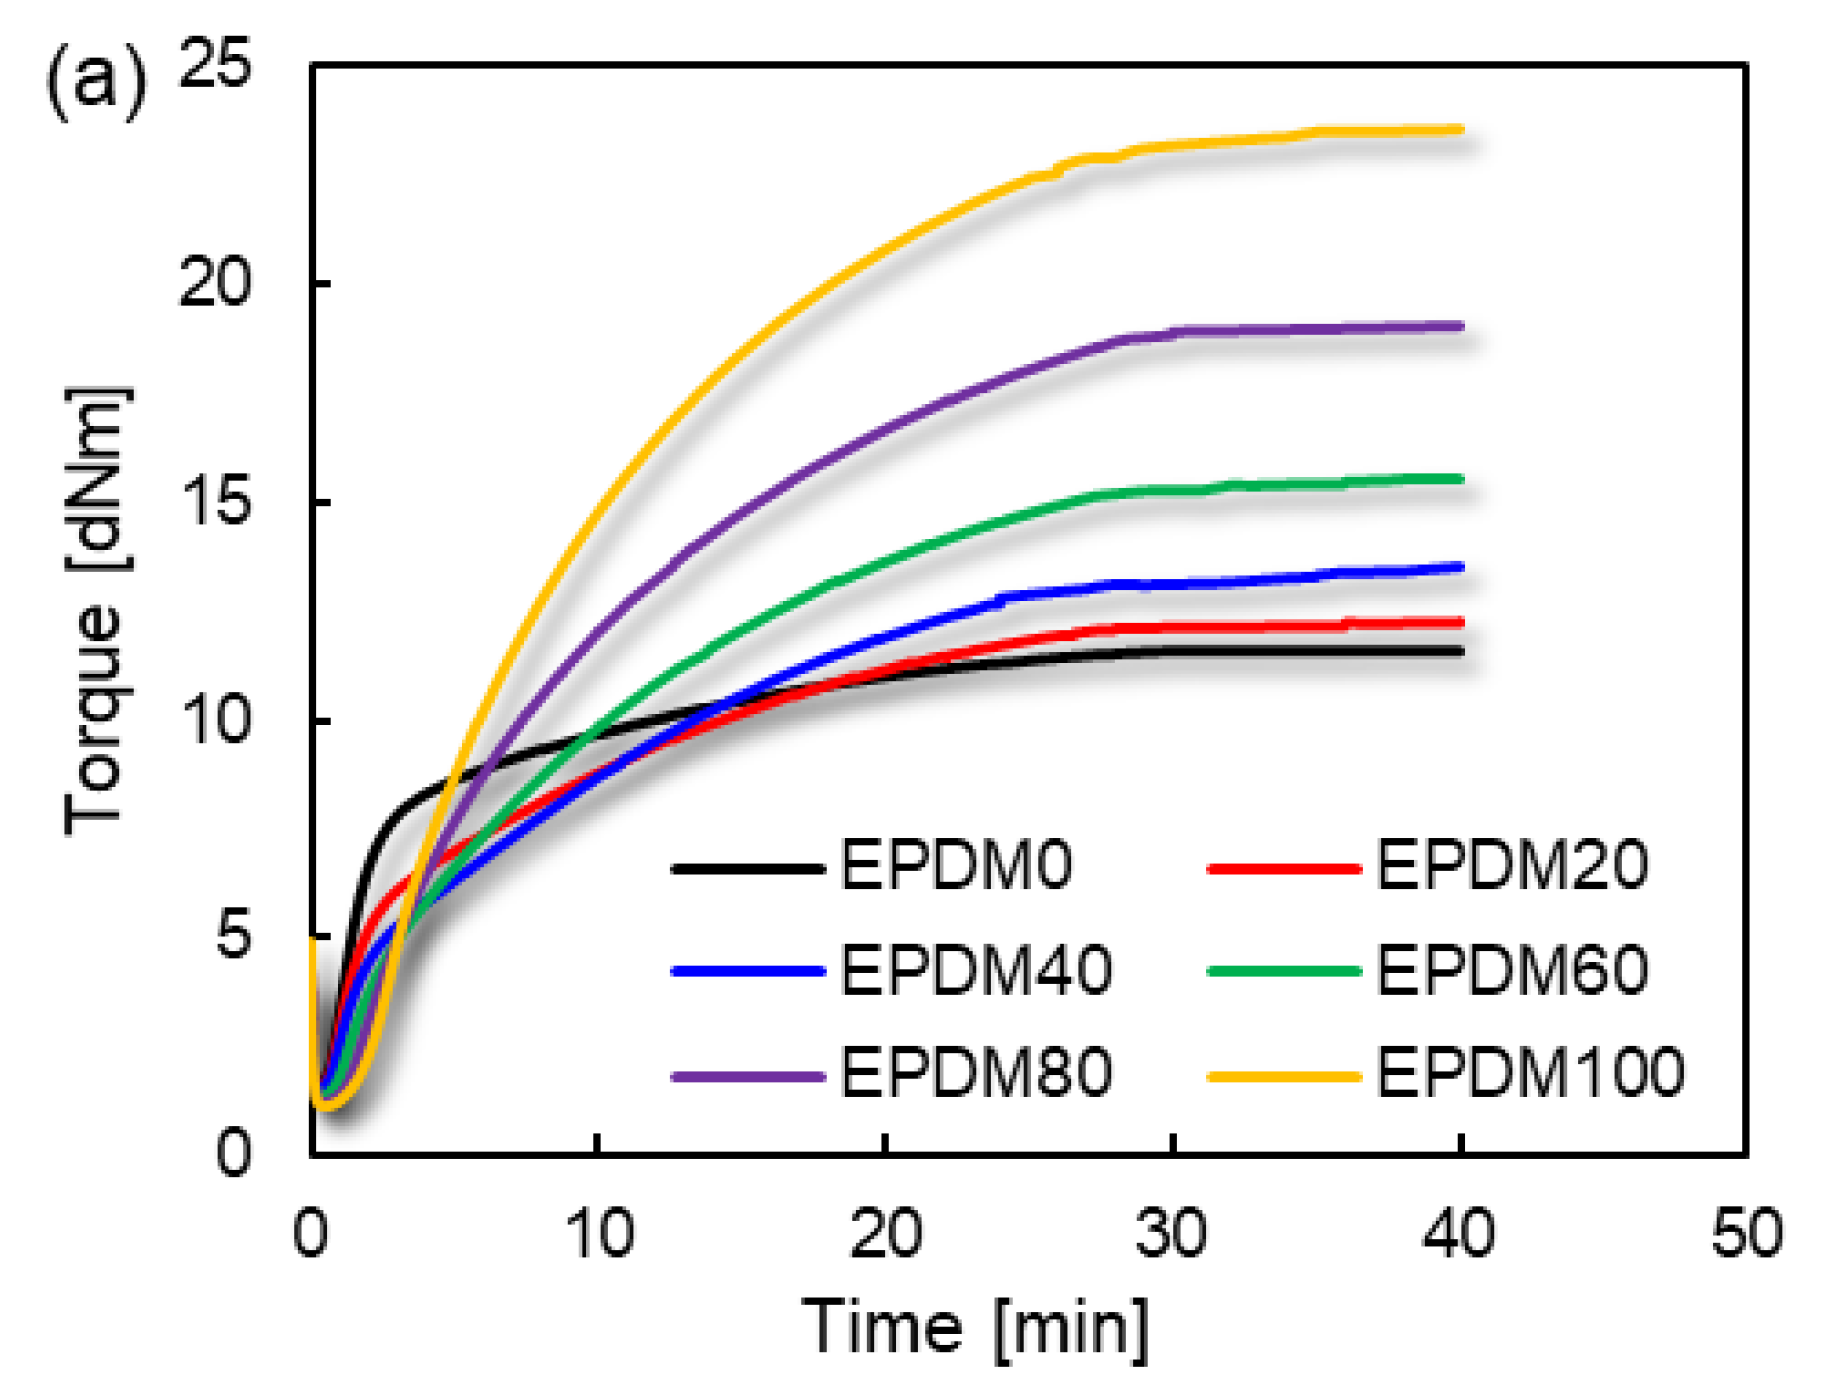
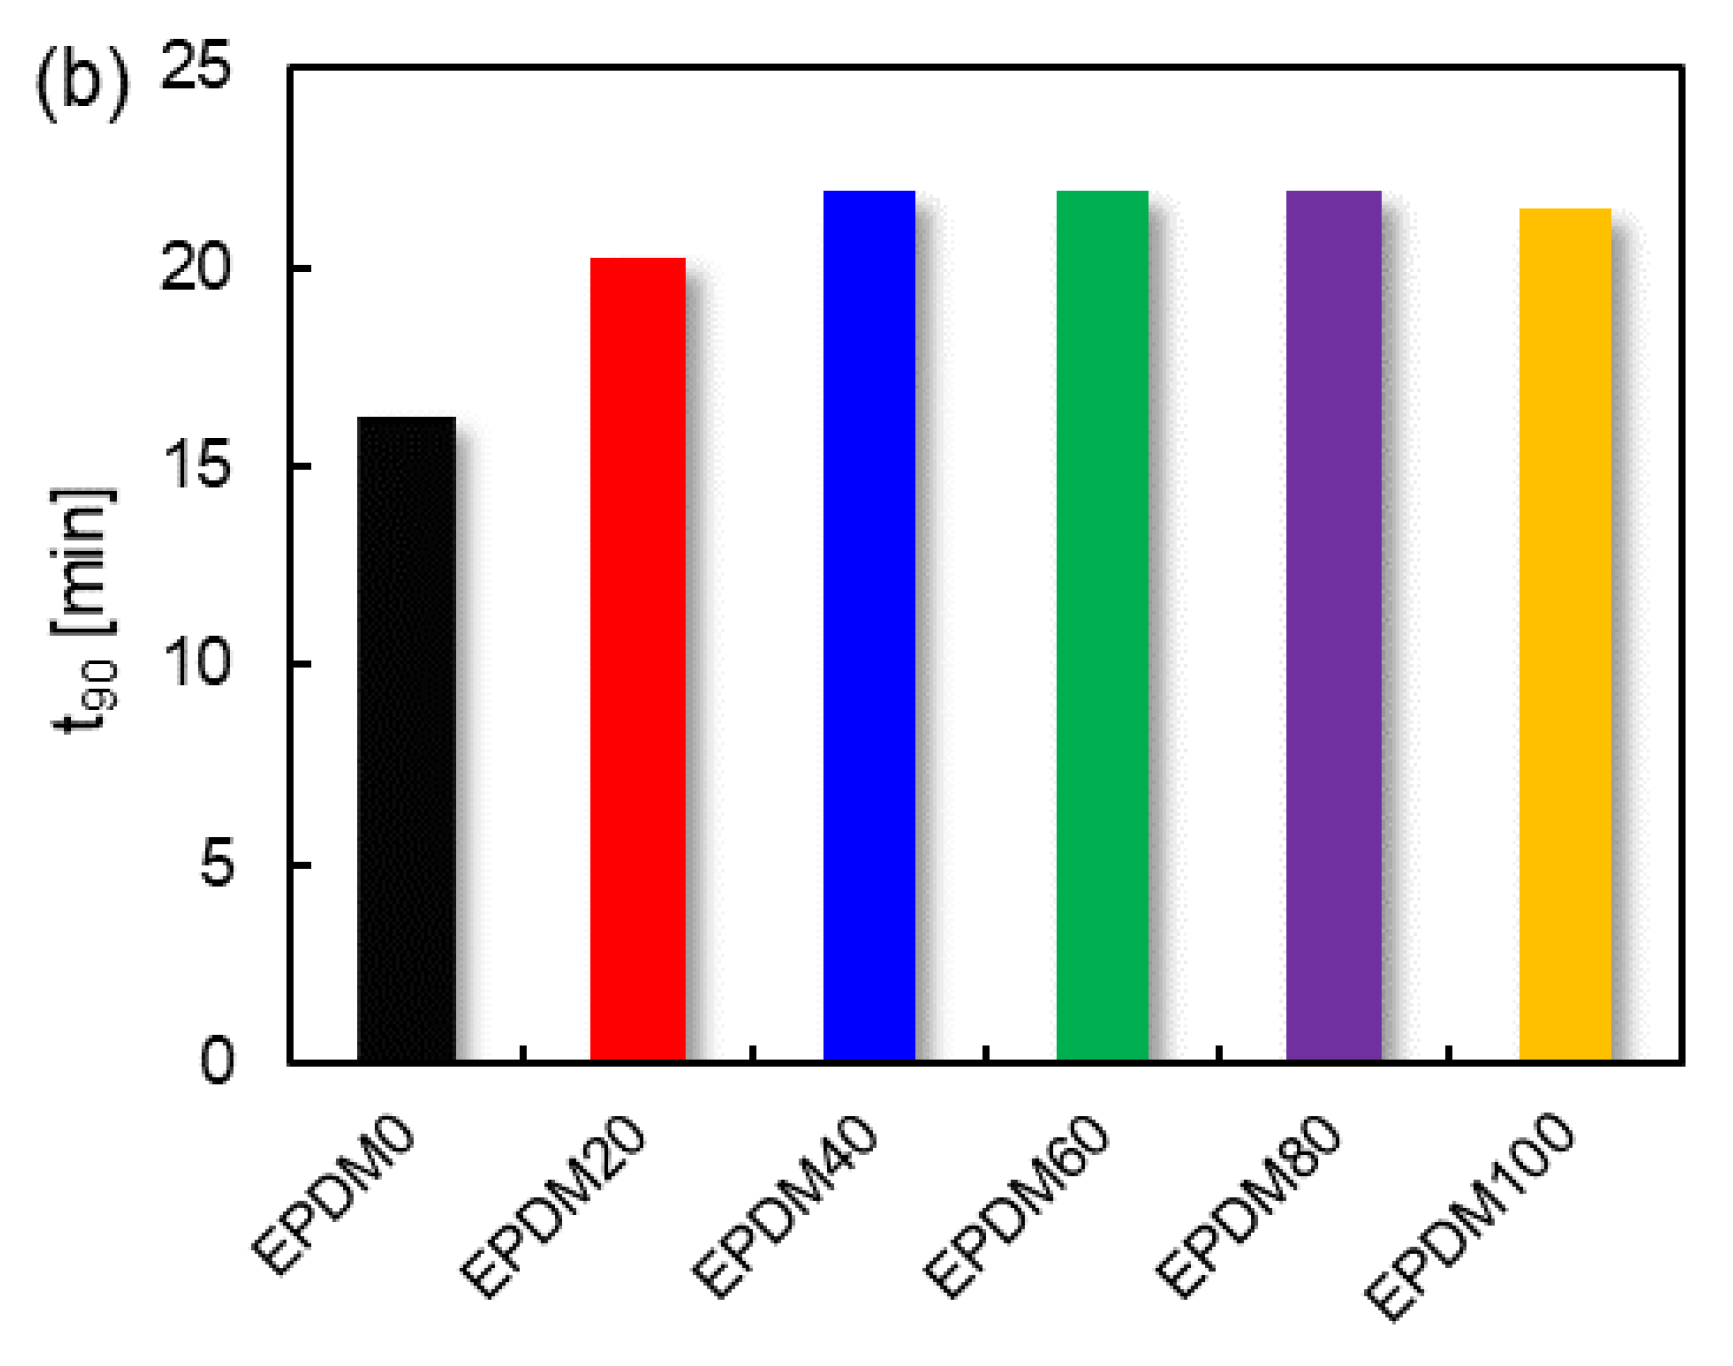
Figure 3.
Results of the rebound behaviors of rubber balls.
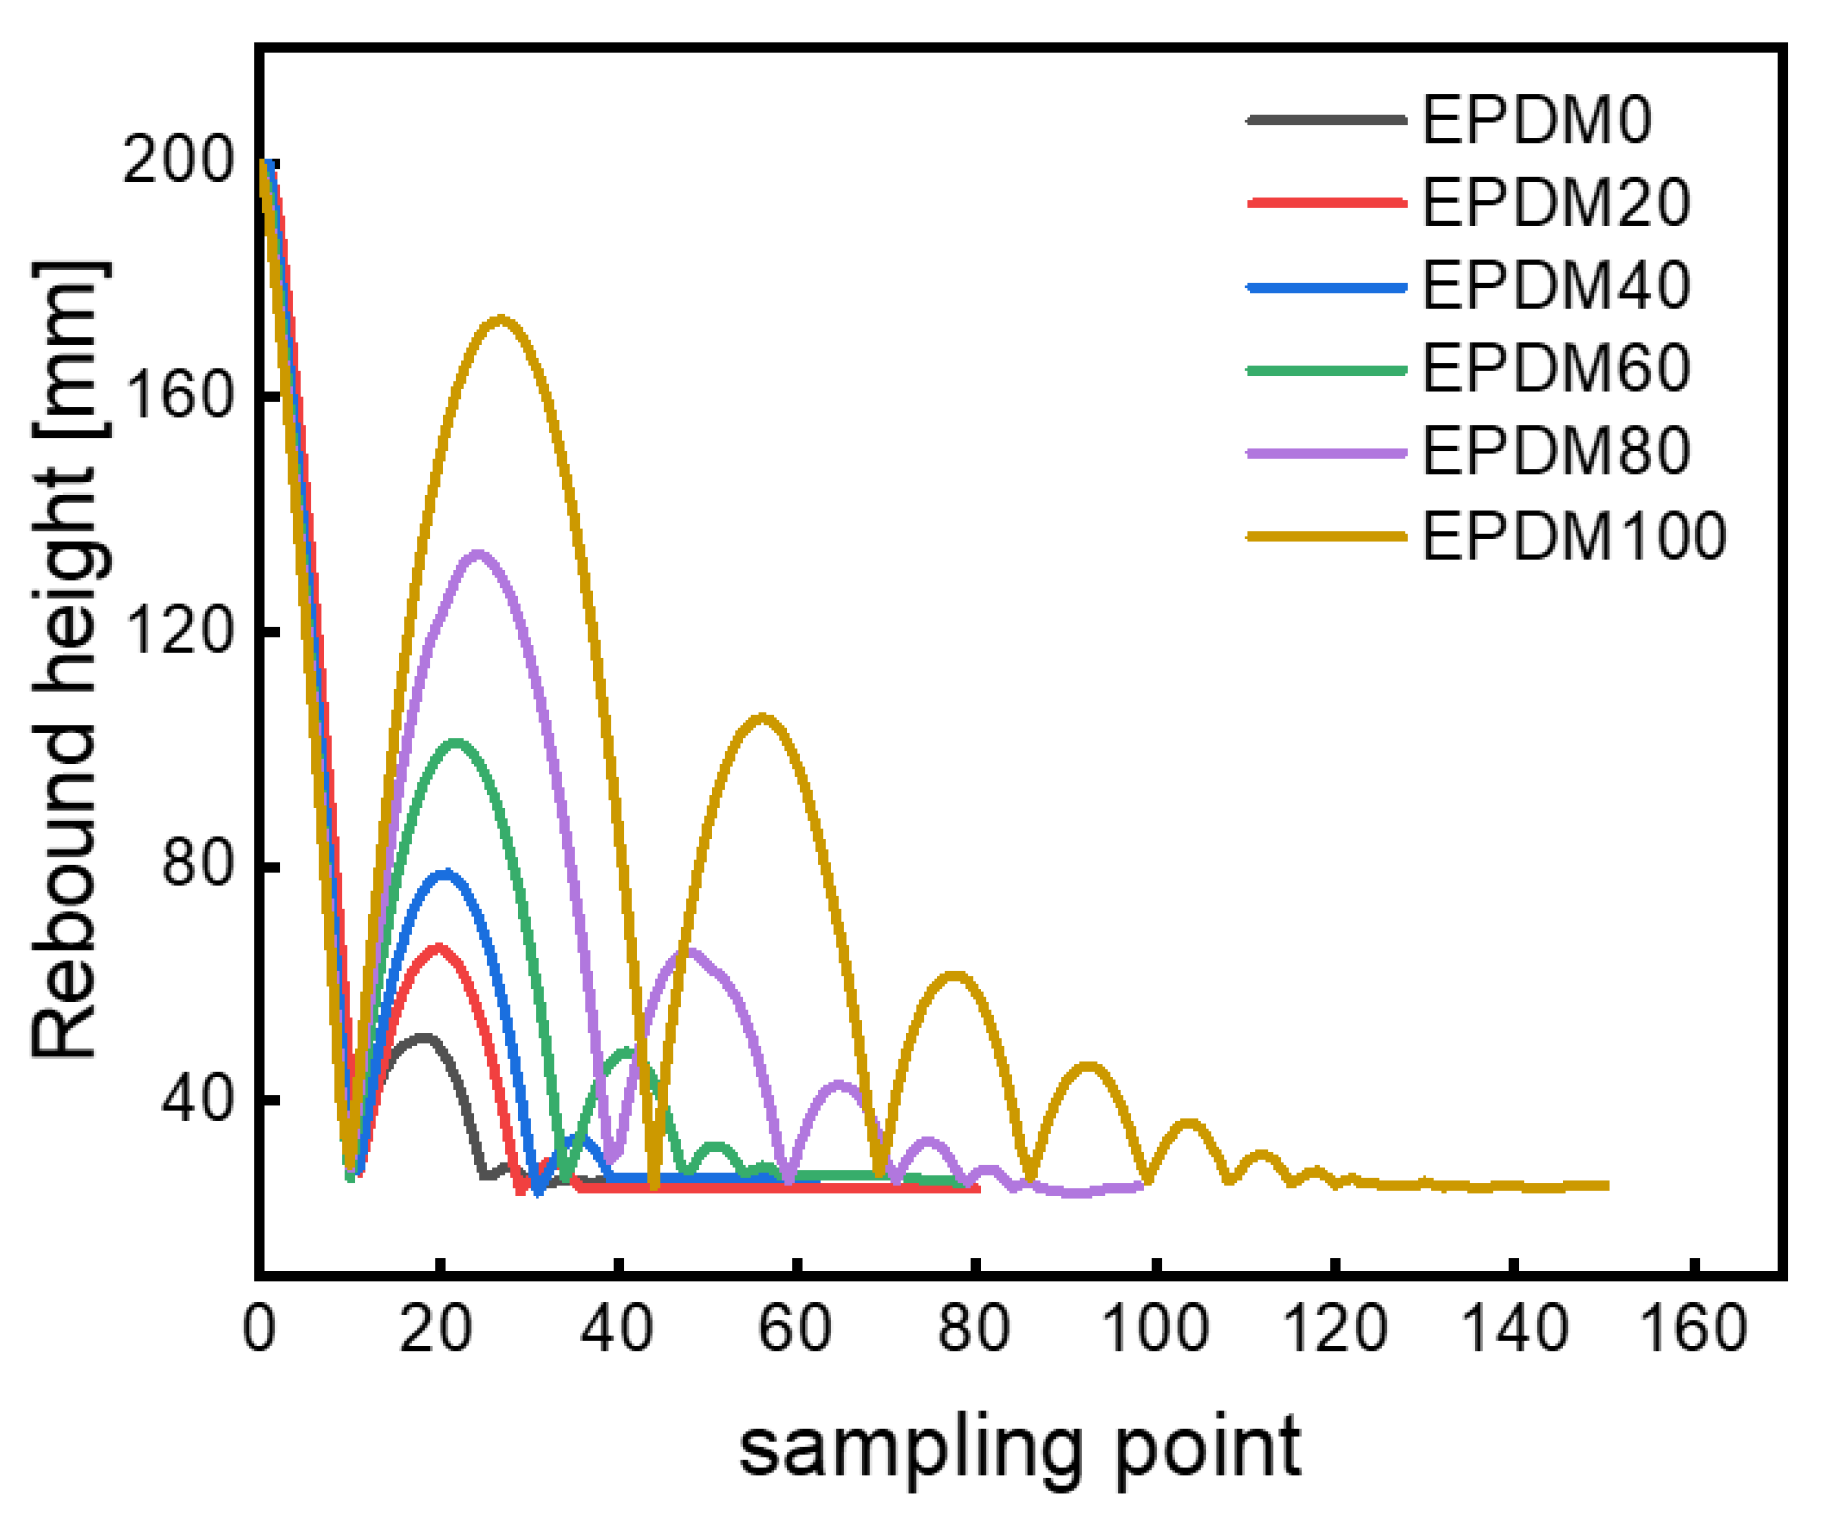
Figure 4.
The deformation process of rubber ball.
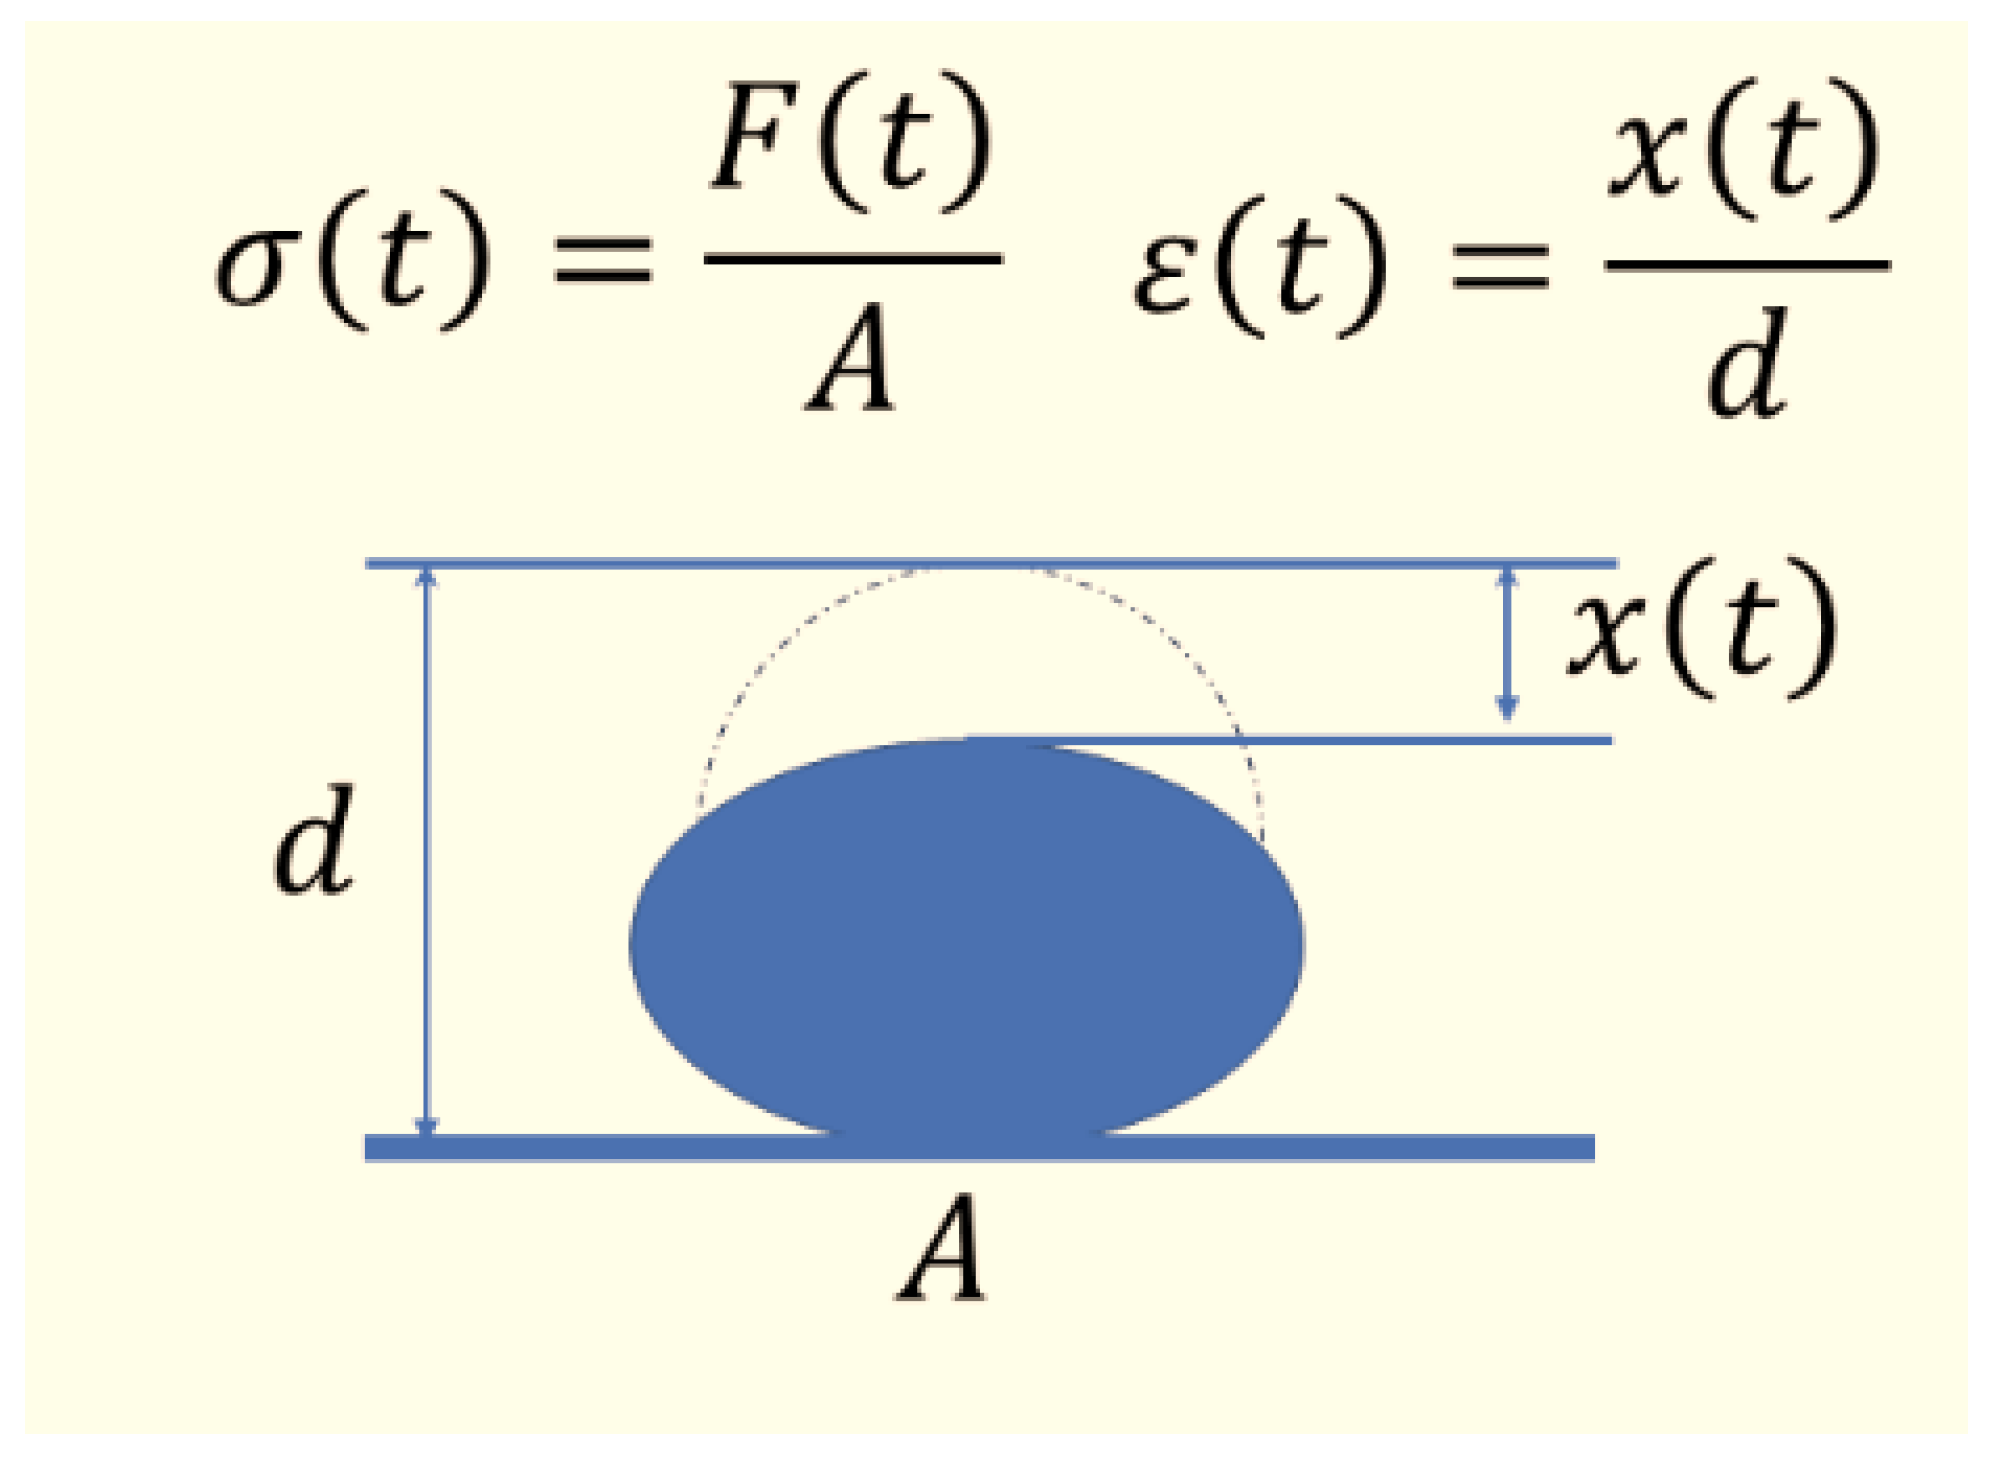
Figure 5.
The measured and predicted tanδ of rubber blends.
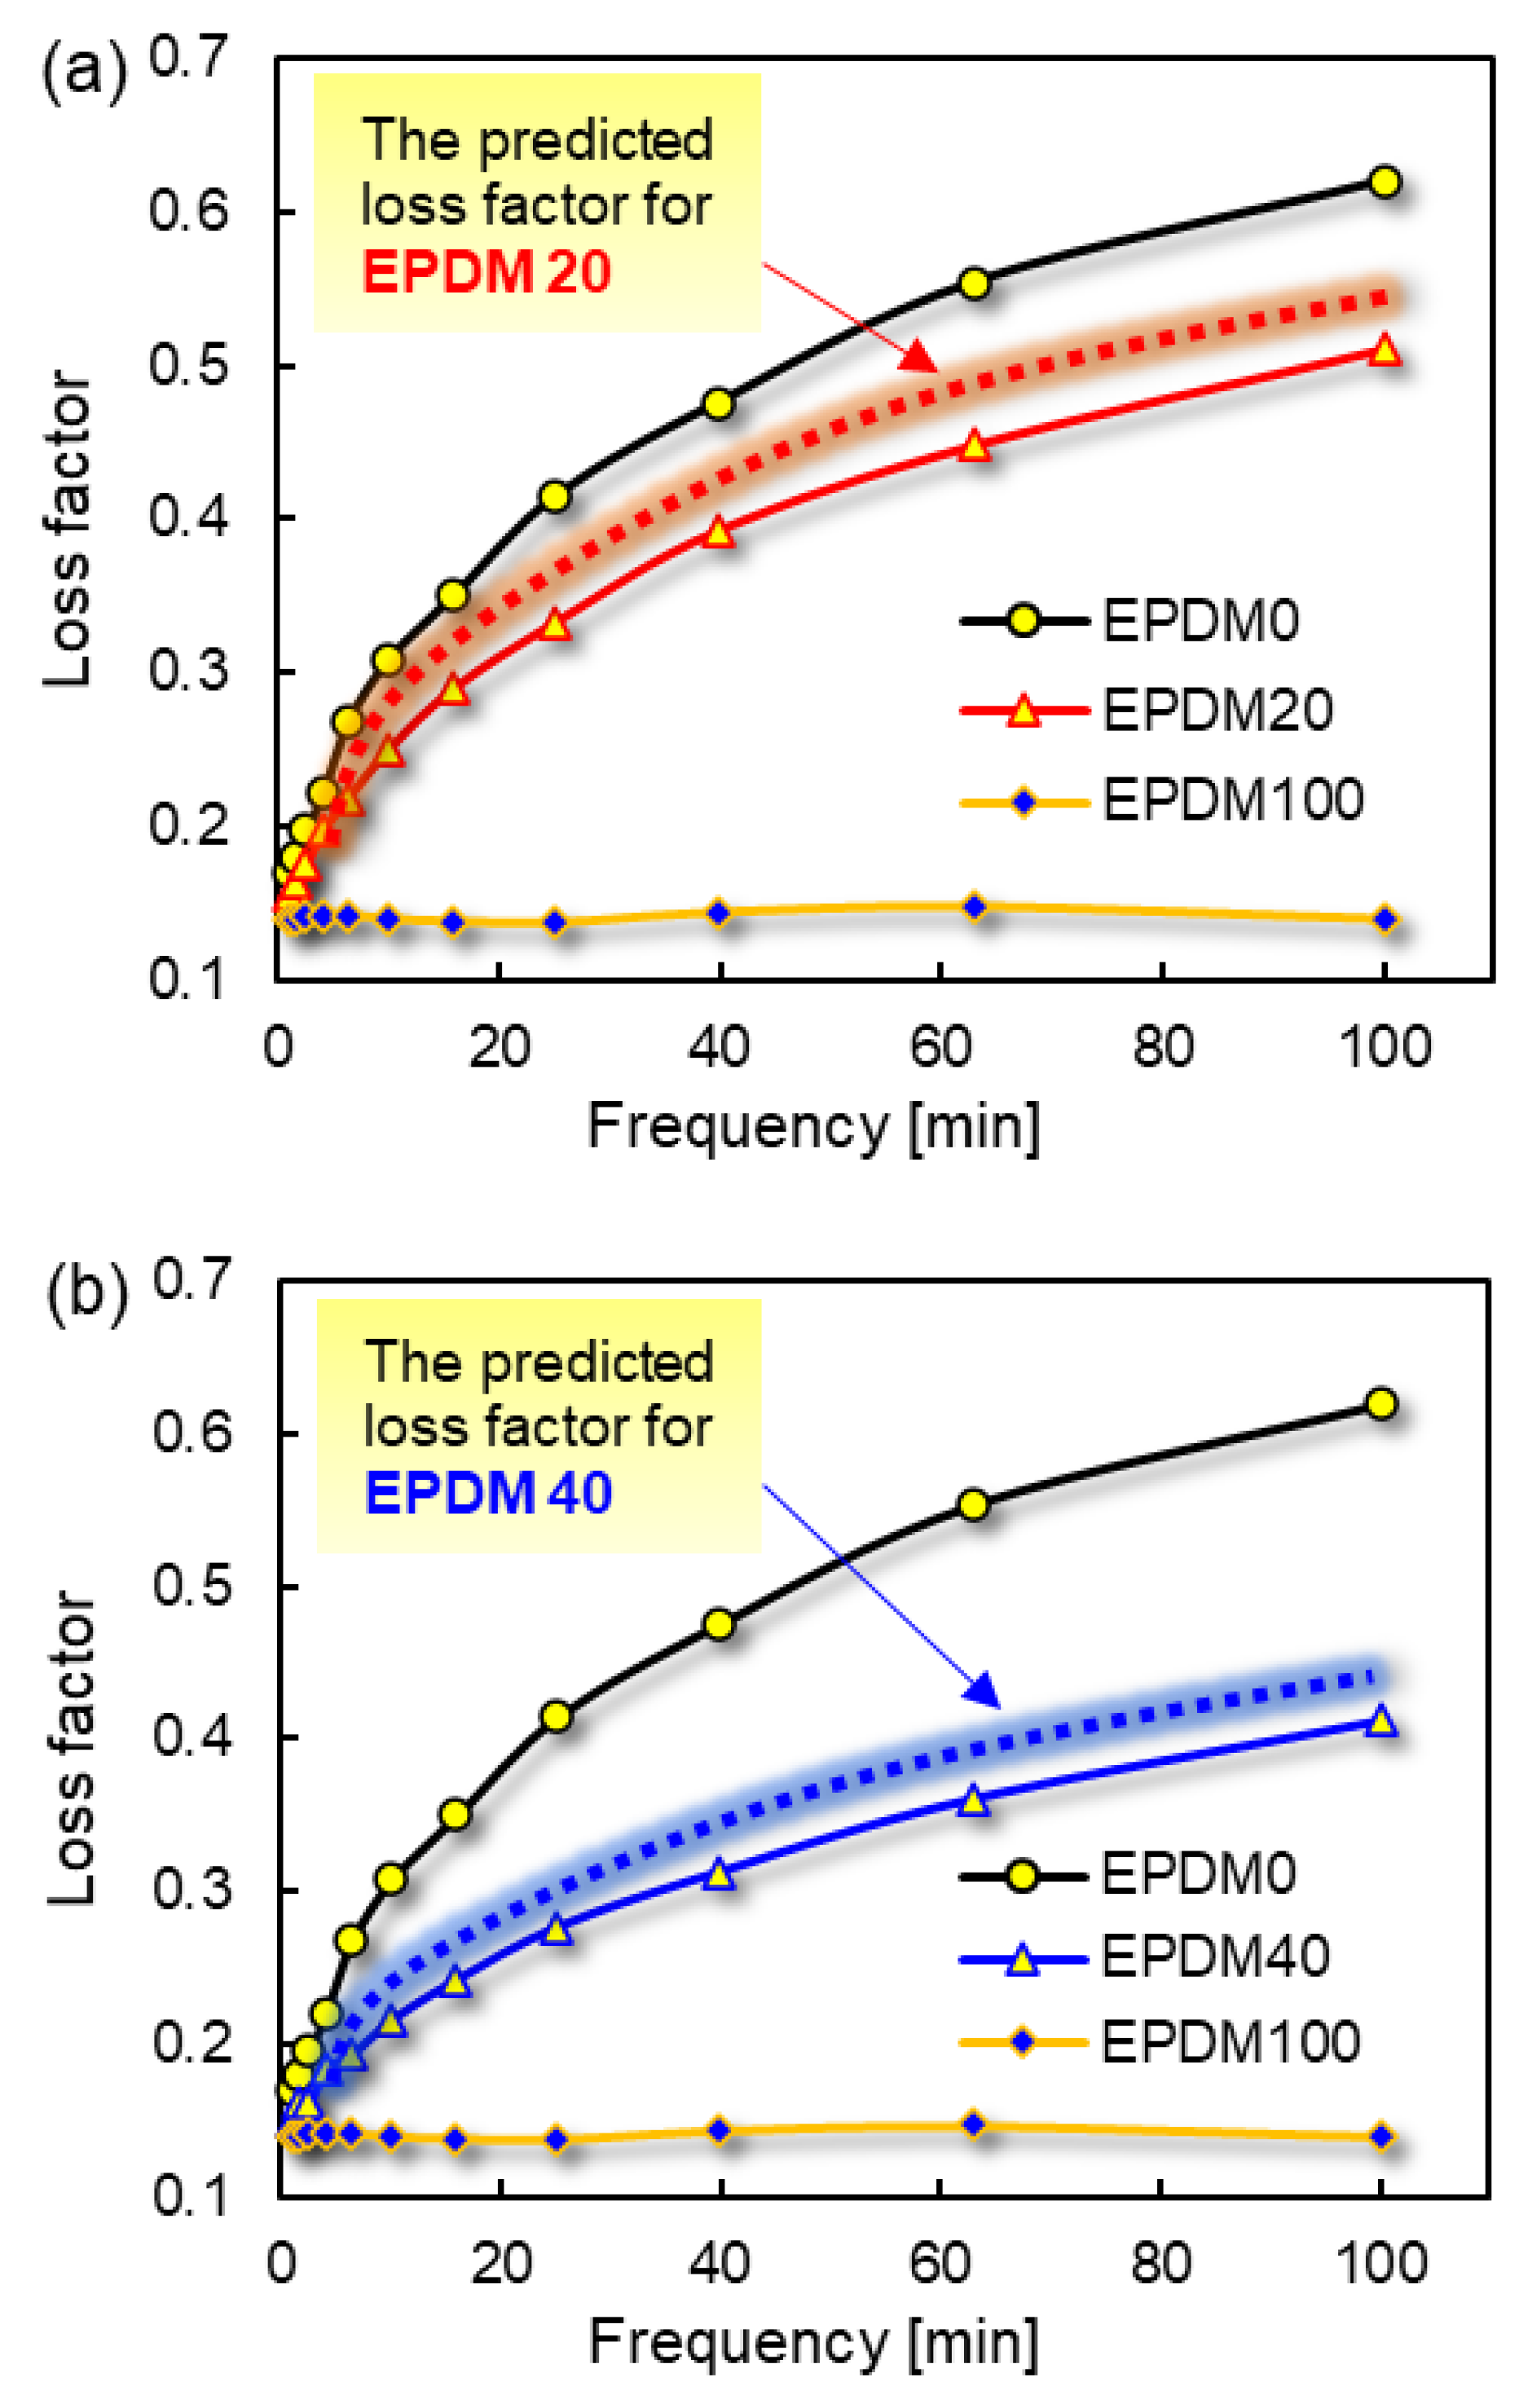
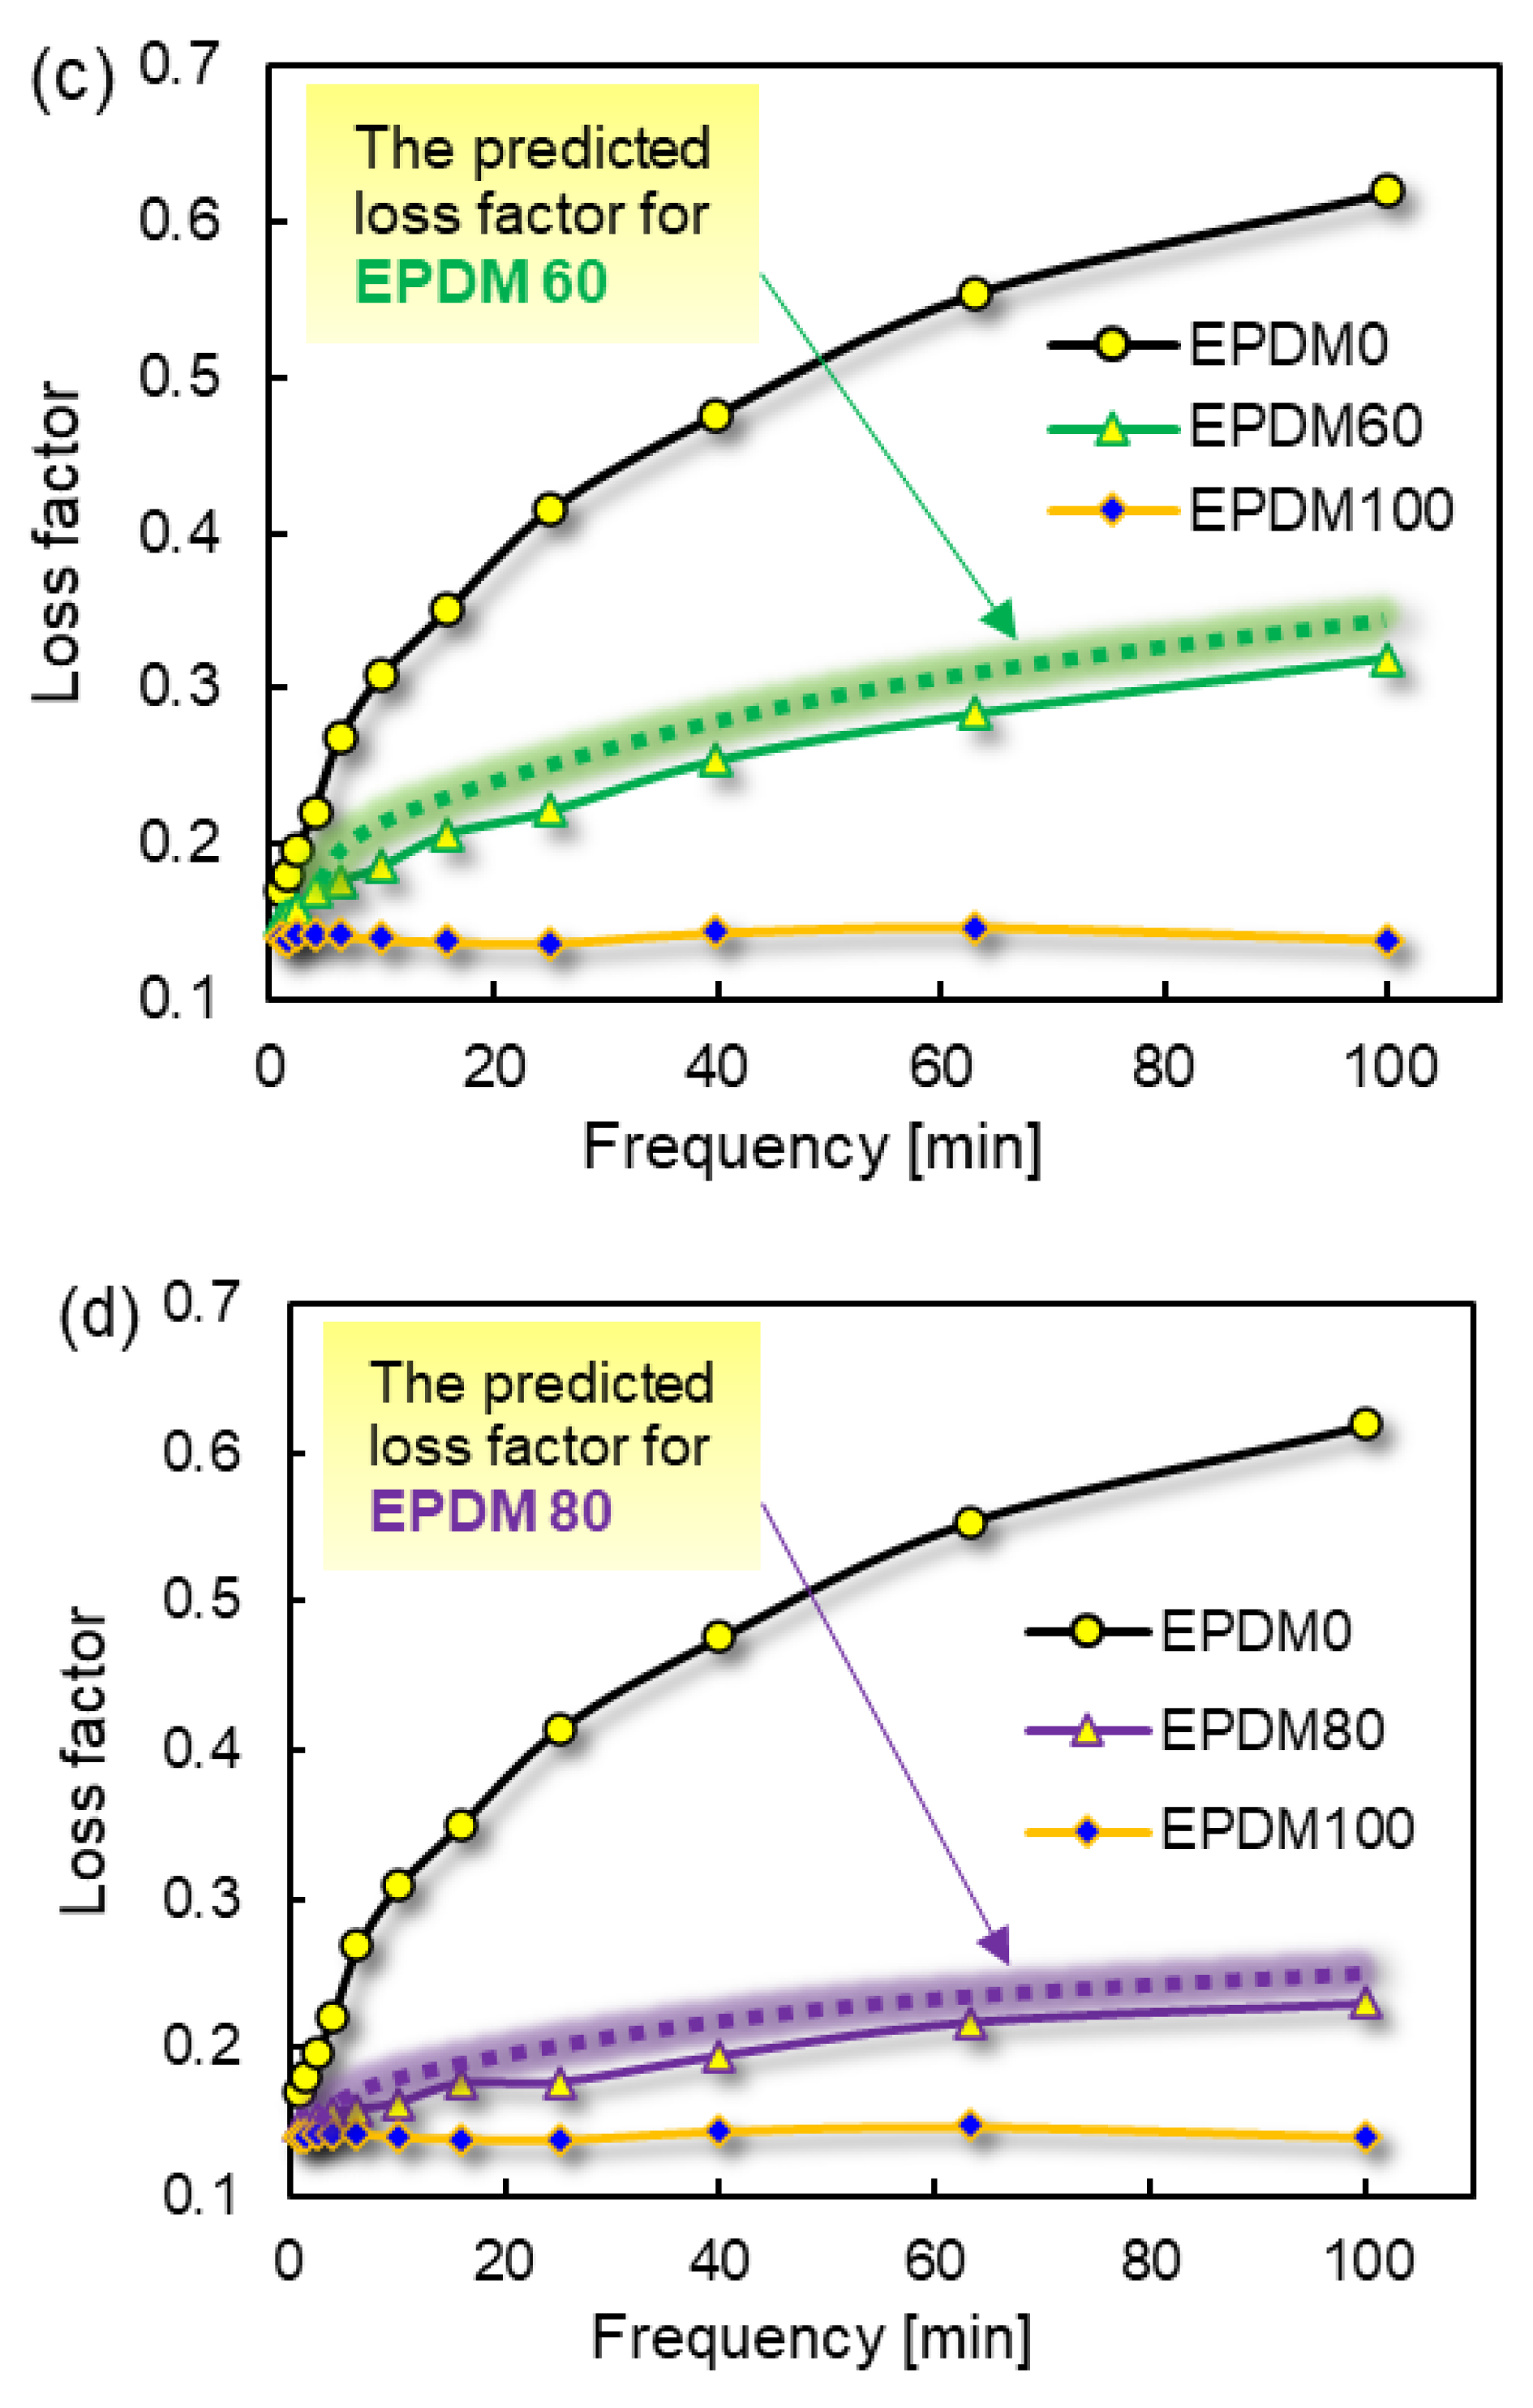
Figure 7.
The rebound time interval of rubber balls.
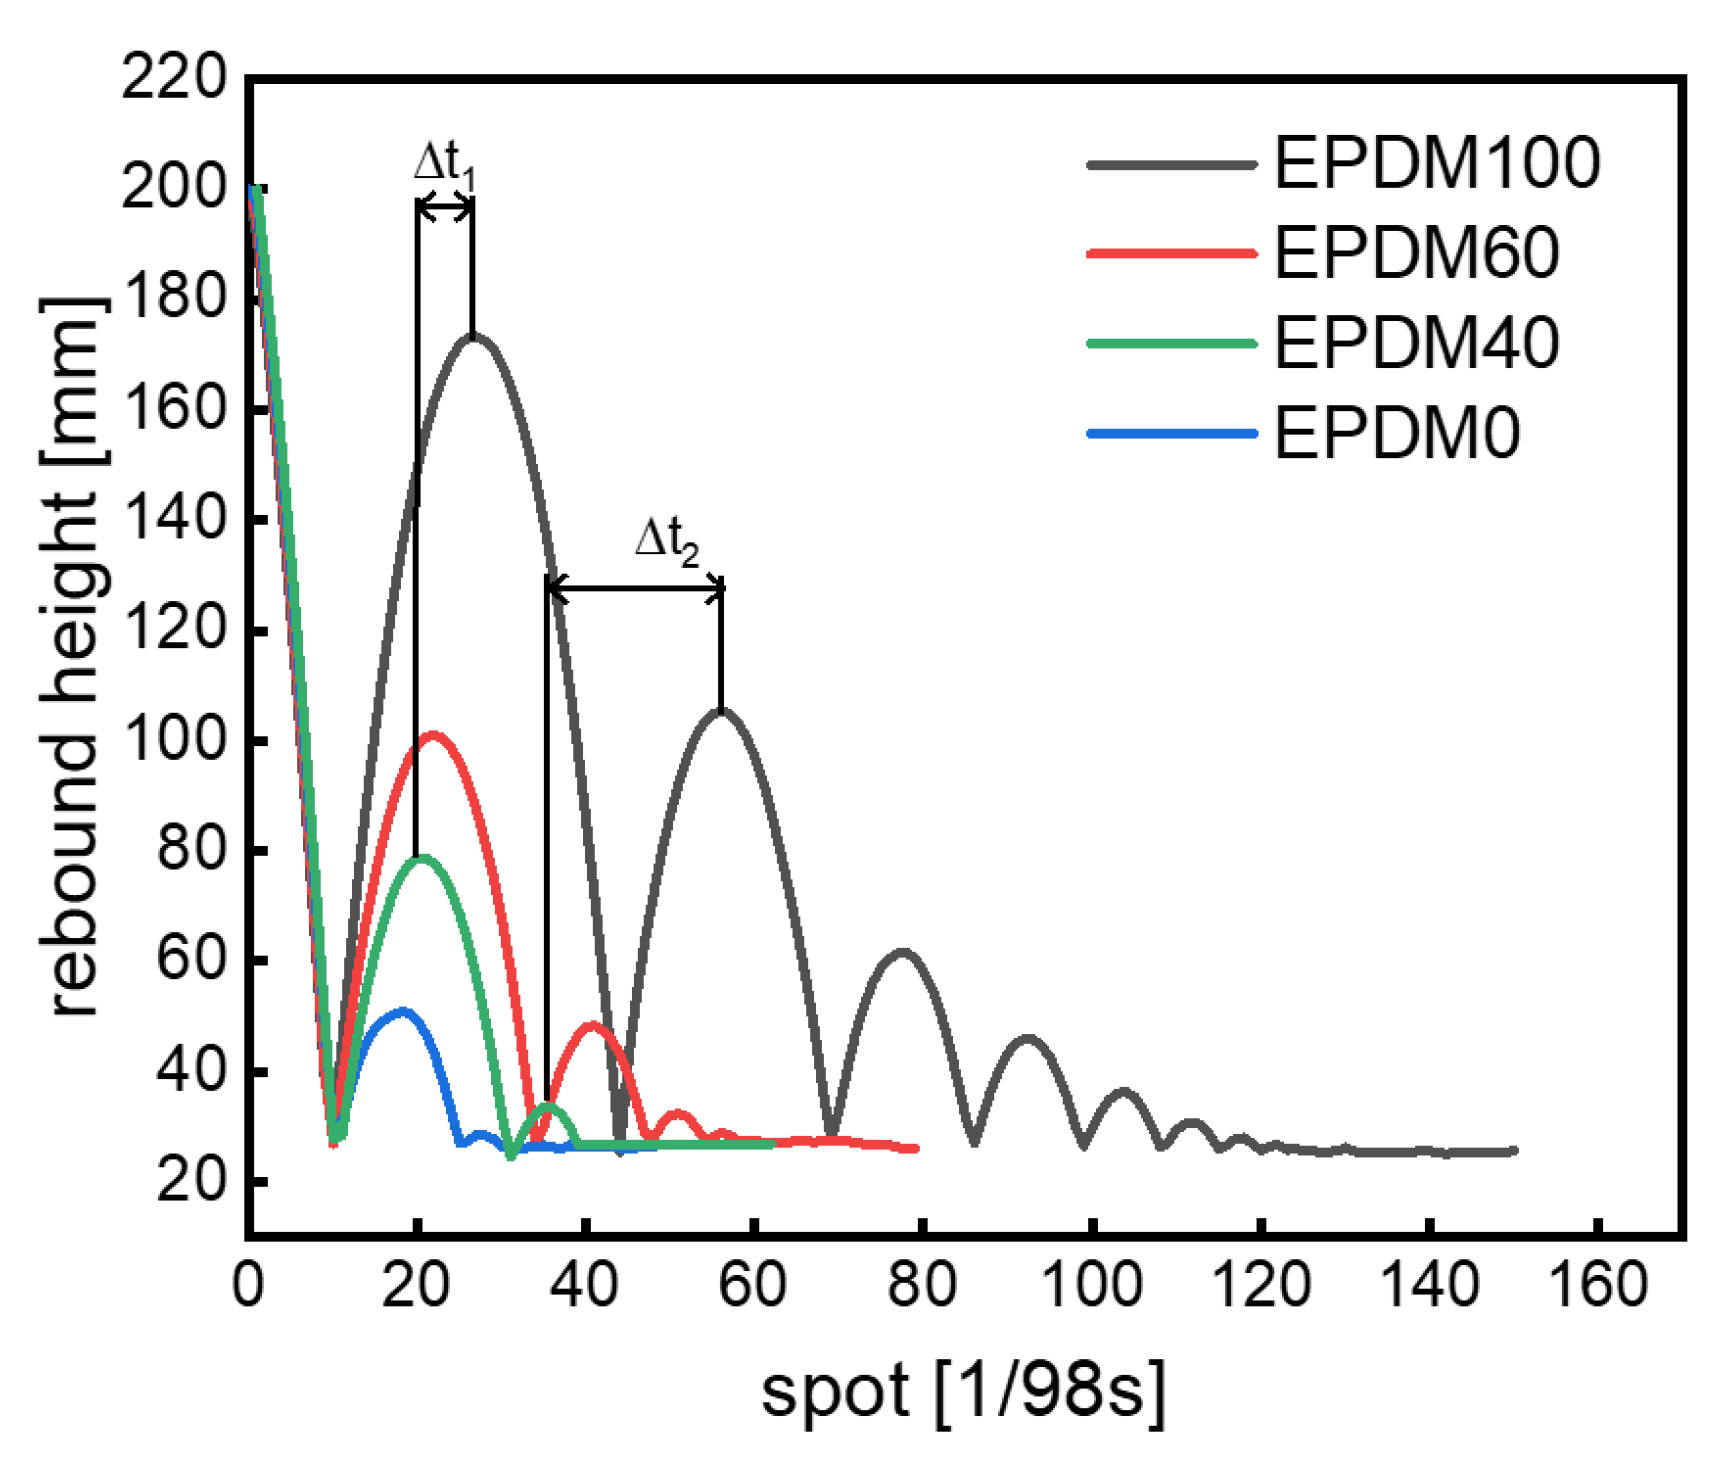
Figure 8.
EDR of rubber balls.
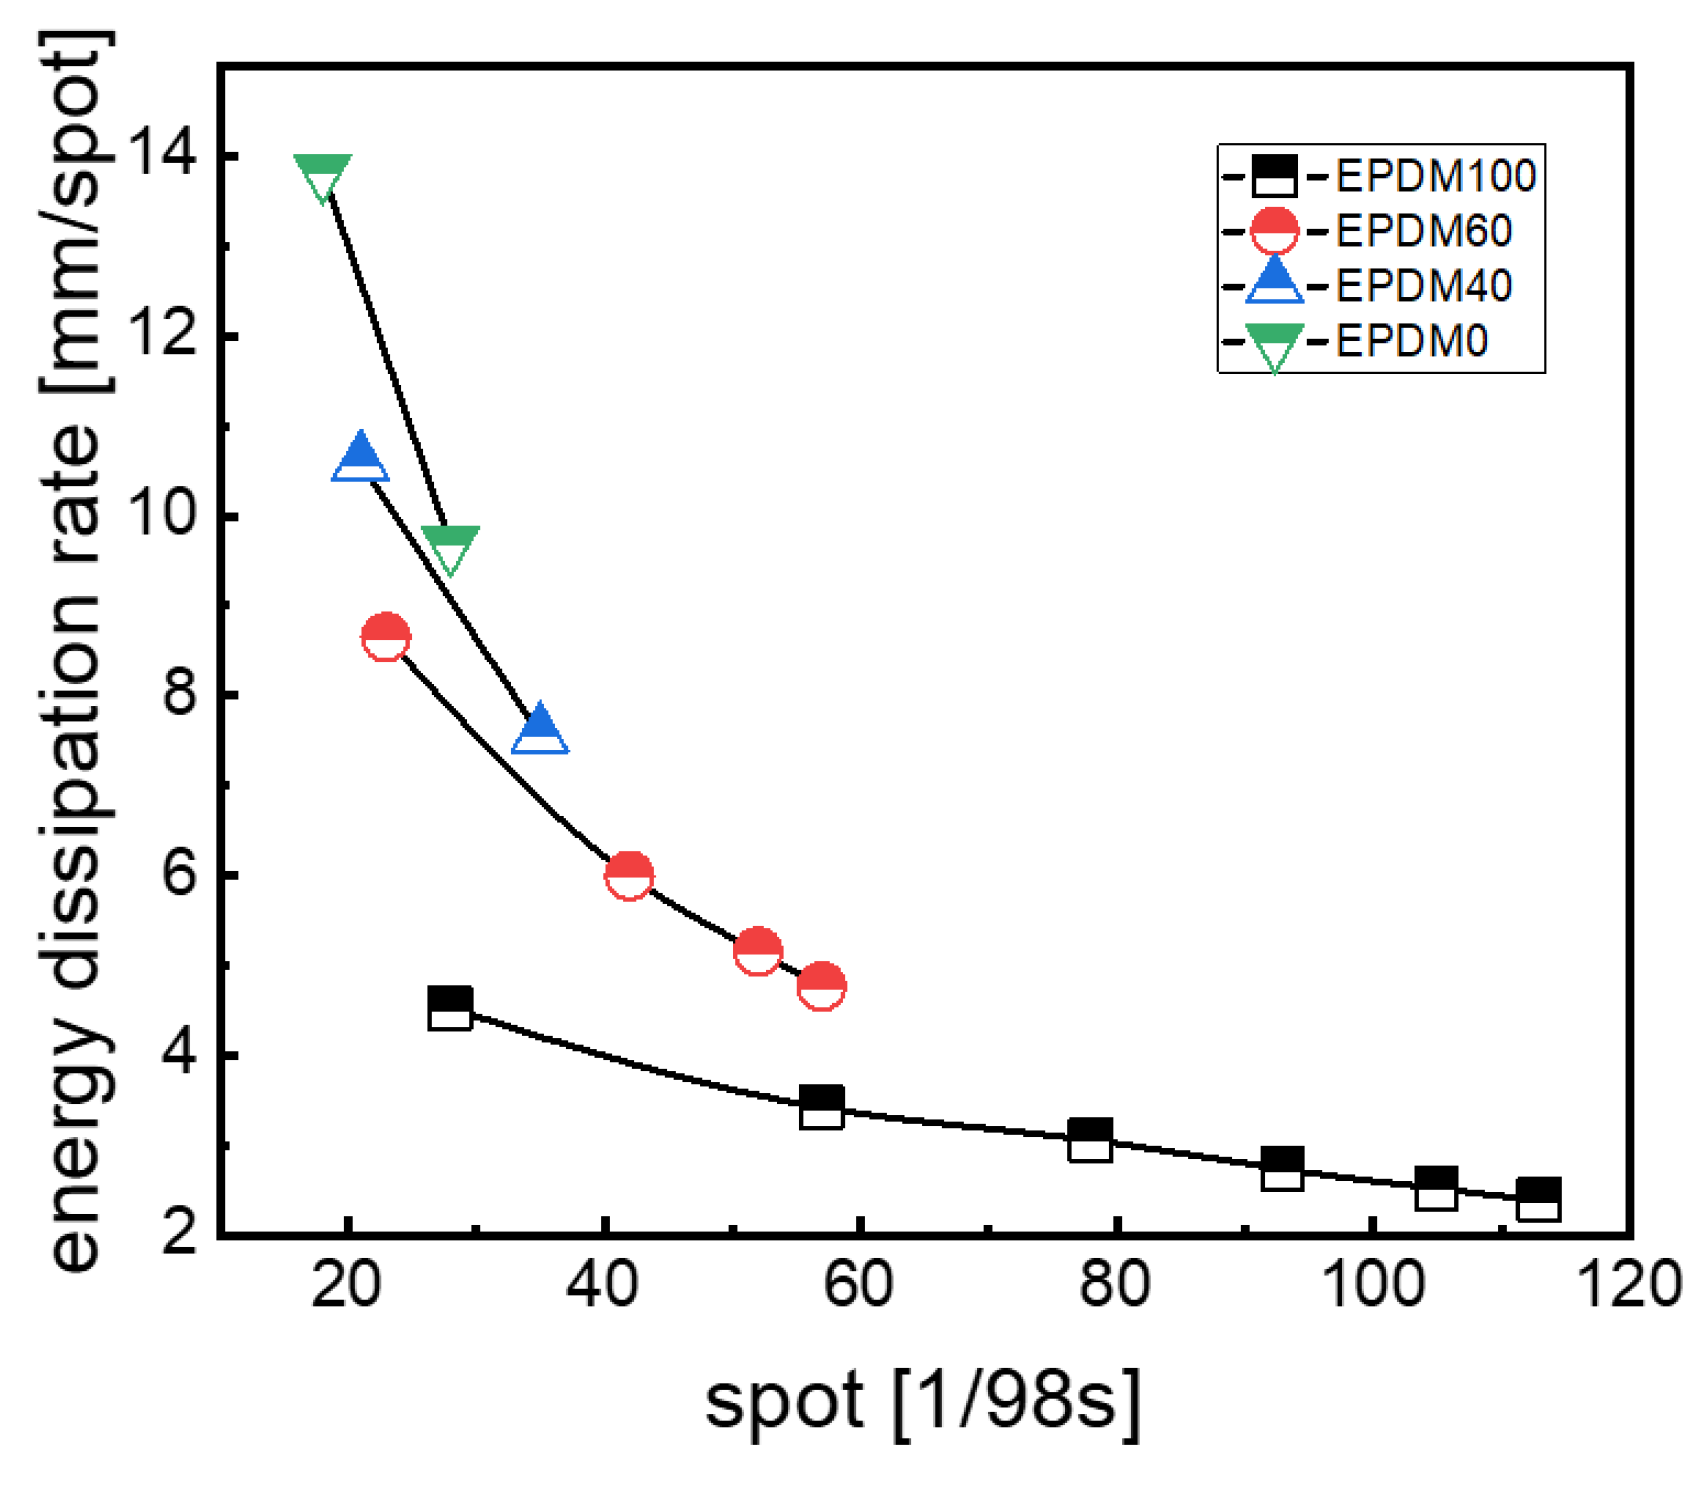

Table 1.
The details of compound formulas.
| Ingredient (phr) | EPDM0 | EPDM 20 | EPDM 40 | EPDM 60 | EPDM 80 | EPDM 100 |
|---|---|---|---|---|---|---|
| CIIR | 100 | 80 | 60 | 40 | 20 | |
| EPDM | 20 | 40 | 60 | 80 | 100 | |
| N550 | 50 | 50 | 50 | 50 | 50 | 50 |
| Paraffin oil | 5 | 5 | 5 | 5 | 5 | 5 |
| Zinc oxide | 5 | 5 | 5 | 5 | 5 | 5 |
| Stearic acid | 2 | 2 | 2 | 2 | 2 | 2 |
| 4020 | 1 | 1 | 1 | 1 | 1 | 1 |
| DM | 1 | 1 | 1 | 1 | 1 | 1 |
| Sulfur | 2 | 2 | 2 | 2 | 2 | 2 |
Table 2.
The theoretical (hi) and measured (Hi) rebound heights of the rubber balls.
| Rebound height | EPDM | EPDM80 | EPDM60 | EPDM40 | EPDM20 | CIIR |
|---|---|---|---|---|---|---|
| Hi/mm | 175.3 | 130 | 101.1 | 78.7 | 65 | 50.9 |
| hi/mm | 175.3 | 150.4 | 125.5 | 100.6 | 75.6 | 50.9 |
| (hi-Hi)/mm | 0 | 20.4 | 24.4 | 21.9 | 10.6 | 0 |
Disclaimer/Publisher’s Note: The statements, opinions and data contained in all publications are solely those of the individual author(s) and contributor(s) and not of MDPI and/or the editor(s). MDPI and/or the editor(s) disclaim responsibility for any injury to people or property resulting from any ideas, methods, instructions or products referred to in the content. |
© 2024 by the authors. Licensee MDPI, Basel, Switzerland. This article is an open access article distributed under the terms and conditions of the Creative Commons Attribution (CC BY) license (http://creativecommons.org/licenses/by/4.0/).
Copyright: This open access article is published under a Creative Commons CC BY 4.0 license, which permit the free download, distribution, and reuse, provided that the author and preprint are cited in any reuse.


