Submitted:
22 April 2024
Posted:
22 April 2024
You are already at the latest version
Abstract
This research focuses on the use of the HEC-RAS model to estimate flash flood risk. It combines advanced hydraulic modeling techniques and precise data entry. The aim is to contribute knowledge to assess flash flood risk and reduce impacts on communities and infrastructure. The selection of study areas with a history of severe flooding, such as the Lam Saphung Basin, Phrom River Basin, and Lam Chern River Basin Part 1 in Thailand, highlights the importance of thorough flash flood risk assessment. By leveraging the HEC-RAS model, the results of this research inform proactive risk management strategies, improve emergency preparedness and help develop sustainable mitigation measures. The results are important in developing emergency response strategies and overall recovery ability in areas at risk of flash floods. The research combines advanced hydrologic modeling and real-world flash flood data. In addition to the flood condition assessment, the extent of the flood area and associated hazards were assessed using a two-case simulation strategy. The study covers future scenarios related to land use changes and retrospective analysis of past flood events. The results have practical implications for improving emergency response strategies, land use planning, and overall resilience in flash flood-prone areas. The integrated approach emphasizes the research output to providing insights and actionable solutions for communities facing ongoing challenges posed by flash floods.
Keywords:
Flash Flood Area
; Runoff
; HEC-RAS
; Land Use Change
; Flood Plain Risk
1. Introduction
Inadequate drainage of drainage channels or creating obstacles that cause more water to be stored constitute improper management of a drainage system. Floods affect many issues such as causing economic loss, death and health problems [1-2], loss of natural resources, damage to society and community areas. Proper management and response to flooding are therefore important to reduce future impacts [3-4]. Good planning in the development and management of water resources such as building an efficient drainage system and monitoring infrastructure improvements [5-6] can help reduce the risk of flooding in the long run. Understanding the factors that cause and impact flooding is fundamental to further efforts to deal with flooding in many areas around the world [7-9].
Flash floods pose a significant threat to human life and infrastructure in flash flood-prone areas [10-13]. These events are characterized by heavy rain over a short period of time, causing rapid runoff and an increased chance of flooding [14-15]. Accurately quantifying flash flood risk is essential to implementing effective mitigation and preparedness measures. In the past few years hydrodynamic models have become a valuable tool in assessing flood hazards and risks [16-17]. For example, the SWMM (Storm Water Management Model) is a tool used to simulate an area's drainage system. For stormwater management and flood risk assessment, the FLO-2D model can simulate flood movement in areas that are flat or not connected to the waterline [18-20]. The model allows risk assessment and prediction of areas that may fall into flood zones. The MIKE Flood model is a simulation system used to assess the risk and power of flooding [21-23]; it has the ability to simulate water flow and flood movement in an area both spatially and temporally. However, among such models the HEC-RAS (Hydrological Engineering Center-River Analysis System) model has proven to be extremely effective in simulating flood flow behavior [24-26].
The HEC-RAS model is a widely used one-dimensional hydraulic model which helps predict water surface characteristics flow speeds and flood extent. It simulates interactions between river channels, floodplains structures and other hydraulic features to cover flood risk in a specific area [27-29]. By accurately simulating the complex dynamics of flash floods, the HEC-RAS model can help identify places at risk. It can estimate flood depth and potential damage with flood patterns and is able to be refined by including additional information such as rainfall land use and river channel characteristics [30-32]. To increase the accuracy of flood assessments, remote sensing and high-altitude satellite imagery can help better the precision of flood modeling and risk assessment. These data can offer further insights into the extent and severity of flooding across various regions [33-34]. However, the current study does not delve into the limitations associated with its methods and scope. Further research and analysis may be required to address these limitations and increase the usability of the findings. Satellite data provides low-precision information about flood events such as the location and extent of the flood but cannot determine the depth and duration of the flood [35-36]. Historically flooded property surveys are essential for complete and reliable flood management information. This study focuses on creating flood hazard maps using observable flood maps and the HEC-RAS V. 6 and GIS tools.
Despite numerous studies on the relationship between flood hazard and housing prices in developed countries, research in developing countries is lacking. In Thailand for example, this study does not present the effects of land change or human intervention on future flood hazards, especially regarding criteria for considering property loss or evaluating land changes in areas prone to flooding [37-39]. The results of this research can be used in flood risk management and emergency management planning. Accurately estimating flash flood risk using the HEC-RAS model affects stakeholders including local agencies, urban planners and emergency management agencies, bringing all-round information about land use. Design infrastructure and preparedness links to reduce risk in areas at risk of flash floods [12,40-41]. These findings are useful in developing targeted mitigation strategies [42]. To reduce risk and increase resilience in communities facing flash flood risk there are many benefits from using the HEC-RAS model.
In summary, using the HEC-RAS model to estimate flash flood risk has the potential to revolutionize research understanding of these catastrophic events by combining advanced hydraulic modeling techniques with precise data entry [43-45]. This research aims to contribute to the growing body of knowledge on flash flood hazard assessment by implementing effective mitigation measures based on its findings. Research can be conducted on implementing effective mitigation measures based on the findings of this study. Research can take important steps in reducing the impact of flash floods on communities and, ultimately, protecting lives and infrastructure. The study area (Lam Saphung Basin, Phrom Basin, and Lam Chern Basin Part 1 which are tributaries of the Chi River Basin. Which is located in the northeast of Thailand has a history of experiencing severe flooding in the past [46-48]. Floods such as these highlight the importance of detailed and localized flash flood risk assessments by leveraging the HEC-RAS model.
The objective of this research is to provide detailed and accurate estimates of flash flood risk in selected areas. The results have the potential to inform proactive risk management strategies, improve emergency preparedness and contribute to the development of sustainable mitigation measures tailored to the unique challenges posed by flash floods. While this research delves into the complexities of flash flood risk assessment using the HEC-RAS model, it not only addresses the immediate concerns of the selected study area, but also provides valuable insights that can be extrapolated to other regions grappling with similar environmental vulnerabilities. The combination of advanced hydrologic modeling and real-world flash flood data sets this research apart from existing studies.
2. Materials and Methods
This research uses the HEC-RAS model to assess flash flood risk from areas that have experienced flooding [49-50]. In addition to evaluating flood conditions with HEC-RAS, this research imported river cross-section data into RAS Mapper and adjusted the Manning' N value in the model which was divided into 2 parts: river coefficient and flood area coefficient (2D Area) that are appropriate to the geography and watershed studied. Water levels and flood zone boundaries were calibrated and checked. Two cases were considered. – (1) Simulating flooding from past land use changes using water data from the 2021 SWAT model importing HEC-RAS and simulating in 2006, 2008, 2010, 2015, 2017 and 2019, (2) Simulation of past flood events using water data from SWAT and land use in 2006, 2008, 2010, 2015, 2017, and 2019, emphasizing the analysis of various steps as shown in Figure 1.
Figure 1 illustrates that the evaluation of flood conditions using the HEC-RAS model was divided into two simulation cases. In each case the simulation estimated the extent of the flood area and assessed the danger from flooding. This assessment of the danger from flooding was divided into 2 cases. – (1) Simulating flood hazards from changes in land use in the past, (2) Simulating past flood events classifying the level of danger from flooding.
2.1. Study Area
The study area selected for research comprised three basins that have experienced flash floods, namely the Lam Saphung Basin, the Phrom Basin, and the Chern Basin Part 1. These three basins are subbasins of the Chi River basin which is located in the northeastern region of Thailand as shown in Figure 2. In addition, all 3 basin areas have complete land use and rainfall map data available which can be used to evaluate the occurrence of runoff at different times.
From Figure 2, it is seen that these 3 basins have different characteristics under watershed conditions, even though they are adjacent areas. Information on the general condition and details of each basin are described below.
2.1.1. Lam Saphung River Basin
The Lam Saphung River Basin, is a subbasin of the Chi Basin with an area of 743.74 km2 covering 1.51 % of the main basin. This area covers Kaset-somboon District, Nong Bua Daeng District and Khon San District in Chaiyaphum Province. The average annual rainfall is about 1,203.4 mm. The total runoff volume is 229.6 MCM (million cubic meters), with runoff volume per unit area of 9.8 l/s-m2 (liters/second-square meter).
2.1.2. Phrom River Basin
The Phrom River basin is a subbasin of the Chi River basin with an area of 2,264.66 km2 covering 4.60 % of the main river basin. This area covers Kaset Sombun District, Phu Khiao District, Ban Thaen District and Khon San District in Chaiyaphum Province, Chum Phae District in Khon Kaen Province, Mueang Phetchabun District, Lom Sak District and Nam Nao District in Phetchabun Province. The average annual rainfall is about 1,080.3 mm. Total runoff volume is 435.3 MCM with runoff volume per unit area 6.1 l/s-m2.
2.1.3. Chern River Basin Part 1
The Chern Basin Part 1 is a subbasin of the Chi Basin with an area of 1,899.65 km2 covering 3.86 % of the main basin. This area covers Kaset Sombun District, Phu Khiao District, Ban Thaen District and Khon San District in Chaiyaphum Province, Chum Phae District in Khon Kaen Province, Lom Sak District and Nam Nao District in Phetchabun Province. The average annual rainfall is about 1,104.4 mm. Total runoff volume is 363.8 MCM with runoff volume per unit area 6.1 l/s-m2.
2.2. Data Preparation
Data preparation involved selected river basin areas that had experienced flash floods in 2021 using flash flood and flash flood data from the system https://data.dmr.go.th/dataset/debris_flood [47-48] provided by the Department of Mineral Resources. Flash flood events were selected for study only in the Lam Saphung Basin, Phrom River Basin, and Chern River Basin Part 1. Each basin has different characteristics. The input data format was collected from relevant agencies as shown in Table 1.
The data presented in Table 1 were used as input for the HEC-RAS unit model, representing three areas. These inputs were – (1) A numerical elevation model (DEM) using LDD DEM (4 m), (2) A land use information map covering the years 2006-2019 from the Land Development Department, (3) Hydraulic building data from the Royal Irrigation Department, (4) The extent of modeling from the upstream side expected to be affected by flooding, obtained from data provided by the Geo-Informatics and Space Technology Development Agency.
2.3. Flood Condition Assessment Using the HEC-RAS Model
This study utilized the HEC-RAS version 6.4.1 model for analyzing flood areas in the three subbasins. The HEC-RAS model, developed by the U.S. Army Corps of Engineers, stands for Hydrologic Engineering Center - River Analysis System. It serves as a tool for simulating steady flow conditions in 1D and both 1D and 2D unsteady flow conditions. In this study, the analysis of flood areas was conducted using the HEC-RAS model, with the following important steps.
2.3.1. Creating and Defining Physical Characteristics
In creating the HEC-RAS model to assess flooding conditions in the three study areas for this research, the extent of modeling expected to be affected by flooding from the upstream side was been determined based on data from the Geo-Informatics and Space Technology Development Agency (Public Organization), or GISTDA. The steps involved in creating the model are detailed as follows.
- 1)
- Creating the centerline of the river's left and right banks
The creation of the river centerline and left-right bank in the HEC-RAS version 6.4.1 model can be accomplished by importing aerial image map data and using it as a background image. The centerlines and left-right banks of the three rivers, as demonstrated in the details of the Ras Mapper window of the HEC-RAS model, were as depicted in Figure 3.
From Figure 3 it is seen that the Lam Saphung River Basin is at the foot of Ban Saphung Nuea Nong Waeng Subdistrict Nong Bua Daeng District Chaiyaphum Province to the confluence point of the Chi River. The Ban Huai Han area Wang Chomphu Subdistrict, Nong Bua Daeng District Chaiyaphum Province has a total distance of approximately 19.7 km. Following that is the Phrom River Basin, starting from the bridge over the Phrom River in the area of Ban Kaeng Tad Sai Non Thong Subdistrict, Kaset Sombun District, Chaiyaphum Province, and extending to the confluence point of the Chern River in the same area. Baan At Samat, Na Phiang Subdistrict Chum Phae District Khon Kaen Province a total distance of approximately 142.9 km and the last order is Lam Nam Chern River Basin Part 1 from the bridge over the Chern River in the area of Ban Wang Mon Wang Swap Subdistrict Phu Pha Man District, Khon Kaen Province to the confluence point of the Nam Phrom River in the area Baan At Samat Na Phiang Subdistrict Chum Phae District Khon Kaen Province total distance approximately 128.4 km.
- 2)
- Importing Digital Elevation Model data (DEM)
After creating the center line of the river and the left-right bank the numerical elevation model or DEM data was then imported into the Ras Mapper window to use as a representation of the elevation of each flooded area. In this study, DEM data with a resolution of 5 meters x 5 meters was used to cover the area expected to be flooded as shown in Figure 4.
3) Importing river cross-section data and the Hydraulics Building
This research imported stream cross section data into RAS Mapper by drawing lines perpendicular to the stream that were imported in the previous step. A total of 115 river sections were imported consisting of 12 sections of the Lam Saphung Basin 54 sections of the Phrom River Basin, and 49 sections of the Lam Nam Chern River Basin Part 1. The elevation data for each river section was obtained from the 5 x 5-meter DEM data that was imported into Ras Mapper in the previous step. The elevation values obtained from DEM data may not have sufficient resolution. Therefore, the elevation value of the river cross-section data obtained in the Geometric Data window was adjusted by relying on the river cross-section data obtained from surveys in the area of the Royal Irrigation Department and the Department of Water Resources to make adjustments as shown in Figure 4, Figure 5, Figure 6 and Figure 7.
Figure 5, Figure 6 and Figure 7 shows the cross-section of the watershed survey foreach river. In addition to the stream cross-section data imported into the HEC-RAS model, hydraulic building data was also imported into the HEC-RAS model in order to obtain accurate, accurate, and reliable results from the HEC-RAS simulation.
In this study, the data of 2 hydraulic buildings were imported, namely the Nam Phrom Basin Floodgate and Lam Nam Chern Floodgate Part 1. When adjusting the height of the river cross-section and importing the hydraulic building data. After adjusting the height of the river cross section and importing the hydraulic building data, a section can be presented along the length of each river as seen in Figure 8.
4) The creation of flood zone boundaries for 2D flow and connecting lines between 1D and 2D flow
The flood area for 2D flow was represented by the 2D Area while the line connecting the 1D and 2D flows was represented by the Lateral Structure which is the line connecting the flooded area from the river and the flooded area (2D Area) by considering the left and right bank lines. The 2D Area and Lateral Structure data were imported from the Geometric Data window and the elevation of each data type was determined from the DEM data that was entered in the previous step. The resolution of the Grid Cell was set to be 400 m except for areas close to river boundaries and roads where the Grid Cell was set to be 100 meters in size to improve resolution of calculation. Subsequently, the HEC-RAS model determined the elevation of each grid cell using the elevation values from the DEM data. Lateral Structure data was processed in the same way. The data elevation value was set from the DEM data, which generally used the same elevation as the waterline level. After the operation was completed, the boundaries of the 2D Area and Lateral Structure could be displayed as shown in Figure 9.
5) Determination of the roughness coefficient (Manning's n) of streams and flooded areas
The determination of the roughness coefficient (Manning's n) in the HEC-RAS model was divided into 2 parts: the roughness coefficient of the waterway and the roughness coefficient of the flooded area (2D Area). These considered the roughness coefficient of both parts as shown in Table 2, where the Manning's n value of the river was mainly determined by the condition of the river, while Manning's n of flood area (2D Area) was determined from land use data in the flood area. The details can be seen in Figure 10.
6) Importing Boundary Conditions data
After defining the geometric data and determining the Manning's n coefficient, then importing the flow rate data for each sub-basin calculated with the SWAT model, the results were stored in an available data storage system called HEC Data Storage System (DSS) and inputted to the HEC-RAS model, entered through the Unsteady Flow Data window.
2.3.2. Assessing the Extent of Flood Areas Using the HEC-RAS Model
This research evaluated flood conditions by estimating the extent of the flooded area with the HEC-RAS model focusing on importing river cross-section data and adjusting the Manning' N value in the model to create appropriate coefficients. To obtain an accurate model of the river basin and flood conditions, simulation results were included to calibrate and check water levels and the extent of the flooded area. Detailed analysis and consideration of past events of interest to increase understanding of flood behavior in the study area. This research divided the simulation into 2 cases. – (1) the case of simulating flood conditions from changes in land use in the past, and (2) the case of simulating past flood events in the past.
2.3.3. Assessing the Danger from Flood Conditions
The flood hazard assessment for this study was based on criteria from the WRL Technical Report 2014/17 Flood Hazard [52]. In evaluating flood hazard with the HEC-RAS model, these criteria for danger from flooding were as shown in Figure 11 in which flood hazard is resolved into 6 levels (H1-H6) based on depth and flow velocity as the determinants, as shown in Table 3. These criteria can be used to write scripts in Ras Mapper to create flood hazard maps. As shown in Figure 12, this research has divided the simulation into 2 cases: 1) the case of simulating flood conditions from changes in land use in the past, 2) the case of simulating past flood events in the past.
3. Results and Discussion
This research has provided diverse information and deepened our understanding of flooding issues, thereby helping to inform effective decision-making in managing and preventing flood risk. The results of the HEC-RAS model calibration and validation provide confidence in the model’s accuracy in simulating current flood conditions. In estimating the flood area extent with the HEC-RAS model, the ability to predict and assess areas at risk of flooding has been achieved in situations where land use change has been confirmed. The results provide a useful database for developing flood management and prevention plans that are compatible with different development programs and uses of floodplains. In addition, the results of the flood hazard assessment provide useful information for planning and managing flood risk. For hazard assessment, it not only provides information about high-risk areas, but it also categorizes different hazard levels that can be used to prepare flood management plans and create compatible protection plans. Therefore, all the results of this research provide guidelines and information necessary for planning and implementing flood management situations. In addition, the data and results of this research can be used to develop policies and guidelines for flood management that affect the local community and environment as detailed below.
3.1. HEC-RAS Model Calibration and Verification Results
The results of calibration and verification of the HEC-RAS model were achieved by adjusting the Manning's n value of the river and riverbank plains (in the 2D area), divided into 2 types. – (1) calibration and verification of water level values and (2) calibration and verification of flood area boundaries. The details and results of the calibration are as follows.
3.1.1. Results of Calibration and Inspection of Water Level Values
Water level values were checked and calibrated by adjusting the Manning' N value in the model for calibration [24, 25] at 3 water measuring stations of the Royal Irrigation Department in each river basin. – (1) Lam Saphung River Basin, water measuring station E.83. (2) Phrom River Basin, water measuring station E.93. (3) Chern River Basin Part1 water measuring station E.85. Then the water level results from the model were compared with the values obtained from actual water level measurements at water measuring stations on a daily basis between July 2021 and October 2021 which was a year of severe flooding. The calibrated Manning' N values were then used to check the model again. during July 2010 to October 2010.
The results of the model calibration and verification are shown in Figure 13 and 14. The R2 and NSE statistical values were obtained by comparing the calculated water level values from the HEC-RAS model with the obtained water level values. From the measurement reported in Table 4, the R2 and NSE statistical values was greater than 0.600 and the P-BIAS value was less than ±15%, showing that the relationship between the water level values was very good and acceptable according to international standards [53].
3.1.2. Results of Calibration and Inspection of Flood Area Boundaries
The spatial data relationship Relative Error (RE) and F-statistics were used as statistical values to check reliability of the results for calibration and inspection of the flood area extent. As shown in the equation below, low RE values and large Fs values show the consistency of the flood area boundaries from satellite images and model simulations [54].
The HEC-RAS model calibration and verification results used the flood area boundaries using information on the extent of the flooded area obtained from the analysis of satellite image data from GISTDA [55] which in calibrating the model, used data from satellites COSMO-SkyMed-4. The data recorded on September 27, 2021 at 5:58 a.m. was compared with the extent of the water area during the same period obtained from the HEC-RAS model, as shown in Figure 13. The relative values of the spatial data were obtained: Relative Error (RE) and F-statistics are equal to 0.41 and 46.57%, respectively. This statistical result does not provide clear criteria for dividing the reliability interval.
Figure 15.
Calibration of flood area extent on 27 September 2021 from the HEC-RAS model and from GISTDA satellite images.
Figure 15.
Calibration of flood area extent on 27 September 2021 from the HEC-RAS model and from GISTDA satellite images.
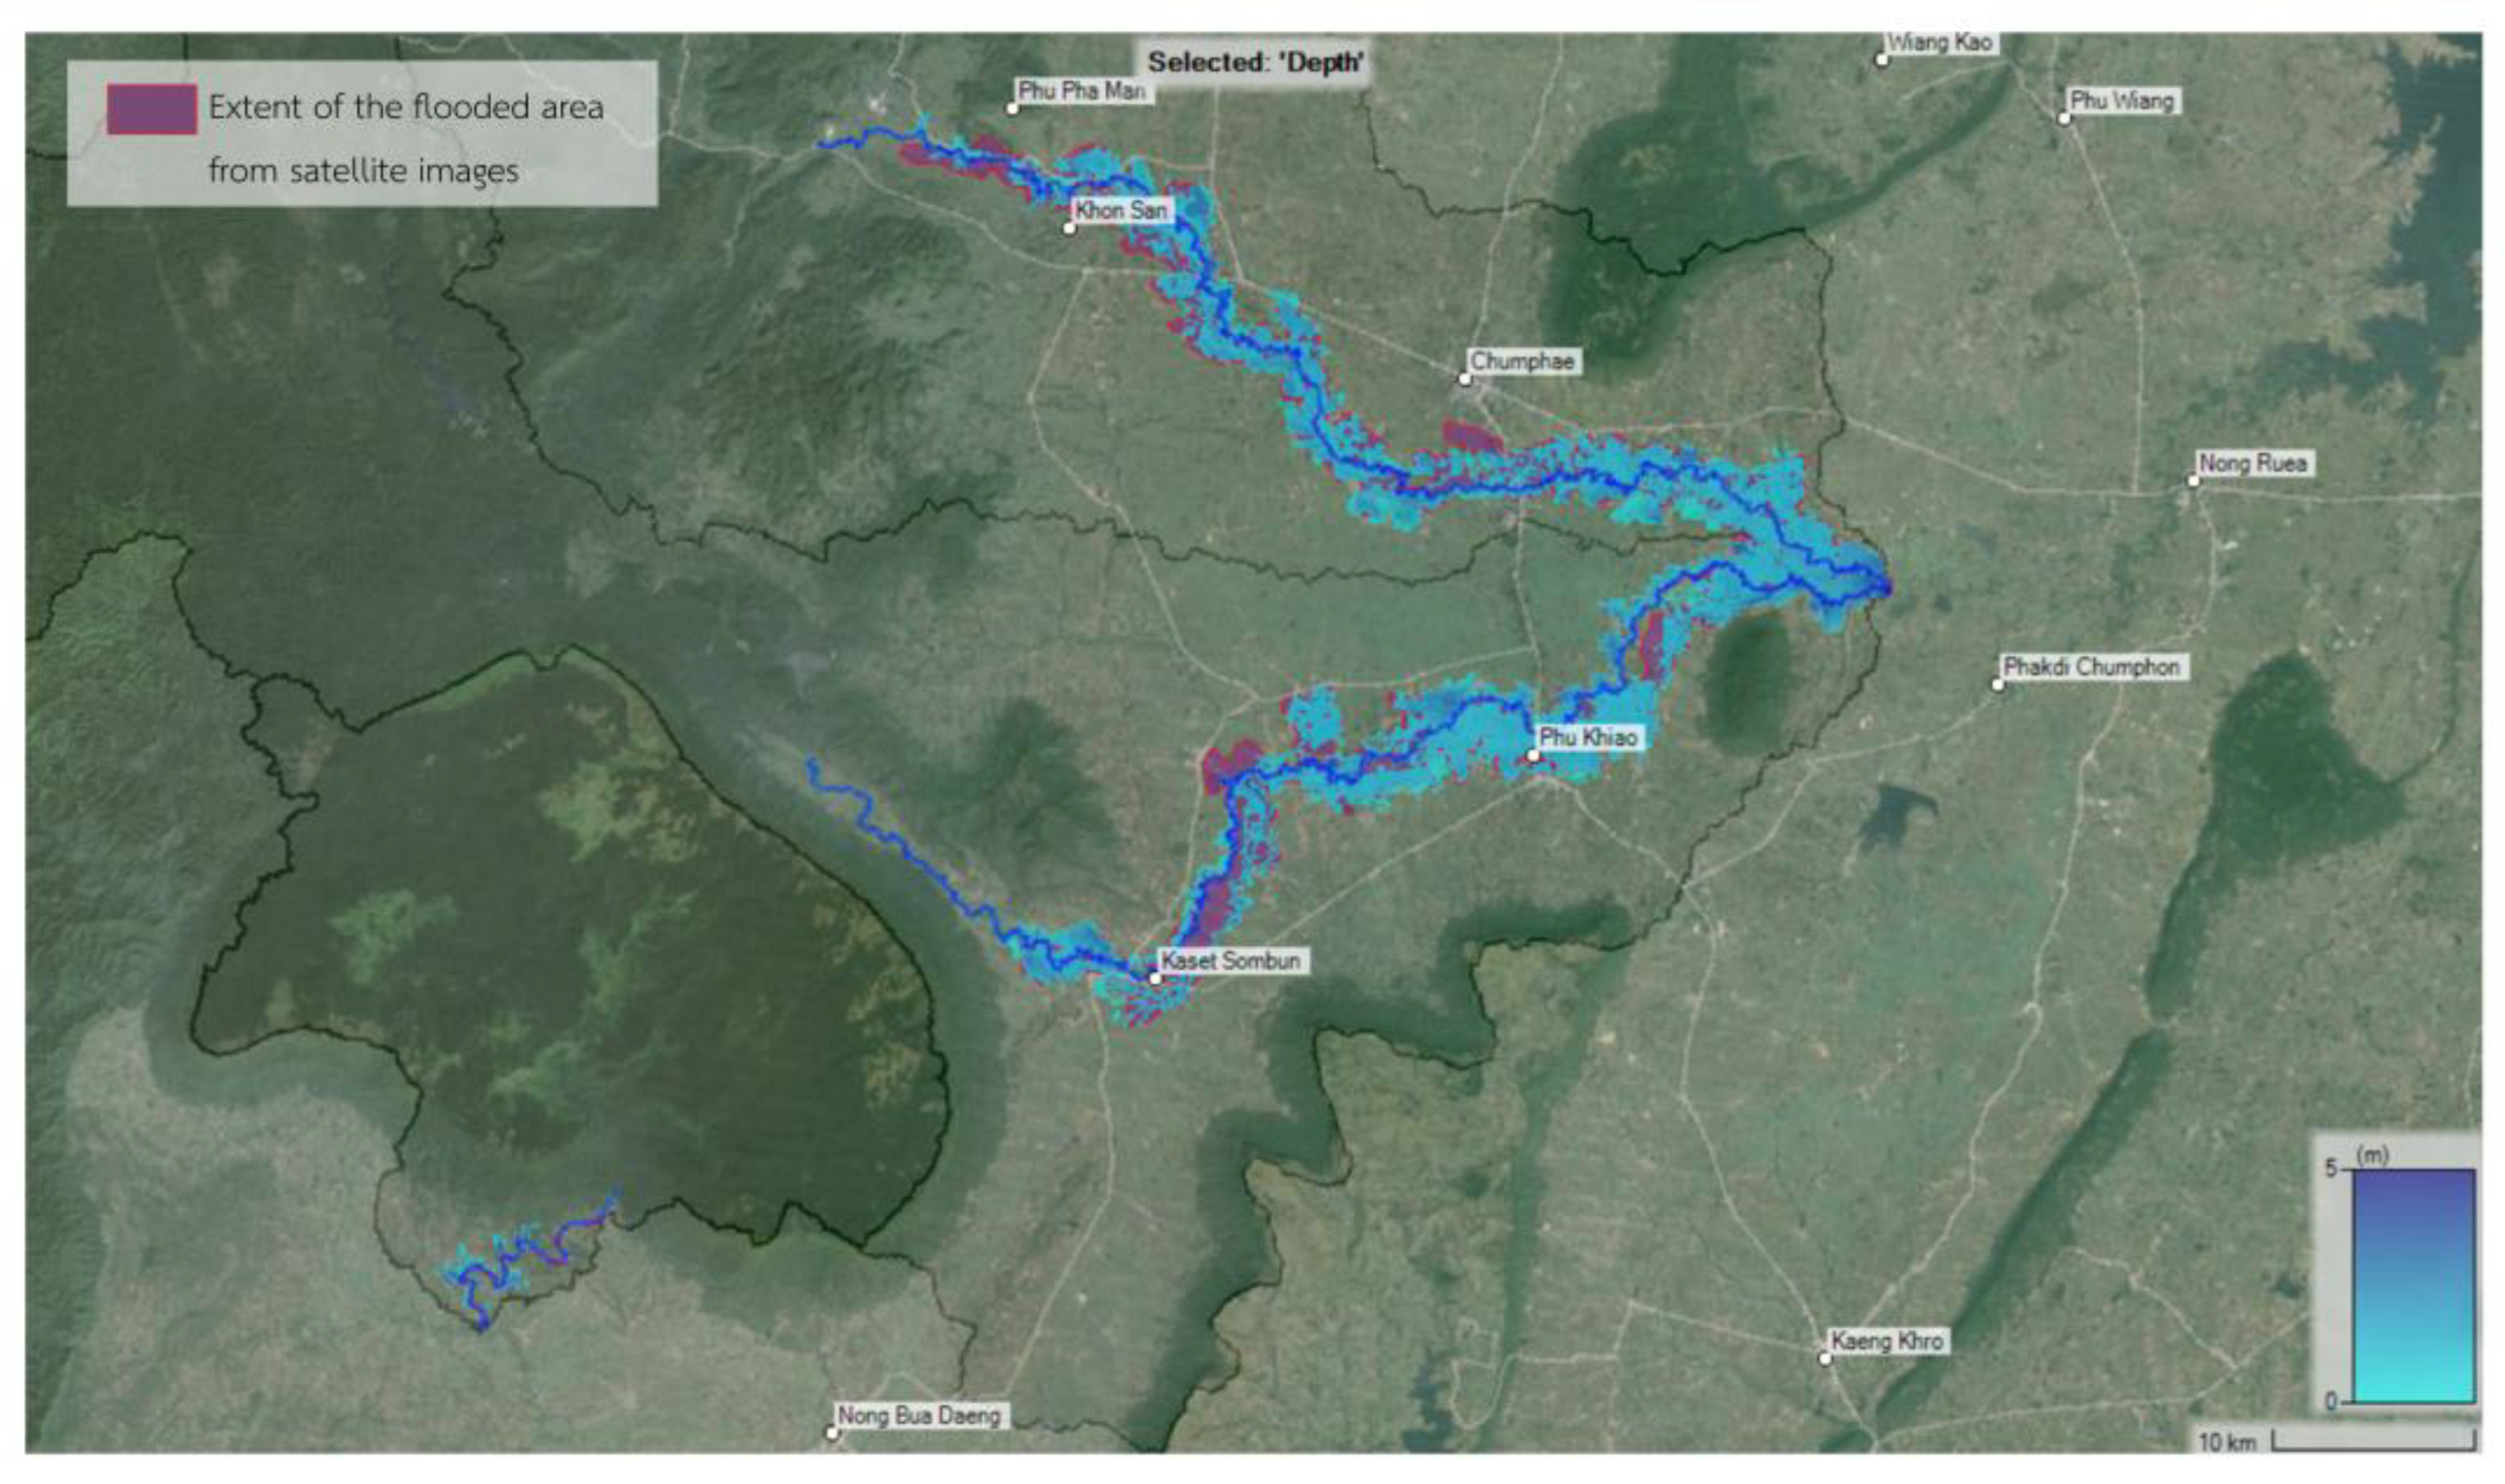
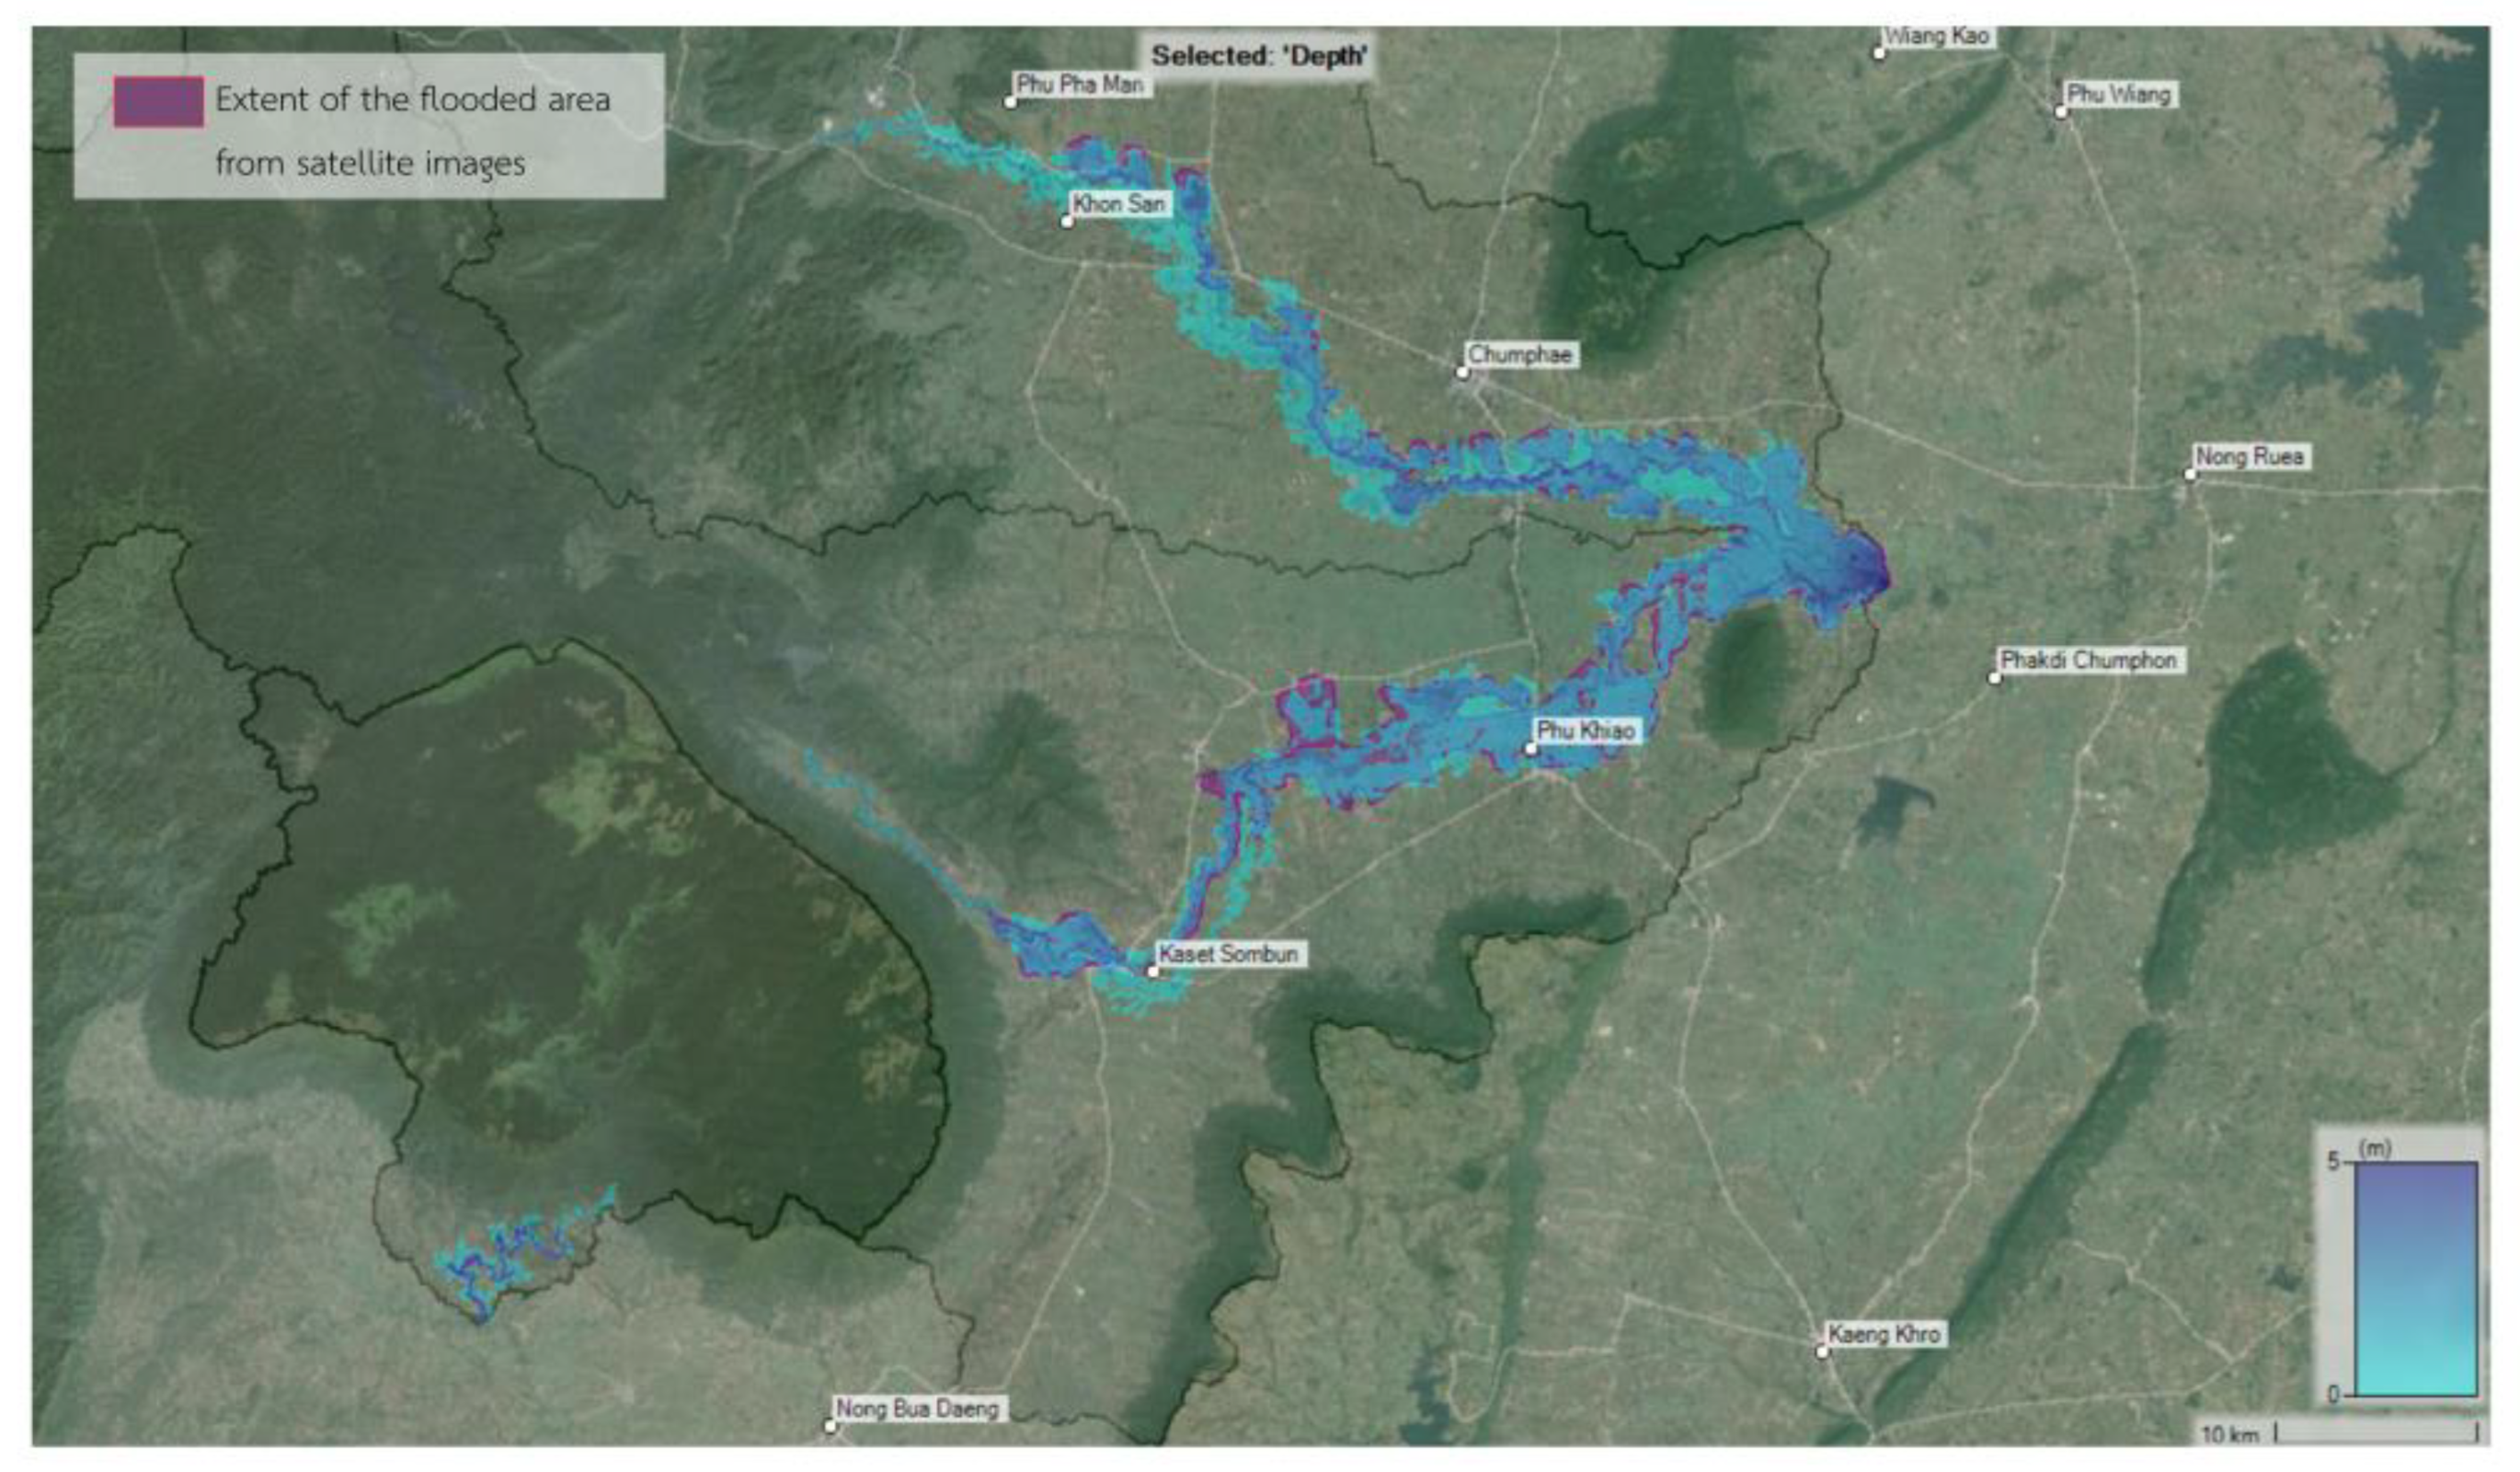
Figure 16.
Verification of flood area extent on 20 October 2010 from the HEC-RAS model and from GISTDA satellite images.
Figure 16.
Verification of flood area extent on 20 October 2010 from the HEC-RAS model and from GISTDA satellite images.
3.2. The Assessment of Flood Area
Results of the assessment of flood area extent using the HEC-RAS model to analyze current flood conditions. The simulations were separated into two important cases. This makes it interesting to analyze the fluctuations in flood conditions in more detail.
3.2.1. Flood Conditions from Changes in Land Use in the Past
In this case, flood simulations were studied in the context of past land use changes. The focus was to analyze the impact of such changes on water flow characteristics and areas that may have been affected by past floods. This study focused on understanding trends and changes that occurred in the area during periods of land use change. Using the 2021 runoff data from the SWAT model imported into the HEC-RAS model and then applying simulated changes in land use in the past for 6 years including the years 2006, 2008, 2010, 2015, 2017 and 2021 results in the simulated flood extent map shown in Figure 17. This approach can show details of the size of the flooded areas in the past classified by type of land use each year as shown in Table 5 and Figure 18.
From the results in Table 5 and Figure 18, it is seen that the trend of the size of flooded areas in each river basin tended to increase steadily with land use from 2006 to 2019. This is the result of changes in land use in which forest areas became agricultural areas. In the Lam Saphung River Basin, there was a flood area of 3.10 km2 in 2006 and a flood area of 3.18 km2 in 2019, an increase of 0.08 km2, equivalent to 2.5% (an increase in the flood area of 0.43% per year). In the Phrom River Basin trhere was a flood area of 96.20 km2 in 2006 and a flood area of 101.48 km2 in 2019, an increase of 5.28 km2, accounting for 5.49% (an increase in the flood area per year of 0.91%). The Chern River Basin Part 1 had a flood area of 84.19 km2 in 2006 and a flood area of 88.82 km2. In 2019, it increased by 4.63 km2, accounting for 5.50% (representing an increase in the flood area per year of 0.92%. In addition, it was found that the type of land use that caused the most flooding in each basin was agricultural land use [56,57].
3.2.2. Flood Events in the Past
In this case, flood simulation was used to study flood events that have occurred in the past. By simulating past floods, this will help understand the nature and impact of past flood events. The approach focused on analyzing the severity of flooding and the areas most affected by past flooding events. This study aims to build an understanding of the nature of past events to enhance knowledge on future flood management and prevention. We used annual runoff data from the SWAT model, imported into the HEC-RAS model and simulated together with land use in the past 6 years, namely 2019, 2017, 2015, 2010, 2008, and 2006. The results of the simulation of the flood extent map are shown in Figure 19 which shows details of the size of the former flood area classified by type of land use. Each year is as shown in Table 6 and Figure 20.
From the results reported in Table 6 and Figure 20, it is seen that the size of the flooded areas in each past year was different. It depended on whether each year experienced a lot of rain resulting in high flooding or if it was a year with little rain resulting in little flooding but drought. From the simulation, it was found that the year 2010 was the year with the highest flooding in the Lam Saphung and Chern River basins Part1 with area sizes of 4.15 km2 and 105.20 km2. In the Phrom River Basin, 2017 was the year with the highest flooding. It has an area of 89.91 km2 for the year with the least flooding, which was the year 2019, both the Lam Saphung Basin, Phrom River Basin, and Chern River Basin Part 1 (an area of 0.55 km2) it was 21.41 km2 and 14.09 km2, respectively. In addition, it was found that the type of land use that caused the most flooding in each basin was agricultural land use [55-58].
3.3. Results of Flood Hazard Assessment
Flood hazard assessment employed data from simulations to analyze and assess the level of risk associated with flooding. This study divided the simulations into two main cases of interest.
3.3.1. Case of Simulating Flood Hazards from Past Land Use Changes
Flood simulation in the context of past land use changes focused on assessing the level of flood hazard produced by such changes. This assessment not only simulated water flow and areas that may be affected but it also categorized the various levels of danger that may occur to the countryside, environment and affecting people by using the 2021 runoff data from the SWAT model and importing it into the HEC-RAS model.
As seen by the results shown in Table 6 and Figure 22, it is found that the trend of the size of flooded areas in each river basin tended to keep increasing from 2006 until 2019. This was a result of the change in land use from forest area to agricultural area. By considering the level of danger from flooding, it was found that the Lam Saphung River basin had an area with the highest flood danger level, at the H5 level; this is unsafe for vehicles and people and less sturdy buildings are at risk of collapsing. The area was between 0.69 - 0.71 km2 in 2006 to 2019 and the danger level was Level H3; this is unsafe for vehicles, children and elderly people. The area is between 0.70 - 0.71 km2. In the years 2006 to 2019, the Phrom River Basin, had an area with the highest flood danger level, at level H3; this is unsafe for vehicles, children, and elderly people. The area was between 29.24 - 33.01 km2 in the years 2006 to 2019 and next level H1: safe for vehicles, people, and buildings, with an area between 29.26 - 31.17 km2 in 2006 to 2019 and the last one is the Chern River Basin Part 1 which has the area with the highest flood danger level, level H3; this is not safe for vehicles, children, and elderly people. The area is between 26.66 - 28.29. km2 in the years 2006 to 2019 and next level H1; this is safe for vehicles, people, and buildings, with an area between 26.60 - 27.27 km2 in 2006 to 2019.
3.3.2. In the Case of Simulating Past Flood Events, Classifying Flood Danger Levels
Simulation of floods from past events helps to classify and assess the level of danger posed by past flood events. This analysis not only provides information about water flow characteristics and affected areas, but it also separates the different levels of danger that exist both at the rural level and in the environment. Using the amount of runoff each year from the SWAT model and importing it into the HEC-RAS model by simulating with land use in the past 6 years (2019, 2017, 2015, 2010, 2008 and 2006). The results of the simulation of the flood hazard level map are shown in Figure 23 showing details of the size of the flooded areas in the past. The level of flood danger in each year can be classified as shown in Table 8 and Figure 24.
From the results in Table 8 and Figure 24, it is seen that the area size of flood danger levels was different in different years. It was found that there was a flood in each year. Flood danger levels were mostly H1, which is safe for vehicles, people, and buildings, and H3: not safe for vehicles, children, and elderly people, except for the Lam Saphung river basin. The highest level of flood danger is H5, which is unsafe for vehicles and people and less sturdy buildings are at risk of collapse. The second level is H3, which is unsafe for vehicles, children, and the elderly. This is because it is a river basin with a high slope near the beginning of the river. When reaching the middle to lower reaches, the slope of the river decreases. As a result, the water flows quickly and floods occur from the middle to the back of the water [59-60].
4. Conclusions
This research represents a pioneering effort to improve flood risk assessment in flash flood-prone regions by integrating advanced methods. Focusing specifically on the application of the HEC-RAS model, this study uses two methods to holistically assess flood conditions and flash flood-related hazards. Central to this effort is the meticulous application of the HEC-RAS model. It is a robust tool developed by the U.S. Army Corps of Engineers. This research provides an in-depth analysis of hydraulic dynamics to facilitate estimating flood risk in areas with a history of flash floods. The reliability of the model was rigorously verified using key statistical indicators including R2, NSE and PBIAS which confirmed its accuracy in simulating observed flood conditions.
In addition to assessing flood conditions. The research was expanded to assess the extent of the flooded area and associated hazards. A two-case simulation strategy was adopted. It covered future scenarios related to land use changes and retrospective analysis of past flood events. This comprehensive approach not only enhances the reliability of the HEC-RAS model, but also provides valuable insights for proactive risk management and adaptation strategies.
In summary, the research represents significant progress in estimating risk in flood zones. It combines the application of the HEC-RAS model with a thorough understanding of historical data. The results of this study have practical implications for improving emergency response strategies. land use planning and overall recovery ability in areas at risk of flash floods. The integrated approach emphasizes the research's ability to providing insights and actionable solutions for communities facing ongoing challenges posed by flash floods.
However, the HEC-RAS model used in tis study faces inherent limitations of model simplification and data limitations. This may affect the accuracy of the prediction. The chosen spatial and temporal scale limits generalizability and the study may not explicitly consider future climate variability or changes in land management practices. The assumption of stability and potential uncertainty in model calibration and validation adds complexity to flood risk estimation. Research is lacking that examines human factors. economic and social aspects and uncertainty in comprehensive future simulations. Acknowledging these limitations is important for a thorough interpretation of the study results and emphasizes the need to continually improve flood risk assessment methods.
Author Contributions
Conceptualization, L.S. and A.K.; methodology, L.S.; validation, L.S., and A.K.; formal analysis, L.S.; investigation, L.S.; resources, L.S.; data curation, L.S.; writing—original draft preparation, L.S. and A.K.; writing—review and editing, L.S., J.S., K.S., O.S. and A.K.; visualization, L.S.; supervision, A.K.; project administration, A.K.; funding acquisition, A.K. All authors have read and agreed to the published version of the manuscript.
Funding
This research was financially supported by Mahasarakham University.
Data Availability Statement
The data used to support the findings of this study are available from the corresponding author upon request.
Acknowledgments
The author would like to appreciate the Land Development Department, the Meteorological Department and the Royal Irrigation Department for supporting data.
Conflicts of Interest
The authors declare no conflict of interest.
References
- Bruno, Merz., Günter, Blöschl., Sergiy, Vorogushyn., Francesco, Dottori., Jeroen, C., J., H., Aerts., Paul, D., Bates., Miriam, Bertola., Matthias, Kemter., Matthias, Kemter., Heidi, Kreibich., Upmanu, Lall., Elena, Macdonald. (2021). Causes, impacts and patterns of disastrous river floods. [CrossRef]
- Ali, Davoudi-Kiakalayeh. (2023). Editorial. IIUM Engineering Journal. [CrossRef]
- Katsutoshi, Nishino. (2022). Flood Management—An Overview. [CrossRef]
- Carlos, Fernandez. (2023). Strategies for crisis organisations and management of torrential floods and important urban runoffs. [CrossRef]
- Mathew, Bamm., Robert, Dickinson., Courtney, King., Bridget, Thrasher. (2017). WeatherShift Water Tools: Risk-Based Resiliency Planning for Drainage Infrastructure Design and Rainfall Harvesting. [CrossRef]
- Antonietta, Simone., Alessandra, Cesaro., Cristiana, Di, Cristo., Oreste, Fecarotta., Maria, Cristina, Morani. (2023). Monitoring planning for urban drainage networks. IOP Conference Series: Earth and Environmental Science. [CrossRef]
- Dwi, Ariyani., Mohammad, Yanuar, Jarwadi, Purwanto., Euis, Sunarti., Perdinan. (2022). Contributing Factor Influencing Flood Disaster Using MICMAC (Ciliwung Watershed Case Study). Jurnal pengelolaan sumberdaya alam dan lingkungan,. [CrossRef]
- Adaku, Jane, Echendu. (2023). Human factors vs climate change; experts’ view of drivers of flooding in Nigeria. Natural hazards research. [CrossRef]
- Bizuneh, Asfaw, Abebe., Berhane, Grum., Mebrahtom, G., Kebedew. (2023). Investigation of Flood incidence causes and mitigation: Case study of Ribb river, northwestern Ethiopia. Natural hazards research. [CrossRef]
- Liutong, Chen., Qian, Li., Yingjun, Xu. (2022). Flash Flood Risk Assessment in the context of Economic Change Scenarios. Weather, Climate, and Society. [CrossRef]
- Ahmed, Shawky., Quazi, K., Hassan. (2023). Geospatial Modeling Based-Multi-Criteria Decision-Making for Flash Flood Susceptibility Zonation in an Arid Area. Remote sensing. [CrossRef]
- Hayley, J. , Fowler., Anna, Jarosz. (2023). Anthropogenic intensification of life-threatening rainfall extremes: Implications for flash floods in urban areas. [CrossRef]
- Mohamed, Abdelkareem., Abbas, M., Mansour. (2023). Risk assessment and management of vulnerable areas to flash flood hazards in arid regions using remote sensing and GIS-based knowledge-driven techniques. Natural Hazards. [CrossRef]
- Hayley, J. , Fowler., Geert, Lenderink., Andreas, F., Prein., Seth, Westra., Richard, P., Allan., Nikolina, Ban., Renaud, Barbero., Peter, Berg., Stephen, Blenkinsop., Hong, Xuan, Do., Hong, Xuan, Do., Selma, B., Guerreiro., Jan, O., Haerter., Jan, O., Haerter., Elizabeth, J., Kendon., Elizabeth, Lewis., Christoph, Schaer., Ashish, Sharma., Gabriele, Villarini., Conrad, Wasko., Xuebin, Zhang. (2021). Anthropogenic intensification of short-duration rainfall extremes. [CrossRef]
- Arnaud, Cerbelaud. (2023). Space-time downscaling of extreme rainfall using stochastic simulations, intense runoff susceptibility modeling and remote sensing-based pluvial flood mapping. [CrossRef]
- Namgyal, T. , Mohanty, M. P., & Anand Thakur, D. (2023, May). How fitting are open-source flood models in capturing flood risks over mountainous regions: A prudent analysis over Chamkar Chu Basin, Bhutan using HEC-RAS v6. 3. In EGU General Assembly Conference Abstracts (pp. EGU-11334).
- Qiuhua, Liang., Xilin, Xia., Huan, Liu. (2023). An integrated hydrodynamic model for flash flood and debris flow simulations. [CrossRef]
- Dimitriadis, P. , Tegos, A., Oikonomou, A., Pagana, V., Koukouvinos, A., Mamassis, N., Koutsoyiannis, D., & Efstratiadis, A. (2016). Comparative evaluation of 1D and quasi-2D hydraulic models based on benchmark and real-world applications for uncertainty assessment in flood mapping. Journal of Hydrology, 534, 478–492. [CrossRef]
- Gonzalez, J. O. (2017). Development of Lower Rio Grande River Water Quality Transportation Numerical Model for Bi-National River Management. The University of Texas Rio Grande Valley.
- Demir, V. , & Keskin, A. Ü. (2020). Obtaining the Manning roughness with terrestrialremote sensing technique and flood modeling using FLO-2D. Geofizika, 37(2), 131–156. [CrossRef]
- Lamb, R. , Keef, C., Tawn, J., Laeger, S., Meadowcroft, I., Surendran, S., Dunning, P., & Batstone, C. (2010). A new method to assess the risk of local and widespread flooding on rivers and coasts. Journal of Flood Risk Management, 3(4), 323–336. Portico. [CrossRef]
- Ongsomwang, S. , & Pukongduean, P. (2016). Urban flood mitigation and prevention using the mike 21 model: a case study of nakhon ratchasima province, thailand. Suranaree Journal of Science & Technology, 23(4).
- Tansar, H., Babur, M., & Karnchanapaiboon, S. L. (2020). Flood inundation modeling and hazard assessment in Lower Ping River Basin using MIKE FLOOD. Arabian Journal of Geosciences, 13(18), 934.
- Kidson, R. L. , Richards, K. S., & Carling, P. A. (2006). Hydraulic model calibration for extreme floods in bedrock-confined channels: case study from northern Thailand. Hydrological Processes: An International Journal, 20(2), 329-344.
- Dr, Jayakrishnan, A, R. (2023). Application of the HEC-RAS Model for the Floodplain Delineation in a Flat Semi-Arid River Basin. [CrossRef]
- Housseyn, Madi., Ali, Bedjaoui., Abdelghani, Elhoussaoui. (2023). Flood Vulnerability Mapping and Risk Assessment Using Hydraulic Modeling and GIS in the Tamanrasset Valley Watershed, Algeria. Journal of Ecological Engineering. [CrossRef]
- Bodoque, J. M. , Amérigo, M., Díez-Herrero, A., García, J. A., Cortés, B., Ballesteros-Cánovas, J. A., & Olcina, J. (2016). Improvement of resilience of urban areas by integrating social perception in flash-flood risk management. Journal of Hydrology, 541, 665–676. [CrossRef]
- O’Loughlin, F. E. , Neal, J., Schumann, G. J. P., Beighley, E., & Bates, P. D. (2020). A LISFLOOD-FP hydraulic model of the middle reach of the Congo. Journal of Hydrology, 580, 124203. [CrossRef]
- Monteil, C. Monteil, C., Foulquier, P., Defossez, S., Péroche, M., & Vinet, F. (2022). Rethinking the share of responsibilities in disaster preparedness to encourage individual preparedness for flash floods in urban areas. International Journal of Disaster Risk Reduction, 67, 102663. [CrossRef]
- Wouter, Vanneuville., K, De, Rouck., K, Maeghe., M., Deschamps., Philippe, De, Maeyer., Frank, Mostaert. (2005). Spatial calculation of flood damage and risk ranking.
- Andrea, Taramelli., Margherita, Righini., Emiliana, Valentini., Lorenzo, Alfieri., Ignacio, Gatti., Simone, Gabellani. (2022). Building-scale flood loss estimation through vulnerability pattern characterization: application to an urban flood in Milan, Italy. Natural Hazards and Earth System Sciences,. [CrossRef]
- Matthias, Mengel., Heidi, Kreibich., Dominik, Paprotny., Michalis, Vousdoukas., Aloïs, Tilloy., Simon, Treu. (2023). Improving estimation of space-time dynamics of floods in Europe by combining modelled and observed flood impact data. [CrossRef]
- Jorge, Manuel, Torres, Pereira., João, Monteiro., Jacinto, Estima., Bruno, Martins. (2019). Assessing flood severity from georeferenced photos. [CrossRef]
- Elton, V. , Escobar-Silva., Cláudia, Maria, de, Almeida., Gustavo, Barbosa, Lima, da, Silva., Ingobert, Bursteinas., Kleber, Lopes, da, Rocha, Filho., Cleber, Gonzales, de, Oliveira., Marina, Refatti, Fagundes., Rodrigo, Cauduro, Dias, de, Paiva. (2023). Assessing the Extent of Flood-Prone Areas in a South-American Megacity Using Different High Resolution DTMs. Water,. [CrossRef]
- Dasgupta, A. , Hybbeneth, L., & Waske, B. (2022). Towards Daily High-resolution Inundation Observations using Deep Learning and EO. arXiv preprint . arXiv:2208.09135.
- Hannah, Porter. (2023). Detection of Flood Events from Satellite Images Using Deep Learning. [CrossRef]
- M, C, Satriagasa., Piyapong, Tongdeenok., Naruemol, Kaewjampa. (2023). Assessing the Implication of Climate Change to Forecast Future Flood Using SWAT and HEC-RAS Model under CMIP5 Climate Projection in Upper Nan Watershed, Thailand. Sustainability,. [CrossRef]
- Curoy, J. , Ward, R., Wang, Y., Martin, D., Alamirew, N., Barlow, J.,... & Nakhapakorn, K. (2023). Flood modelling shows increased impacts from flooding in southern Thailand as a result of climate change.
- Shuyu, Yang., Baoxu, Zhao., Dawen, Yang., Taihua, Wang., Ying, Yang., Teng-Bo, Ma., Jerasorn, Santisirisomboon. (2023). Future changes in water resources, floods and droughts under the joint impact of climate and land-use changes in the Chao Phraya basin, Thailand. Journal of hydrology, . [CrossRef]
- Bodoque, J. M. , Amérigo, M., Díez-Herrero, A., García, J. A., Cortés, B., Ballesteros-Cánovas, J. A., & Olcina, J. (2016). Improvement of resilience of urban areas by integrating social perception in flash-flood risk management. Journal of Hydrology, 541, 665–676. [CrossRef]
- dos Santos Alvalá, R. C. , de Assis Dias, M. C., Saito, S. M., Stenner, C., Franco, C., Amadeu, P., Ribeiro, J., Souza de Moraes Santana, R. A., & Nobre, C. A. (2019). Mapping characteristics of at-risk population to disasters in the context of Brazilian early warning system. International Journal of Disaster Risk Reduction, 41, 101326. [CrossRef]
- Marie, Pelagie, Elimbi, Moudio., Rick, Bolin., Alberta, Carpenter., Samantha, Reese., Arman, Shehabi., P., Kritee, Rao. (2022). Characterizing manufacturing sector disruptions with targeted mitigation strategies. [CrossRef]
- S., Di, Francesco., Chiara, Biscarini., Arnaldo, Pierleoni., P., Manciola. (2016). An engineering based approach for hydraulic computations in river flows. [CrossRef]
- Fangxin, Fang. (2021). Numerical and Data-Driven Modelling in Coastal, Hydrological and Hydraulic Engineering. Water,. [CrossRef]
- Wenbin, Su. , Wei, Ren., Hui, Sun., Canjie, Liu., Xuhao, Lu., Yingli, Hua., Hongbo, Wei., Han, Jia. (2022). Data-Based Flow Rate Prediction Models for Independent Metering Hydraulic Valve. Energies,. [CrossRef]
- Tsuda, H., & Tebakari, T. (2022). Floods and demographics in Thailand, 2005-2019.
- Katawut, Waiyasusri., Parichat, Wetchayont., Aekkacha, Tananonchai., Dolreucha, Suwanmajo. (2023). Flood Susceptibility Mapping Using Logistic Regression Analysis In Lam Khan Chu Watershed, Chaiyaphum Province, Thailand. Geography, Environment, Sustainability. [CrossRef]
- Suwannachai, L., Sriworamas, K., Sivanpheng, O., & Kangrang, A. (2024). Application of SWAT Model for Assessment of Surface Runoff in Flash Flood Areas. Water, 16(3), 495.
- Noor, Suraya, Romali., Zulkifli, Yusop., Ahmad, Zuhdi, Ismail. (2018). Application of HEC-RAS and Arc GIS for floodplain mapping in Segamat town, Malaysia. International Journal of Geomate. [CrossRef]
- Cristian, Popescu., Alina, Barbulescu. (2023). Flash Flood Simulation Between Slănic and Vărbilău Rivers in Vărbilău Village, Prahova County, Romania, Using Hydraulic Modeling and GIS Techniques. [CrossRef]
- Bruce, R. el al., “Fundamentals of Fluid Mechanics”, Iowa State University. Ames,Iowa, USA, 1990, 843 pp.
- Smith GP, Davey EK, Cox RJ (2014) Flood hazard, WRL technical report 2014/07, WRL Tech. Rep. 2014/07, no. September, p 59.
- Moriasi, D.N., et al. (2007) Model Evaluation Guidelines for Systematic Quantification of Accuracy in Watershed Simulations. Transactions of the ASABE, 50, 885-900. [CrossRef]
- Younghun, Jung., Dongkyun, Kim., Dongwook, Kim., Munmo, Kim., Seung, Oh, Lee. (2014). Simplified Flood Inundation Mapping Based On Flood Elevation-Discharge Rating Curves Using Satellite Images in Gauged Watersheds. Water,. [CrossRef]
- Rakwatin, P. , Sansena, T., Marjang, N., & Rungsipanich, A. (2013). Using multi-temporal remote-sensing data to estimate 2011 flood area and volume over Chao Phraya River basin, Thailand. Remote sensing letters, 4(3), -250.
- Turkelboom, F. , Poesen, J., & Trébuil, G. (2008). The multiple land degradation effects caused by land-use intensification in tropical steeplands: A catchment study from northern Thailand. Catena, 75(1), 102-116.
- Petchprayoon, P. , Blanken, P. D., Ekkawatpanit, C., & Hussein, K. (2010). Hydrological impacts of land use/land cover change in a large river basin in central–northern Thailand. International Journal of Climatology, 30(13), 1917-1930.
- Kuntiyawichai, K. , Sri-Amporn, W., Wongsasri, S., & Chindaprasirt, P. (2020). Anticipating of potential climate and land use change impacts on floods: a case study of the lower Nam Phong River Basin. Water, 12(4), 1158.
- Dariusz, Ciszewski., Tomáš, Matys, Grygar. (2016). A Review of Flood-Related Storage and Remobilization of Heavy Metal Pollutants in River Systems. Water Air and Soil Pollution. [CrossRef]
- Xianghu, Li. , Xianghu, Li., Qi, Zhang., Qi, Hu., Dan, Zhang., Xuchun, Ye. (2017). Lake flooding sensitivity to the relative timing of peak flows between upstream and downstream waterways: A case study of Poyang Lake, China. Hydrological Processes. [CrossRef]
Figure 1.
Study Framework.
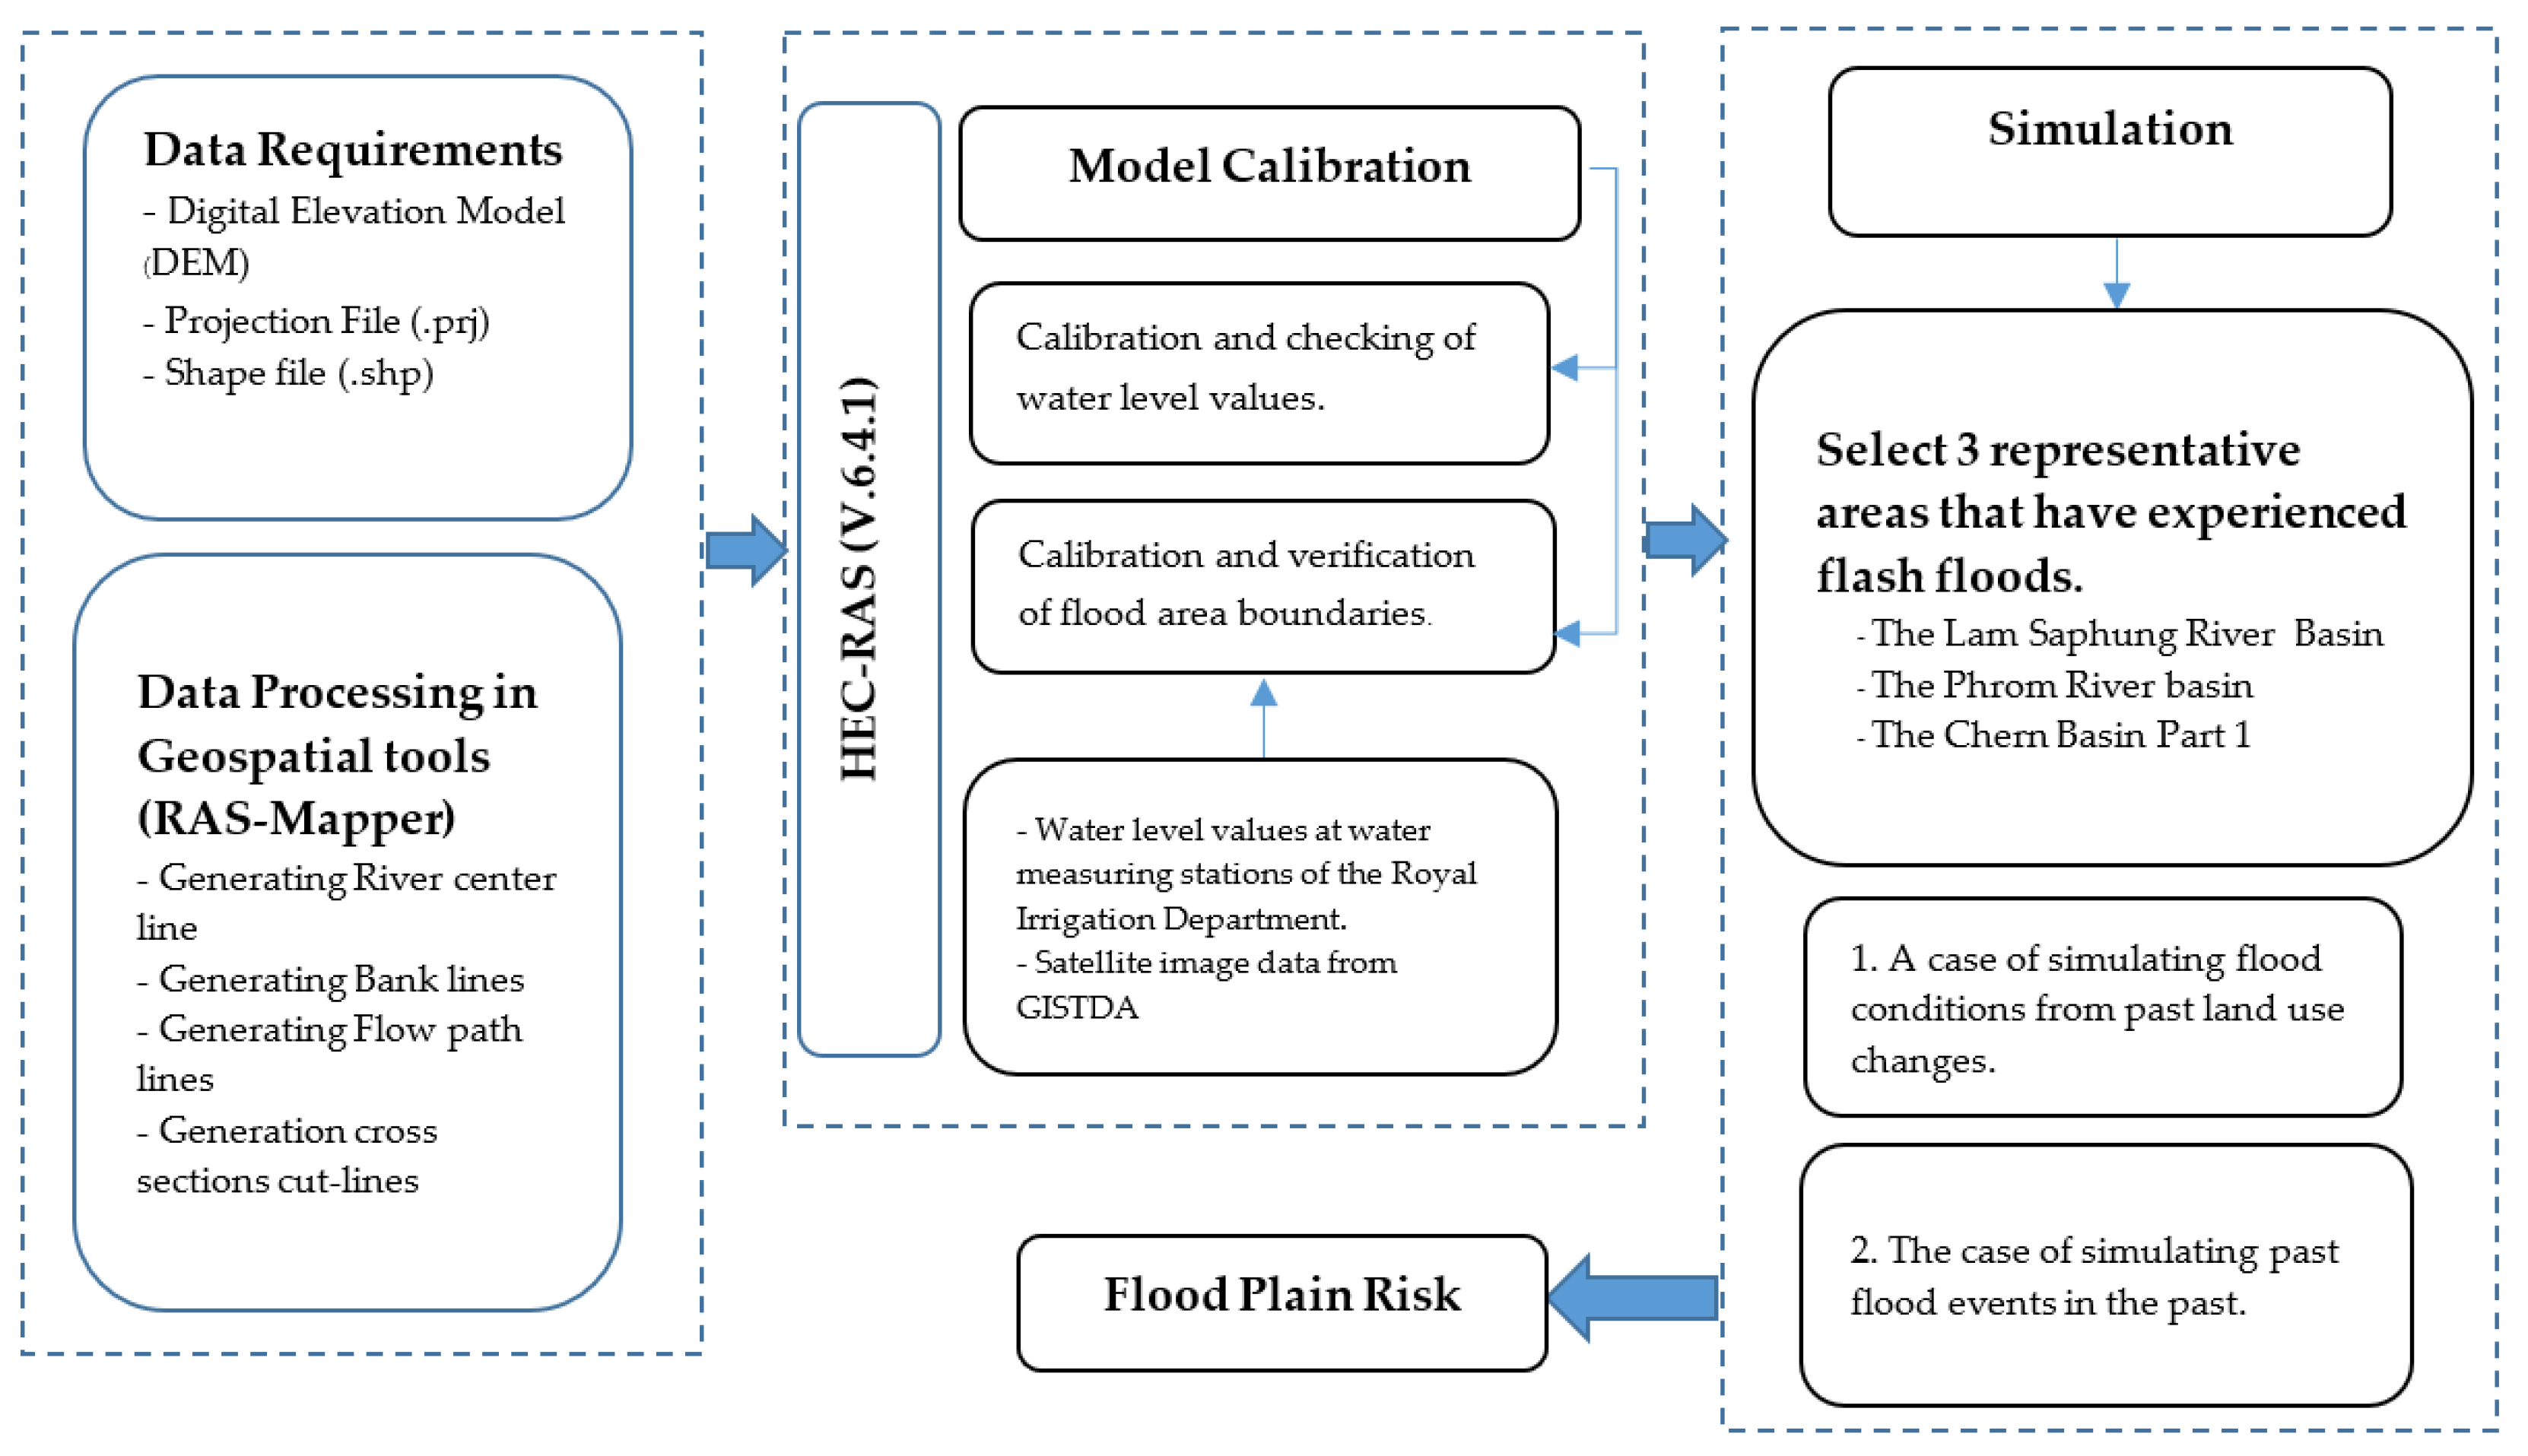
Figure 2.
Study area.
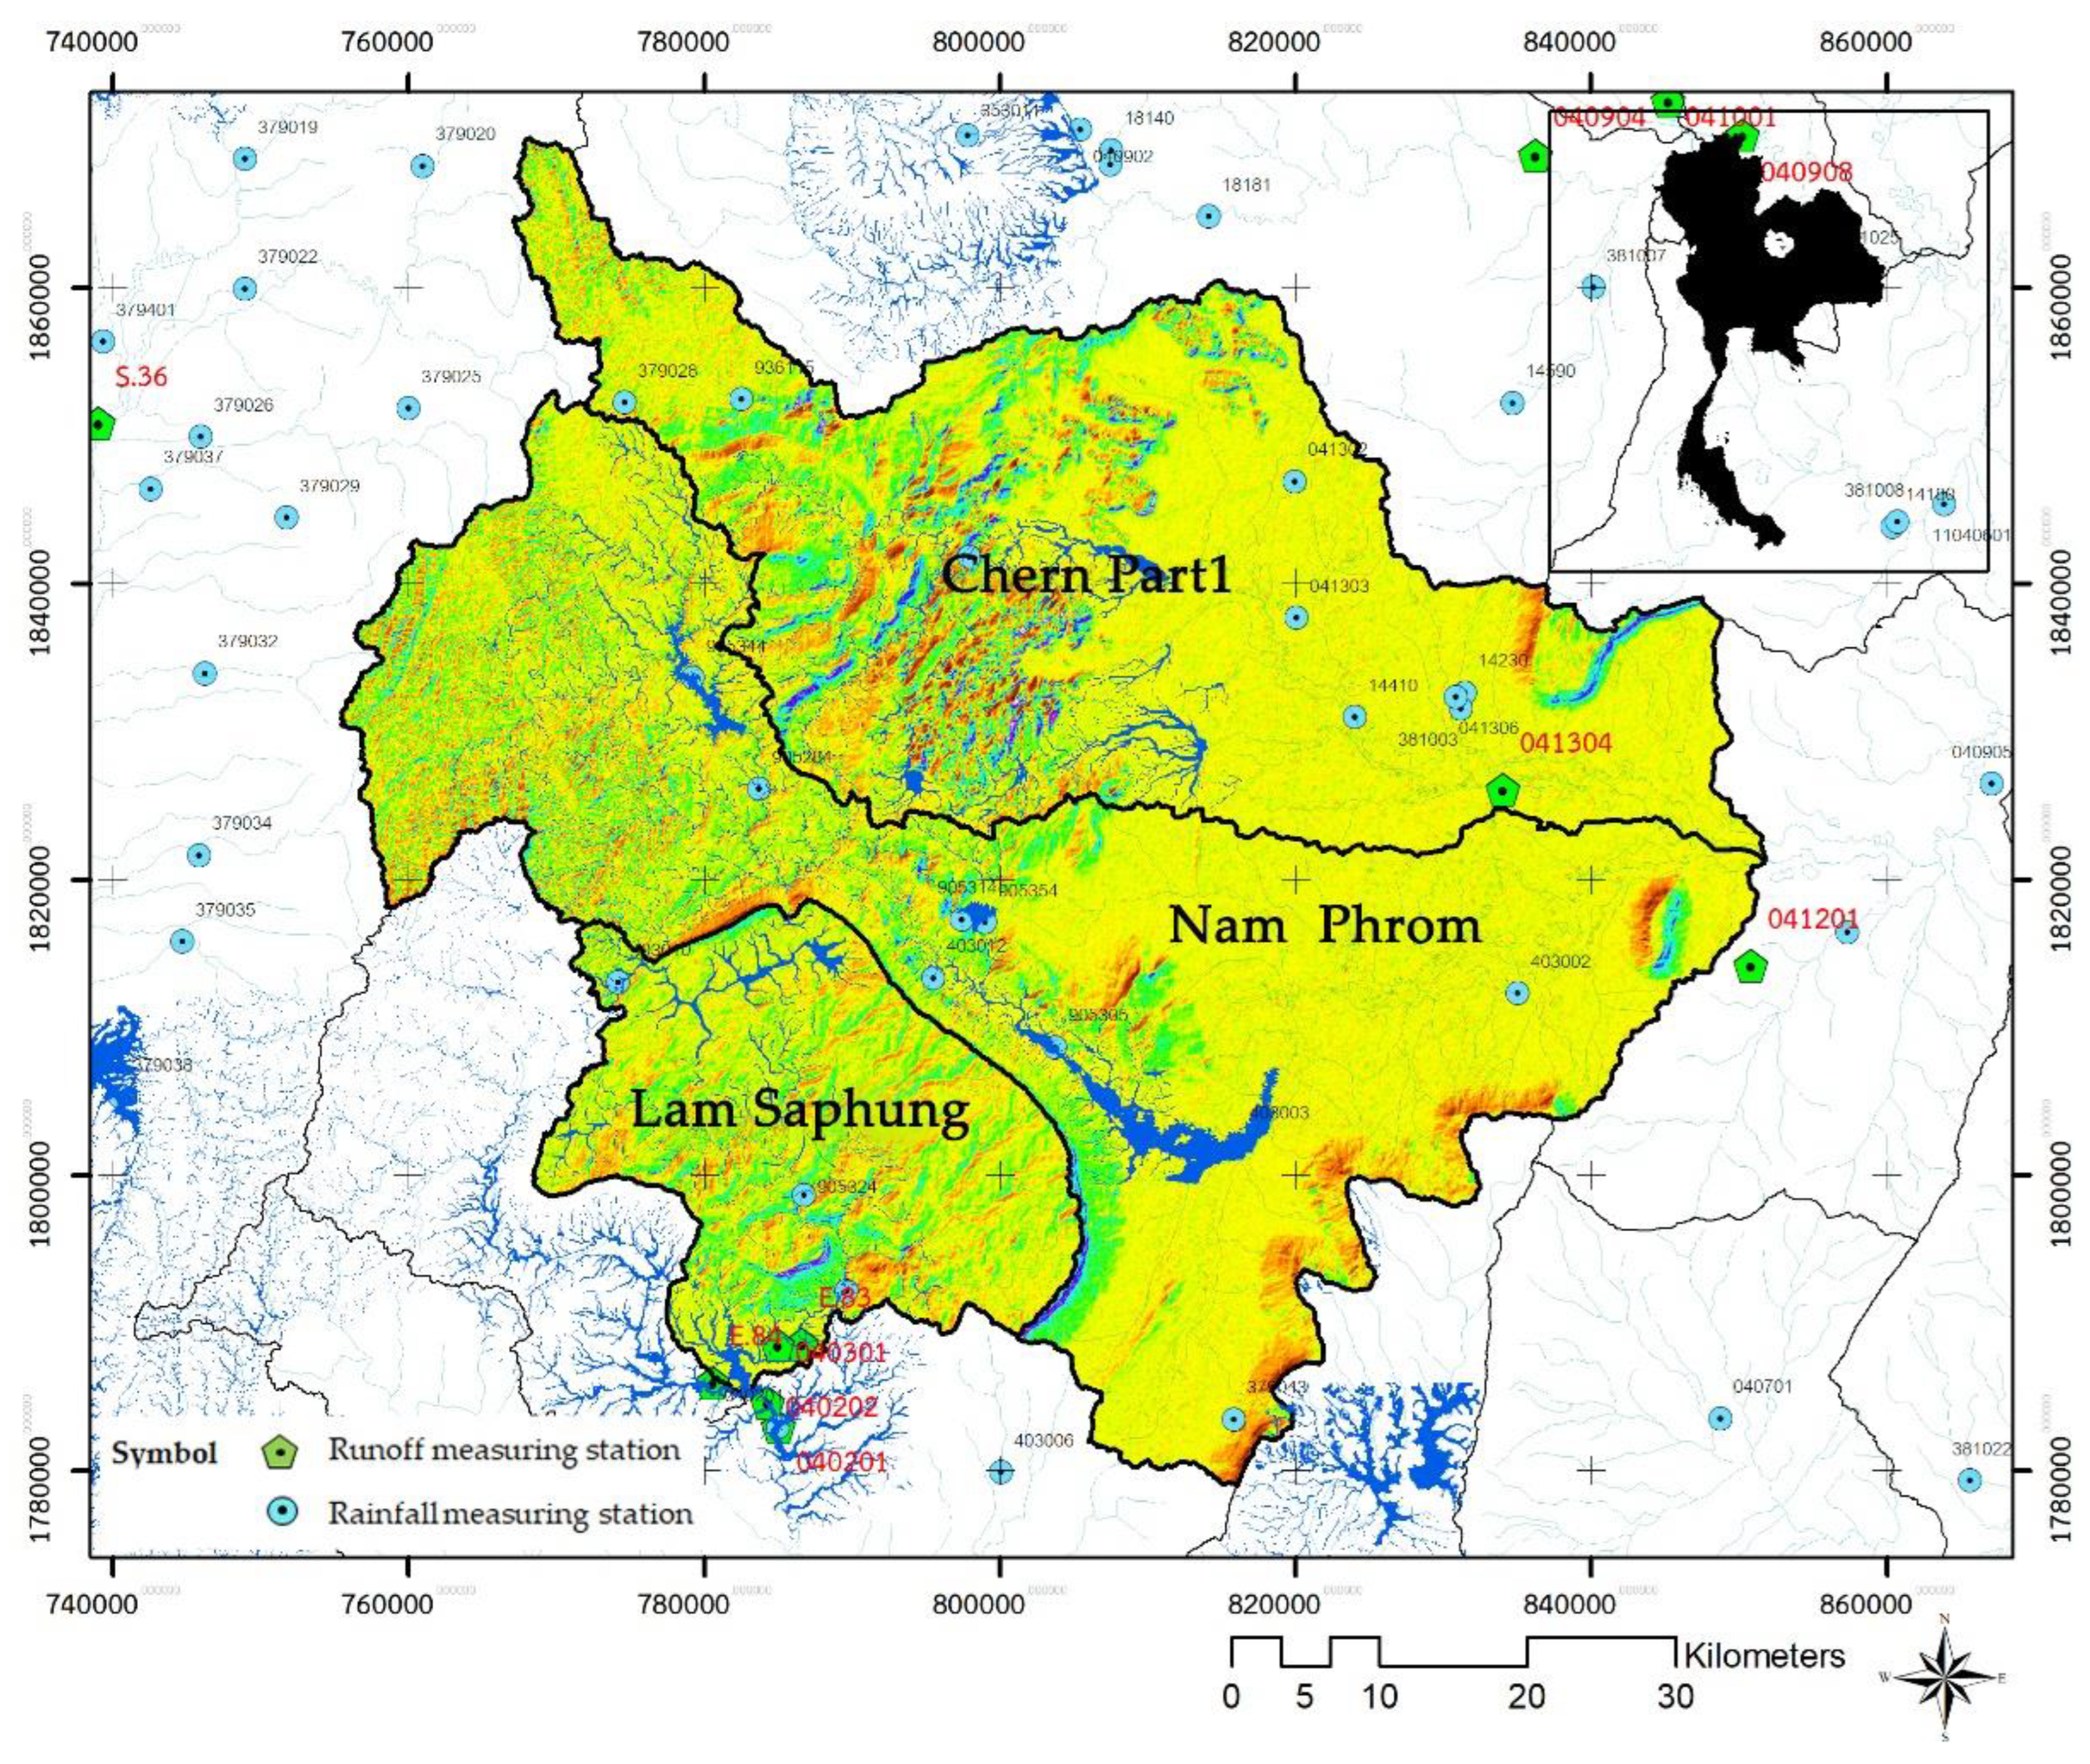
Figure 3.
Creating the center line of the river and the left-right bank in the Ras Mapper window.
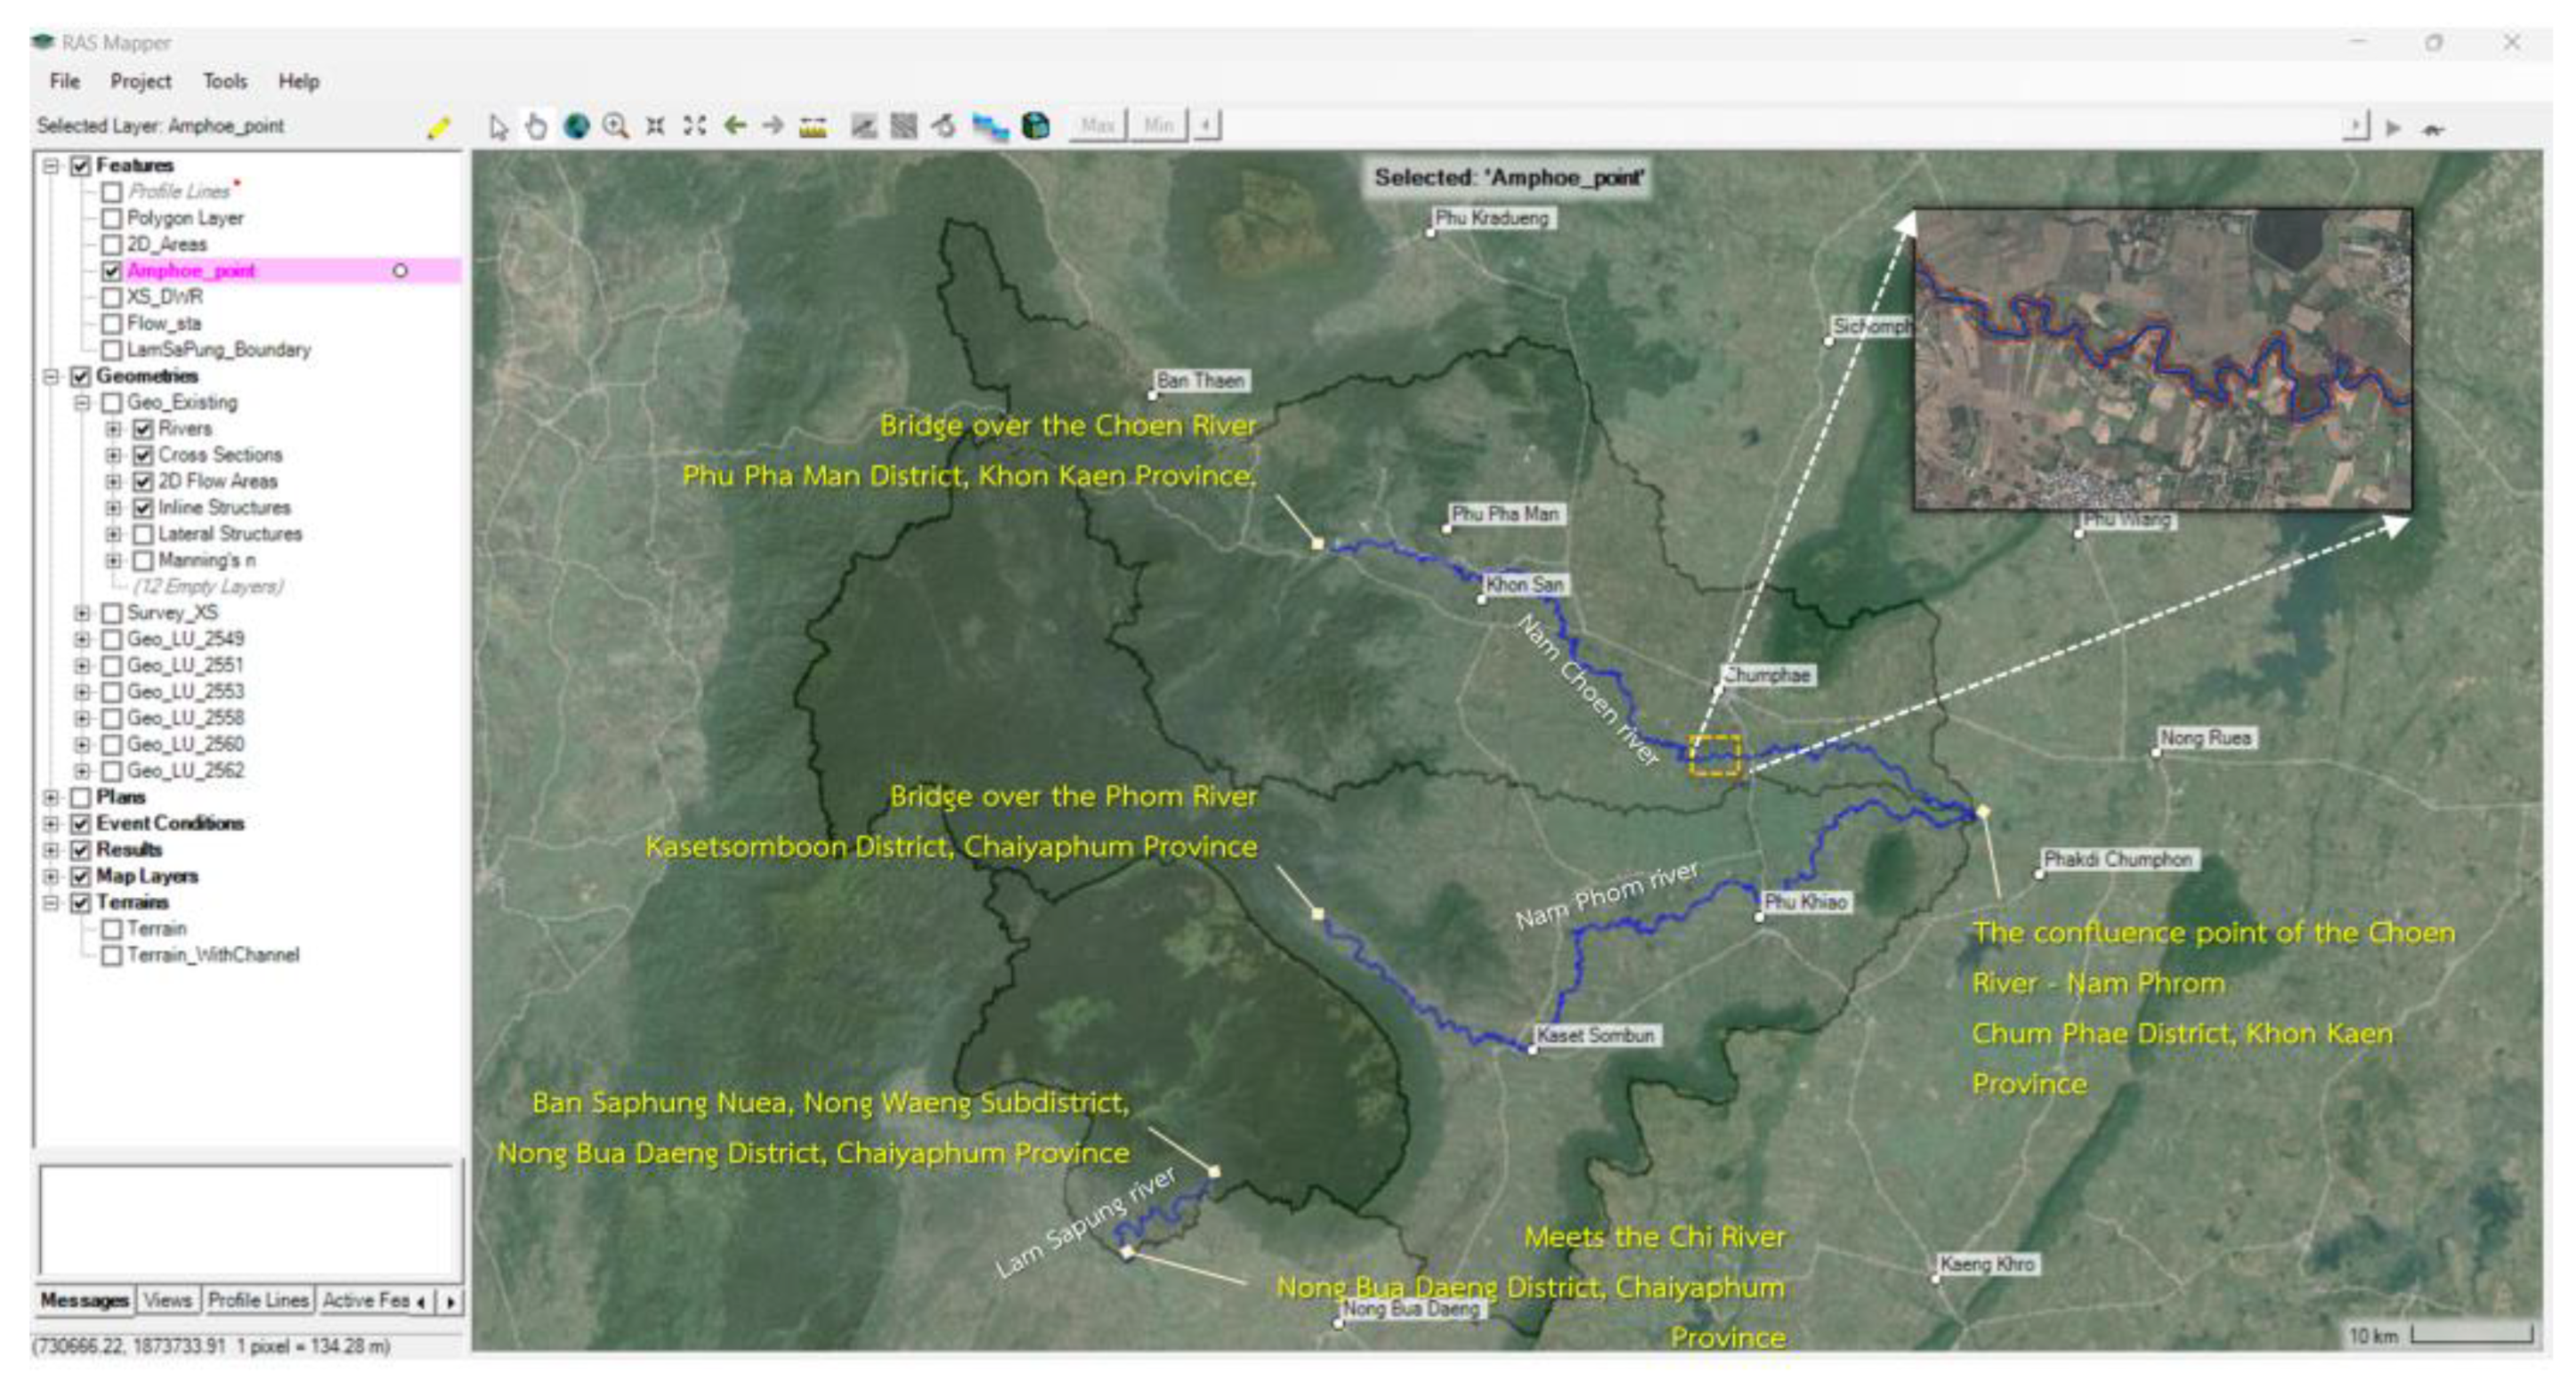
Figure 4.
Importing DEM data with a size of 5x5 m and river cross-section locations from surveys conducted by the Royal Irrigation Department and the Department of Water Resources into the HEC-RAS model.
Figure 4.
Importing DEM data with a size of 5x5 m and river cross-section locations from surveys conducted by the Royal Irrigation Department and the Department of Water Resources into the HEC-RAS model.
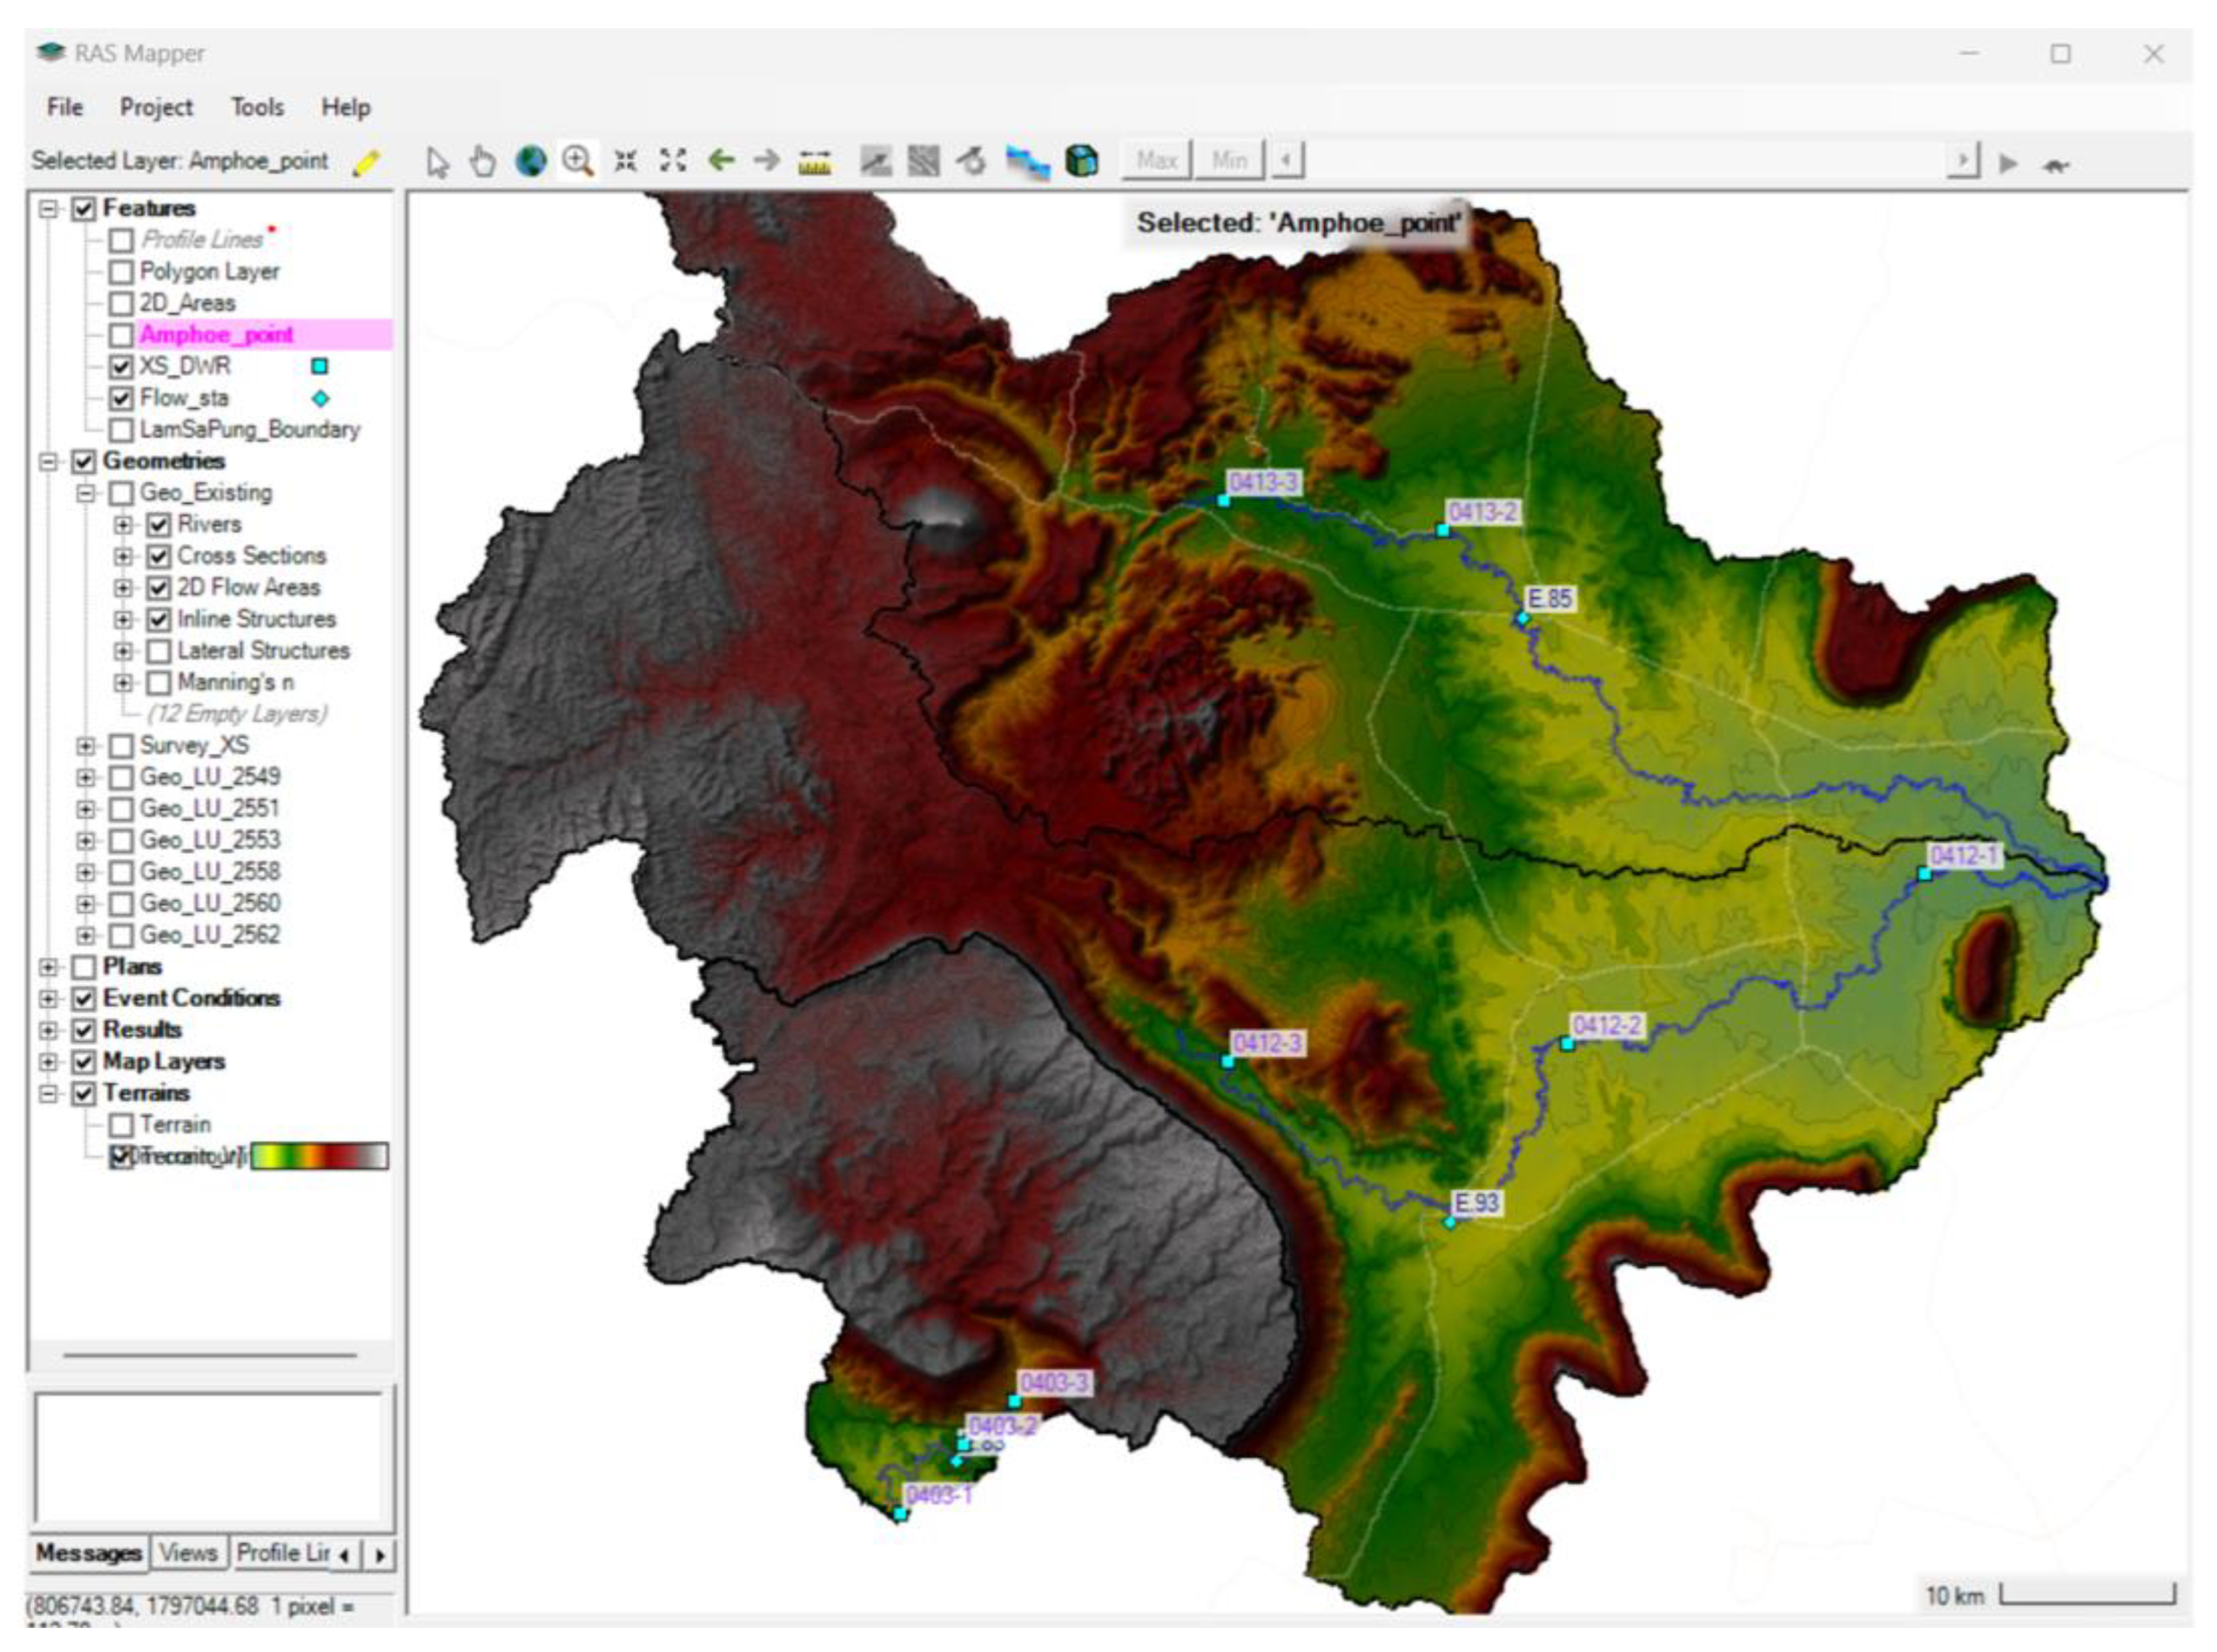
Figure 5.
Lam Saphung Basin survey cross-section imported into the HEC-RAS model.
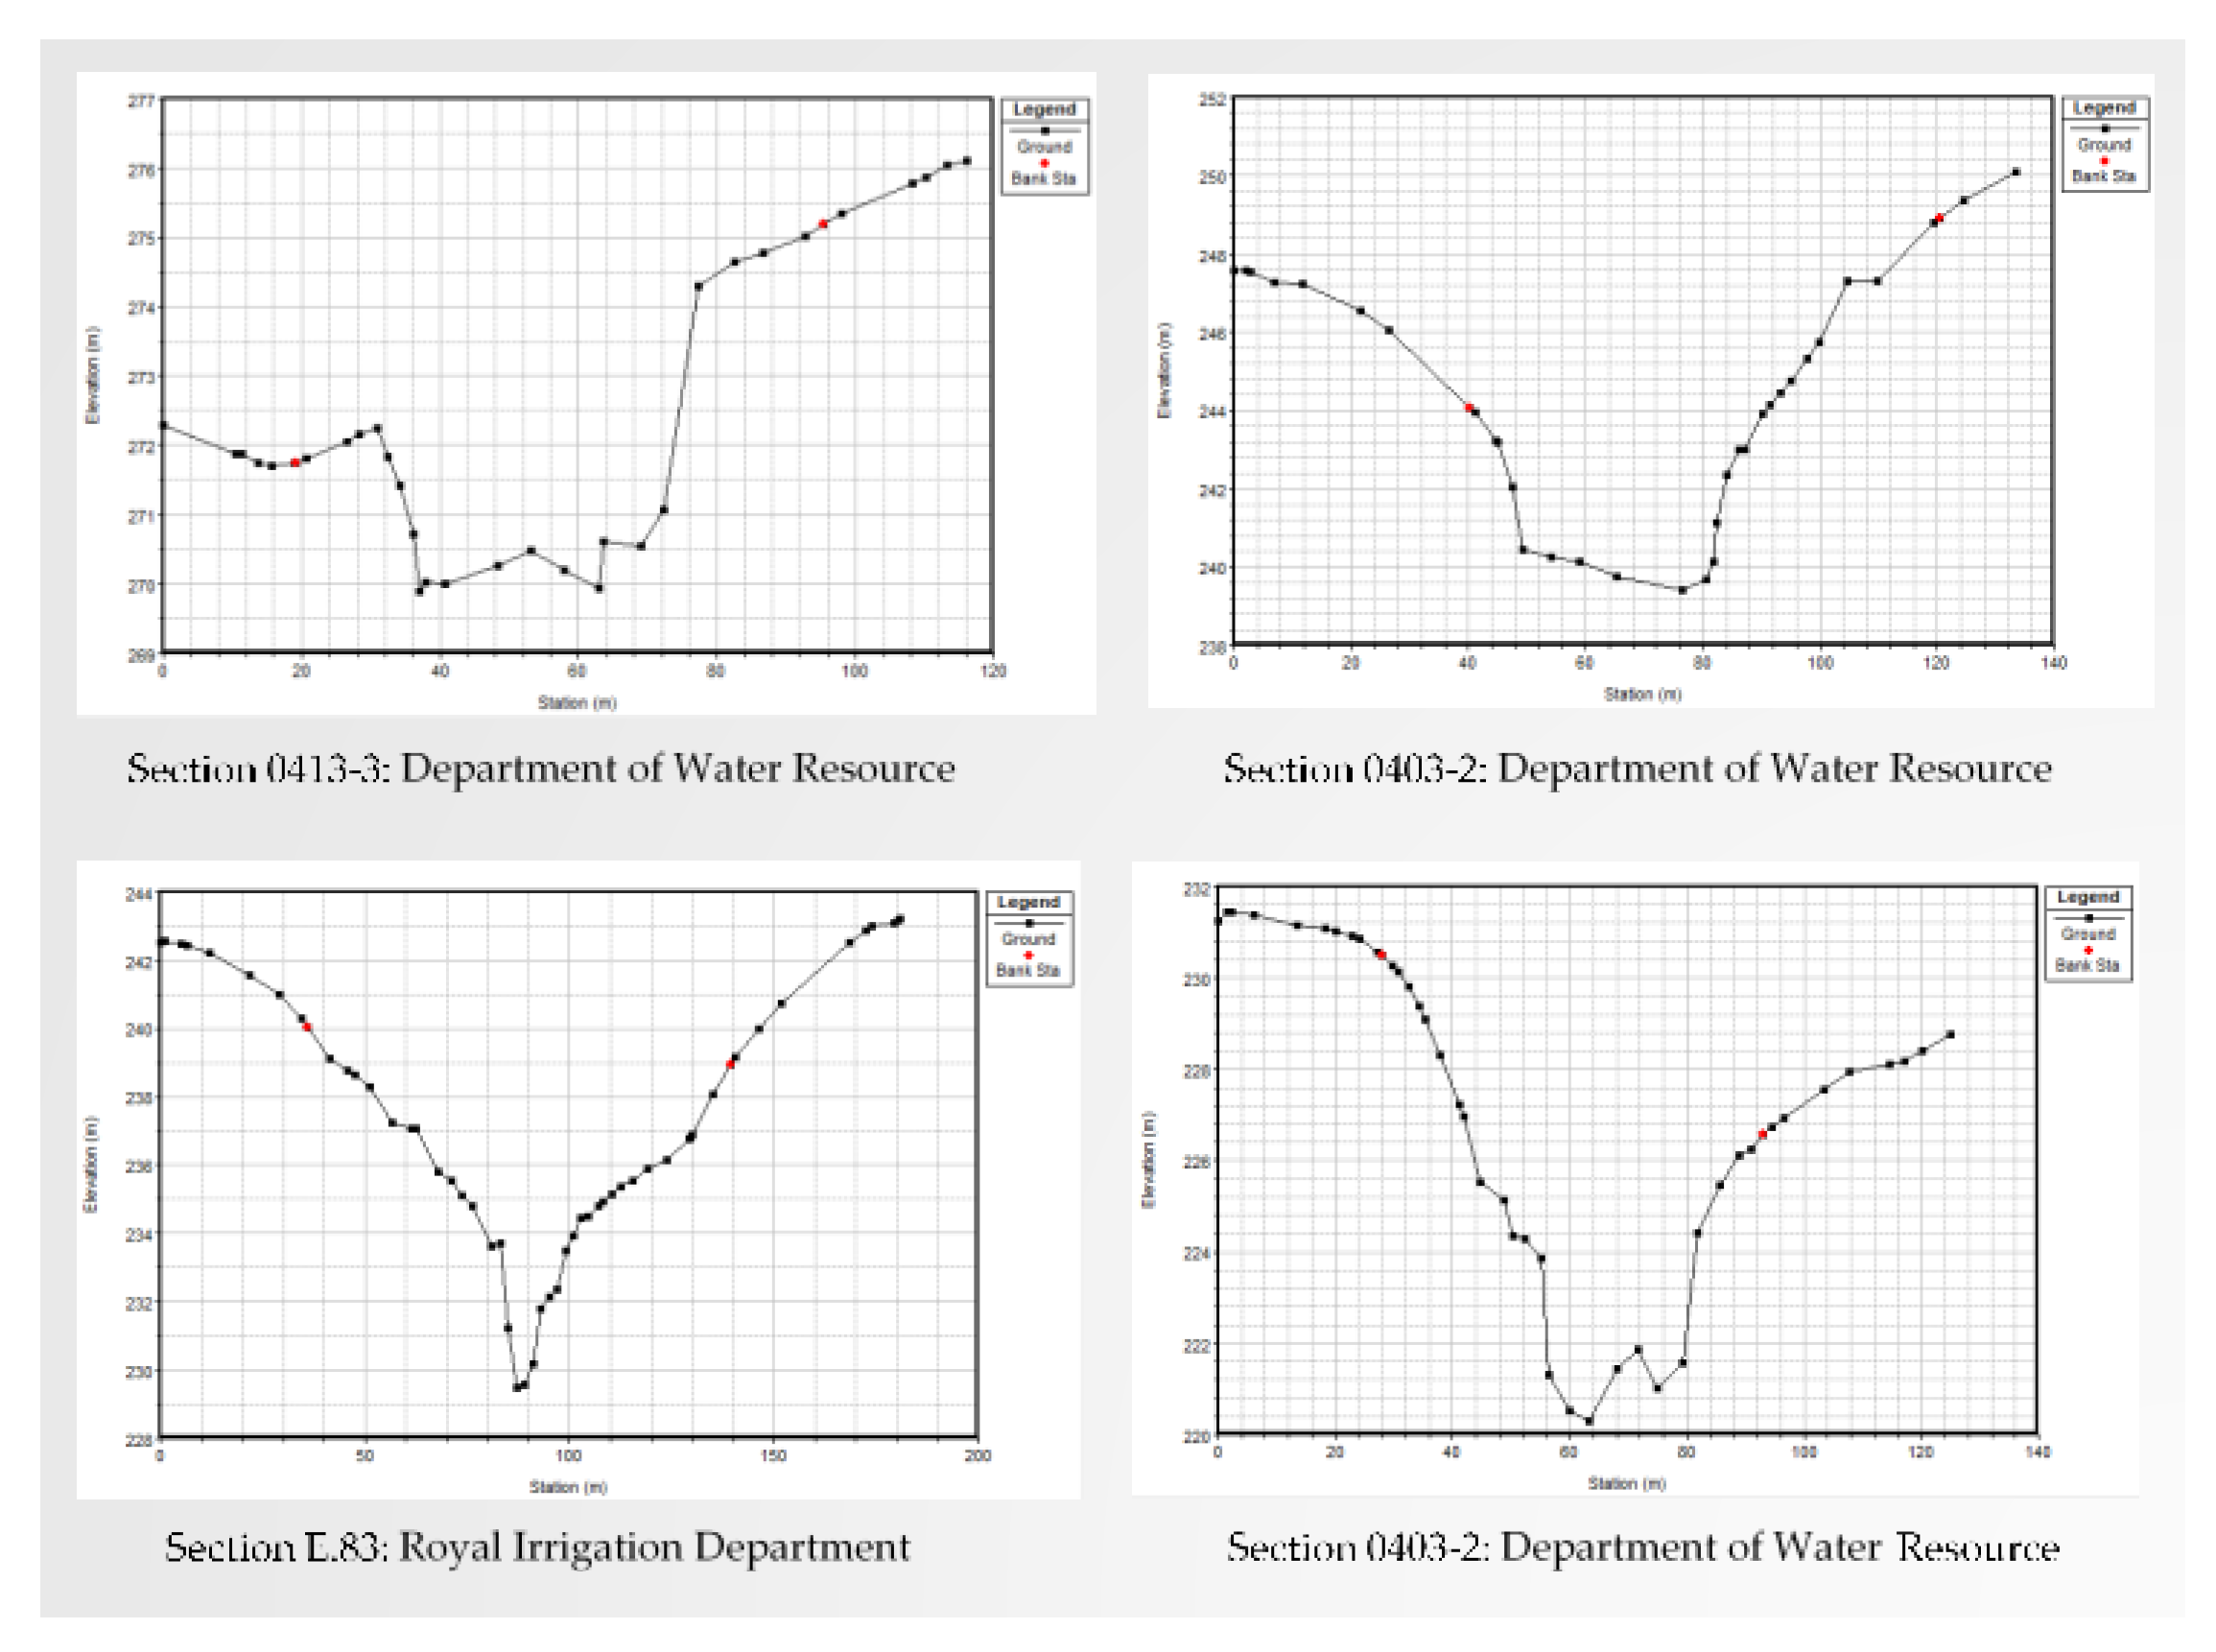
Figure 6.
Carpet basin survey cross section imported into the HEC-RAS model.
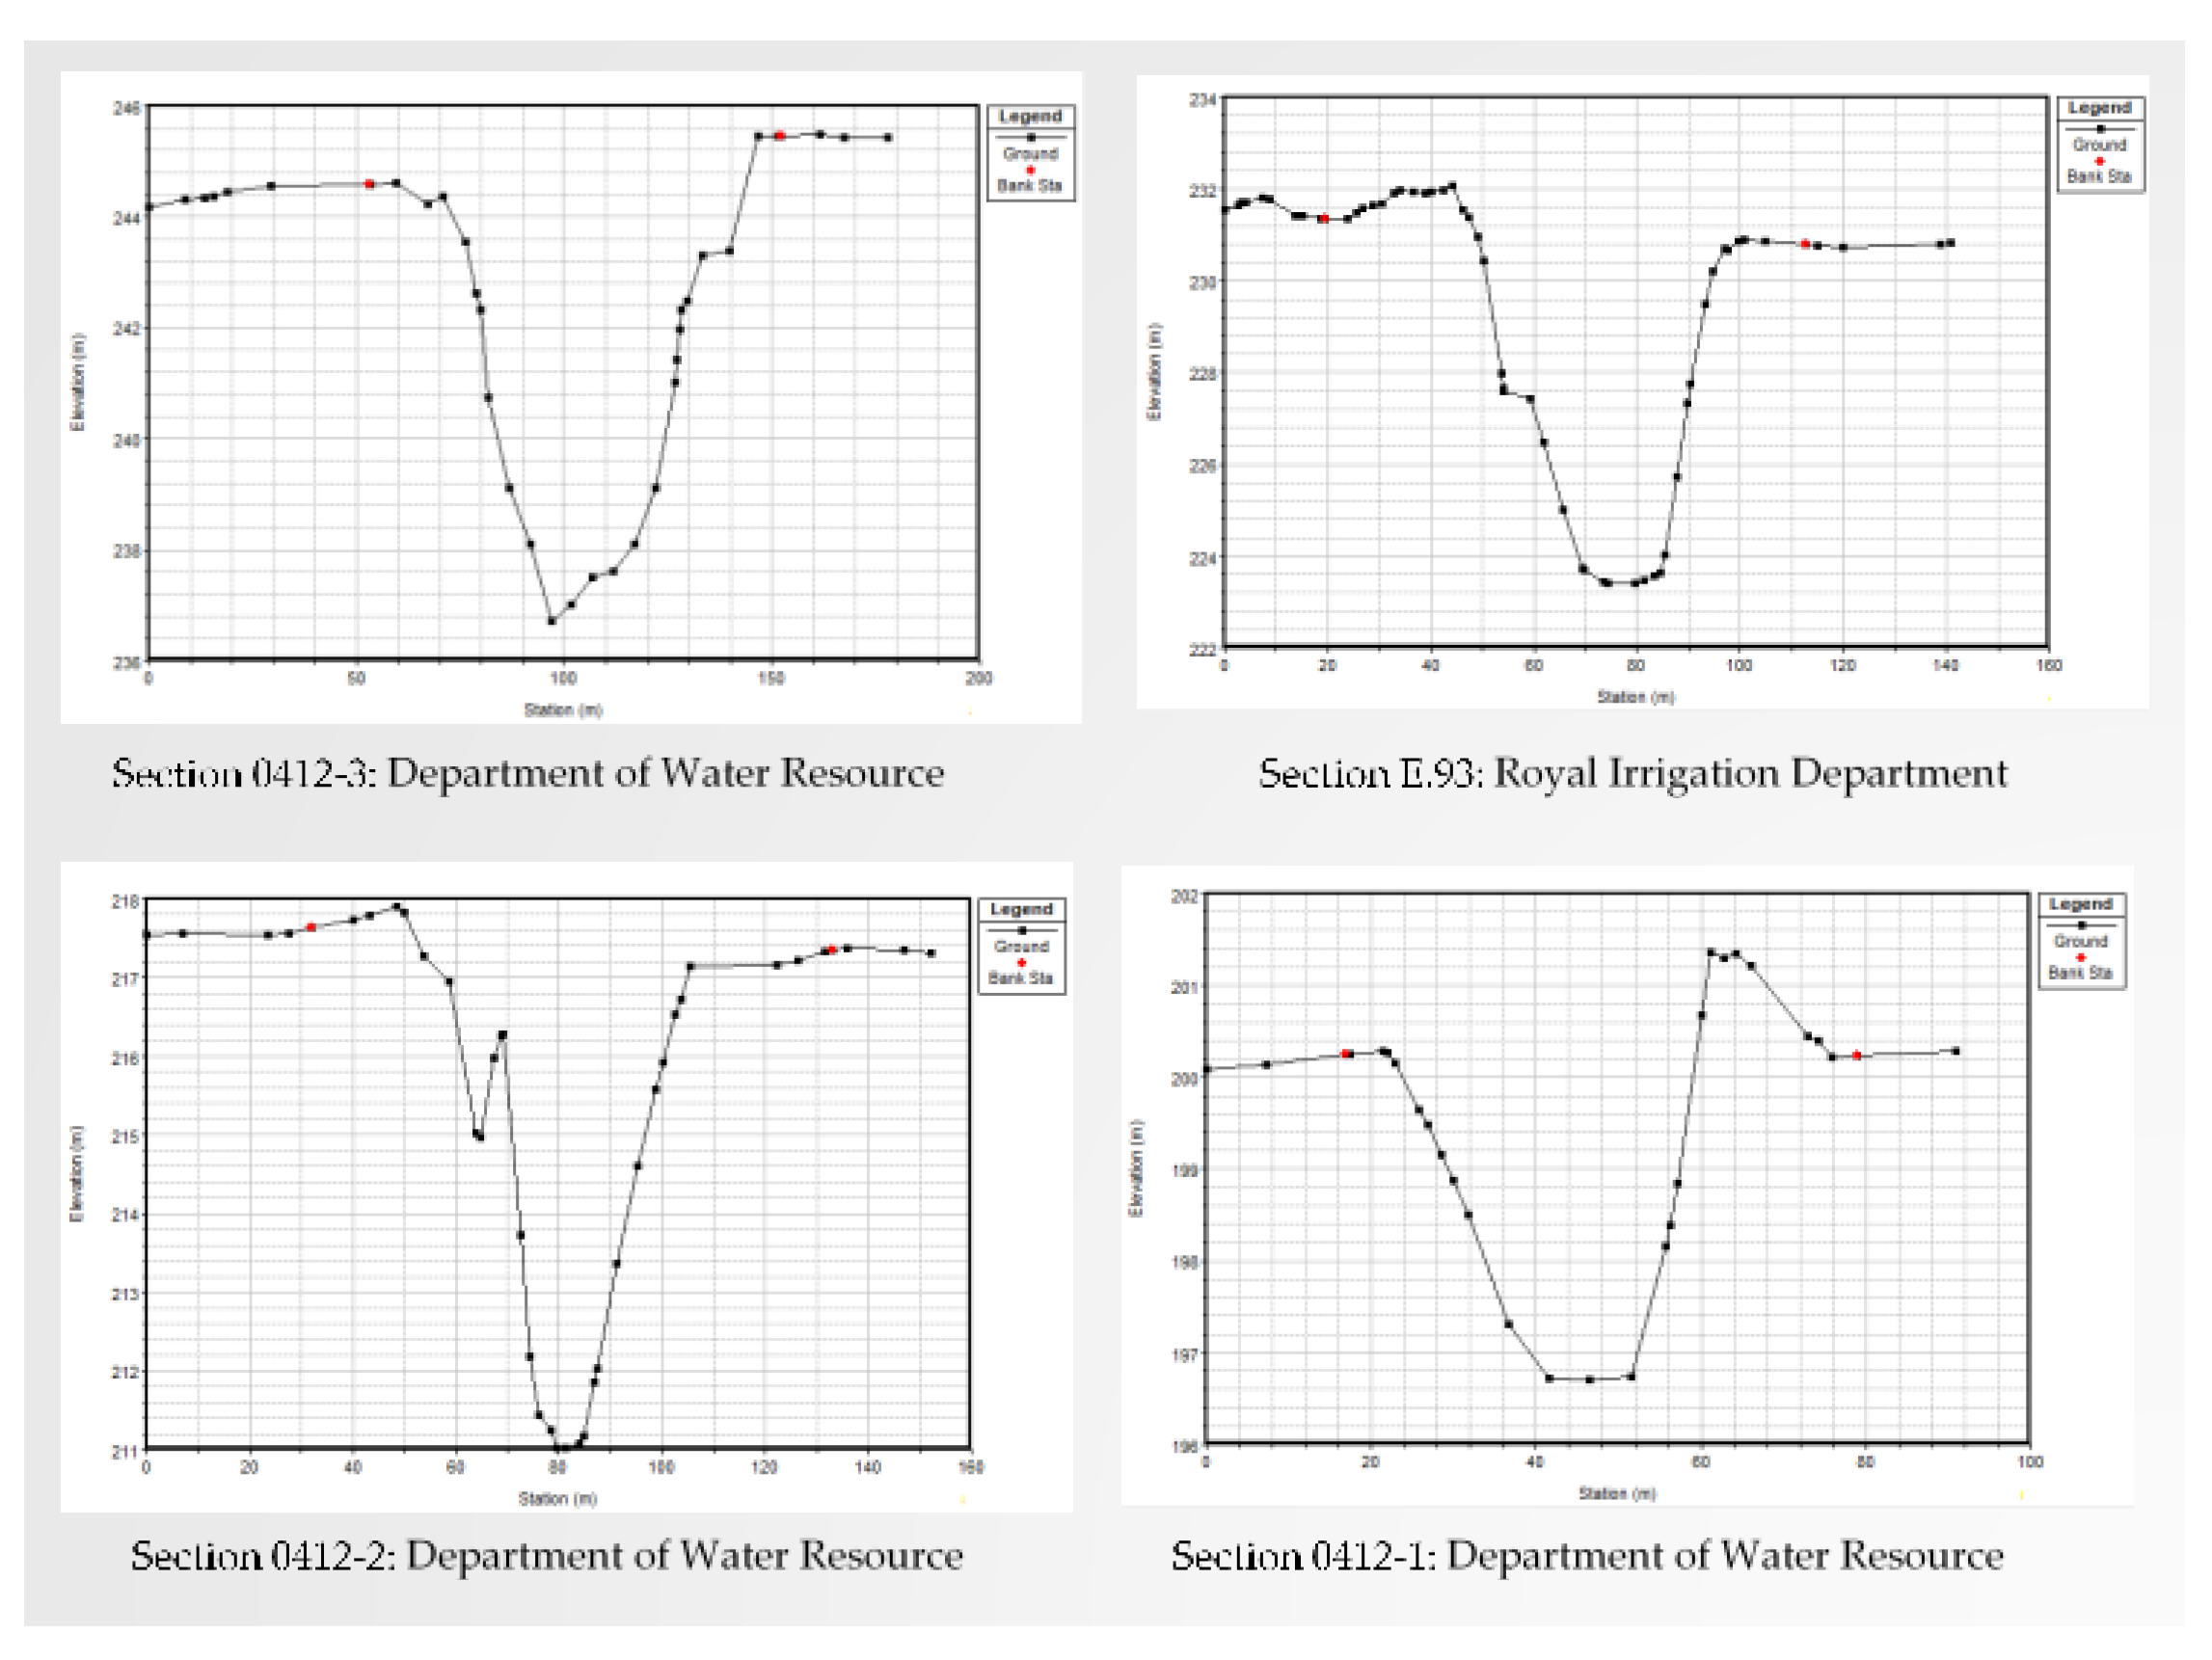
Figure 7.
Cross section of the Nam Chuen River Basin Survey Part 1 imported into the HEC-RAS model.
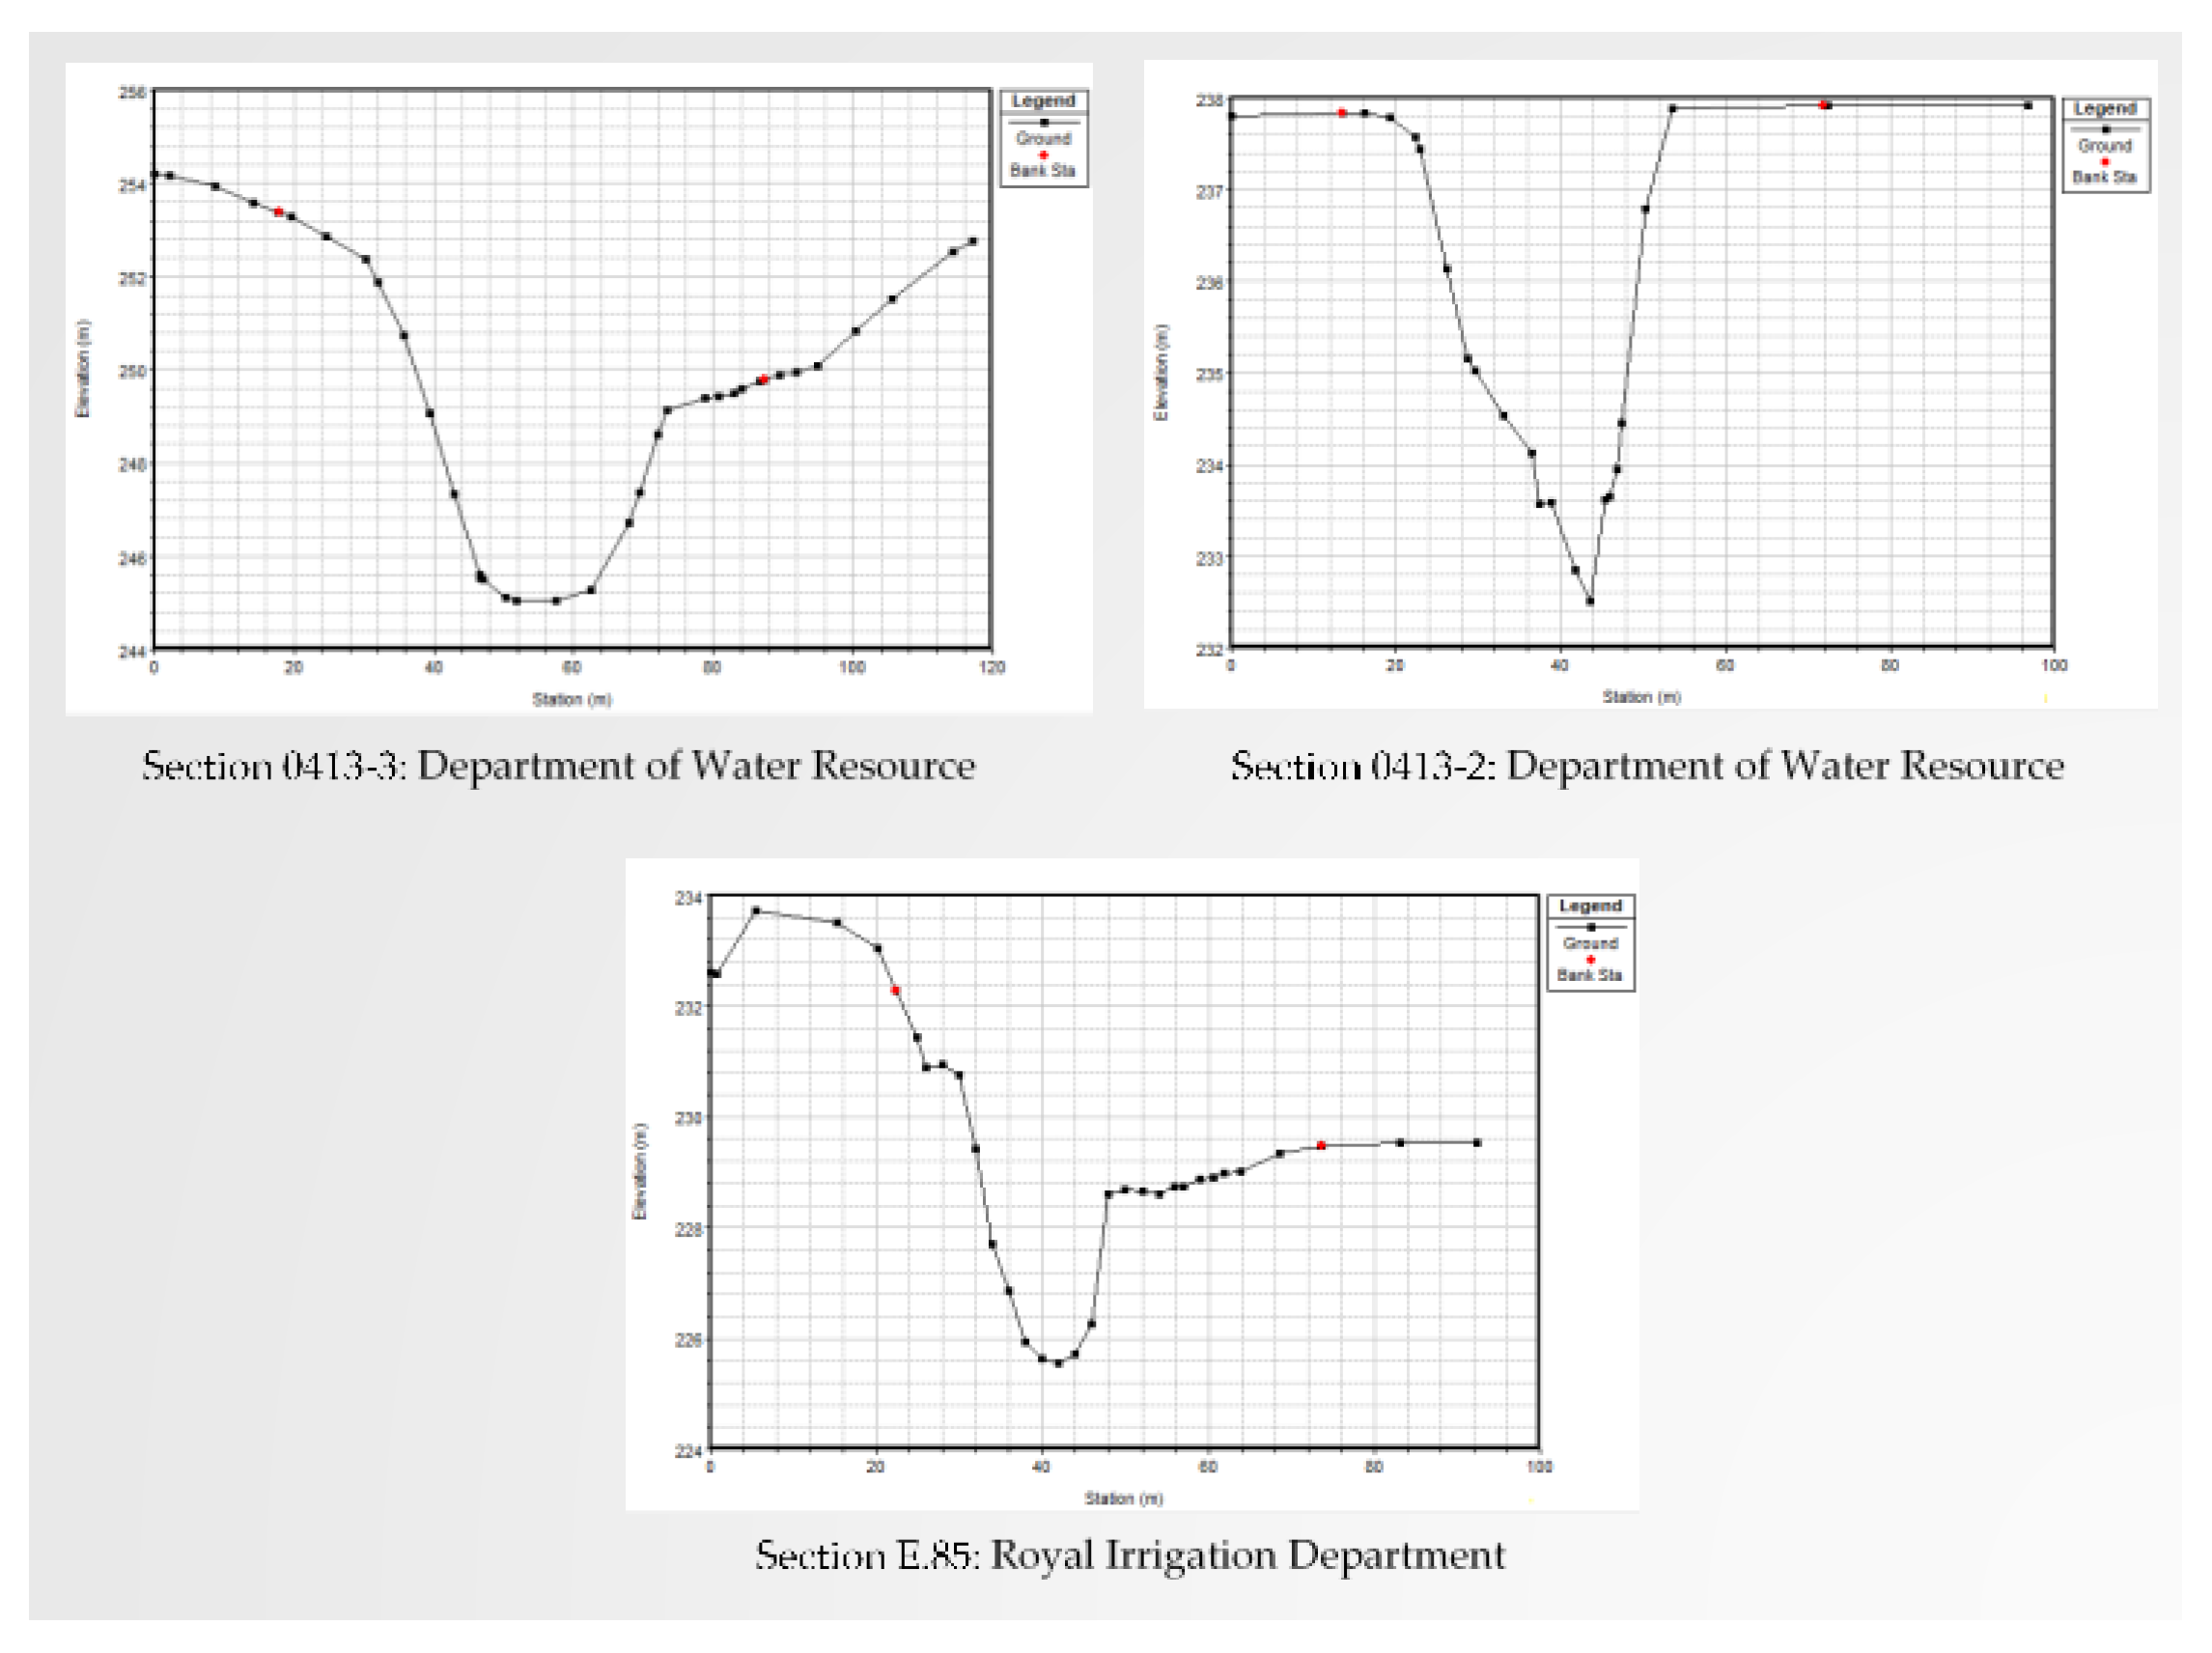
Figure 8.
River Profile (a) Lam Saphung River Basin, (b) Phrom River Basin, and (c) Chern River Basin Part 1
Figure 8.
River Profile (a) Lam Saphung River Basin, (b) Phrom River Basin, and (c) Chern River Basin Part 1
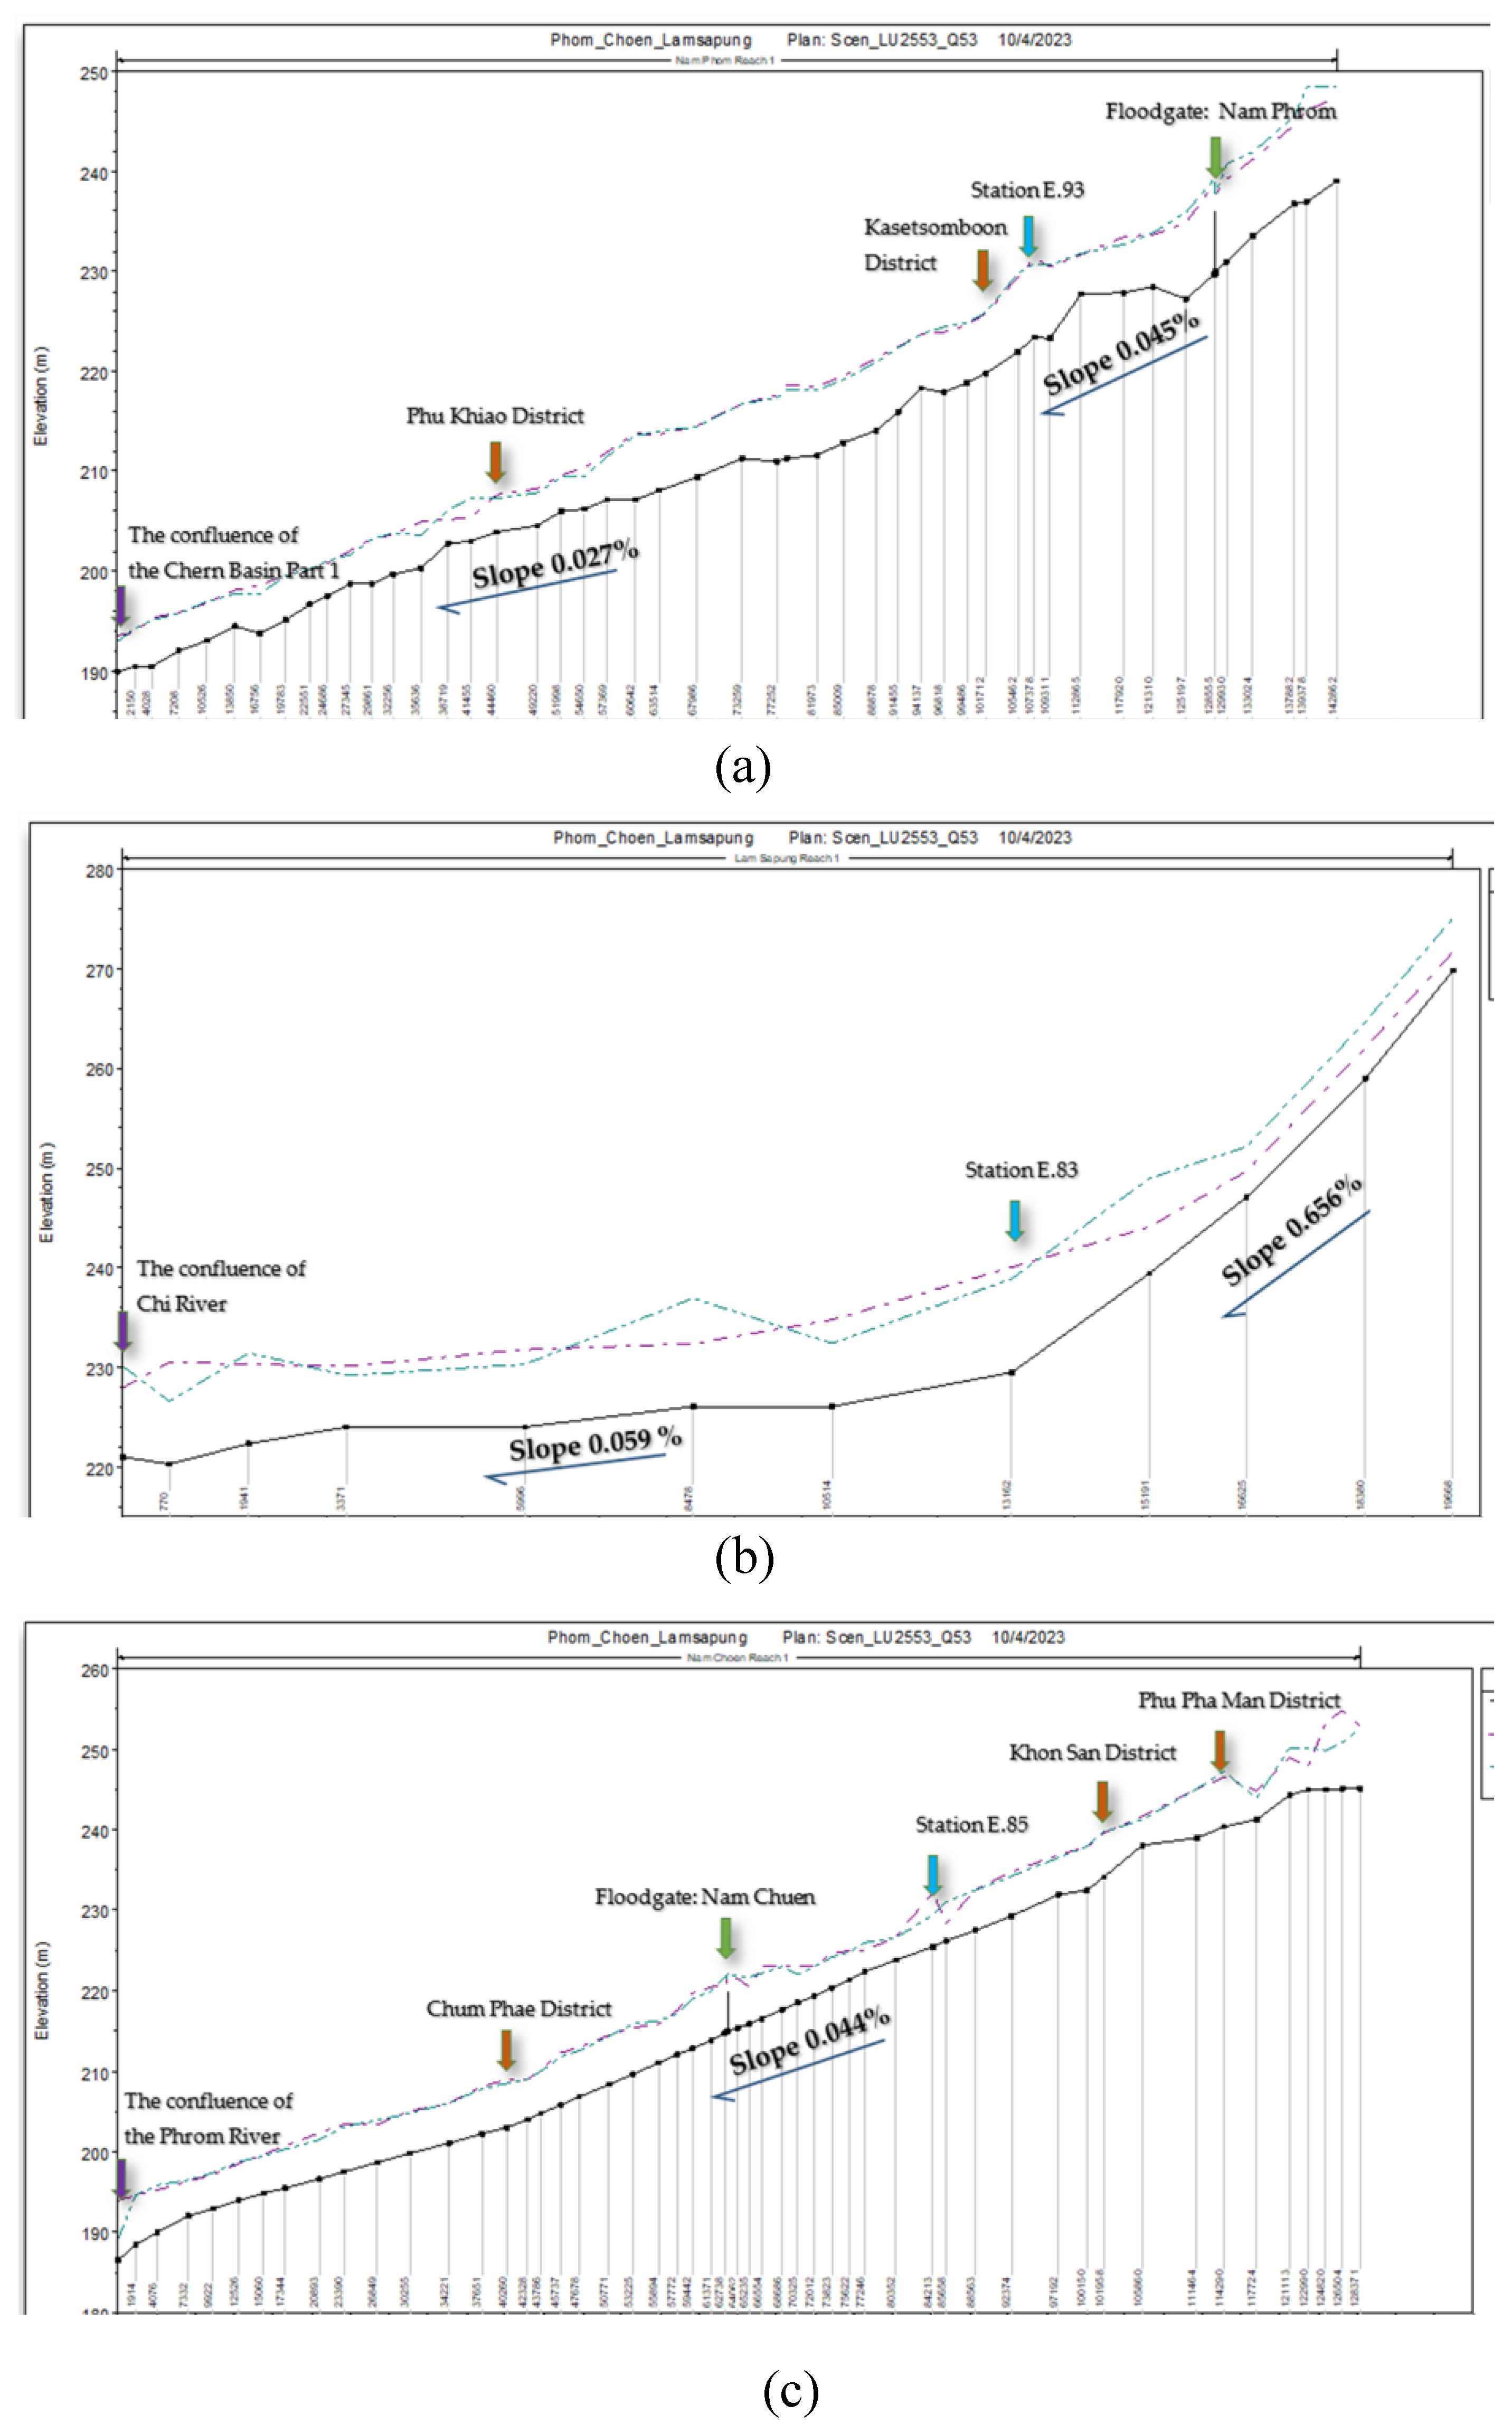
Figure 9.
Overview of importing 2D Area and Lateral Structure data.
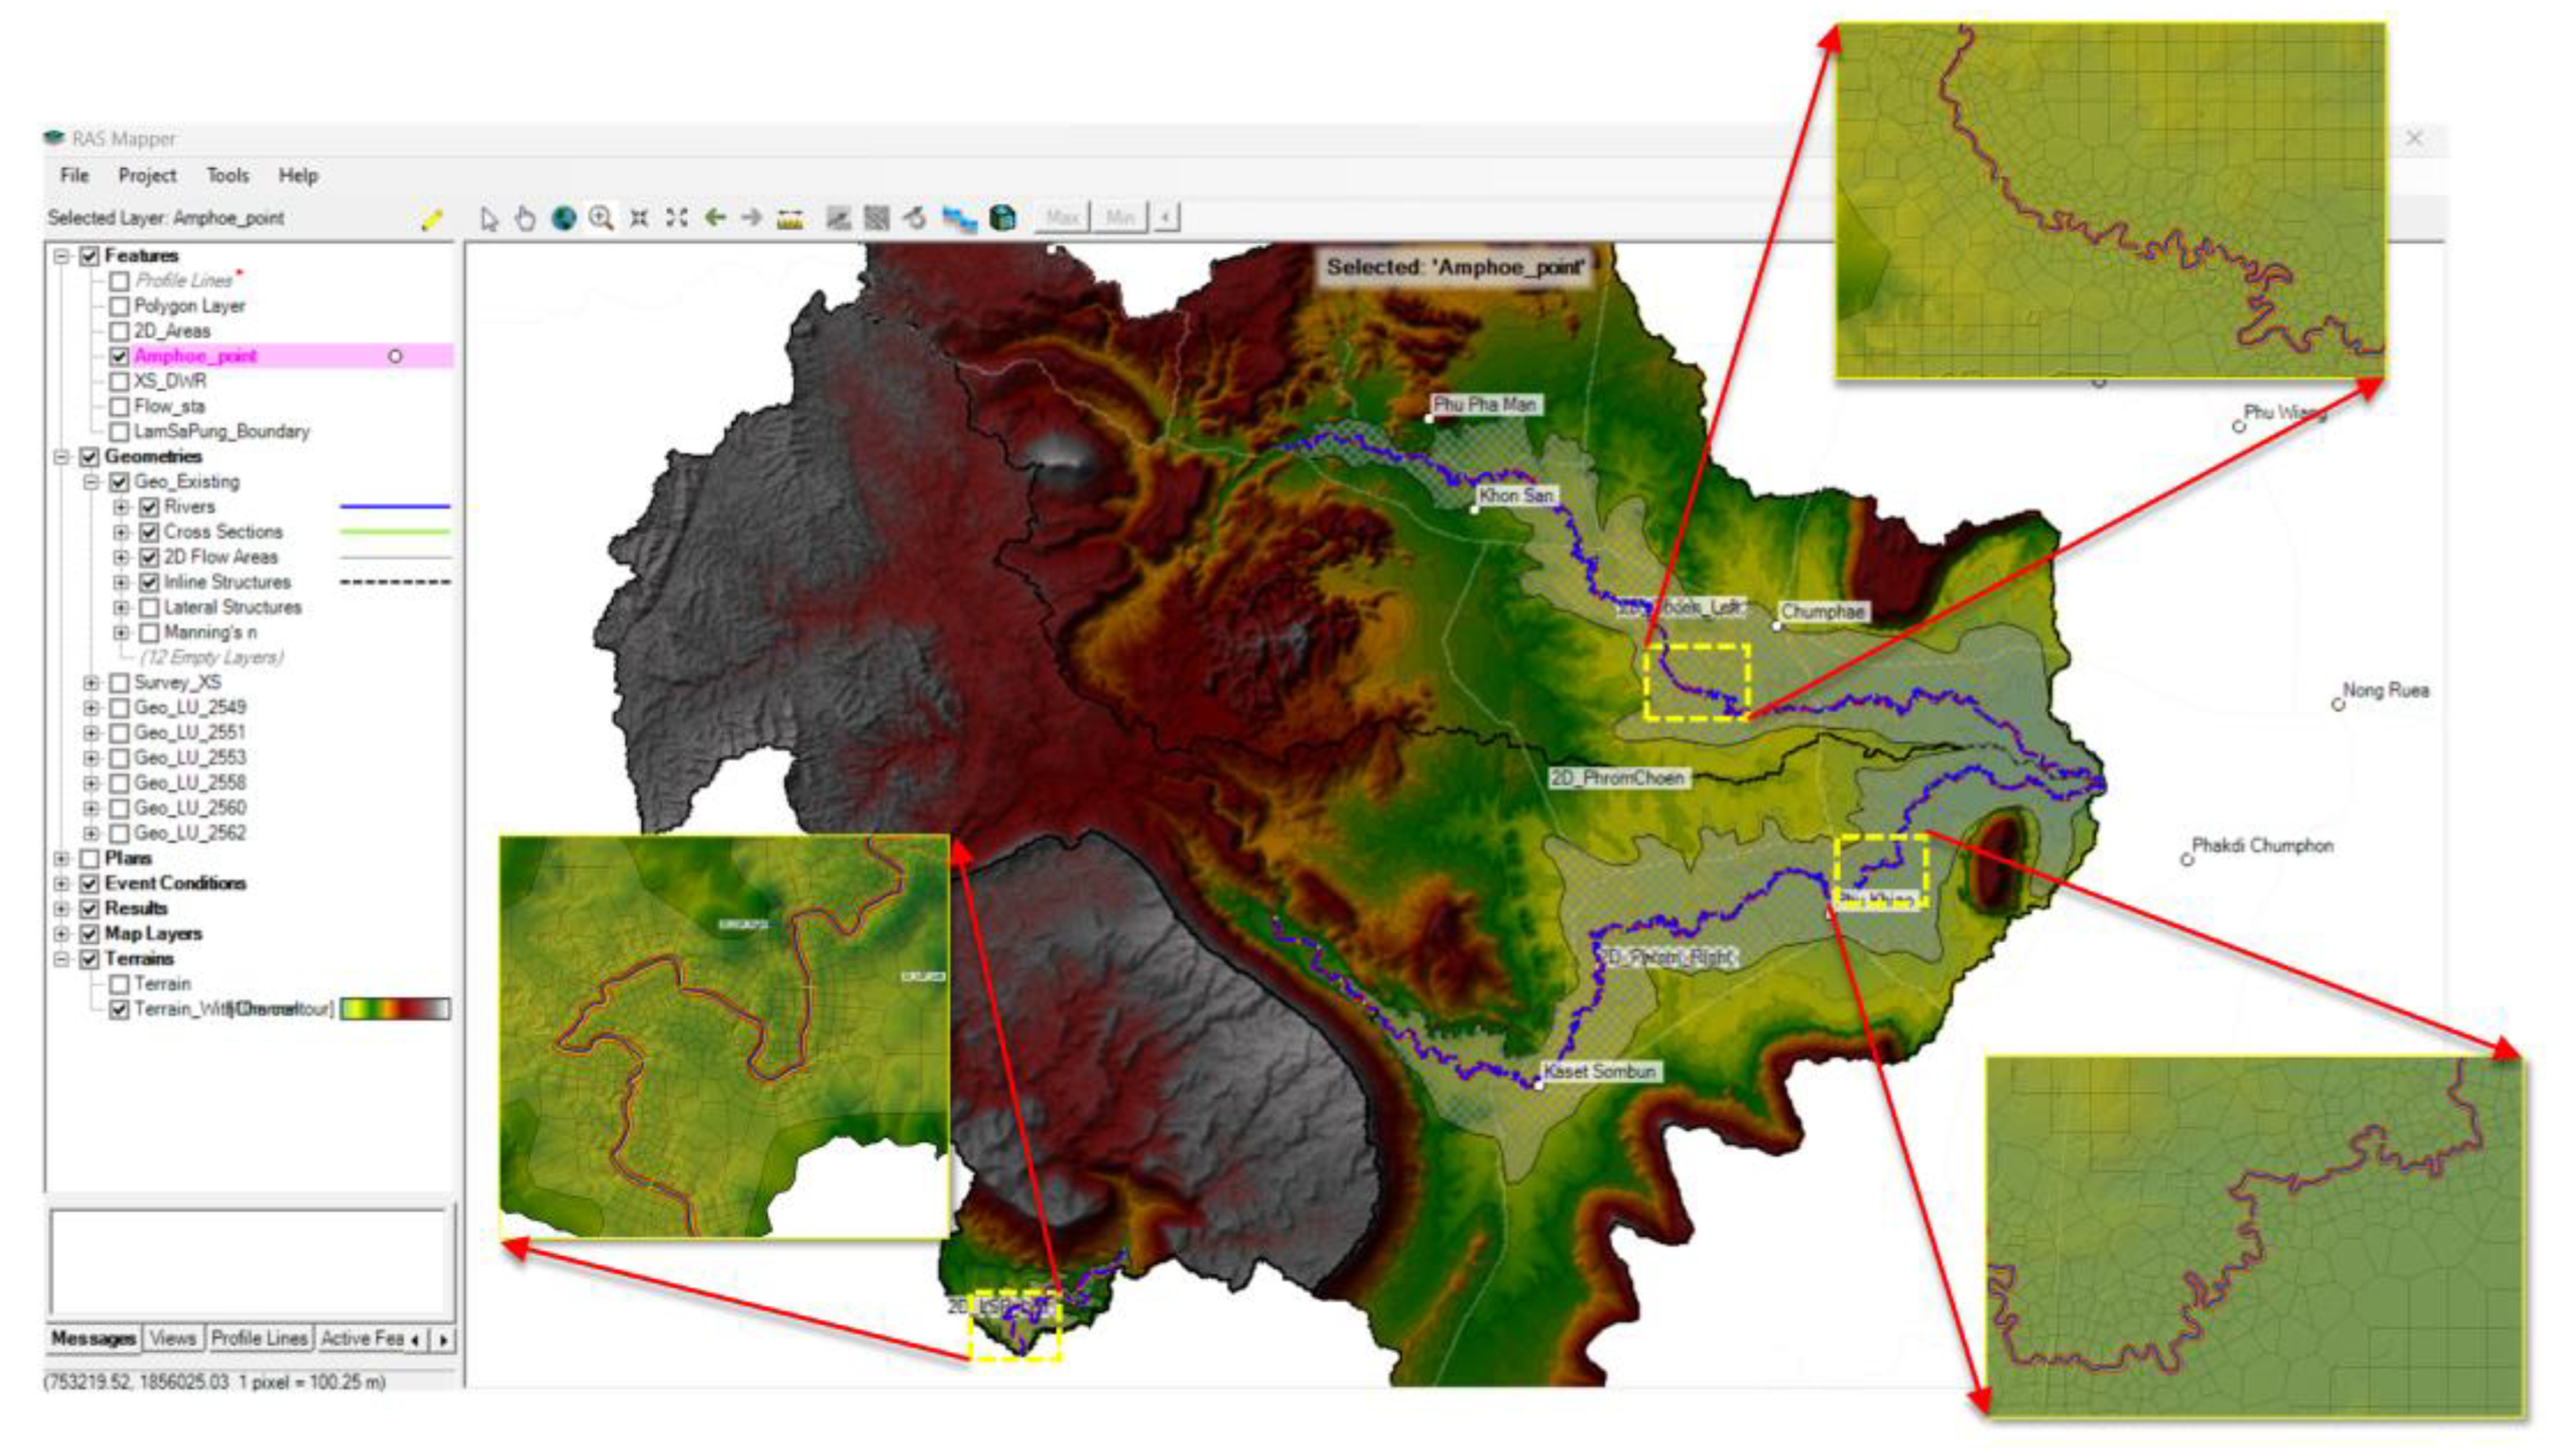
Figure 10.
Manning's n value determination for the flooded area (2D Area) from the 2019 land use map.
Figure 10.
Manning's n value determination for the flooded area (2D Area) from the 2019 land use map.
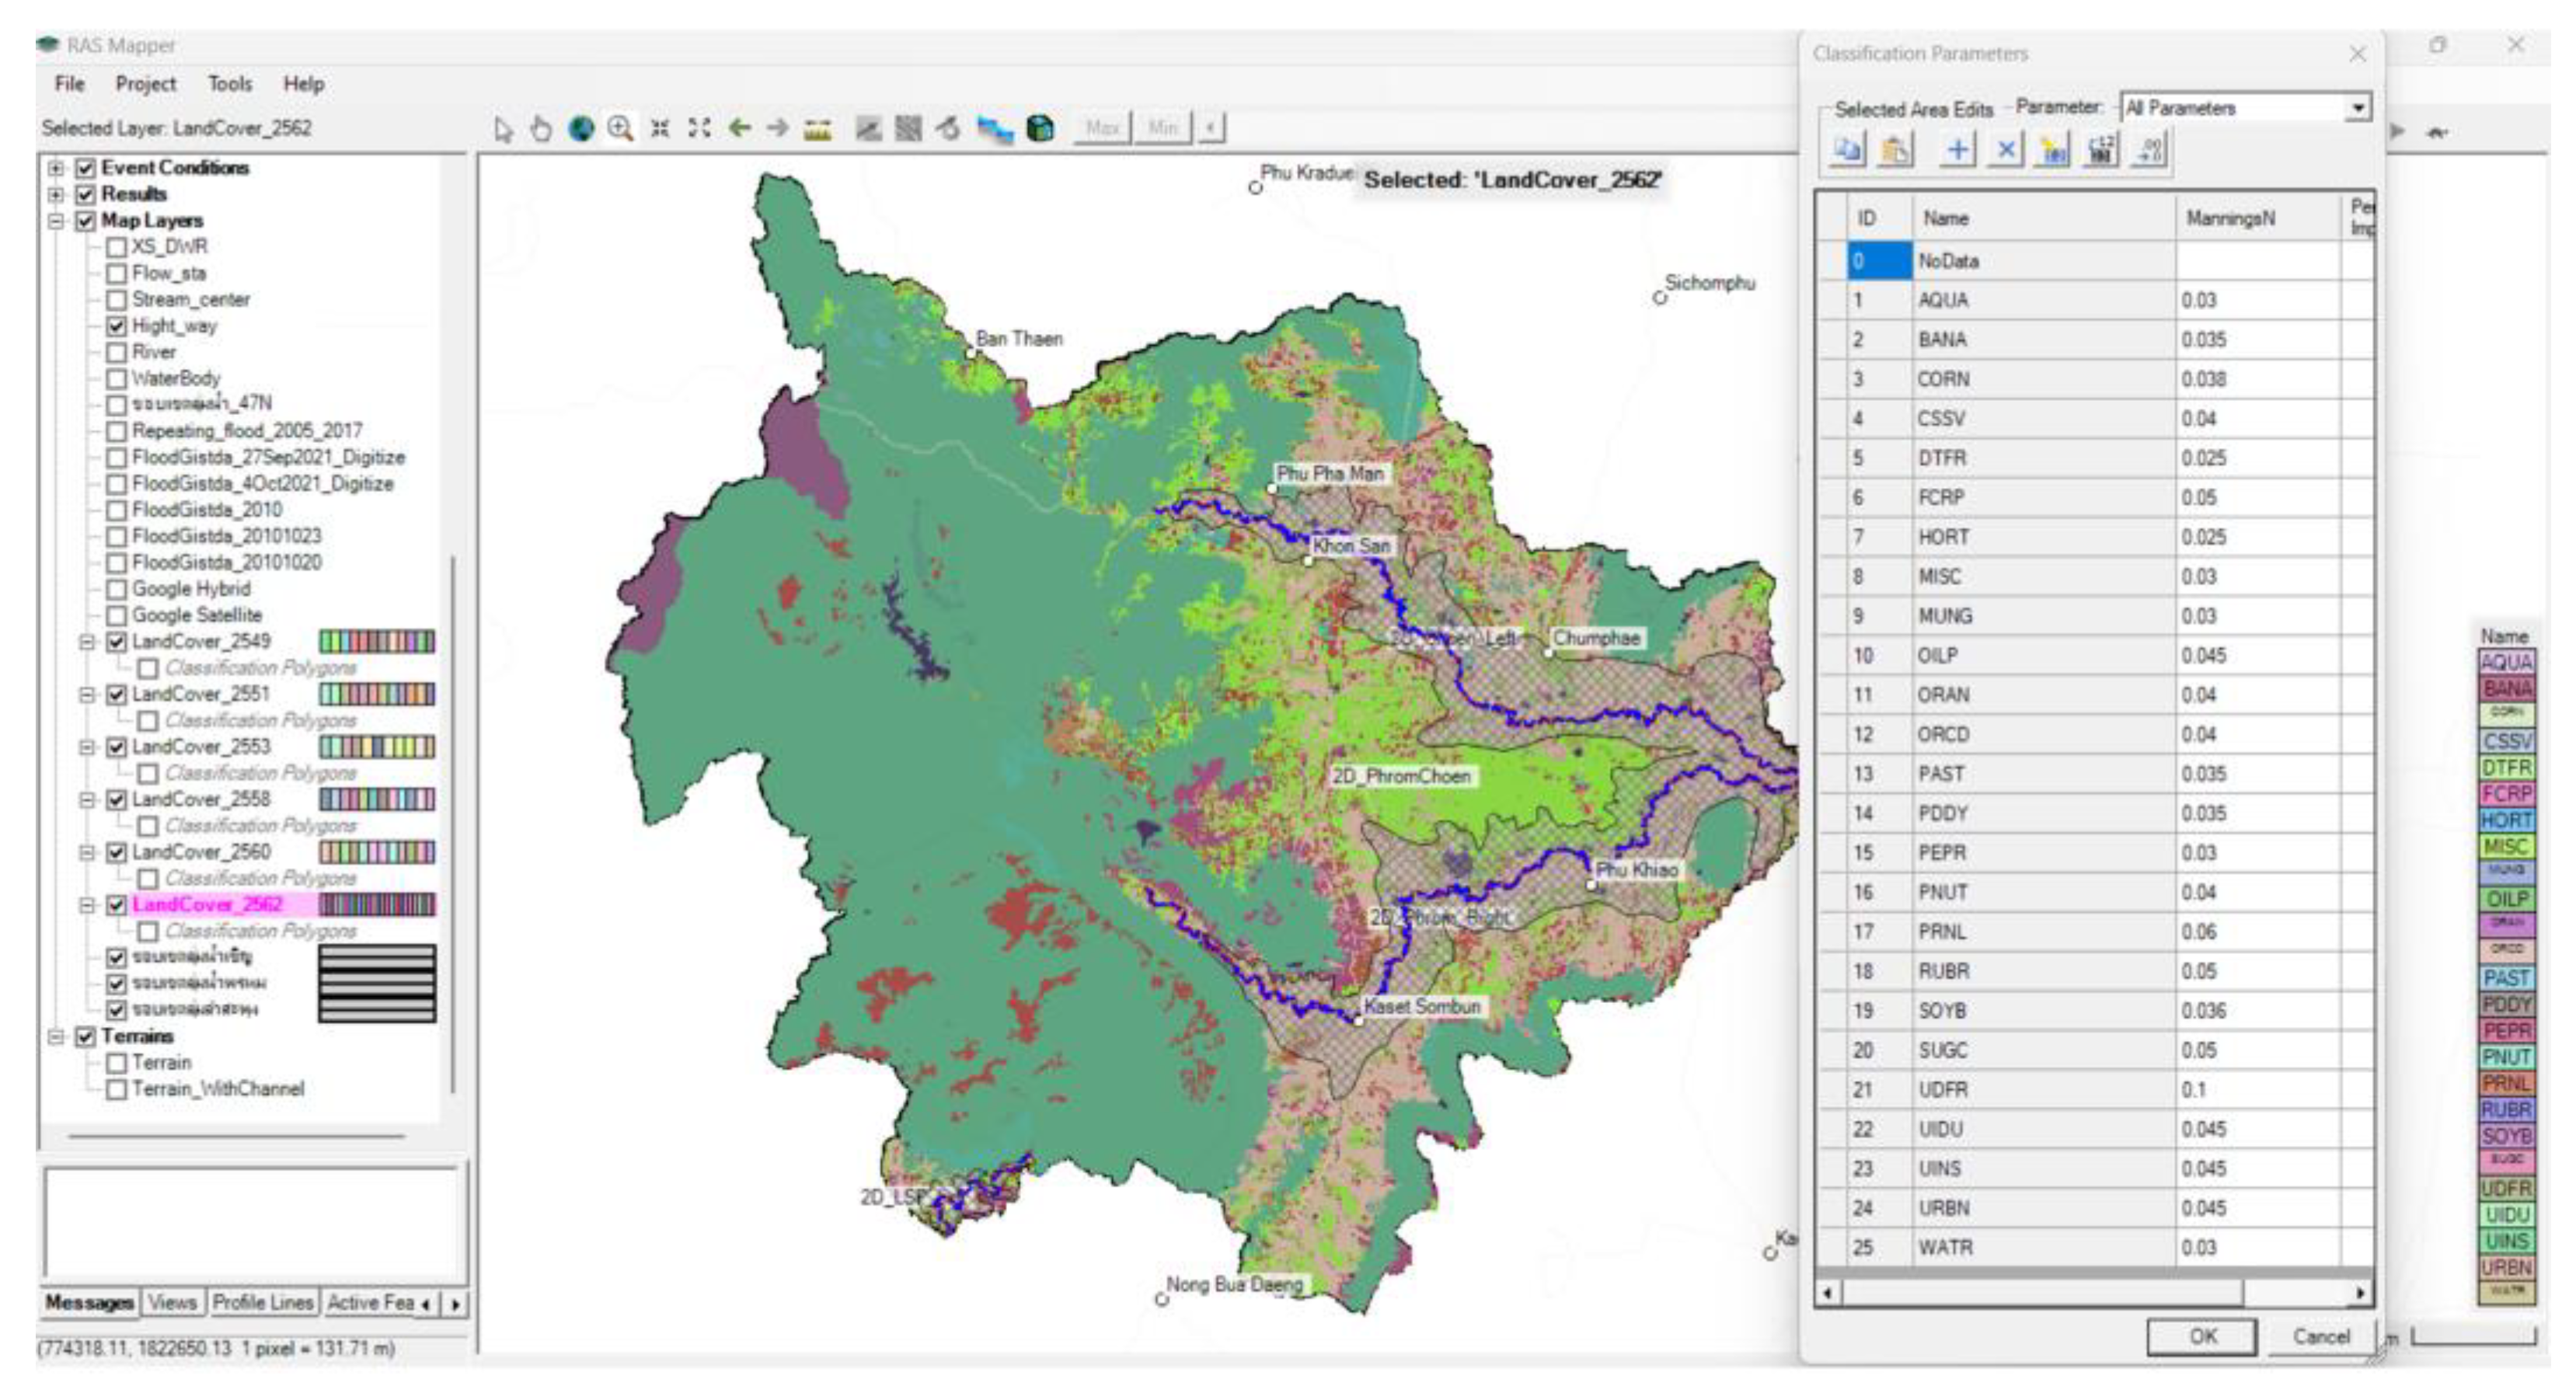
Figure 11.
Flood hazard curve. Classified by depth and flow velocity.
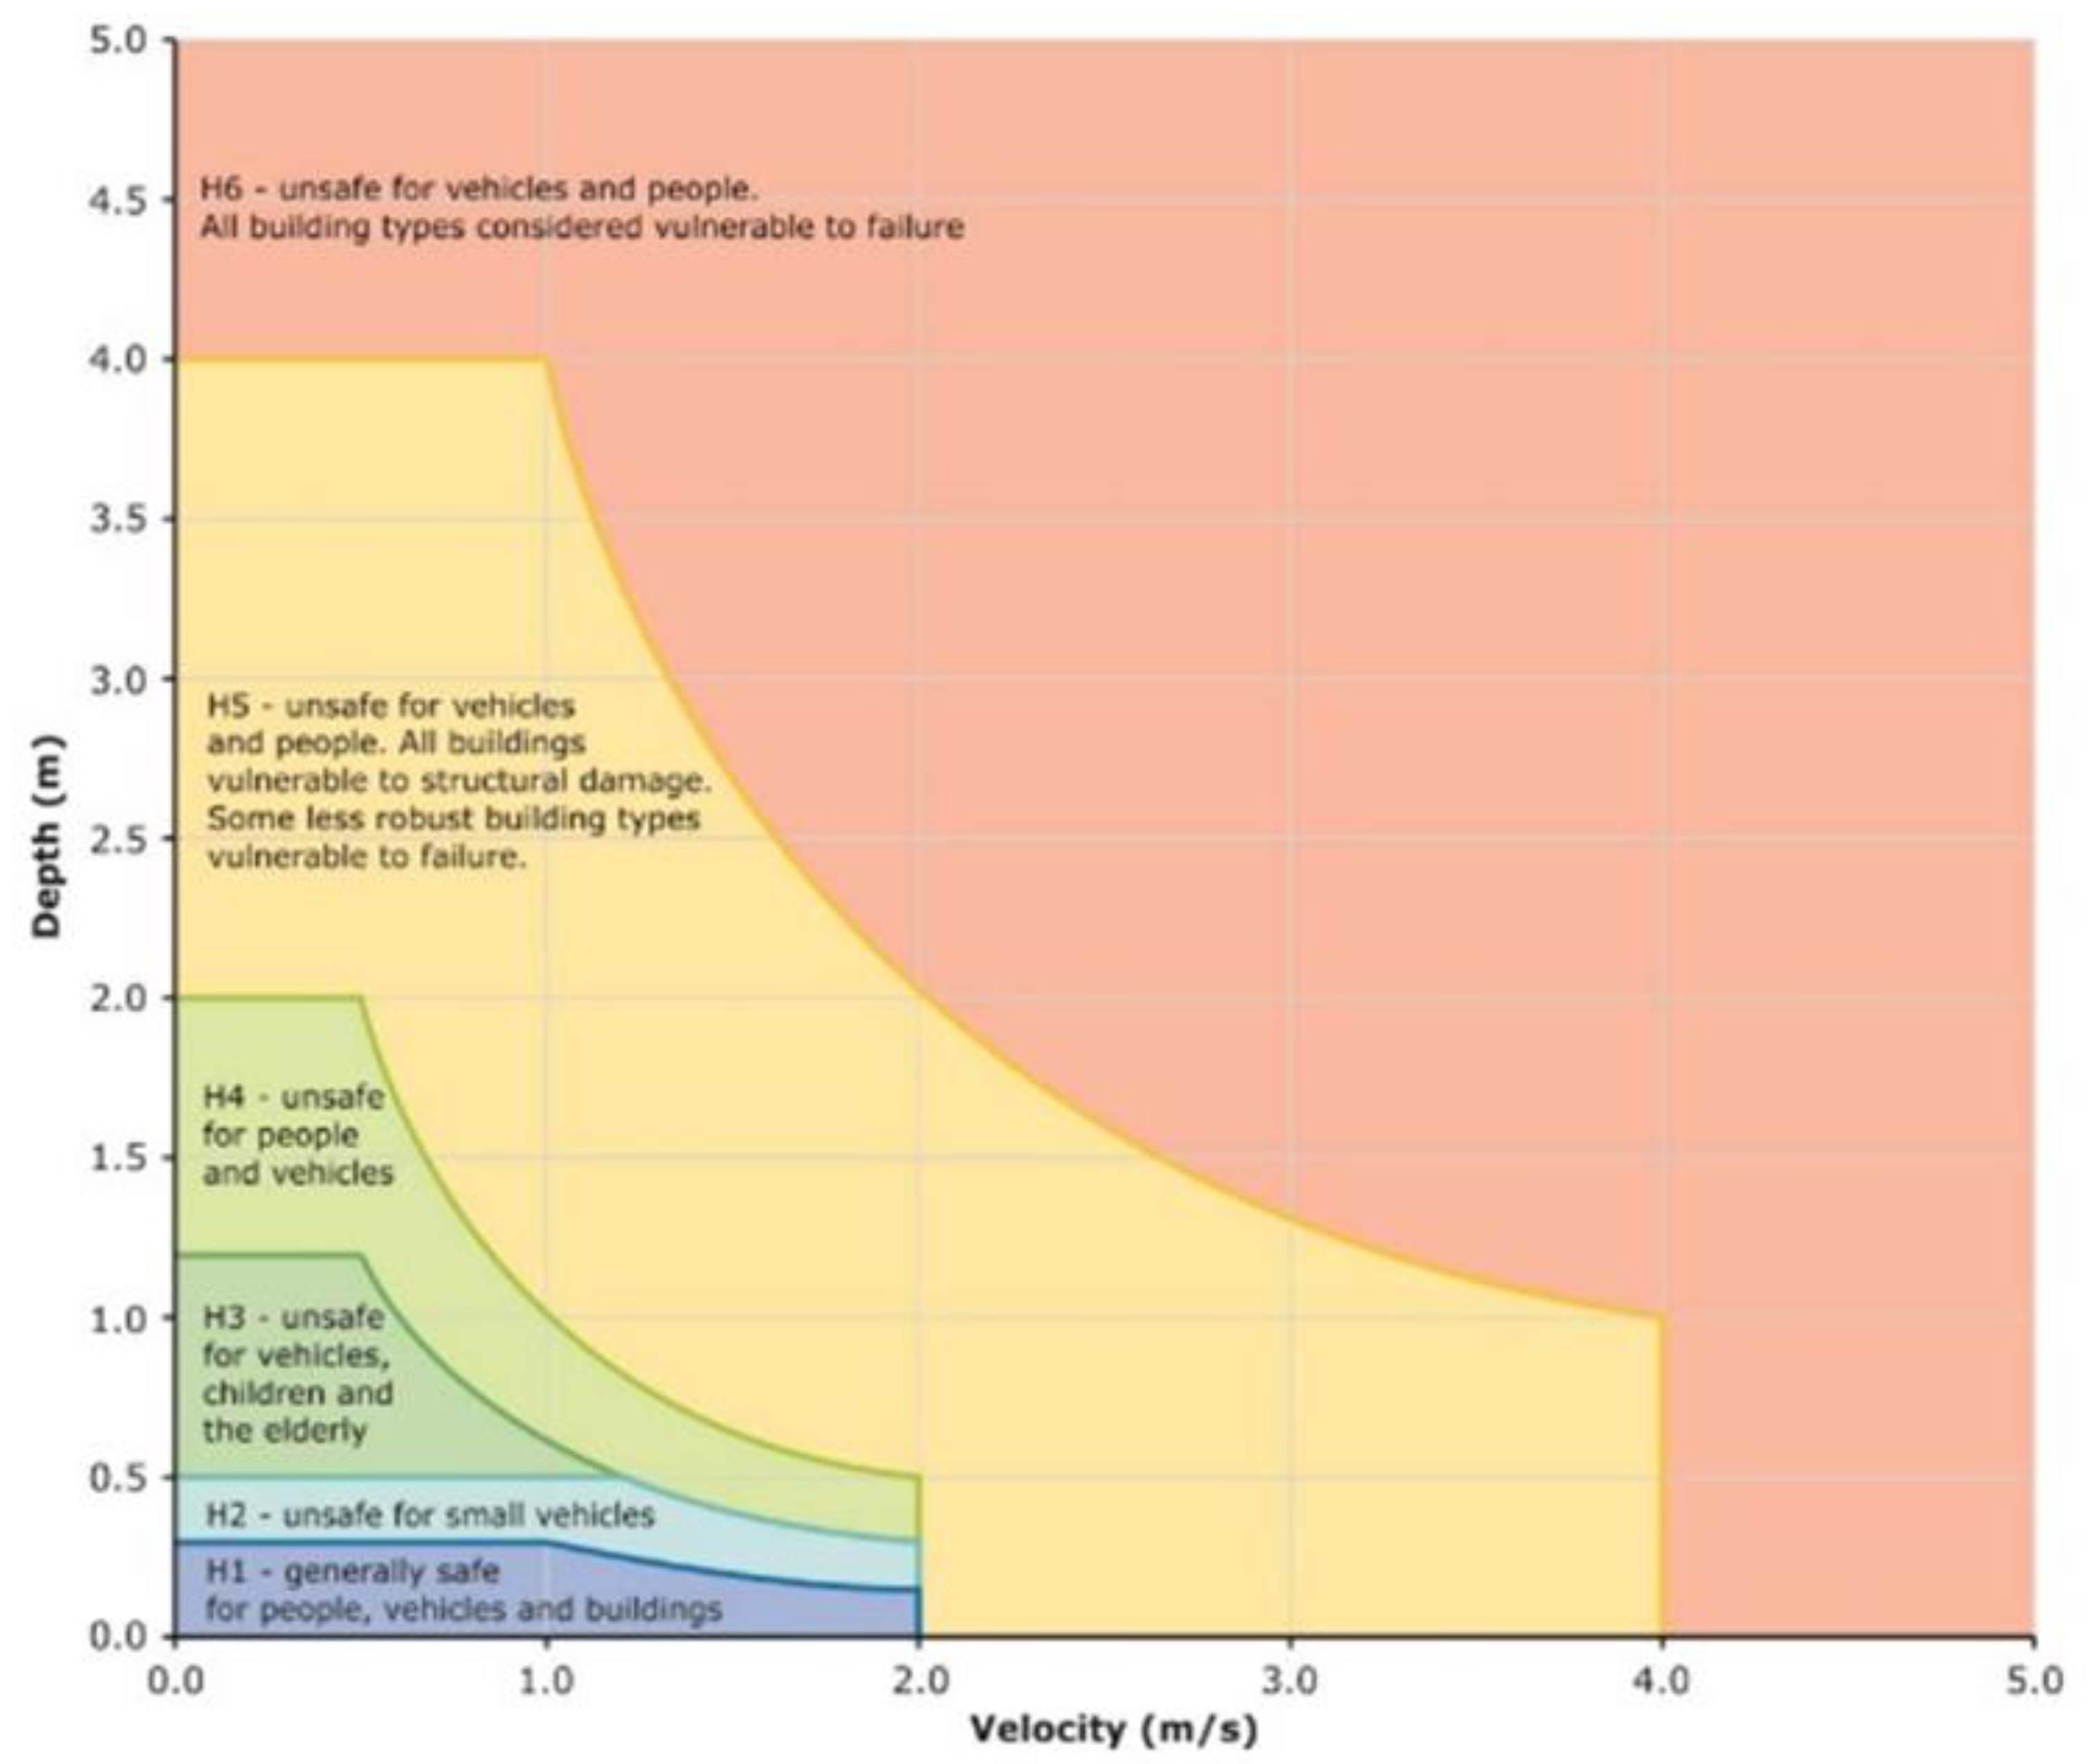
Figure 12.
Using flood hazard classification criteria to write scripts in Ras Mapper to create flood hazard maps.
Figure 12.
Using flood hazard classification criteria to write scripts in Ras Mapper to create flood hazard maps.
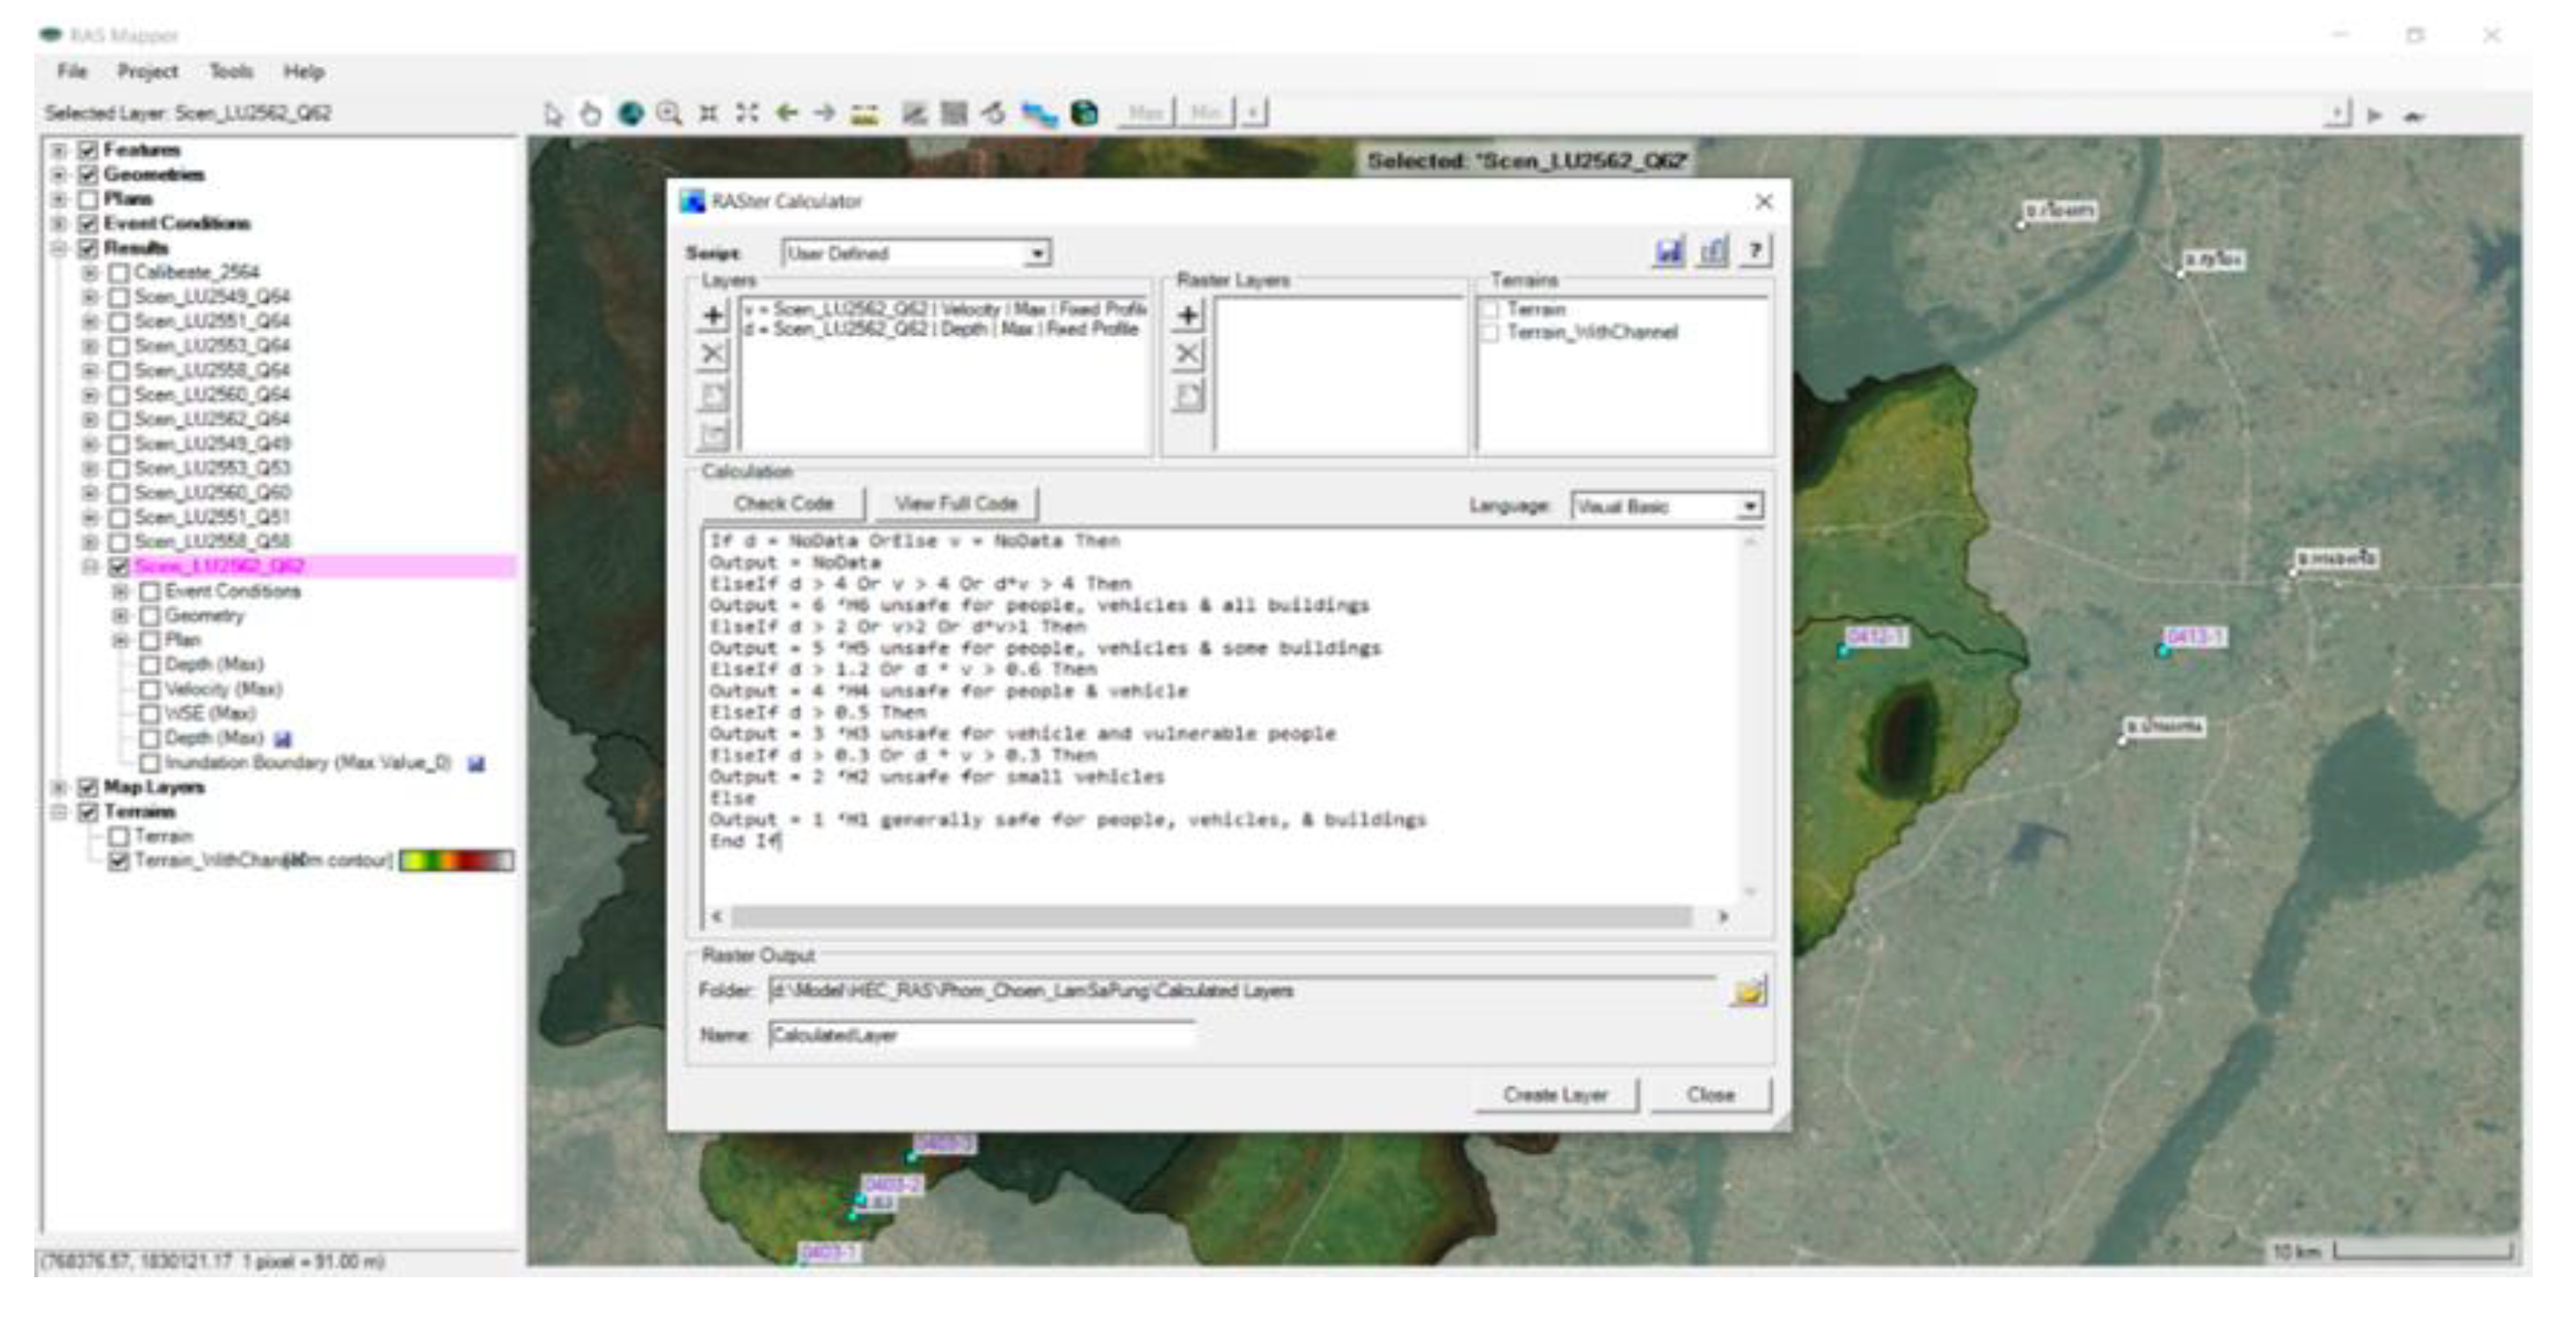
Figure 13.
Calibration of the HEC-RAS model at each water metering stations during the period between July 2021 and December 2021.
Figure 13.
Calibration of the HEC-RAS model at each water metering stations during the period between July 2021 and December 2021.
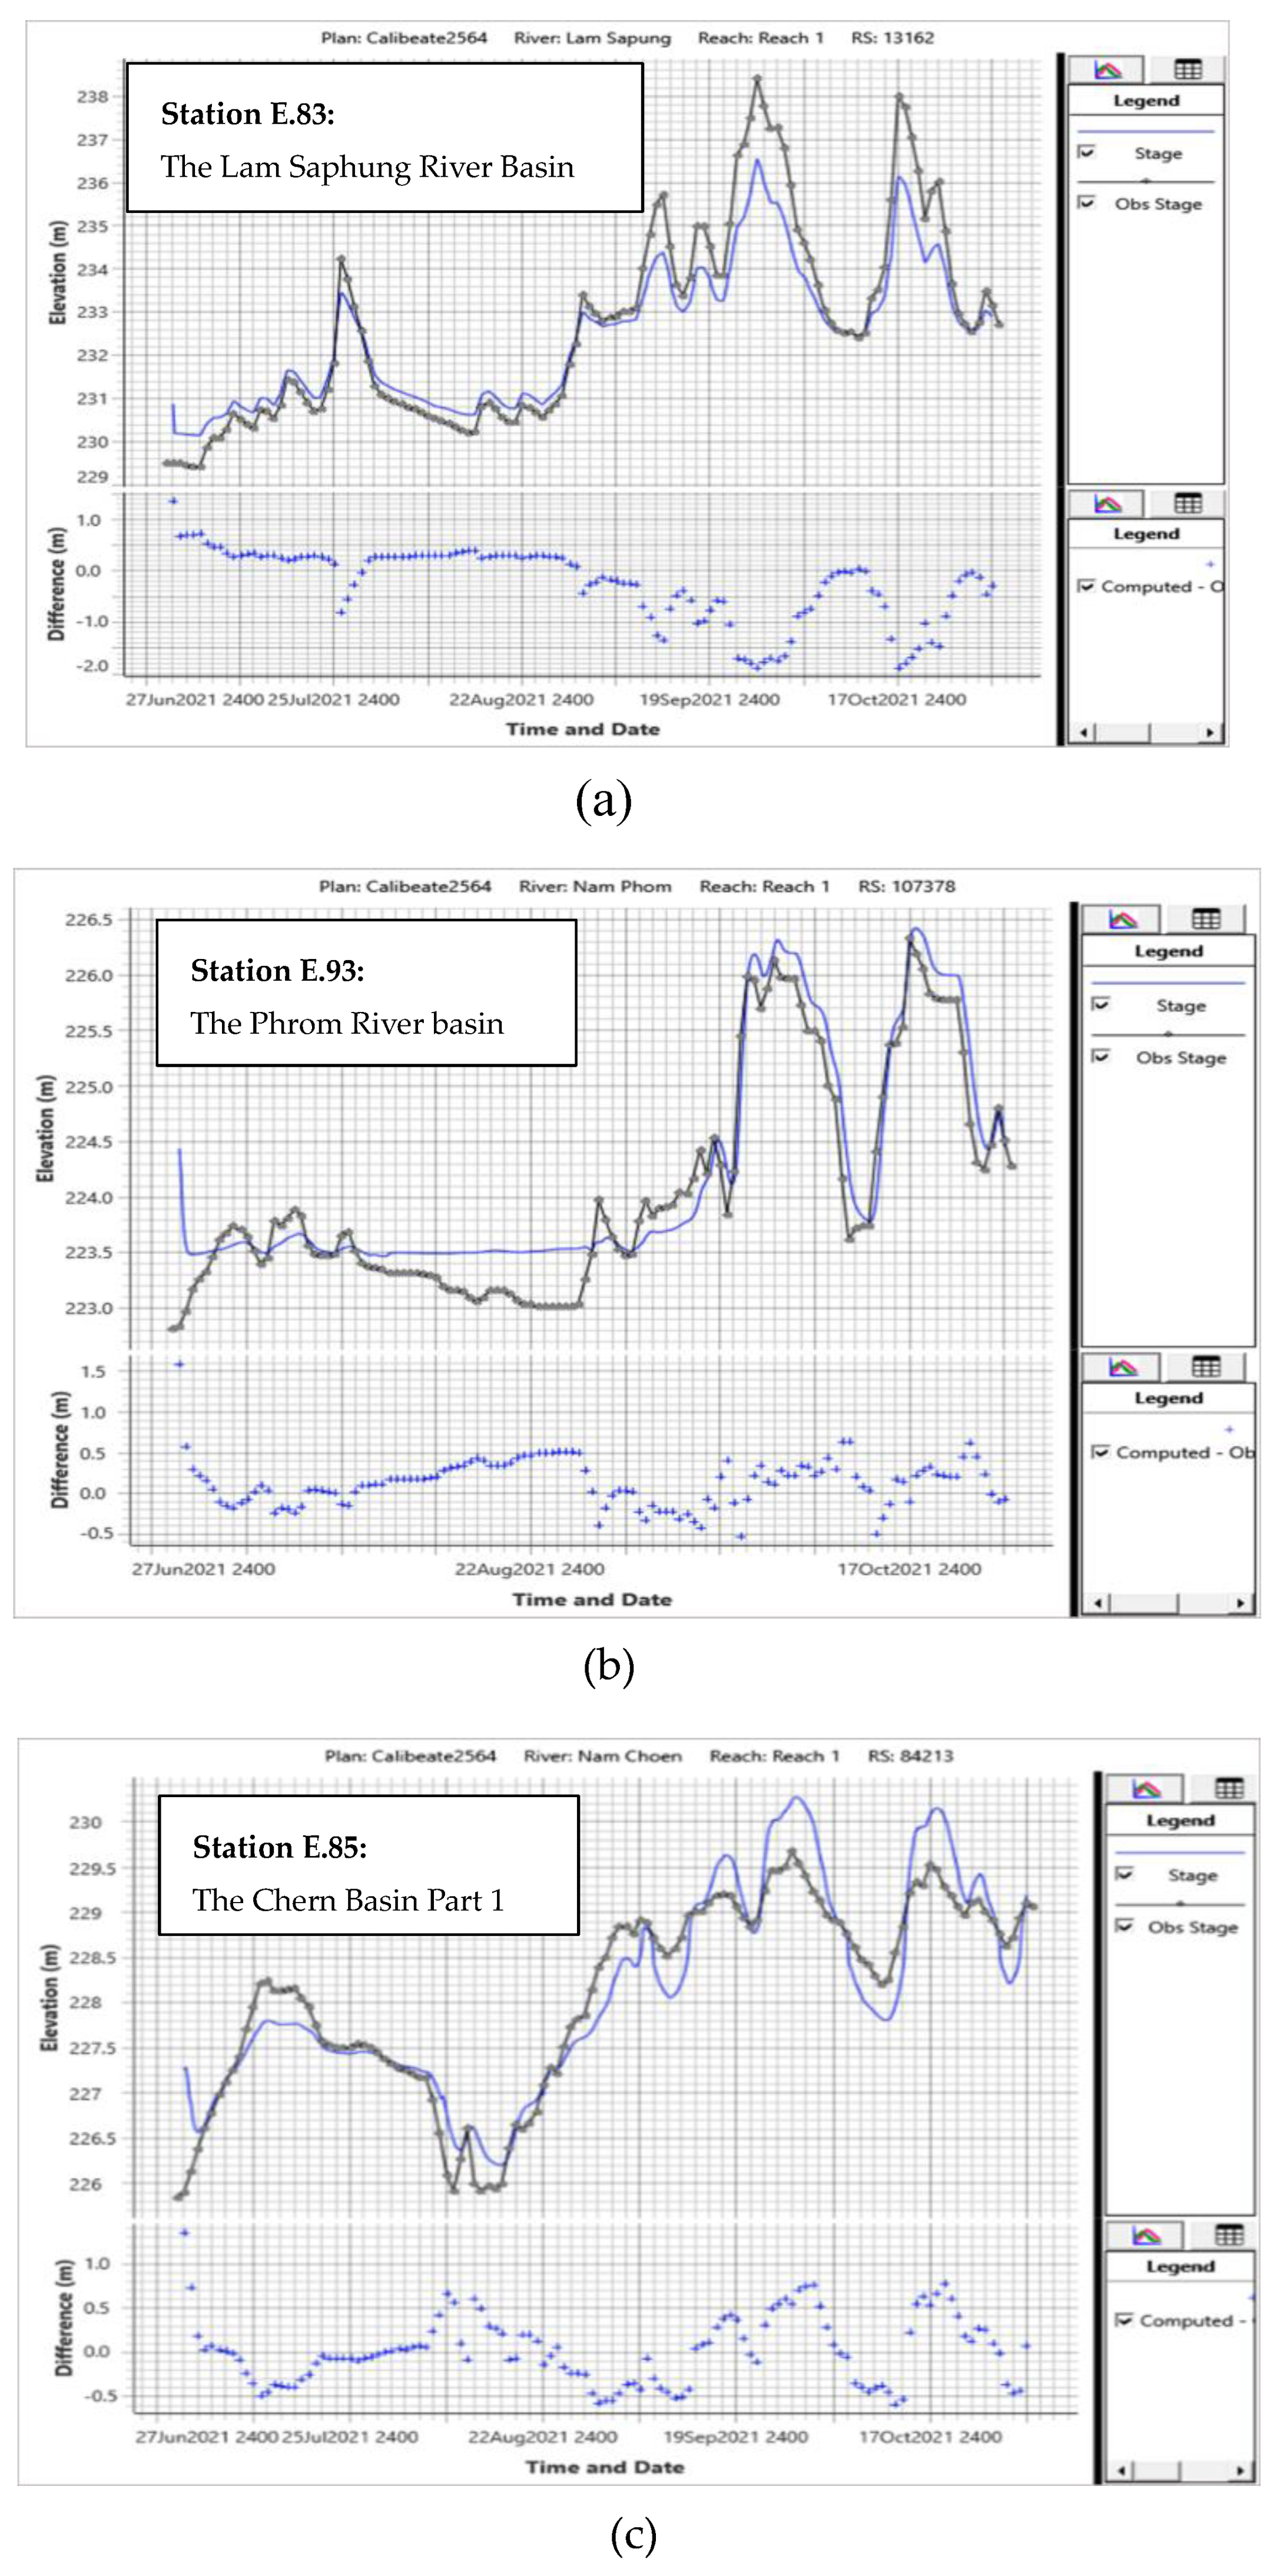
Figure 14.
Validation of the HEC-RAS model at each water metering stations during the period between July 2010 and December 2010.
Figure 14.
Validation of the HEC-RAS model at each water metering stations during the period between July 2010 and December 2010.
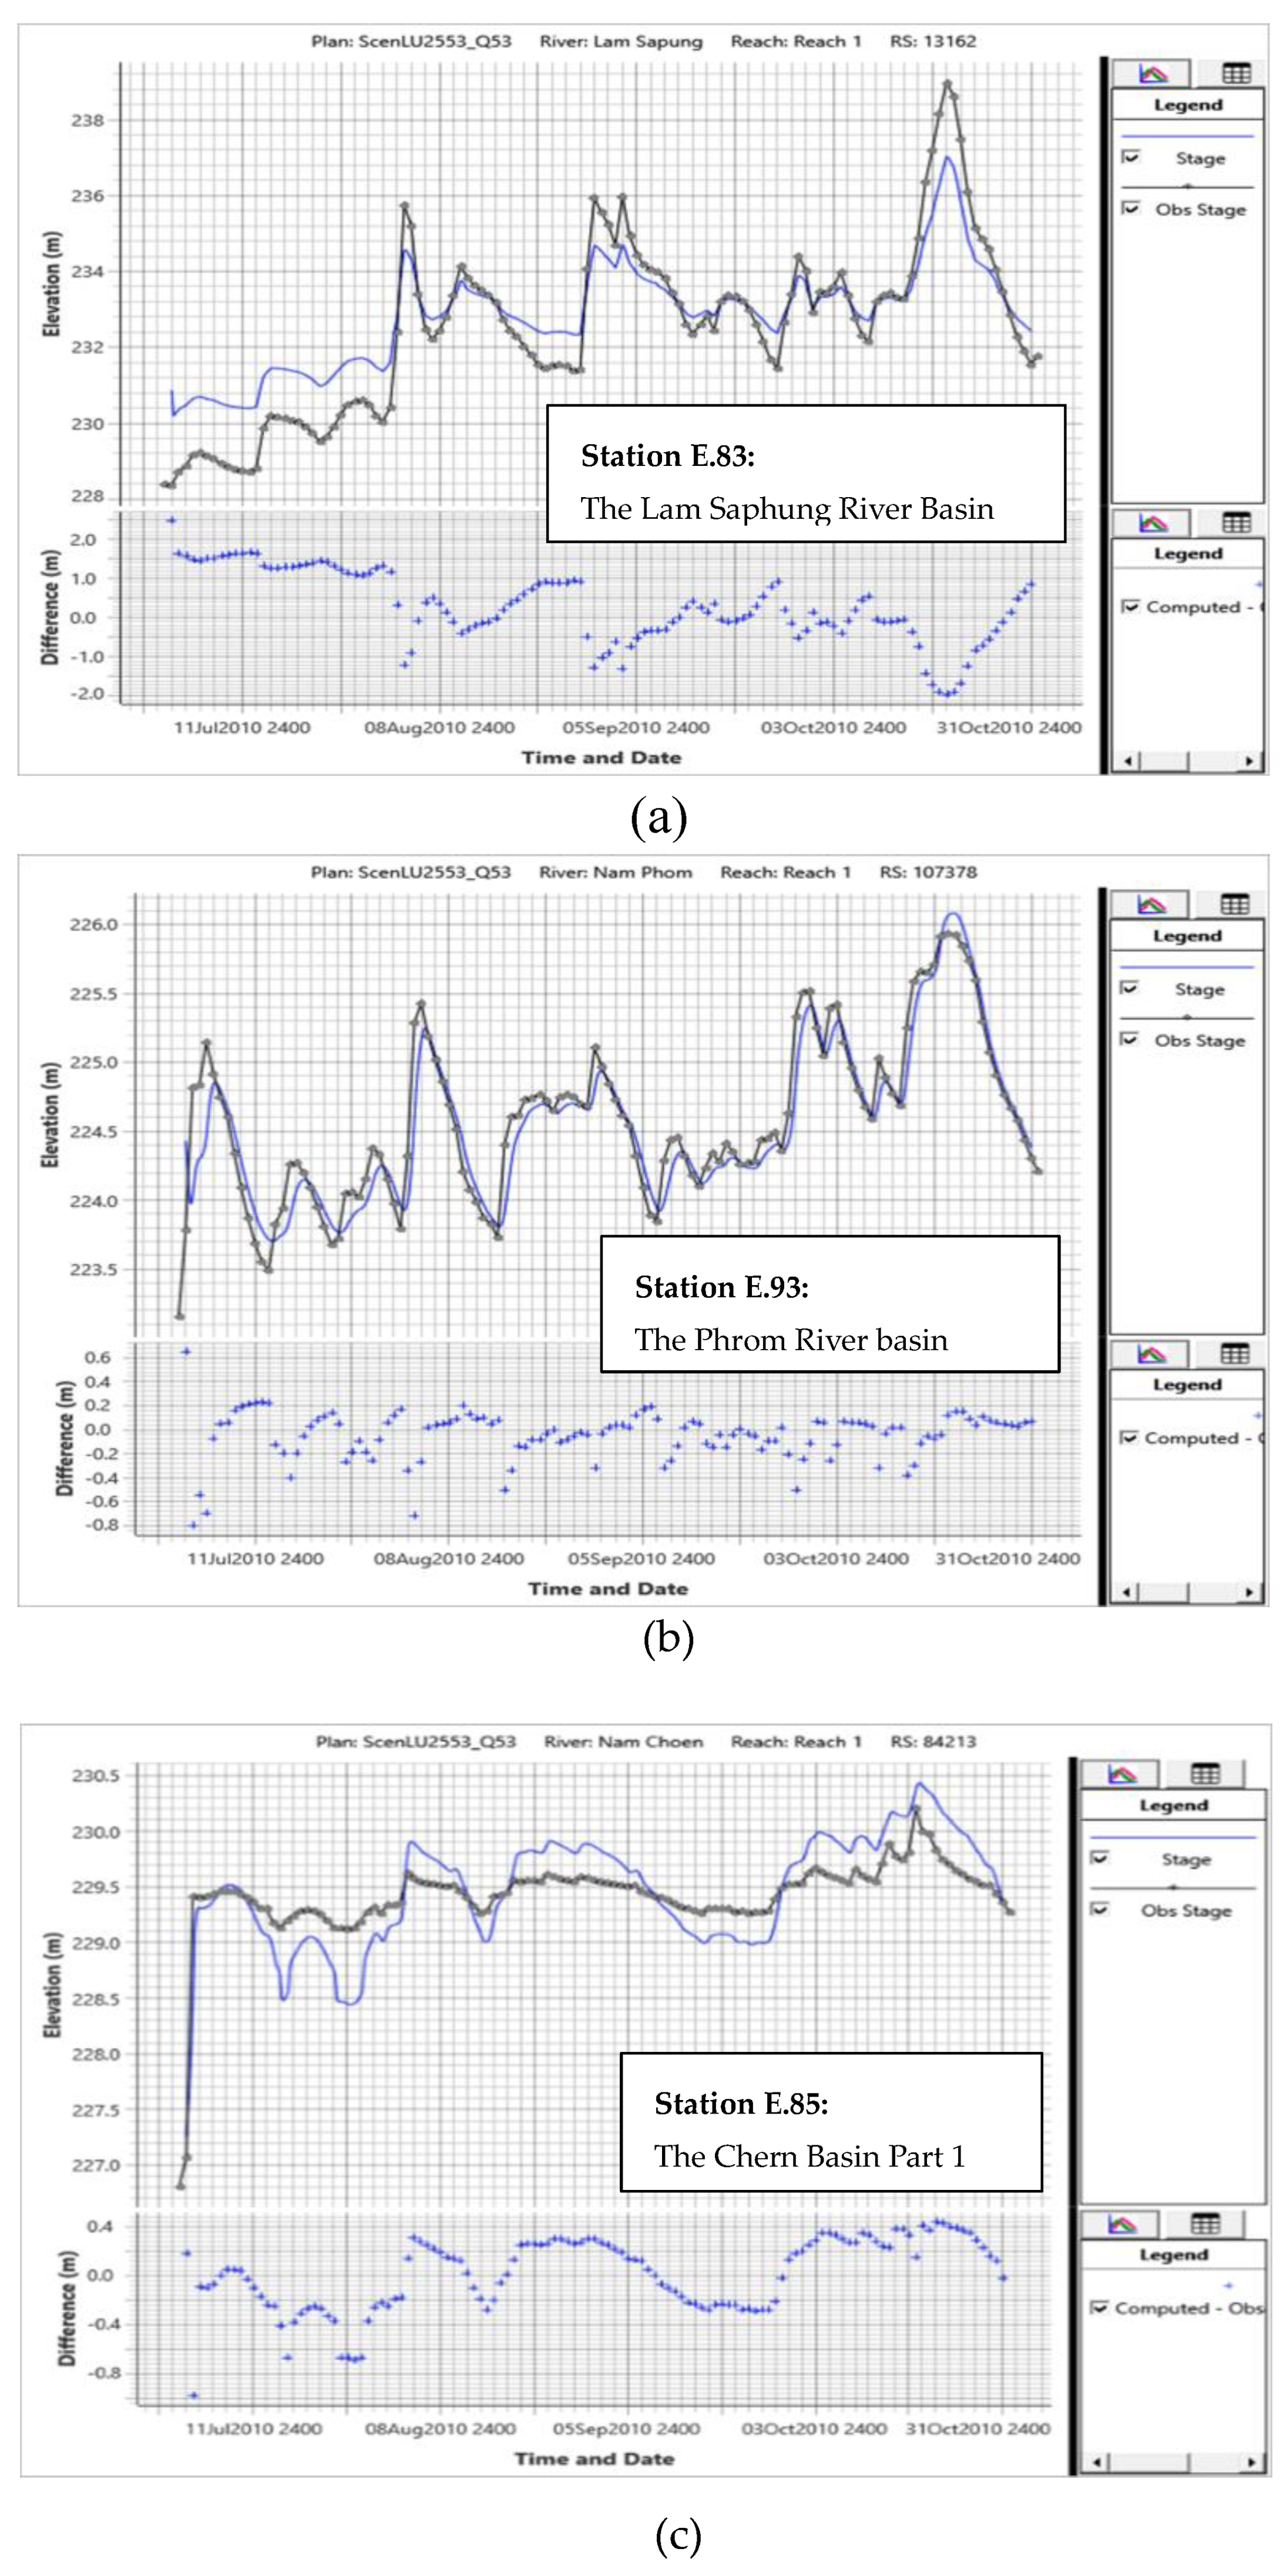
Figure 17.
Extent of flooded areas from past land use changes.
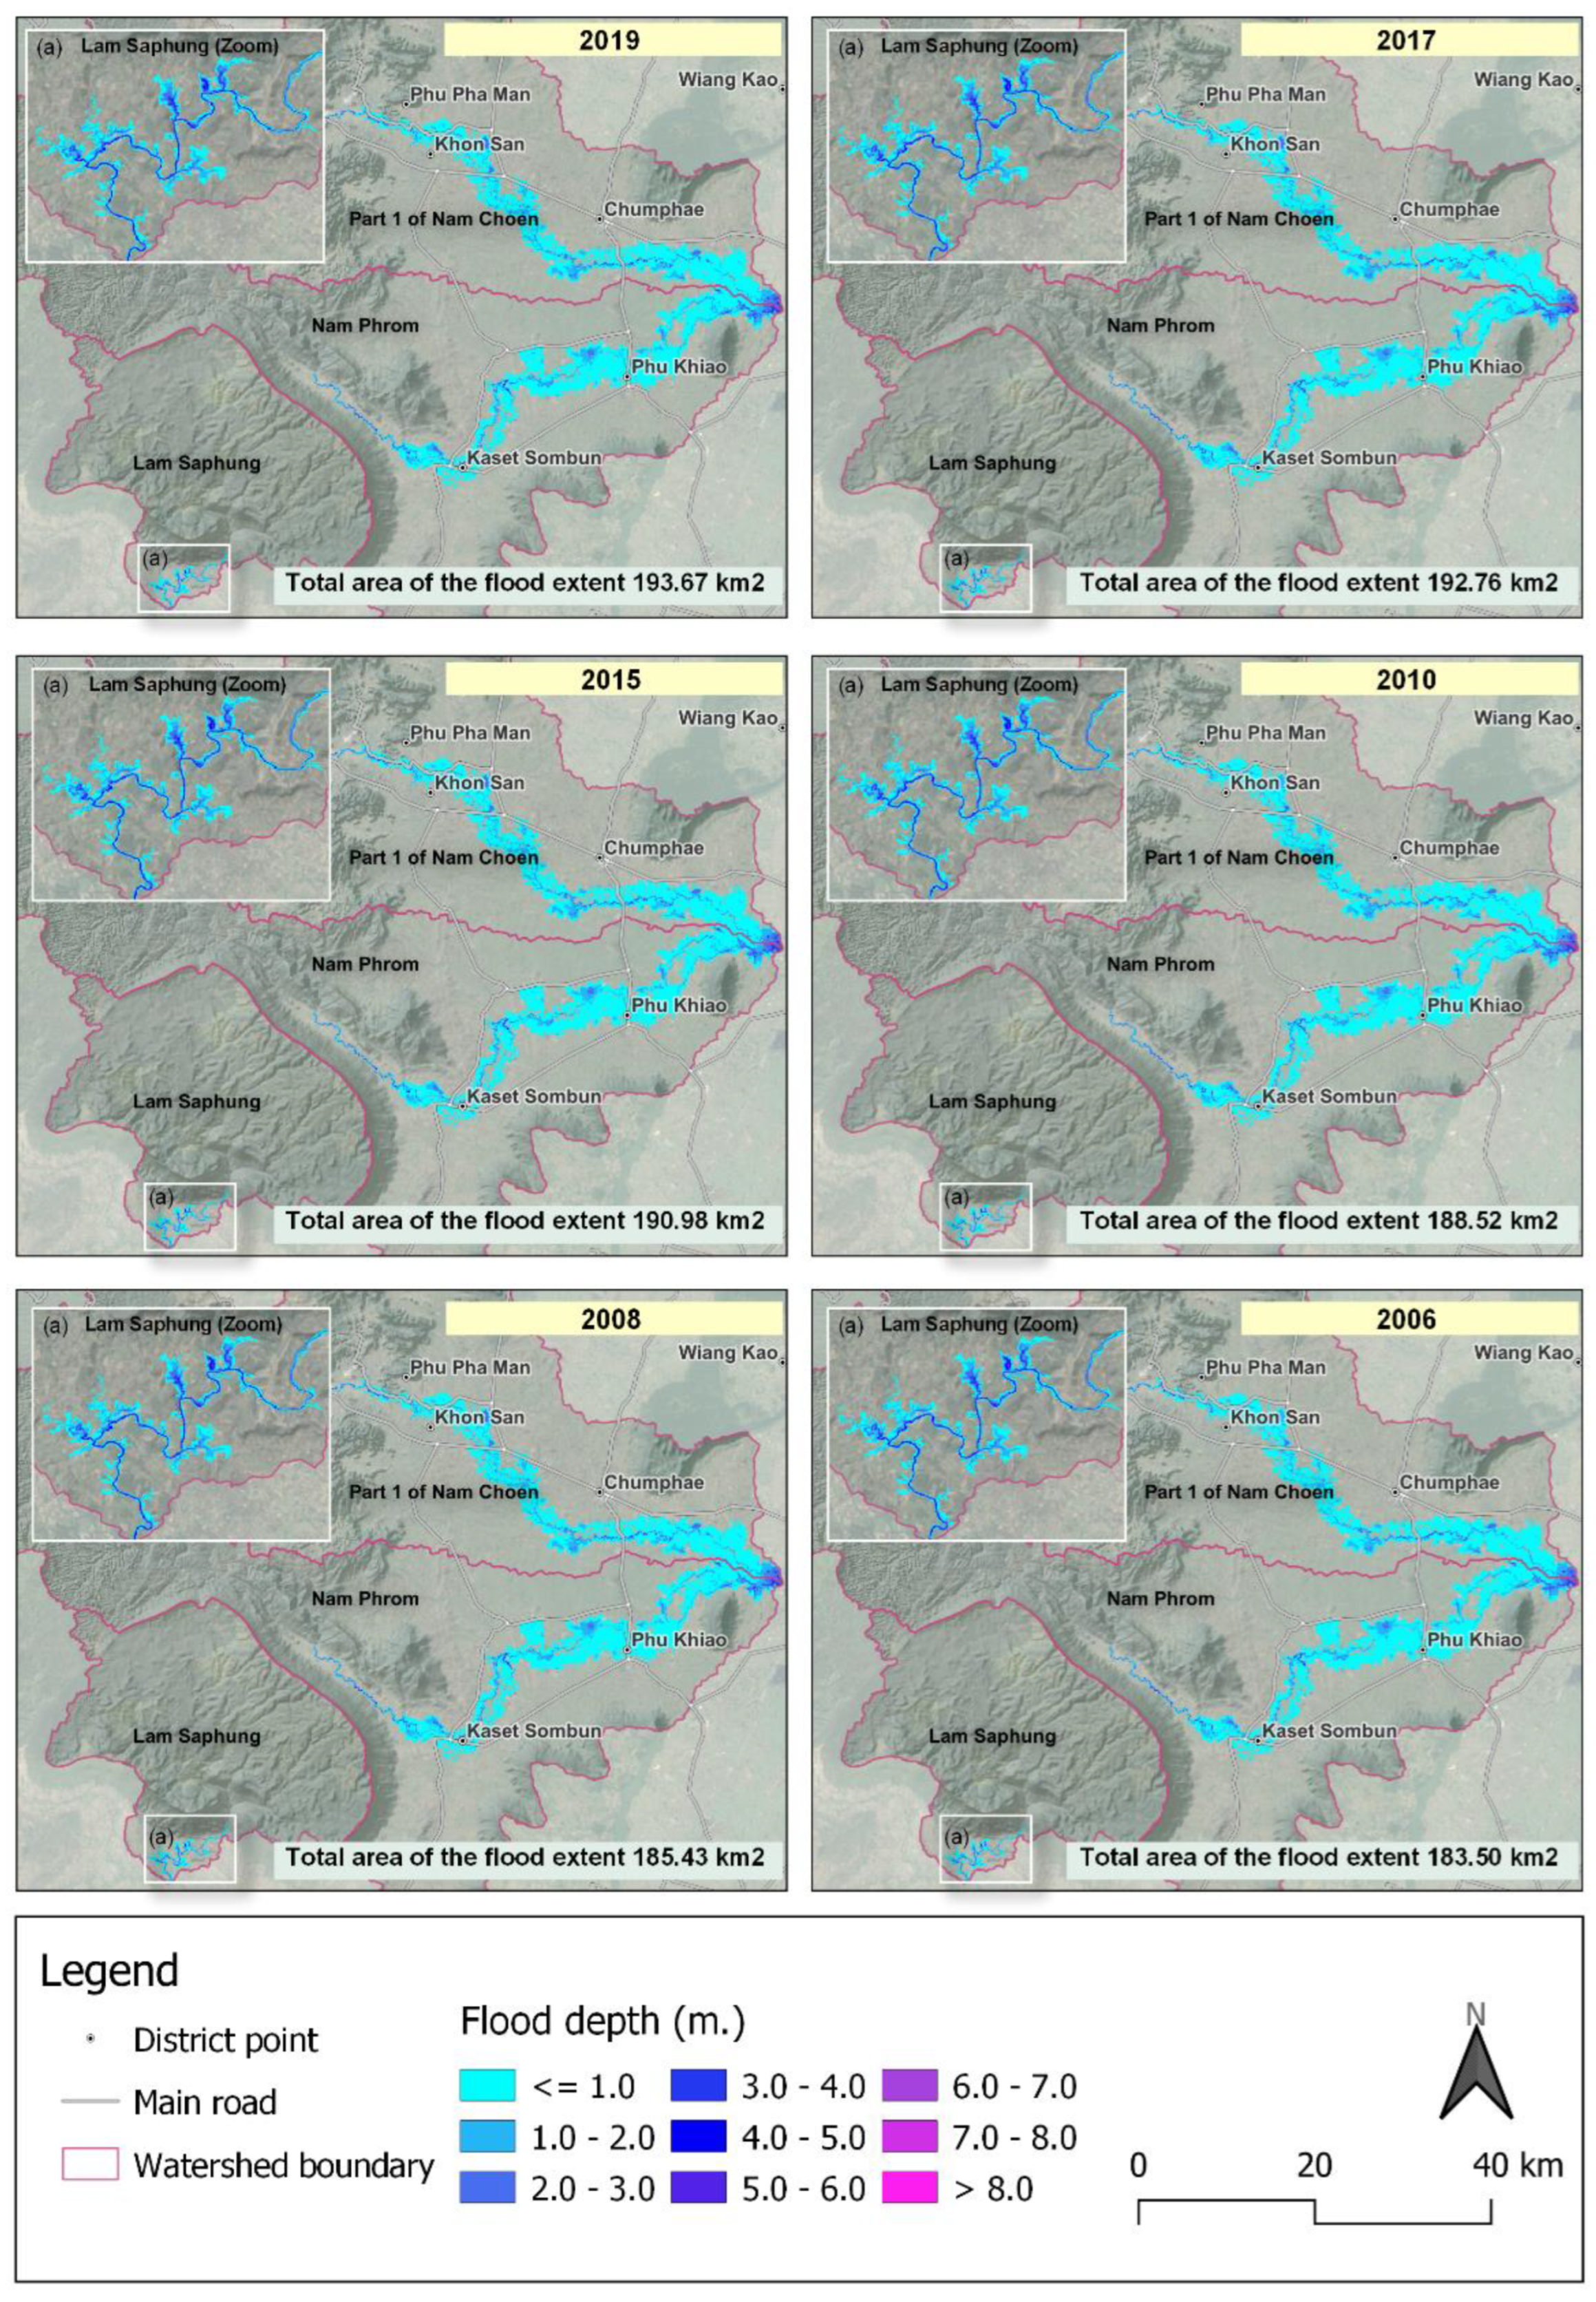
Figure 18.
Flood areas classified by type of land use each year (a) Lam Saphung Basin (b) Phrom River Basin and (C) Chern River Basin Part 1.
Figure 18.
Flood areas classified by type of land use each year (a) Lam Saphung Basin (b) Phrom River Basin and (C) Chern River Basin Part 1.
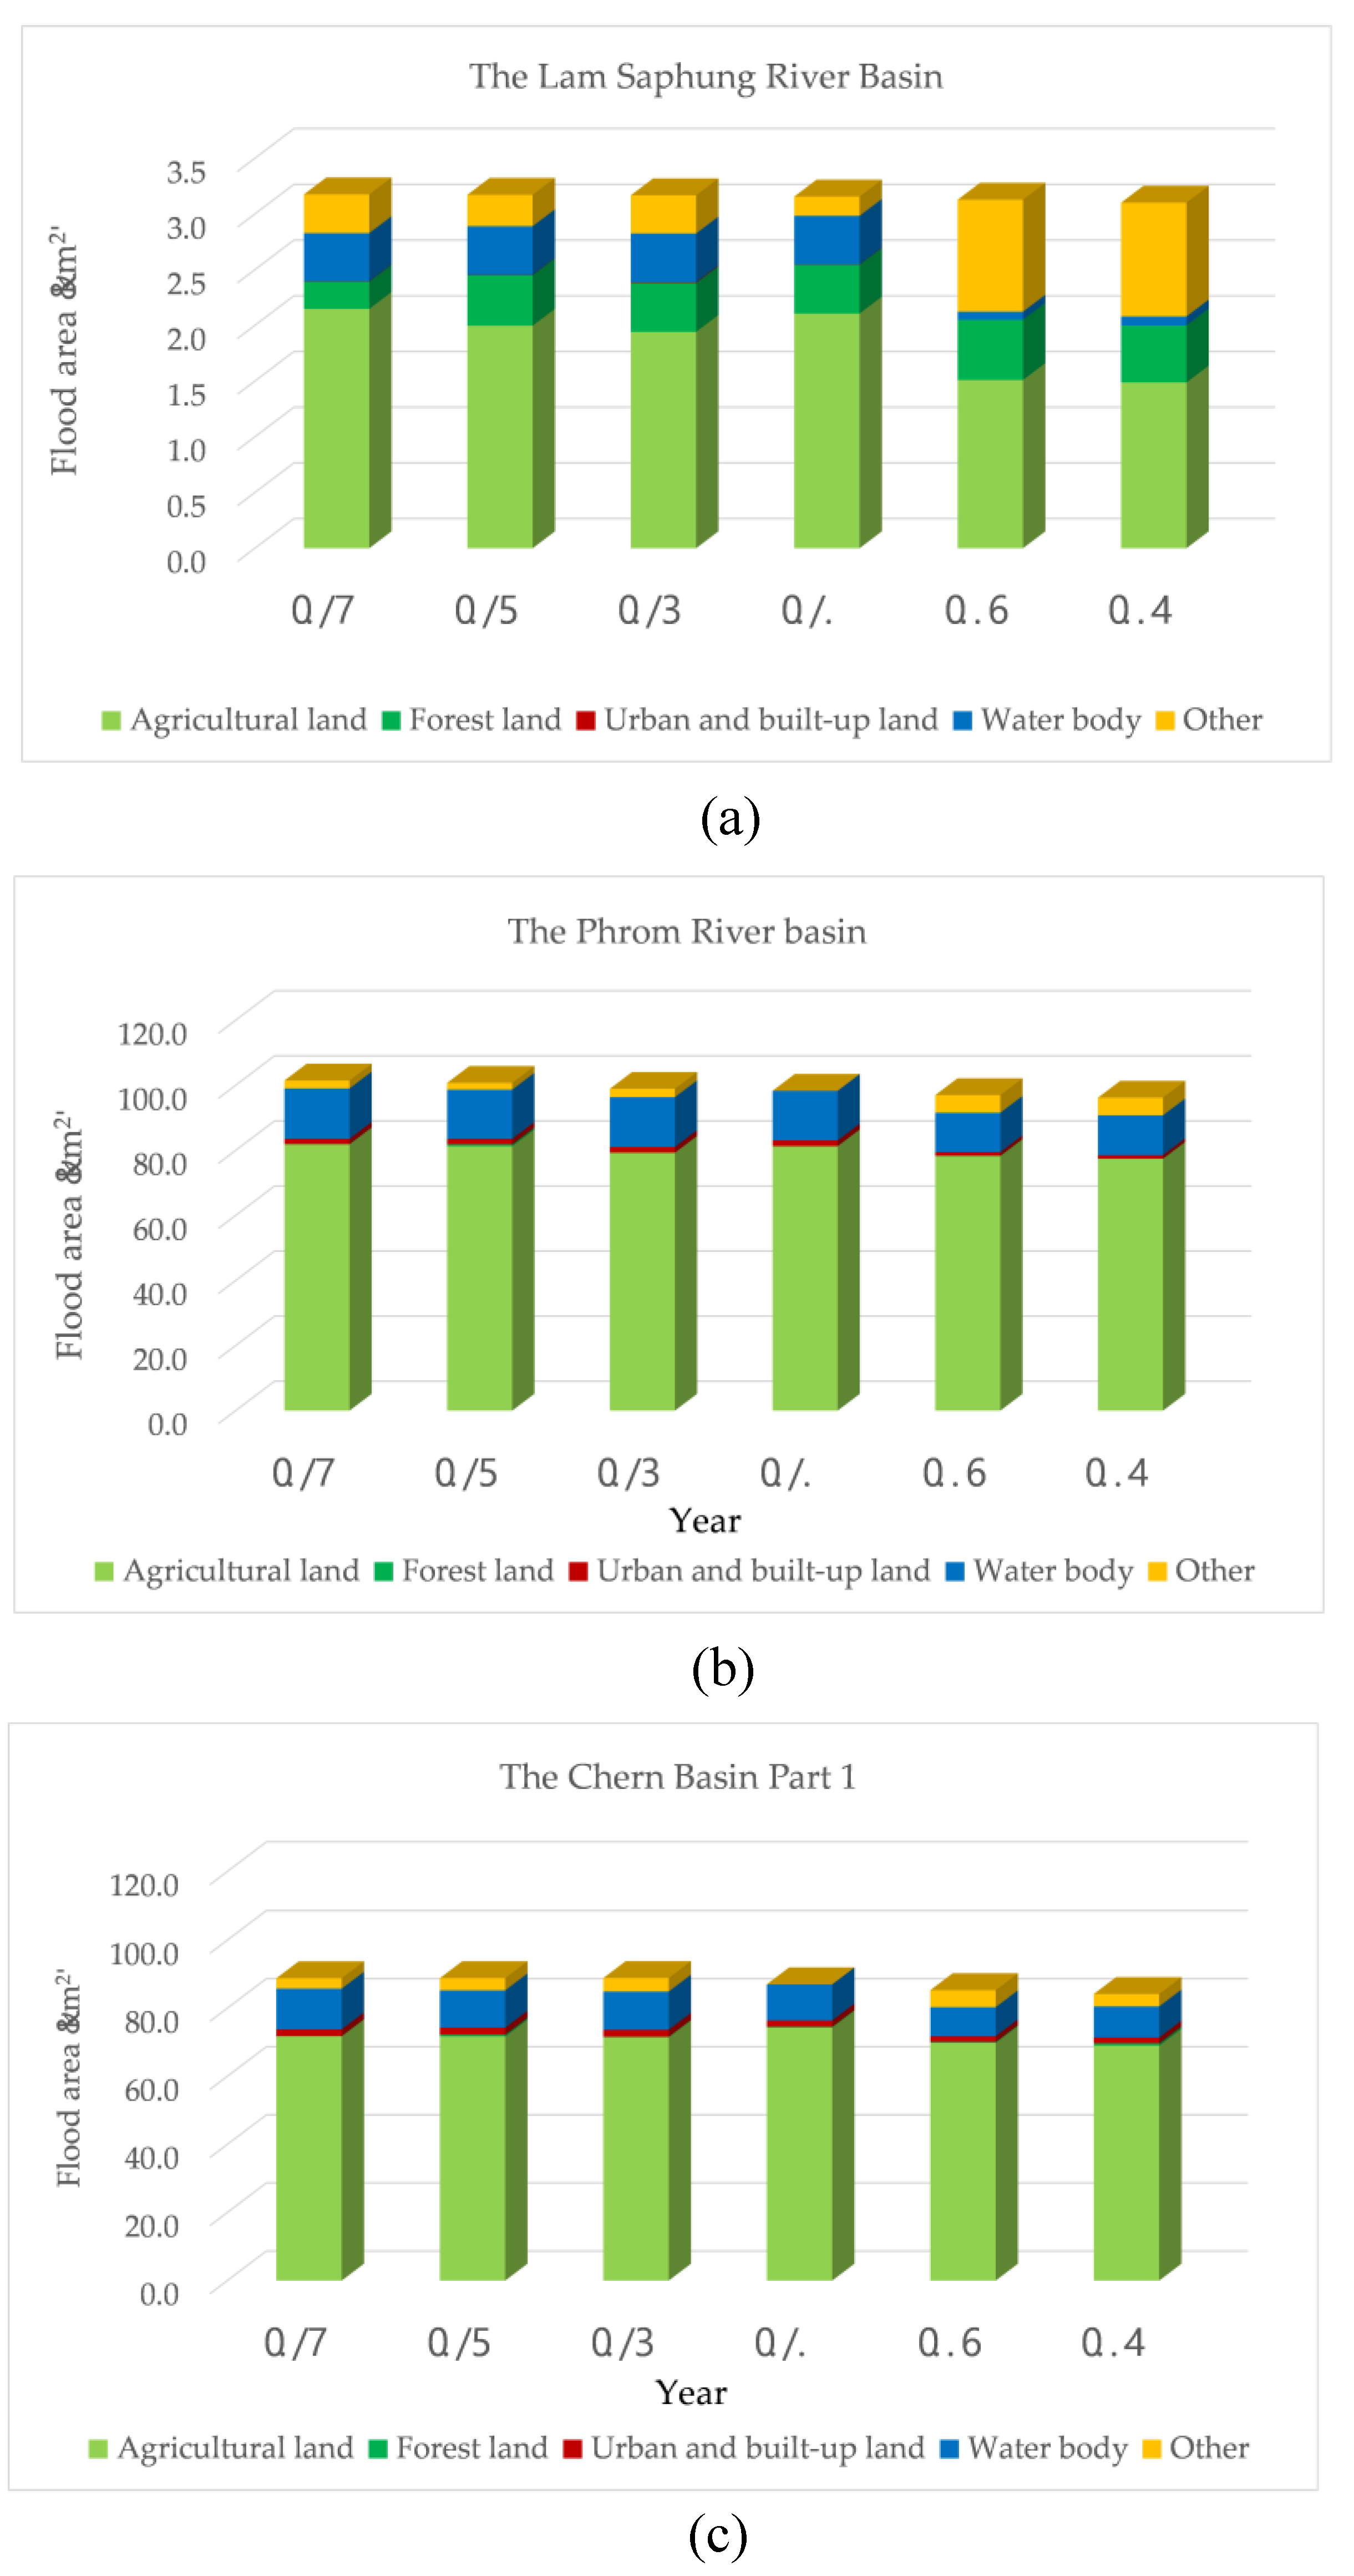
Figure 19.
Extent of flood areas from past flood events from HEC-RAS simulation.
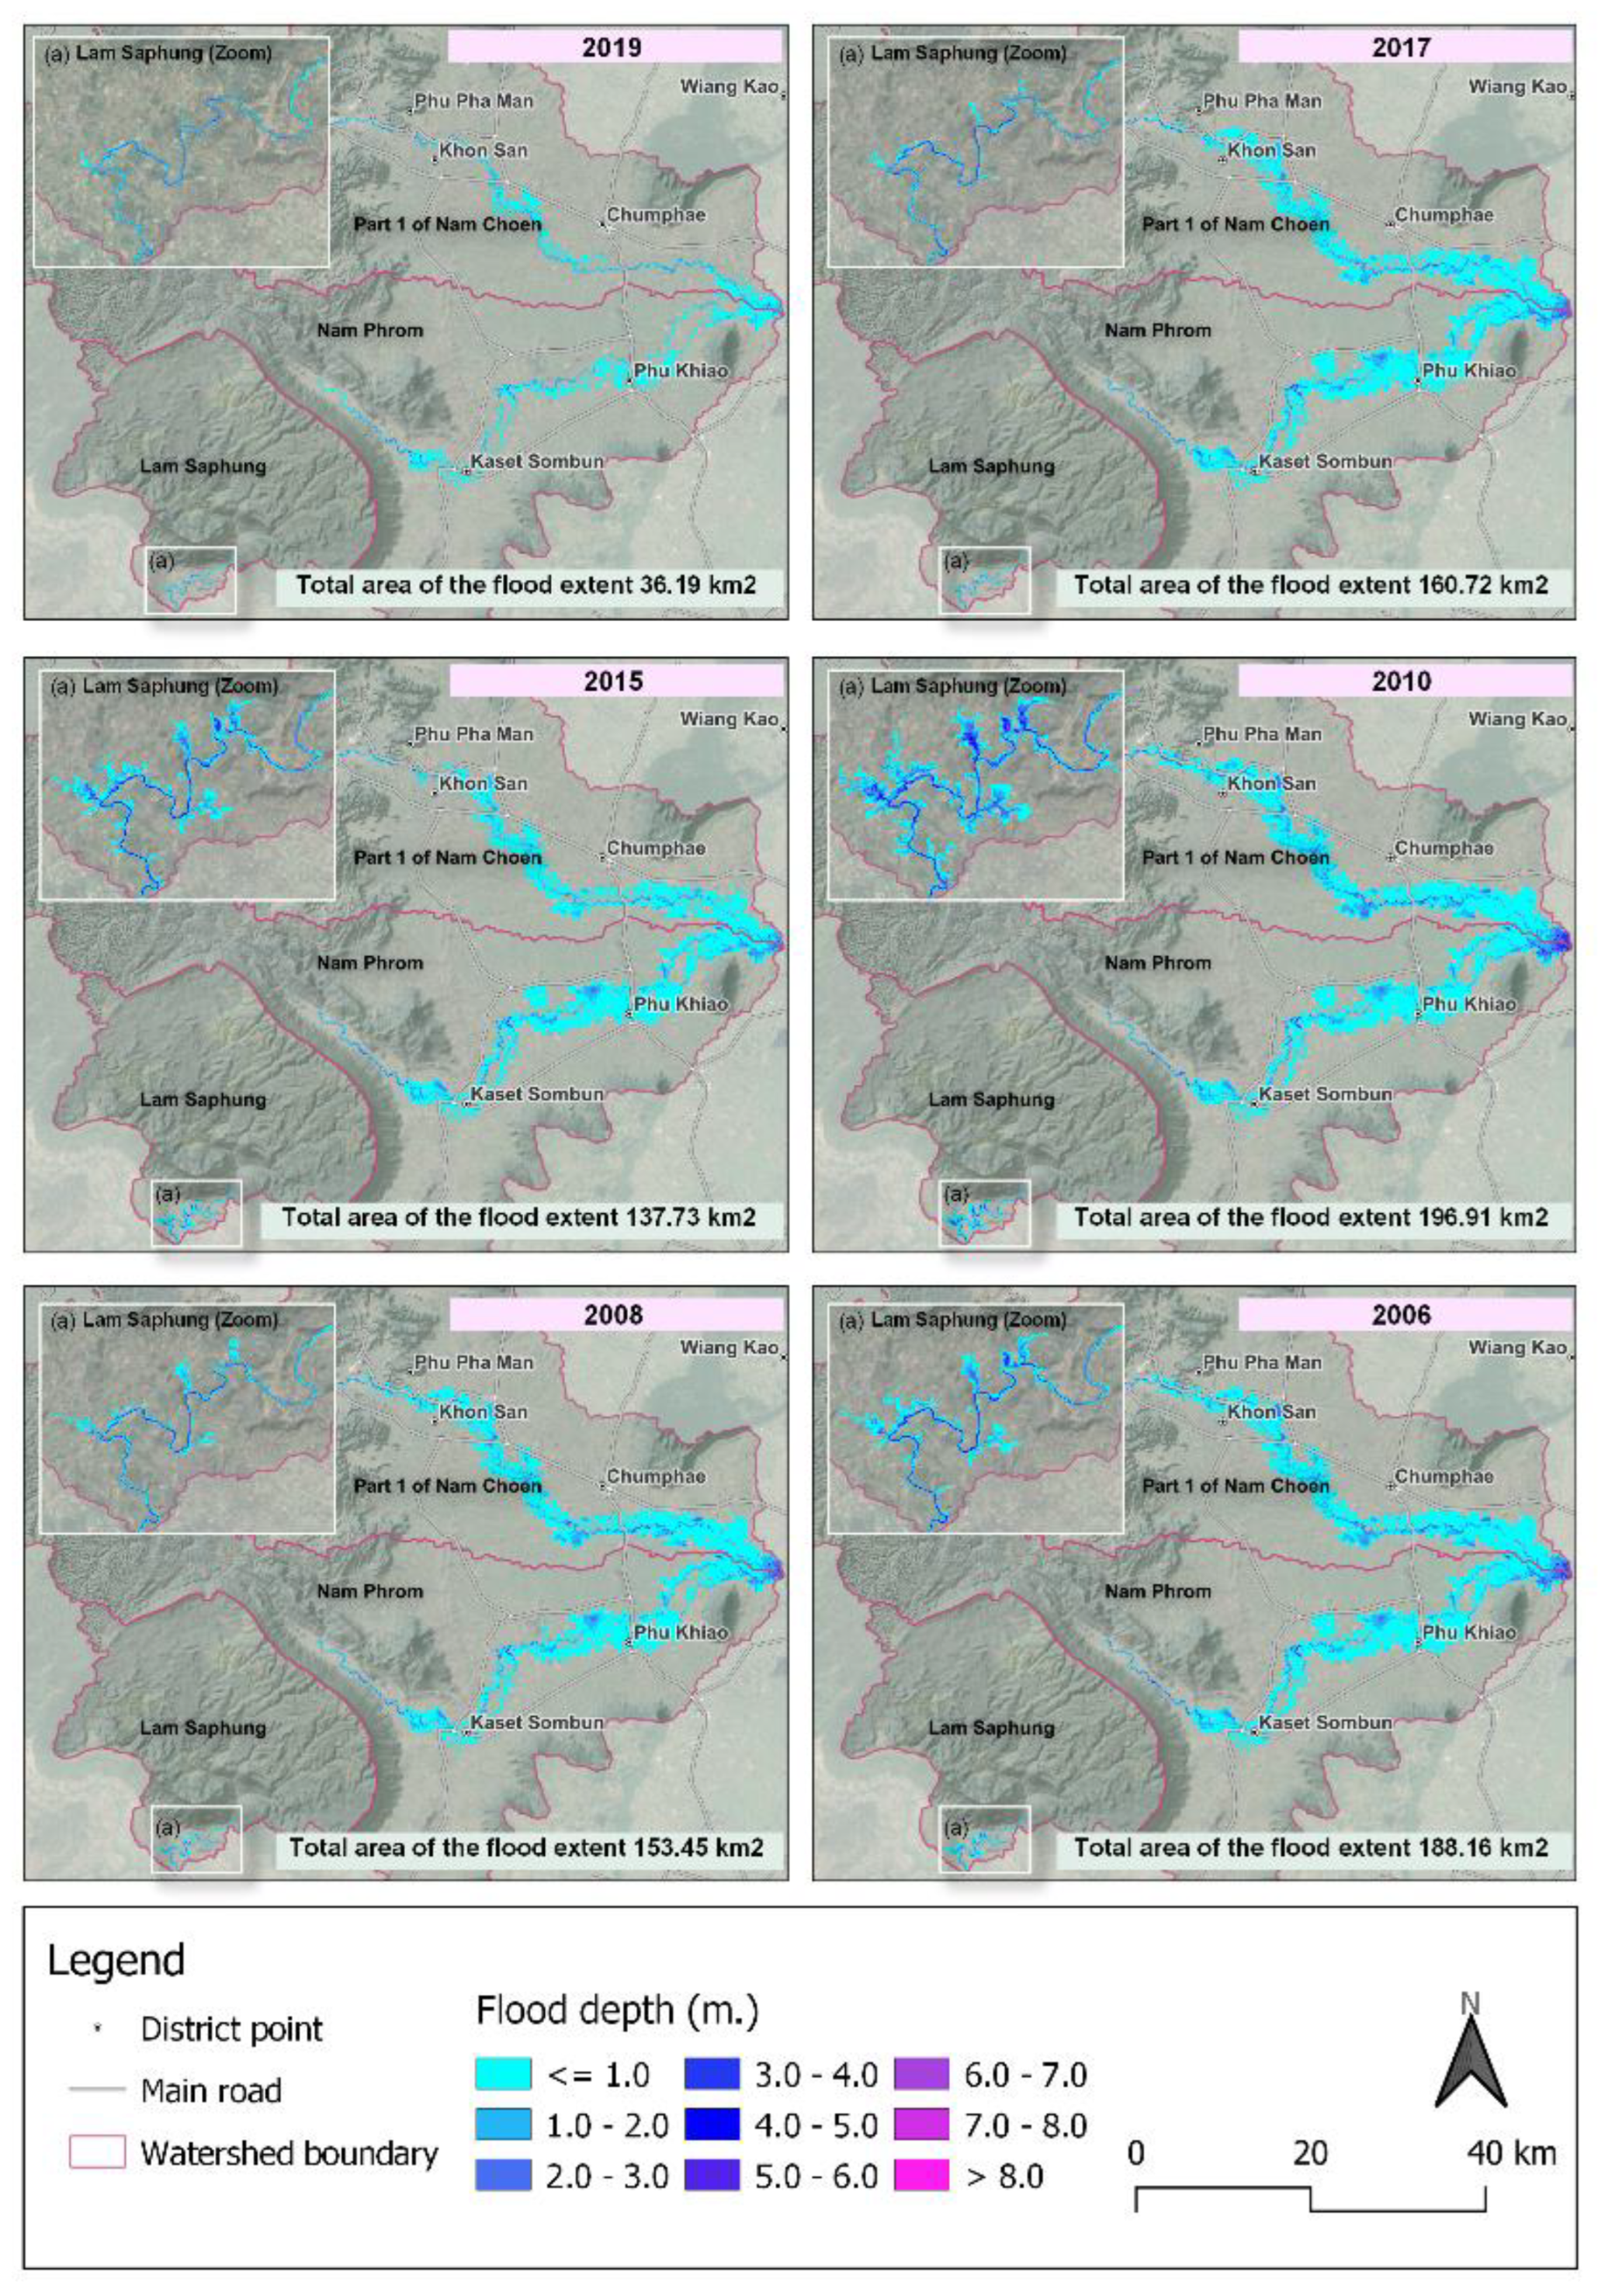
Figure 20.
Flooded areas from past flood events, classified by type of land use each year (a) Lam Saphung River Basin, (b) Phrom River Basin, and (c) Chern River Basin Part 1.
Figure 20.
Flooded areas from past flood events, classified by type of land use each year (a) Lam Saphung River Basin, (b) Phrom River Basin, and (c) Chern River Basin Part 1.
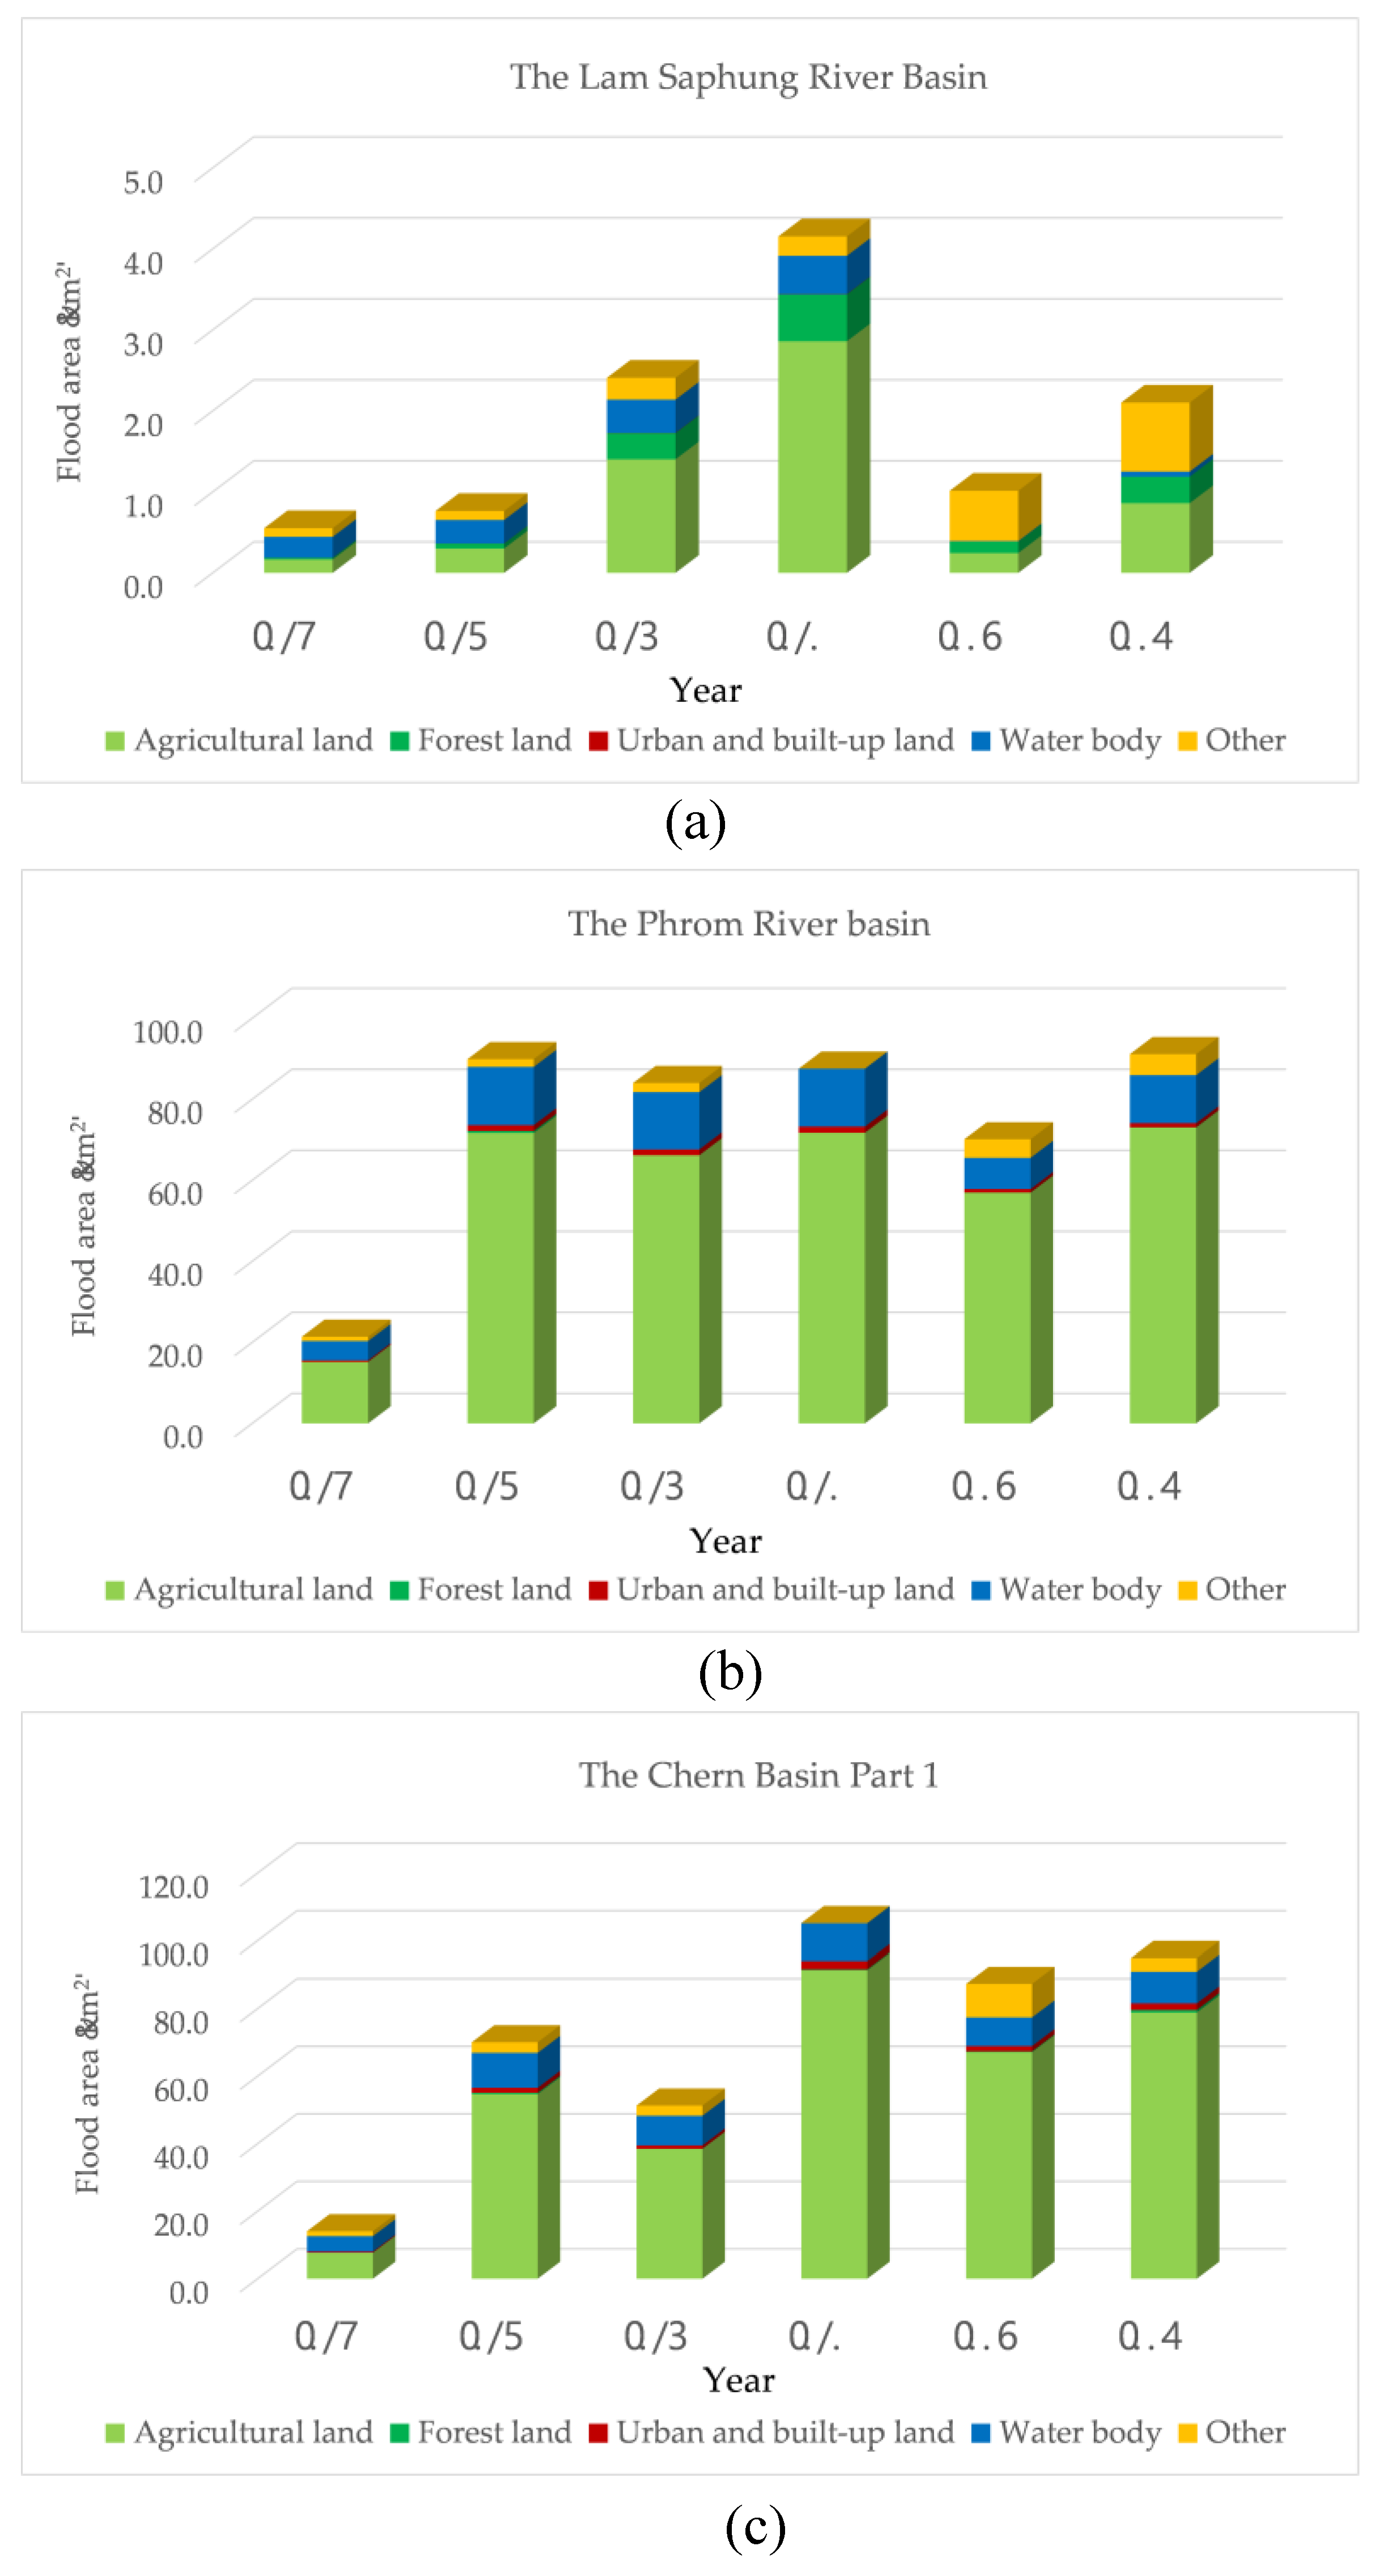
Figure 21.
Extent of flooded areas from past land use changes.
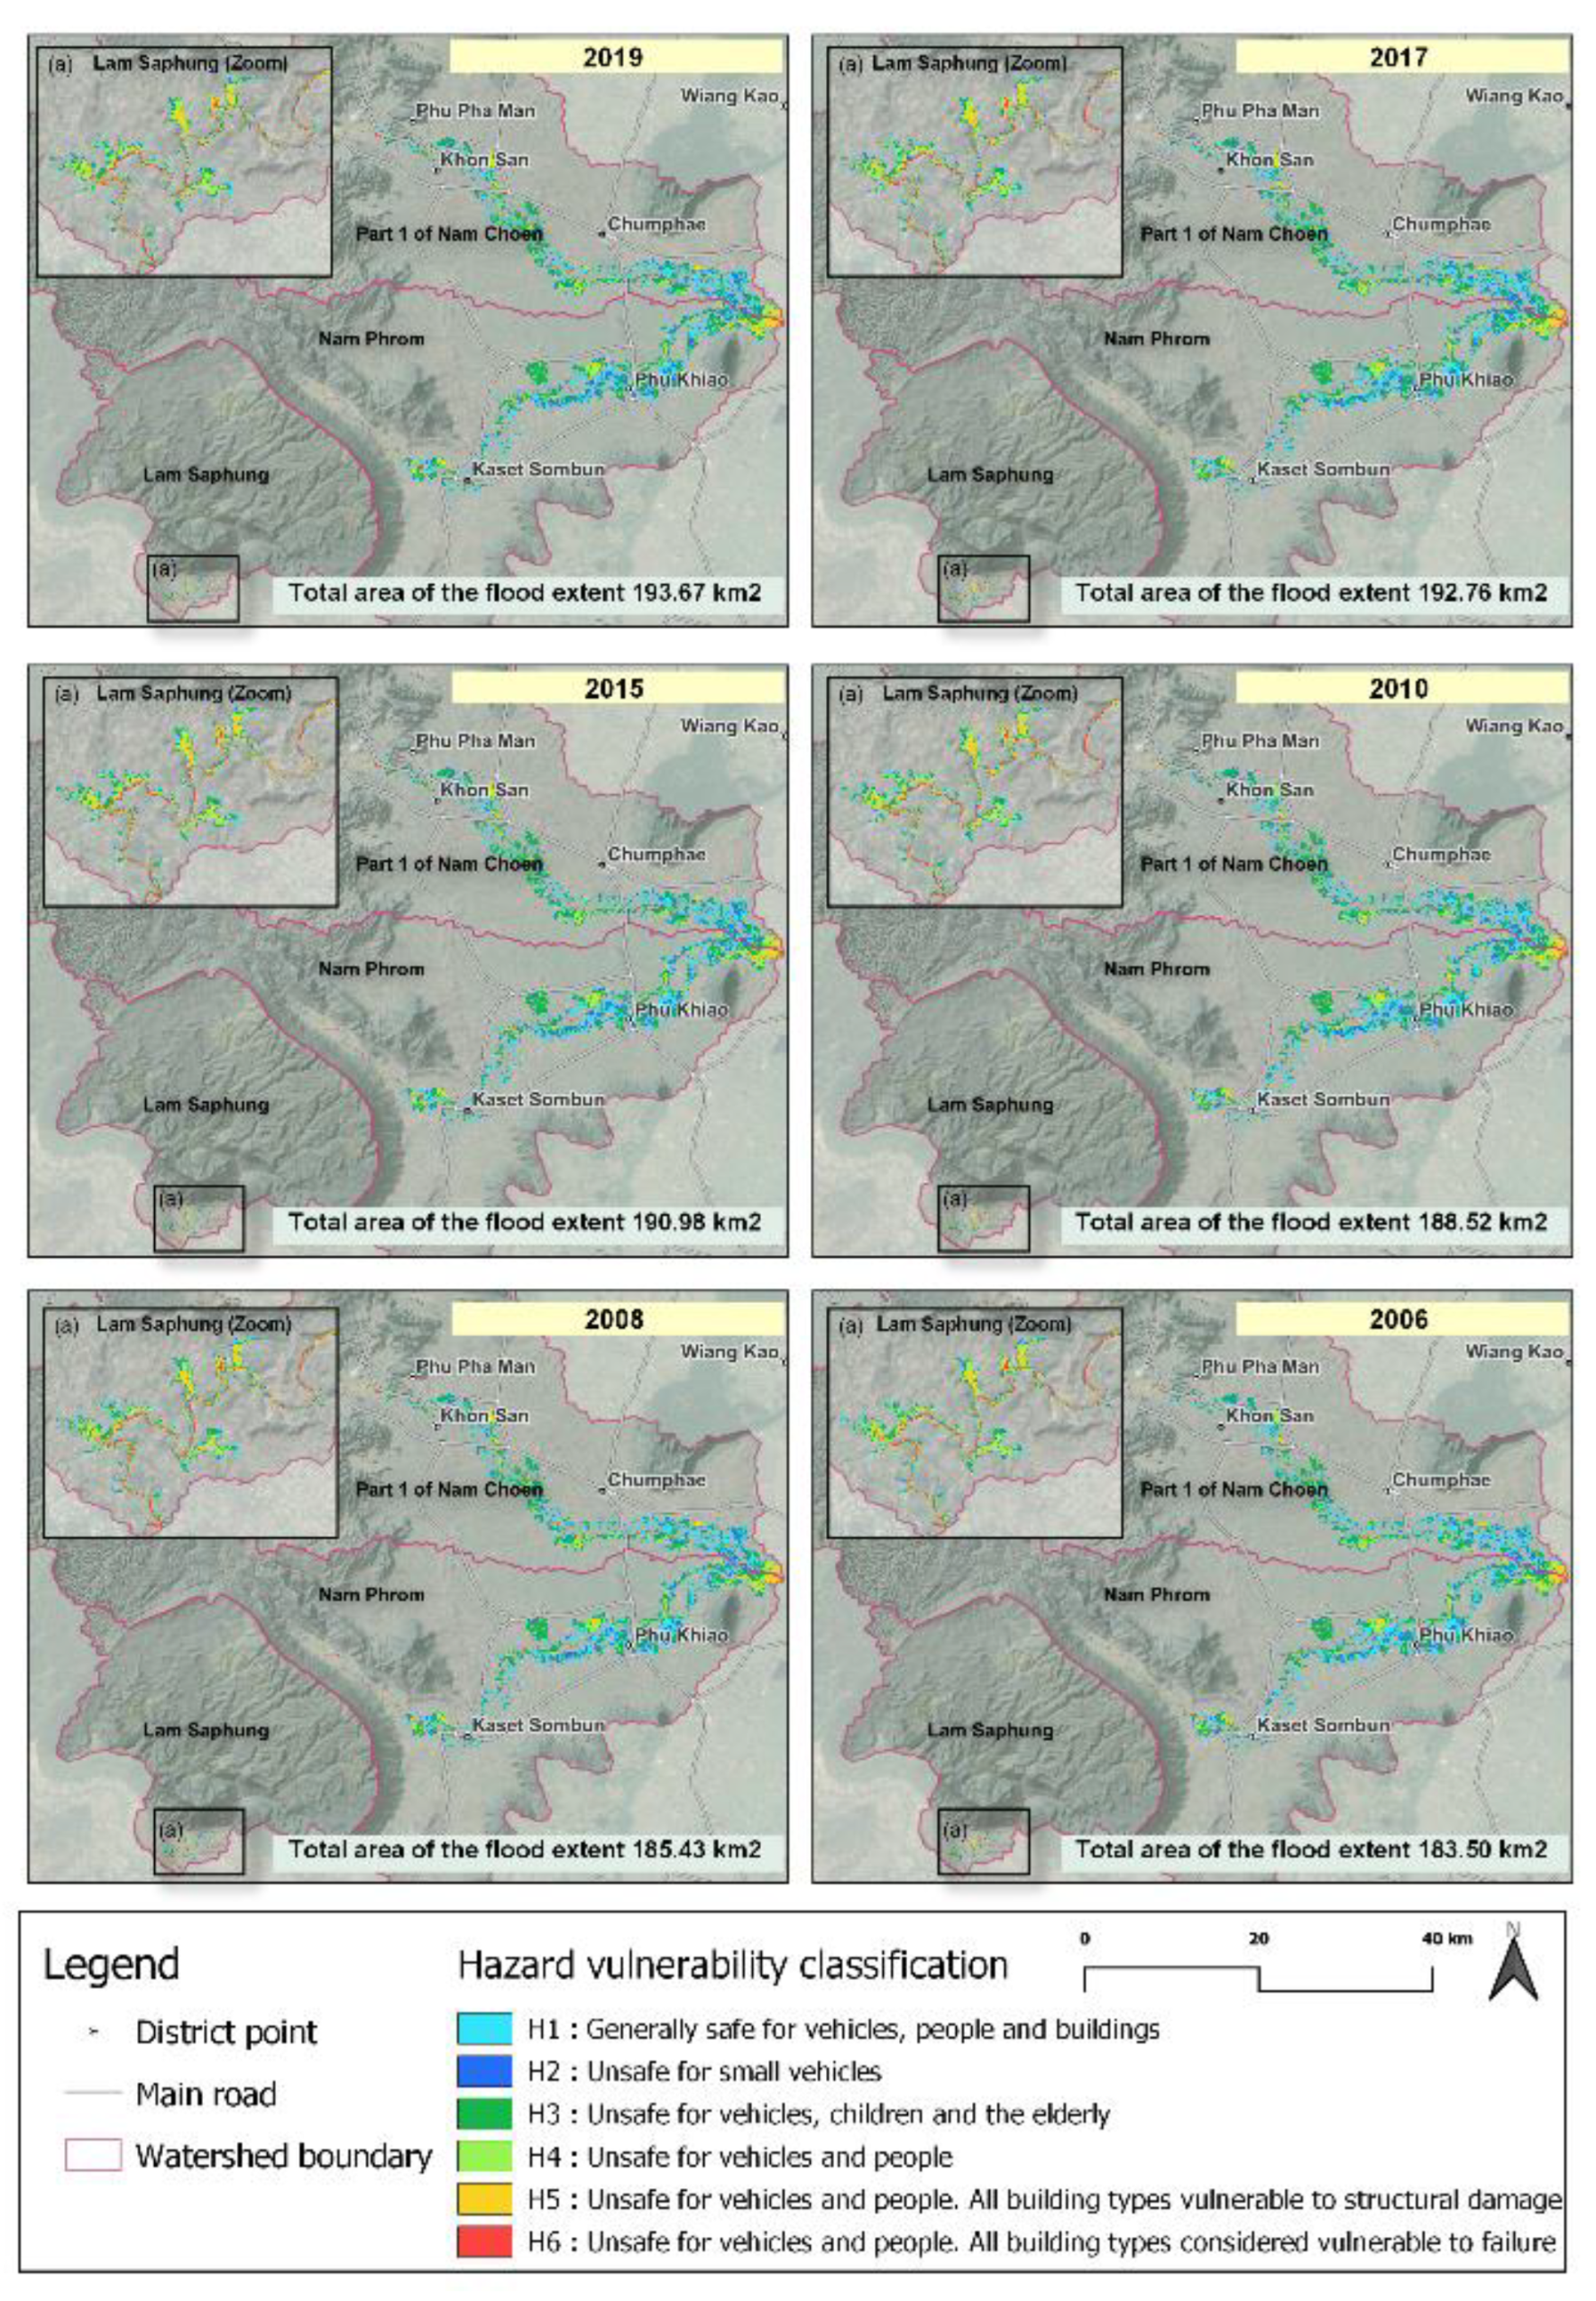
Figure 22.
Areas flooded each year, classified according to the level of flood danger (a) Lam Saphung River Basin, (b) Phrom River Basin, and (c) Chern River Basin Part 1.
Figure 22.
Areas flooded each year, classified according to the level of flood danger (a) Lam Saphung River Basin, (b) Phrom River Basin, and (c) Chern River Basin Part 1.
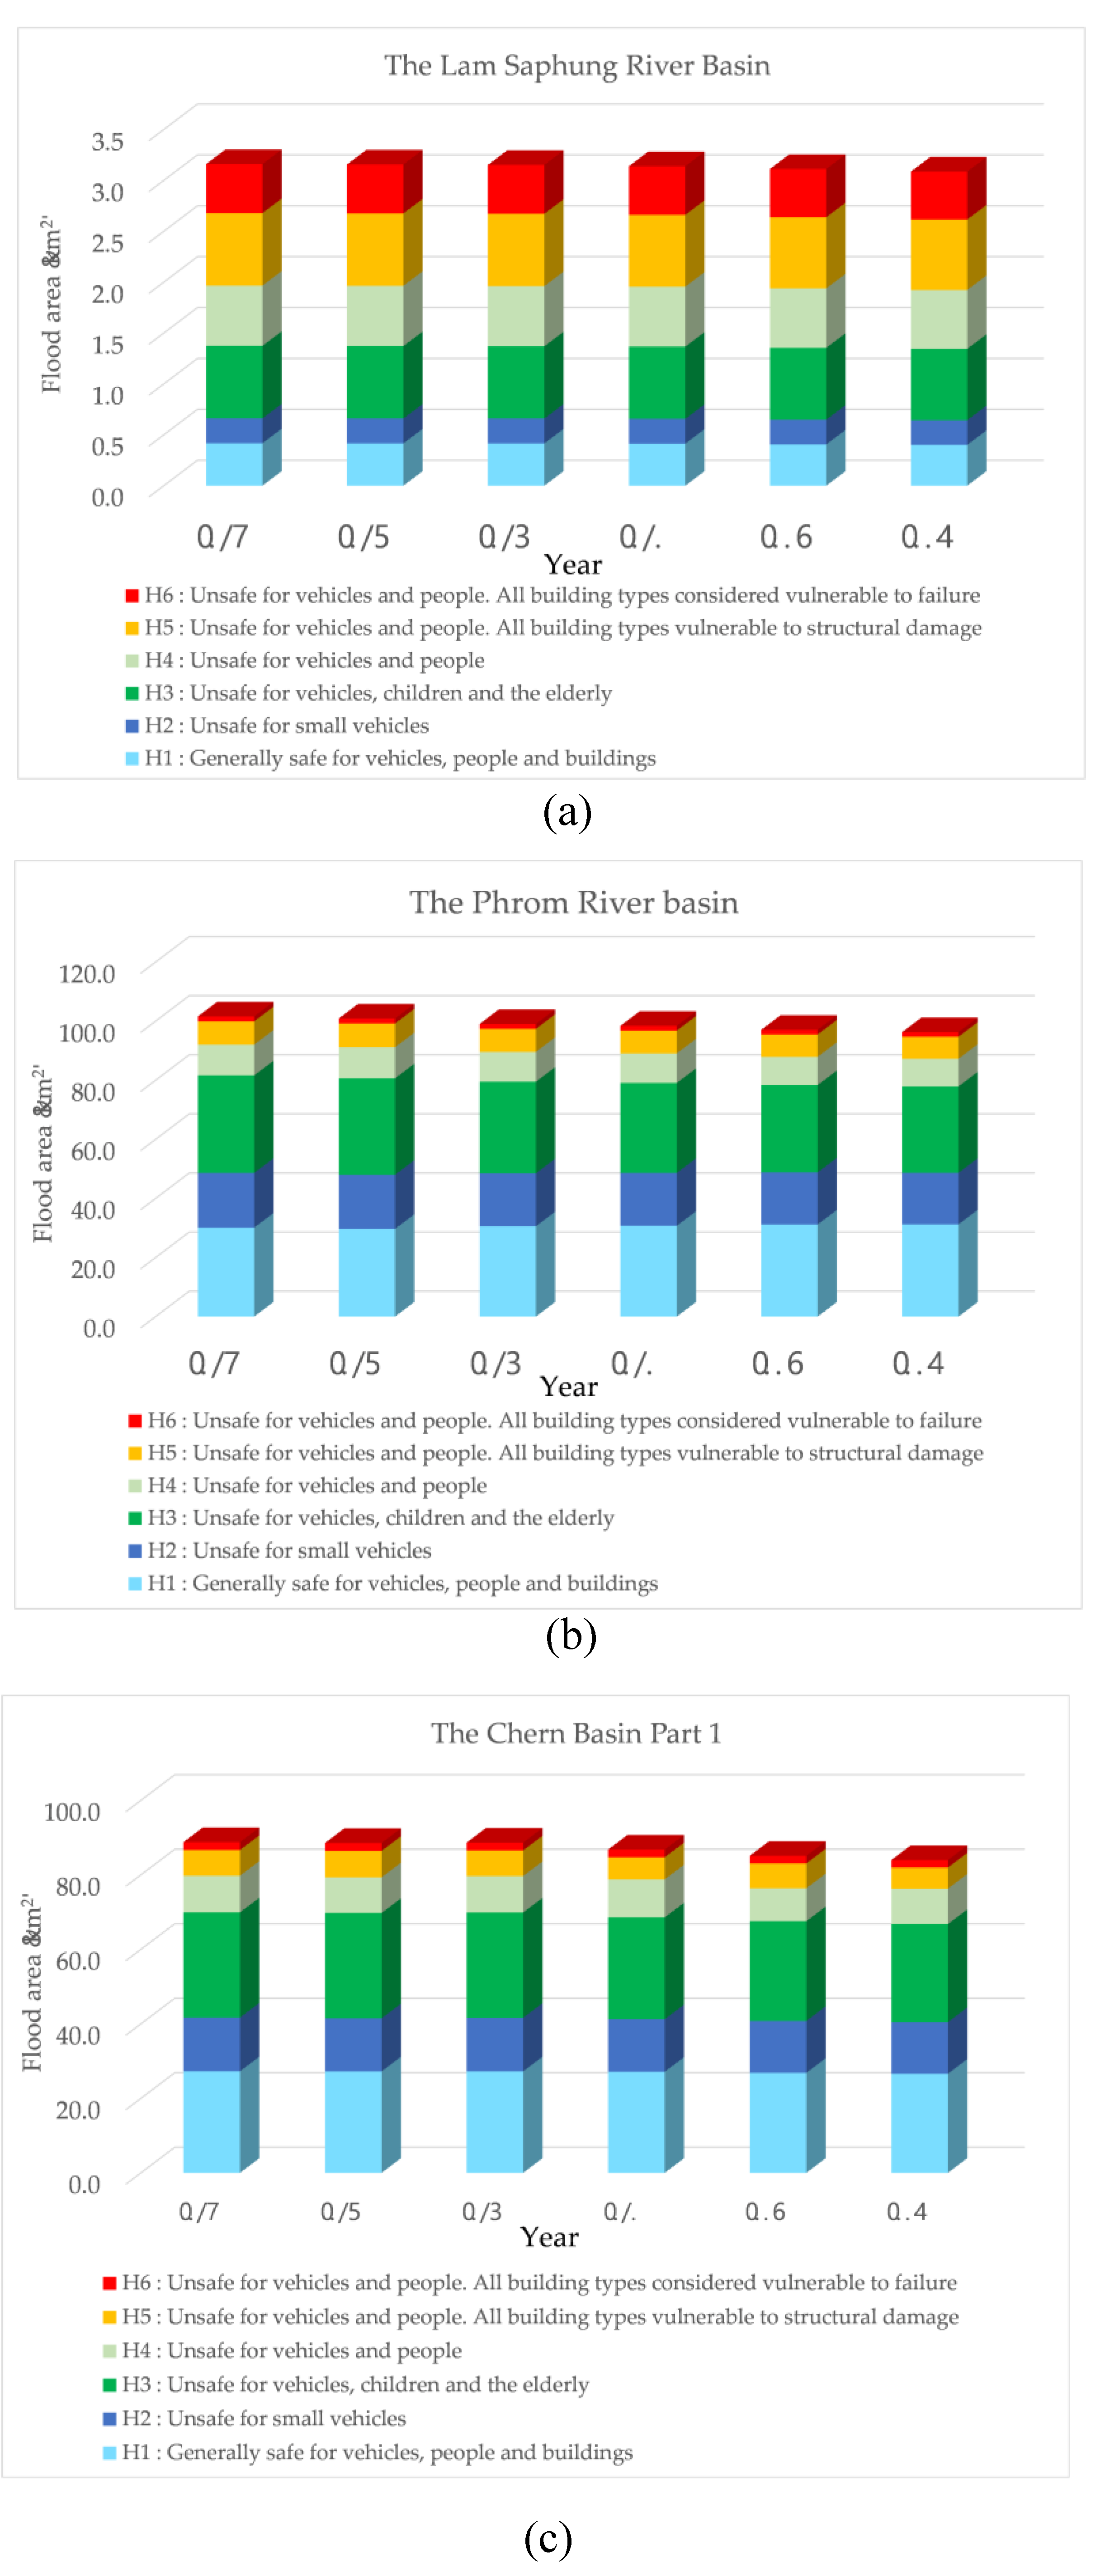
Figure 23.
Area extent of flood hazard levels from past flood events from simulations with the HEC-RAS model.
Figure 23.
Area extent of flood hazard levels from past flood events from simulations with the HEC-RAS model.
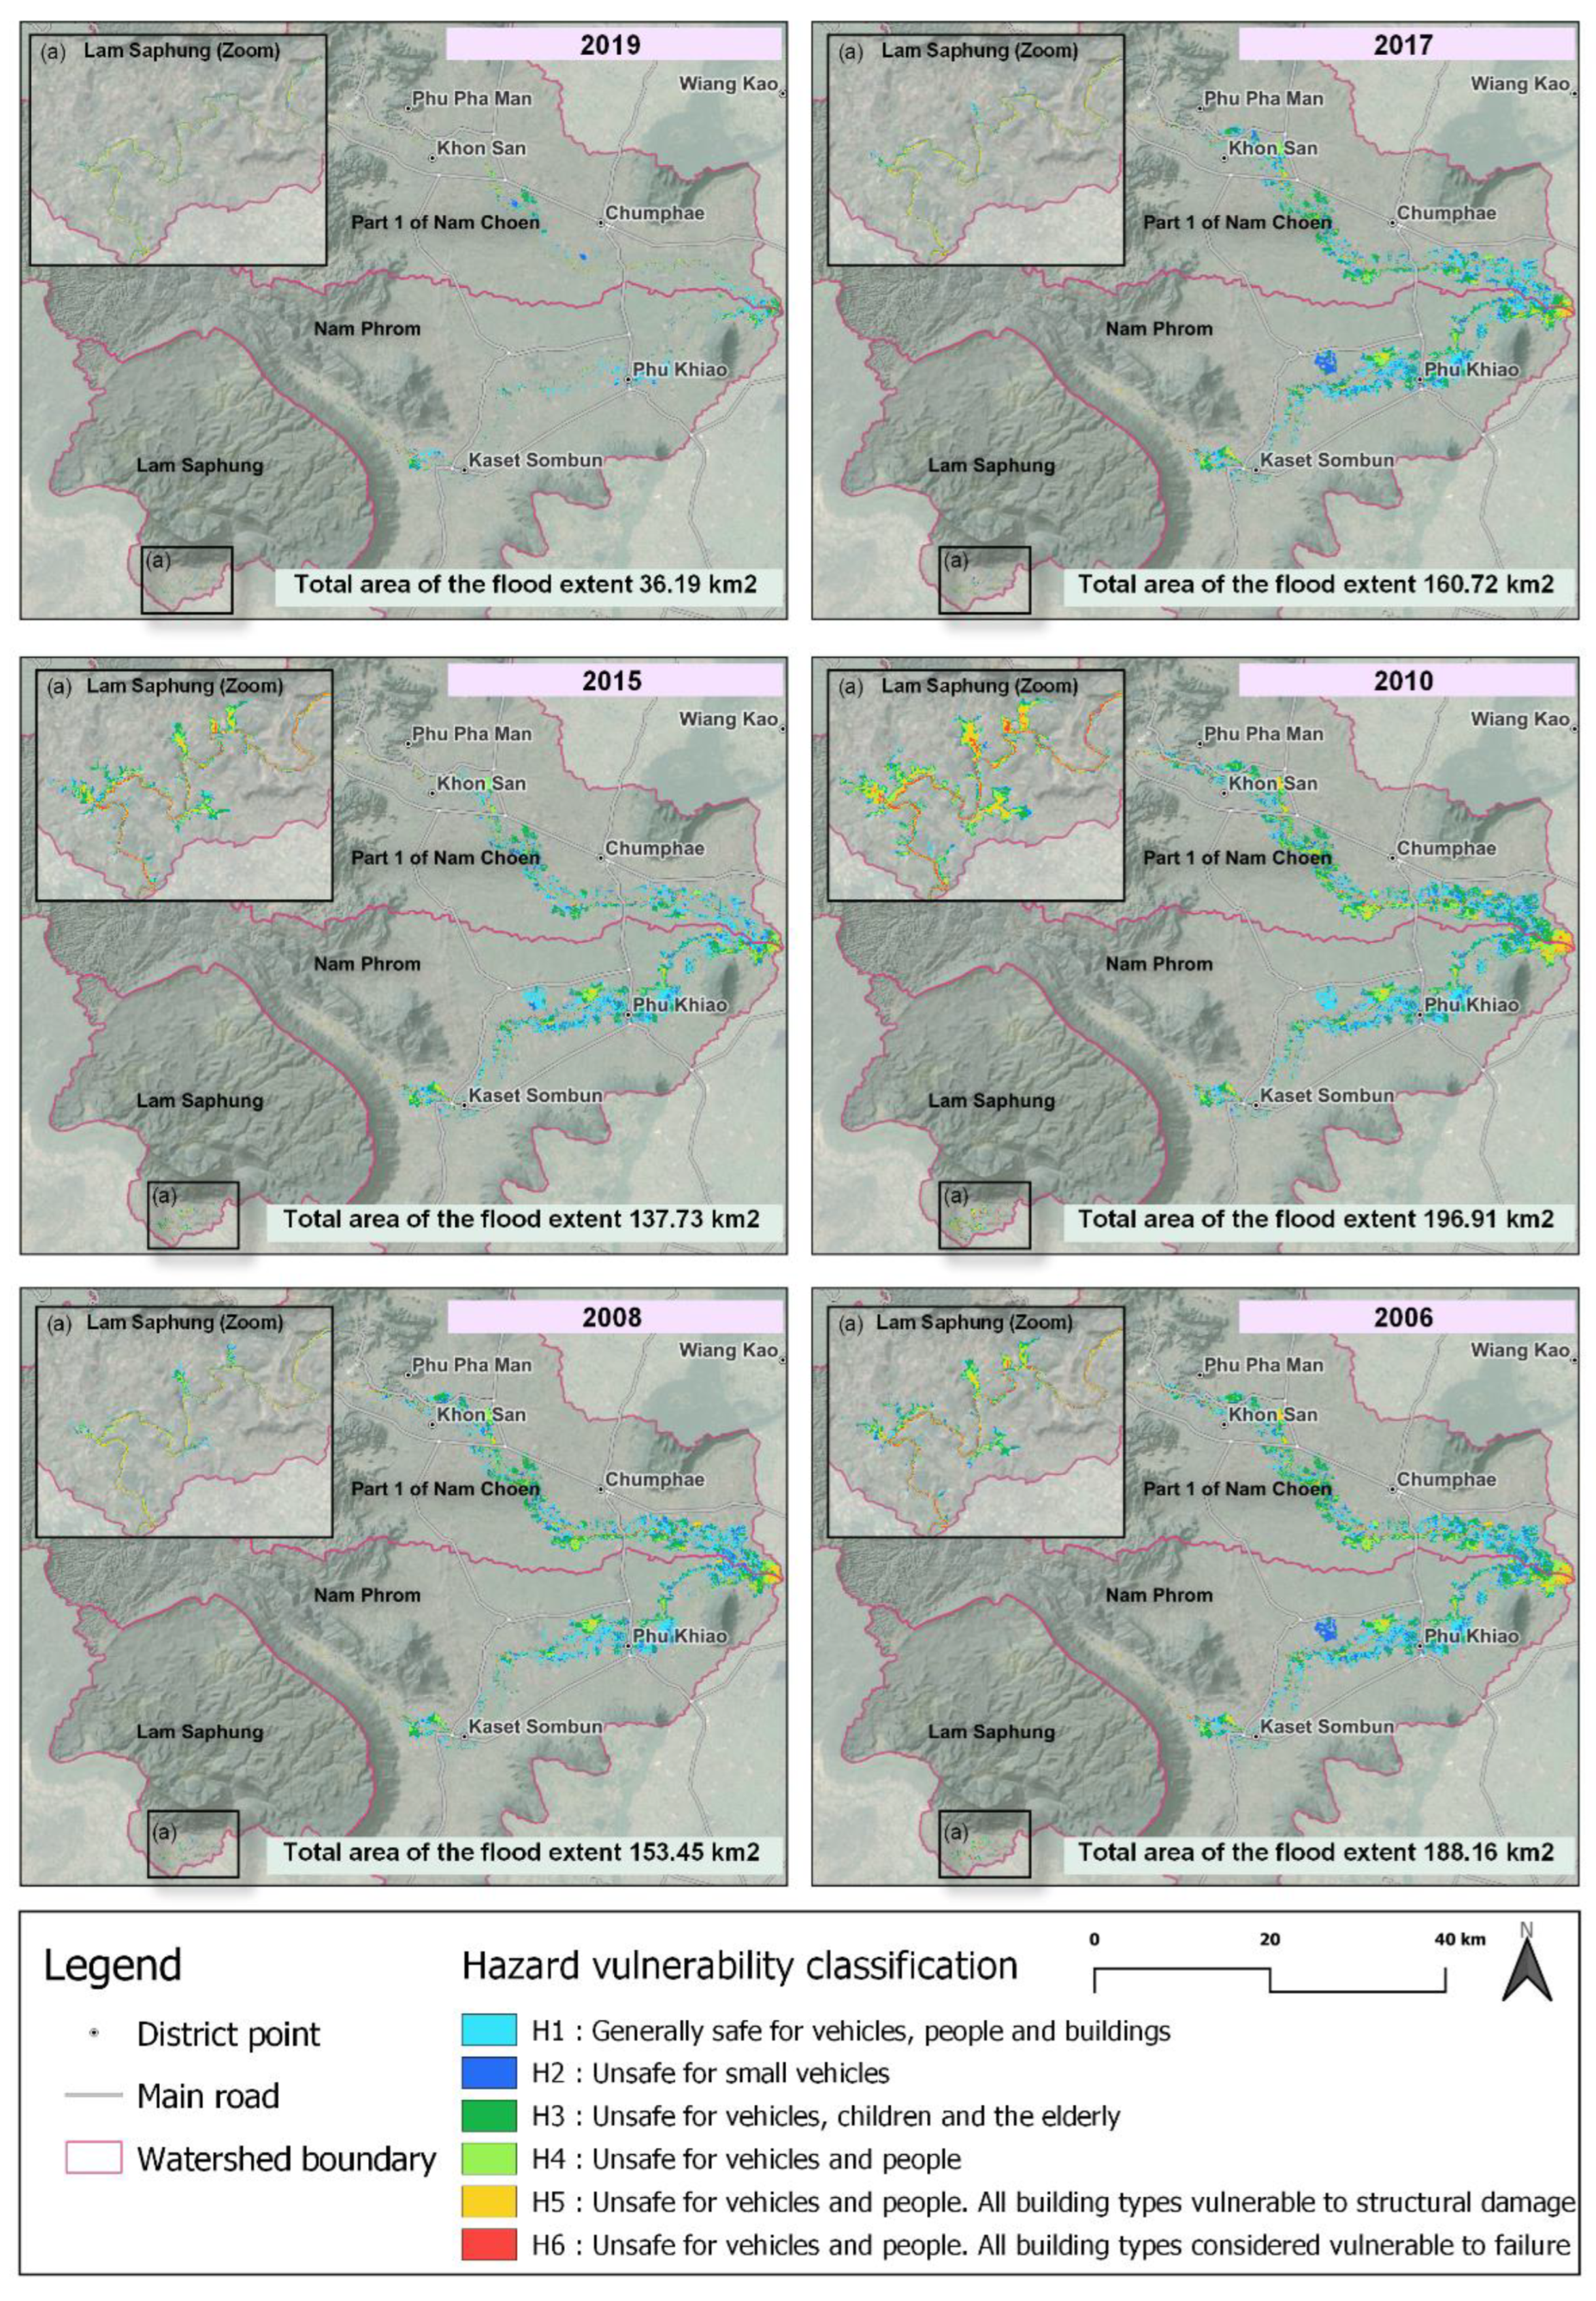
Figure 24.
Flood danger level areas from past flood events in each year (a) Lam Saphung River Basin, (b) Phrom River Basin, and (c) Chern River Basin Part 1.
Figure 24.
Flood danger level areas from past flood events in each year (a) Lam Saphung River Basin, (b) Phrom River Basin, and (c) Chern River Basin Part 1.
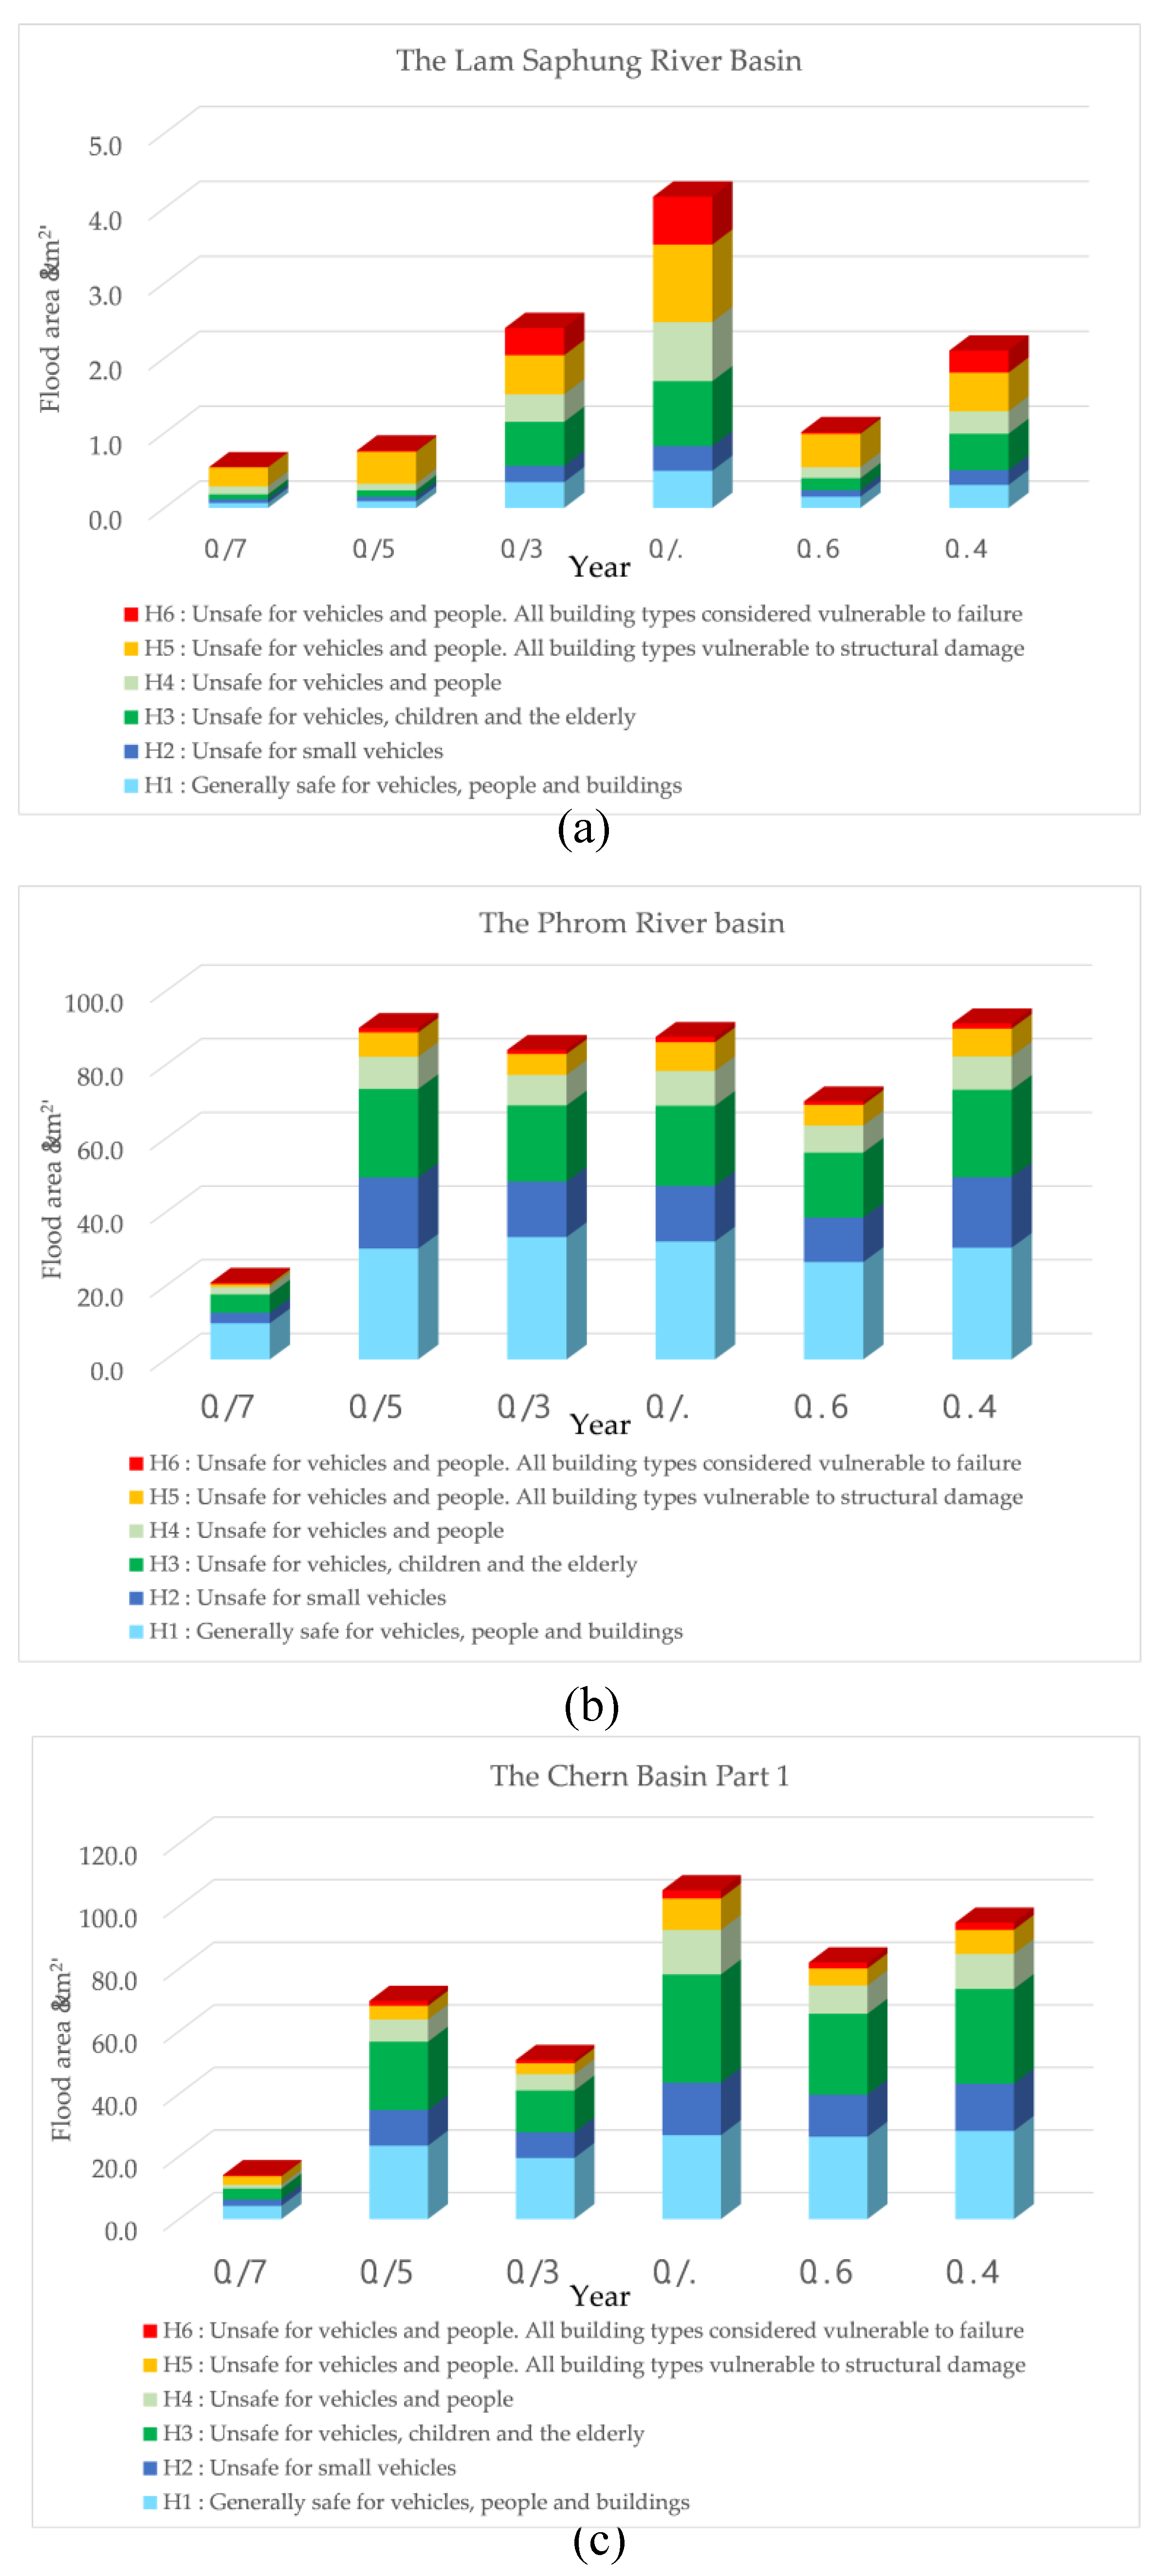

Table 1.
Data Used in Simulating Water Scenarios.
| Data Sources During the year 2006-2021 | |
| DEM | Department of Land Development |
| Land Use Map | Department of Land Development |
| Hydraulic Building | Department of Irrigation |
| Shape file | GISTDA |
Table 2.
Manning's roughness coefficient (n) values [51].
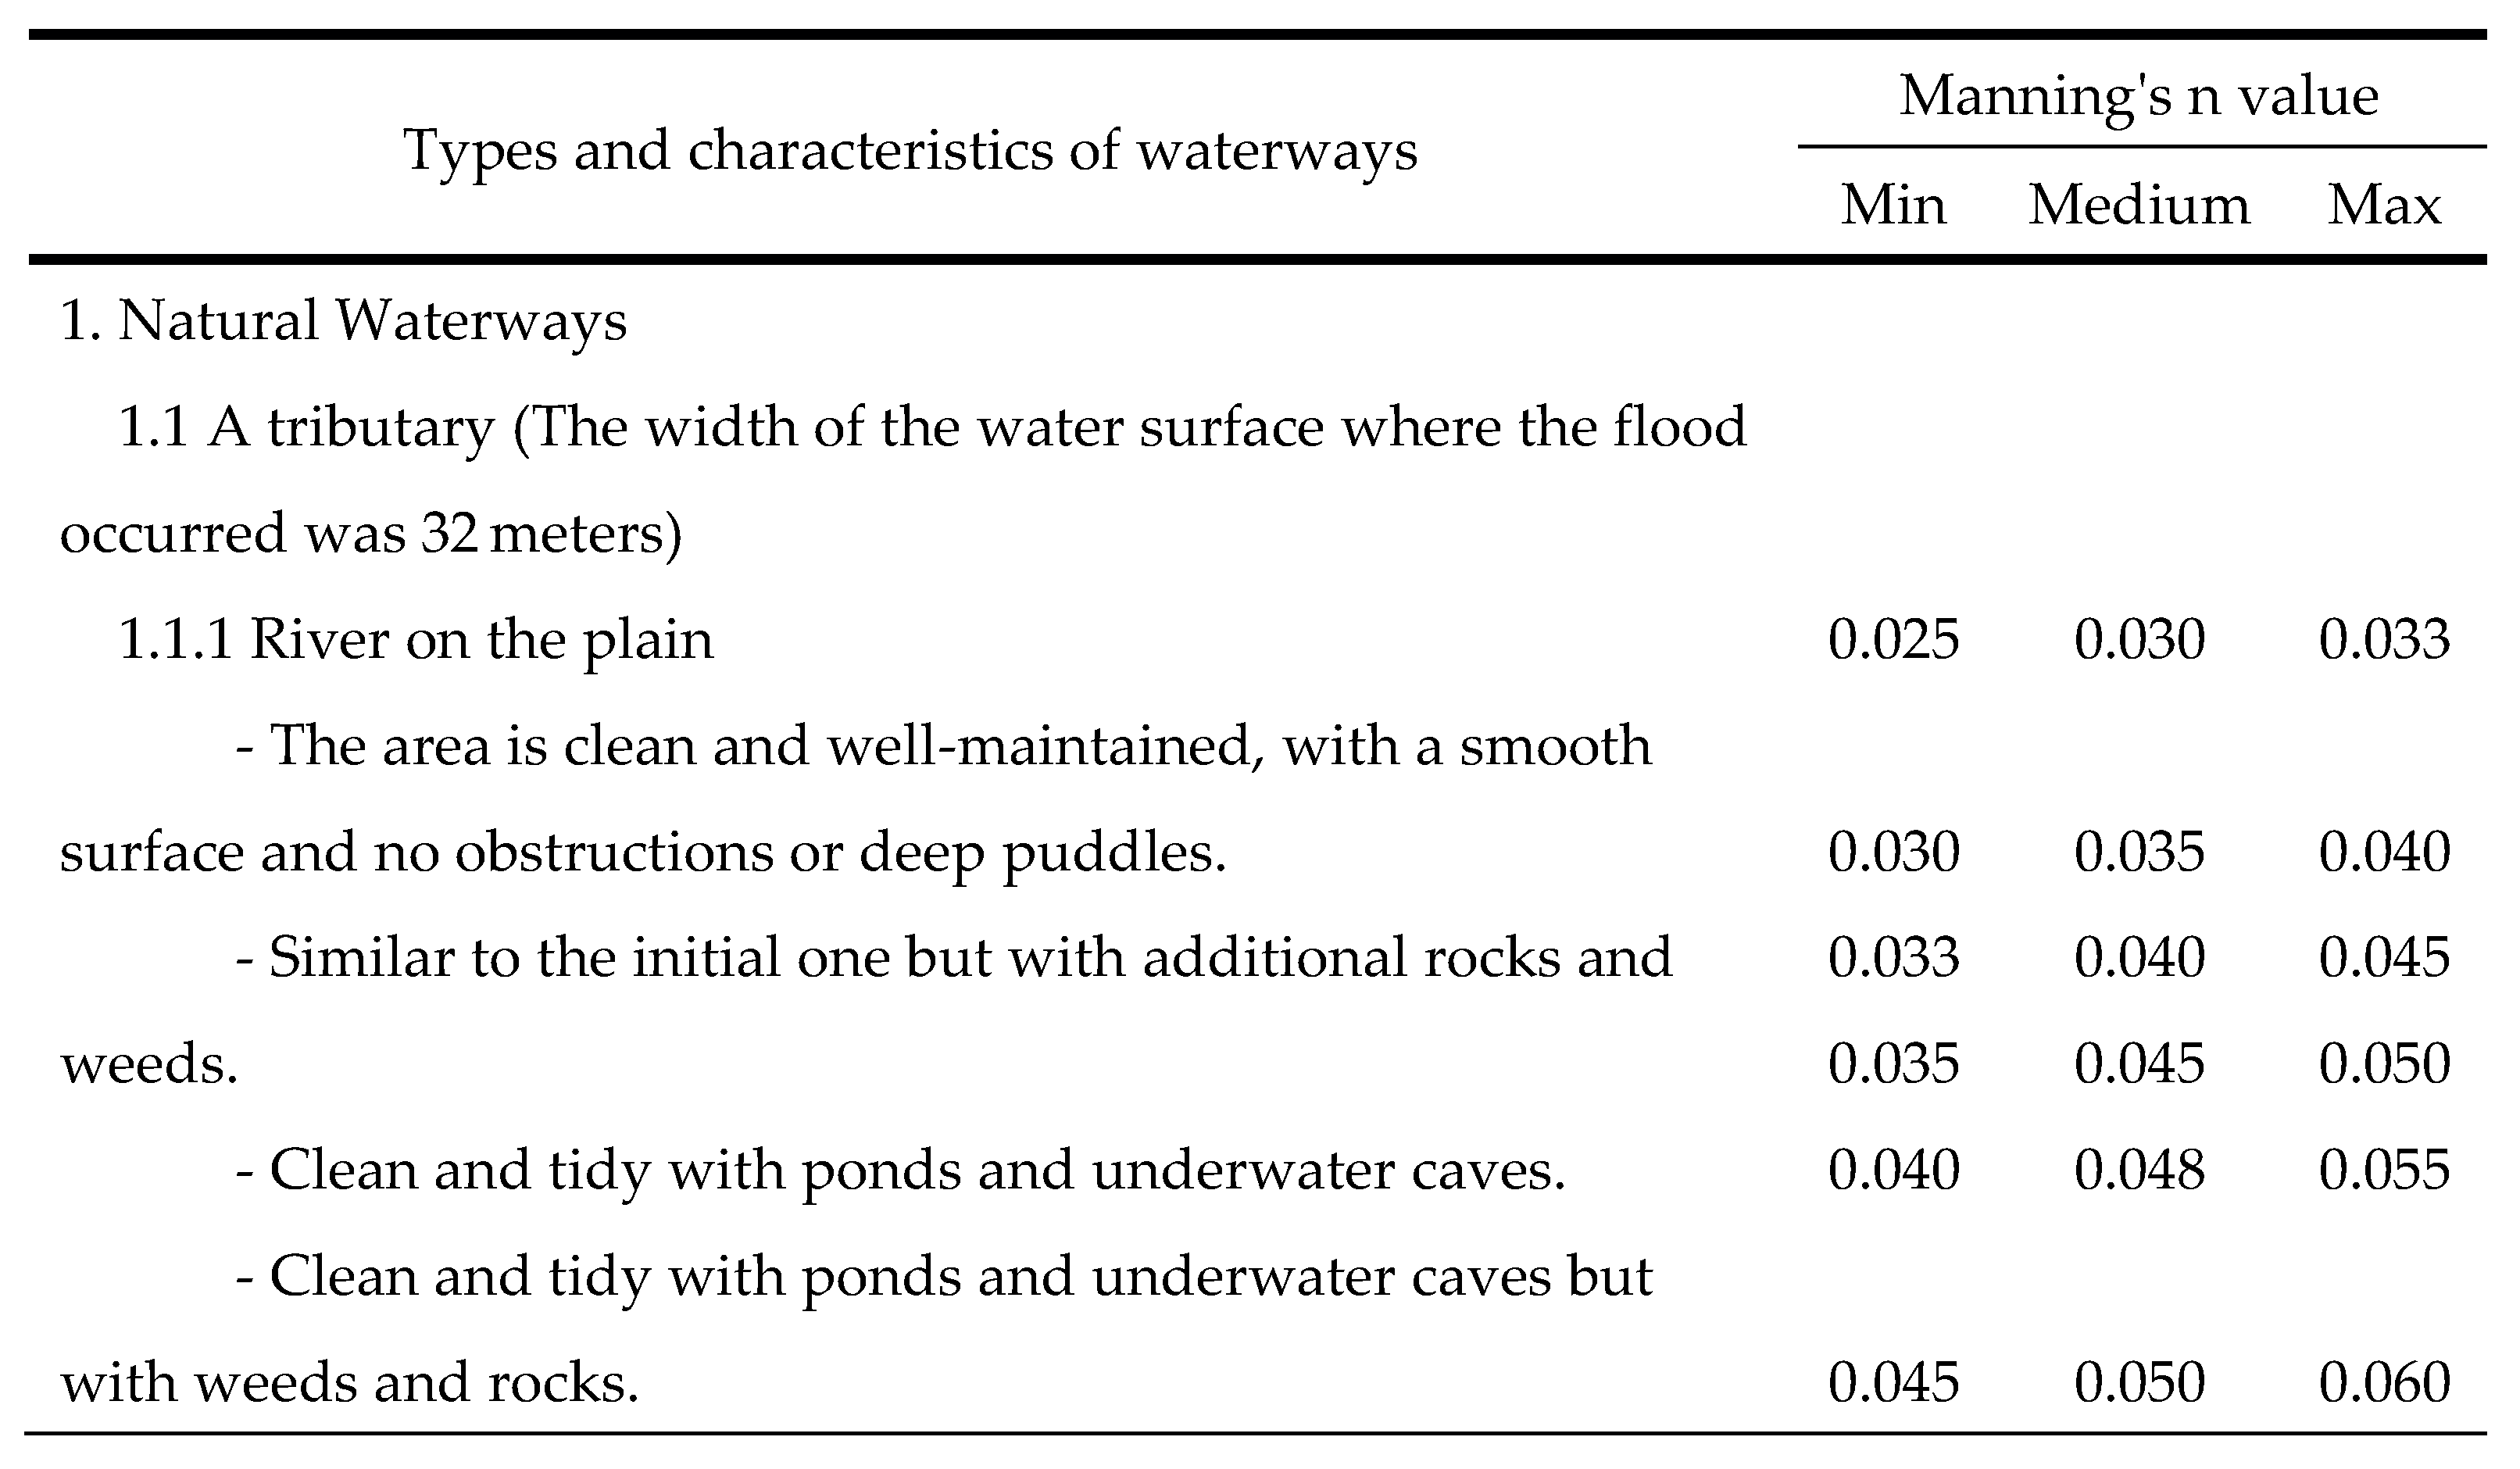
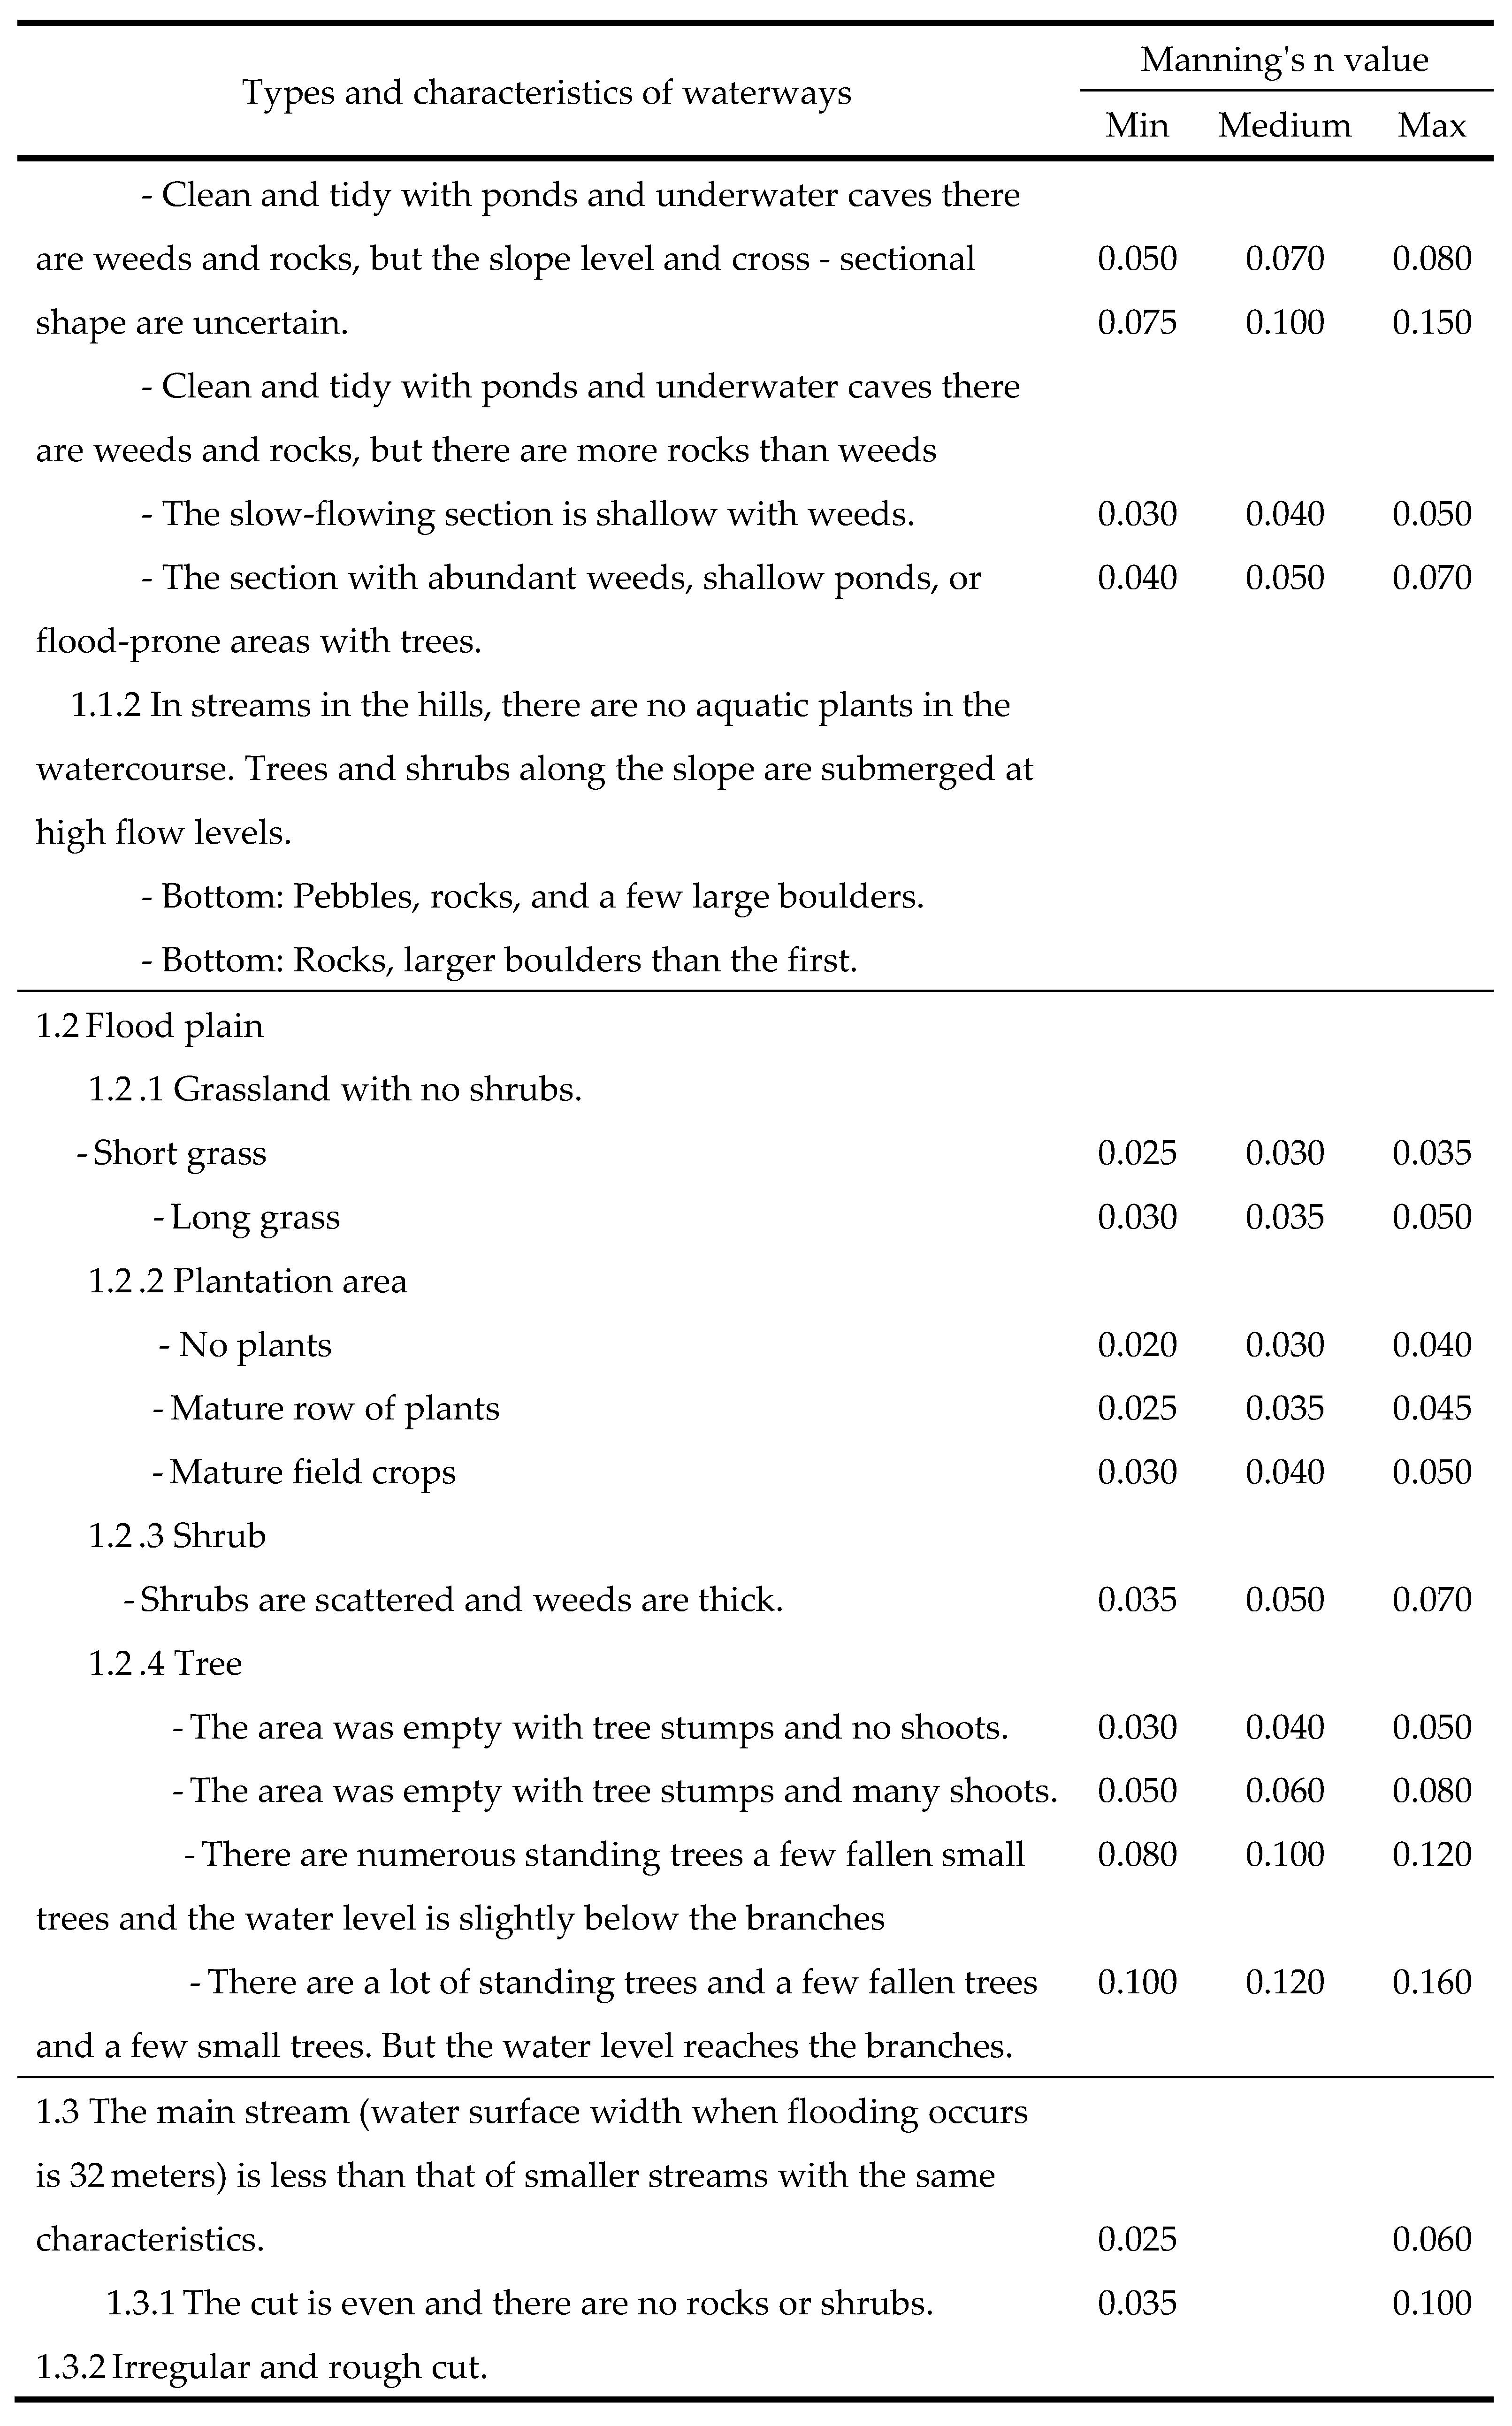
Table 3.
Flood danger level classification criteria with depth and flow velocity.
| Hazard | The product between depths (D) and flow velocity (V) | The highest flood level | The highest flow velocity |
| H1 | D*V ≤ 0.3 | 0.3 | 2.0 |
| H2 | D*V ≤ 0.6 | 0.5 | 2.0 |
| H3 | D*V ≤ 0.6 | 1.2 | 2.0 |
| H4 | D*V ≤ 1.0 | 2.0 | 2.0 |
| H5 | D*V ≤ 4.0 | 4.0 | 2.0 |
| H6 | D*V ≤ 4.0 | - | - |
Table 4.
R2 and NSE statistical values from calibration and validation of the model at each water measuring station.
Table 4.
R2 and NSE statistical values from calibration and validation of the model at each water measuring station.
| Statistical values | Calibrations | Validations | ||||
| E.85 | E.93 | E.83 | E.85 | E.93 | E.83 | |
| R2 | 0.880 | 0.913 | 0.994 | 0.745 | 0.874 | 0.993 |
| NSE | 0.868 | 0.893 | 0.892 | 0.653 | 0.868 | 0.822 |
| P-BIAS | +0.01% | +0.06% | -0.10% | +0.01% | -0.02% | +0.12% |
Table 5.
Size of flooded areas from past land use changes classified by type of land use.
| River basin | Land use type | Size of flood area (km2) | |||||
| 2019 | 2017 | 2015 | 2010 | 2008 | 2006 | ||
| Lam Saphung | Agricultural area | 2.15 | 2.00 | 1.94 | 2.11 | 1.51 | 1.49 |
| Forest area | 0.25 | 0.45 | 0.44 | 0.44 | 0.54 | 0.51 | |
| Urban and built-up land | 0.00 | 0.00 | 0.01 | 0.00 | 0.00 | 0.00 | |
| Water source | 0.43 | 0.44 | 0.44 | 0.44 | 0.07 | 0.08 | |
| Other | 0.35 | 0.28 | 0.34 | 0.17 | 1.00 | 1.02 | |
| Total | 3.18 | 3.17 | 3.17 | 3.16 | 3.13 | 3.10 | |
| Phrom | Agricultural area | 81.87 | 81.28 | 79.27 | 81.29 | 78.26 | 77.41 |
| Forest area | 0.02 | 0.56 | 0.00 | 0.00 | 0.04 | 0.04 | |
| Urban and built-up land | 1.67 | 1.71 | 1.77 | 1.76 | 1.16 | 1.08 | |
| Water source | 15.47 | 15.12 | 15.31 | 15.26 | 12.10 | 12.25 | |
| Other | 2.44 | 2.09 | 2.58 | 0.01 | 5.42 | 5.42 | |
| Total | 101.48 | 100.75 | 98.93 | 98.32 | 96.99 | 96.20 | |
| Chern Part 1. | Agricultural area | 71.78 | 71.73 | 71.53 | 74.37 | 69.87 | 69.02 |
| Forest area | 0.04 | 0.51 | 0.06 | 0.17 | 0.22 | 0.67 | |
| Urban and built-up land | 1.99 | 2.05 | 2.10 | 1.88 | 1.70 | 1.72 | |
| Water source | 11.96 | 10.97 | 11.21 | 10.60 | 8.53 | 9.13 | |
| Other | 3.05 | 3.58 | 3.97 | 0.03 | 5.01 | 3.66 | |
| Total | 88.82 | 88.84 | 88.88 | 87.05 | 85.32 | 84.19 | |
Table 6.
Size of flood areas from past flood events from simulation with HEC-RAS model.
| River basin | Land use type | Size of flood area (km2) | |||||
| 2019 | 2017 | 2015 | 2010 | 2008 | 2006 | ||
| Lam Saphung | Agricultural area | 0.17 | 0.30 | 1.40 | 2.86 | 0.25 | 0.86 |
| Forest area | 0.02 | 0.06 | 0.32 | 0.58 | 0.14 | 0.33 | |
| Urban and built-up land | 0.00 | 0.00 | 0.00 | 0.00 | - | 0.00 | |
| Water source | 0.26 | 0.29 | 0.41 | 0.47 | 0.01 | 0.06 | |
| Other | 0.11 | 0.11 | 0.27 | 0.24 | 0.62 | 0.85 | |
| Total | 0.55 | 0.76 | 2.41 | 4.15 | 1.01 | 2.10 | |
| Phrom | Agricultural area | 15.19 | 71.68 | 66.17 | 71.73 | 56.93 | 73.03 |
| Forest area | - | 0.49 | 0.00 | 0.00 | 0.03 | 0.04 | |
| Urban and built-up land | 0.38 | 1.45 | 1.46 | 1.55 | 0.88 | 1.03 | |
| Water source | 4.77 | 14.37 | 14.13 | 14.28 | 7.70 | 11.85 | |
| Other | 1.07 | 1.92 | 2.26 | 0.01 | 4.59 | 5.19 | |
| Total | 21.41 | 89.91 | 84.02 | 87.56 | 70.13 | 91.15 | |
| Chern River Basin Part 1. | Agricultural area | 7.72 | 54.69 | 38.48 | 91.33 | 67.10 | 78.84 |
| Forest area | 0.00 | 0.39 | 0.02 | 0.24 | 0.21 | 0.74 | |
| Urban and built-up land | 0.33 | 1.48 | 1.01 | 2.46 | 1.60 | 1.97 | |
| Water source | 4.56 | 10.34 | 8.77 | 11.12 | 8.47 | 9.34 | |
| Other | 1.48 | 3.14 | 3.02 | 0.06 | 9.92 | 4.01 | |
| Total | 14.09 | 70.05 | 51.30 | 105.20 | 87.31 | 94.91 | |
Table 7.
Size of flooded areas due to changes in land use in the past, classified by flood hazard level.
Table 7.
Size of flooded areas due to changes in land use in the past, classified by flood hazard level.
| River basin | Flood Hazard | Size of flood area (km2) | |||||
| 2019 | 2017 | 2015 | 2010 | 2008 | 2006 | ||
| Lam Saphung | H1: Safe for vehicles, people and buildings. | 0.42 | 0.42 | 0.42 | 0.41 | 0.41 | 0.40 |
| H2: Not safe for light vehicles. | 0.24 | 0.24 | 0.24 | 0.24 | 0.24 | 0.24 | |
| H3: Unsafe for vehicles, children and elderly people. | 0.71 | 0.71 | 0.71 | 0.71 | 0.71 | 0.70 | |
| H4: Not safe for vehicles and people. | 0.59 | 0.59 | 0.59 | 0.59 | 0.58 | 0.58 | |
| H5: Unsafe for vehicles and people. Less sturdy buildings are at risk of collapse. | 0.71 | 0.71 | 0.71 | 0.71 | 0.70 | 0.69 | |
| H6: Unsafe for vehicles and people. All types of buildings are at risk of collapse. | 0.48 | 0.48 | 0.48 | 0.48 | 0.47 | 0.47 | |
| Total | 3.16 | 3.16 | 3.15 | 3.14 | 3.11 | 3.09 | |
| Phrom | H1: Safe for vehicles, people and buildings. | 30.11 | 29.68 | 30.57 | 30.71 | 31.17 | 31.22 |
| H2: Not safe for light vehicles. | 18.52 | 18.33 | 17.93 | 17.92 | 17.64 | 17.45 | |
| H3: Unsafe for vehicles, children and elderly people. | 33.01 | 32.64 | 31.01 | 30.46 | 29.55 | 29.24 | |
| H4: Not safe for vehicles and people. | 10.40 | 10.51 | 10.07 | 9.98 | 9.54 | 9.35 | |
| H5: Unsafe for vehicles and people. Less sturdy buildings are at risk of collapse. | 7.88 | 8.03 | 7.80 | 7.71 | 7.56 | 7.45 | |
| H6: Unsafe for vehicles and people. All types of buildings are at risk of collapse. | 1.68 | 1.69 | 1.66 | 1.64 | 1.60 | 1.57 | |
| Total | 101.60 | 100.90 | 99.04 | 98.42 | 97.07 | 96.29 | |
| Chern Part 1. | H1: Safe for vehicles, people and buildings. | 27.27 | 27.23 | 27.24 | 27.14 | 26.84 | 26.60 |
| H2: Not safe for light vehicles. | 14.43 | 14.24 | 14.38 | 14.11 | 13.95 | 13.86 | |
| H3: Unsafe for vehicles, children and elderly people. | 28.24 | 28.29 | 28.27 | 27.34 | 26.78 | 26.33 | |
| H4: Not safe for vehicles and people. | 9.83 | 9.55 | 9.77 | 10.19 | 8.83 | 9.49 | |
| H5: Unsafe for vehicles and people. Less sturdy buildings are at risk of collapse. | 6.91 | 7.11 | 6.89 | 5.94 | 6.67 | 5.67 | |
| H6: Unsafe for vehicles and people. All types of buildings are at risk of collapse. | 2.10 | 2.13 | 2.09 | 2.08 | 2.04 | 2.01 | |
| Total | 88.77 | 88.55 | 88.65 | 86.80 | 85.10 | 83.96 | |
Table 8.
Area size of flood hazard level from past flood events using HEC-RAS model.
| River basin | Flood Hazard | Size of flood area (km2) | |||||
| 2019 | 2017 | 2015 | 2010 | 2008 | 2006 | ||
| Lam Saphung | H1: Safe for vehicles, people and buildings. | 0.07 | 0.09 | 0.34 | 0.50 | 0.15 | 0.31 |
| H2: Not safe for light vehicles. | 0.05 | 0.06 | 0.22 | 0.33 | 0.09 | 0.20 | |
| H3: Unsafe for vehicles, children and elderly people. | 0.07 | 0.09 | 0.59 | 0.87 | 0.16 | 0.49 | |
| H4: Not safe for vehicles and people. | 0.11 | 0.09 | 0.37 | 0.79 | 0.15 | 0.30 | |
| H5: Unsafe for vehicles and people. Less sturdy buildings are at risk of collapse. | 0.25 | 0.43 | 0.52 | 1.04 | 0.45 | 0.52 | |
| H6: Unsafe for vehicles and people. All types of buildings are at risk of collapse. | - | 0.02 | 0.36 | 0.64 | 0.02 | 0.29 | |
| Total | 0.54 | 0.77 | 2.40 | 4.15 | 1.01 | 2.10 | |
| Phrom | H1: Safe for vehicles, people and buildings. | 9.82 | 30.09 | 33.22 | 32.02 | 26.45 | 30.33 |
| H2: Not safe for light vehicles. | 2.84 | 19.29 | 15.05 | 15.08 | 12.07 | 19.13 | |
| H3: Unsafe for vehicles, children and elderly people. | 5.00 | 24.05 | 20.69 | 21.77 | 17.63 | 23.74 | |
| H4: Not safe for vehicles and people. | 2.03 | 8.70 | 8.27 | 9.44 | 7.36 | 9.05 | |
| H5: Unsafe for vehicles and people. Less sturdy buildings are at risk of collapse. | 0.75 | 6.62 | 5.67 | 7.79 | 5.61 | 7.54 | |
| H6: Unsafe for vehicles and people. All types of buildings are at risk of collapse. | 0.39 | 1.23 | 1.12 | 1.45 | 0.98 | 1.44 | |
| Total | 20.84 | 89.99 | 84.02 | 87.55 | 70.08 | 91.23 | |
| Chern Part 1. | H1: Safe for vehicles, people and buildings. | 4.23 | 23.47 | 19.53 | 26.82 | 26.32 | 28.17 |
| H2: Not safe for light vehicles. | 2.03 | 11.39 | 8.19 | 16.77 | 13.46 | 15.12 | |
| H3: Unsafe for vehicles, children and elderly people. | 3.50 | 21.84 | 13.39 | 34.59 | 25.86 | 30.27 | |
| H4: Not safe for vehicles and people. | 1.19 | 7.09 | 5.20 | 14.24 | 9.03 | 11.19 | |
| H5: Unsafe for vehicles and people. Less sturdy buildings are at risk of collapse. | 2.77 | 4.37 | 3.51 | 10.02 | 5.43 | 7.68 | |
| H6: Unsafe for vehicles and people. All types of buildings are at risk of collapse. | 0.35 | 1.58 | 1.03 | 2.66 | 1.93 | 2.32 | |
| Total | 14.07 | 69.75 | 50.86 | 105.10 | 82.03 | 94.74 | |
Disclaimer/Publisher’s Note: The statements, opinions and data contained in all publications are solely those of the individual author(s) and contributor(s) and not of MDPI and/or the editor(s). MDPI and/or the editor(s) disclaim responsibility for any injury to people or property resulting from any ideas, methods, instructions or products referred to in the content. |
© 2024 by the authors. Licensee MDPI, Basel, Switzerland. This article is an open access article distributed under the terms and conditions of the Creative Commons Attribution (CC BY) license (http://creativecommons.org/licenses/by/4.0/).
Copyright: This open access article is published under a Creative Commons CC BY 4.0 license, which permit the free download, distribution, and reuse, provided that the author and preprint are cited in any reuse.


