

Submitted:
22 April 2024
Posted:
23 April 2024
You are already at the latest version
Abstract
Wearable sensors have become increasingly popular for assessing athletic performance, but the optimal methods for processing and analysing the data remain unclear. This study investigates the efficacy of discrete and continuous feature extraction methods, separately and in combination, for modelling countermovement jump performance using wearable sensor data. We demonstrate that continuous features, particularly those derived from Functional Principal Component Analysis, outperform discrete features in terms of model performance, robustness to variations in data distribution and volume, and consistency across different datasets. Our findings underscore the importance of methodological choices, such as signal type, alignment methods, and model selection, in developing accurate and generalisable predictive models. We also highlight the potential pitfalls of relying solely on domain knowledge for feature selection and the benefits of data-driven approaches. Furthermore, we discuss the implications of our findings for the broader field of sports biomechanics and provide practical recommendations for researchers and practitioners aiming to leverage wearable sensor data for athletic performance assessment. Our results contribute to the development of more reliable and widely applicable predictive models, facilitating the use of wearable technology for optimising training and enhancing athletic outcomes across various sports disciplines.
Keywords:
countermovement jump
; jump power
; inertial measurement units
; smartphone
; accelerometer
; wearables
; functional principal component analysis
; feature extraction
; signal alignment
; sport
1. Introduction
Wearable sensors have become commonplace in sport, ranging from mass participation events to high-level competitions. Given the practicality and convenience of using them in the field, wearable sensors have numerous potential sporting applications, providing valuable feedback to users and researchers alike [1,2,3]. Data from wearable sensors are becoming increasingly used in machine learning models in attempts to predict output variables of interest, such as performance metrics or potential injury risk factors [4,5]. However, the methods for processing and analysing sensor data vary widely across the literature [4,6,7,8].
Feature extraction is essential when using wearable sensor data as inputs to machine learning models. This process is necessary to reduce data dimensionality while retaining signal characteristics that contain information deemed relevant to the application of interest [5,9]. In early force platform-based studies of vertical jumping, discrete features were extracted from the ground reaction force time-history using domain expertise in attempts to understand the factors influencing jump performance [10,11]. Later studies have progressed to extracting continuous features, typically determined by data-driven discovery techniques such as functional principal component analysis (FPCA) [12,13,14]. This gradual shift towards analyses that consider continuous features is purported to provide model inputs that comprise a more comprehensive description of the underlying signal. However, given the widely varying approaches in the literature, particularly when wearable sensors are used to provide these input signals, it remains unclear whether the complexity and time entailed in the continuous approach provides additional value beyond the use of discrete features, especially when the interpretation of continuous features can sometimes be challenging.
One previous study compared discrete with continuous features extracted from vertical ground reaction force (VGRF) data when estimating jump height [15] and found that continuous features from FPCA tended to yield a better estimation. However, this potentially favoured the functional principal components (FPCs), as they were proportional to the area under the force-time curve and therefore directly related to the jump height, given the conservation of momentum. Wearable sensors also provide a different challenge as they typically yield the kinematics of a single sensor at a specific anatomical location. In addition, such as sensor attachment method, location, and the likely changing orientation of the sensor throughout a movement, may also make extracting relevant information from the signal more challenging. It is therefore essential to compare and contrast the efficacy of discrete and continuous features obtained from wearable sensor signals as inputs to ML models for such applications.
To assess the relative merits of using discrete or continuous features as inputs to ML models, we must also consider the interaction with other methodological decisions [16]. For example, certain model types may better suit different feature extraction methods, whilst data volume and the distributions of the extracted features may also be important factors given the often opportunistic or limited samples obtained in applied sporting studies. Other considerations include the sensor type (e.g. IMU vs. accelerometer), the different locations for placement (e.g. handheld vs. trunk mounted) or other aspects [2,17].
To better understand these factors, a relatively simple, standardised sporting movement that is well understood is required. The countermovement jump (CMJ) offers a suitable choice as it has been studied extensively and is widely used for assessment in sports biomechanics and applied practice [18,19]. Whilst the CMJ provides an exemplar to illustrate the key concepts studied in this paper, the findings have implications for the broader field, including the study of related athletic movements, signal processing techniques and ML models, to name a few.
This study will systematically apply rigorous and robust methods for all stages of the modelling process to offer a deeper understanding of how different feature extraction approaches can influence model performance. It aims to explore how different feature extraction techniques influence wearable sensor-based models of CMJ performance while also considering the effect of other common methodological factors such as sampling, data collection, and model selection. More specifically, we set out to answer the following research questions.
- 1.
- Feature extraction efficacy: How do discrete and continuous feature extraction methods compare when modelling athletic performance metrics, such as the peak power output in the CMJ?
- 2.
- Model robustness: How robust are different model types, based on discrete or continuous features, or combinations of both, to variations in data distribution and sample size?
- 3.
- Generalisability: How consistent are the findings between studies where different sensors, placements and/or data collection protocols are used?
2. Methods
We developed a specific workflow to answer these questions (Figure 1). Data for our analysis was taken from two independent studies investigating the efficacy of using wearable inertial sensors to estimate vertical jump performance [20,21] (Table 1). Both investigations involved healthy sports science students, free of injury, all of whom had given their prior written consent. The studies had been approved by the governing institutions’ ethics committees, including further analysis of the data. Having two datasets was intended to allow for differences in sensor type and placement (research question 3) and make for a more thorough evaluation of the first two research questions. Full details of the data collections are available in the respective papers. We summarise the key information in Table 1 for convenience.
2.1. Data Collections
The first study ("Smartphone" [20]) recruited 32 participants and gathered data from sensors onboard a Xiaomi Redmi 9T smartphone (triaxial accelerometer and gyroscope), hand-held close to the chest at sternum level throughout each trial. The participants performed three or five CMJs for a total of 119 jumps. The second study ("Accelerometer" [21]) recruited 73 participants and employed a Delsys Trigno sensor containing only a triaxial accelerometer attached to the lower back with surgical tape. Most participants performed four valid CMJs, but 14 made eight jumps in total, having attended two rounds of data collection. One jump was rejected as invalid during processing, leaving 347 jumps in total. In both datasets, the time series encompassed the entire takeoff, flight and landing phases.
As the Accelerometer dataset lacked the gyroscope data possessed by the Smartphone dataset, we used the resultant acceleration from both datasets, also making the analysis more robust to different sensor attachments [9]. This approach also made the input signals directly comparable. Hence, differences between the Smartphone and Accelerometer datasets were limited to the sensor make and placement.
We chose the mass-normalised peak external power output as our jump performance measure, given its common usage in elite sports alongside jump height, to monitor athlete training status and progression [19,22,23,24]. The external mechanical power is the product of the instantaneous force and the centre of mass velocity. The ground truth for this metric was computed from the vertical ground reaction force recorded by a force plate in accordance with the recognised gold standard method [25].
2.2. Discrete Feature Extraction
Twenty-three discrete features devised by Mascia et al. [20] were used in the current study, as detailed in Appendix A.1. These included maxima, minima, gradients, and phase durations and tend to be informed by domain-specific knowledge. A complete list of features with their definitions is given in Appendix A.1. We did not include the three features based on variational mode decomposition (VMD) [26] used by Mascia et al. because they were continuous features. However, we did include the VMD features in a combined feature set in the final part of the investigation, as described below in Section 2.4.
The discrete features were extracted from the resultant acceleration time series and from two series derived from it, as described below. The resultant acceleration time series from the sensor were low-pass filtered using a 50 Hz 6th-order Butterworth filter, and after the gravitational acceleration was subtracted1.
The apparent velocity was calculated from the net acceleration using the cumulative trapezoidal rule, which served as the second input time series. This calculation ignored that the direction of the acceleration vector was unknown because it was based on the resultant. Nevertheless, this pseudo-velocity served its purpose by providing the equivalent metric for the relevant discrete features, originally devised for vertical accelerations [20]. Using the resultant acceleration and the pseudo-resultant velocity, a pseudo-power time series was obtained by taking the instantaneous acceleration and pseudo velocity at each point in the time series.
2.3. Continuous Feature Extraction
The continuous features were extracted using functional principal component analysis (FPCA), which is based entirely on the variance in the data [27]. Hence, these data-driven features were discovered automatically without applying any domain-specific knowledge. As described below, the procedure involved padding the time series to a standard length, aligning the signals, converting them into smooth functions, and then running FPCA to yield continuous features. The shape of each functional principal component (FPC) effectively defined the continuous feature, corresponding to a particular mode of variation in the resultant acceleration waveform. Their associated FPC scores were the inputs to the models.
Firstly, the time series were padded out to give them all the same length as the longest series in the sample. Points were appended to the end of the series, equal to the last value before padding. No signal filtering was performed because the functional smoothing performs the same purpose of penalising high-frequency oscillations.
The padded time series required alignment so that FPCA would capture amplitude variance between the signals. Based on our previous research, we opted to align the signals by making a linear offset to the time series rather than using curve registration, which has the disadvantage of distorting the waveforms to enforce maximal alignment [28,29]. We developed five alignment algorithms to align the signals based on cross-correlation and landmark identification, two common approaches when applying a linear offset to the signals. Having several candidate methods allowed us to determine the best approach specific to our respective wearable sensor datasets. The cross-correlation methods aligned the signals to a reference signal, which was either the mean signal (XCMeanConv) or a randomly chosen signal from the sample (XCRandom). The landmark methods identified either a peak immediately before takeoff (LMTakeoffPeak), the takeoff instant identified by the discrete feature extraction algorithm (LMTakeoffBiomechanical), or the peak associated with landing (LMLandingPeak). For the Accelerometer dataset, we also had the actual takeoff time for reference (LMTakeoffActual), as determined from the force plate VGRF data. Further details on our signal alignment methods can be found in Appendix A.2, along with their evaluation in Appendix A.4.
After the time series were padded and aligned, they were converted into continuous, smoothly varying functions with a b-spline basis of 4th order, regularised with a 1st-order roughness penalty. For further details of this automated procedure, refer to Appendix A.3.
Finally, FPCA was performed on the functional representations of the padded and aligned time series to obtain the FPCs that defined each continuous feature’s characteristic shape. The associated FPC scores were calculated for each signal by computing the inner product of its functional curve with each respective FPC.
2.4. Feature Selection
We evaluated models based on three feature sets from each dataset: discrete features, continuous features, and a hybrid set that combined both feature types. Our investigation first considered the qualities and efficacy of the discrete and continuous features in isolation before introducing the combined feature set. The combined feature set also included the VMD features from the Mascia et al. study that had been excluded from our prior comparison set owing to their continuous nature. A correlation matrix revealed the relationship within and between discrete and continuous features. We also calculated the Variance Inflation Factor (VIF) to detect multicollinearity in the models, which is usually defined as when [30]
As part of research question 1, we restricted the number of features, forcing the model to choose the most valuable features to predict jump peak power. The feature selection method chosen was based on Lasso regression using least squares. Lasso is a regularised linear model in which high beta coefficients are penalised. Depending on the regularisation parameter, the L1 regularisation forces some of those beta coefficients to zero, thereby effectively removing the associated predictors from the model. The feature selection algorithm fitted 100 models across a wide range of values for the regularisation parameter, , to find which value yielded the desired number of predictors with non-zero coefficients. If values resulted in models with too many predictors or too few but not the number required to meet the specified sample size, the range was narrowed and the procedure repeated. The selected features were then input directly to all model types, which in the case of Lasso meant re-fitting the model with the pre-determined .
When applied to the combined feature set, feature selection offered a direct comparison between feature types. The extent to which discrete and continuous were favoured revealed the relative efficacy of each feature type based on the probability of selection and the mean absolute beta coefficients for selected features. We initially restricted the number of features to five and then eased the restriction to 10 and then 15 to see which other features were progressively included.
2.5. Dataset Truncation
To answer research question 2, we downsized the datasets progressively to evaluate the models’ sensitivity to sample size. Participants were added at random, one by one to the smaller dataset, including all their jumps, until the number of jumps reached the required number for the sample, as specified by the investigation. When adding the last participant to be included, their block of jumps could make the sample larger than it should be. In this case, jumps were removed at random from any participant already included until the dataset was shrunk to the required volume.
2.6. Models
Having extracted discrete and continuous features characterising the jumps, we used them as separate or combined groups of predictors in a range of regression models to predict peak external power. We chose the following regression models as being representative of the different types of models that may be employed to address similar research questions:
- a linear model allowing for extensive inference of the model fit, including explained variance, shrinkage and other statistics that can support our investigation;
- Lasso linear regression using L1 regularisation to handle potentially large numbers of predictors and curb overfitting [31];
- a support vector machine (SVM), a non-parametric model to serve as an alternative to the linear parametric models above [32]; and
The models were trained to predict peak power based on the three aforementioned feature sets standardised to z-scores prior to fitting. The mean and standard deviations for the training features were also retained as model parameters and used to standardise the validation features to the same scale. The outcome variable, peak power, was also standardised in this way, so the linear model produced standardised beta coefficients. This standardisation was applied to all models, allowing for a fair comparison between datasets by removing differences in performance levels between the cohorts as a confounding factor.
The models were subject to Bayesian optimisation through MATLAB’s automated hyperparameter optimisation procedure, except for the linear model, which has no tunable hyperparameters. Two-fold cross-validation (CV) was chosen to maximise validation set size and improve the likelihood of selecting the true best model [35]. As many thousands of model fittings would be performed, the optimisation procedure was limited to 20 iterations to keep the computational cost manageable.
2.7. Evaluation
We employed a two-fold CV to evaluate the models, repeated 25 times to make 50 model fits and provide a representative assessment. The one exception was for the sample size investigation, which involved 10 dataset truncations and 10 two-fold CV repeats, making model fits, double the previous number of fits to address the higher variance observed between fits for small sample sizes.
The datasets were partitioned at the participant level, so a person’s jumps only appeared in the training or validation datasets. Each model was evaluated on the training and validation sets using several metrics. The principal measure of model performance was the root mean squared error (RMSE) in predicted standardised peak power. Other metrics relating to evaluation can be found in Appendix A.2.
Model performance was explored over a range of configuration settings using grid searches. The configuration setup encompassed parameters controlling every aspect of their operation, including the feature extraction methods, feature selection, dataset truncation and the modelling procedure. All procedures described above were implemented in MATLAB R2023b, https://github.com/markgewhite/jumpsensormodels.
2.8. Full Modelling Procedure
The guiding principle behind applying CV in our study was to obtain an unbiased estimate of the model’s performance on unseen data. By performing the entire modelling procedure, including data preprocessing (filtering for discrete features, alignment for continuous features), feature extraction 2, feature selection, model fitting, and optimisation, within each training fold, we ensured that the CV error reflects the error we can typically expect when applying these same methods to new, independent datasets. The cross-validated RMSE provides a realistic assessment of how well the models would generalise to unseen data. Its calculation depends on considering the potential variations in key determinants dependent on the data distribution. Such determinants include reference points or signals used in the alignment methods, the roughness penalty for functional smoothing, the FPC definitions themselves, and the optimised hyperparameters of the fitted models. This robust approach goes beyond simply enabling the cross-validation option for a model function. It ensured no "information leakage" between training and validation sets [36,37]. However, it comes at a greater cost because the same procedures are repeated multiple times with slightly different results each time. Nonetheless, this is essential for our purpose if we are to build models that are generalisable to future applications and answer our research questions.
3. Results
3.1. Continuous Feature Extraction: Alignment Evaluation
The evaluation of the alignment methods for FPCA concluded that XCMeanConv was best for both datasets (Appendix A.4). This convergent cross-correlation method yielded the lowest alignment RMSE, the highest Pearson correlation and the highest signal-to-noise ratio (SNR) for their respective datasets. It was noted that the choice of alignment method could have a material effect on the shape of the FPCs.
We then extended our alignment evaluation to consider the consequential impact on the models’ performance. For the Smartphone dataset, the lowest model validation error was achieved with LMTakeoffBiomechanical for all models except XGBoost. This finding contrasts with the results based solely on alignment metrics, although in the latter case, the difference was marginal (Figure 2). Moreover, LMTakeoffBiomechanical had the worst alignment metrics for the Smartphone dataset (Figure A2). Notably, XCMeanConv achieved the lowest training error across all models, indicating that the poor validation error associated with this method was likely due to overfitting.
The Accelerometer dataset was similar in that the best alignment method, XCMeanConv, did not yield the lowest model validation error. Instead, LMTakeoffPeak from our candidate methods achieved the lowest validation error. However, LMTakeoffActual, the true takeoff time only included as a reference, outperformed all model types in this regard. XCMeanConv did achieve the lowest training error, indicating that the best alignment method induces overfitting in the models. In general terms, however, the models based on Smartphone data had a greater tendency to overfit, given the wider differences between validation and training error. XGBoost had the lowest training errors, yet the validation error was similar to the other models. The SVM models revealed the least overfitting. To conclude, the alignment method that was the best model validation performance did not produce the most closely aligned curves.
For the following analysis, we chose LMTakeoffPeak alignment for both datasets based on its consequent low model validation errors. It produced the lowest validation RMSE across all Accelerometer models and only a slightly higher validation RMSE than LMTakeoffBiomechanical for the Smartphone models, especially given the large RMSE variance between model fits. Having the same alignment method for both datasets was also considered advantageous as it made them more comparable.
3.2. Feature characteristics
There was no correlation between the continuous features, which are orthogonal by definition, but there was a high degree of correlation between the discrete features (Figure 3). Moreover, from the extended correlation matrices that include both sets of features, it is evident that there were only weak correlations between the discrete and continuous features, indicating that they are largely distinct from one another. The strongest correlations with the discrete features were found with FPC1-3.
The continuous features were generally normally distributed, but many of the discrete features were not (Appendix A.5). Several discrete features exhibited long tails and moderate skew.
3.3. Linear Model Inference
We examined several statistics from linear models fitted to each dataset to gain further insight into the qualities of the discrete and continuous features (Table 2). These statistics helped us compare the performance and characteristics of the models when using either discrete or continuous features. The linear models fitted with continuous features showed better performance for both datasets, as evidenced by lower training errors, higher F-statistics, and greater variance explained. Additionally, the continuous feature models exhibited lower shrinkage, indicating less overfitting. The discrete feature models had a lower proportion of outliers compared to the continuous feature models. However, the outlier proportions for both the Smartphone and Accelerometer datasets (0.042 and 0.014, respectively) were below 0.05, suggesting a narrow, peaked distribution that deviated from normality. This deviation from normality could potentially affect the validity of the linear model’s assumptions and its sensitivity to outliers, although the impact may be limited given the relatively small deviation and the sample size.
It is also important to note that discrete features had an extremely high level of multicollinearity. Three predictors had , and for a further seven, VIF was infinite. In other words, those features could be explained perfectly by a suitable linear combination of other variables. This multicollinearity brought considerable uncertainty to the contribution of individual features, as detailed in Appendix A.6).
3.4. Model Performance
The performance of the model types was assessed as a function of the number of predictors using discrete, continuous or combined feature sets with the latter including VMD features (Figure 4a). The training error was lower for models using continuous features than discrete features. The combined feature set sustained the downward trend in training error as more features were added to the models. In the case of the SVM, Lasso and XGBoost models using either discrete or continuous features from the Smartphone dataset, the training error initially fell and then rose as the number of features increased. In the case of the Accelerometer dataset, the training error tended to fall asymptotically as the number of features increased. In all cases, the XGBoost model consistently yielded the lowest training error. The uncertainty (interquartile range indicated by error bars) for the Accelerometer training errors was smaller than that of the Smartphone dataset. In some cases, the error bars were so large that there was considerable uncertainty in the trend lines obtained using a Gaussian process best fit.
The validation errors were higher than the training errors, more so for the Smartphone models than the Accelerometer models (Figure 4b). The linear, Lasso and SVM models all tended towards higher validation errors for the Smartphone dataset as the number of features increased, but this trend was uncertain. Only the XGBoost model seemed unaffected by this apparent overfitting, given a flat trend. It was only with the Accelerometer data that there was a clear reduction in validation error as the number of features increased, most clearly when using continuous features or the combined features set when using the linear, Lasso and SVM models, which all produced similar error levels. For the Accelerometer dataset, the XGBoost validation errors were lower when using discrete data, but it did not respond as the other models did when using continuous data.
3.5. Sample Size Truncation
The model robustness and sensitivity to data volume (research question 2) were reflected in changes in model performance when the datasets were capped at an increasing number of observations (Figure 5a). The training error generally rose and then plateaued as the available data was enlarged for both datasets and all three feature options. One specific exception was where it fell slightly when the Lasso and SVM models used discrete Accelerometer features, whilst XGBoost models continued to improve their training errors as the sample size increased. The training error initially declined for the Lasso and SVM models when continuous features from the Accelerometer dataset were used. As mentioned above, the large variation in error between model fits made trends harder to discern.
As with training, the validation error was lower for XGBoost except with continuous Accelerometer features, although the gap to other models narrowed at higher data volumes (Figure 5b). Again, Lasso, SVM and linear models produced the best validation estimates for the Accelerometer datasets. Linear models trained on discrete features produced large validation errors, which could vary substantially between model fits, especially with small samples.
3.6. Feature Selection Preference
Restricting predictor numbers from the combined feature set revealed the relative efficacy of discrete and continuous features (research question 1), as highlighted by the feature selection process (Figure 6). The plots showing the probability of selection revealed a strong preference for the continuous features across both datasets (research question 3). The models often favoured FPC1, and as the restriction on the number of predictors was gradually lifted, many of the FPCs were present in around half of the models. The VMD features, which were included at this stage of the analysis, were rarely chosen. The discrete features were more prominent when few predictors were required. u and (mean concentric power and acceleration at the end of the braking phase, respectively) were often present. The mean absolute value of the beta coefficients when these discrete features were present demonstrated that the FPCs were the dominant factors in the model. The discrete features’ influence on the outcome variable was relatively minor.
4. Discussion
This study investigated the efficacy of discrete and continuous feature extraction methods, separately and in combination, for modelling athletic performance using wearable sensor data. By comparing these approaches across two datasets with different sensor types and placements, as well as with a variety of different models, we aimed to provide insights into the robustness and generalisability of these methods. Our findings demonstrate the superiority of continuous features, particularly those derived from FPCA, in terms of model performance, robustness to variations in data distribution and volume, and consistency across different datasets. Specifically, we found that (1) continuous features, especially FPCs, consistently outperformed discrete features in modelling CMJ peak power output; (2) models based on continuous features were more robust to variations in data distribution and volume compared to discrete feature models; and (3) the consistency of our results across datasets differing in sensor type and placement supports the generalisability of our findings.
4.1. Research Question 1: Feature Extraction Efficacy
Our investigation revealed that continuous features, specifically FPCs, outperformed discrete features in modelling peak power output during countermovement jumps (Figure 5b). These findings are based on a rigorous and comprehensive modelling approach encompassing the entire process from data preprocessing to model evaluation. By applying this full modelling procedure within each cross-validation fold, our results provide a robust and realistic assessment of model performance on unseen data, avoiding potential biases arising from information leakage. The independence of FPCs, as demonstrated by the correlation matrix analysis, contributed to their robustness and ability to capture valuable temporal information. In contrast, discrete features exhibited high multicollinearity, leading to less reliable models and overfitting. These findings support the approach taken in previous research that used continuous features to distinguish between groups based on characteristic patterns in the data [12,13,38]. The evidence from the correlation matrix (Figure 3) suggests that the notion that FPCs may sometimes be largely equivalent to discrete features of peaks and troughs is incorrect. FPCs take the whole waveform into account, and the influence of curves away from the peak in question serves to regularise the components, providing an advantage for the models based on these features.
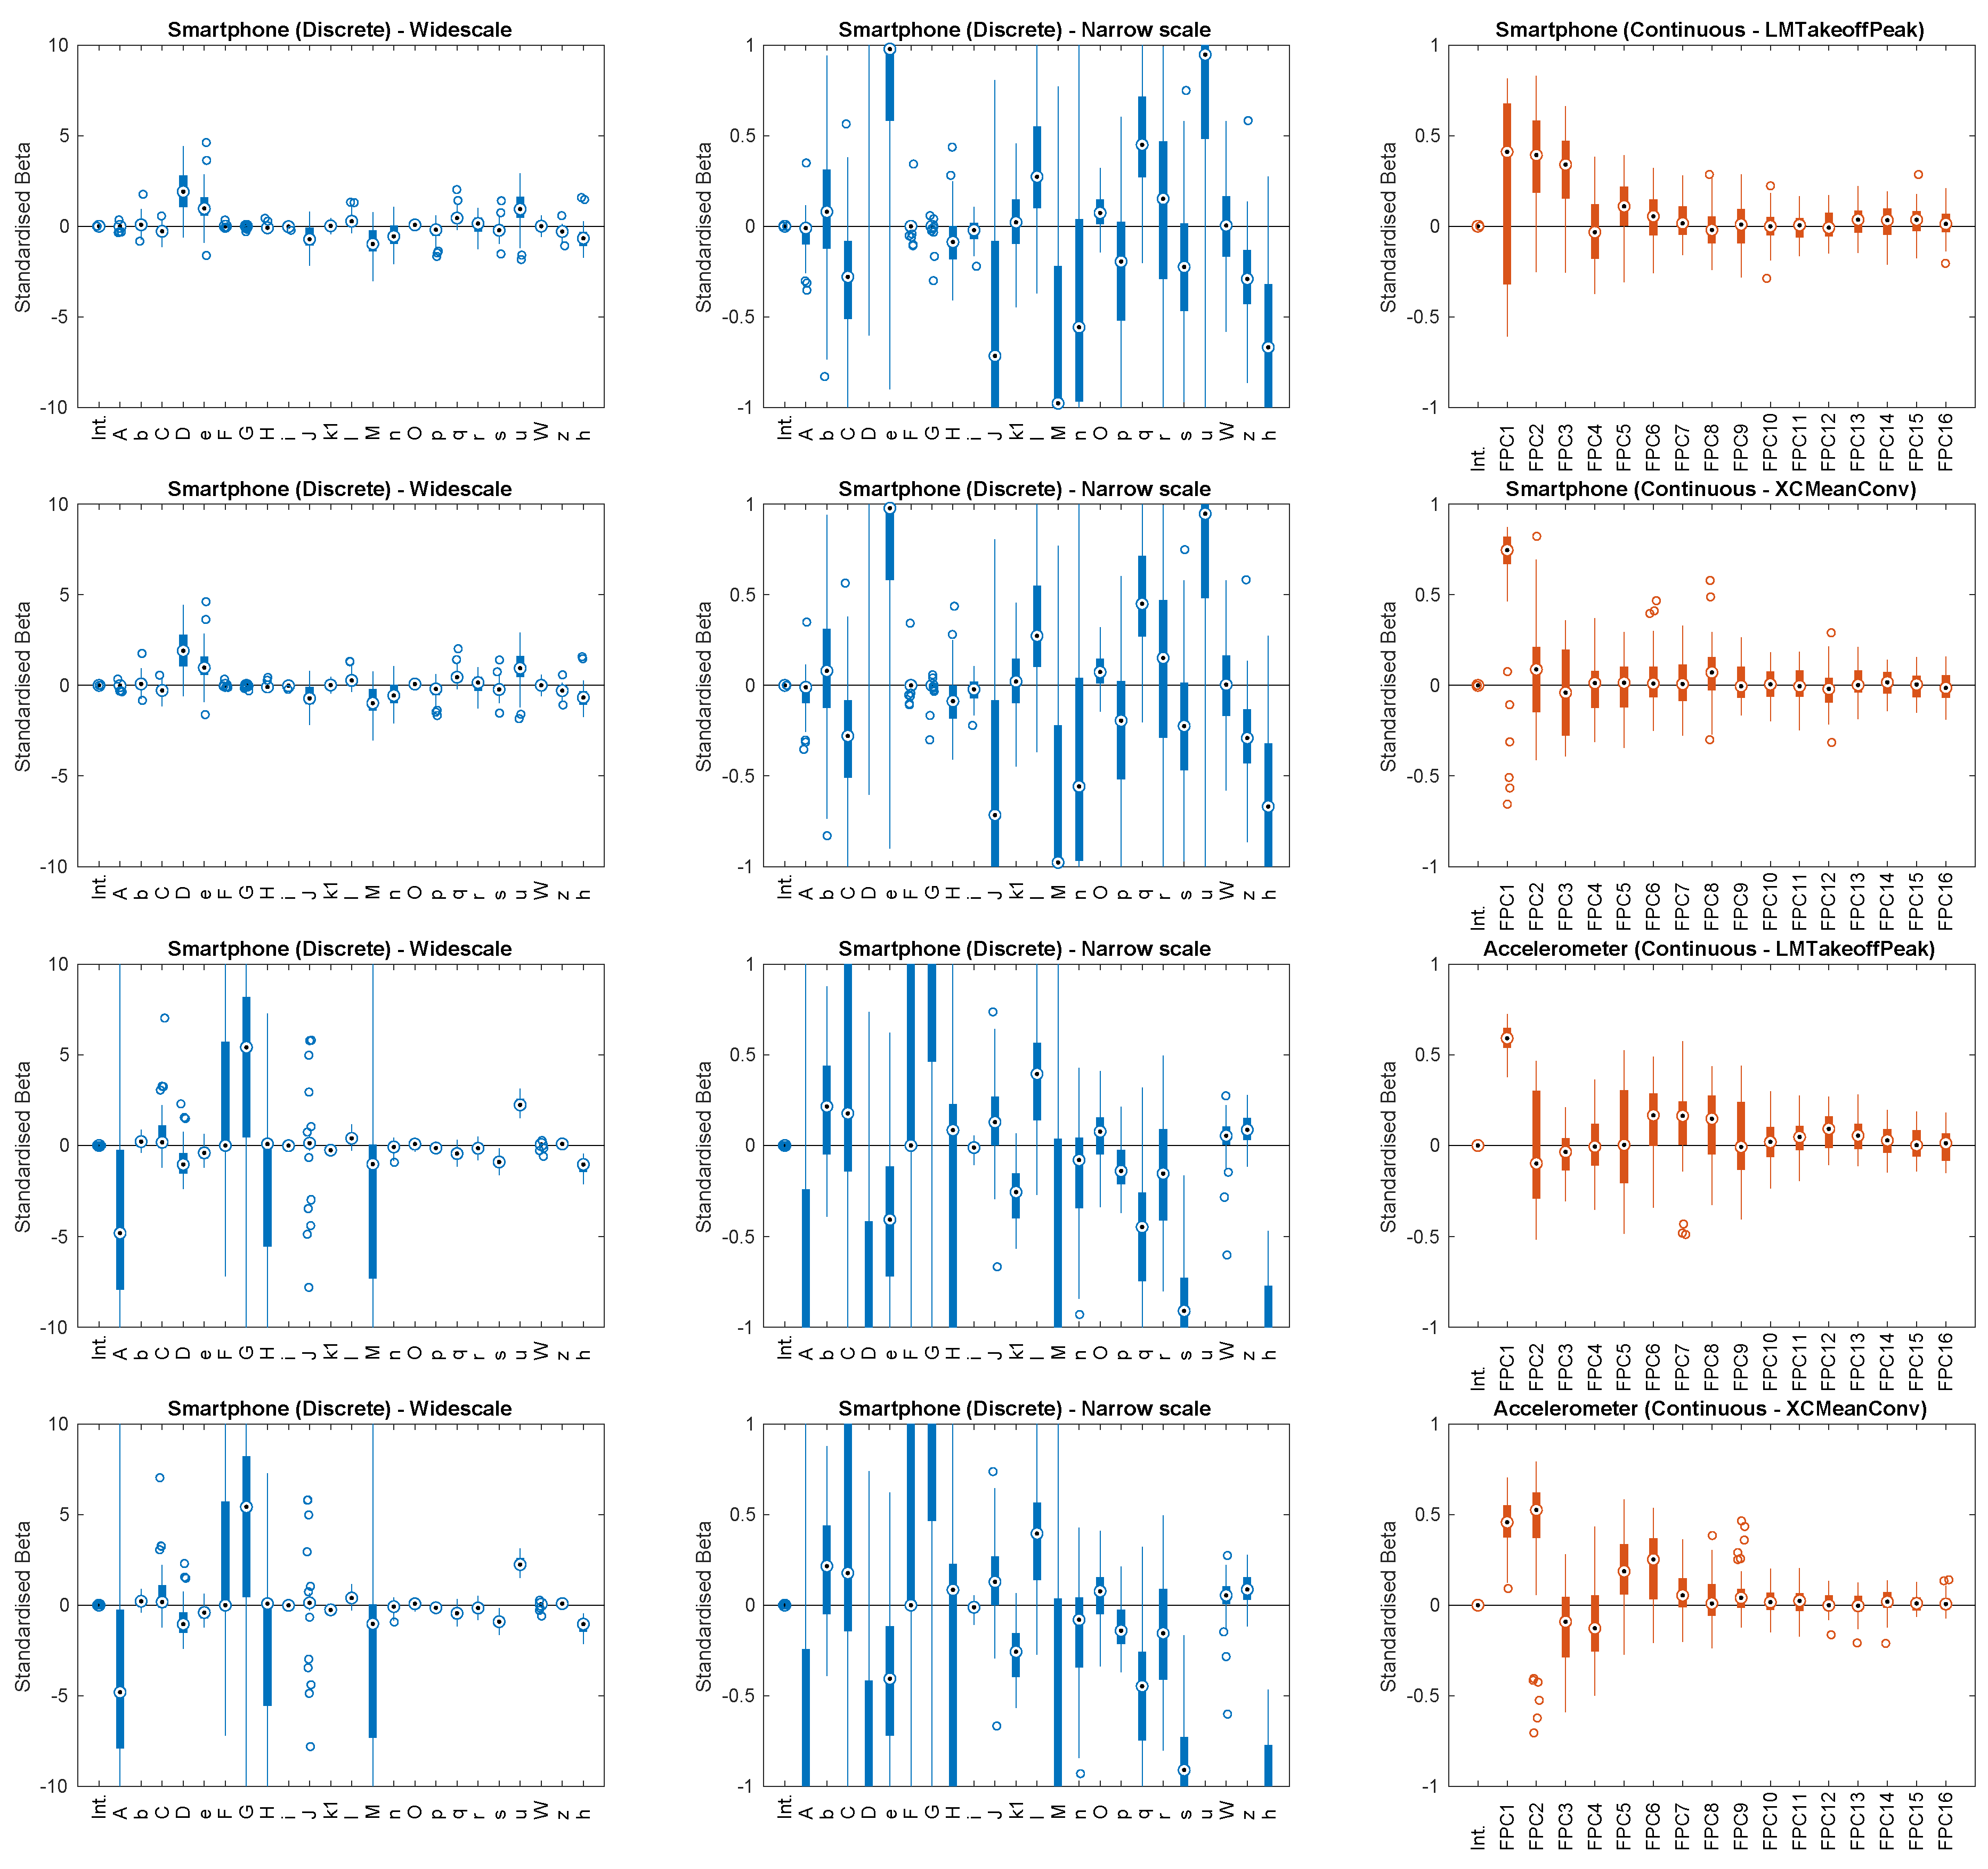
The discrete features’ beta coefficients varied greatly between the training subsamples (Figure A5), particularly in the Smartphone models, indicating considerable uncertainty in their true values. This uncertainty made it difficult to conclude which discrete features contribute strongly to performance outcomes. It therefore limits the practical value of discrete features, contrary to their apparent intuitive interpretability, which has often been seen in the biomechanics field as their chief advantage over other types of features. In contrast, the beta coefficients for the continuous features exhibited lower variance and more consistent values across subsamples, suggesting that FPCs provide a more reliable basis for modelling athletic performance. However, it is important to note that wearable sensor signals are inherently noisy and more challenging to interpret than traditional measures such as ground reaction forces. As a result, the choice of sensors and feature extraction methods should prioritise practical considerations and model performance over interpretability alone.
4.2. Research Question 2: Model Robustness
Our results showed that continuous feature models, particularly those using FPCs, were more robust to variations in data distribution and volume compared to discrete feature models (Figure 5). As the number of features increased, continuous feature models were able to make effective use of the additional predictors, improving their validation performance. In contrast, the discrete feature models suffered from increasing levels of overfitting and worsening validation errors (Figure 4). These results highlight the need for feature selection to limit the number of discrete features in the model. However, Lasso regularisation can alleviate, to some extent, the issue of multicollinearity.
An unexpected observation from our sample size truncation analysis was the initial increase in training error for most models as the dataset size increased, followed by a plateauing trend (Figure 5). This phenomenon suggests that smaller datasets may not capture the true complexity of the underlying relationships, leading to an underestimation of the training error. Interestingly, XGBoost was less susceptible to this effect, as its training error consistently decreased with increasing sample size. This robustness could be attributed to XGBoost’s ability to effectively capture complex non-linear relationships and its inherent regularisation techniques, which help prevent overfitting [33,34].
The choice of the best-performing model may depend on the specific circumstances and dataset characteristics, confirming the well-known importance of evaluating a range of models for each application. Linear models, despite their simplicity, can provide valuable insights into the relationships between features and performance outcomes, as demonstrated by the analysis of beta coefficients in our study (Figure A5). Lasso is also a linear regression model whose beta coefficients can also be interpreted in a similar way, but it has the added advantage of handling multicollinearity, making it a reasonable choice when working with discrete features. However, it was XGBoost that tended to yield lower validation errors than the other models when using discrete features in smaller samples or when more features were included, demonstrating its robustness for limited datasets or where domain expertise suggests there are potentially a large number of features that may be relevant. When using continuous features exclusively, XGBoost was outperformed by Lasso and SVM, and even the linear model provided that sufficient FPCs and observations were available. In summary, these findings underscore the need for careful consideration of model robustness and sample size when selecting feature extraction methods and developing athletic performance models.
4.3. Research Question 3: Generalisability
The consistency of our results across the Accelerometer and Smartphone datasets demonstrates that our findings – the superior performance of models using continuous features and their greater robustness to variations in data distribution and volume – are generalisable across different data collection protocols. However, the differences in corresponding FPC waveforms between datasets and the under-performance of Smartphone models compared to Accelerometer models suggest that sensor characteristics, location and attachments can impact model performance. These findings underscore the importance of protocol decisions when developing athletic performance models [2].
When comparing the datasets, it should be borne in mind that the Accelerometer dataset was almost 2.5 times larger. This sample size difference may have contributed to the better performance of the Accelerometer models, mainly when using continuous features. Notwithstanding this difference, our main findings were generally consistent across the datasets, reinforcing the superiority of continuous features and the challenges associated with discrete features, thus bolstering the generality of our conclusions.
4.4. Acceleration Signal Type
In this study, we focused on using the resultant acceleration for direct comparability between the Smartphone and Accelerometer datasets, even though the Smartphone data included gyroscope measurements that could have been used to compute the vertical acceleration component. While the vertical component is more pertinent when estimating jump performance, given that the peak power (ground truth) was calculated using the vertical ground reaction force, our preliminary research revealed that models based on the resultant acceleration yielded lower validation errors than those using the vertical acceleration. This unexpected finding suggests that the machine learning approach, which relies on patterns in the data, can effectively handle the resultant acceleration by implicitly adjusting the model parameters to account for the motion in other principal axes. Furthermore, using the resultant acceleration may have a regularising effect, reducing the risk of overfitting compared to using the vertical component alone. These results challenge conventional thinking in biomechanics and highlight the need for future research to investigate alternative signal representations and their impact on model performance, given the additional information from other signals that may enhance predictive accuracy. The optimal choice of input signal may not always align with traditional assumptions.
4.5. Alignment Methods
This study employed relatively simple alignment methods, such as cross-correlation and landmark-based methods, compared to more sophisticated approaches like curve registration (dynamic time warping) or linear time transformations. Interestingly, we found that the model validation performance was better when using signals that were not optimally aligned (e.g., LMTakeoffPeak) according to our metrics. This key finding emphasises the trade-off between alignment and preserving valuable phase information captured by FPCs, as was evident in the phase-shift properties observed in some FPCs (Figure A3). The temporal position of peaks in component plots shifted as the FPC score varied, an effect more apparent in FPC1 and FPC3 with LMTakeoffPeak alignment.
Our findings, along with previous research [28,29,39], suggest that enforcing a higher degree of alignment through curve registration or linear time transformations may be detrimental to the performance of models similar to those in our study. These sophisticated alignment methods often result in distorted waveforms, hindering the model’s ability to capture relevant phase information, even when phase information from the time domain transform is included in the model [28]. In a previous study using the same Accelerometer dataset, we found that landmark registration was detrimental to the peak power model compared to the non-registered condition and that models depended on the variance in flight time [29].
The choice of alignment method can also materially affect the shape and interpretation of the FPCs, determining which aspects of the jump are emphasised in the components. For example, in the Accelerometer dataset, FPC1 captured the variation in acceleration during the braking phase when using XCMeanConv alignment but captured the variation in flight duration primarily when using LMTakeoffPeak alignment. These differences in FPC characteristics underscore the importance of carefully selecting an alignment method that preserves the relevant phase information and enhances the interpretability of the components, ultimately contributing to a clearer understanding of the aspects of the jump that influence performance.
4.6. Limitations and Future Directions
Firstly, our analysis was based solely on the resultant acceleration to ensure comparability between the datasets. However, there are other ways to represent acceleration, but although we found that the vertical acceleration component was less effective, there are other representations, such as using all three signal dimensions. Exploring these alternative signal representations could lead to more accurate and informative models. For instance, using the vertical acceleration component or considering all three dimensions might better capture the key aspects of the jump that contribute to peak power. Furthermore, investigating the optimal signal representation for different sensor types and placements could inform future data collection protocols, ensuring that the most relevant and informative data are captured for modelling athletic performance.
Secondly, our feature selection procedure relied on Lasso regularisation, which has gained popularity owing to its simplicity and effectiveness [40]. It requires only adjusting the regularisation parameter to vary the number of features admitted to the model. Other methods may be considered, such as stepwise regression, but it is slower and requires tuning several hyperparameters [40]. Although different selection methods may choose other features, our conclusions are unlikely to be significantly affected, as all selection methods depend on the intrinsic information held by the predictors. The differences in selected features between methods may only be subtle, as the underlying relationships between the predictors and the target variable remain the same. Ultimately, the effectiveness of any feature selection method is limited by the information available in the dataset.
Thirdly, we inferred feature influence using the standardised beta coefficients in the linear model. While this approach is convenient and provides a direct measure of influence in the linear model, there are other predictor contribution methods available, such as SHAP (SHapley Additive exPlanations) values [41] and LIME (Local Interpretable Model-agnostic Explanations) [42]. These techniques can be applied to various model types and offer a more comprehensive understanding of the features’ importance. However, these methods may not always provide a reliable estimate of the predictor’s true influence. For example, SHAP values can be sensitive to multicollinearity, while LIME explanations may be affected by the choice of perturbation strategy and the complexity of the local approximation [43,44].
Future research should explore alternative signal representations, investigate the impact of different feature selection methods, and employ a range of predictor contribution techniques to gain a more comprehensive understanding of feature influence. By doing so, athletic performance models based on wearable sensor data may continue to improve in accuracy, interpretability, and generalisability, and so become more useful to the applied practitioner.
4.7. Practical Implications
Our study has important practical implications for feature extraction and model development in biomechanics. The superiority of continuous features, particularly FPCs, for modelling athletic performance metrics emphasises the importance of understanding the efficacy of different feature extraction methods. Our findings suggest that continuous feature extraction can streamline the feature selection process and reduce the reliance on arduous and time-consuming hand-crafted features [9]. This research has the potential to accelerate the development of accurate and reliable athletic performance models, enabling researchers and practitioners to make more informed decisions about training and performance optimisation. While domain knowledge can provide valuable insights, it is crucial to consider the potential biases or false assumptions that may be introduced. Striking a balance between data-driven approaches and domain expertise is essential, ensuring that the models remain objective and evidence-based while still benefiting from domain experts’ contextual understanding.
5. Conclusions
Our study advances the understanding of discrete and continuous feature extraction methods for modelling athletic performance using wearable sensor data. By demonstrating the efficacy of continuous features, particularly FPCs, and highlighting the challenges associated with discrete features, we have provided valuable insights for researchers and practitioners in the biomechanics field. Our findings emphasised the importance of considering model robustness, sensor type and placement, and the trade-offs between alignment and preserving valuable phase information when developing athletic performance models. Future research should explore the impact of sensor type and placement on model performance, investigate alternative signal representations, and consider the balance between data-driven approaches and domain knowledge in feature selection.
==
Author Contributions
Conceptualisation, M.W., B.DL., N.B. and V.C.; methodology, M.W. and B.DL.; software, M.W. and B.DL.; validation, M.W., B.DL., N.B. and V.C.; formal analysis, M.W.; investigation, M.W., B.DL. and V.C.; resources, V.C. and N.B.; data curation, M.W. and B.DL.; writing—original draft preparation, M.W.; writing—review and editing, M.W., B.DL., N.B. and V.C.; visualisation, M.W.; supervision, N.B. and V.C.; project administration, N.B. and V.C.; funding acquisition, V.C. All authors have read and agreed to the published version of the manuscript.
Funding
This research was funded by Regione Lazio, Call: POR FESR Lazio 2014–2020 (Azione 1.2.1), grant number 20028AP000000095. 1.2.1), grant number 20028AP000000095. The APC was waived.
Institutional Review Board Statement
The study was conducted in accordance with the Declaration of Helsinki. The Smartphone data collection was approved by the Internal Review Board of the University of Rome “Foro Italico”, piazza Lauro de Bosis 6, 00135, Rome, Italy (protocol code No. CAR-94/2021/Rev2022, date of approval: 4 May 2022). The Accelerometer data collection was approved by the Research Ethics and Governance Committee of Swansea University’s College of Engineering (protocol code No. 2018-061, date of approval: 29 May 2018.
Informed Consent Statement
Informed consent was obtained from all subjects involved in the study.
Data Availability Statement
The datasets used in this study are available for download from the Zenodo repository: https://zenodo.org/records/10975077. The MATLAB code is available from Github: https://github.com/markgewhite/jumpsensormodels
Conflicts of Interest
The funders had no role in the design of the study, in the collection, analyses, or interpretation of data, in the writing of the manuscript or in the decision to publish the results.
Appendix A. Methods
Appendix A.1. Discrete features

Table A1.
Discrete feature definitions [20].
Table A1.
Discrete feature definitions [20].
| ID | Feature | Units | Description |
|---|---|---|---|
| A | Unweighting phase duration | s | |
| b | Minimum acceleration | m/s² | |
| C | Time from minimum to maximum acceleration | s | |
| D | Main positive impulse time | s | Time duration of positive acceleration from to the last positive sample prior |
| e | Maximum acceleration | m/s² | |
| F | Time from acceleration positive peak to take-off | s | |
| G | Ground contact duration | s | |
| H | Time from minimum acceleration to the end of braking phase | s | |
| I | Maximum positive slope of acceleration | m/s³ | |
| k1 | Acceleration at the end of the braking phase | m/s² | |
| J | Time from negative peak velocity to the end of braking phase | s | |
| l | Negative peak power | W/kg | |
| M | Positive power duration | s | Self-explanatory |
| n | Positive peak power | W/kg | |
| O | Time distance between positive peak power and take-off | s | |
| p | Mean slope between acceleration peaks | au | |
| q | Shape factor | au | Ratio between the area under the curve from to the last positive sample prior (lasting D) and the one of a rectangle of sides D and e |
| r | Impulse ratio | au | |
| s | Minimum negative velocity | m/s | |
| u | Mean concentric power | W/kg | Average value of |
| W | Power peaks delta time | s | |
| z | Mean eccentric power | W/kg | Average value of |
| High central frequency | Hz | Highest VMD central frequency, associated with wobbling tissues and noise | |
| Middle central frequency | Hz | Middle VMD central frequency, associated with wobbling tissues | |
| Low central frequency | Hz | Lowest VMD central frequency, associated with the jump proper | |
| h | Jump height | m | Height computed via TOV from |
Capital letters are for timings.
==
Appendix A.2. Signal Alignment
Cross-correlation slides one signal over another to find the offset between them where the correlation between overlapping signals is highest. A collection of signals can be aligned by computing the offsets obtained from running cross-correlations between each signal and a common reference signal. The mean signal was chosen as the reference signal for our first candidate method, XCMeanConv. When the signals were out of phase before starting the procedure, the mean signal was a poor reference for aligning the signals. Despite this, the procedure shifted signals into closer alignment with each other. A revised mean signal could then be recalculated, which would become a better representation of the general pattern. Repeating the alignment procedure with the revised mean signal improved the overall alignment further. With further iterations, the mean signal converged to what may be considered the archetypal signal for the sample. Convergence was reached when the change to the mean signal variance over successive iterations fell below a tolerance of 0.001. Typically, 8-9 iterations were required. Our second candidate method, XCRandom, used a randomly chosen signal from the sample to serve as the reference signal so that this approach served as a comparator to XCMeanConv. The signals were aligned once to that randomly chosen reference signal with no further iterations.
Three candidate methods used landmarks to align the signals. The signals were phase-shifted in these methods so the chosen landmark coincided with a reference position. The choice of reference position is essentially arbitrary so long as its position does not cause the shifted signal to be truncated. We defined the reference position as the average landmark position across the sample. We chose landmarks associated with takeoff and landing as appropriate events that can be readily identified. The alignment objective is to identify a landmark that allows FPCA to capture the relevant amplitude variance and maximise model performance. Therefore, an effective landmark is not necessarily one that accurately identifies the timing of the biomechanical event precisely (takeoff or landing), although that may be the case. It could be that a landmark identified with a peak associated with takeoff and landing may be more effective because it is more in keeping with FPCA’s focus on amplitude variance.
We defined two candidate landmark methods based on the two most prominent peaks in the acceleration, approximating takeoff and landing. We smoothed the signal first using a moving average with a 0.5 s window so the peak position was more representative of the general rise in acceleration and not biased by noise. LMTakeoffPeak was the first of those peaks in time and LMLandingPeak was the second. Prominence was one of the metrics returned by the MATLAB findpeaks() function. Our third candidate method, LMTakeoffBiomechanical, attempts to locate the takeoff time as a discrete feature accurately. Specifically, the landmark was the instant when the sensor’s inertial acceleration first dropped below the acceleration due to gravity (i.e., when ) once the computed velocity had risen above zero after passing through its first minimum. Finally, LMTakeoffActual was implemented to compare with the true takeoff time or ground truth. It gave the takeoff point from force plate data when VGRF first fell below 10 N and was considered. This information was only available for the Accelerometer dataset.
The quality of signal alignment was evaluated based on comparisons between signal pairs, averaged across all possible pair comparisons, and further averaged across 50 model fits (25×2-fold CV). The signal-pair comparison metrics were: Alignment RMSE (the difference in magnitude between pairs of signals, standardised to z-scores, averaged across their entire length); Pearson Correlation (as the linear correlation between signal pairs); and the Signal-to-Noise Ratio (SNR, the ratio signal power to noise power, defined here as the squared difference between the signal pair: ).
Appendix A.3. Functional Smoothing
The time series were converted into continuous, smoothly varying functions with a b-spline basis of 4th order[27]. The number of basis functions was scaled with the duration of the time series at a rate of one basis function for every 0.04 s (5.12 points for Smartphone data, 10 points for Accelerometer data). By definition, the 4th-order basis functions have a three-quarter overlap with their immediate neighbours, giving greater flexibility to follow the time series than may be expected from the function density alone. We found this relatively low function density yielded lower model validation errors and was quick to execute. FPCA cost rises exponentially as more basis functions are added.
The basis functions were regularised using a 1st-order roughness penalty, with the roughness parameter, , determined by an automated generalised cross-validation (GCV) procedure. We used MATLAB’s fminbnd(), a simple local optimiser, to find that minimised GCV error, where . We found that penalising high rates of change in the signal’s curvature (1st order) produced lower GCV errors than the more conventional approach of penalising high curvature (2nd order). This finding may be attributable to the high rates of change in acceleration on landing.
Appendix A. Extended Results
Appendix A.4. Alignment Evaluation
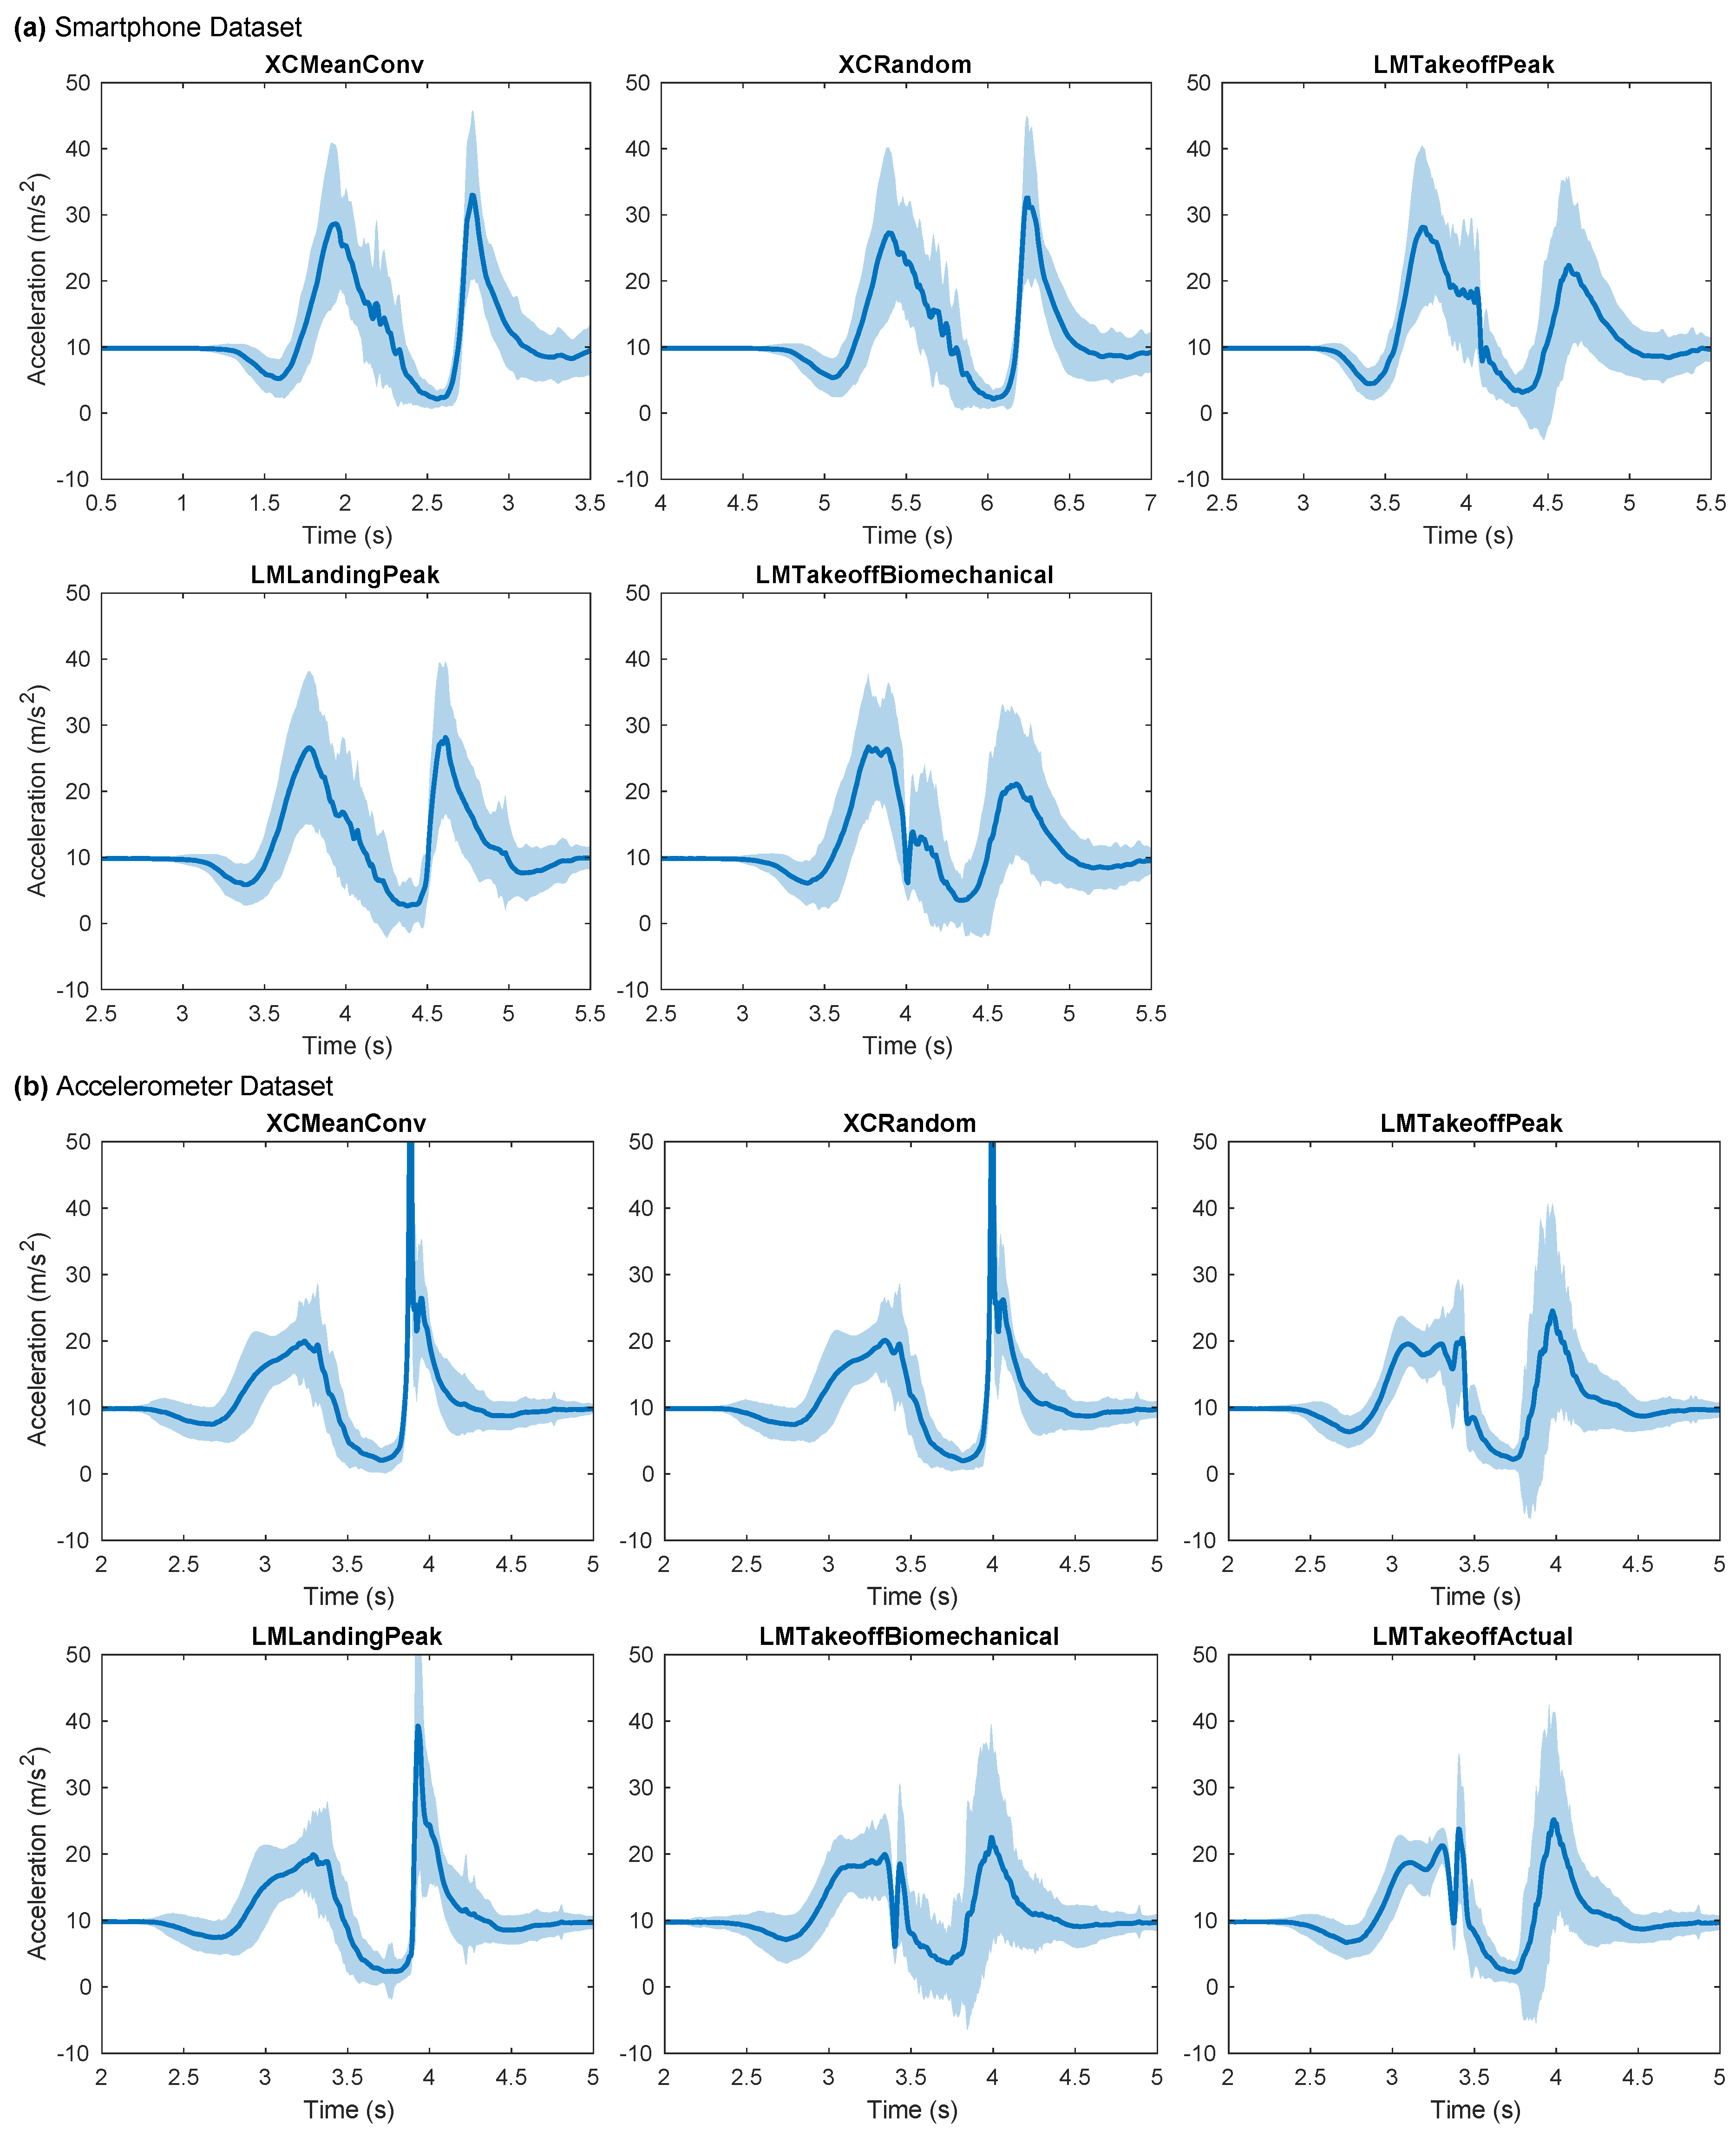
A visual inspection of the Accelerometer signals shows that both cross-correlation methods (XCMeanConv and XCRandom) achieved a high degree of alignment (Figure A1). The cross-correlation methods aligned the signals at the high amplitude peak upon landing. This peak was better resolved than when using the LMLandingPeak method, which identified this peak specifically as the chosen landmark. The landmark methods generally resulted in smaller shared regions at takeoff, but at the expense of larger variation during and after landing, particularly so for LMTakeoffBiomechanical. As a result, the mean curve revealed greater complexity, which had been otherwise averaged out in the landing-focused methods.
The cross-correlation methods for the Smartphone dataset were not as effective, as indicated by larger shaded regions (variance) than the corresponding regions for the Accelerometer dataset. XCMeanConv aligned the signals at or around takeoff, and similarly for XCRandom. The landmark methods tended to leave larger variance regions across the waveform, although LMTakeoffBiomechanical yielded slightly smaller regions. The difference in landmark position between LMTakeoffPeak resulted in slightly different emphasis.
Figure A1.
Signal alignments (a prerequisite for FPCA) for the whole dataset, according to different alignment methods. Solid line: mean signal after alignment; shaded region: corresponding standard deviation. A narrow region indicates close alignment. The acceleration rises to a peak immediately before takeoff, then drops towards zero during flight and then spikes to a high value at landing impact. LMTakeoffActual is the ground truth takeoff according to the force plate (Accelerometer only).
Figure A1.
Signal alignments (a prerequisite for FPCA) for the whole dataset, according to different alignment methods. Solid line: mean signal after alignment; shaded region: corresponding standard deviation. A narrow region indicates close alignment. The acceleration rises to a peak immediately before takeoff, then drops towards zero during flight and then spikes to a high value at landing impact. LMTakeoffActual is the ground truth takeoff according to the force plate (Accelerometer only).
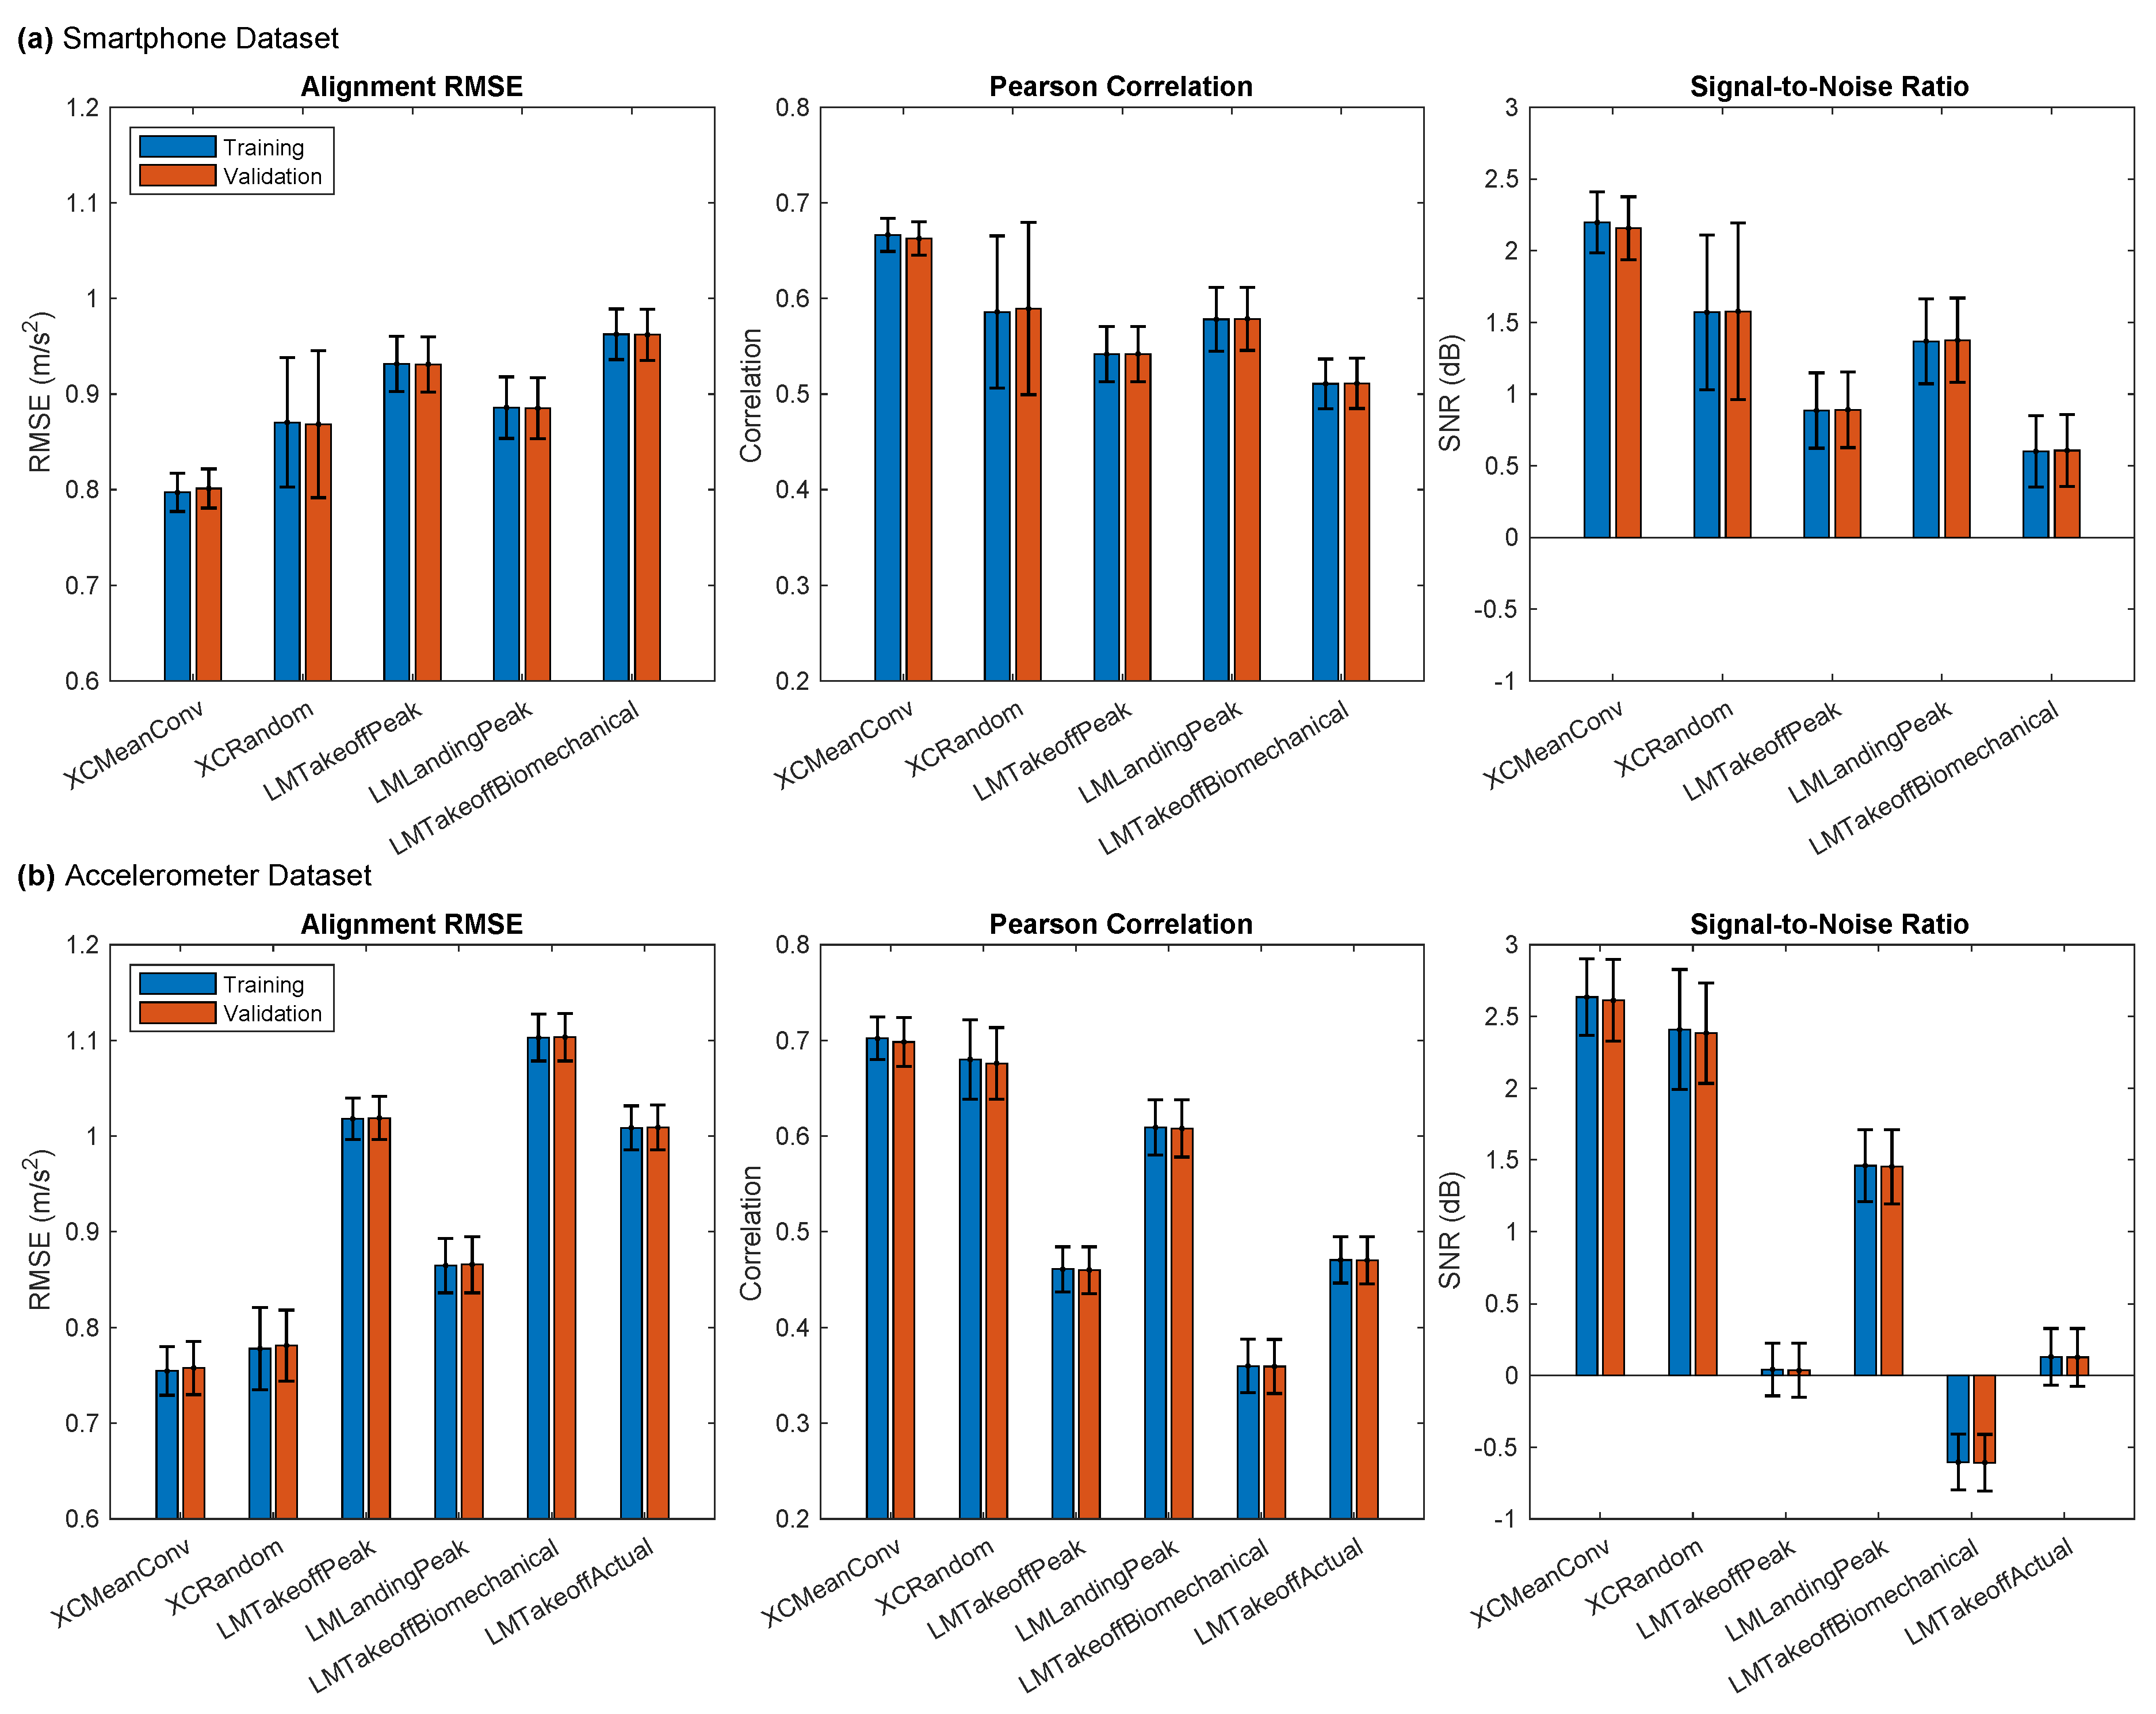
The signal alignment metrics provided a more objective assessment of the signal alignment (Figure A2). XCMeanConv was best for both datasets, achieving the lowest alignment RMSE and the highest Pearson correlation and SNR. When referring back to the alignment plots, SNR appears for the most part to reflect the visual inspection: a high SNR corresponds to tightly aligned signals in Figure A1. LMTakeoffActual performed poorly across these metrics despite being the takeoff time’s ground truth measure. Finally, the similarity in the alignment metrics between training and validation sets showed that the reference signals (cross-correlation methods) or reference points (landmark methods) determined from the training set could be applied equally to validation (Appendix A.2).
Figure A2.
Metrics evaluating the quality of signal alignment achieved by the alignment methods averaged over 50 model fits (2-fold CV). Alignment RMSE is the difference in magnitude between pairs of signals, standardised to z-scores, averaged across their full length (lower is better); Pearson Correlation is the linear correlation between signal pairs (higher is better); Signal-to-Noise Ratio is the ratio signal power to noise power, which is defined here as the squared difference between the signal pair (higher is better).
Figure A2.
Metrics evaluating the quality of signal alignment achieved by the alignment methods averaged over 50 model fits (2-fold CV). Alignment RMSE is the difference in magnitude between pairs of signals, standardised to z-scores, averaged across their full length (lower is better); Pearson Correlation is the linear correlation between signal pairs (higher is better); Signal-to-Noise Ratio is the ratio signal power to noise power, which is defined here as the squared difference between the signal pair (higher is better).
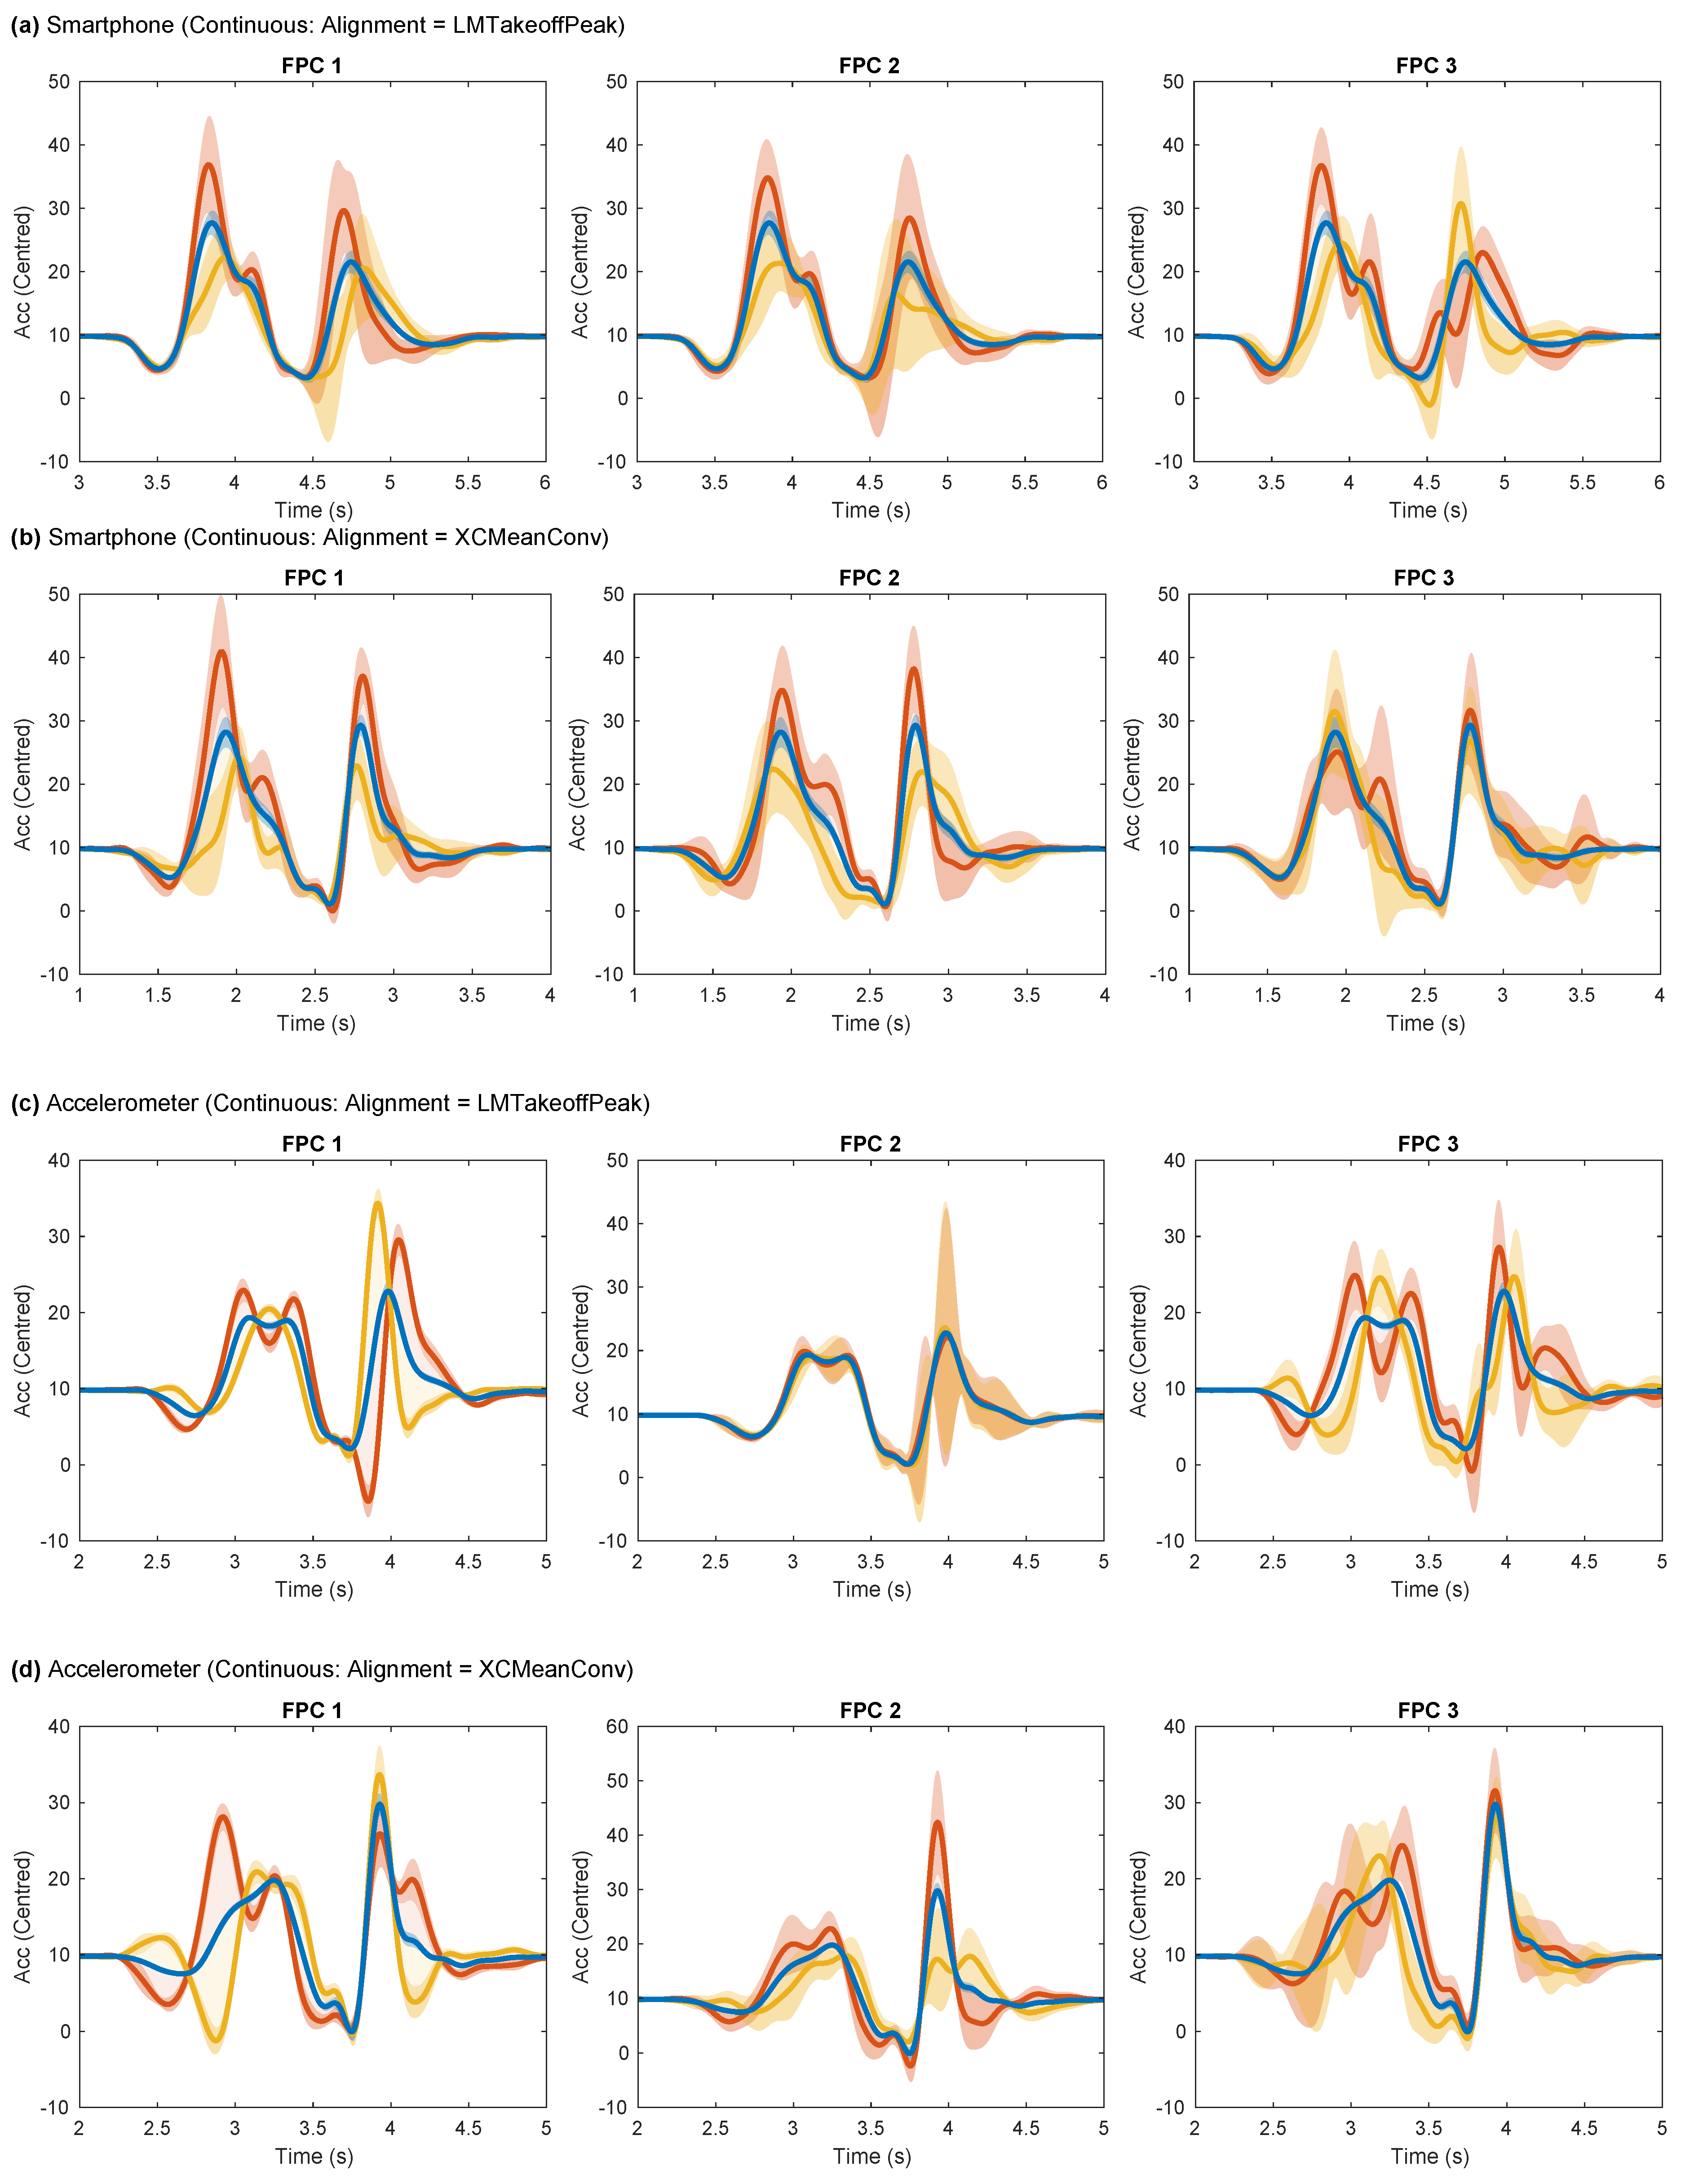
The choice of alignment method modified the shape of the FPCs, as expected. However, the extent of the change was such that in some cases, a different interpretation of the components was merited (Figure A3). The differences were most apparent for the Accelerometer dataset, between LMTakeoffPeak and XCMeanConv, representing alignment at takeoff or landing, respectively. FPC1 for XCMeanConv captured the variation in acceleration most prominently in the braking phase when acceleration rises before takeoff. In comparison, FPC1 for LMTakeoffPeak captured primarily the variation in flight duration, given that the rise in acceleration on landing occurs later for higher FPC1 scores. An analogy can be drawn using VGRF data in the CMJ to help interpret these components. Higher FPC1 scores for XCMeanConv would be indicative of higher and greater VGRF generation in the braking phase, whereas FPC1 scores for LMLandingPeak signify higher jumps and, by implication, greater peak power. FPC2 for XCMeanConv captured the variation in the amplitude of the acceleration spike on impact, whereas FPC2 for LMLandingPeak had no discernible characteristics in this plot as the component varies so much between subsamples.
Figure A3.
The first three Functional Principal Components (FPCs) respectively for each dataset based on either the LMTakeoffPeak or XCMeanConv alignment methods. This plot is an adaptation of the traditional FPC plots, showing the modes of variation that arise from changing the corresponding FPC score. The blue line is the mean curve with a score of zero. The yellow line is of the FPC score, and the red line is . The mode of variation may be imagined by varying the curve from the yellow line through the blue and onto the red line, a transition achieved by increasing the FPC score. The shaded regions for each line represent one standard deviation across subsamples.
Figure A3.
The first three Functional Principal Components (FPCs) respectively for each dataset based on either the LMTakeoffPeak or XCMeanConv alignment methods. This plot is an adaptation of the traditional FPC plots, showing the modes of variation that arise from changing the corresponding FPC score. The blue line is the mean curve with a score of zero. The yellow line is of the FPC score, and the red line is . The mode of variation may be imagined by varying the curve from the yellow line through the blue and onto the red line, a transition achieved by increasing the FPC score. The shaded regions for each line represent one standard deviation across subsamples.
Appendix A.5. Feature Distributions
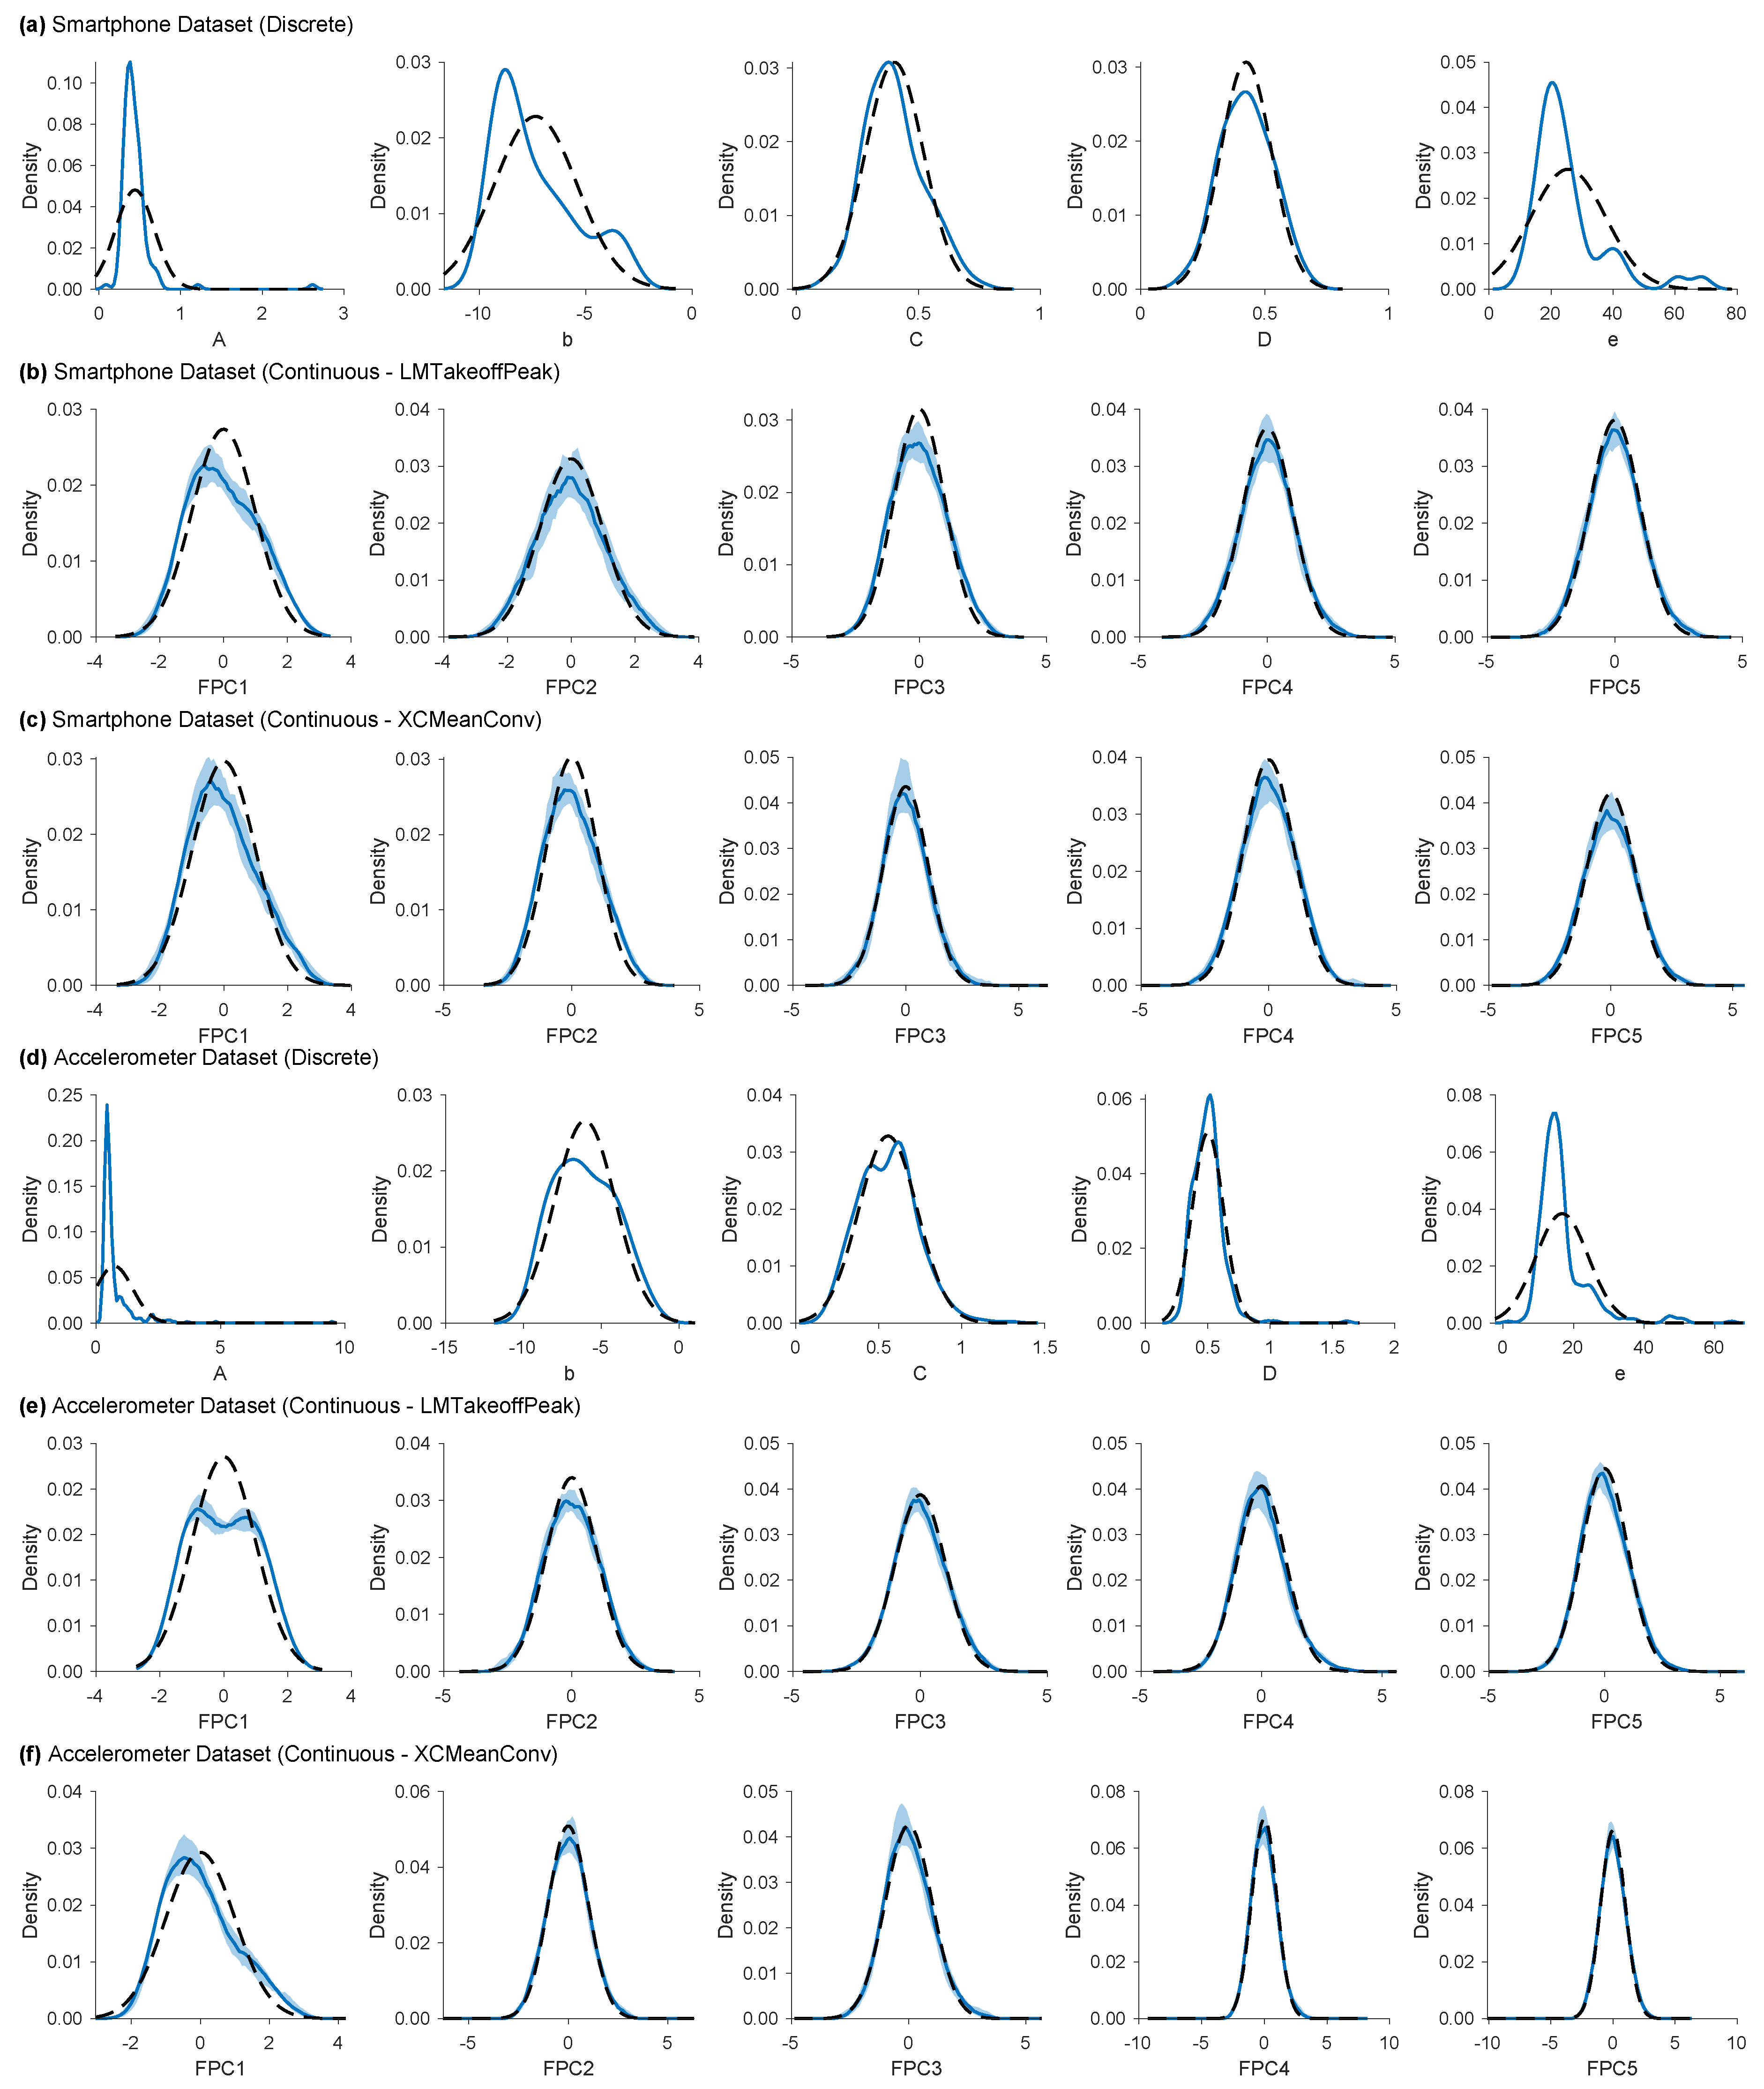
The continuous features were generally normally distributed, but the many discrete features were not (Figure A4). Several discrete features exhibited long tails and moderate skew, most notably A and e of those shown in the figure. Others (not shown) included G, n, O, u and h, the estimated jump height. The continuous features’ distributions were largely unaffected by the choice of alignment method insofar as the Smartphone dataset was concerned. However, the change was more marked for the Accelerometer dataset. Notably, the Accelerometer FPC1 for LMTakeoffPeak had a bimodal distribution.
Figure A4.
Selected features’ probability density distributions before centring, based on the full datasets (solid blue line) compared to the equivalent normal distribution computed from the data’s mean and standard deviation (dashed black line). The continuous features have an additional shaded light blue region showing the standard deviation in the distribution between cross-validated folds. Alignment based on the takeoff landmark identified by the algorithm.
Figure A4.
Selected features’ probability density distributions before centring, based on the full datasets (solid blue line) compared to the equivalent normal distribution computed from the data’s mean and standard deviation (dashed black line). The continuous features have an additional shaded light blue region showing the standard deviation in the distribution between cross-validated folds. Alignment based on the takeoff landmark identified by the algorithm.
Appendix A.6. Linear Model Beta Coefficients
The standardised beta coefficients of the linear model varied between subsamples, reflecting the features’ varying degrees of influence (Figure A5). In most cases, the features’ direction of influence on the outcome variable could change, either increasing or decreasing peak power depending on the sign. The variance in continuous features’ beta coefficients in the linear was more consistent across subsamples than those of the discrete features. Indeed, beta coefficients for the same discrete features varied much more than those of the continuous features. This phenomenon was much more prevalent for discrete features, especially for A, G, J and M from both datasets, which can have extreme values, . Hence, the true influence of discrete features on the outcome variable was uncertain.
Figure A5.
Variance in the linear model’s standardised beta coefficients across 50 model fits ( 2-fold CV). The left-hand column shows betas for discrete features on two scales because they vary so much in magnitude. The right-hand column shows beta for continuous features based on two different alignment methods. A solid bar represents the interquartile range where the small target circle is the median. Passing through the zero line indicates the predictor can have opposing effects between samples. A standardised beta coefficient of 1 indicates a one standard deviation in the predictor causes a one standard deviation in the outcome variable.
Figure A5.
Variance in the linear model’s standardised beta coefficients across 50 model fits ( 2-fold CV). The left-hand column shows betas for discrete features on two scales because they vary so much in magnitude. The right-hand column shows beta for continuous features based on two different alignment methods. A solid bar represents the interquartile range where the small target circle is the median. Passing through the zero line indicates the predictor can have opposing effects between samples. A standardised beta coefficient of 1 indicates a one standard deviation in the predictor causes a one standard deviation in the outcome variable.
References
- Seshadri, D.R.; Drummond, C.; Craker, J.; Rowbottom, J.R.; Voos, J.E. Wearable Devices for Sports: New Integrated Technologies Allow Coaches, Physicians, and Trainers to Better Understand the Physical Demands of Athletes in Real time. IEEE Pulse 2017, 8, 38–43. [Google Scholar] [CrossRef] [PubMed]
- Camomilla, V.; Bergamini, E.; Fantozzi, S.; Vannozzi, G. Trends Supporting the In-Field Use of Wearable Inertial Sensors for Sport Performance Evaluation: A Systematic Review. Sensors 2018, 18, 873. [Google Scholar] [CrossRef]
- Preatoni, E.; Bergamini, E.; Fantozzi, S.; Giraud, L.I.; Orejel Bustos, A.S.; Vannozzi, G.; Camomilla, V. The Use of Wearable Sensors for Preventing, Assessing, and Informing Recovery from Sport-Related Musculoskeletal Injuries: A Systematic Scoping Review. Sensors 2022, 22, 3225. [Google Scholar] [CrossRef]
- Cust, E.E.; Sweeting, A.J.; Ball, K.; Robertson, S. Machine and deep learning for sport-specific movement recognition: a systematic review of model development and performance. Journal of Sports Sciences 2019, 37, 568–600. [Google Scholar] [CrossRef] [PubMed]
- Chambers, R.; Gabbett, T.J.; Cole, M.H.; Beard, A. The Use of Wearable Microsensors to Quantify Sport-Specific Movements. Sports Medicine 2015, 45, 1065–1081. [Google Scholar] [CrossRef]
- Ancillao, A.; Tedesco, S.; Barton, J.; O’Flynn, B. Indirect Measurement of Ground Reaction Forces and Moments by Means of Wearable Inertial Sensors: A Systematic Review. Sensors 2018, 18, 2564. [Google Scholar] [CrossRef] [PubMed]
- Johnson, W.; Mian, A.; Robinson, M.A.; Verheul, J.; Lloyd, D.G.; Alderson, J.A. Multidimensional ground reaction forces and moments from wearable sensor accelerations via deep learning. arXiv:1903.07221v2, arXiv:1903.07221v2 2019, p. 18.
- Hughes, G.T.; Camomilla, V.; Vanwanseele, B.; Harrison, A.J.; Fong, D.T.; Bradshaw, E.J. Novel technology in sports biomechanics: some words of caution. Sports Biomechanics 2024, 23, 393–401. [Google Scholar] [CrossRef]
- Dorschky, E.; Camomilla, V.; Davis, J.; Federolf, P.; Reenalda, J.; Koelewijn, A.D. Perspective on “in the wild” movement analysis using machine learning. Human Movement Science 2023, 87, 103042. [Google Scholar] [CrossRef] [PubMed]
- Dowling, J.J.; Vamos, L. Identification of Kinetic and Temporal Factors Related to Vertical Jump Performance. Journal of Applied Biomechanics 1993, 9, 95–110. [Google Scholar] [CrossRef]
- Oddsson, L. What Factors Determine Vertical Jumping Height? In Biomechanics in sports V; Tsarouchas, L., Ed.; Hellenic Sports Research Institute, 1989; pp. 393–401.
- Donoghue, O.A.; Harrison, A.J.; Coffey, N.; Hayes, K. Functional Data Analysis of Running Kinematics in Chronic Achilles Tendon Injury:. Medicine & Science in Sports & Exercise 2008, 40, 1323–1335. [Google Scholar] [CrossRef]
- Ryan, W.; Harrison, A.J.; Hayes, K. Functional data analysis of knee joint kinematics in the vertical jump. Sports Biomechanics 2006, 5, 121–138. [Google Scholar] [CrossRef] [PubMed]
- Warmenhoven, J.; Cobley, S.; Draper, C.; Harrison, A.J.; Bargary, N.; Smith, R. Considerations for the use of functional principal components analysis in sports biomechanics: examples from on-water rowing. Sports Biomechanics 2017, 18, 317–341. [Google Scholar] [CrossRef] [PubMed]
- Richter, C.; O’Connor, N.E.; Marshall, B.; Moran, K. Analysis of Characterizing Phases on Waveforms: An Application to Vertical Jumps. Journal of Applied Biomechanics 2014, 30, 316–321. [Google Scholar] [CrossRef] [PubMed]
- Halilaj, E.; Rajagopal, A.; Fiterau, M.; Hicks, J.L.; Hastie, T.J.; Delp, S.L. Machine learning in human movement biomechanics: Best practices, common pitfalls, and new opportunities. Journal of Biomechanics 2018, 81, 1–11. [Google Scholar] [CrossRef] [PubMed]
- Picerno, P.; Camomilla, V.; Capranica, L. Countermovement jump performance assessment using a wearable 3D inertial measurement unit. Journal of Sports Sciences 2011, 29, 139–146. [Google Scholar] [CrossRef]
- Claudino, J.G.; Cronin, J.; Mezêncio, B.; McMaster, D.T.; McGuigan, M.; Tricoli, V.; Amadio, A.C.; Serrão, J.C. The countermovement jump to monitor neuromuscular status: A meta-analysis. Journal of Science and Medicine in Sport 2017, 20, 397–402. [Google Scholar] [CrossRef] [PubMed]
- McMahon, J.J.; Suchomel, T.J.; Lake, J.P.; Comfort, P. Understanding the Key Phases of the Countermovement Jump Force-Time Curve. Strength & Conditioning Journal 2018, 40, 96–106. [Google Scholar] [CrossRef]
- Mascia, G.; De Lazzari, B.; Camomilla, V. Machine learning aided jump height estimate democratization through smartphone measures. Frontiers in Sports and Active Living 2023, 5, 1112739. [Google Scholar] [CrossRef]
- White, M.G.E.; Bezodis, N.E.; Neville, J.; Summers, H.; Rees, P. Determining jumping performance from a single body-worn accelerometer using machine learning. PLOS ONE 2022, 17, e0263846. [Google Scholar] [CrossRef]
- Jones, T.; Smith, A.; Macnaughton, L.S.; French, D.N. Strength and Conditioning and Concurrent Training Practices in Elite Rugby Union:. Journal of Strength and Conditioning Research 2016, 30, 3354–3366. [Google Scholar] [CrossRef]
- Cormack, S.J.; Newton, R.U.; McGuigan, M.R. Neuromuscular and Endocrine Responses of Elite Players to an Australian Rules Football Match. International Journal of Sports Physiology and Performance 2008, 3, 359–374. [Google Scholar] [CrossRef] [PubMed]
- Cronin, J.; Hansen, K.T. Strength and power predictors of sports speed. Journal of Strength and Conditioning Research 2005, 19, 349–357. [Google Scholar] [CrossRef] [PubMed]
- Owen, N.J.; Watkins, J.; Kilduff, L.P.; Bevan, H.R.; Bennett, M.A. Development of a Criterion Method to Determine Peak Mechanical Power Output in a Countermovement Jump:. Journal of Strength and Conditioning Research 2014, 28, 1552–1558. [Google Scholar] [CrossRef] [PubMed]
- Dragomiretskiy, K.; Zosso, D. Variational Mode Decomposition. IEEE Transactions on Signal Processing 2014, 62, 531–544. [Google Scholar] [CrossRef]
- Ramsay, J.O.; Silverman, B.W. Functional data analysis, 2nd ed ed.; Springer series in statistics; Springer: New York, 2005. [Google Scholar]
- White, M.G.E.; Neville, J.; Rees, P.; Summers, H.; Bezodis, N. The effects of curve registration on linear models of jump performance and classification based on vertical ground reaction forces. Journal of Biomechanics 2022, 140, 111167. [Google Scholar] [CrossRef] [PubMed]
- White, M.G.E. Generalisable FPCA-based Models for Predicting Peak Power in Vertical Jumping using Accelerometer Data. PhD thesis, Swansea University, 2021.
- Kutner, M.H.; Nachtsheim, C.J.; Neter, J.; Li, W. Applied Linear Statistical Models, 5 ed.; McGraw-Hill/Irwin: Boston, MA, 2005. [Google Scholar]
- Tibshirani, R. Regression Shrinkage and Selection Via the Lasso. Journal of the Royal Statistical Society: Series B (Methodological) 1996, 58, 267–288. [Google Scholar] [CrossRef]
- Smola, A.J.; Schölkopf, B. A tutorial on support vector regression. Statistics and Computing 2004, 14, 199–222. [Google Scholar] [CrossRef]
- Chen, T.; Guestrin, C. XGBoost: A Scalable Tree Boosting System. Proceedings of the 22nd ACM SIGKDD International Conference on Knowledge Discovery and Data Mining; ACM: San Francisco California USA, 2016; pp. 785–794. [Google Scholar] [CrossRef]
- Nielsen, D. Tree Boosting With XGBoost - Why Does XGBoost Win "Every" Machine Learning Competition? Master’s thesis, Norwegian University of Science and Technology, 2016.
- Shao, J. Linear Model Selection by Cross-validation. Journal of the American Statistical Association 1993, 88, 486–494. [Google Scholar] [CrossRef]
- Cawley, G.C.; Talbot, N.L.C. On Over-fitting in Model Selection and Subsequent Selection Bias in Performance Evaluation. Journal of Machine Learning Research 2010, 11, 2079–2107. [Google Scholar]
- Vabalas, A.; Gowen, E.; Poliakoff, E.; Casson, A.J. Machine learning algorithm validation with a limited sample size. PLOS ONE 2019, 14, e0224365. [Google Scholar] [CrossRef]
- Harrison, A.; Ryan, W.; Hayes, K. Functional data analysis of joint coordination in the development of vertical jump performance. Sports Biomechanics 2007, 6, 199–214. [Google Scholar] [CrossRef] [PubMed]
- Moudy, S.; Richter, C.; Strike, S. Landmark registering waveform data improves the ability to predict performance measures. Journal of Biomechanics 2018, 78, 109–117. [Google Scholar] [CrossRef] [PubMed]
- Hastie, T.; Tibshirani, R.; Friedman, J.H. The elements of statistical learning: data mining, inference, and prediction, 2nd ed ed.; Springer series in statistics; Springer: New York, NY, 2009. [Google Scholar]
- Lundberg, S.; Lee, S.I. A Unified Approach to Interpreting Model Predictions, 2017. arXiv:1705.07874 [cs, stat].
- Ribeiro, M.T.; Singh, S.; Guestrin, C. "Why Should I Trust You?": Explaining the Predictions of Any Classifier, 2016. arXiv:1602.04938 [cs, stat].
- Kumar, I.E.; Venkatasubramanian, S.; Scheidegger, C.; Friedler, S. Problems with Shapley-value-based explanations as feature importance measures. Proceedings of the 37th International Conference on Machine Learning; III, H.D.; Singh, A., Eds. PMLR, 2020, Vol. 119, Proceedings of Machine Learning Research, pp. 5491–5500.
- Slack, D.; Hilgard, S.; Jia, E.; Singh, S.; Lakkaraju, H. Fooling LIME and SHAP: Adversarial Attacks on Post hoc Explanation Methods. Proceedings of the AAAI/ACM Conference on AI, Ethics, and Society; ACM: New York NY USA, 2020; pp. 180–186. [Google Scholar] [CrossRef]
| 1 | The gravitational offset was analogous to that performed on VGRF jump data, which has the participant’s bodyweight subtracted to yield the net force acting on the body. |
| 2 | The discrete features for a given signal would always have the same values irrespective of the subsample in which it was present. |
Figure 1.
The workflow to address the three research questions. The left-hand side of the figure presents the general steps, while the right-hand side details the choices based on the available data.
Figure 1.
The workflow to address the three research questions. The left-hand side of the figure presents the general steps, while the right-hand side details the choices based on the available data.
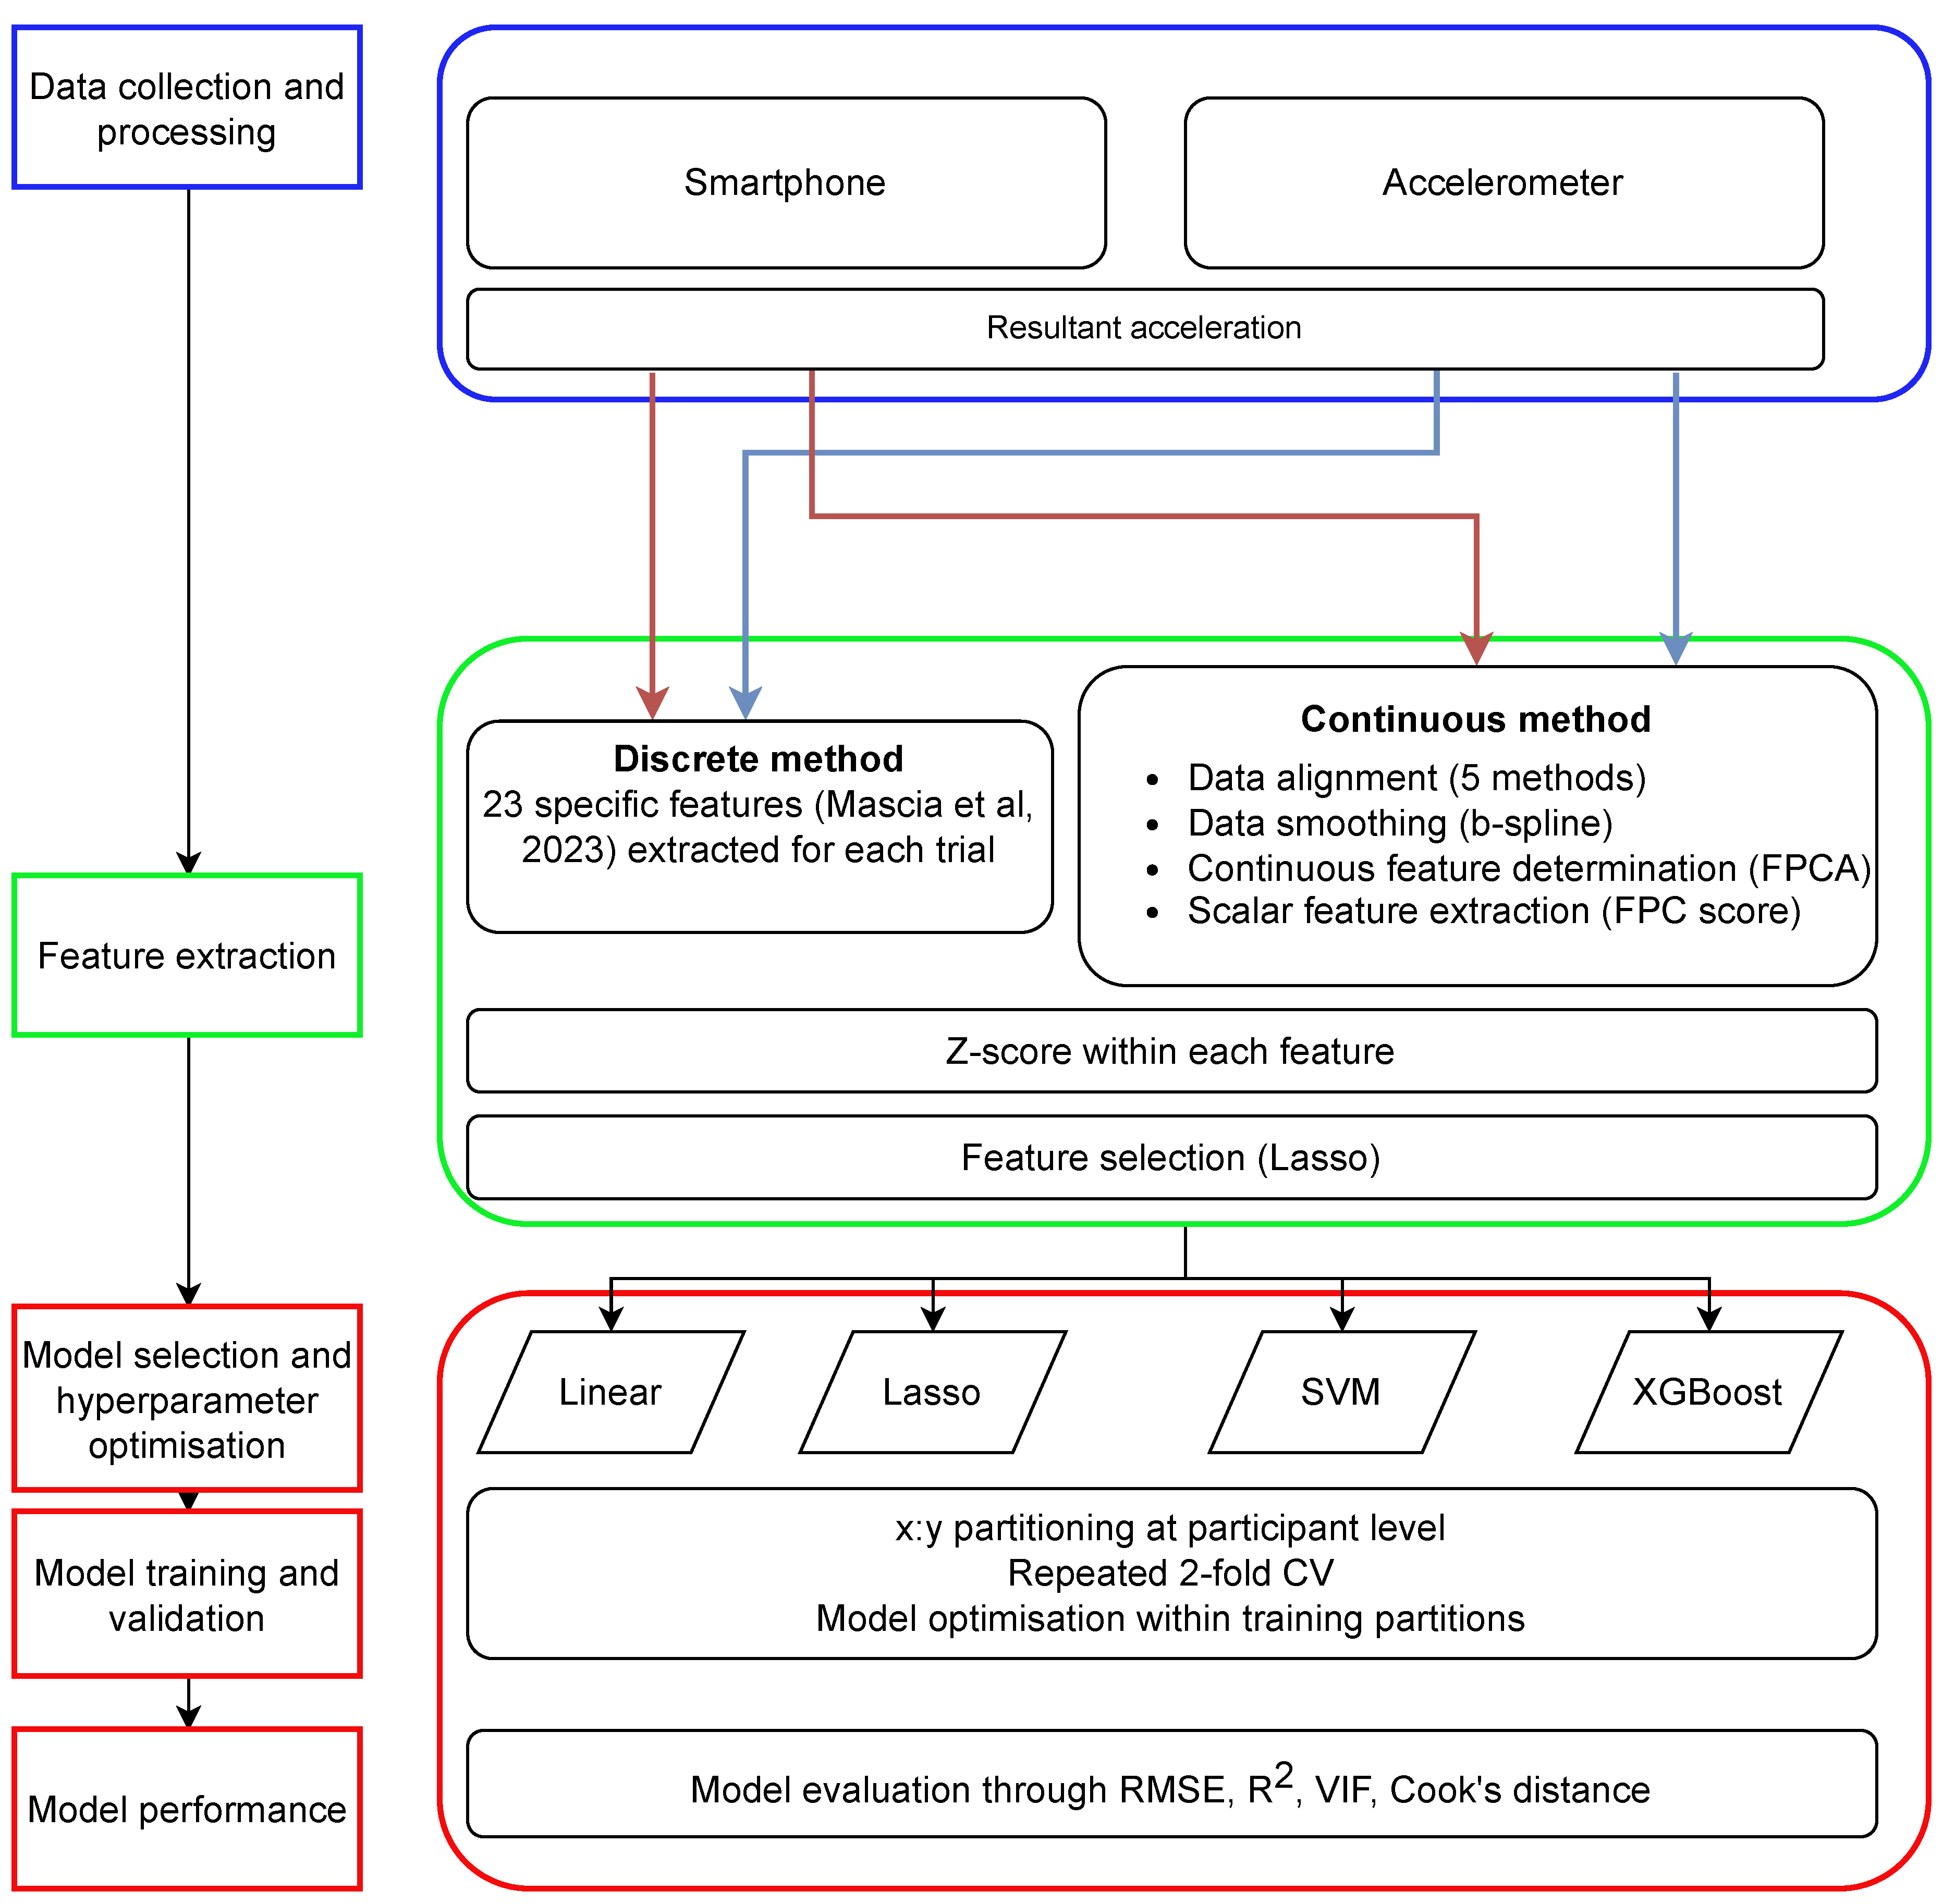
Figure 2.
Model performance using continuous features for different alignment methods. Standardised RMSE is in z-scores for jump peak power. Model performance is averaged over 50 model fits (2-fold CV) from the same run as for Figure A2. The mean validation error is shown next to each red bar. The error bars show the standard deviation between model fits.
Figure 2.
Model performance using continuous features for different alignment methods. Standardised RMSE is in z-scores for jump peak power. Model performance is averaged over 50 model fits (2-fold CV) from the same run as for Figure A2. The mean validation error is shown next to each red bar. The error bars show the standard deviation between model fits.
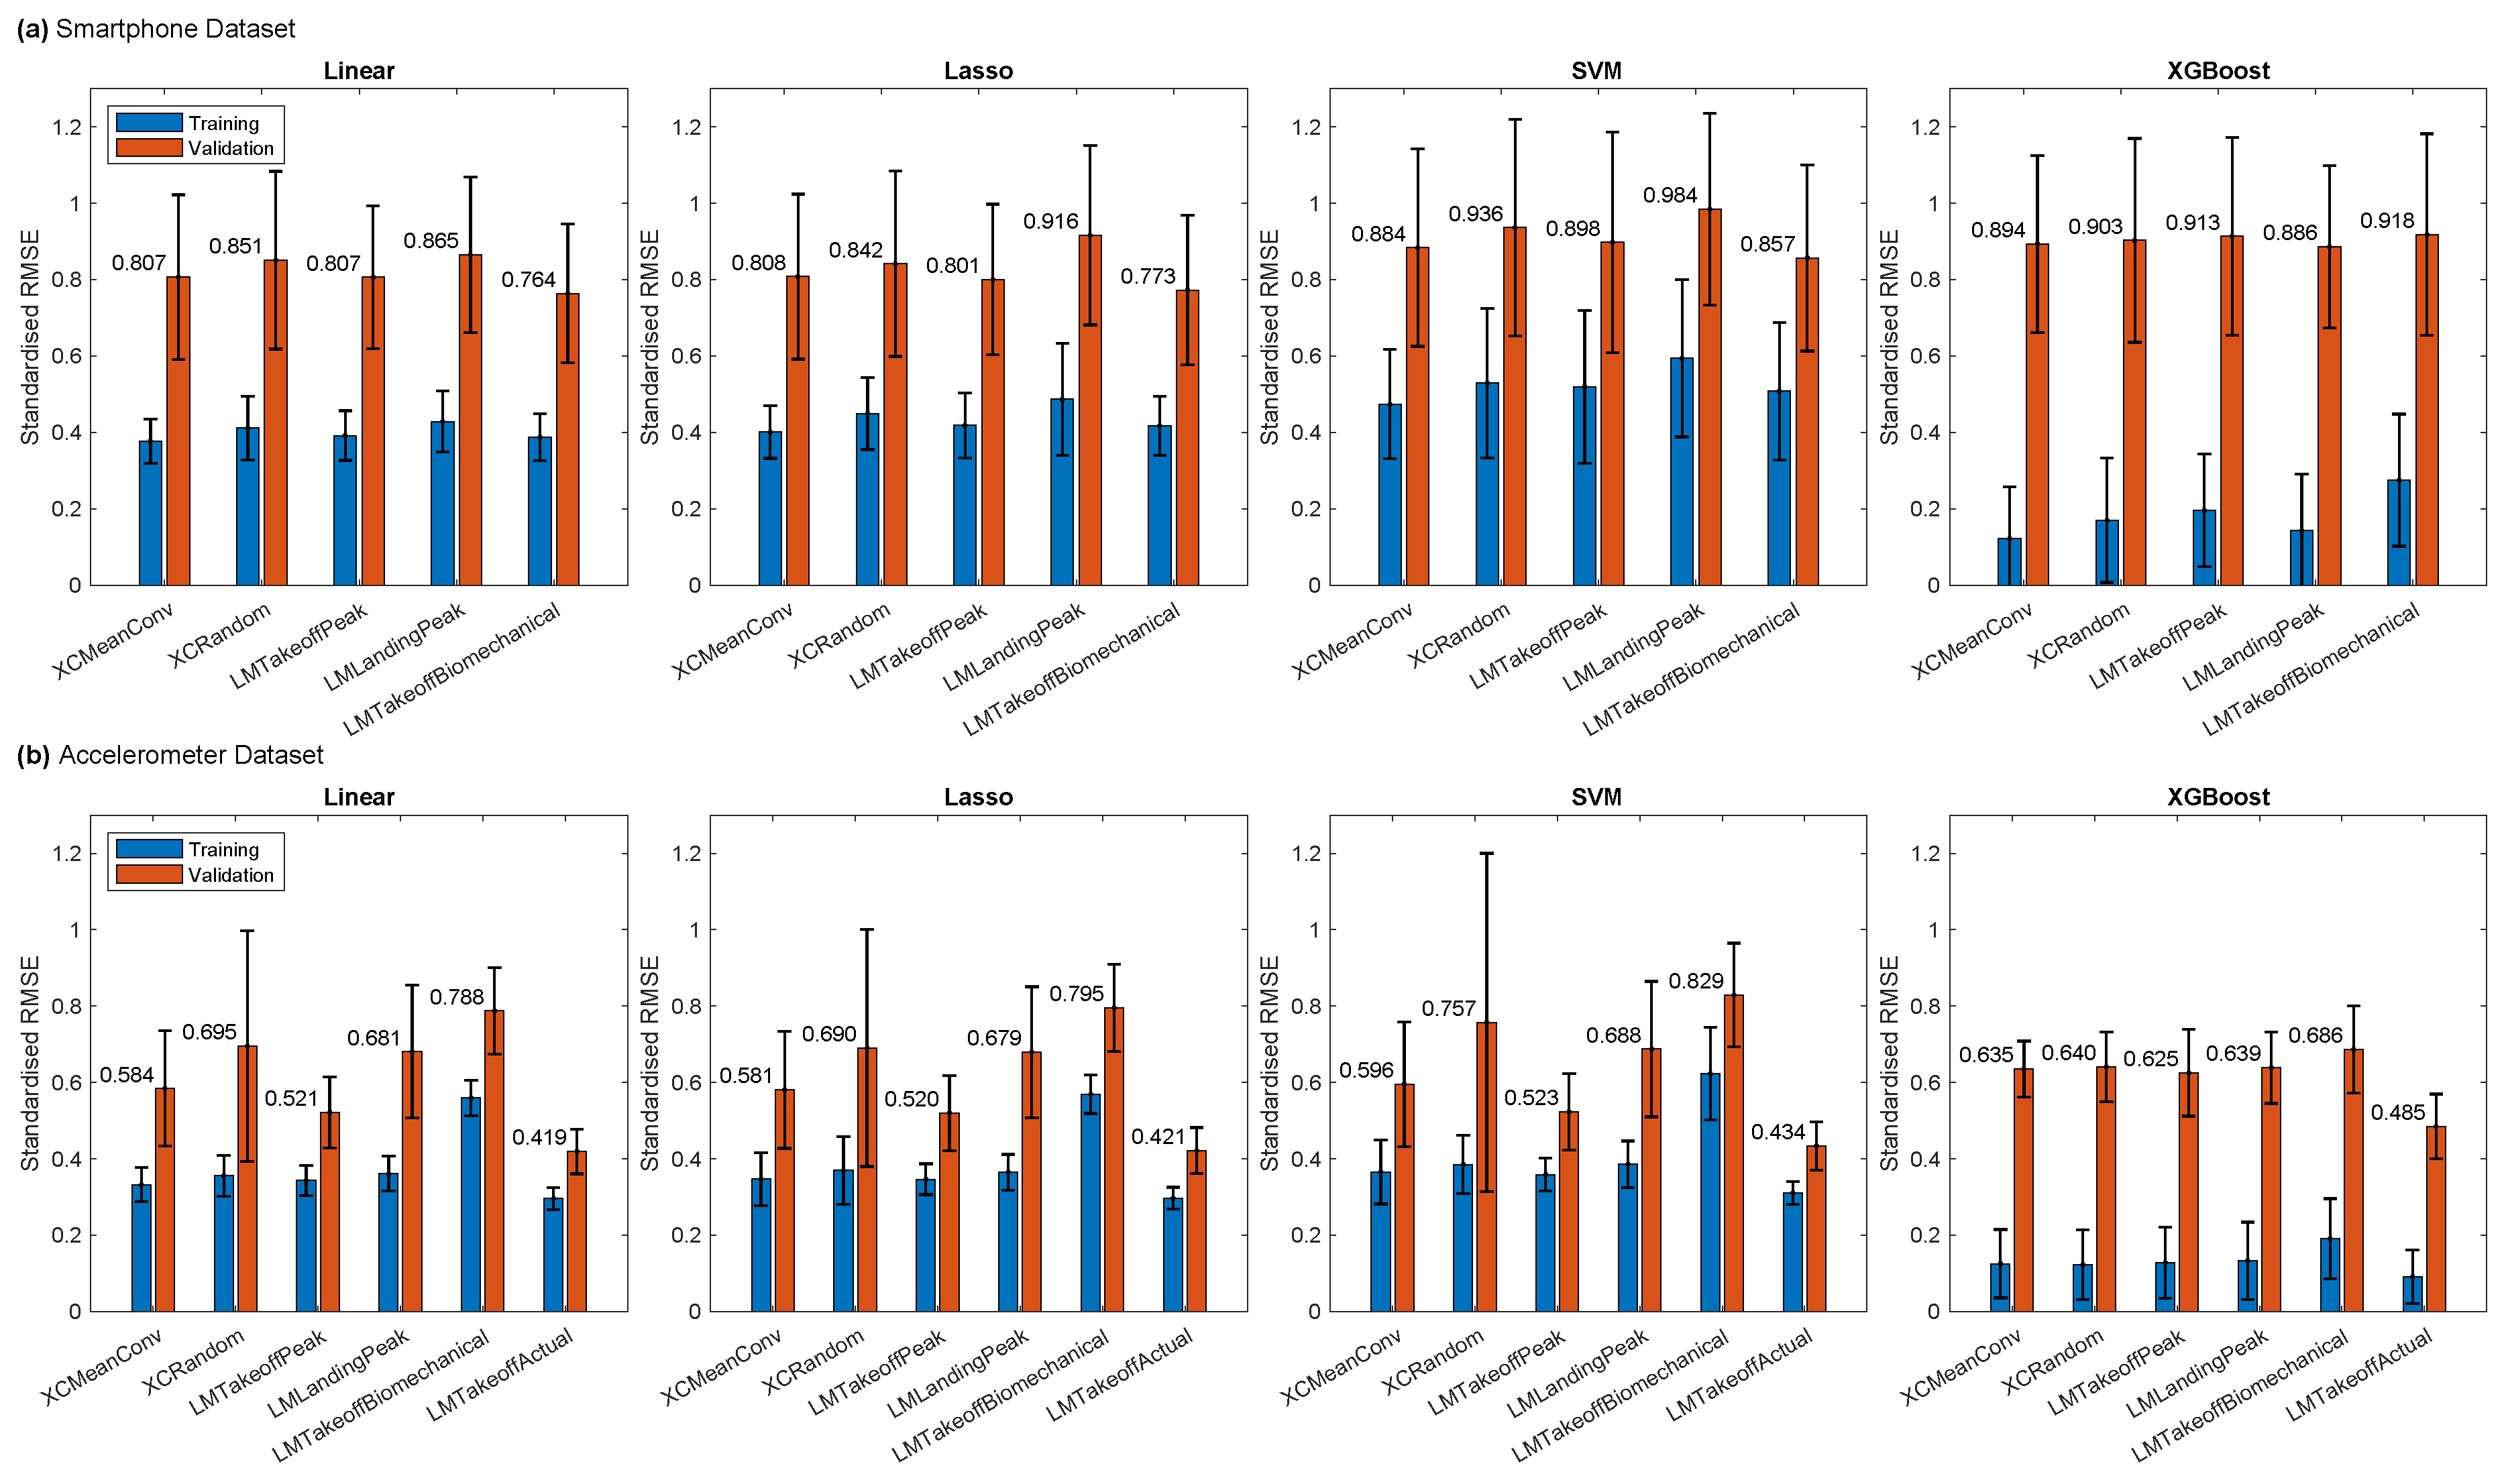
Figure 3.
Correlation heatmap within and between feature extraction methods for Smartphone and Accelerometer datasets averaged over 50 training folds (2-fold CV). Note the high correlations within discrete features (top-left triangle). There are no correlations within continuous features, FPCn (blank lower right triangle).
Figure 3.
Correlation heatmap within and between feature extraction methods for Smartphone and Accelerometer datasets averaged over 50 training folds (2-fold CV). Note the high correlations within discrete features (top-left triangle). There are no correlations within continuous features, FPCn (blank lower right triangle).
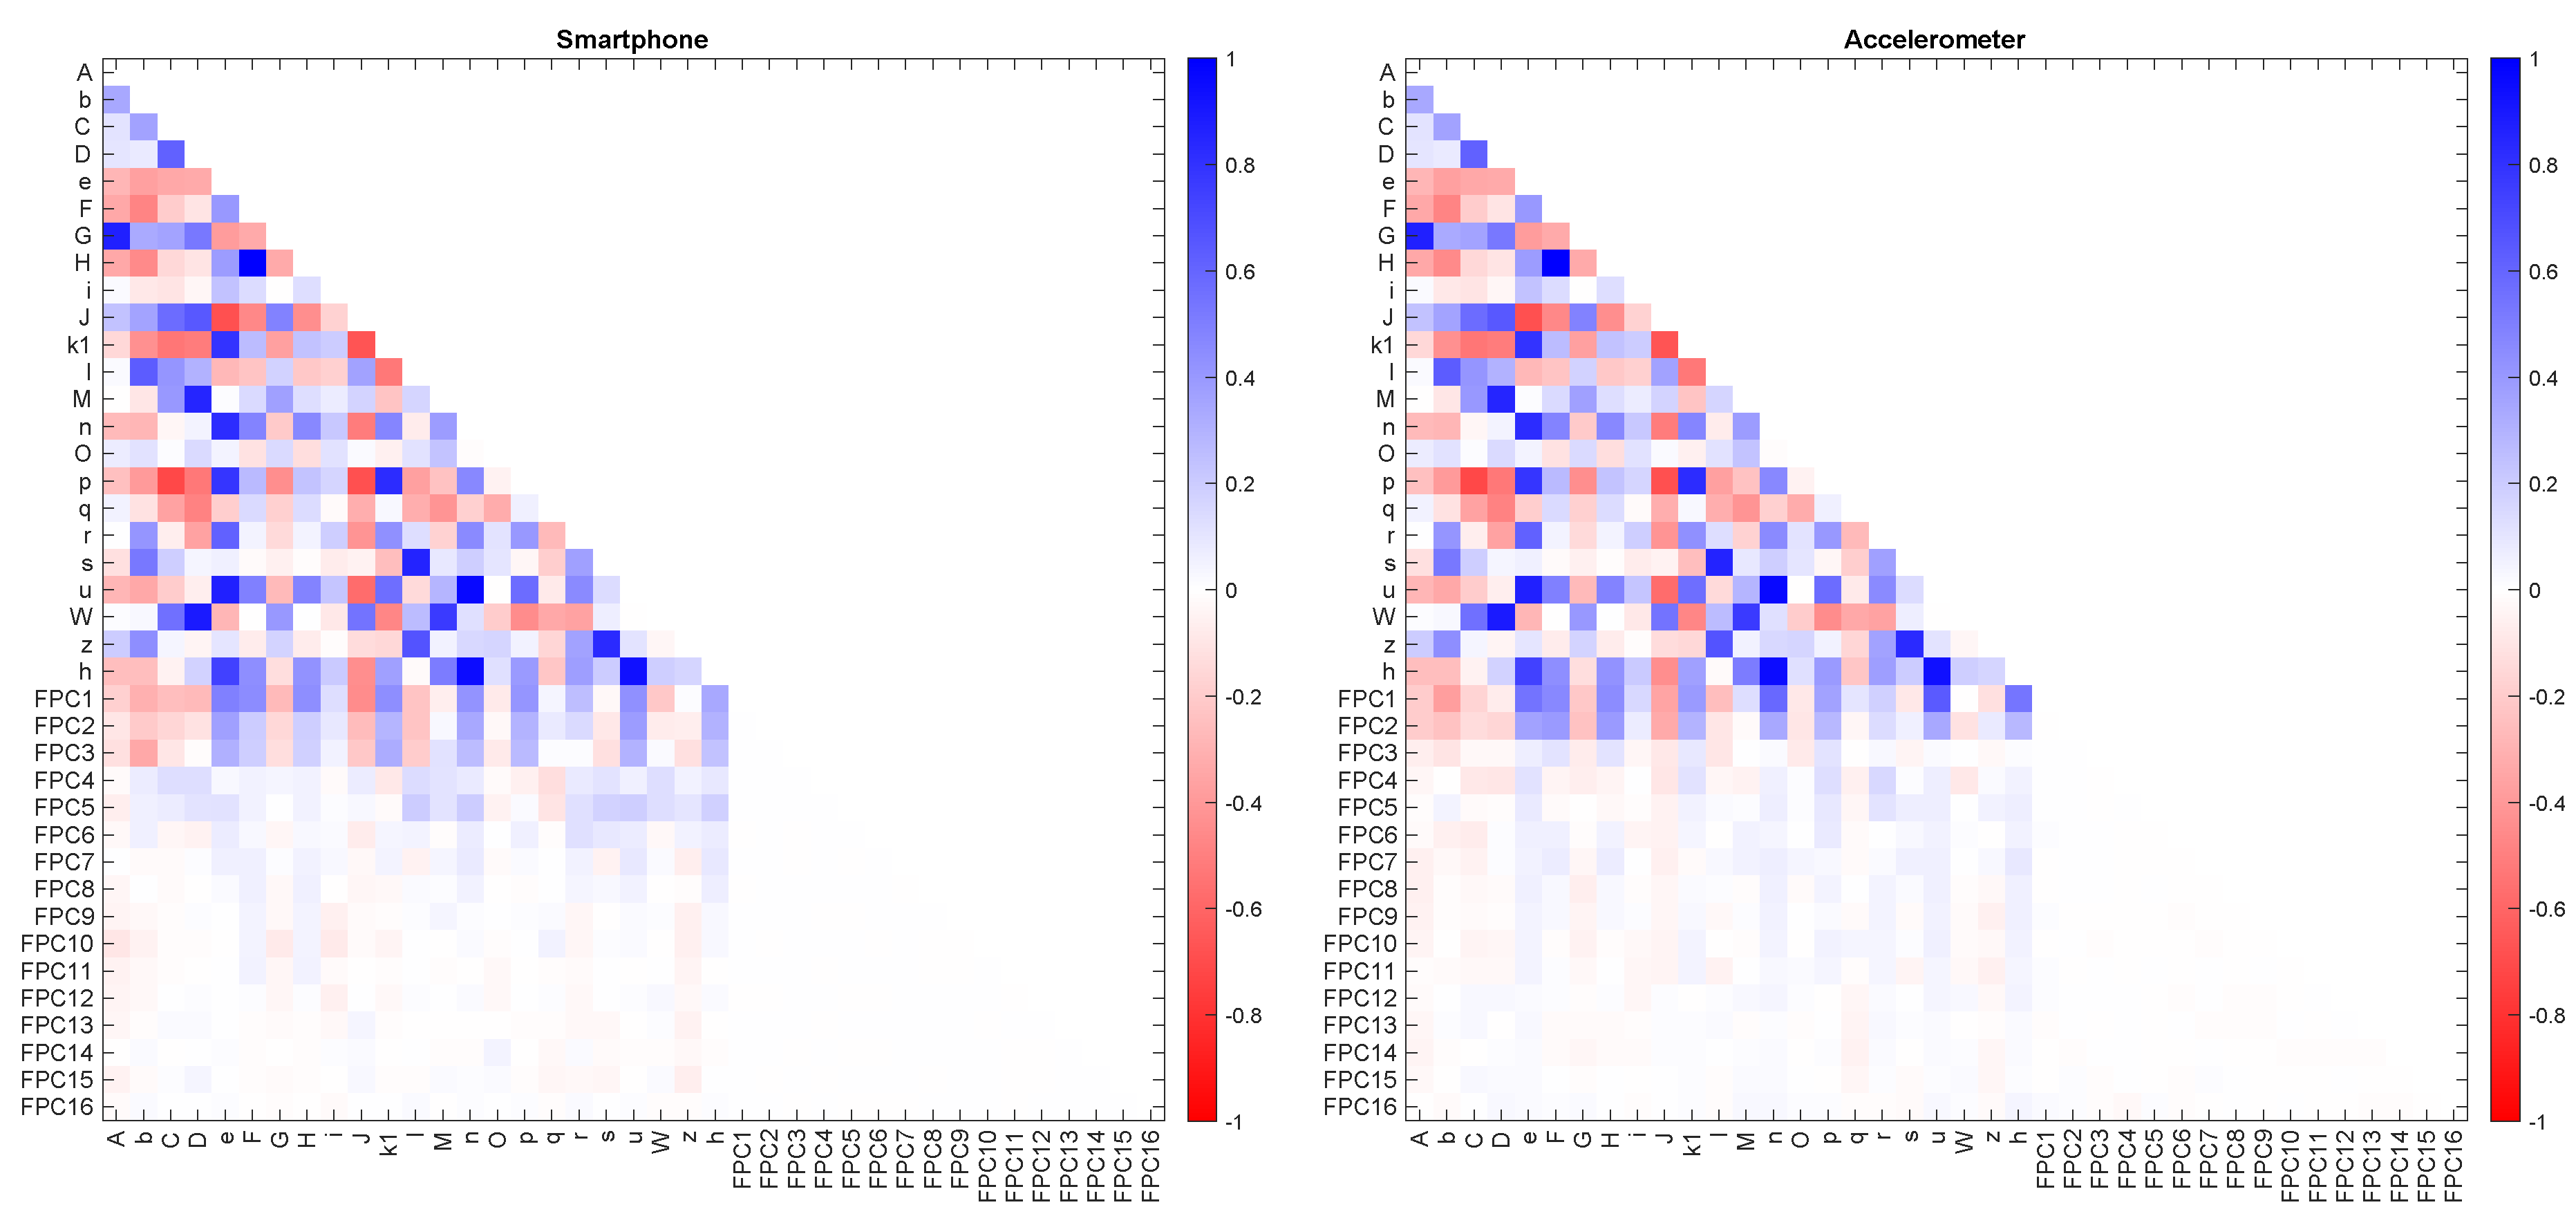
Figure 4.
Performance of the four model types as a function of the number of features selected. Standardised RMSE (log scale) is the median of 50 model fits ( 2-fold CV), where the error bars represent the interquartile range. A standardised error indicates performance worse than the null model, defined as a constant equal to the mean peak power. Best fit lines based on Gaussian process regression using a Matern 5/2 kernel.
Figure 4.
Performance of the four model types as a function of the number of features selected. Standardised RMSE (log scale) is the median of 50 model fits ( 2-fold CV), where the error bars represent the interquartile range. A standardised error indicates performance worse than the null model, defined as a constant equal to the mean peak power. Best fit lines based on Gaussian process regression using a Matern 5/2 kernel.
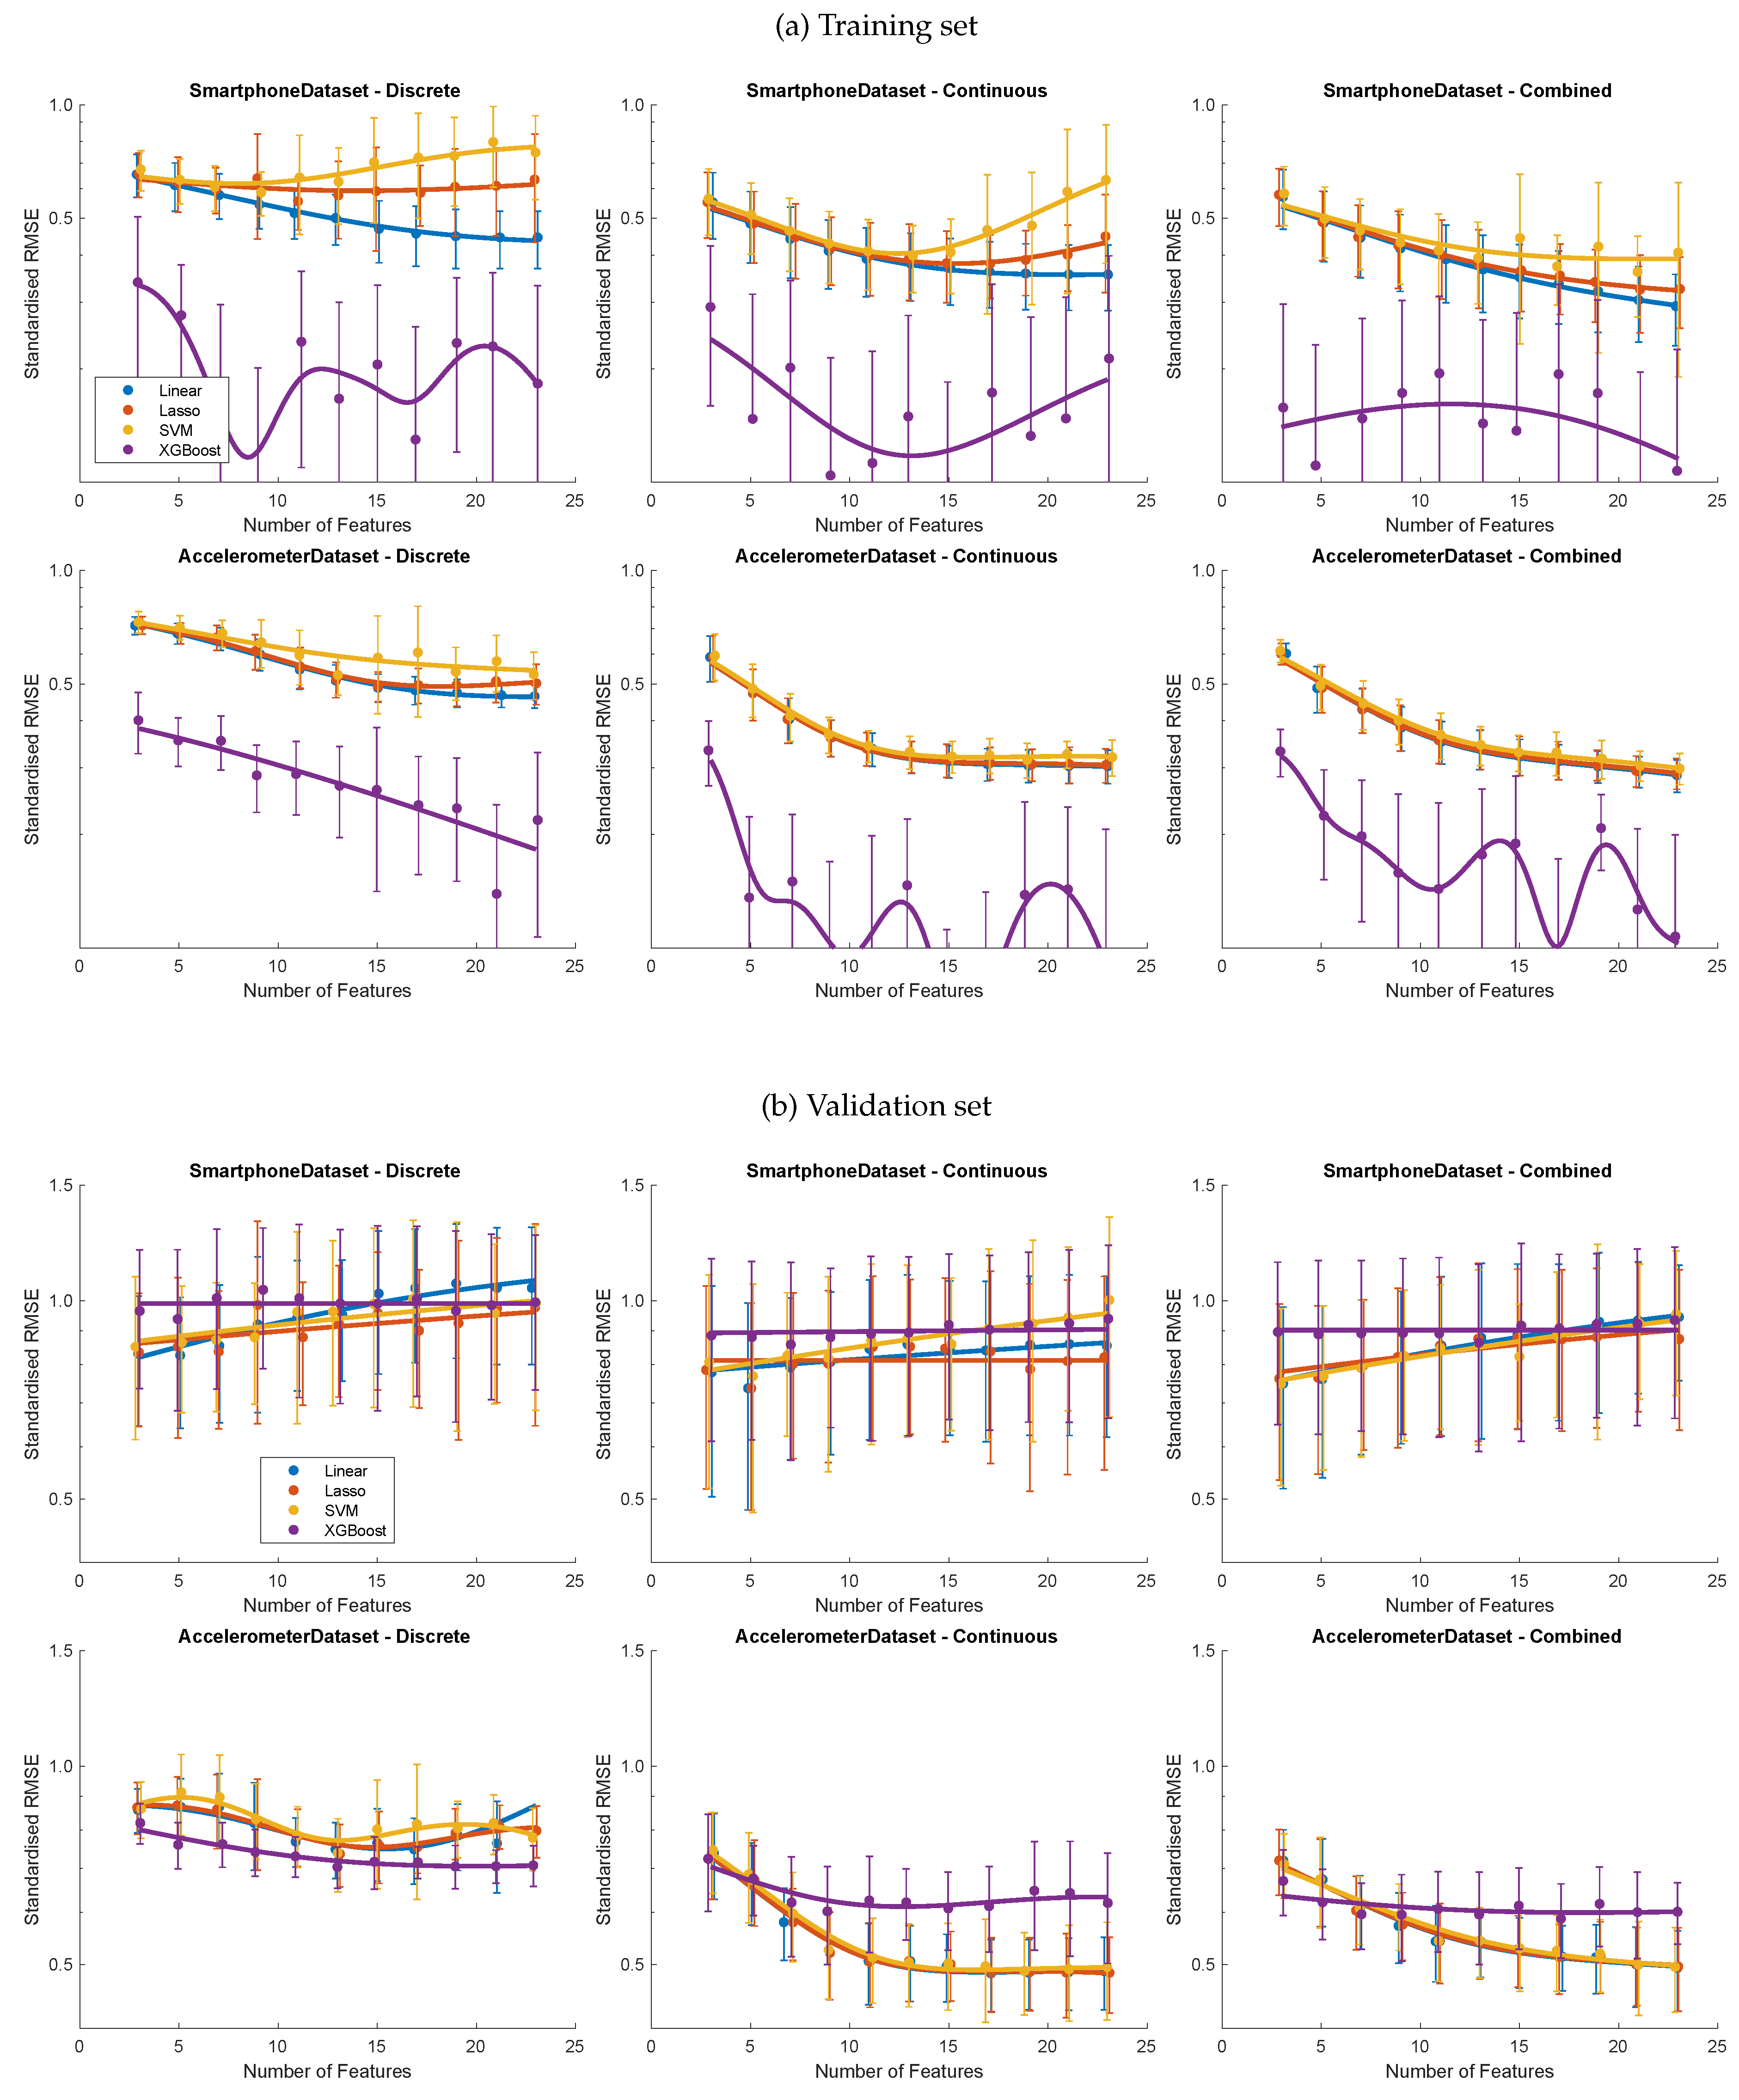
Figure 5.
Model performance as a function of sample size when the number of observations is capped. Standardised RMSE is the median over ten random subsets, each involving 2-fold CV, making up 200 model fits for each point. The error bars represent the interquartile range. Best fit lines based on Gaussian process regression using a Matern 5/2 kernel.
Figure 5.
Model performance as a function of sample size when the number of observations is capped. Standardised RMSE is the median over ten random subsets, each involving 2-fold CV, making up 200 model fits for each point. The error bars represent the interquartile range. Best fit lines based on Gaussian process regression using a Matern 5/2 kernel.
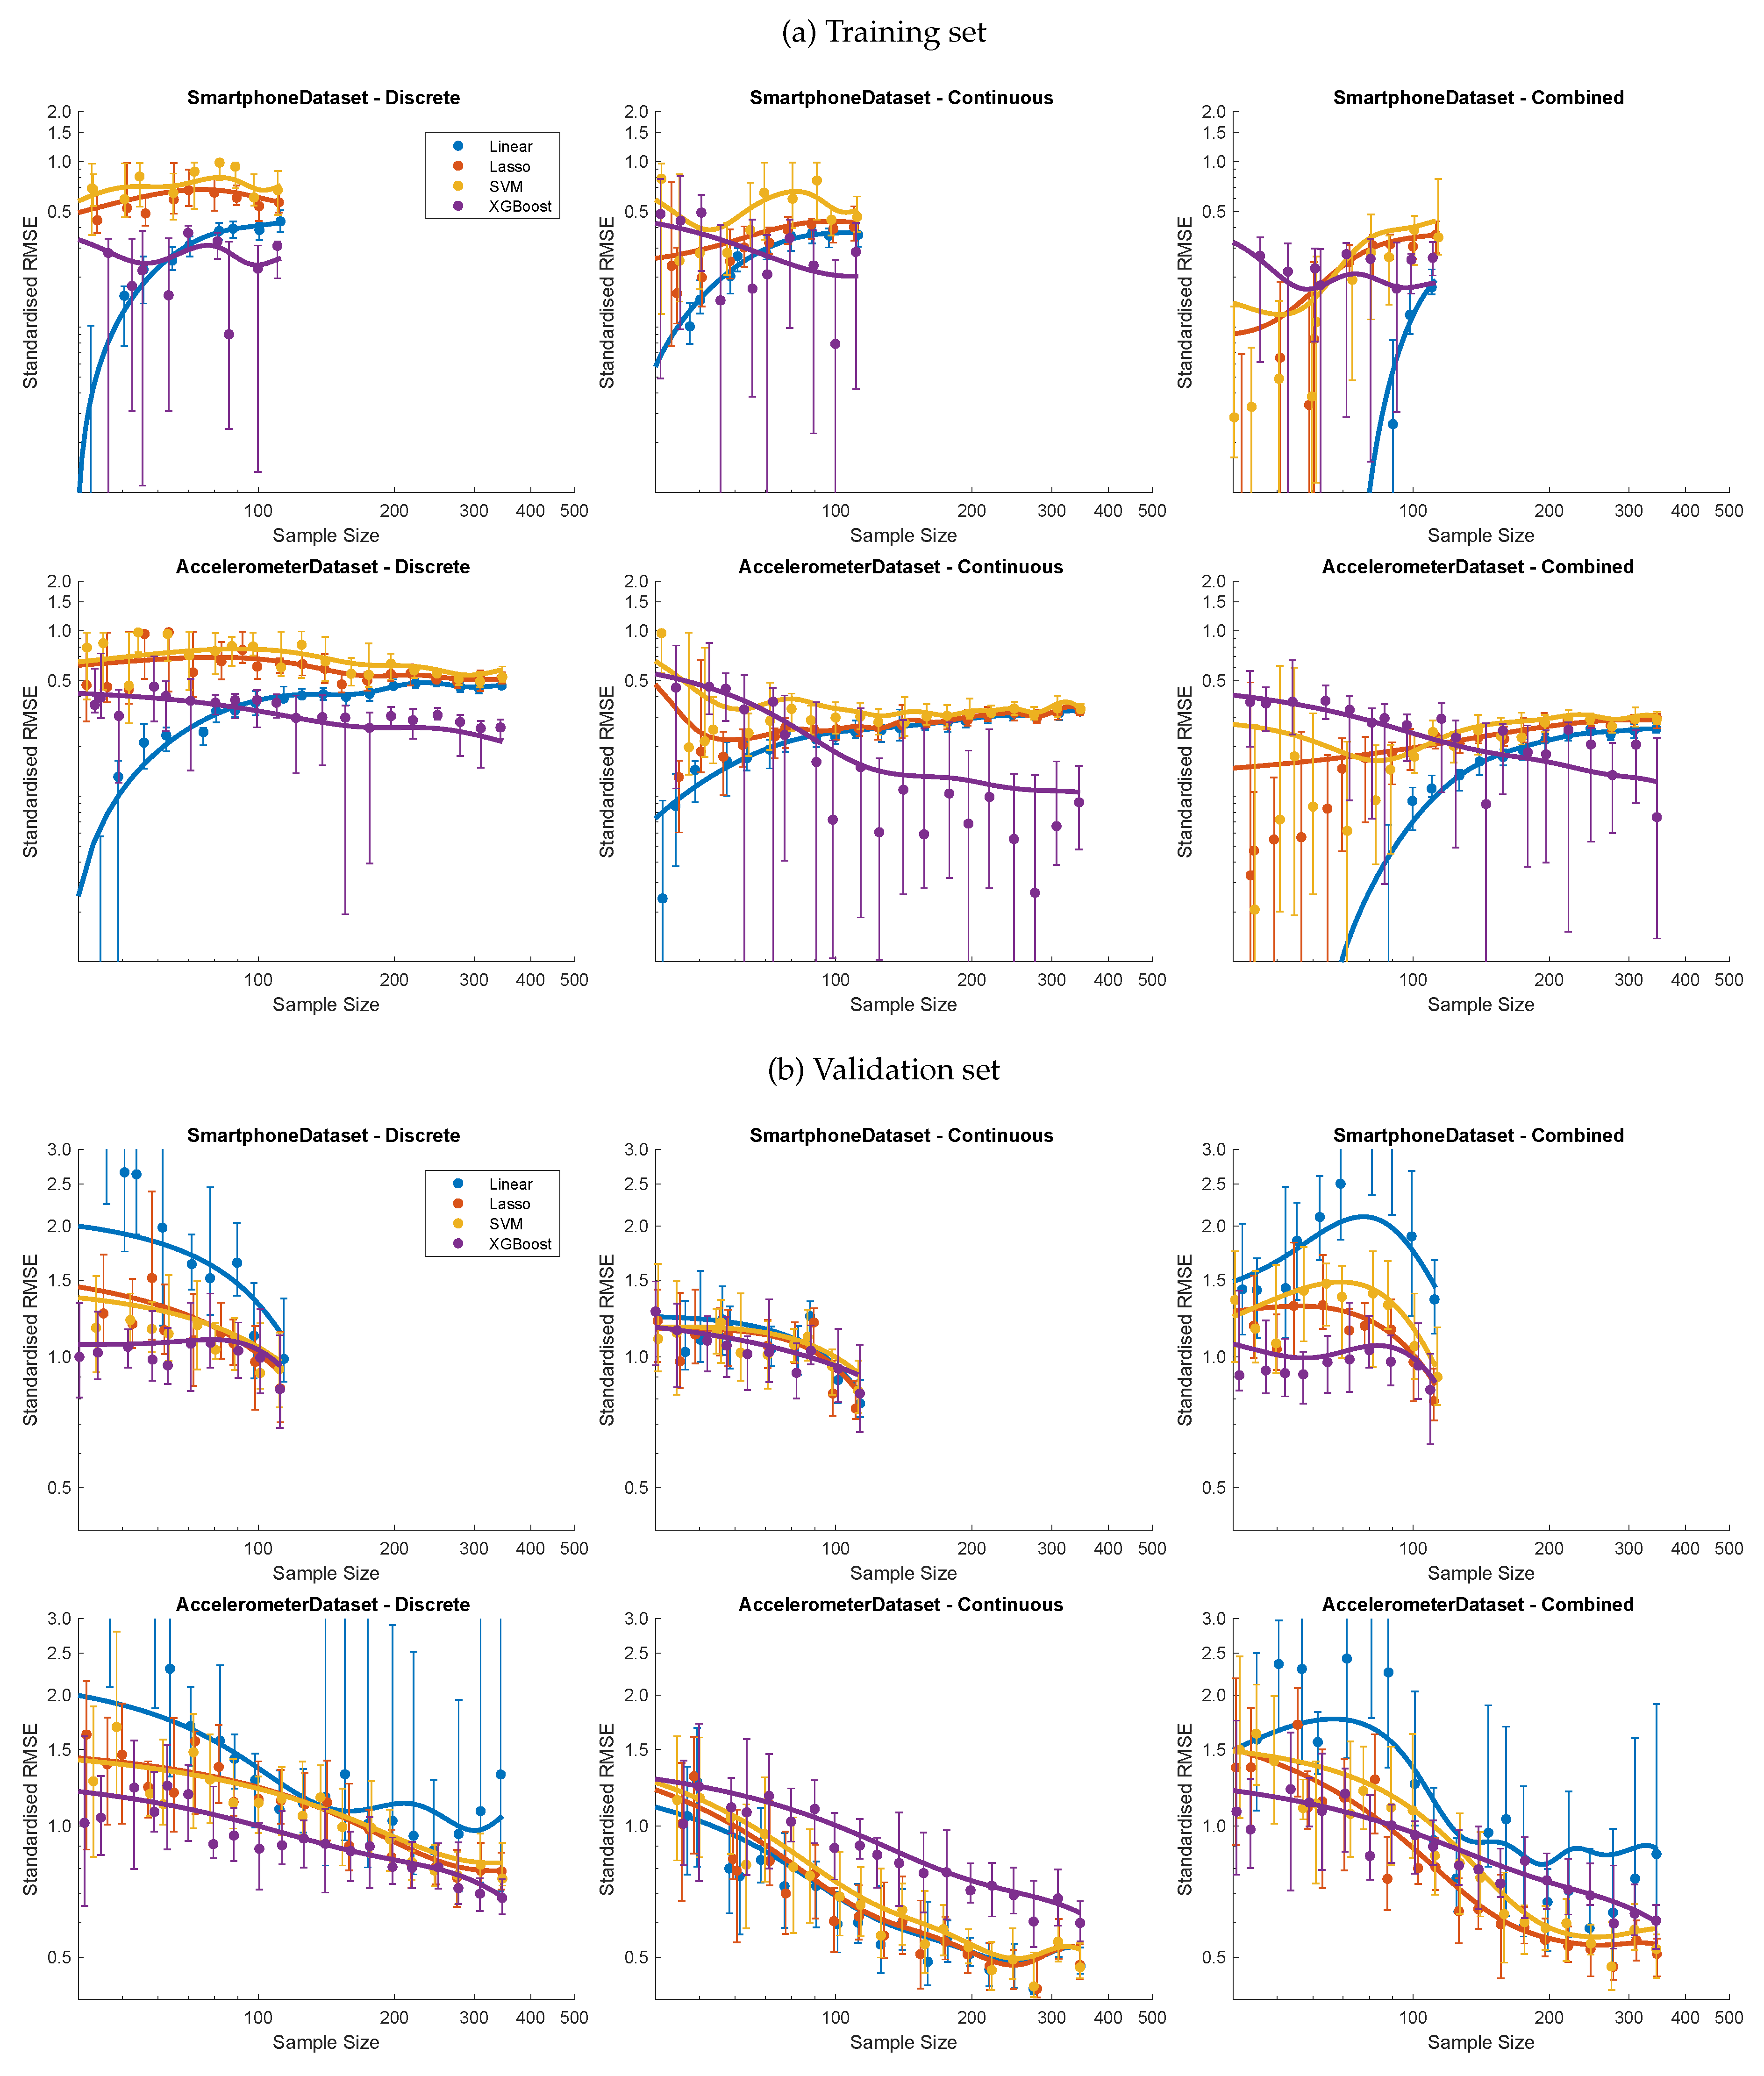
Figure 6.
Predictor selection for the combined feature set when restricting the models to 5, 10 or 15 features. (a) Probability of a feature being selected over 50 training samples ( 2-fold CV). (b) Mean absolute beta coefficients from when those features were selected. Note that the continuous predictors include VMD and FPC features.
Figure 6.
Predictor selection for the combined feature set when restricting the models to 5, 10 or 15 features. (a) Probability of a feature being selected over 50 training samples ( 2-fold CV). (b) Mean absolute beta coefficients from when those features were selected. Note that the continuous predictors include VMD and FPC features.
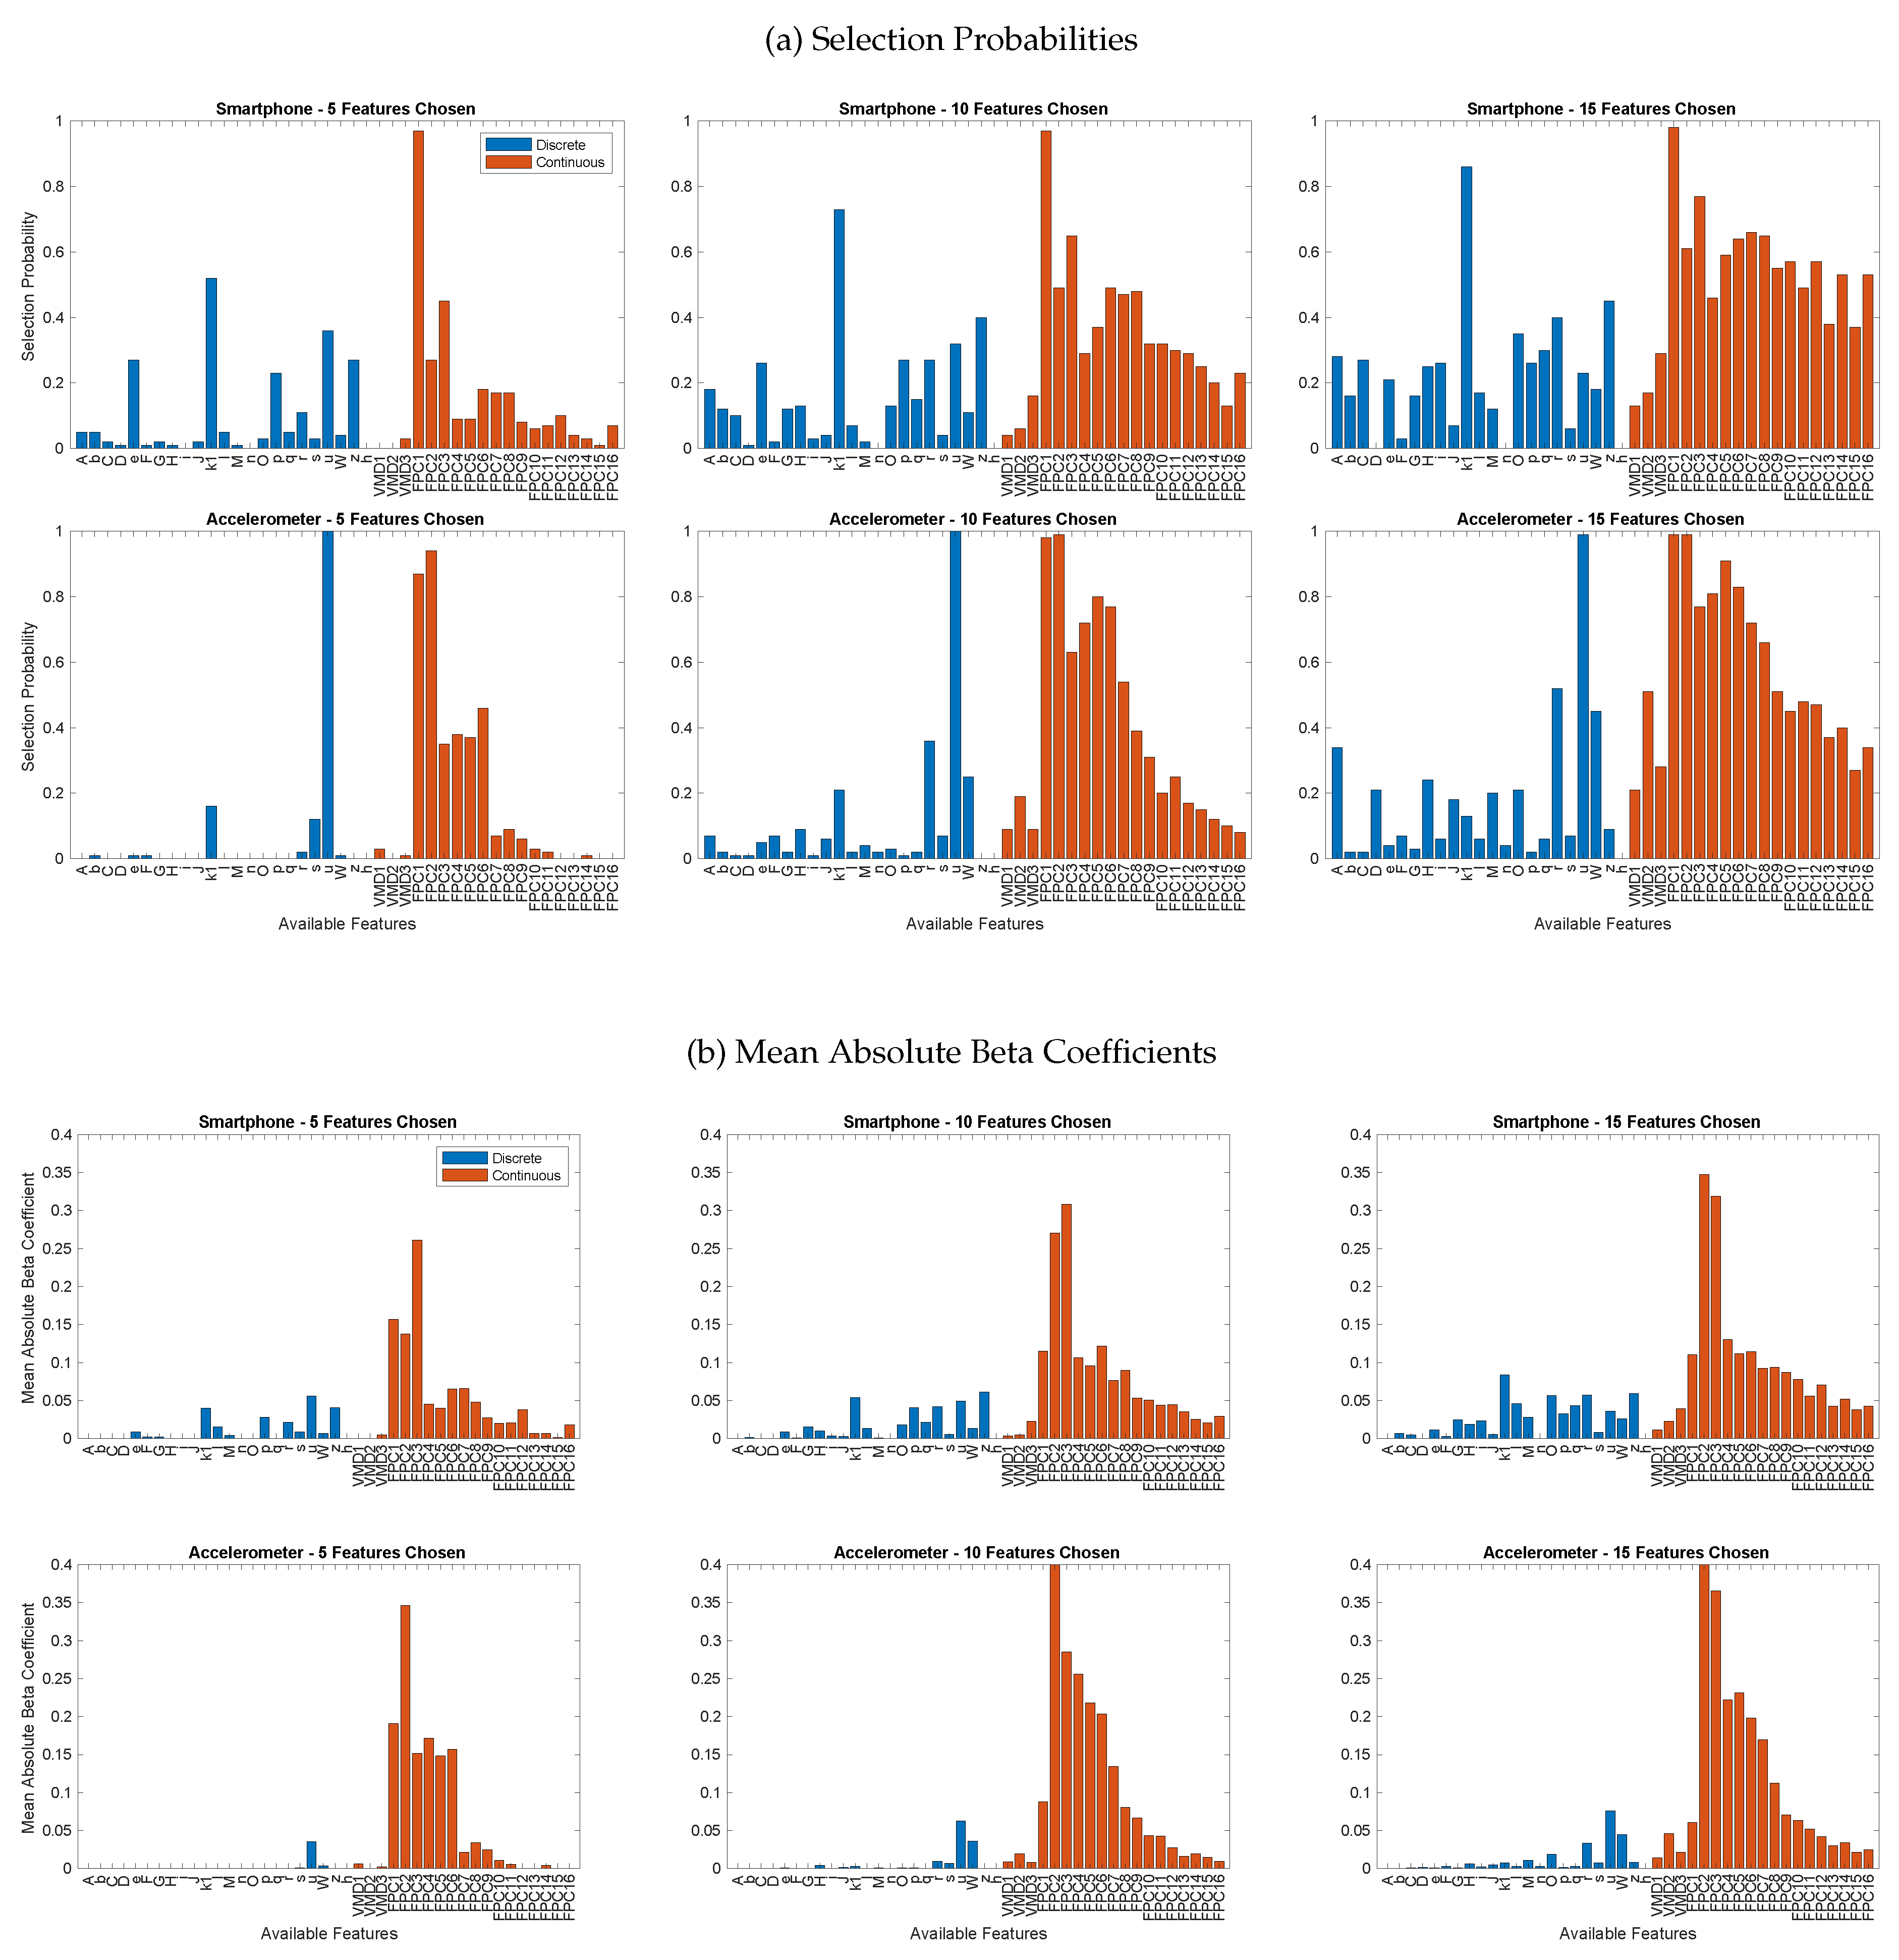
Table 1.
Experimental details of the two data collections used in this analysis.
| Smartphone [20] | Accelerometer [21] | |
|---|---|---|
| Participants | 22 males, 10 females | 48 males, 25 females * |
| Age (mean ± SD) | 26.5 ± 4.1 years | 21.6 ± 3.3 years |
| Height (mean ± SD) | 1.74 ± 0.08 m | 1.75 ± 0.10 m |
| Mass (mean ± SD) | 70.0 ± 10.9 kg | 71.2 ± 15.1 kg |
| Device | Redmi 9T phone | Trigno sensor |
| Manufacturer | Xiaomi Technology, Beijing, China | Delsys Inc., MA, USA |
| Sampling Frequency | 128 Hz | 250 Hz |
| Onboard Sensors | Accelerometer: ±8 g; | Accelerometer ±9 g |
| Gyroscope: ± 360 deg/s | ||
| Placement | Hand-held at sternum level | Taped to lower back (L4) |
| Reference force platform | Bertec | 9260AA |
| Manufacturer | AMTI, Watertown, MA, USA | Kistler, Winterthur, Switzerland |
| Sampling Frequency | 1000 Hz | 1000 Hz |
| Valid jumps included | 119 | 347 |
| Peak Power (W/kg)† | 40.7 ± 8.9 | 45.1 ± 7.6 |
| Signal for Analysis | Resultant Acceleration | Resultant Acceleration |
* The numbers of participants differ from those reported in the original study because we combined training and test datasets for this investigation. † Ground truth determined from vertical ground reaction force measured by a force plate.
Table 2.
Comparison of encoding methods for each training dataset based on the linear model’s statistics and associated metrics. Mean and SD compiled from 50 model fits (2-fold CV). Superior performance emboldened for each dataset. Note this is training, not validation performance.
Table 2.
Comparison of encoding methods for each training dataset based on the linear model’s statistics and associated metrics. Mean and SD compiled from 50 model fits (2-fold CV). Superior performance emboldened for each dataset. Note this is training, not validation performance.
| Dataset | Encoding | Standardised Training RMSE * | F-Statistic † | Explained Variance, | Shrinkage ‡ | Proportion Outliers a | Proportion Highly Correlated b |
|---|---|---|---|---|---|---|---|
| Smartphone | Discrete | 0.430 ± 0.062 | 8.34 ± 3.04 | 0.808 ± 0.055 | 0.108 ± 0.033 | 0.042 ± 0.018 | 0.827 ± 0.032 |
| Continter"uous | 0.392 ± 0.065 | 15.8 ± 6.3 | 0.840 ± 0.053 | 0.061 ± 0.021 | 0.054 ± 0.018 | 0.000 ± 0.000 | |
| Accelerometer | Discrete | 0.469 ± 0.041 | 24.3 ± 5.9 | 0.777 ± 0.039 | 0.034 ± 0.007 | 0.014 ± 0.015 | 0.831 ± 0.059 |
| Continuous | 0.343 ± 0.039 | 75.8 ± 18.3 | 0.880 ± 0.029 | 0.012 ± 0.003 | 0.052 ± 0.012 | 0.000 ± 0.000 |
* Standardised as z-scores for comparison between datasets. † Ratio of the model’s explained variance (allpredictors) to that of the null model (interceptonly), i.e. how well the model explains the data. ‡ Estimated reduction in explained variance if the model is applied to new data from the same population. a Proportion of observations considered outliers, as defined by Cook’s distance exceeding 4× training set’s mean distance. b Proportion of predictors with high multicollinearity, as defined by the Variance Inflation Factor,VIF > 10.
Disclaimer/Publisher’s Note: The statements, opinions and data contained in all publications are solely those of the individual author(s) and contributor(s) and not of MDPI and/or the editor(s). MDPI and/or the editor(s) disclaim responsibility for any injury to people or property resulting from any ideas, methods, instructions or products referred to in the content. |
© 2024 by the authors. Licensee MDPI, Basel, Switzerland. This article is an open access article distributed under the terms and conditions of the Creative Commons Attribution (CC BY) license (https://creativecommons.org/licenses/by/4.0/).
Copyright: This open access article is published under a Creative Commons CC BY 4.0 license, which permit the free download, distribution, and reuse, provided that the author and preprint are cited in any reuse.


