Submitted:
19 April 2024
Posted:
22 April 2024
You are already at the latest version
Preprints on COVID-19 and SARS-CoV-2
Abstract
Our aim is at three feels: i) study safe haven properties of sectoral CDS; ii) study hedging effectiveness and measure the diversification benefits of introducing them in both Conventional and Islamic stock markets portfolios and iii) compare these results with VSTOXX, Gold and Bitcoin indices. To do this, we estimate time varying hedge ratio using (A)DCC and GOGARCH models and then deduce hedging effectiveness.. We follow the same methodology for each sub-period and each refit to test the effect of bubble crypto currency and COVID-19 pandemic on hedging effectiveness. Empirical results show the superiority of industrial CDS sectoral index to hedge both conventional and Islamic stock markets whether long or short term despite that their performances were reduced slightly during the second and third periods. VSTOXX and Others sectoral CDS indices offers Hedging performances that are generally better than Bitcoin and gold.
Keywords:
Sectoral CDS
; Conventional and Islamic emerging stock market indices
; MGARCH
; Safe haven
; Hedging effectiveness
; bubble crypto currency
; COVID-19
1. Introduction
During pandemics, investors around the world have been in search of new alternative investment assets that can provide better portfolio diversification and reduce the downside risk. That being so, adding alternative investment instruments, acting as safe havens, into their portfolios and selecting the best effective hedging instruments is challenging and is not a trivial task, especially with the emergence of more and more frequent financial turmoil such as the bubble crypto currencies in 2017 and the COVID-19 pandemic.
In such a context, a growing number of studies have investigated the potential of inclusion of alternatives asset in the investment portfolio, such as gold (Baur & Lucey (2010); Beckmann et al. (2015); Akhtaruzzaman et al. (2021); Salisu et al. (2021); Yousaf et al. (2022); among others), bitcoin (Yang et al. (2022); Guesmi et al. (2019); Ji et al. (2020), Mroua et al. (2022), Mariana et al. (2021); among others), commodities (Domanski and Heath (2007); Erb and Harvey (2006); Silvennoinen and Throp (2013); Zghal et al. (2022) ; among others); Islamic indexes (Salisu and Sikiru (2020); Kenourgios et al. (2016); Yarovaya et al. (2021); among others); Credit Default Swaps (Zghal et al. (2018); Hachicha et al. (2021); among others) and Volatility index (Hood and Malik (2013); Zghal and Ghorbel (2020); Tarchella and Dhaoui (2021); Shahzad et al. (2022); ali et al. (2022); Nkhili et al. (2022); among others).
This paper is different from previous ones in several ways. To start with, the lack of studies that examine the hedging ability of ten alternative assets simultaneously, involving seven sectoral CDS indices, VSTOXX, Gold and Bitcoin, in emerging-country contexts. This choice is justified by the fact that these indices are generally used as potential hedging instruments for the Dow Jones Conventional and Islamic emerging market index.
Second, at the methodological level, prior studies have so far mostly used the BEKK (Baba et al. (1990)) model, the Dynamic Conditional Correlation (DCC) (Engle (2002)) model, or the VARMA-GARCH method (Ling and McAleer (2003)). However, these models have some limitations. BEKK model, for instance, as well as the VARMA-GARCH modeling-based estimations are too hard to implement even in the trivariate cases. It is owing mainly to the presence of a wide range of free parameters likely to bring about serious optimization problems once the likelihood function is flat. Similarly, the DCC model does not allow covering the asymmetric relationship linking the underlying assets since the relevant estimation is most often bound by the model specificity.
What is more, several studies apply the DCC-GARCH models in order to estimate optimal hedge ratios. That is why, we will compare the optimal hedge ratios via the ADCC-GARCH advanced by Cappiello et al. (2006), and through the GO-GARCH model invented by Van der Weide (2002). Subsequently, we will choose the suitable model so as to address the estimation imposed by the prevalence of multiple variables within a large dataset. This process will provide a rather thorough understanding of how the optimal hedge ratios varies across a wide range of multivariate GARCH specifications. Furthermore, the GARCH model selections are implemented in our context for constructing a one-period-ahead hedge ratio. This procedure differs from a large number of that of other studies, mainly those elaborated on applying the current hedge ratio as a proxy. Thus, the next period hedge ratio should be estimated. Indeed, the one-step-ahead optimal hedge ratios are constructed on the principle of using a rolling window analysis accounting for the data changing-variability nature.
Third, following Kroner and Sultan (1993), we compute optimal hedge ratios relevant to the Conventional and Islamic emerging market indices, by means of the conditional volatility estimates associated with the MGARCH models specifications (DCC, ADCC and GO-GARCH). Fourth, via applying the hedging effectiveness, we compare the model outputs. So that, we highlight the difference extents perceived in hedge ratio across GARCH models.
Finally, existing studies on alternative assets have not distinguished the benefits of CDS, VSTOXX, Gold and Bitcoin to investors in the EMERGC and EMERGI markets. Thus, we assess the conditional diversification benefits (CDB) of these alternatives assets following the method of Christoffersen et al. (2018). The CDB measure, which is defined in terms of expected shortfall for a given probability, allows for capturing the time variability in the diversifications benefits depending upon portfolio composition and probability levels under the bubble crypto currency and the COVID-19 pandemic periods.
In this context, we select three specific events that caused global uncertainty and thus posed global effects during our sample period. The first event is before bubble crypto currency. The second event is during bubble crypto currency and before COVID-19 period. Finally, the last event that during the COVID-19 period.
Our main results show that both Bitcoin and gold can be regarded as a weak safe haven asset in most cases. The most of CDS sectors serve as a strong safe haven for the EMERGI and EMERGC index. Moreover, the CDS-IND sector provide the highest hedging effectiveness with both Conventional and Islamic portfolios. Furthermore, CDS-IND delivers stronger and more stable diversification benefits, followed by CDS-Goods during the three periods under study.
Our empirical analysis is important for the decision making of market participants as it increases the current understanding of the similarities and dissimilarities of the roles of CDS, VSTOXX, gold and Bitcoin with respect to the Conventional and Islamic stock markets. Investors and portfolio managers could design better investment strategies by comparing these alternative assets for possible inclusion in the composition of their equity portfolios. Speculators could create spread trades with respect to market conditions. Our analysis is also useful to financial advisors who often seek unconventional assets that can provide protection for stock portfolios against downside risk, especially during stress periods, when protection is rewarding.
2. Literature Review
This present work relates to the literature that discusses the hedging role of various assets classes such as Gold, Bitcoin, CDS, VIX and VSTOXX against market downturns.
2.1. Hedging role of Gold and Bitcoin
Gold is widely regarded as a hedge and safe haven asset, as its value tends to rise when negative shocks affect markets. Previous studies examined the role of gold as hedge and safe haven. Indeed, Hillier et al. (2006) discover that precious metals, such as gold, exhibited hedging capability against stock-related risks.
What is more, Baur and Lucey (2010) analyze whether gold could act as a hedge, a diversifier or a safe haven for stocks and bonds. The authors found the first empirical evidence of gold being a hedge against stocks on average, and a safe haven in extreme stock market conditions. Baur and McDermott (2010) expand on these analyses by including multi-country analyses. They test the safe haven effect across a broad cross-section of world stock markets, and showed that gold was both a hedge and a strong safe haven for developed markets, but not for emerging markets such as the BRIC countries.
Hood and Malik (2013) find that gold is a hedge for the U.S. stock market, but its safe haven property is low relative to the volatility index. Lucey and Li (2015) study the role of precious metals as safe havens in a time varying framework and find that the strength of gold as a safe haven changes over time.
Moreover, Chkili (2016) estimate the dynamic correlations between gold and the stock market index in each BRICS member country and he concludes that gold is a strong safe haven for the financial assets studied. Similarly, Kang et al. (2016) explore the co-movement between stock market index, oil, and gold in BRICS countries. They conclude that gold can serve simultaneously as a hedging and a stabilizing instrument for the assets traded in the financial markets under review.
Chkili (2017) also investigates whether gold can be considered a hedge or a safe haven for Islamic stocks. The results reveal that gold can act as a safe haven against Islamic stock market risks in both stable and volatile periods. Additionally, Raza et al. (2019) document that gold and commodities futures are the best effective hedging instruments in US real estate investment in both the short and long run.
Akhtaruzzaman et al. (2021) examine the role of gold as a safe haven during the COVID-19 crisis. They found that during phase I (before March16, 2020) gold was a strong safe haven; however, its property has weakened during phase II (starting from March 17, 2020).
In addition, gold provides important hedging effectiveness against risks. Particularly, Salisu et al. (2021) shows that gold has a high hedging effect against oil price risk during the covid-19. Sikiru and Salisu (2021) find that gold offers the best hedge against the risk associated with the Asia-Pacific equities during the COVID-19 pandemic albeit with a lower hedging effectiveness during the pandemic.
Ali et al. (2021) examine the diversifying role of precious metals for Dow Jones Islamic (DJI) equity index portfolios. Therefore, dynamic conditional correlations between sample assets increase drastically; however, inclusion of gold in a portfolio with any of the DJI index decreases the downside risk of these portfolios, whereas other precious metals do not provide such benefit.
Despite the general reference of Bitcoin to digital gold, a growing number of studies focus on the studies on whether Bitcoin could act as a hedging instrument. In this regard, Dyhrberg (2016) shows that Bitcoin could be used as a hedge against the FTSE 100 index, and as a hedge against the US dollar in the short term.
Bouri et al. (2017a) examine the hedging ability of Bitcoin against global uncertainty. Their empirical results suggest that Bitcoins hedging properties vary between regions and investment horizons. Another study by Bouri et al. (2017b) study the relationship between Bitcoin and commodities. Their estimated results reveal that Bitcoin exhibits hedge and safe haven properties for the general commodity index and for the energy commodity index.
What is more, Mroua et al. (2022) investigate the potential portfolio diversification benefits by introducing the Bitcoin to the traditional diversified financial portfolio. Their findings indicate that the optimal portfolio diversification combining Bitcoin, US stock market and commodities indices can be a good hedge, offering risk-averse, more performing portfolio investments during any financial crisis.
Corbet et al. (2020), based on a sample of gold and crypto-currencies, find the evidence of a “flight to safety” during the COVID-19 pandemic period. Further, Conlon et al. (2020) explore evidence of safe-haven and flight-to-safety behavior in the cryptocurrency markets during the COVID-19 pandemic.
Additionally, some researchers have shifted to the safe haven properties of Bitcoin during the COVID-19 outbreak. Thereby, these studies have attempted to verify the superiority of the Bitcoin compared to gold in terms of portfolio diversification. Consequently, investors lean towards alternative assets such as Bitcoin to reduce the risk of their portfolios.
Therefore, several previous studies attempt to compare the role of gold and bitcoin can play as a hedge and safe haven for various commodity and financial assets. In this context, Popper (2015) argues that Bitcoin has many similarities as gold, in terms of its hedging capabilities and potential to act as a diversifier.
Furthermore, Klein et al. (2018) compare the volatility, correlation and portfolio performance of Bitcoin and gold. They conclude that the correlations of Bitcoin with the other markets are most of time opposite to those of gold. They also find that Bitcoin’s volatility dynamics share some aspects with gold but cannot serve as a safe haven during market downturn which represents the principal feature of gold. Finally, they affirm that Bitcoin cannot be considered as new gold.
Bouri et al. (2020) compare the safe-haven properties of Bitcoin, gold, and the commodity index against world, developed, emerging, USA, and Chinese stock market indices. They prove that the benefits of diversification vary in the time-frequency space, with Bitcoin exhibiting a superiority over both gold and commodities.
Mariana et al. (2021) suggest that Bitcoin exhibits short-term safe haven features before and during the pandemic despite the fact that it is more volatile than gold and S&P 500. Pho et al. (2021) reveal that the choice of the diversifier depends on the investor’s degree of risk aversion. More precisely, they conclude that for China, gold is a preferred portfolio diversifier than Bitcoin for risk-averse investors and vice versa for risk-seeking investors.
Tarchella and Dhaoui (2021) examine the hedging performance of alternative assets including some financial assets and commodities futures for the Chinese stock market in a multi-scale setting before and during the pandemic crisis. Their findings suggest that Bitcoin provides the best hedge to the Shanghai stock market. Whereas WTI offers the highest hedging effectiveness, Gold ranks second by a slight margin.
Chkili et al. (2021) examine the role of Bitcoin as a hedge and safe haven for Islamic stock markets in comparison with gold during the COVID19. Their empirical finding substantiate that Bitcoin qualifies as a safe haven against Islamic stock markets downturns. What is more, as regards the COVID-19 outbreak period, they find also that the hedging strategy involving Bitcoin leads to a higher cost during the crisis.
Chemkha et al. (2021) investigate the safe haven property of gold and Bitcoin The empirical results show the effectiveness of Bitcoin and gold as hedging assets in reducing the risk of international portfolios. Moreover, the analysis provides evidence that during the COVID-19 pandemic, gold is a weak safe haven for the considered assets, while Bitcoin cannot provide shelter due to its increased variability.
More recently, Yang et al. (2022) studies the connectedness, hedging and safe-haven properties of Bitcoin/gold/crude-oil/commodities against six currencies across multiple investment horizons, placing a particular focus on the performance of these assets during the recent COVID-19 outbreak. Their result prove that Bitcoin offers better hedging capability in the long term and commodities emerge as the most favorable option for the optimal portfolio of currency over all time horizons. Further analysis shows that assets are better at helping investments reduce risk in the initial stages of the pandemic, and gold is an effective and robust safe haven for currencies.
Yousaf et al. (2022) analyze the return and volatility transmission of oil-gold and oil-Bitcoin pairs during the pre-COVID-19 and COVID-19 periods. The results show that all hedge ratios are higher during the COVID-19 period, implying a higher hedging cost compared to the pre-COVID-19 period. Further, results reveal that gold is a strong safe haven and a hedge for the oil market, while Bitcoin serves as a diversifier for the oil market during the COVID-19 period.
Hedging Role of CDS and Volatility Indices
The CDS market’s unprecedented development highlighted its phenomenal efficacy as a tool for both hedging and speculating on credit risk.
In this regard, Calice et al. (2013) investigate that the CDS as a potential stock hedge, in which a single name corporate CDS data is applied as a sample representing the U.S context. The study concludes that an effective holding of basket of CDS helps greatly in reducing both of the default and capital associated risks. The authors have ultimately reached the conclusion that holding CDS without exposure to the actual reference entity (a naked CDS) constitutes a significant partial hedge against stocks, commodities, and foreign exchange investments. Ratner and Chiu (2013) highlight the potential safe haven characteristics of CDS against stock indices throughout the financial crisis period, as their level appeared to rise rapidly, while stocks lost value.
Moreover, Zghal et al. (2018) show that CDS indices can be considered hedging and safe haven instruments against the stock sectors’ fluctuations. Likewise, Hachicha et al. (2021) show that CDS indices are the best hedging instruments for both Islamic and conventional portfolios, as they have the highest hedging effectiveness.
In addition, several recent studies focusing on the effects of the COVID-19 pandemic on credit risk. Agca et al. (2022) show that the credit default swap (CDS) spreads of U.S. firms with supply chain partners in China increased when this supply chain link was disrupted following the imposition of lockdown restrictions.
Kwan and Mertens (2020) estimate the effects of COVID-19 on firms’ CDS spreads. They show that there has been a widening of CDS spreads in all sectors. Among investment-grade firms, those in the energy sector have experienced the greatest widening.
Daehler et al. (2020) adopt a two-stage econometric approach to explain the evolution of emerging market (EM) sovereign CDS spreads in the first half of 2020. They find that EM CDS spreads are not driven by COVID specific risk factors but rather by traditional determinants such as fiscal space, oil shocks, and monetary policies. This paper also focuses on the effects of COVID-19 on credit risk. In doing so, we examine the changes in sovereign CDS spreads that have occurred during the COVID-19 pandemic.
Moreover, the equity volatility derivatives are considered as natural diversifiers given the remarkable negative correlations they could display with stock market variables during crises. Indeed, Hood and Malik (2013) compare the VIX to oil, gold, other precious metals and other commodities. They provide evidence that VIX performs better and works as a superior hedge and a safe-haven asset for the US equity markets. Chen et al. (2011) explore the diversification benefits of volatility-related assets and conclude that the investment opportunities for investors increase with an addition of such assets in their portfolios.
Furthermore, several studies have highlighted the diversification benefits associated with investing in VIX or VSTOXX. In this respect, McFarren (2013) and Moran (2014) found that the diversification benefits of VIX for equity portfolios are short lived.
Fernandes et al. (2014) discover that the VIX proved to demonstrate better investment opportunities as a hedge to a portfolio compared to other derivatives, such as CDS and commodity futures. Ahmad et al. (2018) estimate the time-varying correlations between crude oil, US bonds, gold, VIX, OVX and European carbon prices to determine the most effective instrument for hedging clean energy related investment. They find that the VIX is the best asset for hedging and stabilization.
More recently, Tarchella and Dhaoui (2021) find that VIX has optimal diversification for Shanghai stock market in this pandemic period.
Shahzad et al. (2022) compare the weak/strong hedging abilities of three alternative assets (VIX, bitcoin and gold), against the downside movements in BRICS stock market indices. They find that VIX futures offer higher diversification benefits in Brazil, Russia, India and South Africa during the abrupt of the COVID-19 outbreak.
Ali et al. (2022) analyzes the conditional correlations and thereafter constructs the optimal portfolios for G-12 countries’ stock market returns and national benchmark bonds, crude oil, gold and the volatility index (VIX) returns. They highlight that the volatility index (VIX) generates the best effective hedge to stock returns for these markets. The risk and downside risk measures suggest that a sole stock exhibits the greatest risk and the expected maximum loss compared to a mixed bond-stock, a mixed VIX-stock, or a mixed gold-stock portfolio.
Therefore, several previous studies attempt to compare between VIX and CDS in terms of hedging capability. Indeed, Caporin (2013) makes a comparison between the VIX and the CDS indices as hedging instruments. He concludes that the CDS indices based hedging policy is more efficient than those based on the VIX. Moreover, Hkiri et al. (2018) examine the co-movement between US financial sector CDS spreads and global risk factors including the market volatility index (VIX), oil prices and interest rates. The authors show that VIX is one of the leading risk factor driving the evolution of financial sector CDS spreads, which is also contingent on the frequency.
Unlike this study, Zghal and Ghorbel (2020) highlight that VIX and sovereign CDSs are discovered to be apt to serve as a potentially robust hedging solution with respect to most of the studied stock market cases. The VIX index is considered as strong safe haven against Chinese stock market. Likewise, the sovereign CDS is considered as a strong safe haven against Japanese and Philippian stock markets. Noteworthy, however, is that the safe haven roles and diversifier properties associated with the CDS and VIX indices seem to depend heavily on data frequency and the models applied.
3. Methodology
In this study, we use the DCC model of Engle (2002), the ADCC model of Cappiello et al. (2006) and the GO-GARCH model of Van der Weide (2002) with the goal of modeling the volatility dynamics, conditional correlations, hedge ratios and hedging effectiveness between the equity of the Conventional (Islamic) stock markets and the sectoral’s CDS, VSTOXX, Gold and Bitcoin. Let be a vector of asset returns. An AR (1) process for conditional on the information set can be written as:
The residuals are modeled as:
where denote , and the conditional covariance matrix of and designates i.i.d random vector of errors.
3.1. DCC-GARCH Model
The Engle (2002) dynamic conditional correlation (DCC) model is estimated according to a two-step procedure. The first step concerns estimating the GARCH parameters, while the second step relates to estimating the conditional correlations which is as follows:
where represents the conditional correlation matrix, and is a diagonal matrix with time-varying standard deviations on the diagonal. Hence,
The expressions of are univariate GARCH. For the GARCH(1,1) model, the elements of can be rewritten in the following form:
and, the symmetric positive definite matrix of elements , could be explained as
represents the unconditional correlation matrix of the standardized residuals . Both parameters and are non-negative, and are related to the exponential smoothing process. These parameters are used to construct the dynamic conditional correlations. The DCC model is mean-reverting as long as . The correlation estimate becomes as follows :
3.2. ADCC-GARCH Model
Besides the DCC model, we also consider the asymmetric DCC (ADCC) specification of Cappiello et al. (2006) through build on the DCC model and the asymmetric GARCH model of Glosten et al. (1993) by introducing an asymmetric term, thus establishing the Asymmetric DCC (ADCC) model which is:
The indicator function if , and 0 otherwise. For this specification, a positive value of d implies that the negative residuals tend to increase the variance more than the positive ones. The asymmetric or “leverage” effect is intended to capture a characteristic qualifying financial assets, i.e., an unexpected drop in asset prices tends to increase volatility more than an unexpected increase in asset prices of the same magnitude would do. Hence, we denote that bad news tend to increase volatility more than good news. In the ADCC model case, the Q dynamics are represented by :
In the equation above, A, B and G refer to parameter matrices. are zero-threshold standardized errors, which are equal to when , and and equal to zero, otherwise. and are the unconditional matrices of and , respectively.
3.3. The GO-GARCH Model
The generalized orthogonal (GO)—GARCH model of Van der Weide (2002) specifies the returns as a function of the conditional mean () and an error term () in which the conditional mean may include an AR(1) term:
The GO-GARCH model maps on a set of unobservable independent factorsare:
In addition, the mixing matrix can be decomposed into an unconditional covariance matrix and an orthogonal (rotational) matrix, as follows:
In the mixing matrix , the rows represent the assets, and the columns refer to the factors :
The random variable presents the characteristics , and .The factor conditional variances can be modeled in terms of a GARCH process. The unconditional distribution of the factorssatisfies , and. Combining the equations (11), (12) and (14), so the equation becomes as:
The conditional covariance matrix of the returns is:
Hence, two key assumptions can be drawn from the GO-GARCH model. The first one is that is time invariant. The second one states thatcould represent a diagonal matrix. It is also important to note that the OGARCH modeling is achieved by restricting to be orthogonal. Originally, the GO-GARCH model, as initially advanced by Van der Weide (2002), is in the form of a one-step maximum likelihood approach, jointly estimating the rotation matrix and the dynamics. This model has been found out to be quite impractical in modeling multi-asset cases.
The matrix can also be estimated through the nonlinear least squares and method of moments (Boswijk and Van der Weide (2011)). More recently, however, it has been suggested that can be estimated by means of an independent component analysis (ICA) (Broda and Paolella (2009)), as adopted in our study context. Three asset-returns can actually help highlight the autocorrelation cases, especially volatility clustering and fat tails. This implies that an AR (1) mean equation for each GARCH model is imposed. That is way, we will use a multivariate Student t distribution for the DCC and ADCC models, and a Normal Inverse Gaussian (NIG) for the GO-GARCH model.
4. Data and Descriptive Statistics
We use daily data on the Dow Jones Conventional and Islamic emerging market indices (EMERG, EMERGI), seven sectoral CDS (Telecom, Industrial, Banks, Goods, Energy, Metals, Other Financial), the VSTOXX, Gold prices and Bitcoin. The analysis period runs from July 19, 2010 to October 10, 2021. The sample consists of 2929 daily observations.
The sample period is partitioned into three: i) Before bubble crypto currency (Period 1): from July 19, 2010 to December, 25, 2017; ii) During bubble crypto currency and before COVID-19 (Period 2): from December, 26, 2017 and December, 31, 2019 and iii) During COVID-19 (Period 3) from January, 1, 2020 to October, 16, 2021. These data were extracted from Datastream.
Table 1 highlights the persistence of negative means for both the CDS index returns of all sectors and the VSTOXX return. Bitcoin shows the highest average daily return (0.4558), and CDS Other Fin shows the lowest average return (-0.0551).
The entirety of the return series is discovered to be leptokurtic, characterized with a distribution asymmetrical in type, as skewness appears to be either positive or negative. Additionally, The Jarque-Berra test statistics are significant in all cases rejecting the null hypothesis of normality for all series. The augmented Dickey–Fuller (ADF) test shows that all return series are stationary.
This analysis is confirmed by examining the plots for raw return series for EMERGI, EMERGC, sectoral CDS indices, VSTOXX, Gold, and Bitcoin ( Figure 1).
We observe intense fluctuations in the returns of all assets under examination throughout the period. Interestingly, variations in prices and returns were even more pronounced during economic events such as the bubble crypto currency (period 2) and the COVID-19 outbreak (period 3). Figure 2 presents squared returns of indices over the three periods.
5. Empirical Results
The model primarily aims to estimate a selection of DCC model versions, each enclosing a constant in the mean equation, along with a GARCH (1,1) variance equation. Adjustments have been introduced to incorporate an AR (1) term in the mean equation and choice of distribution. Accordingly, the model selection criteria reveal that the DCC with an AR (1) term in the mean equation, estimated through a multivariate distribution, exhibits the most appropriately best-fit selection. The entire set of GARCH model selections (DCC, ADCC, GO-GARCH) has been subject to estimation with an AR (1) term in the mean equation. To account for non-normality in the distribution of returns, both DCC and ADCC modeling specifications have been estimated through a multivariate distribution. The GO-GARCH model, in which the multivariate t distribution is not an option, has been estimated through a multivariate affine negative inverse Gaussian (MANIG) distribution.
5.1. Dynamic Conditional Correlation
In this step, we use the rolling window analysis to construct one-step-ahead dynamic conditional correlations. The estimation window is set at 2929 observations, and a total number of 1000 one-step-ahead dynamic conditional correlations have been attained. We then refit each MGARCH models for every 20 and 60 daily observations. We aim to determine the right correlations and hedging strategies for different time horizons to these models (DCC, ADCC and GO-GARCH). Therefore, the objective consists to distinguish between short and long-run hedging of sectoral CDS, VSTOXX, Gold and Bitcoin in both Conventional and Islamic portfolios.
Figure 3. outlines the one-step-ahead dynamic conditional correlations between the DCC, ADCC and GO-GARCH model versions.
The DCC and ADCC models’ dynamic conditional correlations appear to have almost the same dynamics. Yet, the GO-GARCH model provides conditional correlations that differ noticeably from those obtained via both the DCC and ADCC models. Even though all the three correlation estimation modes increased by early 2020, the DCC model estimation helped in gradually weakening the correlations. Nevertheless, the GO-GARCH model-provided correlations remain fairly robust and reliable. These results are in line with those achieved by Ahmad et al. (2018), Basher and Sadorsky (2016) and Zghal et al. (2022). Overall, the dynamic correlations obtained via DCC and ADCC have the same patterns but are more volatile than those attained through the GO-GARCH model.
Touching the dynamic conditional correlations linking the Conventional (EMERGC) and Islamic (EMERGI) stock indices and five sectoral CDS (TEL, Banks, Goods, Energy Metals) and Gold, they appear to fluctuate between negative and positive values. During 2020, however, the correlation increased remarkably, in both the conventional and Islamic stock indices, and the MGARCH models estimated correlations recorded a significantly greater variability.
In addition, the dynamic conditional correlations for EMERGC/CDS-IND and EMERGC/VSTOXX, EMERGI/CDS-IND and EMERGI/VSTOXX are predominantly negative in terms of each estimation model. This empirical finding suggests that CDS IND and VSTOXX could be used as significant hedging instruments in both Conventional and Islamic portfolios. Further, the GO-GARCH model estimated correlation recorded the more negative values.
Moreover, the rolling-window correlation between Bitcoin and stock indices (both Conventional and Islamic) is positive for each MGARCH models. That being so, the Bitcoin can be applied as diversification instrument in both Conventional and Islamic portfolios.
Overall, both of the DCC and ADCC models maintained correlations appear to be closely similar, whereas the GO-GARCH model estimated correlations tend to display a different pattern. Furthermore, the three MGARCH models tended to increase over the year 2020, further intensified with the emergence of COVID-19 pandemic, even though the DCC model correlations seemed to weaken gradually while the GO-GARCH model maintained correlations proved to remain fairly strong. Table 2. sums up the various associations binding correlations.
For each correlation pair and for the conventional and Islamic equity indices, the DCC model-maintained dynamic conditional correlations prove to correlate remarkably high with those modeled via the ADCC. As for the DCC and GO-GARCH (or ADCC and GO-GARCH)-associated correlation pairs, the dynamic conditional correlations binding relationships tend to be considerably low regarding each single pair.
5.2. Diversifier, Hedge and Safe Haven Properties of Sectoral CDS, VSTOXX, Gold and Bitcoin
To examine CDS, VSTOXX, Gold and Bitcoin’s capabilities as a diversifier, hedge and safe haven against movements in EMERGC and EMERGI equity markets, we follow the method used by Baur and McDermott (2010). Following the ADCC-GARCH estimation, the pairwise dynamic conditional correlations between both Dow Jones Islamic and conventional emerging market indices stock markets and each of the alternative assets are extracted from Equation (17) into separate time series. are regressed on dummy variables (D):
where D represents the dummy variables helping to capture the extreme movements in the underlying stock sectors at the 10%, 5%, and 1% quantiles of the most negative stock returns.
In effect, the CDS, VSTOXX, gold and bitcoin would act as a weak hedge if is zero and as a strong hedge in case proves to be negative, thus, standing as significant for the individual sector. Still, CDS, VSTOXX, gold and bitcoin turn out to be a weak safe haven once the , , or coeffificients appear to be negative and non-significant and a strong safe haven in case they prove to be negative and significant. Accordingly, CDS, VSTOXX, gold and bitcoin should not represent a safe haven in case the , , or coeffificients turn out to be positive.
Equations (18, 19 and 20) show the model estimated to investigate the role of CDS, VSTOXX, Gold and bitcoin during the three periods events.
Following the estimation of the ADCC model, the dynamic conditional correlations is extracted from Eq. 17 into separate time series and then used to assess the hedge and safe haven properties of sectoral CDS, VSTOXX, Gold, and Bitcoin for Conventional and Islamic portfolios. Table 3 and Table 4 repot the coefficient estimates from the regression models specified in Eq. 18, 19 and 20. The estimated results on the role of sectoral CDS, VSTOXX, Gold and Bitcoin as a hedge and safe-haven for EMERGC stock return are reported in Table 3.
Table 3. highlights that the hedge parameter is negative and statistically significant, which indicates that sectoral CDS spreads and VSTOXX can be considered as a strong hedge for EMERGC index in all periods. In contrast, the positive and significant parameter indicate that gold and Bitcoin act only as an effective diversifier for EMERGC index.
Concerning the safe haven capability, the sectoral CDS spread, except for Banks and Goods sectors, can be regarded as a weak safe haven asset before bubble crypto currency. In contrast, it be considered as a strong safe haven for the EMERGC before COVID-19 period. Furthermore, CDS metals and VSTOXX being a strong safe haven for the EMERGC index during COVID-19 pandemic.
Moreover, gold and Bitcoin neither serve as a strong hedge nor strong safe haven, which implies that sectoral CDS and VSTOXX has a more preferable characteristic for EMERGC investors. These results are of interest to investors in terms of portfolio diversification and hedging strategies during a crisis.
These results corroborate those of Shahzad et al. (2019) that compare the safe haven property of Bitcoin and gold during extreme market conditions. They verify whether such property is similar or different for the two assets. Further, they conclude that both Bitcoin and gold can be regarded as a weak safe haven asset in most cases.
As shown in Table 4, the EMERGI index is found to be negatively and significantly correlated with the sectoral CDS indices and VSTOXX during the three periods under study. This result indicates that the both assets are a strong hedge for the emerging Islamic financial index. As such, it could be beneficial for investors with exposure to emerging Islamic countries to include sectoral CDS and VSTOXX in their equity portfolios for hedging purposes.
However, Gold and Bitcoin cannot be regarded as a hedge, as all the coefficients ( are positive and significant. This implies that gold and Bitcoin are only an effective diversifier for investors in the EMERGI market.
As for safe haven capability, we find evidence of Bitcoin being a strong safe haven for emerging Islamic financial indices, before bubble crypto currency, in 5% quantile. These findings suggest that investors react quite to shocks in the emerging Islamic countries.
In addition, before the COVID-19 period, CDS spreads for banks, goods, metals and other financial sectors and Bitcoin serve as a strong safe haven for the EMERGI index. That is, in times of extreme market turmoil and uncertainty, investors with exposure to the EMERGI sell stocks and buy CDS for the four sectors and Bitcoin. It is also worth noting that, sectoral CDS, VSTOXX, Gold and Bitcoin acted as a weak safe haven for EMERGI index during the COVID-19 period. Our results corroborate those of Conlon and McGee (2020) considering that Bitcoin does not act as a safe haven during time of crisis.
5.3. Hedging and Risk Management
The Conventional and Islamic stock-index return hedged by CDS, VSTOXX, Gold and Bitcoin can be reformulated as follows:
where is the return of the hedged portfolio at day t; denotes conventional or Islamic emerging stock market return at day t;represents the alternative asset return at day t (sectoral CDS, VSTOXX, Gold or Bitcoin); and is the hedge ratio. If the investor remains in the stock index position for long, the hedge ratio will be the number of alternative assets indices to be sold. Thus, the hedged portfolio variance, the conditional on the information set at time , will be:
Then, the optimal hedge ratios (OHRs) are , enabling to minimize the conditional variance of the hedged portfolio. The OHR, the conditional on the information set at , can be attained by considering the partial derivative of the variance, and by setting the expression to zero (Baillie and Myers (1991)) as follows:
The conditional volatility estimates of the GARCH model may construct the hedge ratios (Kroner and Sultan (1993)). Thus, a particular long position of an asset (e.g., asset i) can be hedged by a short position in a second asset (e.g., asset j). The optimal hedge ratio used to cover the stock market risk by alternative assets indices can be expressed as
where is the conditional variance of alternative asset returns, and denotes the conditional covariance between the Conventional and Islamic stock market indices and the sectoral CDS, VSTOXX, Gold and Bitcoin indices. The performance of different OHRs, attained via various GARCH model specifications, could be measured through the hedging effectiveness (HE) index (e.g., Chang et al. (2011); and Ku et al. (2007)):
where is the variance of unhedged portfolio, and is the variance of the optimal portfolio. Certainly, a higher HE index reflects a better hedging effectiveness level. What is more, the out-of-sample hedge ratios are constructed, using a rolling window analysis. At the time period t, we first forecast one-step-ahead conditional volatility, and then we use these forecasts to make one-step-ahead hedge ratios. We then use these forecasted hedge ratios to formulate our hedging strategies. We use a window of 1000 observations. For each new day, we forecast conditional variances and covariances introducing the more recently 1000 observations. We use two refits one of 20 days the other of 60 days to adjust MGARCH parameters estimates periodically. This will allow us to distinguish between hedging effectiveness at long and short terms. In totality, we obtain for each case, 1929 one-step-ahead hedge ratios
Accordingly, we notice that the GO-GARCH hedge ratios mostly exhibit greater variations, but there are some exceptions as in the case of EMERGC/Gold, EMERGC/Bitcoin and EMERGI/Gold. It is also noting that DCC hedge ratios are similar to ADCC model’s hedge ratios. Similarly, we find that time-varying hedge ratios can capture the significant events related to the global economic system viz., bubble crypto currency and COVID-19 pandemic. Table 5. displays the registered correlations between the inter-hedge ratios calculated from three versions of MGARCH models viz., DCC, ADCC and GO-GARCH.
We find that the hedge ratio obtained from DCC/ADCC models exhibit high correlation, indicating that the two models capture the properties of the data similarly.
In addition, the DCC/GO-GARCH hedge ratio correlations, in the EMERGC index, are considerably lower than ADCC and GO-GARCH for CDS of IND, banks, goods, other fin. and VSTOXX hedge ratios binding correlations. Further, hedge ratios calculated from DCC/GO-GARCH, in the EMERGI, are significantly lower than ADCC and GO-GARCH for CDS of TEL, IND, goods, energy and other fin sectors hedge ratios binding correlations.
Table 6, Table 7 and Table 8 report the summary statistics of hedge ratios and hedging effectiveness between the Dow Jones Islamic and conventional emerging market indices and the ten hedging instruments from three variants of MGARCH models and from model refits every 20 and 60 days and during the three periods under study.
Figure 4.
Rolling one-step ahead dynamic hedging ratios.
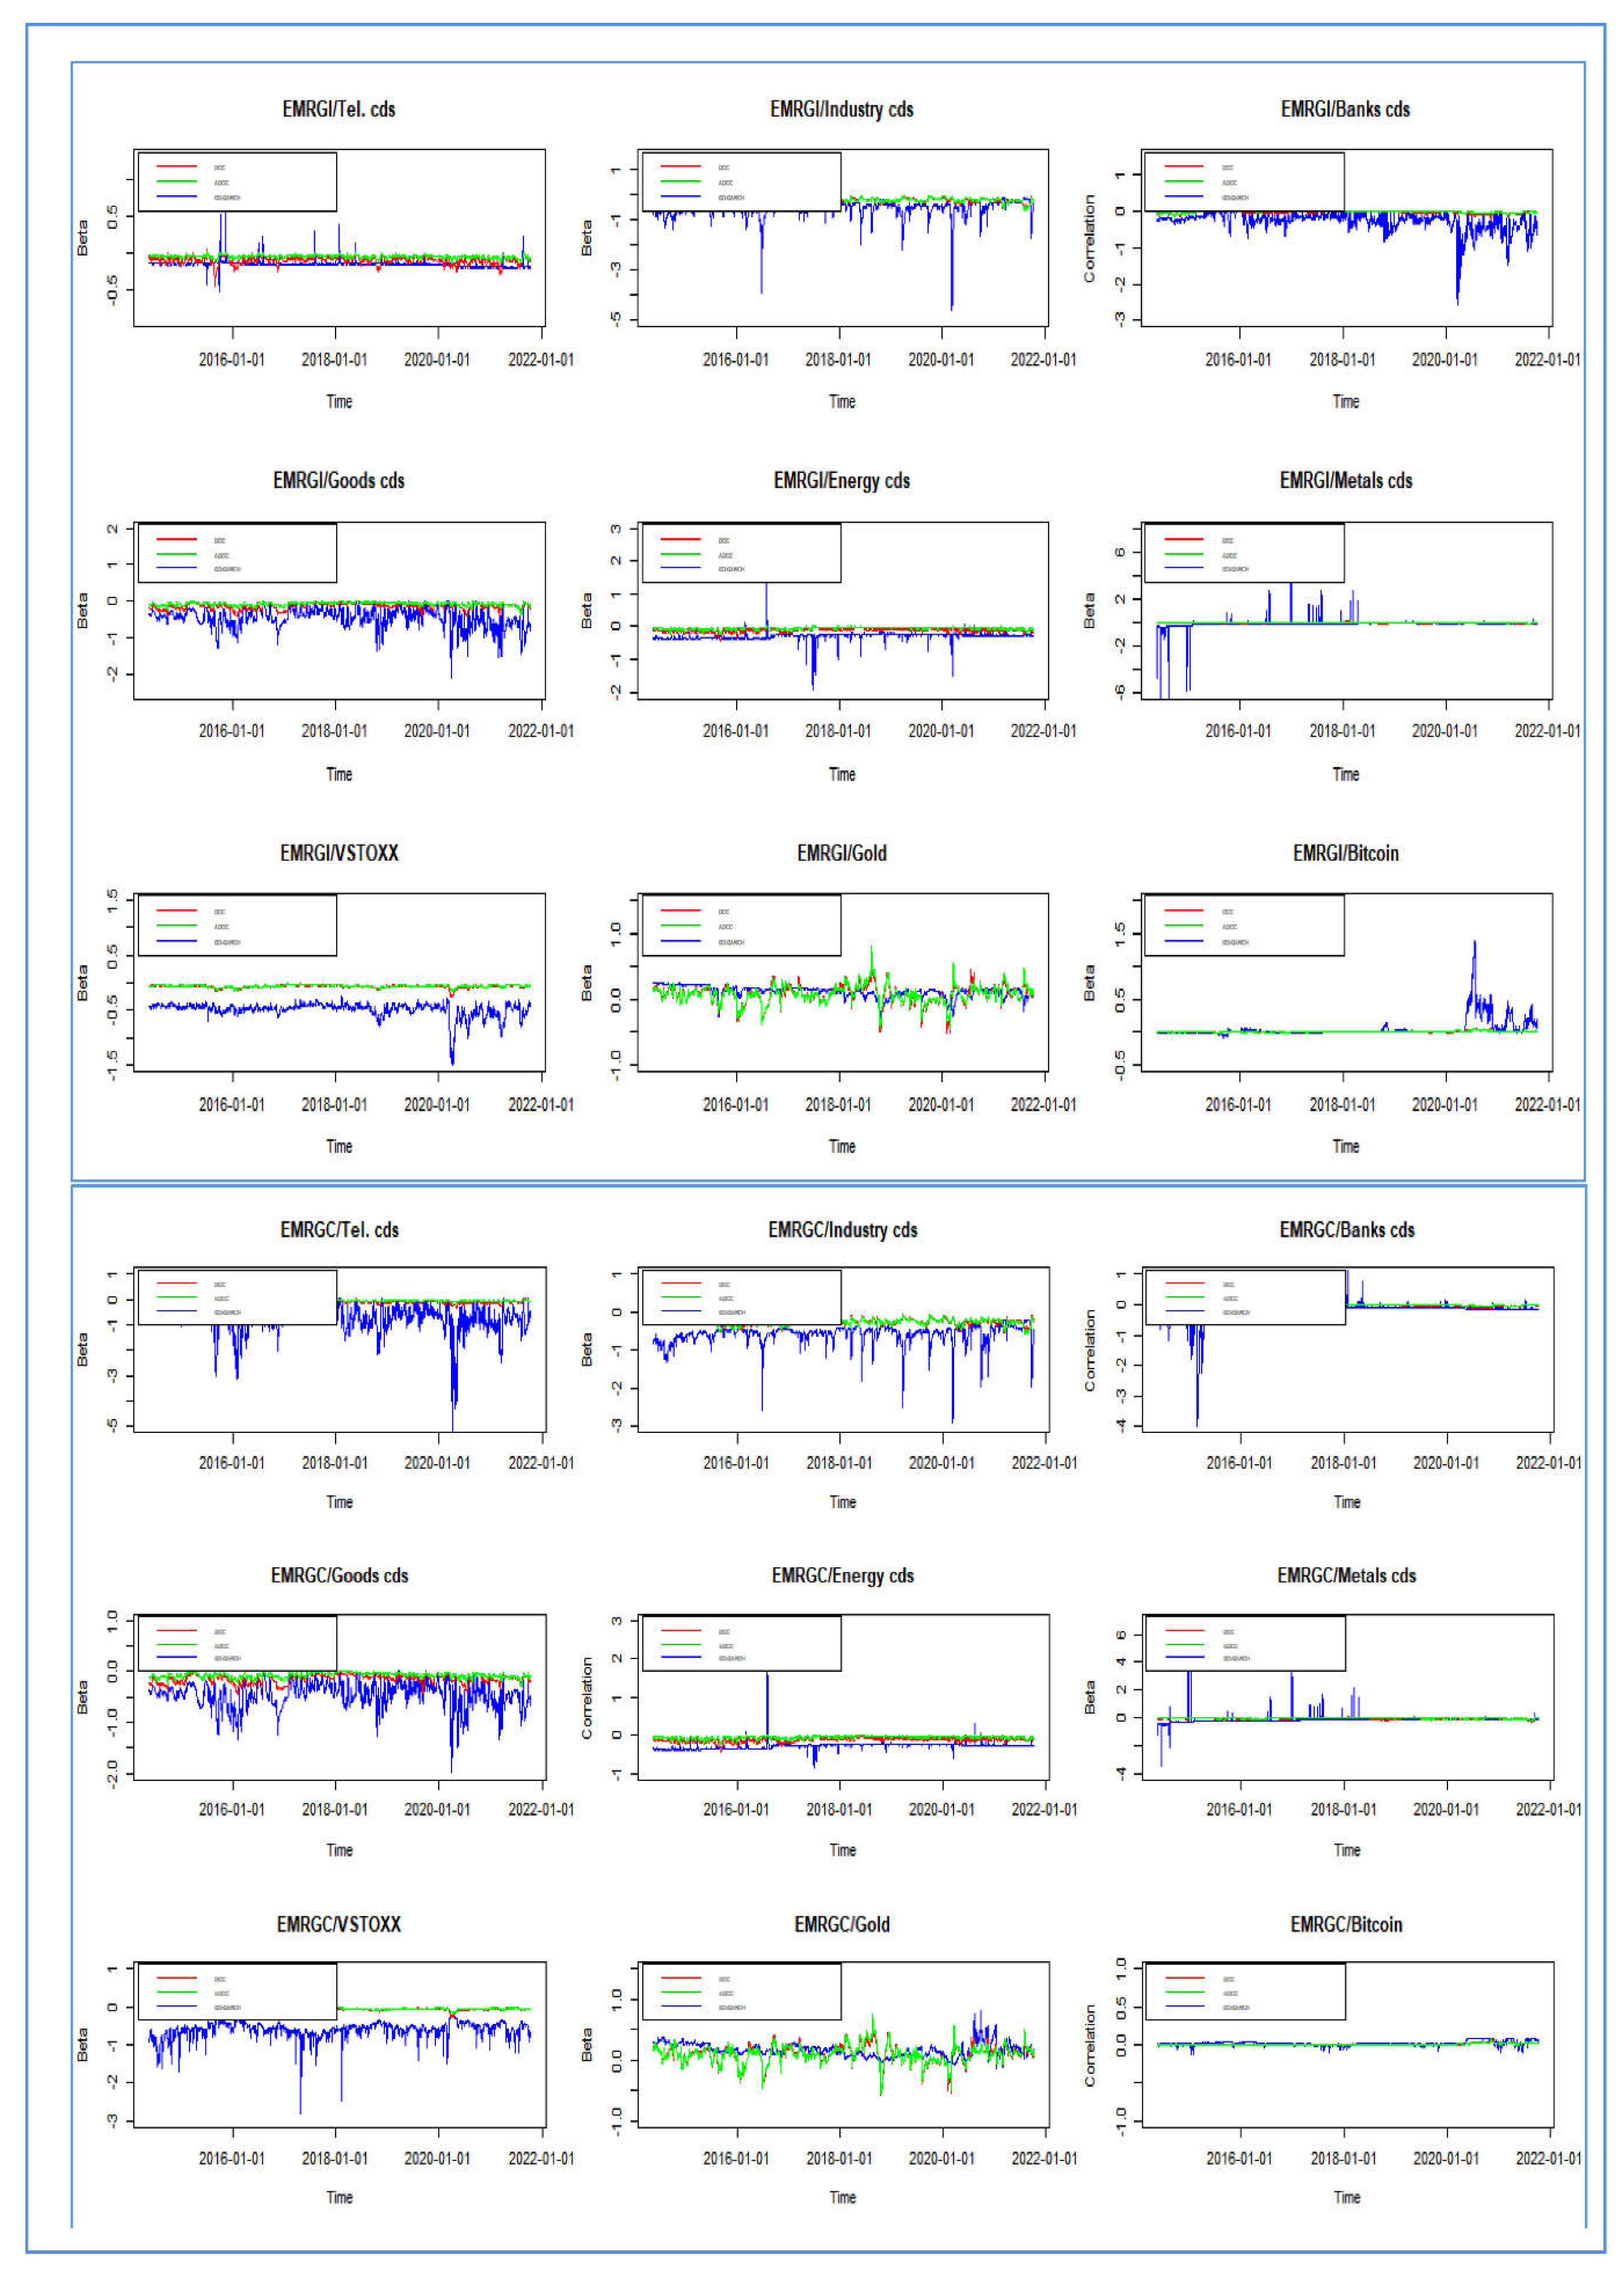
Table 6. displays the hedge ratios and hedging effectiveness obtained by using the DCC model. We use a rolling estimation procedure to estimate these parameters, and we choose two refits (20 and 60 days) to study the effectiveness of sectoral CDS, VSTOXX, Gold and Bitcoin to hedge Islamic and conventional stock markets in short and long-run horizons during the three periods.
For each alternative and refit, we find out that the hedge ratios and the hedge effectiveness values are fairly similar, across the two refits. In fact, the means for the hedge ratios are negative for all the alternative assets, except Gold and Bitcoin. That being so, the hedging benefits of EMERGC and EMERGI can be achieved by taking either short or long position for both considered assets (sectoral CDS and VSTOXX). This empirical result is in line with those achieved by Basher and Sadorsky (2016) and Raza et al. (2019).
However, the positive mean hedge-ratio pairs for EMERGC/Gold, EMERGI/Gold, followed by, EMERGC/Bitcoin and EMERGI/Bitcoin, during the three periods. This implies that hedging can be accomplished by taking a long position on the Islamic and Conventional stocks and a short position on the Gold and Bitcoin assets. Indeed, the hedging-ratio values of Gold are on average between 0.0812 and 0.1057 for EMERGC and between 0.0623 and 0.0944 for EMERGI. Therefore, according to the maximum HE criterion, the CDS IND sector yields the highest hedging effectiveness level (0.2827) for the EMERGC, followed by EMERGI (0.2625) during the first period under study and for the longest forecasts. The VSTOXX index ranks as the second instrument, providing the highest hedging effectiveness (0.2490) for EMERGC and (0.2312) for EMERGI stock market.
Additionally, for each period under study, we find that the hedge ratio and hedging effectiveness values are fairly similar across the different model refits.
Such finding has important implications for investors seeking to reduce risk in their Islamic and conventional portfolios. In this context, our results corroborate those of Hachicha et al. (2022) considering that opting for the industrial sector CDS index implies a rather beneficial portfolio-design objective.
Table 7 highlights the results of hedge ratio and hedging effectiveness values estimated with the ADCC model. Compared to Table 6., we find that the different hedging values acheived with the ADCC model are stastically similair to those calculated by the DCC model during the three periods. In fact, among the ten pairs, EMERGC/Gold, EMERGI/Gold, EMERGC/Bitcoin and EMERGI/Bitcoin exhibit positive average hedge ratio values. For instance, the mean value of the hedge ratio of EMERGC/Gold is 0.0777 (Table 7, period 1, refit=20). We interpret this value as a $1 long position in EMERGC can be hedged on average for 7.77 cents with a short position in Gold.
Moreover, the different hedging effectiveness values for both Islamic and Conventional stock market indices are very similair, regardless of which model is used (DCC or ADCC).
One could also conclude that both CDS-IND and VSTOXX keep the highest values during the first period. Hence, the hedging for both Islamic and conventional portfolios can be highly beneficial and profitable for investors by using industrial CDS and VSTOXX indices as alternative short/long position instruments.
Furthermore, the different hedge ratio and HE values are very similar, regardless of which period is studied (period 1, period 2 and period 3).
Table 8. depicts the result highlighting the optimal hedge ratios and the hedging effectiveness calculated from the estimates of GO-GARCH.
Generally, the GO-GARCH model records the highest values of hedge ratios and hedging effectiveness regarding the different periods and refits used in this study. Indeed, all of the alternative assets have the same sign of the average mean hedge ratios values (positive values for Gold and Bitcoin and negative values for all other indices)
However, both Islamic and conventional stock market indices differ with respect to the GO-GARCH model, comparing to the DCC and ADCC models. For instance, the hedging values of the pair EMERGC/ Bitcoin is 0.0204, 0.0199, 0.2916, respectively, for DCC, ADCC and GO-GARCH models.
Moreover, according to the maximum HE criterion, the industrial CDS sector yields the highest HE level (36.88%) for the shortest forecasts during the first period. Thus, the GO-GARCH model has been able to provide a rather effective hedging efficiency touching the EMERGC/CDS-IND case.
In this context, our results corroborate those of Zghal et al. (2022) considering that selecting for the GO-GARCH model maximizes the efficiency of the various hedging measures.
In addition, through the comparison both of the econometric models, statistical evidence proves to reveal well that, there is no difference in the DCC and ADCC models used in most of the observed cases. The investors in the EMERGC and EMERGI stock market have the same opportunity to hedge their portfolios due to these models by using sectoral CDS indices and VSTOXX. While, the GO-GARCH hedges mostly greater variation on the EMERGC and EMERGI stock markets.
5.4. Diversification Benefits
We assess the diversification benefits arising from combining both Dow Jones Islamic and conventional emerging stock indices and CDS, VSTOXX, gold and bitcoin via the CDB measure of Christoffersen et al. (2018), which is captured in terms of the expected shortfall for a probability q as follows:
where represents the weight of the asset (CDS, VSTOXX, gold and bitcoin) in the portfolio at time . The expected shortfall (ES) is given by:
where represents the inverse of the distribution function of asset at timeThe upper bound of the expected shortfall
where and show a cumulative distribution function with υ degrees of freedom and standard Student’s t density function, respectively. Table 9 presents the mean values and standard deviations of the CDB for time-varying portfolio weights.
The results show that the CDB is higher for EMERGC/IND-CDS portfolio (62.91%) during the first period, followed by CDS Goods (59.33%). For EMERGI, like the case of EMERGC, the CDB is higher for CDS-IND during the first period (61.53%). However, the CDB decrease during the second and third periods and the CDS-IND sector always record the highest values compared to the others alternatives assets. While the CDB results confirm that CDS-IND offers particular value to investors in Conventional and Islamic stock markets. In addition, the diversification benefits of Bitcoin are stable during the three periods. This result is in line with those of Chkili et al. (2021) highlighting that the diversification benefits of Bitcoin are most times stable during turbulent periods. Thereby, adding Bitcoin in a portfolio of Conventional or Islamic stocks reduce the risk of portfolio.
6. Conclusions
In this paper, we perform a comparative analysis of the potential roles of CDS, VSTOXX, Gold and Bitcoin for the Conventional and Islamic stock markets. As a starting point, we apply the approach of Baur and McDermott (2010) that covers the safe haven and hedge roles against stock market downturns. Then, we analyze the out-of-sample hedging effectiveness of CDS, VSTOXX, Gold and Bitcoin for both Conventional and Islamic portfolios, obtained from the DCC, ADCC and GO-GARCH models. We also assess the conditional diversification benefits for various portfolio compositions (Christoffersen et al. (2018)).
Our main results indicate that CDS, VSTOXX, Gold and Bitcoin exhibit large dissimilarities in their safe haven, hedging and diversifying abilities for the Conventional and Islamic stock markets. Gold and Bitcoin being a strong safe haven for emerging Islamic financial indices, before bubble crypto currency. Also, CDS metals and VSTOXX exhibit a strong safe haven for the EMERGC index during COVID-19 pandemic.
In terms of the hedging effectiveness, results show that CDS-IND is the most effective hedge for the Conventional and Islamic stock indices. What is more, the GO-GARCH model records the highest values of hedge ratios and hedging effectiveness regarding the different periods and refits used in this study. As regard to the conditional diversification benefits, CDS-IND offers higher benefits to investors in Conventional and Islamic stock markets.
Our empirical analysis is particularly important for investors and portfolio managers who could design better investment strategies by comparing CDS, VSTOXX, Gold and Bitcoin for possible inclusion in the composition of their Conventional and Islamic equity portfolios. Our findings are also useful to financial advisors who now have empirical evidence that industrial CDS sector’s hedging effectiveness and diversification benefits are much higher than other alternative assets.
References
- Agca, S., Babich, V., Birge, J. R., & Wu, J. (2022). Credit shock propagation along supply chains: Evidence from the CDS market. Management Science, 68(9), 6506-6538. [CrossRef]
- Ahmad, W., Sadorsky, P., & Sharma, A. (2018). Optimal hedge ratios for clean energy equities. Economic Modelling, 72, 278-295. [CrossRef]
- Akhtaruzzaman, M., Boubaker, S., Lucey, B. M., & Sensoy, A. (2021). Is gold a hedge or a safe-haven asset in the COVID–19 crisis?. Economic Modelling, 102, 105-588. [CrossRef]
- Ali, F., Jiang, Y., Sensoy, A. (2021). Downside risk in Dow Jones Islamic equity indices: Precious metals and portfolio diversification before and after the COVID-19 bear market. Research in International Business and Finance 58, 101-502. [CrossRef]
- Ali, S., Raza, N., Vo, X. V., & Le, V. (2022). Modelling the joint dynamics of financial assets using MGARCH family models: Insights into hedging and diversification strategies. Resources Policy, 78, 102-861. [CrossRef]
- Baba, Y., Engle, R., Kraft, D. and Kroner, K. (1990), Multivariate Simultaneous Generalized ARCH, Unpublished Manuscript, University of California, San Diego.
- Basher, S. A., & Sadorsky, P. (2016). Hedging emerging market stock prices with oil, gold, VIX, and bonds: A comparison between DCC, ADCC and GO-GARCH. Energy Economics, 54, 235-247. [CrossRef]
- Baur, D.G., Lucey, B.M. (2010). Is gold a hedge or a safe haven? An analysis of stocks, bonds and gold. Financial Review 45, 217-229. [CrossRef]
- Baur, D.G., McDermott, T.K. (2010). Is gold a safe haven? International evidence. Journal of Banking & Finance 34, 1886-1898. [CrossRef]
- Beckmann, J., Berger, T., & Czudaj, R. (2015). Does gold act as a hedge or a safe haven for stocks? A smooth transition approach. Economic Modelling, 48, 16-24. [CrossRef]
- Boswijk, H. P., & Van der Weide, R. (2011). Method of moments estimation of go-garch models. Journal of Econometrics, 163(1), 118-126.
- Bouri, E., Gupta, R., Tiwari, A.K., Roubaud, D. (2017a). Does Bitcoin hedge global uncertainty? Evidence from wavelet-based quantile-in-quantile regressions. Finance Research Letters 23, 87-95. [CrossRef]
- Bouri, E., Jalkh, N., Molnár, P., Roubaud, D. (2017b). Bitcoin for energy commodities before and after the December 2013 crash: diversifier, hedge or safe haven? Applied Economics 49, 5063-5073. [CrossRef]
- Bouri, E., Shahzad, S.J.H., Roubaud, D., Kristoufek, L., Lucey, B. (2020). Bitcoin, gold, and commodities as safe havens for stocks: New insight through wavelet analysis. The Quarterly Review of Economics and Finance 77, 156-164. [CrossRef]
- Broda, S. A., & Paolella, M. S. (2009). Chicago: A fast and accurate method for portfolio risk calculation. Journal of Financial Econometrics, 7(4), 412-436. [CrossRef]
- Calice, G., Chen, J., & Williams, J. (2013). Liquidity spillovers in sovereign bond and CDS markets: An analysis of the Eurozone sovereign debt crisis. Journal of Economic Behavior & Organization, 85, 122-143. [CrossRef]
- Caporin, M. (2013). Equity and CDS sector indices: Dynamic models and risk hedging. The North American Journal of Economics and Finance 25, 261-275. [CrossRef]
- Cappiello, L., Engle, R.F., Sheppard, K. (2006). Asymmetric dynamics in the correlations of global equity and bond returns. Journal of Financial econometrics 4, 537-572. [CrossRef]
- Chang, C. L., McAleer, M., & Tansuchat, R. (2011). Crude oil hedging strategies using dynamic multivariate GARCH. Energy Economics, 33(5), 912-923. [CrossRef]
- Chemkha, R., BenSaïda, A., Ghorbel, A., & Tayachi, T. (2021). Hedge and safe haven properties during COVID-19: Evidence from Bitcoin and gold. The Quarterly Review of Economics and Finance, 82, 71-85. [CrossRef]
- Chen, H. C., Chung, S. L., & Ho, K. Y. (2011). The diversification effects of volatility-related assets. Journal of Banking & Finance, 35(5), 1179-1189. [CrossRef]
- Chkili, W. (2016). Dynamic correlations and hedging effectiveness between gold and stock markets: Evidence for BRICS countries. Research in International Business and Finance, 38, 22-34. [CrossRef]
- Chkili, W. (2017). Is gold a hedge or safe haven for Islamic stock market movements? A Markov switching approach. Journal of Multinational Financial Management 42, 152-163. [CrossRef]
- Chkili, W. (2017). Is gold a hedge or safe haven for Islamic stock market movements? A Markov switching approach. Journal of Multinational Financial Management, 42, 152-163. [CrossRef]
- Chkili, W., Rejeb, A. B., & Arfaoui, M. (2021). Does bitcoin provide hedge to islamic stock markets for pre-and during COVID-19 outbreak? A comparative analysis with gold. Resources Policy, 74, 102-407. [CrossRef]
- Christoffersen, P., Goyenko, R., Jacobs, K., & Karoui, M. (2018). Illiquidity premia in the equity options market. The Review of Financial Studies, 31(3), 811-851. [CrossRef]
- Conlon, T., Corbet, S., & McGee, R. J. (2020). Are cryptocurrencies a safe haven for equity markets? An international perspective from the COVID-19 pandemic. Research in International Business and Finance, 54, 101248. [CrossRef]
- Conlon, T., McGee, R. (2020). Safe haven or risky hazard? Bitcoin during the COVID-19 bear market. Finance Research Letters 35, 101-607. [CrossRef]
- Corbet, S., Larkin, C., & Lucey, B. (2020). The contagion effects of the COVID-19 pandemic: Evidence from gold and cryptocurrencies. Finance Research Letters, 35, 101-554. [CrossRef]
- Daehler, T., Aizenman, J., & Jinjarak, Y. (2020). Emerging markets sovereign spreads and country-specific fundamentals during COVID-19. National Bureau of Economic Research.
- Domanski, D., & Heath, A. (2007). Financial investors and commodity markets. BIS quarterly review, March.
- Dyhrberg, A.H. (2016). Hedging capabilities of bitcoin. Is it the virtual gold? Finance Research Letters 16, 139-144.
- Engle, R. (2002). Dynamic conditional correlation: A simple class of multivariate generalized autoregressive conditional heteroskedasticity models. Journal of Business & Economic Statistics 20, 339-350.
- Erb, C. B., & Harvey, C. R. (2006). The strategic and tactical value of commodity futures. Financial Analysts Journal, 62(2), 69-97. [CrossRef]
- Fernandes, M., Medeiros, M.C., Scharth, M. (2014). Modeling and predicting the CBOE market volatility index. Journal of Banking & Finance 40, 1-10. [CrossRef]
- Glosten, L. R., Jagannathan, R., & Runkle, D. E. (1993). On the relation between the expected value and the volatility of the nominal excess return on stocks. The journal of finance, 48(5), 1779-1801.
- Guesmi, K., Saadi, S., Abid, I., & Ftiti, Z. (2019). Portfolio diversification with virtual currency: Evidence from bitcoin. International Review of Financial Analysis, 63, 431-437. [CrossRef]
- Hachicha, N., Ghorbel, A., Feki, M.C., Tahi, S., Dammak, F.A. (2021). Hedging Dow Jones Islamic and conventional emerging market indices with CDS, oil, gold and the VSTOXX: A comparison between DCC, ADCC and GO-GARCH models. Borsa Istanbul Review. [CrossRef]
- Hillier, D., Draper, P., Faff, R. (2006). Do precious metals shine? An investment perspective. Financial Analysts Journal 62, 98-106. [CrossRef]
- Hkiri, B., Hammoudeh, S., Aloui, C., Shahbaz, M. (2018). The interconnections between US financial CDS spreads and control variables: New evidence using partial and multivariate wavelet coherences. International Review of Economics & Finance 57, 237-257. [CrossRef]
- Hood, M., & Malik, F. (2013). Is gold the best hedge and a safe haven under changing stock market volatility?. Review of Financial Economics, 22(2), 47-52. [CrossRef]
- Ji, Q., Zhang, D., Zhao, Y. (2020). Searching for safe-haven assets during the COVID-19 pandemic. International Review of Financial Analysis 71, 101-526. [CrossRef]
- Kang, S.H., McIver, R., Yoon, S.-M. (2016). Modeling time-varying correlations in volatility between BRICS and commodity markets. Emerging Markets Finance and Trade 52, 1698-1723. [CrossRef]
- Kenourgios, D., Naifar, N., & Dimitriou, D. (2016). Islamic financial markets and global crises: Contagion or decoupling?. Economic Modelling, 57, 36-46. [CrossRef]
- Klein, T., Thu, H.P., Walther, T. (2018). Bitcoin is not the New Gold–A comparison of volatility, correlation, and portfolio performance. International Review of Financial Analysis 59, 105-116.
- Kroner, K. F., & Sultan, J. (1993). Time-varying distributions and dynamic hedging with foreign currency futures. Journal of financial and quantitative analysis, 28(4), 535-551. [CrossRef]
- Ku, Y. H. H., Chen, H. C., & Chen, K. H. (2007). On the application of the dynamic conditional correlation model in estimating optimal time-varying hedge ratios. Applied Economics Letters, 14(7), 503-509. [CrossRef]
- Kwan, S. H., & Mertens, T. M. (2020). Market assessment of COVID-19. FRBSF Economic Letter, 2020(14), 1-5.
- Ling, S., & McAleer, M. (2003). Asymptotic theory for a vector ARMA-GARCH model. Econometric theory, 19(2), 280-310. [CrossRef]
- Lucey, B. M., & Li, S. (2015). What precious metals act as safe havens, and when? Some US evidence. Applied Economics Letters, 22(1), 35-45. [CrossRef]
- Mariana, C.D., Ekaputra, I.A., Husodo, Z.A. (2021). Are Bitcoin and Ethereum safe-havens for stocks during the COVID-19 pandemic? Finance research letters 38, 101-798.
- McFarren, T. (2013). VIX your portfolio: selling volatility to improve performance. Blackrock Investment Insights 16, 1-21.
- Moran, M.T. (2014). Thirty Volatility Indexes: Worldwide tools to gauge sentiment and diversify portfolios. The Journal of Index Investing 4, 69-87.
- Mroua, M., Bahloul, S., & Naifar, N. (2022). Should investors include bitcoin in their portfolio? New evidence from a bootstrap-based stochastic dominance approach. Applied Economics Letters, 29(1), 53-62. [CrossRef]
- Nekhili, R., Sultan, J. (2022). Hedging bitcoin with conventional assets. Borsa Istanbul Review, 22(4), 641-652. [CrossRef]
- Pho, K. H., Ly, S., Lu, R., Van Hoang, T. H., & Wong, W. K. (2021). Is Bitcoin a better portfolio diversifier than gold? A copula and sectoral analysis for China. International Review of Financial Analysis, 74, 101-674. [CrossRef]
- Popper, N. (2015). Digital gold: The untold story of Bitcoin. Penguin UK.
- Ratner, M., & Chiu, C. C. J. (2013). Hedging stock sector risk with credit default swaps. International Review of Financial Analysis, 30, 18-25. [CrossRef]
- Raza, N., Ali, S., Shahzad, S. J. H., Rehman, M. U., & Salman, A. (2019). Can alternative hedging assets add value to Islamic-conventional portfolio mix: Evidence from MGARCH models. Resources Policy, 61, 210-230. [CrossRef]
- Salisu, A.A., Sikiru, A.A. (2020). Pandemics and the Asia-Pacific islamic stocks. Asian Economics Letters 1, 17413. [CrossRef]
- Salisu, A.A., Vo, X.V., Lawal, A. (2021). Hedging oil price risk with gold during COVID-19 pandemic. Resources Policy 70, 101-897. [CrossRef]
- Shahzad, S. J. H., Bouri, E., Rehman, M. U., Roubaud, D. (2022). The hedge asset for BRICS stock markets: Bitcoin, gold or VIX. The World Economy, 45(1), 292-316. [CrossRef]
- Shahzad, S.J.H., Bouri, E., Roubaud, D., Kristoufek, L., Lucey, B. (2019). Is Bitcoin a better safe-haven investment than gold and commodities? International Review of Financial Analysis 63, 322-330.
- Sikiru, A.A., Salisu, A.A. (2021). Hedging with financial innovations in the Asia-Pacific markets during the COVID-19 pandemic: the role of precious metals. Quantitative Finance and Economics 5, 352-372. [CrossRef]
- Silvennoinen, A., & Thorp, S. (2013). Financialization, crisis and commodity correlation dynamics. Journal of International Financial Markets, Institutions and Money, 24, 42-65.
- Tarchella, S., Dhaoui, A. (2021). Chinese jigsaw: Solving the equity market response to the COVID-19 crisis: Do alternative asset provide effective hedging performance?. Research in International Business and Finance, 58, 101-499. [CrossRef]
- Van der Weide, R. (2002). GO--GARCH: a multivariate generalized orthogonal GARCH model. Journal of Applied Econometrics 17, 549-564.
- Yang, C., Wang, X., Gao, W. (2022). Is Bitcoin a better hedging and safe-haven investment than traditional assets against currencies? Evidence from the time-frequency domain approach. The North American Journal of Economics and Finance, 62, 101-747. [CrossRef]
- Yarovaya, L., Elsayed, A. H., & Hammoudeh, S. (2021). Determinants of spillovers between Islamic and conventional financial markets: exploring the safe haven assets during the COVID-19 pandemic. Finance Research Letters, 43, 101-979. [CrossRef]
- Yousaf, I., Ali, S., Bouri, E., Saeed, T. (2022). Information transmission and hedging effectiveness for the pairs crude oil-gold and crude oil-Bitcoin during the COVID-19 outbreak. Economic Research-Ekonomska Istraživanja, 35(1), 1913-1934. [CrossRef]
- Zghal, R., Ghorbel, A. (2020). Bitcoin, VIX futures and CDS: a triangle for hedging the international equity portfolios. International Journal of Emerging Markets. [CrossRef]
- Zghal, R., Ghorbel, A., Triki, M. (2018). Dynamic model for hedging of the European stock sector with credit default swaps and EURO STOXX 50 volatility index futures. Borsa Istanbul Review 18, 312-328. [CrossRef]
- Zghal, R., Melki, A., Ghorbel, A. (2022). Do commodities hedge regional stock markets at the same effectiveness level? Evidence from MGARCH models. International Journal of Emerging Markets, (ahead-of-print). [CrossRef]
- Baillie, R. T., & Myers, R. J. (1991). Bivariate GARCH estimation of the optimal commodity futures hedge. Journal of Applied Econometrics, 6(2), 109-124. [CrossRef]
Figure 1.
Daily raw returns.
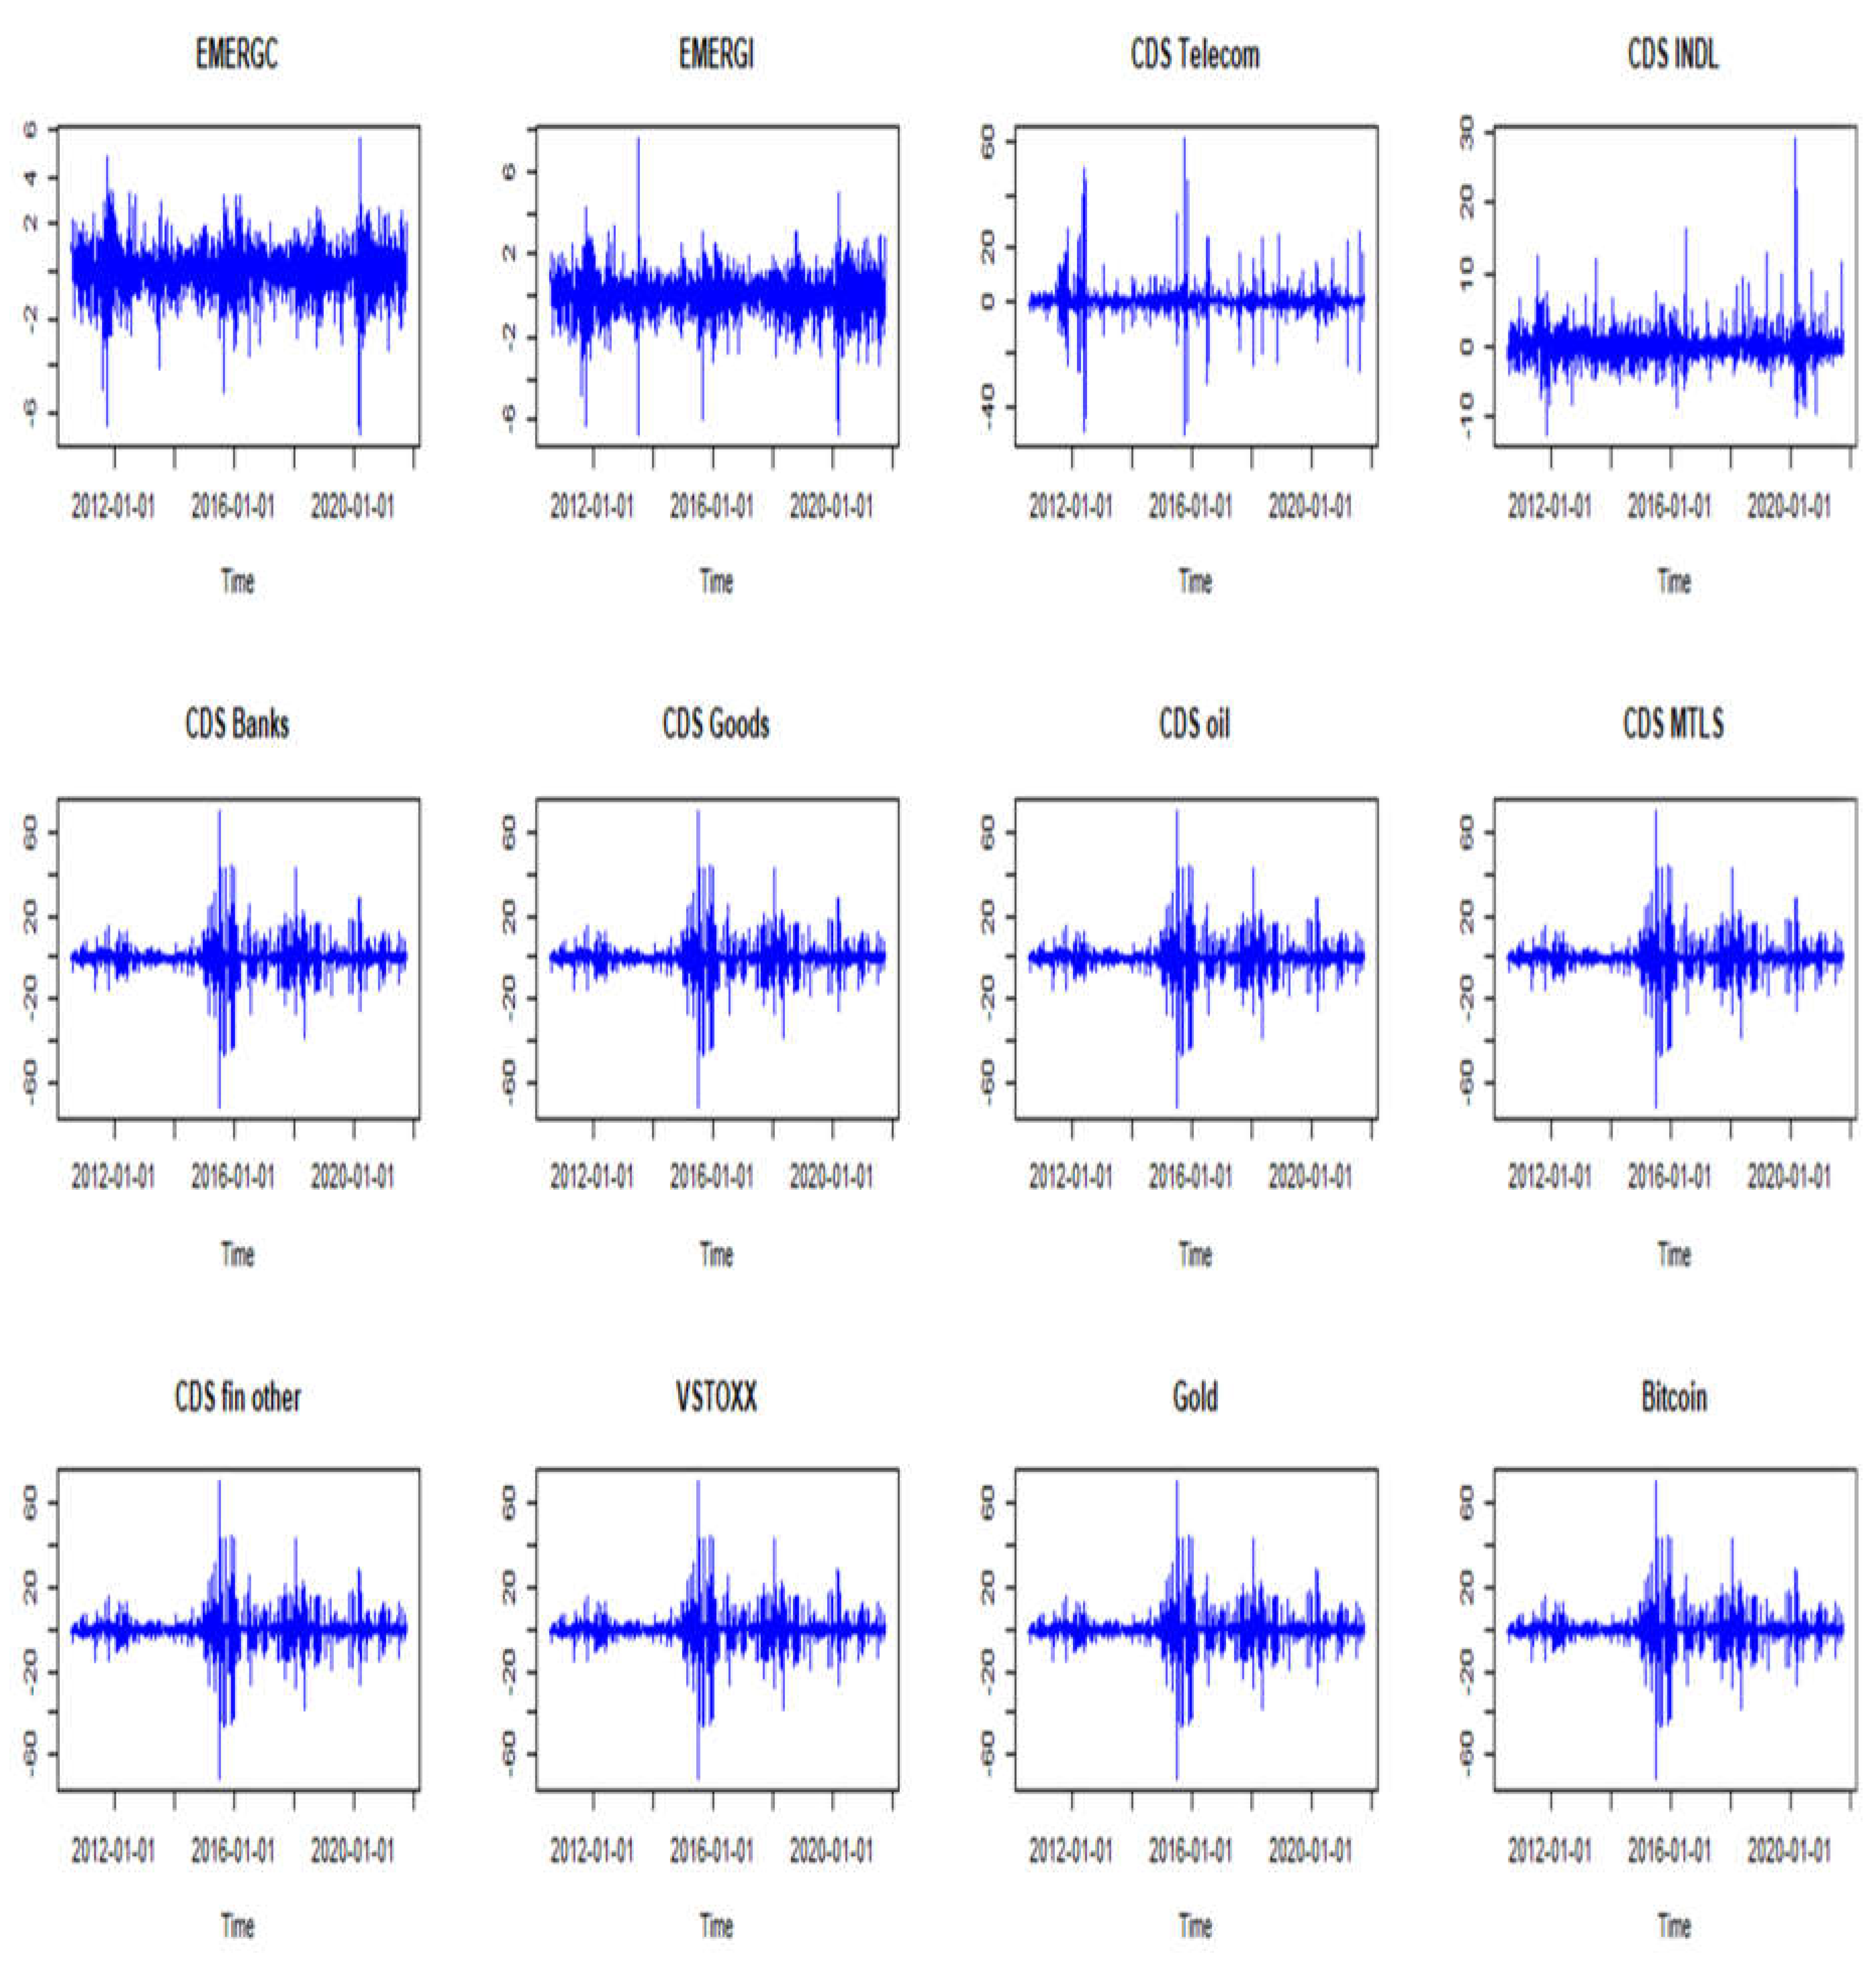
Figure 2.
Daily Squared returns.
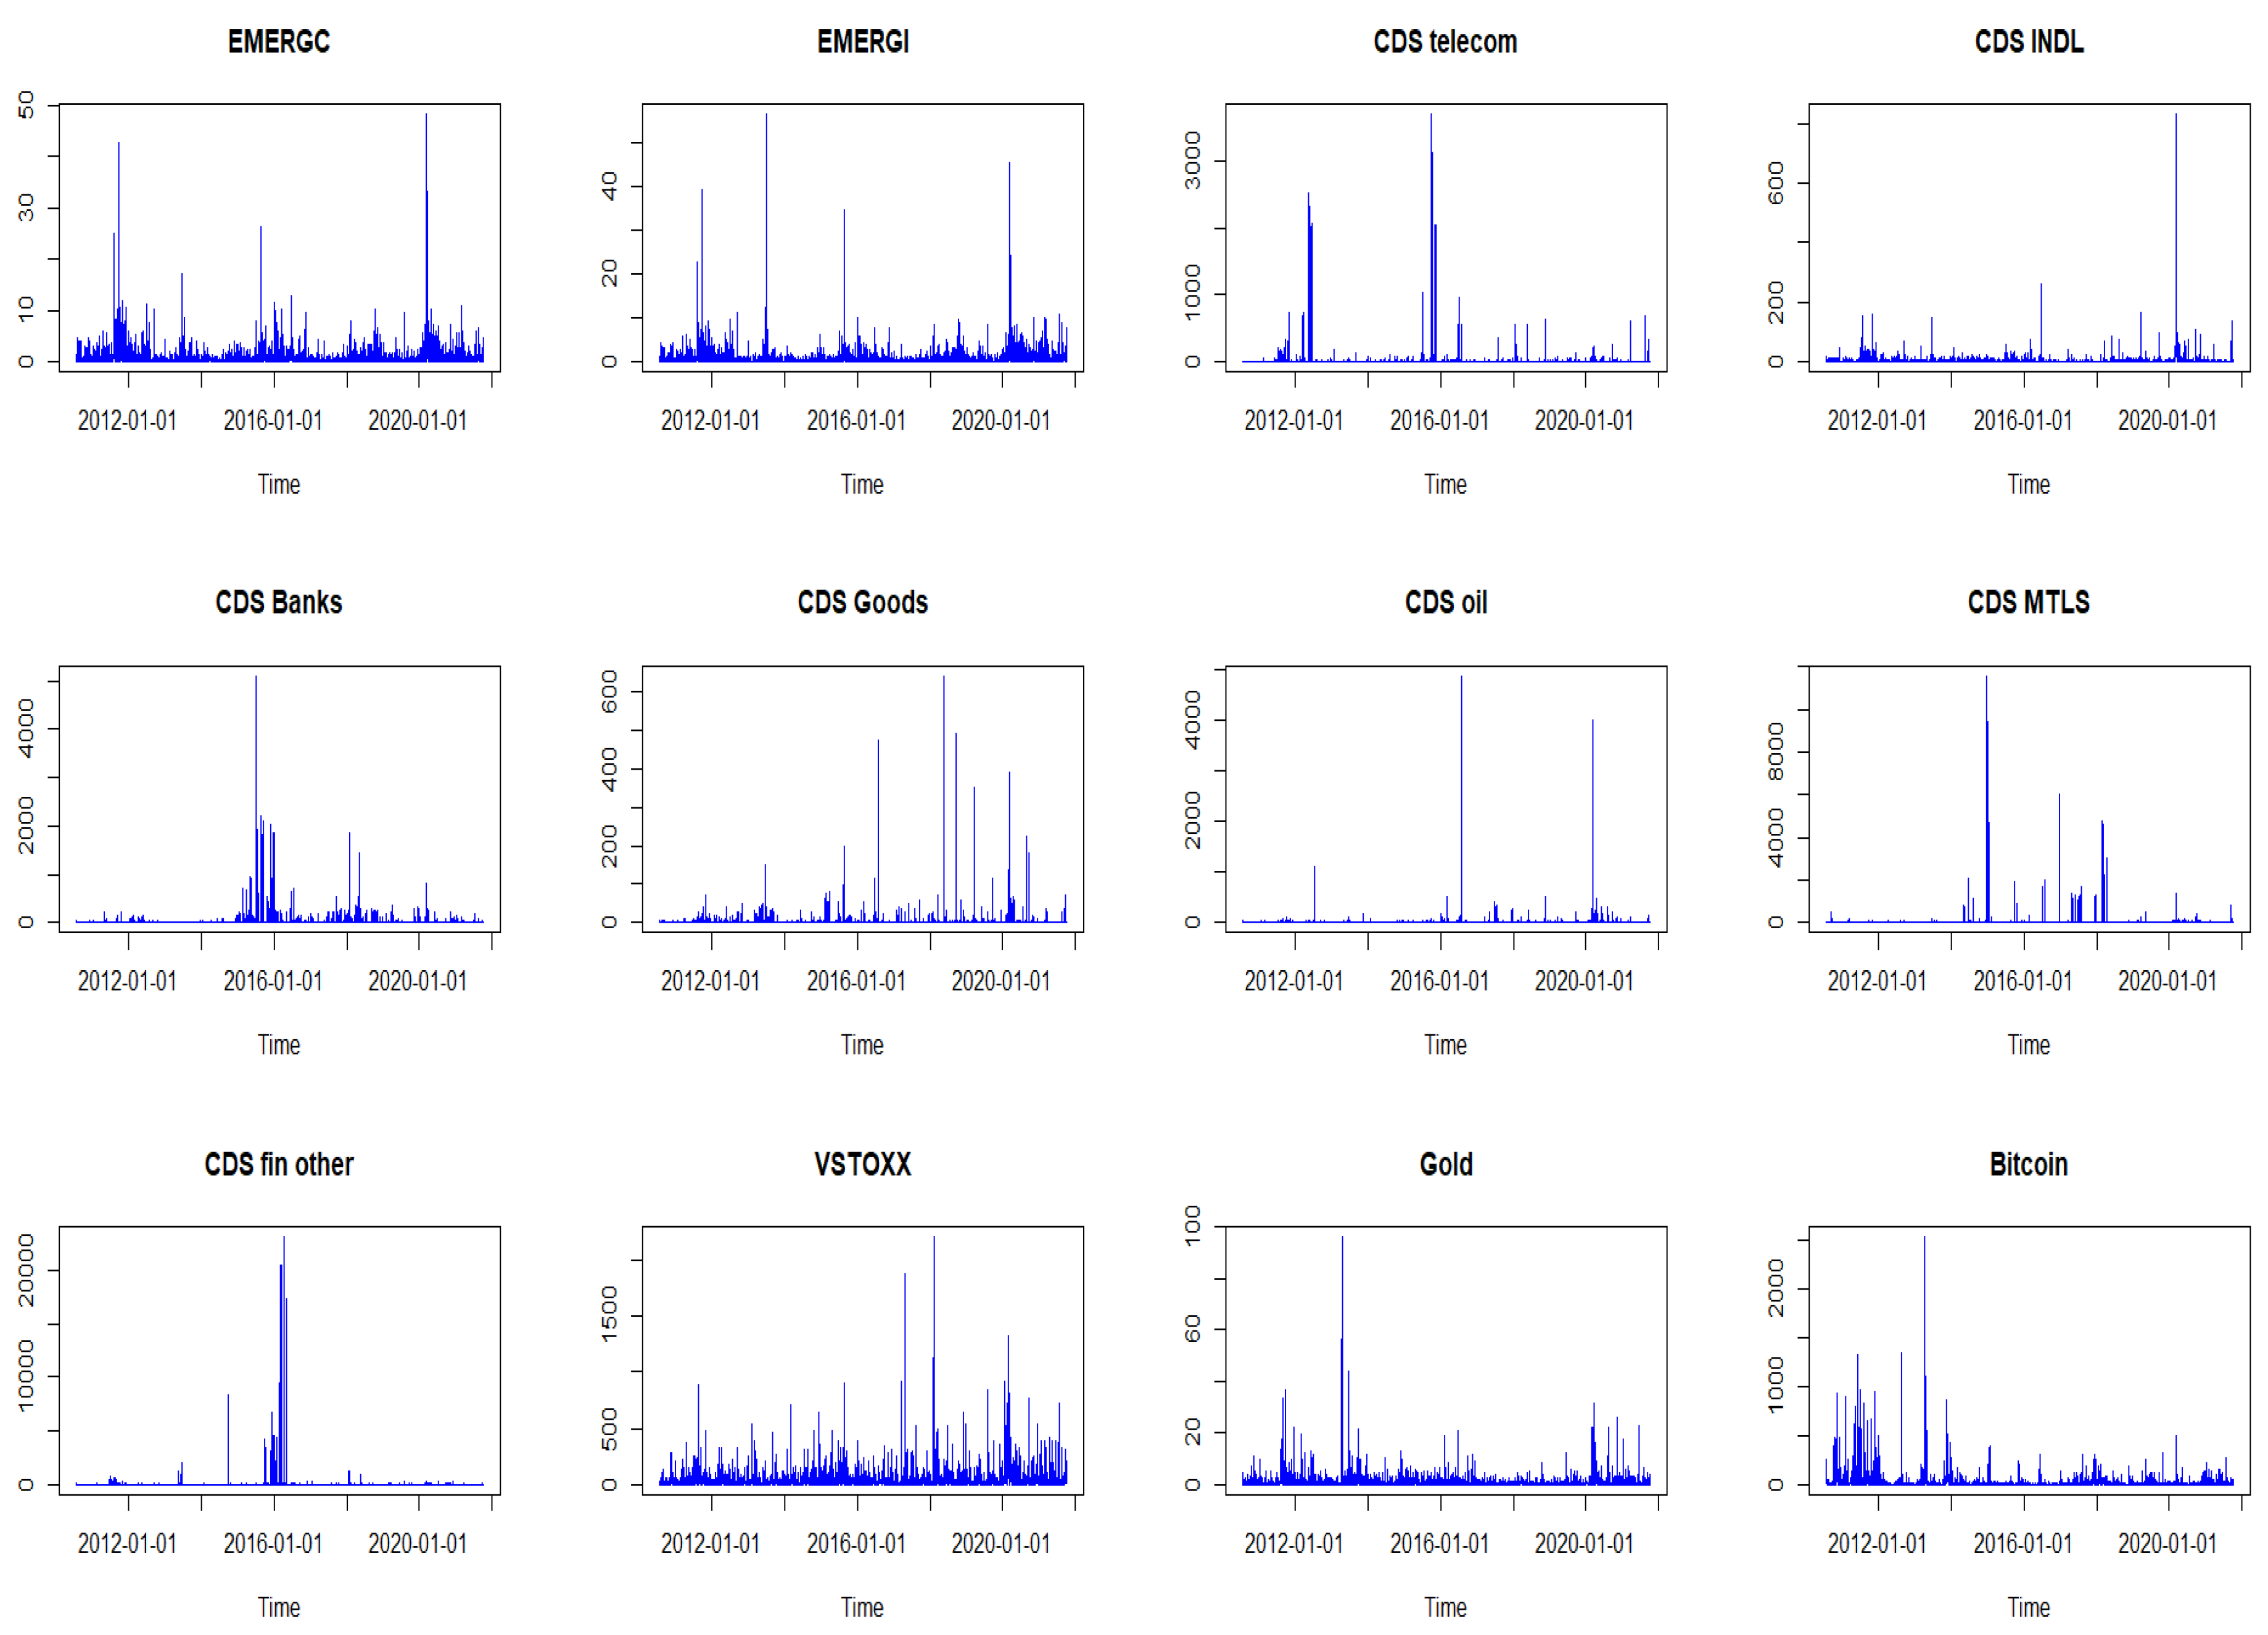
Figure 3.
Rolling one-step ahead conditional correlations.
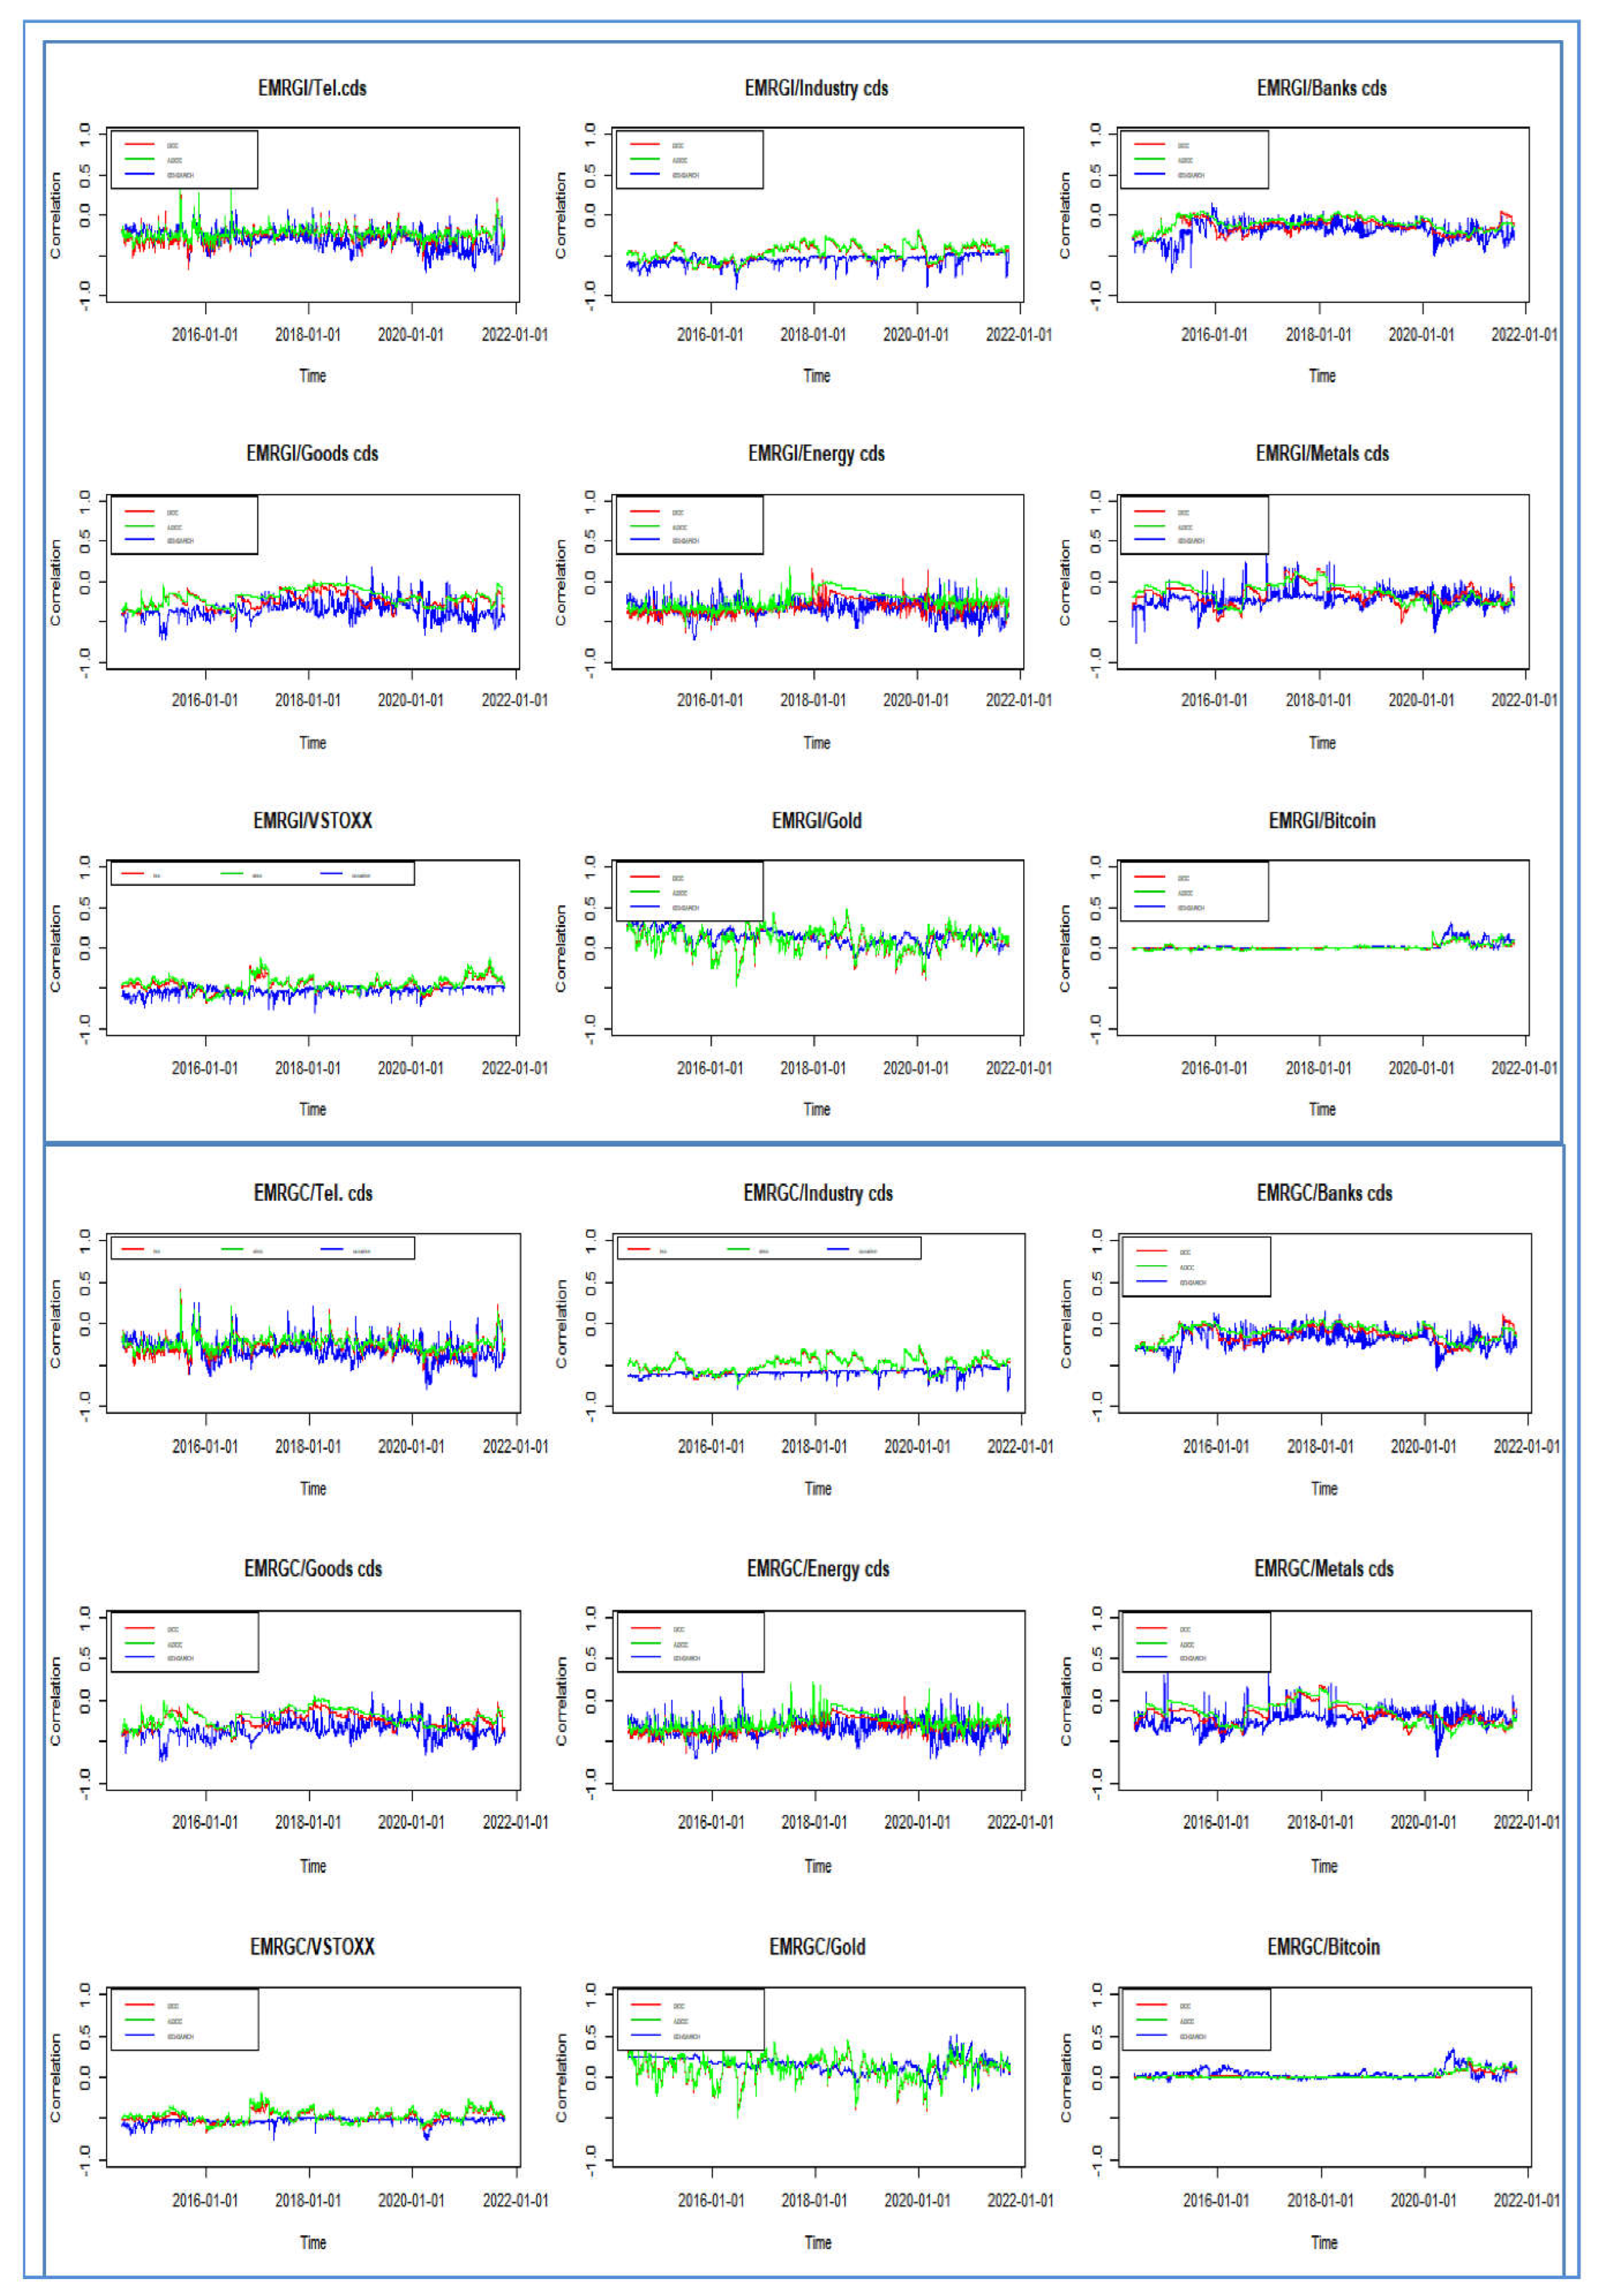

Table 1.
Descriptive statistics.
| Mean | Min | Max | Std.dev | Skewness | Kurtosis | JB Test | ADF Test | Q(12) | Q²(12) | |
|---|---|---|---|---|---|---|---|---|---|---|
| EMERGC | 0.0097 | -6.9433 | 5.5818 | 0.9961 | -0.5944 | 4.7640 | 2948.8*** | -13.746 | 127.07*** | 1927.9*** |
| EMERGI | 0.0197 | -6.7254 | 7.5080 | 0.9710 | -0.5694 | 5.9457 | 4481.8*** | -13.639 | 100.88*** | 1022.5*** |
| CDS TEL | -0.0344 | -50.7063 | 60.8856 | 4.9530 | 0.5699 | 51.8918 | 329263*** | -14.67 | 352.41*** | 1306.4*** |
| CDS IND | -0.0308 | -12.5791 | 28.8322 | 2.1040 | 1.8534 | 21.3409 | 57348*** | -13.205 | 118.99*** | 631.8*** |
| CDS BANKS | -0.0478 | -71.4489 | 70.7189 | 5.7652 | -0.1123 | 32.3276 | 127740*** | -15.042 | 340.84*** | 833.56*** |
| CDS GOODS | -0.0236 | -25.3067 | 22.1544 | 2.0801 | 0.9551 | 33.4898 | 137528*** | -13.306 | 67.23*** | 356.57*** |
| CDS ENERGY | -0.0236 | -59.1570 | 69.7830 | 3.5932 | 2.9412 | 113.3324 | 1573958*** | -12.818 | 79.112*** | 310.02*** |
| CDS METALS | -0.0183 | -107.6675 | 97.0970 | 6.2012 | -1.2154 | 102.7174 | 1290178*** | -16.272 | 115.5*** | 83.715*** |
| CDS OTHER FIN | -0.0551 | -142.8112 | 152.1618 | 9.2989 | 0.5344 | 151.0904 | 2790029*** | -15.194 | 529.34*** | 748.74*** |
| VSTOXX | -0.0116 | -43.4376 | 47.0666 | 6.8544 | 0.6263 | 3.6856 | 1853.7*** | -15.981 | 36.404*** | 319.7*** |
| Gold | 0.0102 | -9.8095 | 5.6000 | 1.0104 | -0.6566 | 7.1701 | 6497.1*** | -13.934 | 11.088* | 197.45*** |
| Bitcoin | 0.4558 | -50.4021 | 36.3626 | 5.2116 | -0.2728 | 13.2355 | 21452*** | -11.08 | 190.53*** | 1018.2*** |
Table 2.
Correlation between correlations.
| EMERGC | DCC/ADCC | DCC/GO-GARCH | ADCC/GO-GARCH |
|---|---|---|---|
| CDS TEL | 0.9708 | 0.3845 | 0.3890 |
| CDS IND | 0.9937 | 0.3266 | 0.3282 |
| CDS BANKS | 0.9064 | 0.5000 | 0.5516 |
| CDS GOODS | 0.8736 | 0.2032 | 0.2242 |
| CDS ENERGY | 0.9354 | 0.2211 | 0.2460 |
| CDS METALS | 0.8970 | 0.2564 | 0.1421 |
| CDS OTHER FIN | 0.9416 | 0.3783 | 0.3936 |
| VSTOXX | 0.9676 | 0.3174 | 0.2108 |
| Gold | 0.9946 | 0.3272 | 0.3026 |
| Bitcoin | 0.9565 | 0.4570 | 0.4119 |
| EMERGI | DCC/ADCC | DCC/GO-GARCH | ADCC/GO-GARCH |
| CDS TEL | 0.9663 | 0.2859 | 0.2895 |
| CDS IND | 0.9897 | 0.3668 | 0.3895 |
| CDS BANKS | 0.8733 | 0.3258 | 0.5020 |
| CDS GOODS | 0.8422 | 0.2038 | 0.2460 |
| CDS ENERGY | 0.8376 | 0.0868 | 0.1243 |
| CDS METALS | 0.8388 | 0.2851 | 0.1770 |
| CDS OTHER FIN | 0.9404 | 0.3429 | 0.3932 |
| VSTOXX | 0.9774 | 0.0942 | 0.0626 |
| Gold | 0.9913 | 0.3539 | 0.2894 |
| Bitcoin | 0.9454 | 0.7371 | 0.6945 |
Table 3.
The estimation results for the role of CDS, VSTOXX, Gold and Bitcoin as a hedge and safe haven asset.
Table 3.
The estimation results for the role of CDS, VSTOXX, Gold and Bitcoin as a hedge and safe haven asset.
| Hedge( γ0) | 0.01 (γ1) | 0.05 (γ2) | 0.1 (γ3) | |
|---|---|---|---|---|
| Before bubble crypto currency | ||||
| CDS TEL | -0.2539*** | -0.0094 | 0.0216* | -0.0246** |
| CDS IND | -0.5110*** | -0.0005 | 0.0084 | 0.0102* |
| CDS BANKS | -0.1687*** | 0.0056 | 0.0069 | 0.0033 |
| CDS GOODS | -0.2668*** | 0.0016 | 0.0082 | 0.0014 |
| CDS OIL GAS | -0.2947*** | -0.0004 | 0.0115 | 0.0021 |
| CDS MTLS | -0.2407*** | -0.0024 | 0.0184 | 0.0211 |
| CDS OTHER FIN | -0.2407*** | -0.0218 | 0.0140 | -0.0007 |
| VSTOXX | -0.4889*** | -0.0001 | 0.0082 | 0.0123* |
| Gold | 0.1216*** | 0.0324* | 0.0034 | 0.0038 |
| Bitcoin | 0.0123*** | -0.0043 | -0.0005 | -0.0026 |
| During bubble crypto currency and before Covid-19 | ||||
| CDS TEL | -0.2406*** | -0.0050 | 0.0286 | -0.0282* |
| CDS IND | -0.4546*** | 0.0096 | 0.0040 | -0.0101 |
| CDS BANKS | -0.0761*** | 0.0082 | 0.0100 | -0.0107 |
| CDS GOODS | -0.2265*** | -0.0048 | 0.0030 | -0.0234* |
| CDS OIL GAS | -0.2842*** | 0.0032 | 0.0135 | -0.0231* |
| CDS MTLS | -0.1395*** | 0.0206 | 0.0151 | -0.0438* |
| CDS OTHER FIN | -0.1365*** | -0.0090 | 0.0137 | -0.0307* |
| VSTOXX | -0.4858*** | -0.0059 | 0.0088 | 0.0007 |
| Gold | 0.0799*** | 0.0334 | 0.0194 | -0.0331 |
| Bitcoin | 0.0086*** | 0.0093 | -0.0079 | 0.0001 |
| Covid-19 period | ||||
| CDS TEL | -0.2923*** | 0.0363* | -0.0012 | 0.0020 |
| CDS IND | -0.4823*** | 0.0223* | 0.0131 | -0.0064 |
| CDS BANKS | -0.1975*** | 0.0066 | 0.0064 | -0.0094 |
| CDS GOODS | -0.2699*** | 0.0183* | -0.0080 | 0.0131 |
| CDS OIL GAS | -0.3039*** | -0.0124 | -0.0136 | -0.0003 |
| CDS MTLS | -0.2860*** | -0.0244** | 0.0062 | 0.0008 |
| CDS OTHER FIN | -0.2421*** | 0.0130 | 0.0146 | -0.0022 |
| VSTOXX | -0.4607*** | 0.0173* | 0.0212* | -0.0174* |
| Gold | 0.1131*** | -0.0099 | -0.0072 | 0.0183 |
| Bitcoin | 0.1106*** | -0.0030 | 0.0005 | 0.0040 |
Table 4.
The estimation results for the role of CDS, VSTOXX, Gold and Bitcoin as a hedge and safe haven asset for EMERGI stock return.
Table 4.
The estimation results for the role of CDS, VSTOXX, Gold and Bitcoin as a hedge and safe haven asset for EMERGI stock return.
| Hedge( γ0) | 0.01 (γ1) | 0.05 (γ2) | 0.1 (γ3) | |
|---|---|---|---|---|
| Before bubble crypto currency | ||||
| CDS TEL | -0.2376*** | 0.01661 | -0.0190* | 0.0058 |
| CDS IND | -0.4892*** | -0.0072 | 0.0088 | 0.0185** |
| CDS BANKS | -0.1802*** | 0.0051 | 0.0066 | 0.0062 |
| CDS GOODS | -0.2585*** | -0.0052 | 0.0075 | 0.0122 |
| CDS OIL GAS | -0.2756*** | -0.0084 | 0.0160* | 0.0019 |
| CDS MTLS | -0.2350*** | -0.0133 | 0.0036 | 0.0550*** |
| CDS OTHER FIN | -0.2402*** | -0.0251 | -0.0120 | 0.0344* |
| VSTOXX | -0.4708*** | -0.0057 | 0.0104 | 0.0182** |
| Gold | 0.1031*** | 0.0305* | 0.0098 | -0.0091 |
| Bitcoin | 0.0131*** | -0.0019 | -0.0079* | 0.0018 |
| Before Covid-19 and during bubble crypto currency | ||||
| CDS TEL | -0.2293*** | 0.0158 | -0.0057 | -0.0064 |
| CDS IND | -0.4172*** | 0.0225 | 0.0040 | -0.0201 |
| CDS BANKS | -0.0633*** | 0.0119 | 0.0129 | -0.0204* |
| CDS GOODS | -0.1960*** | 0.0063 | 0.0021 | -0.0262* |
| CDS OIL GAS | -0.2652*** | 0.0227 | -0.0111 | -0.0053 |
| CDS MTLS | -0.1468*** | 0.0174 | 0.0110 | -0.0362* |
| CDS OTHER FIN | -0.1243*** | 0.0016 | 0.0083 | -0.0288* |
| VSTOXX | -0.4688*** | 0.0027 | -0.0097 | 0.0159* |
| Gold | 0.0588*** | 0.0248 | -0.0151 | 0.0074 |
| Bitcoin | 0.0113*** | 0.0082 | 0.0069 | -0.0140* |
| Covid-19 period | ||||
| CDS TEL | -0.2576*** | 0.0377** | 0.0136 | -0.0175 |
| CDS IND | -0.4252*** | 0.0263* | 0.0180 | -0.0174 |
| CDS BANKS | -0.1835*** | 0.0009 | 0.0089 | -0.0115 |
| CDS GOODS | -0.2508*** | 0.0191* | 0.0111 | -0.0083 |
| CDS OIL GAS | -0.2786*** | -0.0056 | -0.0089 | -0.0073 |
| CDS MTLS | -0.2446*** | -0.0138 | -0.0093 | 0.0106 |
| CDS OTHER FIN | -0.2330*** | 0.0095 | 0.0215 | -0.0149 |
| VSTOXX | -0.4125*** | 0.0165 | 0.0259 | -0.0240 |
| Gold | 9.001e-02*** | -1.446e-02 | 1.209e-02 | -4.444e-05 |
| Bitcoin | 0.0941*** | -0.0115 | -0.0002 | 0.0025 |
Table 5.
Correlations between hedge ratios.
| EMERGC | DCC/ADCC | DCC/GO-GARCH | ADCC/GO-GARCH |
|---|---|---|---|
| CDS TEL | 0.8704 | 0.7813 | 0.7676 |
| CDS IND | 0.9050 | -0.6459 | -0.5811 |
| CDS BANKS | 0.8408 | 0.0707 | 0.1849 |
| CDS GOODS | 0.7617 | 0.5466 | 0.5881 |
| CDS ENERGY | 0.8666 | 0.1705 | 0.1468 |
| CDS METALS | 0.7731 | 0.0667 | 0.0638 |
| CDS OTHER FIN | 0.8426 | -0.0189 | 0.0256 |
| VSTOXX | 0.8821 | -0.6072 | -0.5708 |
| Gold | 0.9773 | 0.2277 | 0.1584 |
| Bitcoin | 0.9346 | 0.6994 | 0.6628 |
| EMERGI | DCC/ADCC | DCC/GO-GARCH | ADCC/GO-GARCH |
| CDS TEL | 0.8543 | 0.1594 | 0.2317 |
| CDS IND | 0.9085 | -0.4891 | -0.4452 |
| CDS BANKS | 0.8243 | 0.3954 | 0.3729 |
| CDS GOODS | 0.7354 | 0.5093 | 0.5612 |
| CDS ENERGY | 0.8334 | 0.0560 | 0.0875 |
| CDS METALS | 0.7563 | 0.0051 | 0.0021 |
| CDS OTHER FIN | 0.8498 | -0.0512 | 0.0009 |
| VSTOXX | 0.8756 | 0.7847 | 0.6155 |
| Gold | 0.9663 | 0.2113 | 0.1025 |
| Bitcoin | 0.9439 | 0.8232 | 0.7752 |
Table 6.
Summary statistics of hedge ratio and hedging effectiveness (HE) obtained from DCC model.
| Refit=20 | ||||||||||||
| Period 1 | Period 2 | Period 3 | ||||||||||
| EMERGC | Min | Max | Mean | HE | Min | Max | Mean | HE | Min | Max | Mean | HE |
| CDS TEL | -0.3263 | 0.0373 | -0.0948 | 0.0784 | -0.2100 | 0.0131 | -0.0844 | 0.0572 | -0.3004 | 0.0275 | -0.1192 | 0.0933 |
| CDS IND | -0.5455 | -0.0936 | -0.2609 | 0.2817 | -0.3902 | -0.0601 | -0.2384 | 0.2126 | -0.5370 | -0.0914 | -0.2796 | 0.2525 |
| CDS BANKS | -0.1533 | 0.0033 | -0.0304 | 0.0272 | -0.0790 | 0.0038 | -0.0214 | 0.0119 | -0.1693 | 0.0218 | -0.0581 | 0.0475 |
| CDS GOODS | -0.4609 | -0.0086 | -0.1600 | 0.0759 | -0.4220 | 0.0067 | -0.1014 | 0.0463 | -0.7460 | -0.0063 | -0.1753 | 0.0929 |
| CDS ENERGY | -0.4320 | 0.0096 | -0.1415 | 0.1319 | -0.1692 | 0.0089 | -0.0856 | 0.0639 | -0.2472 | 0.0061 | -0.1096 | 0.0946 |
| CDS METALS | -0.2059 | 0.0122 | -0.0431 | 0.0379 | -0.2536 | 0.0469 | -0.0638 | 0.0410 | -0.2588 | 0.0016 | -0.0780 | 0.0517 |
| CDS OTHER FIN | -0.2343 | 0.0063 | -0.0507 | 0.0329 | -0.1169 | 0.0071 | -0.0352 | 0.0189 | -0.2178 | -0.0280 | -0.0983 | 0.0662 |
| VSTOXX | -0.1682 | -0.0186 | -0.0688 | 0.2490 | -0.1325 | -0.0310 | -0.0613 | 0.2309 | -0.2508 | -0.0199 | -0.0741 | 0.1919 |
| GOLD | -0.4164 | 0.4075 | 0.0812 | 0.0309 | -0.5620 | 0.5833 | 0.1057 | 0.0299 | -0.5427 | 0.4358 | 0.1033 | 0.0276 |
| BITCOIN | -0.0011 | 0.0084 | 0.0018 | 7.2422.10−5 | -0.0013 | 0.0034 | 0.0006 | 1.8283.10−5 | -0.0026 | 0.0644 | 0.0204 | 0.0069 |
| EMERGI | Min | Max | Mean | HE | Min | Max | Mean | HE | Min | Max | Mean | HE |
| CDS TEL | -0.4296 | 0.0455 | -0.0848 | 0.0748 | -0.2434 | 0.0068 | -0.0718 | 0.0527 | -0.2834 | 0.0172 | -0.1124 | 0.0733 |
| CDS IND | -0.6194 | -0.0828 | -0.2282 | 0.2636 | -0.4193 | -0.0506 | -0.2182 | 0.1848 | -0.5902 | -0.0845 | -0.2682 | 0.2032 |
| CDS BANKS | -0.1346 | 0.0034 | -0.0284 | 0.0304 | -0.0772 | 0.0094 | -0.0187 | 0.0098 | -0.1714 | 0.0138 | -0.0569 | 0.0386 |
| CDS GOODS | -0.4289 | -0.0104 | -0.1484 | 0.0774 | -0.3944 | 0.0054 | -0.0919 | 0.0400 | -0.7195 | -0.0284 | -0.1657 | 0.0755 |
| CDS ENERGY | -0.4422 | 0.0082 | -0.1242 | 0.1207 | -0.1764 | -0.0045 | -0.0743 | 0.0527 | -0.2163 | -0.0015 | -0.1082 | 0.0774 |
| CDS METALS | -0.3118 | 0.0141 | -0.0401 | 0.0407 | -0.2536 | 0.0469 | -0.0638 | 0.0410 | -0.2588 | 0.0016 | -0.0780 | 0.0517 |
| CDS OTHER FIN | -0.2314 | 0.0076 | -0.0467 | 0.0332 | -0.1169 | 0.0071 | -0.0352 | 0.0189 | -0.2178 | -0.0280 | -0.0983 | 0.0662 |
| VSTOXX | -0.1654 | -0.0146 | -0.0599 | 0.2312 | -0.1325 | -0.0310 | -0.0613 | 0.2309 | -0.2508 | -0.0199 | -0.0741 | 0.1919 |
| GOLD | -0.3583 | 0.3586 | 0.0623 | 0.0280 | -0.4811 | 0.5832 | 0.0774 | 0.0240 | -0.5265 | 0.4649 | 0.0938 | 0.0207 |
| BITCOIN | -0.0098 | 0.0062 | -0.0009 | 0.0001 | -0.0112 | 0.0084 | -0.0001 | 8.9266.10−5 | -0.0077 | 0.0680 | 0.0217 | 0.0058 |
| Refit=60 | ||||||||||||
| Period 1 | Period 2 | Period 3 | ||||||||||
| EMERGC | Min | Max | Mean | HE | Min | Max | Mean | HE | Min | Max | Mean | HE |
| CDS TEL | -0.3347 | 0.0373 | -0.0949 | 0.0782 | -0.2067 | 0.0132 | 0.0847 | 0.0571 | -0.3049 | 0.0183 | -0.1206 | 0.0949 |
| CDS IND | -0.5208 | -0.0926 | -0.2605 | 0.2827 | -0.3902 | -0.0601 | -0.2382 | 0.2127 | -0.5348 | -0.0917 | -0.2793 | 0.2526 |
| CDS BANKS | -0.1542 | 0.0032 | -0.0310 | 0.0280 | -0.0790 | 0.0038 | -0.0213 | 0.0119 | -0.1693 | 0.0218 | -0.0576 | 0.0467 |
| CDS GOODS | -0.4479 | -0.0085 | -0.1610 | 0.0765 | -0.4220 | 0.0067 | -0.1043 | 0.0476 | -0.3978 | -0.0079 | -0.1519 | 0.0772 |
| CDS ENERGY | -0.4331 | 0.0095 | -0.1425 | 0.1328 | -0.1692 | 0.0024 | -0.0840 | 0.0603 | -0.2601 | 0.0061 | -0.1104 | 0.0952 |
| CDS METALS | -0.1953 | 0.0109 | -0.0424 | 0.0361 | -0.2196 | 0.0718 | -0.0587 | 0.0409 | -0.1859 | -0.0099 | -0.0798 | 0.0668 |
| CDS OTHER FIN | -0.2328 | 0.0060 | -0.0511 | 0.0333 | -0.1077 | 0.0134 | -0.0400 | 0.0224 | -0.2480 | -0.0371 | -0.0985 | 0.0729 |
| VSTOXX | -0.1539 | -0.0192 | -0.0684 | 0.2477 | -0.1219 | -0.0299 | -0.0642 | 0.2450 | -0.2688 | -0.0271 | -0.0781 | 0.2287 |
| GOLD | -0.4164 | 0.4075 | 0.0830 | 0.0307 | -0.5620 | 0.5680 | 0.1047 | 0.0295 | -0.5427 | 0.4265 | 0.1042 | 0.0275 |
| BITCOIN | -0.0009 | 0.0081 | 0.0018 | 6.8330.10−5 | -0.0013 | 0.0029 | 0.0006 | 1.7650.10−5 | -0.0025 | 0.0644 | 0.0186 | 0.0063 |
| EMERGI | Min | Max | Mean | HE | Min | Max | Mean | HE | Min | Max | Mean | HE |
| CDS TEL | -0.4335 | 0.0455 | -0.0849 | 0.0747 | -0.2434 | 0.0044 | -0.0807 | 0.0528 | -0.2835 | 0.0163 | 0.1125 | 0.0731 |
| CDS IND | -0.6190 | -0.0818 | -0.2284 | 0.2655 | -0.4193 | -0.0506 | -0.2179 | 0.1845 | -0.5821 | -0.0833 | -0.2679 | 0.2033 |
| CDS BANKS | -0.1339 | 0.0020 | -0.0290 | 0.0312 | -0.0745 | 0.0086 | -0.0185 | 0.0097 | -0.1714 | 0.0138 | -0.0565 | 0.0380 |
| CDS GOODS | -0.4251 | -0.0102 | -0.1490 | 0.0772 | -0.3944 | 0.0054 | -0.0967 | 0.0439 | -0.4111 | -0.0287 | -0.1449 | 0.0607 |
| CDS ENERGY | -0.4410 | 0.0078 | -0.1246 | 0.1206 | -0.1771 | -0.0045 | -0.0750 | 0.0517 | -0.2244 | -0.0015 | -0.1080 | 0.0771 |
| CDS METALS | -0.1866 | 0.0141 | -0.0377 | 0.0373 | -0.2502 | 0.0420 | -0.0574 | 0.0411 | -0.2088 | -0.0038 | -0.0663 | 0.0405 |
| CDS OTHER FIN | -0.2382 | 0.0108 | -0.0471 | 0.0335 | -0.1169 | 0.0061 | -0.0354 | 0.0192 | -0.2279 | -0.0292 | -0.0989 | 0.0663 |
| VSTOXX | -0.1558 | -0.0149 | -0.0597 | 0.2300 | -0.1317 | -0.0314 | -0.0615 | 0.2309 | -0.2543 | -0.0209 | -0.0749 | 0.1931 |
| GOLD | -0.3583 | 0.3586 | 0.0645 | 0.0276 | -0.4811 | 0.5602 | 0.0766 | 0.0236 | -0.5279 | 0.4512 | 0.0944 | 0.0207 |
| BITCOIN | -0.0083 | 0.0047 | -0.0009 | 8.6495.10−5 | -0.0061 | 0.0084 | -0.0001 | 3.1811.10−5 | -0.0074 | 0.0625 | 0.0188 | 0.0049 |
Table 7.
Summary statistics of hedge ratio and hedging effectiveness (HE) obtained from ADCC model.
| Refit=20 | ||||||||||||
| Period 1 | Period 2 | Period 3 | ||||||||||
| EMERGC | Min | Max | Mean | HE | Min | Max | Mean | HE | Min | Max | Mean | HE |
| CDS TEL | -0.1054 | 0.0195 | -0.0392 | 0.0608 | -0.0922 | 0.0050 | -0.0430 | 0.0518 | -0.1844 | 0.0210 | -0.0560 | 0.0804 |
| CDS IND | -0.5295 | -0.0890 | -0.2562 | 0.2712 | -0.4083 | -0.0669 | -0.2385 | 0.2077 | -0.6022 | -0.0829 | -0.2716 | 0.2415 |
| CDS BANKS | -0.1409 | 0.0030 | -0.0188 | 0.0182 | -0.0321 | 0.0047 | -0.0075 | 0.0057 | -0.0997 | -0.0007 | -0.0278 | 0.0377 |
| CDS GOODS | -0.2386 | -0.0002 | -0.0789 | 0.0582 | -0.1399 | 0.0128 | -0.0427 | 0.0277 | -0.2924 | -0.0063 | -0.0937 | 0.0697 |
| CDS ENERGY | -0.2376 | 0.0082 | -0.0729 | 0.1080 | -0.0997 | 0.0232 | -0.0332 | 0.0381 | -0.1592 | 0.0027 | -0.0518 | 0.0798 |
| CDS METALS | -0.1241 | 0.0265 | -0.0224 | 0.0263 | -0.1252 | 0.0390 | -0.0225 | 0.0269 | -0.2251 | -0.0047 | -0.0552 | 0.0906 |
| CDS OTHER FIN | -0.1978 | 0.0068 | -0.0303 | 0.0265 | -0.0514 | 0.0199 | -0.0188 | 0.0162 | -0.1378 | -0.0116 | -0.0532 | 0.0562 |
| VSTOXX | -0.1371 | -0.0147 | -0.0625 | 0.2244 | -0.1113 | -0.0242 | -0.0601 | 0.2284 | -0.1726 | -0.0244 | -0.0631 | 0.2041 |
| GOLD | -0.4547 | 0.3579 | 0.0777 | 0.0331 | -0.5522 | 0.7869 | 0.1217 | 0.0320 | -0.4817 | 0.5812 | 0.1089 | 0.0309 |
| BITCOIN | -0.0067 | 0.0059 | 0.0001 | 8.9454.10−5 | -0.0022 | 0.0089 | 0.0000 | 2.7113.10−5 | -0.0022 | 0.0733 | 0.0199 | 0.0120 |
| EMERGI | Min | Max | Mean | HE | Min | Max | Mean | HE | Min | Max | Mean | HE |
| CDS TEL | -0.1034 | 0.0272 | -0.0343 | 0.0572 | -0.1042 | -0.0007 | -0.0400 | 0.0462 | -0.1385 | 0.0148 | -0.0531 | 0.0627 |
| CDS IND | -0.5451 | -0.0638 | -0.2225 | 0.2536 | -0.3649 | -0.0549 | -0.2149 | 0.1769 | -0.6564 | -0.0629 | -0.2557 | 0.1862 |
| CDS BANKS | -0.1327 | 0.0048 | -0.0165 | 0.0176 | -0.0305 | 0.0055 | -0.0066 | 0.0048 | -0.1085 | -0.0017 | -0.0286 | 0.0314 |
| CDS GOODS | -0.2423 | -0.0017 | -0.0720 | 0.0600 | -0.1353 | -0.0006 | -0.0348 | 0.0217 | -0.3573 | -0.0063 | -0.0929 | 0.0609 |
| CDS ENERGY | -0.2285 | 0.0045 | -0.0644 | 0.1029 | -0.0858 | -0.0003 | -0.0246 | 0.0226 | -0.1751 | 0.0052 | -0.0517 | 0.0642 |
| CDS METALS | -0.1169 | 0.0190 | -0.0192 | 0.0256 | -0.1197 | 0.0278 | -0.0243 | 0.0253 | -0.2227 | -0.0040 | -0.0512 | 0.0683 |
| CDS OTHER FIN | -0.1843 | 0.0046 | -0.0278 | 0.0264 | -0.0452 | 0.0051 | -0.0161 | 0.0127 | -0.1340 | -0.0102 | -0.0534 | 0.0497 |
| VSTOXX | -0.1280 | -0.0089 | -0.0543 | 0.2102 | -0.1248 | -0.0225 | -0.0580 | 0.2187 | -0.1505 | -0.0151 | -0.0593 | 0.1681 |
| GOLD | -0.3844 | 0.3239 | 0.0614 | 0.0295 | -0.4277 | 0.8465 | 0.1023 | 0.0260 | -0.4459 | 0.5711 | 0.1039 | 0.0243 |
| BITCOIN | -0.0141 | 0.0077 | -0.0017 | 0.0003 | -0.0066 | 0.0191 | -0.0002 | 0.0001 | -0.0037 | 0.0667 | 0.0172 | 0.0065 |
| Refit=60 | ||||||||||||
| Period 1 | Period 2 | Period 3 | ||||||||||
| EMERGC | Min | Max | Mean | HE | Min | Max | Mean | HE | Min | Max | Mean | HE |
| CDS TEL | -0.1081 | 0.0199 | -0.0391 | 0.0610 | -0.0922 | 0.0051 | -0.0429 | 0.0518 | -0.1832 | 0.0129 | -0.0562 | 0.0807 |
| CDS IND | -0.5126 | -0.0876 | -0.2559 | 0.2727 | -0.4004 | -0.0669 | -0.2382 | 0.2079 | -0.5954 | -0.0826 | -0.2707 | 0.2416 |
| CDS BANKS | -0.1464 | 0.0036 | -0.0194 | 0.0189 | -0.0317 | 0.0047 | -0.0076 | 0.0057 | -0.0960 | -0.0007 | -0.0275 | 0.0364 |
| CDS GOODS | -0.2387 | -0.0005 | -0.0811 | 0.0608 | -0.1399 | 0.0128 | -0.0420 | 0.0271 | -0.2910 | -0.0063 | -0.0933 | 0.0694 |
| CDS ENERGY | -0.2509 | 0.0083 | -0.0727 | 0.1072 | -0.1155 | 0.0232 | -0.0349 | 0.0377 | -0.1586 | 0.0027 | -0.0519 | 0.0797 |
| CDS METALS | -0.1241 | 0.0261 | -0.0216 | 0.0250 | -0.1136 | 0.0380 | -0.0221 | 0.0258 | -0.2279 | -0.0047 | -0.0551 | 0.0900 |
| CDS OTHER FIN | -0.1884 | 0.0072 | -0.0303 | 0.0267 | -0.0514 | 0.0232 | -0.0183 | 0.0160 | -0.1410 | -0.0118 | -0.0528 | 0.0569 |
| VSTOXX | -0.1343 | -0.0178 | -0.0625 | 0.2240 | -0.1103 | -0.0244 | -0.0602 | 0.2288 | -0.1700 | -0.0244 | -0.0630 | 0.2040 |
| GOLD | -0.4547 | 0.3579 | 0.0790 | 0.0331 | -0.5522 | 0.7656 | 0.1199 | 0.0315 | -0.4817 | 0.5594 | 0.1091 | 0.0308 |
| BITCOIN | -0.0045 | 0.0071 | 0.0002 | 7.6966.10−5 | -0.0022 | 0.0089 | 0.0000 | 2.1061.10−5 | -0.0022 | 0.0733 | 0.0193 | 0.0117 |
| EMERGI | Min | Max | Mean | HE | Min | Max | Mean | HE | Min | Max | Mean | HE |
| CDS TEL | -0.1051 | 0.0272 | -0.0343 | 0.0574 | -0.1042 | -0.0007 | -0.0401 | 0.0463 | -0.1365 | 0.0106 | -0.0536 | 0.0631 |
| CDS IND | -0.5216 | -0.0649 | -0.2226 | 0.2559 | -0.3620 | -0.0532 | -0.2144 | 0.1764 | -0.6472 | -0.0616 | -0.2548 | 0.1851 |
| CDS BANKS | -0.1392 | 0.0057 | -0.0169 | 0.0182 | -0.0302 | 0.0059 | -0.0066 | 0.0048 | -0.1049 | -0.0017 | -0.0286 | 0.0312 |
| CDS GOODS | -0.2371 | -0.0032 | -0.0725 | 0.0607 | -0.1353 | -0.0006 | -0.0336 | 0.0204 | -0.3573 | -0.0029 | -0.0895 | 0.0591 |
| CDS ENERGY | -0.2405 | 0.0047 | -0.0637 | 0.1005 | -0.0799 | -0.0006 | -0.0237 | 0.0204 | -0.1739 | 0.0056 | -0.0517 | 0.0638 |
| CDS METALS | -0.1169 | 0.0186 | -0.0184 | 0.0236 | -0.1104 | 0.0267 | -0.0240 | 0.0246 | -0.2245 | -0.0040 | -0.0512 | 0.0679 |
| CDS OTHER FIN | -0.1832 | 0.0050 | -0.0279 | 0.0267 | -0.0426 | 0.0052 | -0.0158 | 0.0125 | -0.1281 | -0.0100 | -0.0528 | 0.0501 |
| VSTOXX | -0.1206 | -0.0108 | -0.0543 | 0.2097 | -0.1238 | -0.0228 | -0.0581 | 0.2192 | -0.1494 | -0.0154 | -0.0591 | 0.1677 |
| GOLD | -0.3844 | 0.3239 | 0.0630 | 0.0292 | -0.4277 | 0.8103 | 0.1006 | 0.0253 | -0.4459 | 0.5526 | 0.1041 | 0.0242 |
| BITCOIN | -0.0154 | 0.0083 | -0.0015 | 0.0003 | -0.0028 | 0.0191 | -0.0002 | 8.5930.10−5 | -0.0037 | 0.0640 | 0.0159 | 0.0060 |
Table 8.
Summary statistics of hedge ratio obtained from GO-GARCH model and hedging effectiveness (HE).
Table 8.
Summary statistics of hedge ratio obtained from GO-GARCH model and hedging effectiveness (HE).
| Refit=20 | ||||||||||||
| Period 1 | Period 2 | Period 3 | ||||||||||
| EMERGC | Min | Max | Mean | HE | Min | Max | Mean | HE | Min | Max | Mean | HE |
| CDS TEL | -3.1838 | 0.0491 | -0.6183 | 0.0915 | -2.1626 | 0.0421 | -0.6743 | 0.1041 | -5.6765 | 0.0374 | -0.9845 | 0.1821 |
| CDS IND | -1.4297 | -0.2409 | -0.6470 | 0.3683 | -1.3110 | -0.2527 | -0.6337 | 0.3326 | -1.3738 | -0.1912 | -0.7056 | 0.3236 |
| CDS BANKS | -2.8739 | 0.7082 | -0.2326 | 0.0450 | -0.1287 | 1.1239 | -0.0949 | 0.0275 | -0.1631 | 0.1546 | -0.1455 | 0.0766 |
| CDS GOODS | -1.4395 | -0.0245 | -0.4503 | 0.1536 | -1.2857 | 0.0101 | -0.3718 | 0.0986 | -2.3923 | -0.0085 | -0.5814 | 0.1659 |
| CDS ENERGY | -1.6153 | 0.0167 | -0.4228 | 0.1365 | -1.6480 | -0.0178 | 0.4414 | 0.1034 | -3.7874 | 0.0243 | -0.6266 | 0.1677 |
| CDS METALS | -6.3525 | 7.0617 | -0.1521 | 0.0794 | -0.1349 | 2.1704 | -0.1060 | 0.0429 | -0.1333 | 0.3282 | -0.1224 | 0.0630 |
| CDS OTHER FIN | -3.1269 | 0.0341 | -0.6396 | 0.1015 | -2.8766 | -0.0159 | -0.9148 | 0.0741 | -7.6550 | -0.0816 | -1.3232 | 0.1196 |
| VSTOXX | -1.1068 | -0.2052 | -0.4700 | 0.2868 | -0.8791 | -0.1824 | -0.4578 | 0.2569 | -2.6532 | -0.2460 | -0.6130 | 0.2791 |
| GOLD | 0.0858 | 0.5599 | 0.1946 | 0.0386 | -0.1746 | 0.1694 | 0.0918 | 0.0108 | -0.3560 | 0.3291 | 0.1326 | 0.0395 |
| BITCOIN | -0.0261 | 0.6153 | 0.0936 | 0.0027 | -0.0154 | 0.5473 | 0.0504 | 0.0010 | -0.0330 | 2.0941 | 0.2916 | 0.0236 |
| EMERGI | Min | Max | Mean | HE | Min | Max | Mean | HE | Min | Max | Mean | HE |
| CDS TEL | -0.4613 | 0.5871 | -0.1326 | 0.0697 | -0.1470 | 0.3774 | -0.1358 | 0.0952 | -0.1906 | 0.2347 | -0.1711 | 0.1814 |
| CDS IND | -3.9191 | -0.2211 | -0.6086 | 0.3363 | -2.2017 | -0.2135 | -0.5304 | 0.2931 | -4.5494 | -0.1494 | -0.4925 | 0.2786 |
| CDS BANKS | -0.7723 | 0.0236 | -0.1787 | 0.0493 | -0.8193 | 0.0059 | -0.2292 | 0.0244 | -3.2809 | -0.0010 | -0.5429 | 0.0754 |
| CDS GOODS | -1.4586 | -0.0238 | -0.4078 | 0.1434 | -1.3533 | 0.0198 | -0.3812 | 0.0977 | -2.0313 | 0.0026 | -0.6500 | 0.1778 |
| CDS ENERGY | -1.8671 | 0.0062 | -0.3716 | 0.1147 | -1.8437 | -0.0329 | -0.4444 | 0.0982 | -3.0577 | 0.0087 | -0.6869 | 0.1737 |
| CDS METALS | -2.1864 | 0.0243 | -0.3388 | 0.0632 | -1.1714 | 0.0217 | -0.3533 | 0.0430 | -4.6849 | 0.0119 | -0.5722 | 0.0671 |
| CDS OTHER FIN | -3.4590 | 0.0194 | -0.5599 | 0.0858 | -3.2345 | -0.0256 | -0.9208 | 0.0678 | -7.2257 | -0.0755 | -1.4547 | 0.1223 |
| VSTOXX | -1.9855 | -0.2411 | -0.6952 | 0.3012 | -2.7094 | -0.2741 | -0.5973 | 0.2626 | -1.7593 | -0.2154 | -0.4658 | 0.2512 |
| GOLD | -0.0311 | 0.5866 | 0.2038 | 0.0388 | -0.0562 | 0.2582 | 0.0666 | 0.0087 | -0.0603 | 0.4011 | 0.1063 | 0.0149 |
| BITCOIN | -0.1071 | 0.0607 | -0.0005 | 4.8966e-05 | -0.0016 | 0.1914 | 0.0146 | 8.4171e-05 | -0.0091 | 1.4095 | 0.2385 | 0.0143 |
| Refit=60 | ||||||||||||
| Period 1 | Period 2 | Period 3 | ||||||||||
| EMERGC | Min | Max | Mean | HE | Min | Max | Mean | HE | Min | Max | Mean | HE |
| CDS TEL | -1.0188 | 1.3005 | -0.1452 | 0.0947 | -0.1599 | 0.9576 | -0.1403 | 0.1044 | -0.2059 | 0.8383 | -0.1774 | 0.1773 |
| CDS IND | -1.4586 | -0.2409 | -0.6461 | 0.3688 | -1.3113 | -0.2525 | -0.6376 | 0.3352 | -1.3838 | -0.1913 | -0.7240 | 0.3245 |
| CDS BANKS | -1.1211 | 0.0286 | -0.2021 | 0.0471 | -0.7690 | 0.0204 | -0.2313 | 0.0275 | -3.0410 | 0.0160 | -0.4898 | 0.0702 |
| CDS GOODS | -1.3244 | -0.0239 | -0.4506 | 0.1539 | -1.2857 | 0.0100 | -0.3730 | 0.0993 | -1.9934 | -0.0085 | -0.5706 | 0.1609 |
| CDS ENERGY | -1.6318 | 0.0148 | -0.4185 | 0.1364 | -1.6675 | -0.0177 | -0.4446 | 0.1043 | -2.6604 | 0.0242 | -0.5992 | 0.1595 |
| CDS METALS | -1.7755 | 0.0195 | -0.4266 | 0.0806 | -0.9923 | 0.0173 | -0.3484 | 0.0434 | -4.8285 | 0.0113 | -0.5279 | 0.0651 |
| CDS OTHER FIN | -14.1272 | 4.8447 | -0.2021 | 0.1034 | -0.1875 | -0.0747 | -0.0833 | 0.0753 | -0.1059 | -0.0626 | -0.0926 | 0.1173 |
| VSTOXX | -2.7792 | -0.3119 | -0.6614 | 0.2875 | -2.4663 | -0.3576 | -0.5913 | 0.2568 | -1.4921 | -0.2291 | -0.5318 | 0.2794 |
| GOLD | 0.1134 | 0.5669 | 0.2019 | 0.0406 | -0.1528 | 0.1682 | 0.0996 | 0.0113 | -0.3301 | 0.3283 | 0.1201 | 0.0394 |
| BITCOIN | -0.0269 | 0.6320 | 0.0970 | 0.0028 | -0.0163 | 0.5066 | 0.0495 | 0.0010 | -0.0324 | 1.3047 | 0.2213 | 0.0167 |
| EMERGI | Min | Max | Mean | HE | Min | Max | Mean | HE | Min | Max | Mean | HE |
| CDS TEL | -0.5099 | 0.5774 | -0.1323 | 0.0695 | -0.1470 | 0.3776 | -0.1358 | 0.0955 | -0.1906 | 0.2282 | -0.1694 | 0.1771 |
| CDS IND | -3.9181 | -0.2202 | -0.6097 | 0.3369 | -2.2016 | -0.2123 | -0.5301 | 0.2941 | -4.5740 | -0.1509 | -0.4794 | 0.2737 |
| CDS BANKS | -11.2704 | 0.8836 | -0.3504 | 0.0540 | -0.1185 | 0.3075 | -0.1004 | 0.0244 | -0.1473 | -0.0062 | -0.1347 | 0.0705 |
| CDS GOODS | -1.2846 | -0.0233 | -0.4087 | 0.1445 | -1.3535 | 0.0197 | -0.3827 | 0.0985 | -2.1163 | 0.0027 | -0.6418 | 0.1743 |
| CDS ENERGY | -1.9107 | 0.0061 | -0.3685 | 0.1148 | -1.8609 | -0.0331 | -0.4482 | 0.0992 | -2.0767 | 0.0084 | -0.6645 | 0.1674 |
| CDS METALS | -2.2134 | 0.0243 | -0.3419 | 0.0662 | -1.1609 | 0.0217 | -0.3562 | 0.0436 | -4.1185 | 0.0117 | -0.5786 | 0.0691 |
| CDS OTHER FIN | -3.5932 | 0.0197 | -0.5634 | 0.0881 | -3.2346 | -0.0256 | -0.9335 | 0.0690 | -6.6988 | -0.0755 | -1.4448 | 0.1200 |
| VSTOXX | -1.8964 | -0.2401 | -0.6955 | 0.3017 | -2.7094 | -0.2718 | -0.5975 | 0.2629 | -1.7613 | -0.1917 | -0.4642 | 0.2467 |
| GOLD | -0.0318 | 0.5827 | 0.2046 | 0.0390 | -0.0511 | 0.2588 | 0.0677 | 0.0087 | -0.0618 | 0.4142 | 0.1024 | 0.0149 |
| BITCOIN | -0.0150 | 0.0060 | -0.0018 | 5.1124e-05 | -0.0127 | 0.0068 | 0.0034 | 7.1380e-05 | -0.0194 | 0.0667 | 0.0406 | 0.0118 |
Table 9.
Diversification benefits of CDS, VSTOXX, Gold and Bitcoin for various portfolio compositions.
Table 9.
Diversification benefits of CDS, VSTOXX, Gold and Bitcoin for various portfolio compositions.
| Period 1 | Period 2 | Period 3 | |
| EMERGC | Mean (std. dev) | Mean (std. dev) | Mean (std. dev) |
| CDS TEL | 0.0262 (0.6783) | 0.0174 (0.3921) | -0.0422 (0.8804) |
| CDS IND | 0.6291 (0.1012) | 0.6172 (0.0897) | 0.6221 (0.0945) |
| CDS BANKS | 0.0775 (0.2128) | 0.0728 (0.1664) | 0.0438 (0.2902) |
| CDS GOODS | 0.5933 (0.2364) | 0.6124 ((0.1787) | 0.5797 (0.2317) |
| CDS ENERGY | 0.5196 (0.2063) | 0.5286 (0.1702) | 0.5097 (0.3027) |
| CDS METALS | -0.1958 (1.5568) | -0.6686 (5.3607) | -0.0229 (1.9954) |
| CDS OTHER FIN | 0.0874 (0.4843) | -0.0336 (0.4870) | -0.1111 (4.7650) |
| VSTOXX | 0.3653 (0.0880) | 0.3455 (0.0735) | 0.3514 (0.0900) |
| GOLD | 0.5921 (0.0839) | 0.5713 (0.1171) | 0.5828 (0.0883) |
| BITCOIN | 0.4752 (0.1310) | 0.4589 (0.1500) | 0.4008 (0.1939) |
| EMERGI | Mean (std. dev) | Mean (std. dev) | Mean (std. dev) |
| CDS TEL | 0.0246 (0.6413) | 0.0021 ( 0.4019) | -0.0066 (3.1428) |
| CDS IND | 0.6153 (0.1045) | 0.6086 (0.0942) | 0.5989 (0.1025) |
| CDS BANKS | 0.0781 (0.1993) | 0.0575 (0.1742) | -0.0175 (0.3693) |
| CDS GOODS | 0.5840 (0.2281) | 0.5896 (0.1848) | 0.5196 (0.2974) |
| CDS ENERGY | 0.5027 (0.1962) | 0.4960 (0.1840) | 0.4532 (0.4023) |
| CDS METALS | -0.0752 (1.3401) | -0.0674 (2.5085) | -0.4349 (1.5195) |
| CDS OTHER FIN | 0.1432 (0.4397) | -0.3582 (0.5114) | -0.0529 (2.2454) |
| VSTOXX | 0.3583 (0.0883) | 0.3462 (0.0776) | 0.3619 (0.0951) |
| GOLD | 0.6008 (0.0864) | 0.5842 (0.1083) | 0.5723 (0.0979) |
| BITCOIN | 0.4779 (0.1029) | 0.4542 (0.1510) | 0.3888 (0.2252) |
Disclaimer/Publisher’s Note: The statements, opinions and data contained in all publications are solely those of the individual author(s) and contributor(s) and not of MDPI and/or the editor(s). MDPI and/or the editor(s) disclaim responsibility for any injury to people or property resulting from any ideas, methods, instructions or products referred to in the content. |
© 2024 by the authors. Licensee MDPI, Basel, Switzerland. This article is an open access article distributed under the terms and conditions of the Creative Commons Attribution (CC BY) license (http://creativecommons.org/licenses/by/4.0/).
Copyright: This open access article is published under a Creative Commons CC BY 4.0 license, which permit the free download, distribution, and reuse, provided that the author and preprint are cited in any reuse.


