Submitted:
18 April 2024
Posted:
19 April 2024
You are already at the latest version
Abstract
Background/Purpose: Multimorbidity of malaria, anaemia, and malnutrition (MAMM) is a condition in which an individual cohabits with two or more of these health outcomes and is becoming an emergent public health concern in sub-Saharan African countries. The independent associations of a child’s demographic variables and socioeconomic disparities with a child’s health outcomes have been established in literature. However, the effects of the intersection of these factors on MAMM, while accounting for other covariates have not been studied. Therefore, this study aimed to determine how children’s sex, age and socioeconomic status interact to explain the variations in MAMM among children aged 6-59 months in Nigeria. Methods: Data from the 2018 Nigeria Demographic and Health Survey and the 2018 National Human Development Report (NHDR) were used. The study includes weighted samples of 10,184 children aged 6-59 months in Nigeria. A three-level multilevel mixed effect ordinal logistic regression model such that individual characteristics at level 1 are nested in communities at level 2 and nested in states at level 3 was used. Subsequently, predictive probability charts and average adjusted probability tables were used to interpret the intersectional effects. Five models were created in this scenario. Model 1 is the interaction between the child's sex and wealth status; model 2, child's sex and age; model 3 is between child's age and wealth status; model 4 has the three 2-way interactions of child's sex, age, and household wealth status, and model 5 includes model 4 and the 3-way interactions between a child's sex, age, and wealth quintiles. Results: The prevalence of children with ‘none of the three diseases’ outcomes was 17.3% (1767/10,184), while, 34.4% (3499/10,184) had ‘only one of the diseases’, and 48.3% (4,918/10,184) cohabit with ‘two or more’ of MAMM. However, in the multivariate analyses, model 3 was the best fit compared with other models, so, that the two-way interaction effects of a child's age and wealth status are significant predictors in the model. Children aged 36-47 months living in the poorest households have the probability of 0.11, 0.18, and 0.32 of contracting MAMM above the probability of children of the same age and live in the middle, more prosperous and richest households, respectively, while all other covariates are held constant. Thus, the variation in MAMM over a child's age differs depending on the household wealth quintile. In other words, as the children grow older, variations in MAMM become more evident between the rich and the poor household. Conclusion: Therefore, it is recommended that policies that are geared toward economic redistribution will help bridged the disparities observed in multiple diseases among children aged 6-59 months in Nigeria
Keywords:
multiple diseases
; moderation effects
; predictive margins
; under-five
; interactions
; syndemic
1. Introduction
Multimorbidity of anaemia, malaria, and malnutrition (MAMM) is a condition an individual cohabits with two or more of these health outcomes and is becoming an emergent public health concern in sub-Saharan African countries. A recent study conducted in Nigeria found that one in every two children aged 6-59 months cohabits with two or more MAMM [1]. Similarly, other findings showed that there are 68.1%, 35.5%, and 43.6% children aged 6-59 months in Nigeria who are anaemic [2], malaria positive [3], and malnourished [4], respectively. In low and middle-income countries (LMICs), results from past studies have often pointed out that gender variation in childhood health outcomes exists strongly at the advantage of the girl-child [5,6,7,8,9,10,11,12,13]. The reasons for these have not been explicitly concluded. Also, older children are found to be more prone to diseases when compared to their younger siblings [14,15,16,17,18,19,20,21], just as is often concluded that children from poor households are more at risk of childhood diseases than those from wealthy households [21,22,23,24,25]. In recent times, social stratifications along wealth status have become even more evident in many developing countries, including Nigeria. In terms of diseases, the social classifications in Nigeria have often been distinguishingly between the rich and the poor. It will be interesting to know that the gender-sensitive variations in age stratum are dependent on the variations in the socio-economic status. So, the fundamental tenet of intersectionality theory is the conceptualization of these various social identities [26]. Therefore, the presence of an interaction effect occurs when a second independent variable moderates the relationship between an independent variable and a dependent variable [26,27]. For instance, when there is a variation in the relationship between child’s sex and poor health by child’s age or socioeconomic status (SES), it means there is an interaction effect between the child’s sex and age or SES and the child’s adverse health outcomes. The implications for these are that the ways boy-child and girl-child may cohabit with MAMM may differ for different SES.
Meanwhile, in Nigeria, the independent associations of a child’s sex, age, and household socioeconomic disparities with a child’s independent health and multiple outcomes have been established in literature [1,28]. But the effects of the intersection of these factors have not been reported in literature. In order to determine how gender, age, and socioeconomic status interact to explain disparities in MAMM among children aged 6-59 months in Nigeria, an intersectionality theory was used in this study. Moreover, when there are several forms of inequality within a social group, policies meant to reduce health disparities between them may be ineffective [26]. Therefore, the aim of this study is to determine how child’s sex, age and socioeconomic status interact in the presence of other covariates to explain the variations in MAMM among children aged 6-59 months in Nigeria. The outcome of this study will serve as a guide to policy formulators and implementers to check the growing trend in multiple diseases in children.
2. Methods and Data
2.1. Sampling Techniques and Sample Size
This is a secondary analysis of two cross sectional survey data sets, the 2018 Nigeria Demographic and Health Survey (NDHS), and the 2018 National Human Development Report (NHDR). NDHS serves as the main data, while contextual covariates were extracted from NHDR and merged into NDHS using the state unique identifier. Two stages of stratified cluster sampling are employed by NDHS. First, a proportionate allocation stratified by place of residence (rural and urban) was used to pick a sample of enumeration areas (EAs) independently from each stratum. At the second stage, households were picked from the designated EAs using a systematic sampling technique [29]. The study includes weighted samples of 10184 children aged 6-59 months in Nigeria.
2.2. Variables Definitions
In NDHS, data on anaemia, malaria, and malnutrition were objectively in accordance with World Health Organization standard. However, the classification of each of these health outcomes have been reported in previous studies [2,3,4]. Therefore, to allow for multi-categorical responses represented in three intersecting sets of anaemia, malaria, and malnutrition, the multimorbidity (with three outcomes) was grouped into eight separate categories which were further reclassified to conform with the definition of multimorbidity counts of 0, 1,and 2, representing, ‘no disease’, ‘one disease only, and ‘two or more diseases’, respectively.
2.3. Independent Variables and Rationale
The main independent variables of interest were the two-way and three-way interactions of child’s age, sex, and household wealth quintiles. The rationale for the choice of these variables was on the premises of findings in previous studies to determine the predictors of each of the outcome variables in MAMM (i.e, anaemia, malaria, and malnutrition), among children aged 6-59 months in Nigeria. These variables (child’s sex, age and household socioeconomic status), were outstandingly common statistically significant factors found [2,3,4]. In addition, considering the enormous current social and economic challenges in Nigeria, resulting into social classifications being redefined [30], the position of the interactions with child’s demographics on adverse health outcomes becomes necessary. The definition, classifications and selections of the covariates which include other child-related, parental-related, household-related, community-related, and state/area-related variables have been reported elsewhere [3].
2.4. Model Specification
Five models were created in this scenario, while accounting for the covariates considered in the study. Model 1 included the interaction between child’s sex and wealth status; model 2, child’s sex and age; model 3 is between child’s age and wealth status; model 4 has the three 2-way interactions of child’s sex, age, and household wealth status, and model 5 includes model 4 and the 3-way interactions between a child’s sex, age, and wealth quintiles. The model of best fit was determined using the model with highest log-likelihood, and least of Akaike Information Criteria (AIC), and Bayesian Information Criteria (BIC).
2.5. Data Analysis
Three analytical procedures were used to establish the aims of the study.
- In view of the hierarchical nature of the data sets, coupled with the ordinal classifications of the outcome variable, a three-level mixed effect ordinal logistic regression (MMEOLR) was used to determine the significance of the predictors, such that individual variables at level 1 are nested in the community at level 2 and are nested in the state at level 3. The three-level model was found to be more appropriate than the two-level model or a single-level by the application of likelihood ratio test (the likelihood-ratio test for Level-2 nested in Level-3). The results here are displayed on the supplementary file.
- To better understand the associations of the intersecting independent variables, interaction plots (Dawson, 2014) were drawn for each intersection.
The computations were done using STATA 17 (StataCorp LP: College Station, TX, USA), and p-value less than 0.05 was considered significant for the predictors.
3. Results
Table 1 shows the distributions and correlations of child’s sex, age, and household wealth status on the MAMM among Nigerian children aged 6-59 months. The prevalence of children with ‘none of the three diseases’ outcomes was 17.3% (1767/10,184), while, 34.4% (3499/10,184) had ‘only one of the diseases’, and 48.3% (4,918/10,184) cohabit with ‘two or more’ of MAMM. 51.2% (5217/10184) of the children in the multimorbidity sample were male. Consequently, the percentage of male children with two or more disorders was 50.62% (2641/5217) whereas the percentage for female children was 45.8% (2277/4967). The age range of 12 to 23 months had the highest percentage of children with two or more diseases (multimorbidity), at 51.4% (1245/2422), and the largest number of children overall, at 23.8% (2422/10184). 51.1% (1102/2160) of the children in the 24- to 35-month age group came after them.
At 73.6% (1393/1893), children from the poorest homes made up the largest proportion of those cohabiting with MAMM, followed by the poor household 63.8% (1268/1989). The proportion of children with MAMM decreases as the household SES increases. The Chi square shows that the three principal predictors were strongly associated with the distribution of MAMM. However, the results of the multivariate analyses of the interactions and covariates in odds ratios using a three-level mixed effect ordinal logistic regression (MMEOLR) are contained in the supplementary 1.
3.1. Model Comparison and Fit
Table 2 shows the model comparison indicators. Model 3, which contains the interactions between a child’s age and wealth status while accounting for all the covariates, was adjudged the best fit model using the least AIC (13977.3) and the best combination of log-likelihoods and BICs.
3.2. Accounting for the Intersections
Figure 1(a) illustrates the predictive margins plot of the interaction between a child’s sex and wealth quintiles on MAMM among children aged 6-59 months in Nigeria. The three bands (from bottom to top) represent the outcome status of ‘none of the diseases’, ‘one of the diseases’, and ‘two or more of the diseases’. Each line in the band represents the wealth quintiles. In the upper band, for instance, the probabilities of female children cohabiting with MAMM were generally lower compared with their male counterparts, and the variations differ, but not statistically significant across the wealth status. So, the parallel lines indicate the non-presence of interaction effects between a child’s sex and household wealth quintiles. It implies that the associations between child’s sex and MAMM do not vary by the household wealth quintile, when all the covariates were accounted for. In other words, the household wealth status does not moderate the relationship between the child’s sex and MAMM.
Similarly, model 2 (Figure 1 (b)), illustrates the predictive margins plot of the interaction between a child’s sex and age on MAMM among children aged 6-59 months in Nigeria. Each line in the three outcome bands represents the age groupings for the children. The none-distinct intersection of the lines indicates the non-significant presence of interaction between a child’s sex and age. Though slight variations are seen to exist for the age bundles between male and female at the advantage of the female-child, and these were not statistically significant. Therefore, the predictive effect of a child’s sex on MAMM does not vary by child’s age. In other words, the child’s age does not moderate the relationship between the child’s sex and MAMM. However, model 3 (model of best fit) illustrated in Figure 1 (c) describes the results of the analysis of two-way interaction between a child’s age and household wealth quintile in MAMM among children aged 6-59 months in Nigeria, while accounting for other covariates. Some categories in this interaction display statistically significant relationships with the outcome of interest. From the chart, it shows that some of the lines’ intersections (non-parallel) indicate the existence of interaction effects. For instance, in the band of ‘none of the diseases’ (lower band) and ‘2 or more diseases’ (upper band), the effects of the richest household vary at different points in the child’s age band. So the two-way interactions of a child’s age and wealth status are relevant in the model prediction of MAMM. Thus, the variation in MAMM over a child’s age differs depending on the household wealth quintile [34]. In view of the multi-categories of the predictors, the chart is non-parsimonious to describe. To help in better understanding of the results from the chart, Table 3 (average adjusted probability of interaction table) was created [32,33]. For instance, in the ‘none of the diseases’ group, a child living in the richest household and aged 48-59 months has a probability of 0.31 of staying healthy from MAMM compared with a child of the same age but resides in the poorest household with a probability 0.12 of being healthy from MAMM. Similarly, children aged 36-47 months living in the poorest households have the probability of 0.11, 0.18, and 0.32 above the probability of children of the same age and live in the middle, richer, and richest households, respectively of contracting MAMM, while all other covariates are held constant.
Table 3, further shows that the probability of children staying healthy from MAMM for each child’s age group is highest for children living in the wealthiest households. Similarly, the same pattern is observed in the morbidity (one disease only) group. However, the pattern changed where the probability of children of all ages cohabiting with ‘two or more diseases’ decreases as the wealth quintile increases. In other words, as the children grow older, variations in MAMM becomes more evident between the rich and the poor household. So, in general, the results reflect that children from the richest household with increase in age had a decreased probability of contract MAMM when compared to children living in the poorest household across the various children’s age.
4. Discussion
This study aims to determine whether child’s sex, age and socioeconomic status interact in the presence of other covariates to explain the variations in MAMM among children age 6-59 months in Nigeria. By examining how the individual variables at level 1 nested in the community at level 2 and nested in the state at level 3 affect the co-occurrence of multiple diseases and perceived that some child’s demographic variables (age and sex) will interact with household socioeconomic status (represented by household wealth status) to modify these relationships with MAMM was conducted.
To address the aim of the study, interaction analyses investigating the relationships between the three two-way and one three-way interactions of a child’s sex, age, and household wealth status with MAMM relative to other covariates was carried out. To the best of the authors knowledge, this study is foremost that has considered the relationships between the intersections of child’s sex, age and household wealth status and MAMM, therefore it becomes difficult to directly compare and contrast the findings with previous studies. The results of the intersections between child’s sex and age, child’s sex and household wealth, and child’s age, sex, and wealth status were not statistically significant predictors of MAMM, when adjusted for other covariates. These findings mean: (i),The relationship between a child’s age and MAMM did not vary by the child’s gender, conversely, the relationship between the child’s gender and MAMM did not vary by child’s age. The possible reason for this is that sex variations in adverse health outcomes are usually stronger than age variations. Culturally, mothers or caregivers in a typical Nigerian’s household often treat female children the same way irrespective of their age status, and boys the same way irrespective of their age, especially when they are above two years of age. The reasons for this could be a subject of future research. (ii) The relationship between wealth status and MAMM did not vary by child’s sex. What this means is that the perspective the rich and the poor households hold concerning MAMM do not differ in terms of the sex of their children. The possible reason for this is that in a typical Nigerian’s family, the health of their children is equally important irrespective of their gender. (iii) The inequalities in the relationship between household wealth and MAMM do not vary by child’s age and sex. The reason for this is not known, and could also be subject of future study. However, while considering the interactions between child’s age and household wealth status in the presence of other covariates, the results showed that the effects of wealth status on MAMM varies by child’s age. The implication is that children in the wealthiest households have the highest chance of maintaining a healthy status from MAMM for each child’s age group. A similar pattern was seen in the group of people with morbidity (contracting only one disease). The likelihood of children of all age groups coexisting with ‘two or more diseases’ lowers as the wealth quintile rises. Compared to children living in the poorest households across all age groups, children from the richest household had the lowest chance of getting MAMM as they became older. To put it another way, as the children become older, differences in MAMM between the rich and the poor household become more noticeable. The possible reason for this is that the richest household has the resources to care for the children irrespective of their age. The older the children from the richest household, the more they are knowledgeable of what is available to eat, can ask for anything they would like to eat and gets it, can complain whenever they are unwell and get medical attention promptly. The inverse is the case for children from the poorest where the scarce resources are used more to the advantage of the younger children than the older children. The older children often wander around to scavenge outside the home for survival [35], and in the process are exposed to unhealthy conditions.
The interaction studies in this paper provide strong evidence for the intersectional character of individual-level disparities in multimorbidity among children in Nigeria. Moreover, it specifically draws attention to the partiality of results obtained from studies that only use individual characteristics models to look for patterns of individual and contextual variations in health outcomes. This position is supported by another study [26], which asserted that the results of this nature lend credence to the mounting evidence of connections between social inequalities in health described in the international literature.
Moreover, a significant contribution of this study is on the premises of intersectionality investigation made. A previous study has highlighted that additive processes do not adequately address significant health inequalities at the point of social groupings based on the idea that variations in risk factors associated with health status are independent. Therefore, the partiality of knowledge from such a perspective raises significant questions about how well future programmes can target individuals at risk of bad health outcomes [26]. Given the above, the current study used an intersectionality framework to investigate the interactions of children’s demographics (age and sex) and household socioeconomic (wealth quintiles) inequalities in multimorbidity while accounting for other additive covariates as a way in addressing these problems. Overall, it will presents a better model fit when the interaction terms for the child’s age and household wealth quintile are considered. Also, the data set came from two nationally representative surveys with abundant evidence of hierarchy. Yet, most previous studies in these categories do not account for the multilevel structure or use the proper statistical techniques. But this study applied multilevel methods to account for individual, community, and state variations.
However, this study is not without limitations: (i) because the data sets were cross-sectional, they were unable to identify the distant causes of MAMM cases in Nigerian children aged 6-59 months. This partially gives credence to the rationale of combining acute disease (Malaria) and more chronic health status (Anaemia and malnutrition), together. A longitudinal study, which necessitates participant follow-up on a regular basis, yields more information on the causes [3]. (ii) Because of Nigeria’s high rate of maternal illiteracy, which may have caused recollection errors when answering several questions, the accuracy of the information submitted at the time of the survey could not be verified. (iii) The listwise deletion approach was utilised to handle incomplete data in the variables that remained after some variables were eliminated due to missingness. For the incomplete observation, alternative techniques like multiple imputations could have been applied. But unfortunately, to the best of the authors’ knowledge, appropriate methods and coding to handle the multilevel mixed effect ordinal logistic regression effectively, and subsequently, the predictive margins plots have not been developed in STATA. (iv) The simple classifications of MAMM as counts in this study was to conform with the general definition of multimorbidity, but this has limitations in developing medical and healthcare interventions. According to Academy of Medical Sciences, clustering of diseases would be more relevant for health intervention purposes [36]. This could be a subject of future studies.
5. Conclusion
The implication from this study gives credence to the belief that the social class in Nigeria has now become between the rich and the poor [30]. The relevance of the study’s findings within the broader context of Nigerian public health challenges, demographics and socioeconomic conditions cannot be overlooked. Factors like healthcare access to timely health intervention, educational opportunities especially for mothers and caregiver for increased ‘knowledge, aptitude and practice’ of simple healthcare interventions, and nutritional availability are at the advantage of the increased household SES than in the decreased SES. Children aged 6-59 months among the poorest families are equally important to have access to health care as their counterparts in the wealthy homes. The study concludes that the richer the household, and older the children are, the more protective they become from MAMM. Therefore, it is recommended that policies that are gear toward socioeconomic redistribution to help the poor households can assist in bridging the disparities observed in multiple diseases among children aged 6-59 months in Nigeria. To guide future studies and ensure the continuity of the research on MAMM in Nigeria, longitudinal studies to track changes over time, qualitative research to understand family and community dynamics, or intervention studies to test the effectiveness of specific policies will be needed. In addition, future research could include targeted interventions for at-risk populations (such as children from the poorest household), studies exploring the role of specific socioeconomic policies on health outcomes, or those that will research into the mechanisms through which child’s age and household socioeconomic status protect against MAMM.
Supplementary Materials
The following supporting information can be downloaded at the website of this paper posted on Preprints.org.
Author Contributions
The conceptualization of this study was performed by P.E.O. and K.K.; the formal drafting of manuscript was carried out by P.E.O.; while S.J.W., R.J. and K.K. supervised, revised, and edited the manuscript. All authors have read and agreed to the published version of the manuscript.
Funding
This study is an integral part of P.E.O.’s doctoral study at the Division of Population Health (Formerly known as ‘School of Health and Related Research’) of the University of Sheffield, United Kingdom. The funding for the doctoral study was granted by TETFUND (Nigeria).
Institutional Review Board Statement
The ethical approval to carry out this research study had been granted by the School of Health and Related Research (ScHARR) Ethics Committee of the University of Sheffield (Reference Number: 031534). This study is a secondary analysis of two nationally representative samples. Permission to use the data sets (2018 Nigeria Demographic and Health Survey and 2018 National Human Development Report) had been obtained from two organizations: Inner City Fund (ICF)-International, and United Nations Development Programme (UNDP-Nigeria).
Informed Consent Statement
Informed consent had been obtained by the original owners of the data sets (MeasureDHS and UNDP-Nigeria).
Data Availability Statement
The data set used in this study is available in MeasureDHS https://dhsprogram.com (accessed on 28 January 2020) and UNDP-Nigeria http://hdr.undp.org/sites/default/files/hdr_2018_nigeria_finalfinalx3.pdf (accessed on 3 March 2020).
Acknowledgments
The authors acknowledged the contributions received from ScHARR community. Phillips appreciates the Rector and the management staff of Niger State Polytechnic, Nigeria, for nominating him for the TETFUND (Nigeria) sponsorship of his doctoral program.
Conflicts of Interest
The authors declare no conflict of interest.
References
- Obasohan, P.E. Investigating Multiple Overlaps in the Determinants of Risk Factors of Anaemia, Malaria, and Malnutrition, and Their Multimorbidity, among Children Aged 6 to 59 Months in Nigeria. phd, University of Sheffield, 2022.
- Obasohan, P.E.; Walters, S.J.; Jacques, R.; Khatab, K. Individual, Household and Area Predictors of Anaemia among Children Aged 6–59 Months in Nigeria. Public Health Pract. 2022, 3, 100229. [Google Scholar] [CrossRef] [PubMed]
- Obasohan, P.E.; Walters, S.J.; Jacques, R.; Khatab, K. Individual and Contextual Factors Associated with Malaria among Children 6–59 Months in Nigeria: A Multilevel Mixed Effect Logistic Model Approach. Int. J. Environ. Res. Public. Health 2021, 18, 11234. [Google Scholar] [CrossRef] [PubMed]
- Obasohan, P.E.; Walters, S.J.; Jacques, R.; Khatab, K. Socio-Economic, Demographic, and Contextual Predictors of Malnutrition among Children Aged 6–59 Months in Nigeria | BMC Nutrition | Full Text. BMC Nutr. 2024, 10. [Google Scholar] [CrossRef] [PubMed]
- Hailu, B.A.; Bogale, G.G.; Beyene, J. Spatial Heterogeneity and Factors Influencing Stunting and Severe Stunting among Under-5 Children in Ethiopia: Spatial and Multilevel Analysis. Sci. Rep. 2020, 10, 16427. [Google Scholar] [CrossRef]
- Kassie, G.W.; Workie, D.L. Determinants of Under-Nutrition among Children under Five Years of Age in Ethiopia. BMC Public Health 2020, 20, 399. [Google Scholar] [CrossRef] [PubMed]
- Khamis, A.G.; Mwanri, A.W.; Kreppel, K.; Kwesigabo, G. The Burden and Correlates of Childhood Undernutrition in Tanzania According to Composite Index of Anthropometric Failure. BMC Nutr. 2020, 6, 39. [Google Scholar] [CrossRef]
- Douglas, A.C. Influence of Malaria on Anemia Levels among Children Less than 60 Months of Age. Int. J. Adv. Res. Dev. 2, 5.
- Dwumoh, D.; Essuman, E.E.; Afagbedzi, S.K. Determinant of Factors Associated with Child Health Outcomes and Service Utilization in Ghana: Multiple Indicator Cluster Survey Conducted in 2011 | Archives of Public Health | Full Text. Available online: https://archpublichealth.biomedcentral.com/articles/10.1186/2049-3258-72-42 (accessed on 22 March 2024).
- Mohammed, S.H.; Habtewold, T.D.; Esmaillzadeh, A. Household, Maternal, and Child Related Determinants of Hemoglobin Levels of Ethiopian Children: Hierarchical Regression Analysis. BMC Pediatr. 2019, 19, 113. [Google Scholar] [CrossRef]
- Moschovis, P.P.; Wiens, M.O.; Arlington, L.; Antsygina, O.; Hayden, D.; Dzik, W.; Kiwanuka, J.P.; Christiani, D.C.; Hibberd, P.L. Individual, Maternal and Household Risk Factors for Anaemia among Young Children in Sub-Saharan Africa: A Cross-Sectional Study. BMJ Open 2018, 8, e019654. [Google Scholar] [CrossRef]
- Ntenda, P.A.M.; Chilumpha, S.; Mwenyenkulu, E.T.; Kazambwe, J.F.; El-Meidany, W. Clinical Malaria and the Potential Risk of Anaemia among Preschool-Aged Children: A Population-Based Study of the 2015–2016 Malawi Micronutrient Survey | Infectious Diseases of Poverty | Full Text. Available online: https://idpjournal.biomedcentral.com/articles/10.1186/s40249-019-0607-8 (accessed on 22 March 2024).
- Ojoniyi, O.O.; Odimegwu, C.O.; Olamijuwon, E.O.; Akinyemi, J.O. Does Education Offset the Effect of Maternal Disadvantage on Childhood Anaemia in Tanzania? Evidence from a Nationally Representative Cross-Sectional Study. BMC Pediatr. 2019, 19, N.PAG-N.PAG. [Google Scholar] [CrossRef]
- Ngnie-Teta, I.; Receveur, O.; Kuate-Defo, B. Risk Factors for Moderate to Severe Anemia among Children in Benin and Mali: Insights from a Multilevel Analysis. Food Nutr. Bull. 2007, 28, 76–89. [Google Scholar] [CrossRef] [PubMed]
- Austin, A.M.; Fawzi, W.; Hill, A.G. Anaemia among Egyptian Children between 2000 and 2005: Trends and Predictors. Matern. Child. Nutr. 2011, 8, 522–532. [Google Scholar] [CrossRef]
- Wanzira, H.; Katamba, H.; Okullo, A.E.; Agaba, B.; Kasule, M.; Rubahika, D. Factors Associated with Malaria Parasitaemia among Children under 5 Years in Uganda: A Secondary Data Analysis of the 2014 Malaria Indicator Survey Dataset. Malar. J. 2017, 16, 191. [Google Scholar] [CrossRef]
- Zgambo, M.; Mbakaya, B.C.; Kalembo, F.W. Prevalence and Factors Associated with Malaria Parasitaemia in Children under the Age of Five Years in Malawi: A Comparison Study of the 2012 and 2014 Malaria Indicator Surveys (MISs) | PLOS ONE. Available online: https://journals.plos.org/plosone/article?id=10.1371/journal.pone.0175537 (accessed on 22 March 2024).
- Amare, Z.Y.; Ahmed, M.E.; Mehari, A.B. Determinants of Nutritional Status among Children under Age 5 in Ethiopia: Further Analysis of the 2016 Ethiopia Demographic and Health Survey. Glob. Health 2019, 15, 62. [Google Scholar] [CrossRef] [PubMed]
- Fantay Gebru, K.; Mekonnen Haileselassie, W.; Haftom Temesgen, A.; Oumer Seid, A.; Afework Mulugeta, B. Determinants of Stunting among Under-Five Children in Ethiopia: A Multilevel Mixed-Effects Analysis of 2016 Ethiopian Demographic and Health Survey Data. BMC Pediatr. 2019, 19, 176. [Google Scholar] [CrossRef] [PubMed]
- Geda, N.R.; Feng, C.X.; Henry, C.J.; Lepnurm, R.; Janzen, B.; Whiting, S.J. Multiple Anthropometric and Nutritional Deficiencies in Young Children in Ethiopia: A Multi-Level Analysis Based on a Nationally Representative Data. BMC Pediatr. 2021, 21, 11. [Google Scholar] [CrossRef]
- Tran, T.D.; Biggs, B.-A.; Holton, S.; Nguyen, H.T.M.; Hanieh, S.; Fisher, J. Co-Morbid Anaemia and Stunting among Children of Pre-School Age in Low- and Middle-Income Countries: A Syndemic. Public Health Nutr. 2019, 22, 35–43. [Google Scholar] [CrossRef]
- Chitunhu, S.; Musenge, E. Direct and Indirect Determinants of Childhood Malaria Morbidity in Malawi: A Survey Cross-Sectional Analysis Based on Malaria Indicator Survey Data for 2012. Malar. J. 2015, 14, 265. [Google Scholar] [CrossRef] [PubMed]
- Adekanmbi, V.T.; Kayode, G.A.; Uthman, O.A. Individual and Contextual Factors Associated with Childhood Stunting in Nigeria: A Multilevel Analysis. Matern. Child. Nutr. 2011, 9, 244–259. [Google Scholar] [CrossRef]
- Machisa, M.; Wichmann, J.; Nyasulu, P.S. Biomass Fuel Use for Household Cooking in Swaziland: Is There an Association with Anaemia and Stunting in Children Aged 6-36 Months? Trans. R. Soc. Trop. Med. Hyg. 2013, 107, 535–544. [Google Scholar] [CrossRef]
- Mulatya, D.M.; Mutuku, F.W. Assessing Comorbidity of Diarrhea and Acute Respiratory Infections in Children Under 5 Years: Evidence From Kenya’s Demographic Health Survey 2014. J. Prim. Care Community Health 2020, 11, 2150132720925190. [Google Scholar] [CrossRef] [PubMed]
- Hartnell, S.J. Intersections of Gender, Ethnicity, and Socioeconomic Position in Health in England: A Mixed Methods Study Available online: https://etheses.whiterose.ac.uk/cgi/search/simple?q=ScHARR&_action_search=&_order=bytitle&basic_srchtype=ALL&_satisfyall=ALL.
- Dawson, J.F. Moderation in Management Research: What, Why, When, and How. J. Bus. Psychol. 2014, 29, 1–19. [Google Scholar] [CrossRef]
- Adedokun, S.T. Correlates of Childhood Morbidity in Nigeria: Evidence from Ordinal Analysis of Cross-Sectional Data. PLOS ONE 2020, 15, e0233259. [Google Scholar] [CrossRef] [PubMed]
- National Population Commission (NPC)[Nigeria]; ICF Nigeria Demographic and Health Survey 2018 2019.
- TheCable Rescuing the Nigerian Middle Class. Available online: https://www.thecable.ng/rescuing-the-nigerian-middle-class (accessed on 10 March 2024).
- The Stata Forum Interpretation of Interaction Term Coefficients of an Ordinal Logistic Regression. - Statalist. Available online: https://www.statalist.org/forums/forum/general-stata-discussion/general/1409237-interpretation-of-interaction-term-coefficients-of-an-ordinal-logistic-regression (accessed on 22 March 2024).
- Williams, R. Adjusted Predictions & Marginal Effects for Multiple Outcome Models & Commands (Including Ologit, Mlogit, Oglm, & Gologit2). 2021, 10.
- Williams, R. Interpreting Interaction Effects; Interaction Effects and Centering. 2021, available at: https://www3.nd.edu/~rwilliam/, 8.
- Moran, M. Statistical Interaction: More than the Sum of Its Parts. Available online: https://www.statisticssolutions.com/statistical-interaction-more-than-the-sum-of-its-parts/ (accessed on 17 August 2022).
- Obasohan, P. Religion, Ethnicity and Contraceptive Use among Reproductive Age Women in Nigeria. Int. J. MCH AIDS IJMA 2014, 3. [Google Scholar] [CrossRef]
- Academy of Medical Science Multimorbidity: A Priority for Global Health Research Overview and Key Messages 2018.
Figure 1.
Predictive margins plot of interaction effects.
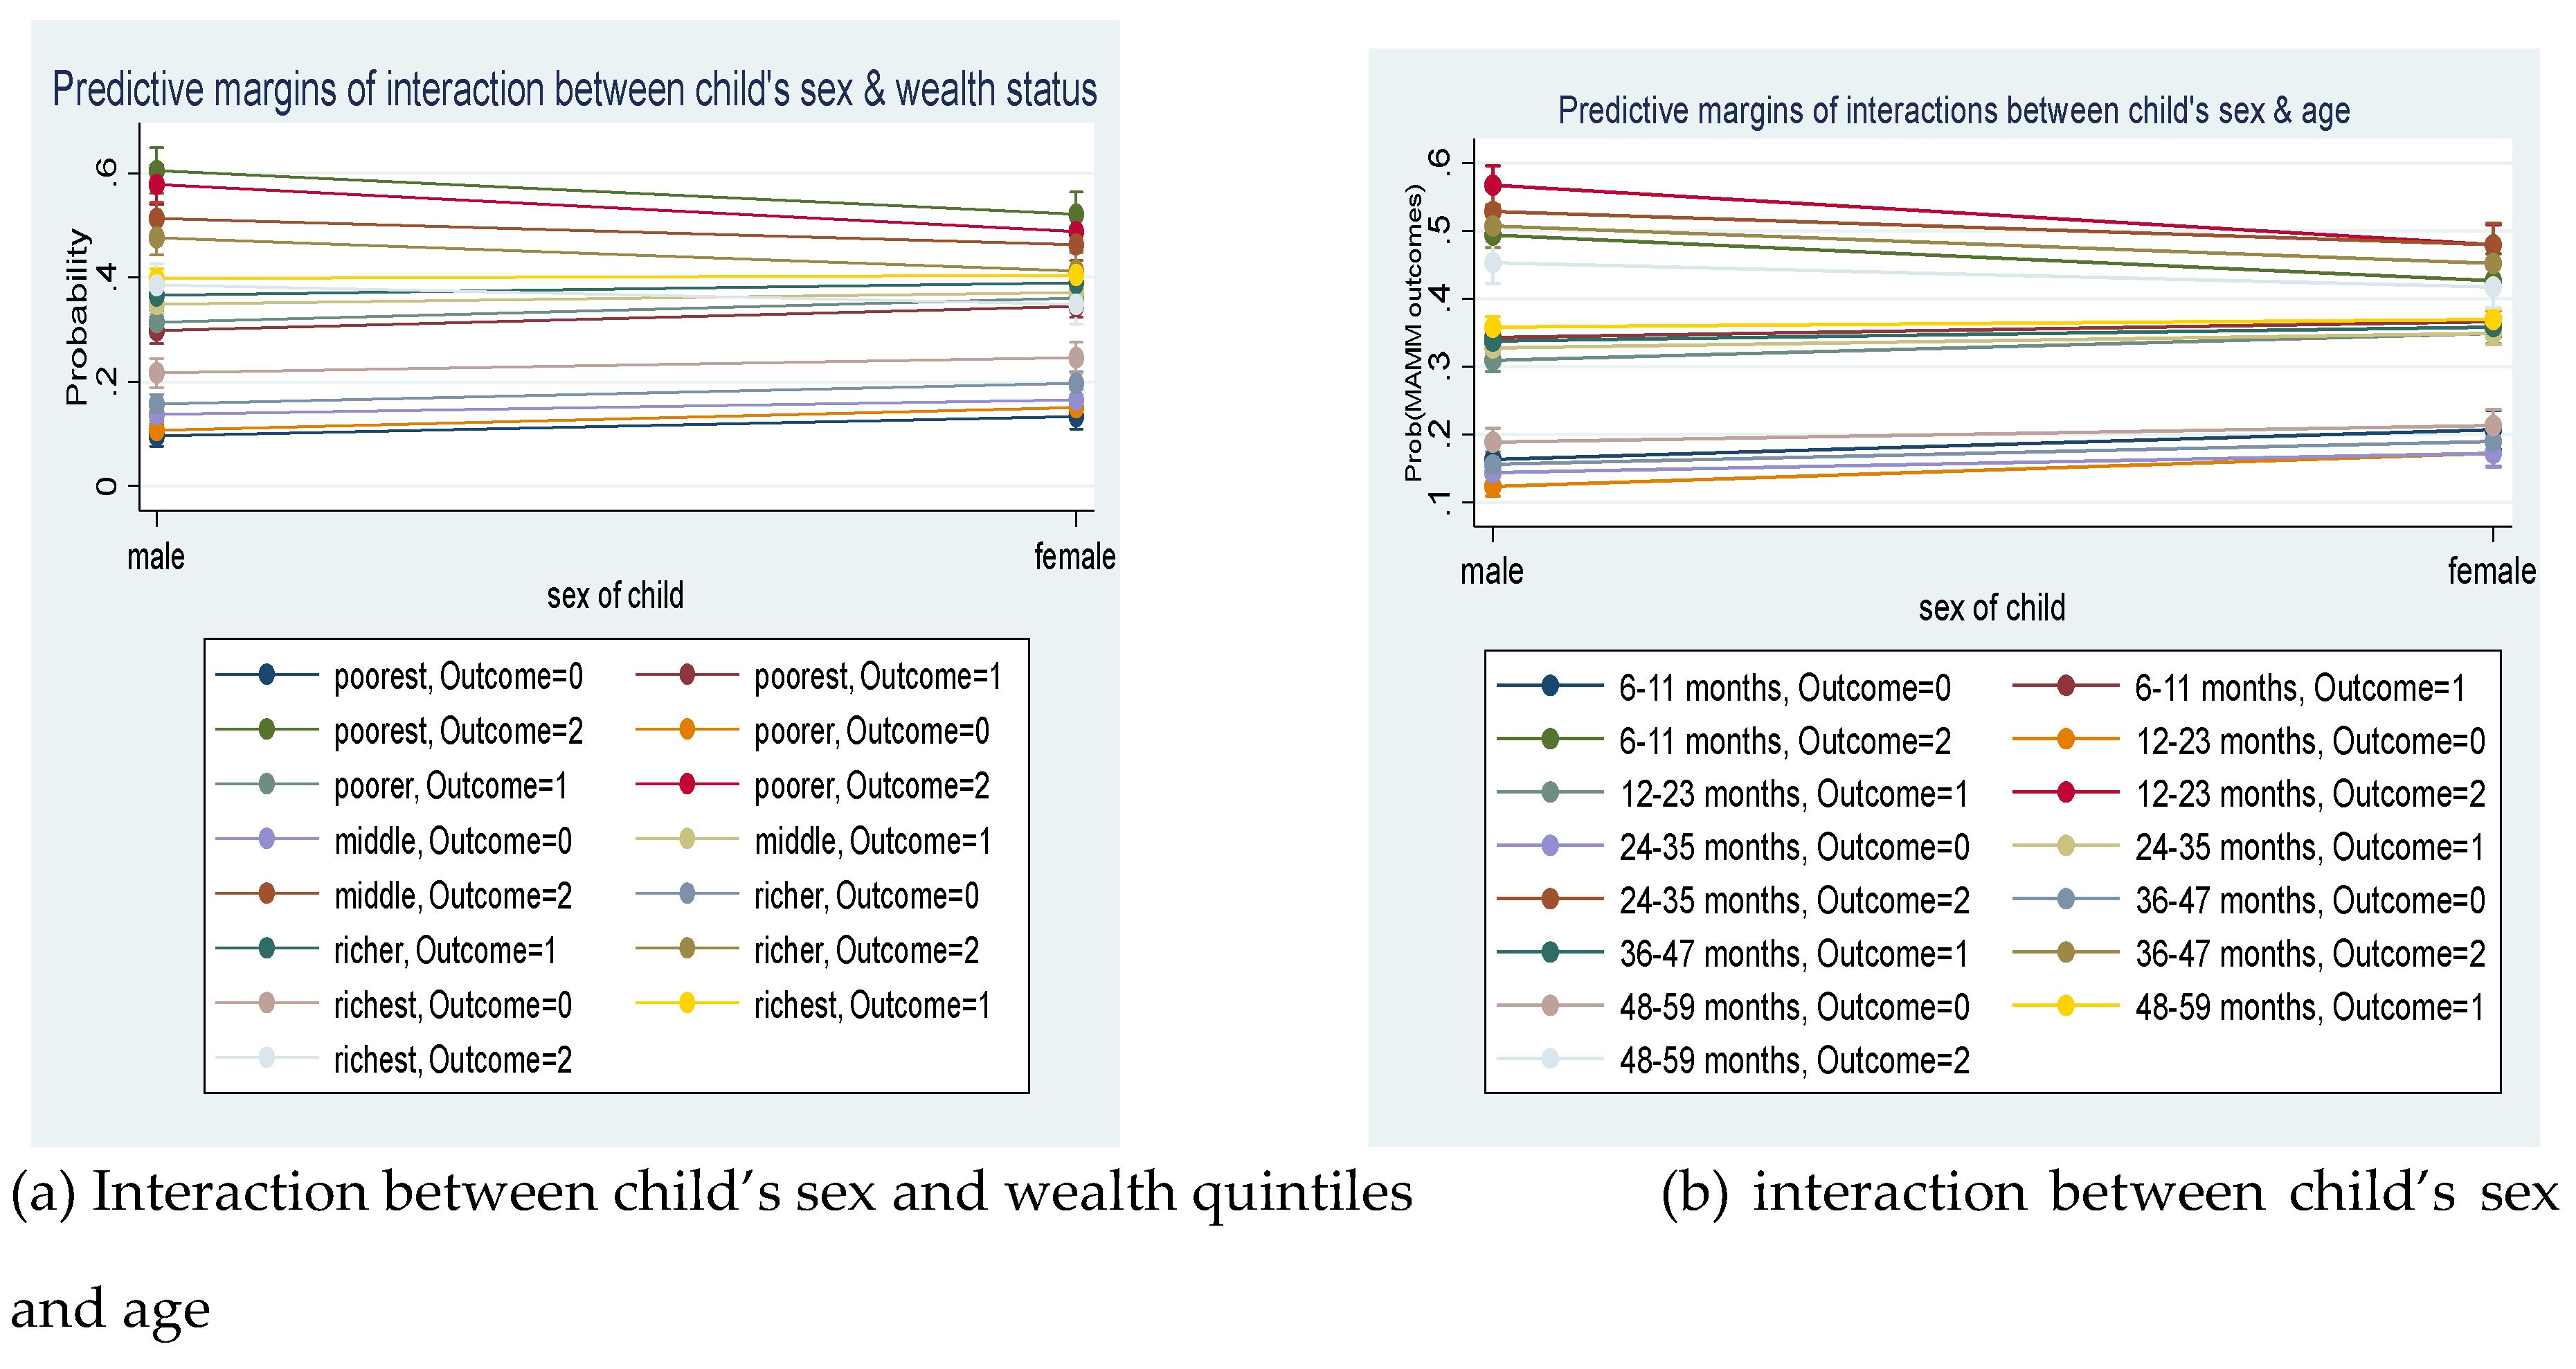
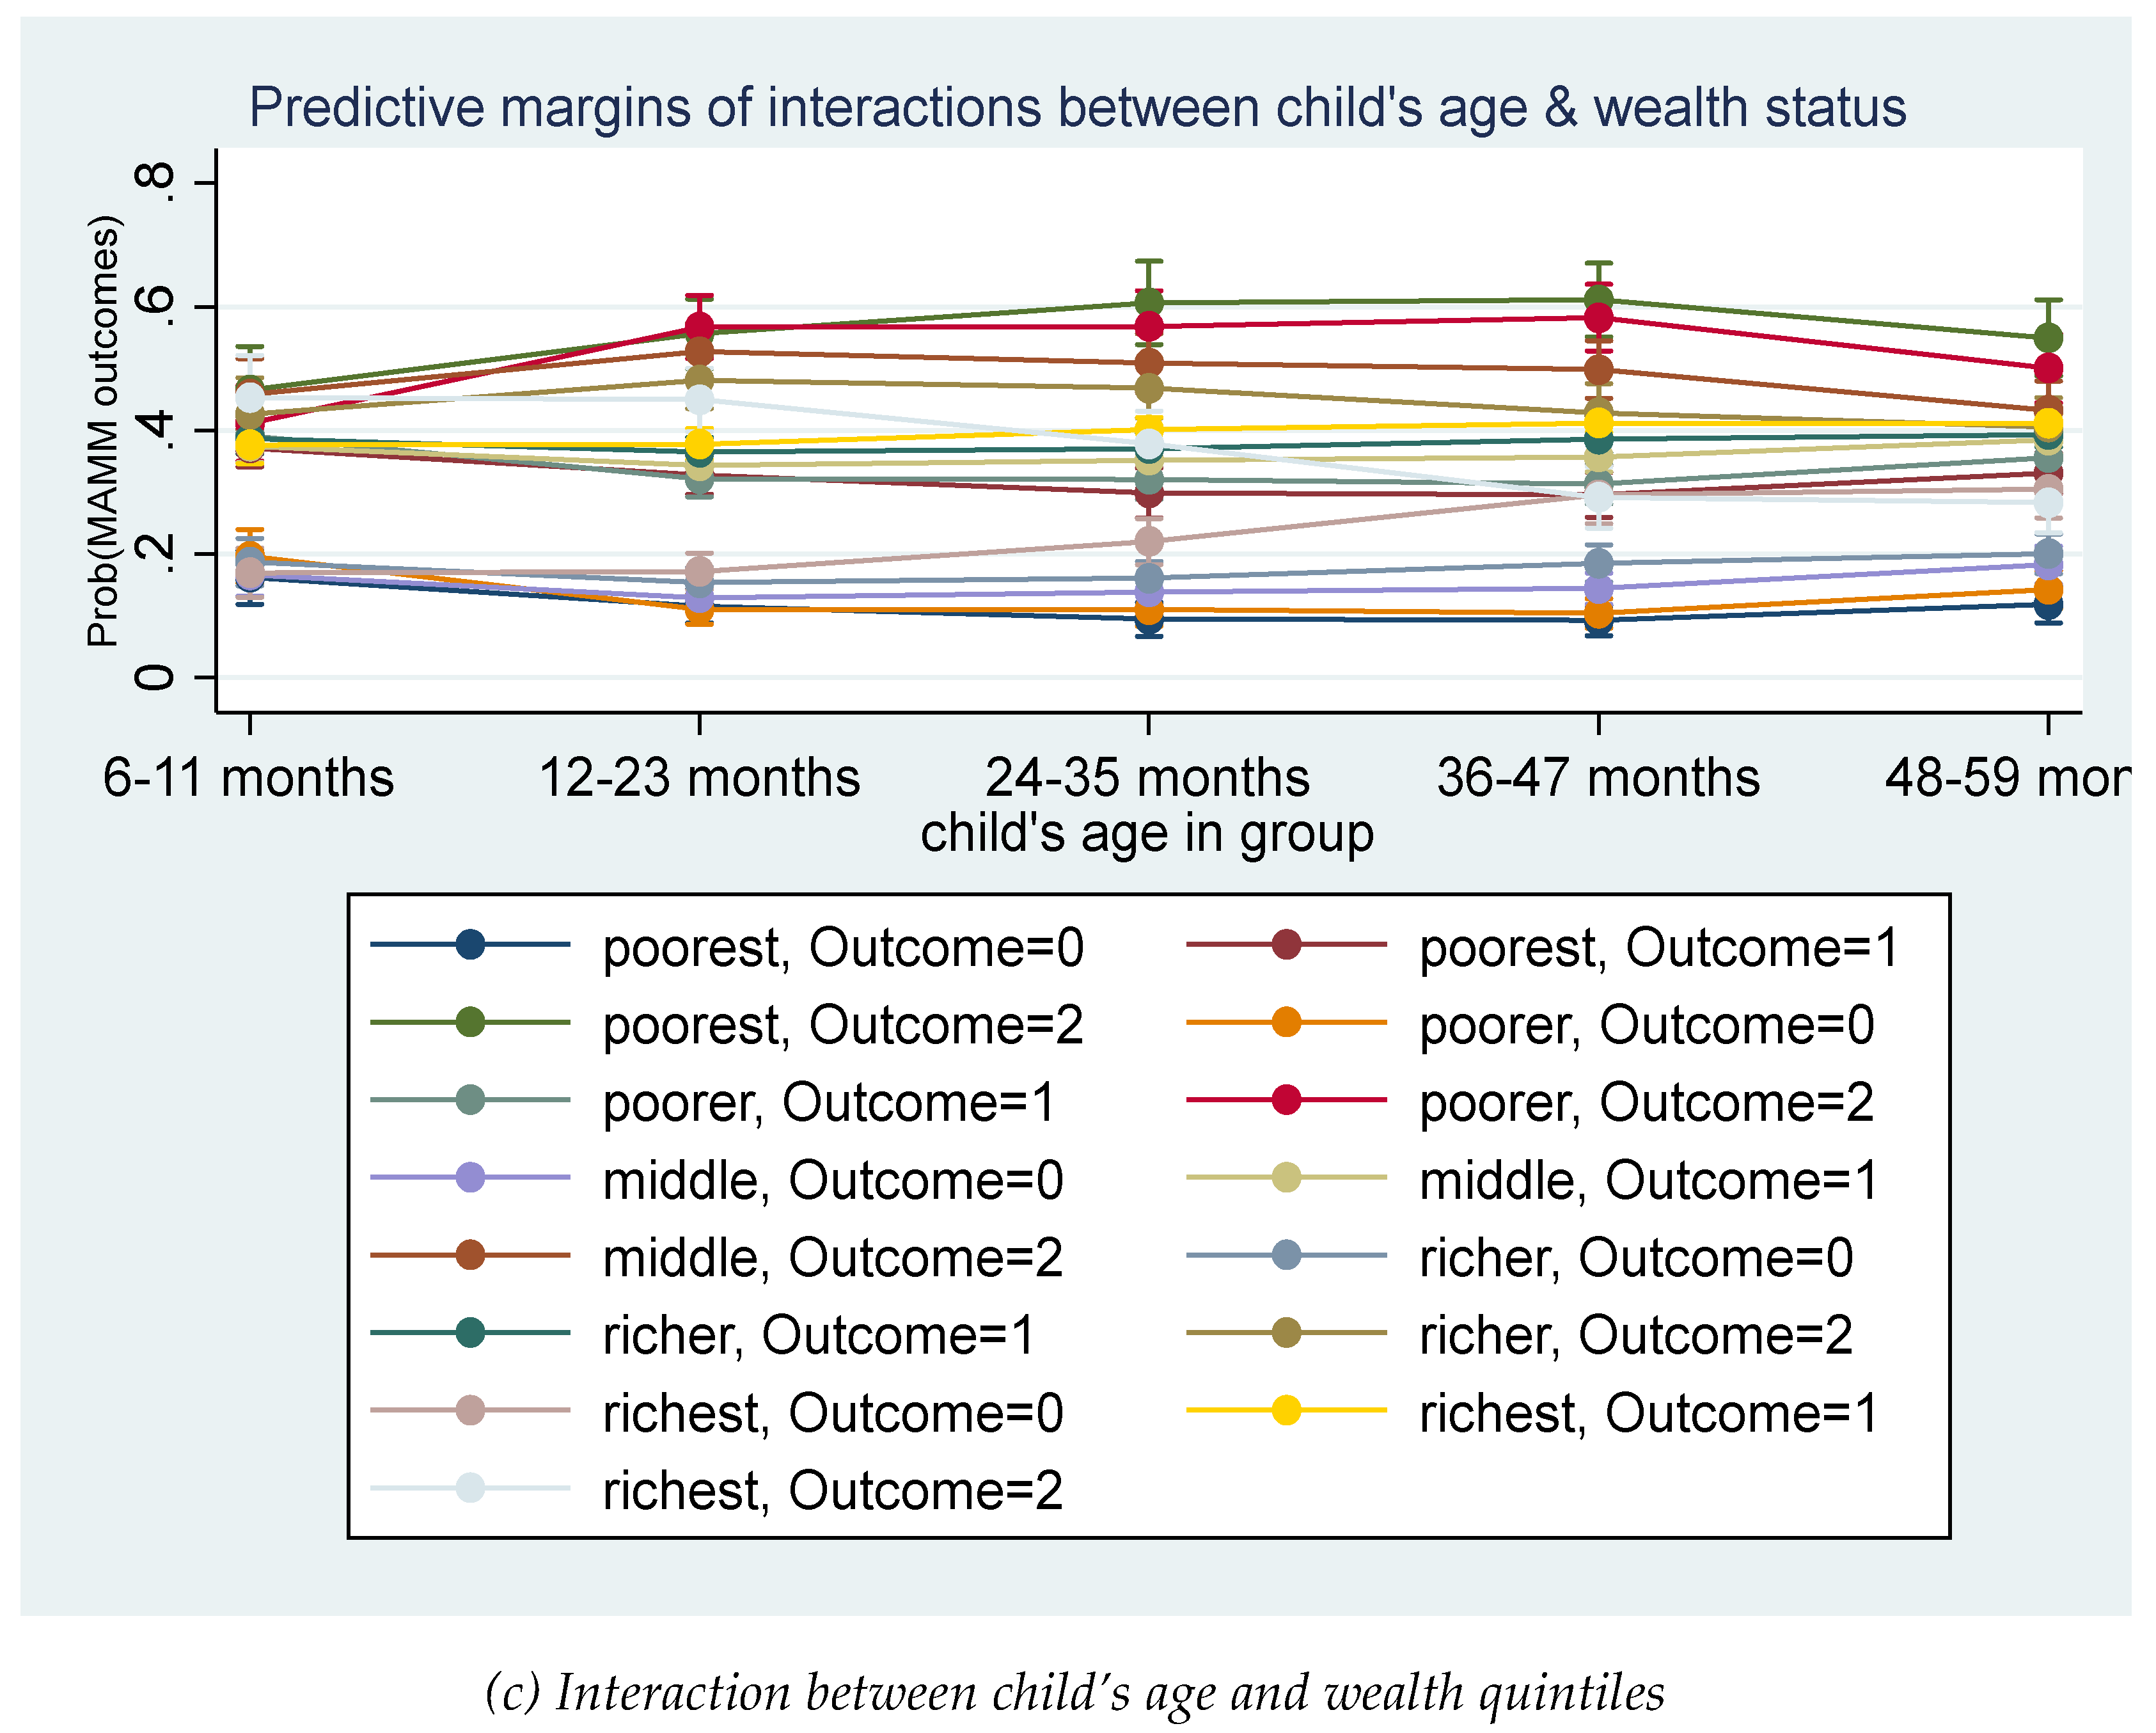

Table 1.
Characteristics and association of predictors with MAMM.
| Multimorbidity | Chi-square | ||||
|---|---|---|---|---|---|
| Variables | Total | None of the diseases | One disease only | Two or more the diseases | |
| n(%) | n(%) | n(%) | n(%) | ||
| Child’s sex | χ2 (2) = 25.03, p=0.0002 | ||||
| Male | 5217(51.23) | 841(16.13) | 1734(33.25) | 2641(50.62) | |
| Female | 4967(48.77) | 926(18.64) | 1764(35.52) | 2277(45.84) | |
| Child’s age in group | χ2 (8) = 205.55, p<0.0001 | ||||
| 6-11 months | 1232(12.1) | 165(13.35) | 566(45.91) | 502(40.74) | |
| 12-23 months | 2422(23.78) | 289(11.95) | 888(36.66) | 1245(51.39) | |
| 24-35 months | 2160(21.21) | 363(16.82) | 694(32.13) | 1102(51.05) | |
| 36-47 months | 2227(21.87) | 452(20.32) | 664(29.83) | 1110(49.85) | |
| 48-59 months | 2143(21.04) | 498(23.23) | 687(32.06) | 958(44.71) | |
| Household wealth index | χ2 (8) = 1635.53, P<0.0001 | ||||
| Poorest | 1893(18.59) | 109(5.73) | 392(20.7) | 1393(73.57) | |
| Poorer | 1989(19.53) | 166(8.33) | 555(27.9) | 1268(63.77) | |
| Middle | 2139(21) | 328(15.35) | 753(35.19) | 1058(49.46) | |
| Richer | 2144(21.05) | 445(20.75) | 876(40.85) | 823(38.4) | |
| Richest | 2019(19.83) | 720(35.66) | 924(45.75) | 376(18.6) | |
| MAMM status | 10184(100) | 1767(17.35) | 3499(34.36) | 4918(48.29) | |
Table 2.
Distribution of model fit.
| Model | Number of covariates | Log-likelihood | AIC | BIC |
|---|---|---|---|---|
| Model 1 | Child’s sex * wealth status + all the covariates | -6933.6 | 14015.1 | 14530.2 |
| Model 2 | Child’s sex * age + all the covariates | -6933.4 | 14014.8 | 14529.9 |
| Model 3 | Child’s age * wealth status + all the covariates | -6902.6 | 13977.3 | 14575.9 |
| Model 4 | Child’s sex * wealth status + child’s sex * age + child’s age * wealth status + all the covariates | -6898.5 | 13985.03 | 14639.4 |
| Model 5 | Child’s sex * age * wealth status + all the covariates | -6890.8 | 14001.6 | 14767.4 |
Table 3.
Average adjusted probability for interactions of child’s age and wealth status.
| Disease classification | Age (Months) | Household wealth status | ||||
| Poorest | Poorer | Middle | Richer | Richest | ||
| None of the disease | 06-11 | 0.162 | 0.196 | 0.166 | 0.187 | 0.17 |
| 11-23 | 0.116 | 0.111 | 0.129 | 0.153 | 0.172 | |
| 23-35 | 0.094 | 0.11 | 0.138 | 0.161 | 0.22 | |
| 35-47 | 0.092 | 0.104 | 0.144 | 0.185 | 0.296 | |
| 47-59 | 0.119 | 0.143 | 0.182 | 0.201 | 0.305 | |
| One disease only | 06-11 | 0.372 | 0.392 | 0.375 | 0.387 | 0.377 |
| 11-23 | 0.328 | 0.322 | 0.343 | 0.365 | 0.378 | |
| 23-35 | 0.299 | 0.321 | 0.352 | 0.371 | 0.401 | |
| 35-47 | 0.296 | 0.313 | 0.357 | 0.386 | 0.412 | |
| 47-59 | 0.331 | 0.356 | 0.385 | 0.394 | 0.412 | |
| Two or more diseases | 06-11 | 0.466 | 0.412 | 0.459 | 0.426 | 0.454 |
| 11-23 | 0.557 | 0.568 | 0.528 | 0.482 | 0.45 | |
| 23-35 | 0.607 | 0.569 | 0.509 | 0.468 | 0.378 | |
| 35-47 | 0.612 | 0.583 | 0.499 | 0.429 | 0.292 | |
| 47-59 | 0.55 | 0.501 | 0.433 | 0.406 | 0.283 | |
Disclaimer/Publisher’s Note: The statements, opinions and data contained in all publications are solely those of the individual author(s) and contributor(s) and not of MDPI and/or the editor(s). MDPI and/or the editor(s) disclaim responsibility for any injury to people or property resulting from any ideas, methods, instructions or products referred to in the content. |
© 2024 by the authors. Licensee MDPI, Basel, Switzerland. This article is an open access article distributed under the terms and conditions of the Creative Commons Attribution (CC BY) license (http://creativecommons.org/licenses/by/4.0/).
Copyright: This open access article is published under a Creative Commons CC BY 4.0 license, which permit the free download, distribution, and reuse, provided that the author and preprint are cited in any reuse.


