

Submitted:
16 April 2024
Posted:
17 April 2024
You are already at the latest version
Abstract
Photoplethysmography (PPG) is widely utilized in wearable healthcare devices due to its convenient measurement capabilities. However, the unrestricted behavior of users often introduces artifacts into the PPG signal. As a result, signal processing and quality assessment play a crucial role in ensuring that the information contained in the signal can be effectively acquired and analyzed. Traditionally, researchers have discussed signal quality and processing algorithms separately, with individual algorithms developed to address specific artifacts. In this paper, we propose a quality-aware signal processing mechanism that evaluates incoming PPG signals using signal quality index (SQI) and selects the appropriate processing method based on the SQI. Unlike conventional processing approaches, our proposed mechanism recommends processing algorithms based on the quality of each signal, offering an alternative option for designing signal processing flows. Furthermore, our mechanism achieves a favorable trade-off between accuracy and energy consumption, which are the key considerations in long-term heart rate monitoring.
Keywords:
Photoplethysmography
; Signal Quality Assessment
; Healthcare
1. Introduction
With the widespread use of wearable devices, photoplethysmography (PPG) has great potential for long-term vital sign monitoring to improve public health and alleviate the increasing obesity rate problem and medical burden. However, PPG is normally collected via wearable devices that are prone to suffer from artifacts. Signal corruption by artifacts will negatively influence measurement accuracy. With regards to this, PPG faces two major challenges in achieving long-term vital sign monitoring: 1) inaccurate vital monitoring caused by unstable signal quality, and 2) insufficient battery capacity for long-term monitoring.
In many PPG research, they focus on optimizing processing algorithms to eliminate particular types of motion or noise artifacts [1,2,3,4,5] to ensure an accurate measurement. Those artifacts were generated under different circumstances, which includes fast running [1,2,6], daily life activities [3,4], coughing [5] and etc. However, under the long-term monitoring scenario, PPG signals could be collected under different circumstances by the time, which means the signal quality of collected PPG varies over time. Therefore, we suggest that selectively choosing processing algorithm regarding signal quality, which is illustrated in Figure 1, could bring benefit to the monitoring system in terms of accuracy and energy consumption as [7] stated that processing unit account power consumption for a large proportion (about 40%).
Conventionally, researchers discussed signal quality and processing algorithms separately. Some researchers work on developing or finding an optimal signal quality index (SQI) for represents or quantify the PPG’s quality [8,9,10] and used them as features to distinguish clean and corrupted PPG segments through machine learning techniques [11,12,13,14]. However, little to no related works discuss the processing algorithm selection regarding SQIs. We have only found that Zhang et al. [2] used kurtosis of PPG spectrum from 0.8 Hz to 2.5 Hz, which is called SQI, to ensure the hand motions are reduced sufficiently, then to trigger the processing algorithm.
With regards to this, this paper presents a quality-aware processing mechanism of PPG signal for long–term heart rate monitoring, which is an extension of [11]. The proposed mechanism evaluates incoming PPG signals by SQIs, and selectively chooses an algorithm for processing. We would like to give more options to the signal processing process in proposed mechanism. When the incoming PPG signal has better quality, the proposed mechanism tends to select a light-weight processing algorithm. Therefore, we achieved higher efficiency by avoiding computation-intense algorithms while maintaining similar accuracy. The main contributions of this work are as follows:
- 1.)
- To the best of our knowledge, we are the first to analyze the relation between PPG’s processing algorithms and algorithm selection framework regarding signal quality indices.
- 2.)
- We presented a novel quality-aware signal processing mechanism that selectively chooses algorithms regarding incoming signal quality indices. The proposed mechanism enables a favorable trade-off between accuracy and energy consumption, which are the key considerations in long-term heart rate monitoring.
2. Background
In the conventional signal processing flow, researchers tend to use a robust algorithm to make the measurement system can adapt to high-noise scenarios. These powerful algorithms usually require much processing effort to ensure that the information contained in the signal can be acquired and analyzed. According to our observation, most of these robust algorithms work well in removing artifacts, thus achieving lower errors in the measurement. To investigate the effect of a particular algorithm, we have performed a simple experiment to show the differences between the "good" and "poor" algorithms.
2.1. Effect Comparison between Processing Algorithms
In this experiment, we initially analyze how the processing algorithm affects the PPG signals based on the case study of heart rate estimation. We took 400 10-s PPG segments for this experiment. These segments undergo different processing algorithms before performing heart rate estimation, which is spectral peak detection from PPG’s spectral between 0.83Hz and 2.16Hz. In Figure 2, raw PPG segments are directly used in estimating H.R., while in Figure 2, we applied a bandpass filter (0.83Hz-2.16Hz and SSA in Figure 2. These three figures represent signal processing flow with (a) no signal processing, (b) simple signal processing, and (c) intense signal processing, respectively. The grid matrices indicate the estimated H.R. error from the 400 PPG segments in different scenarios. As shown in Figure 2, these three grid matrices have different distributions of black spots. However, overall, the root mean square error (RMSE) of raw signals are greatest (14.74 BPM), the second is applying bandpass filter (11.60 BPM), and the lowest (8.69 BPM) is applying the computational-intense processing algorithm, SSA.
2.2. Relation between Processing Algorithms
According to Figure 2, we did see some pattern between the error heatmap between three scenarios. To simplify the analysis, we said that the processing algorithm is sufficient for this PPG signal if the H.R. error of processed PPG is less than 5 BPM. With setting up this rule, these gray-scale heatmaps will turn into binary heatmaps. Therefore, we could make further analyses based on these maps.
As illustrated in Figure 3, we made a venn diagram to visualize the effect of applying a processing algorithm and describe the relationship between each algorithm. Initially, there are 215 raw segments able to use in estimating H.R., which is framed by an orange circle in Figure 3. When the signals are applying a bandpass filter, the signal quality change, and the circle of the venn diagram move and expand to the blue circle, this process makes the set bigger, increasing the high-quality signal from 215 to 265. It tells signal processing help in improving quality, thus producing a lower error rate. However, there are several interesting points we can observe from this venn diagram, which are,
- 1.
- Signal processing does not work for every signal; 7 out of 215 signals become worse if we apply a signal process (bandpass or SSA).
- 2.
- Computational-intense algorithm, like SSA, has a bigger set than the simpler algorithm. However, there is a significant intersection between these three sets, which have 206 signals. For those signals within the intersection, we could bypass the computational-intense algorithm if we selectively choose the processing algorithm.
- 3.
- The union of these three sets generates a bigger set. By selectively choosing an algorithm, we can improve overall accuracy theoretically.
With regards to this, we were motivated to create a quality-aware processing algorithm selection mechanism with signal quality index (SQI).
3. Methodology
In this chapter, we will present an exposition of the operational principles of our mechanism. Our approach is based on the characteristic features of signal quality and involves the selection among several processing algorithms. On the whole, our mechanism can be delineated into two main components, namely the Formation of processing algorithm portfolio and the Quality-aware selection mechanism, as illustrated in Figure 4. Subsequent sections will provide detailed descriptions of their respective implementation intricacies.
3.1. Formation of Processing Algorithm Portfolio
In this subsection, we would like to form an algorithm portfolio for two reasons, which are, 1.) It is harder for a classifier to select among nine processing algorithms. We need more data for the training procedure; 2.) Besides, some algorithms have a similar effect to others, selecting among these algorithms will become meaningless. Hence, we will provide the guideline for how we form the algorithm portfolio for the proposed quality-aware processing mechanism.
We have survey several processing algorithms commoly used in PPG processing [1,15,16,17,18,19], which are shown in Table 1. These algorithms can be categorized into two groups, which are the static filtering method, and the signal decomposition method.
3.1.1. Similarity between Processing Algorithms
To avoid choosing a processing algorithm with similar behavior, we must evaluate the similarity between different algorithms. Then we can remove those highly-correlated algorithms for a smaller algorithm portfolio. To measure the similarity of the algorithm’s behaviors, we investigate the effect of each processing algorithm brought to the application’s outcome. Figure 5 shows the effect brought by the different processing algorithms. We have used different algorithms in this experiment, then we compare the outcome of each processed signal. After cross-checking with the reference H.R. calculated from ECG, we can know which PPG segments can be processed by the algorithm. If the PPG segments have an estimated H.R. error lower than 5 BPM, the segment will be denoted as , which mean it is a high-quality signal (H.R. error ≤ 5 BPM) after processing. Otherwise, the data is labeled as as it got a high-error result (H.R. error > 5 BPM).
Regarding these two binary sequences, we used hamming distance [20] to evaluate the similarity between the two sequences. The hamming distance is defined as the number of places in which u and v differ, that is, . In the example of Figure 6, the hamming distance between the SVD and SSA algorithm equals 1, and then we normalize that to 1/8. If the calculated hamming distance is small, the two sequences are similar. That is, the difference in impact between these two processing algorithms is insignificant.
We continue this process to calculate the hamming distance between each pre-processing algorithm. The result is summarized in Table 2, which shows the hamming distance between each algorithm, lower value of hamming distance indicated a higher similarity. For example, bypass and SSA have greatest hamming distance, which is 0.198, indicates they have different impact to the signal. On the other hand, LPF and bypass has smaller hamming distance, indicating their impact on signal are similar.
3.1.2. Formation of Processing Algorithm Portfolio
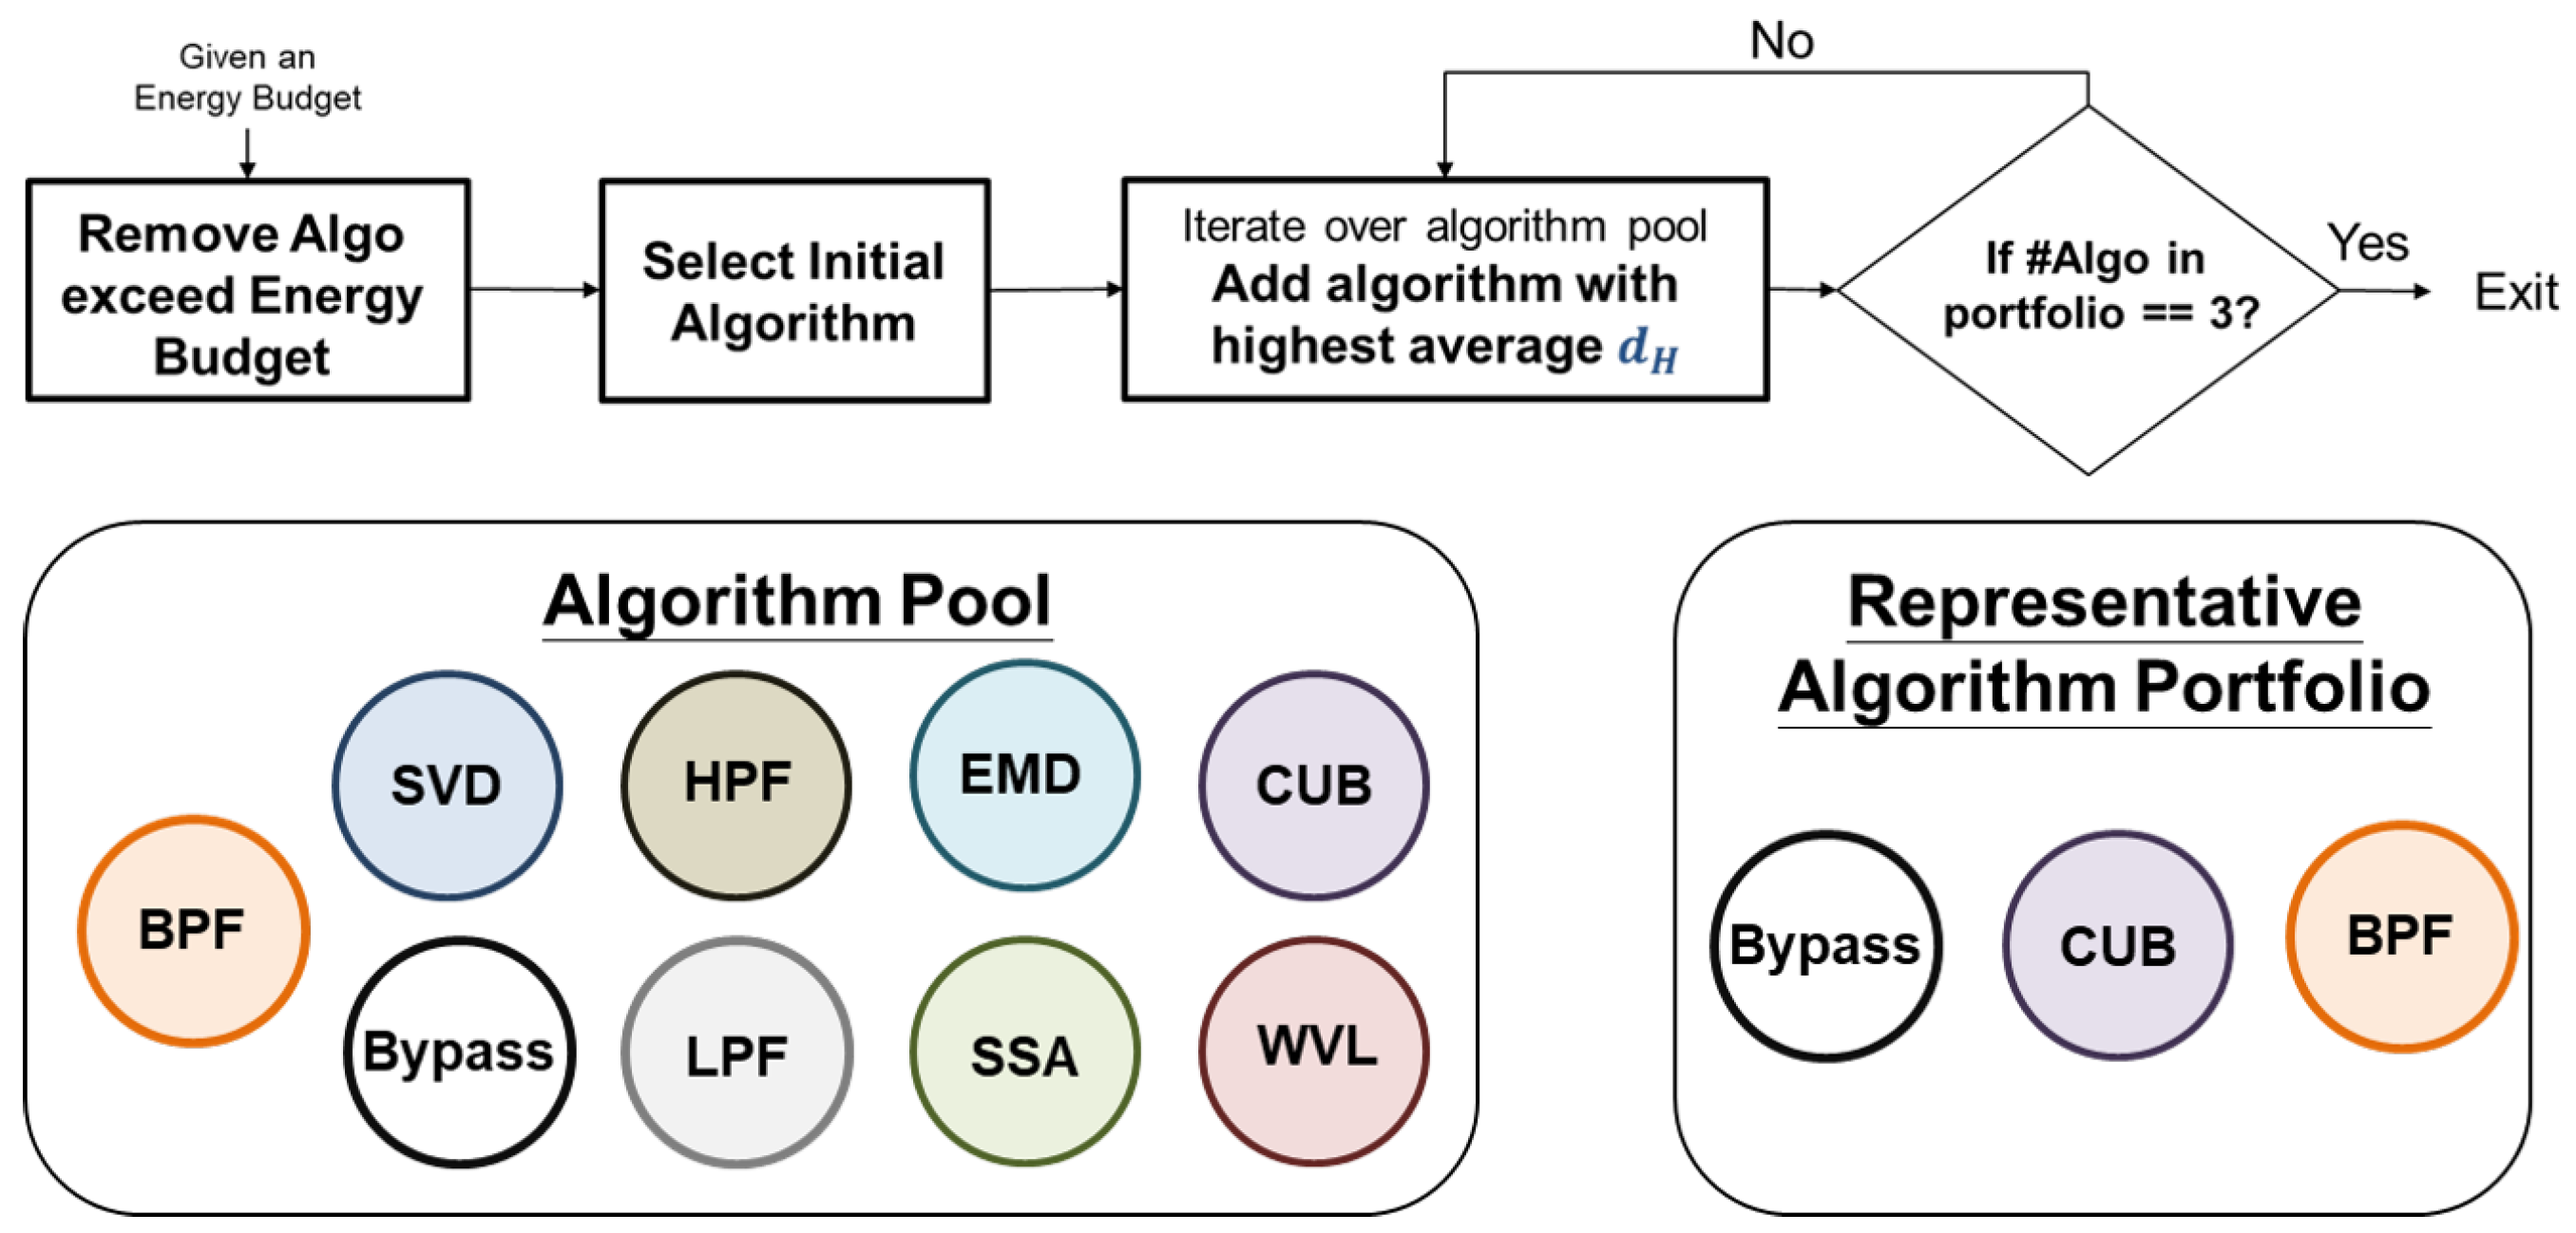
A diverse algorithm portfolio can provide more options for signal processing, thereby leading to improved results. Thus, we adopt a greedy approach to select algorithm from the pool until the number of algorithm in the portfolio reaches three. The selection process is primarily based on the metric introduced earlier, namely, hamming distance. The process comprises three steps:
- 1.)
- Remove Algorithm exceed Energy Budget: Given the energy constraint of every system, the initial step in forming the algorithm portfolio involves the elimination of algorithm that surpass the predetermined energy budget provided by the developer.
- 2.)
- Select initial algorithm: We will select "Bypass" as the initial algorithm in our framework due to its necessity as an option for preserving high-quality signals without processing. This feature could also contribute to energy conservation.
- 3.)
- Iterate over the pool to select algorithm with highest average hamming distance: The next step is to iterate over the algorithm pool, and for each candidate, we will compare it to the selected algorithm. We will compute the average hamming distance between the candidate and the selected algorithm, and select the candidate with the highest average hamming distance to be added to the portfolio.
- 4.)
- Check if number of selected algorithm is equals to 3: Terminate if the selected algorithm is equals to 3.
Choosing algorithms based on the hamming distance metric can lead to a more diverse algorithm portfolio, allowing for processing of a wider range of signals. To investigate this claim, we conducted an experiment. Firstly, we randomly selected algorithm combinations with different average hamming distances. Subsequently, we utilized our proposed quality-aware processing mechanism (to be introduced in the next chapter) to select the appropriate algorithm based on the incoming signal quality. The performance metric used to compare the different portfolios was the accuracy of heart rate estimation.
The results, as depicted in Figure 7, reveal a Pearson correlation coefficient of approximately 0.75 between the two variables, indicating a strong correlation [21]. This finding implies that the algorithm portfolio formation process can play a beneficial role in enhancing the performance of the proposed framework.
3.2. Quality-Aware Selection Mechanism
In this subsection, we present the implementation details of the quality-aware selection mechanism. The proposed mechanism is implemented as follows. Initially, an incoming PPG signal is passed through an feature extractor, which calculates features that represent the signal quality. Subsequently, these SQIs are input to a classifier that determines which algorithm should be used. The overall system architecture is depicted in Figure 9.
Figure 8.
The procedure of selection method with hamming distance.
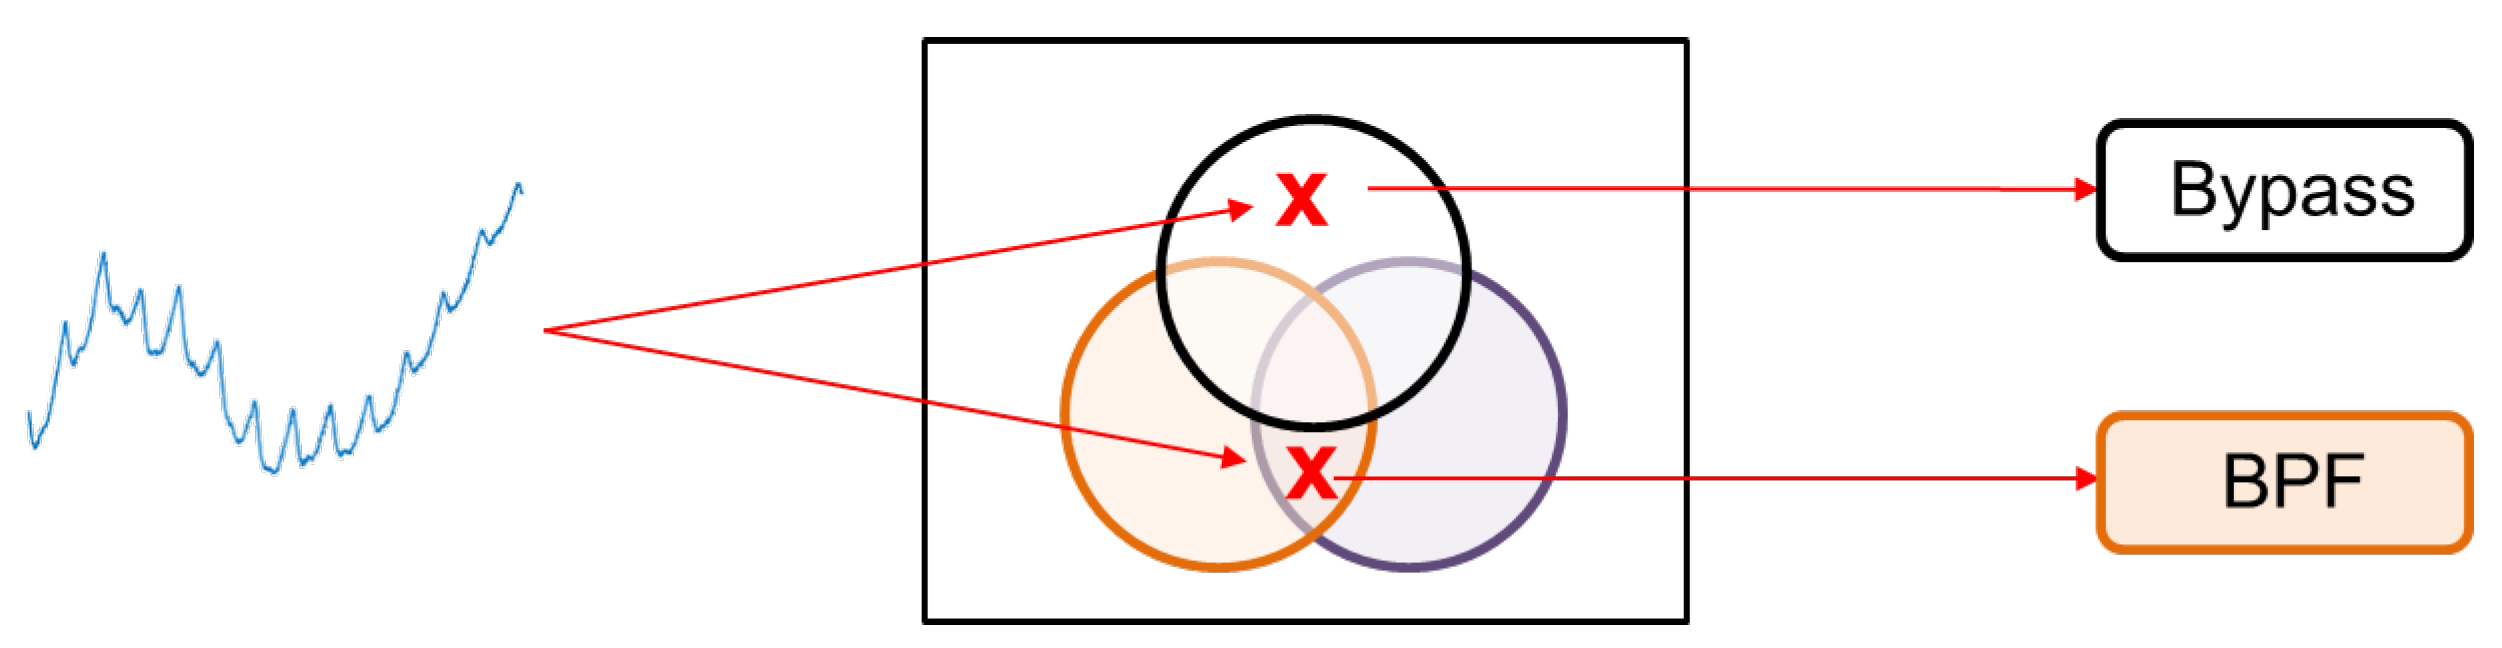
In order to demonstrate proposed mechanism, we present a venn diagram in Figure 10. The purpose of this diagram is to identify the region to which the incoming PPG signal belongs. Based on the region, the appropriate algorithm is recommended for processing.
Figure 9.
Overall flow of proposed quality-aware selection mechanism.
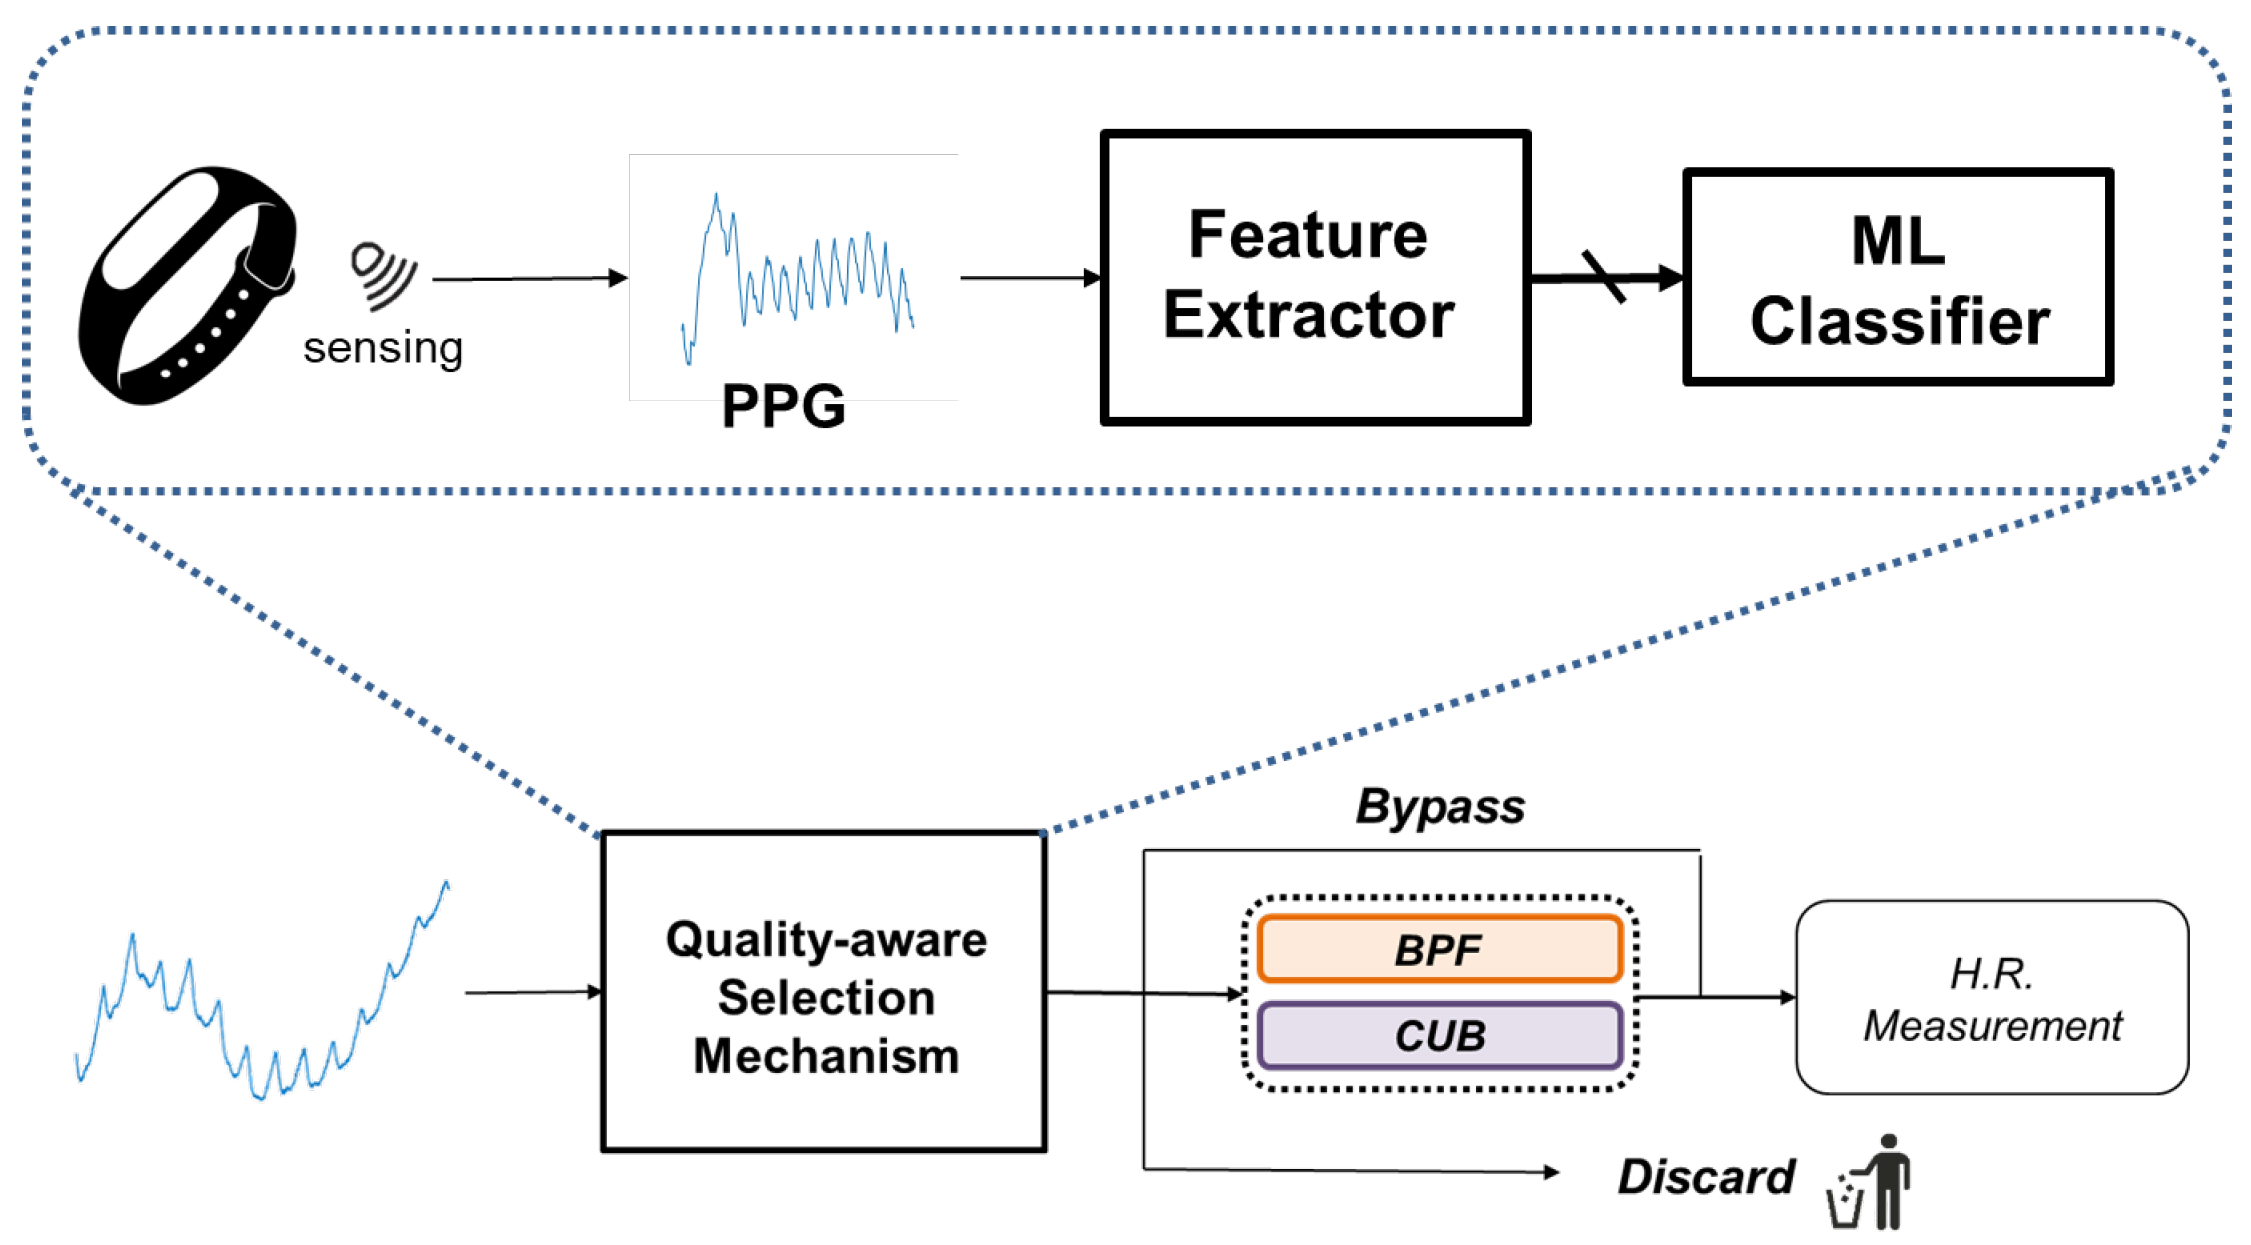
Figure 10.
Illustration diagram of proposed mechanism by venn diagram.
3.2.1. Feature Extraction
We have extracted several low-complexity features for signal quality evaluation to achieve an efficient system. The SQIs we used have been summarized in Table 3. These features include statistical features and frequency-domain features. Statistical features include median, standard deviation (STD), kurtosis, skewness, and entropy. They are commonly used to denote the statistical properties of the signal in the time domain. Frequency-domain features, such as the standard deviation of the power spectrum and the total power at specific frequency intervals, reflect the power of the incoming signals. We can observe the frequency components to determine whether the signal is affected by noise.
3.2.2. Classifier Design
The present classification problem involves the determination of which region of the Venn diagram an incoming PPG signal belongs to, which constitutes a multi-label, multi-class problem. Specifically, there are several options for each PPG signal, thereby resulting in a multi-class problem. At the same time, each PPG signal is eligible for several options, as indicated by correct signs in multiple columns, resulting in a multi-label problem. These aspects are illustrated in Figure 11. Therefore, we have made some design on the ML classifier for this multi-class, multi-label problem, which are:
- 1.
-
Cascade Classifier:To address the multi-class, multi-label problem, we simplify the task by breaking it down into a cascade of binary classification problems. As depicted in Figure 12, the cascade binary classification approach begins by determining if the signal is eligible for Bypass, followed by checks for BPF and CUB, respectively. If none of these algorithms are deemed suitable for effective processing, the signal will be discarded.Therefore, a cascade of three XGBoost (eXtreme Gradient Boosting) [22,23] binary classifiers is employed to assist in determining the appropriate algorithm for processing the incoming signal. The cascade classifier is depicted in Figure 13. The extracted SQIs are first fed into the initial classifier, which determines whether Algorithm 1 is suitable for the signal. If the classifier output is true, we immediately perform processing using Bypass. Conversely, if Bypass is not recommended by the classifier, we proceed to the second classifier to check whether BPF is a better fit for the signal. If none of the three classifiers recommend any algorithm for the incoming signal, it is discarded to avoid potentially high error estimation.
- 2.
-
Training Flow: Initially, we divide the input signals into non-overlapping 10-second segments. Subsequently, we extract 14 signal quality features from the raw PPG signals, along with the labels annotated by ECG signals, to train the classifier. As illustrated in Figure 14, we take BPF as an example and assign the label 1 if a signal is eligible for BPF, otherwise, it is assigned 0.After collecting the labels for Bypass, BPF, and CUB, we proceed to train the XGBoost classifier. Figure 15 depicts the training stage of the XGBoost classifier, where we set it as a binary classifier and use the logistic loss function for model learning. We utilize grid search to find the optimal parameters for XGBoost to achieve the best performance in distinguishing data usability under Bypass, BPF, and CUB processing. Finally, we obtain three binary classifiers, which we cascade to perform algorithm selection from a portfolio that contains three algorithms.
- 3.
-
Classifier order rearrangement:The arrangement of these binary classifiers is deemed to be a significant factor influencing the overall performance. The inquiry regarding the optimal arrangement of these classifiers, depicted in Figure 16, dictates the order in which the classifiers are to be placed in the first, second, and third stages. This subsection aims to demonstrate the impact of reordering the binary classifiers and present the proposed reordering strategy.As the classifiers operate sequentially, it is possible for the signal to exit early from the first and second classifiers. A desirable outcome would involve the signal being processed by algorithm with reduced energy consumption. In the event that the signal is deemed suitable for algorithm 1, early exit from the first or second classifier would aid in conserving energy consumption for the entire system.In light of this perspective, algorithm 1 should represent a processing method with comparably lower energy consumption, while algorithm 2 should have the second-lowest energy consumption, and algorithm 3 should exhibit the highest energy consumption. For instance, the CUB, BPF, and Bypass portfolio can be rearranged in the order of Bypass, BPF, and CUB. Through this rearrangement of algorithms, it is feasible to achieve reduced energy consumption.Subsequently, a straightforward experiment was conducted to demonstrate the impact of reordering the binary classifiers. Two scenarios were compared based on energy consumption, namely, 1) the classifiers without being reordered by algorithm energy consumption, and 2) the classifiers reordered based on energy consumption. The experimental outcomes are displayed in Figure 17, which suggests that the reordering of the binary classifiers based on the algorithm’s energy consumption can lead to a general reduction in energy consumption.
4. Experiment Results
4.1. Experiment Setup
4.1.1. Dataset
For long-term PPG monitoring, the dataset contains two-channel PPG signals and a channel ECG signal in each subject (11 males and 1 female, ages 22 to 25). PPG signals are recorded from wrist-type PPG sensors with a green LED. ECG signals are recorded from the chest using Procomp Infiniti. The sampling rates of PPG and ECG are at 100 Hz and 256 Hz, respectively.
To generate some artifacts or corruption to the signals, subjects are asked to type the same article during the collection of wrist PPG. The experiment flow is shown in Figure 18. At the beginning of experiments, subjects are requested to be static for 2 minutes. Afterward, they type the article for 1 minute. This process is repeated five times, and the total length of the experiment is 15 minutes.
4.1.2. Energy Consumption Estimation
To assess the energy consumption of each algorithm, we employed the RAPL (Running Average Power Limit) power meter. RAPL is a power management technology that permits the CPU to reallocate workload between CPU cores [24]. It includes a power meter that can measure the energy usage of a host machine and the execution of certain programs. Previous studies have demonstrated that RAPL’s estimates are highly correlated with actual power consumption [25,26]. We present the energy consumption of each algorithm in Table 4.
4.2. Selected Portfolio Analysis
Once we consider the energy budget, we will take out the algorithm that exceed the energy budget from the algorithm pool. Then, we will perform the portfolio formation process. We summarize the portfolio under different energy constraints in Table 5.
Table 5 displays the variation in the selected algorithm within the portfolio under different energy budgets. Notably, the selected algorithms differ depending on the available energy budget. For an energy budget below 35.54 mJ, our proposed quality-aware processing mechanism is not recommended due to its energy overhead. In such a case, the One-For-All processing mechanism is preferred. However, for higher energy budgets, the portfolio is inclined towards using more powerful, yet energy-hungry algorithm. This highlights the flexibility offered by the proposed algorithm portfolio formation in enabling developers to choose algorithms based on energy budgets. The selected portfolios under resource-limited and resource-abundant scenarios are summarized in Figure 19.
4.3. Comparison between Frameworks
In this subsection, we will make comparison between frameworks. We will compare them in terms of accuracy, mean absolute error (MAE), consumed energy. The frameworks included for comparison are: 1.) One-For-All (OFA) processing, we will used WVL and SSA as processing algorithms. 2.) Signal quality assessment (SQA), signal will be assessed by SQA, and poor quality signals will be discarded for better measurement results. 3.) Quality-aware processing (QAP) with portfolio of Bypass, BPF, and CUB. The comparison is summarized in Table 6.
Initially, it can be observed that both the SQA and QAP mechanisms rejected 30% of signals for H.R. measurement, which were deemed to be of poor quality. In contrast, the OFA processing scheme did not discard any signals. The key disparity between SQA and QAP lies in the fact that QAP permits signals to undergo various methods. As per Figure 20, 49 % of signals bypassed the processing, 17% of them undergo BPF, and 4% of them undergo CUB. The QAP framework, which offers greater options in terms of processing methods, achieved higher accuracy as compared to both SQA and OFA frameworks, while discarding the same proportion of signals.
Apart from accuracy, it is noteworthy that the use of SSA as a processing algorithm in the OFA algorithm results in significant energy consumption. Conversely, the utilization of WVL as a processing algorithm results in lower energy consumption, but with a compromise in terms of accuracy.
Based on our observations, we can infer that if we have the option to discard poor quality signals, there is no need to design energy-intensive processing methods to achieve higher accuracy. Instead, we can focus on processing signals with moderate quality. Consequently, both SQA and QAP frameworks consume less energy as compared to using only SSA.
In terms of overhead, the QAP framework typically involves calculating SQIs. Since the SQIs utilized in our study are of low-complexity, the resulting energy consumption overhead is minimal (+35.536 mJ) as compared to OFA. Nevertheless, we achieve higher accuracy and lower mean absolute error (MAE).
In comparison to OFA (WVL), we achieve an 8.7% accuracy improvement with an additional energy consumption of 28.07 mJ per photoplethysmography (PPG) segment. Conversely, in comparison to OFA (SSA), we achieve a 3.0% accuracy improvement while consuming only 0.1% of the energy consumption of OFA (SSA).
4.4. Analysis on Signals Passing Each Stage
In this subsection, we will give more detailed analysis on the signal passing each classifier. Our experiment result is based on leave-one-subject-out (LOSO) setting.
As illustrated in Figure 21, the proposed mechanism consists of three cascaded classifiers. The figure presents the percentage of signals that passed through each classifier. For instance, approximately 49% of signals were recommended to bypass in the first stage, while in the second stage, 33% of the remaining signals were recommended to undergo BPF as processing algorithm. Based on this distribution, we can classify these signals into four distinct groups.
- 1.
- Group I: signals that suggested bypass
- 2.
- Group II: signals that suggested BPF
- 3.
- Group III: signals that suggested CUB
- 4.
- Group IV: Poor quality signal that require to discard
Next, we conducted an analysis of signals from different groups. Initially, we assessed the quality of signals in Group I, which we advise not to process, and found that they generally exhibit higher quality. Additionally, we compared the original accuracy of each group without processing. Notably, Group I, which we recommend bypassing processing, exhibited the highest signal quality, followed by Group II, Group III, and finally Group IV, which we recommend discarding due to its low original accuracy. The results is summarized in Table 7.
These findings suggest that the proposed mechanism appropriately recommends algorithm based on incoming signal quality. Specifically, we recommend that high-quality signals should not undergo process, signals of moderate quality should be subjected to simple algorithm (e.g., bandpass filtering), and poor quality signals should be processed using powerful, energy-intensive algorithm methods. Additionally, we recommend that signals deemed unsalvageable by the current processing approach be discarded to avoid adversely affecting subsequent measurements.
5. Conclusion
We presented a quality-aware signal processing mechanism for the application of long-term heart rate monitoring. In comparison to OFA (WVL), we achieve an 8.7% accuracy improvement with an additional energy consumption of 28.07 mJ. Conversely, in comparison to OFA (SSA), we achieve a 3.0% accuracy improvement while consuming only 0.1% of the energy consumption of OFA (SSA). The experiment results indicate selectively choosing algorithm regarding signal quality could benefit a good accuracy-energy tradeoff, which fit the application of long-term monitoring scenario.
Acknowledgments
This work was supported in part by the Ministry of Science and Technology of Taiwan under grant MOST-109-2622-8-002-012-TA, MOST-110-2221-E-002-184-MY3, and in part by PixArt Imaging Inc., Hsinchu, Taiwan, under grant Pix-108053.
References
- Zhang, Z.; Pi, Z.; Liu, B. TROIKA: A general framework for heart rate monitoring using wrist-type photoplethysmographic signals during intensive physical exercise. IEEE Transactions on biomedical engineering 2014, 62, 522–531.
- Zhang, Z. Photoplethysmography-based heart rate monitoring in physical activities via joint sparse spectrum reconstruction. IEEE transactions on biomedical engineering 2015, 62, 1902–1910.
- Zargari, A.H.A.; Aqajari, S.A.H.; Khodabandeh, H.; Rahmani, A.M.; Kurdahi, F. An accurate non-accelerometer-based ppg motion artifact removal technique using cyclegan. arXiv preprint arXiv:2106.11512 2021.
- Risso, M.; Burrello, A.; Pagliari, D.J.; Benatti, S.; Macii, E.; Benini, L.; Pontino, M. Robust and energy-efficient PPG-based heart-rate monitoring. 2021 IEEE International Symposium on Circuits and Systems (ISCAS). IEEE, 2021, pp. 1–5.
- García-López, I.; Rodriguez-Villegas, E. Characterization of artifact signals in neck photoplethysmography. IEEE Transactions on Biomedical Engineering 2020, 67, 2849–2861.
- Talukdar, M.T.F.; Pathan, N.S.; Fattah, S.A.; Quamruzzaman, M.; Saquib, M. Multistage Adaptive Noise Cancellation Scheme for Heart Rate Estimation from PPG Signal Utilizing Mode Based Decomposition of Acceleration Data. IEEE Access 2022.
- Bertolotti, G.M.; Cristiani, A.M.; Colagiorgio, P.; Romano, F.; Bassani, E.; Caramia, N.; Ramat, S. A Wearable and Modular Inertial Unit for Measuring Limb Movements and Balance Control Abilities. IEEE Sensors Journal 2016, 16, 790–797. [CrossRef]
- Elgendi, M. Optimal signal quality index for photoplethysmogram signals. Bioengineering 2016, 3, 21.
- Song, J.; Li, D.; Ma, X.; Teng, G.; Wei, J. PQR signal quality indexes: A method for real-time photoplethysmogram signal quality estimation based on noise interferences. Biomedical Signal Processing and Control 2019, 47, 88–95.
- Li, Q.; Clifford, G.D. Dynamic time warping and machine learning for signal quality assessment of pulsatile signals. Physiological measurement 2012, 33, 1491.
- Yang, Y.C.; Beh, W.K.; Lo, Y.C.; Wu, A.Y.A.; Lu, S.J. ECG-aided PPG signal quality assessment (SQA) system for heart rate estimation. 2020 IEEE workshop on signal processing systems (SiPS). IEEE, 2020, pp. 1–6.
- Vadrevu, S.; Manikandan, M.S. Real-time PPG signal quality assessment system for improving battery life and false alarms. IEEE transactions on circuits and systems II: express briefs 2019, 66, 1910–1914.
- Gao, H.; Wu, X.; Shi, C.; Gao, Q.; Geng, J. A LSTM-based realtime signal quality assessment for photoplethysmogram and remote photoplethysmogram. Proceedings of the IEEE/CVF Conference on Computer Vision and Pattern Recognition, 2021, pp. 3831–3840.
- Mohagheghian, F.; Han, D.; Peitzsch, A.; Nishita, N.; Ding, E.; Dickson, E.; Dimezza, D.; Otabil, E.; Noorishirazi, K.; Scott, J.; others. Optimized signal quality assessment for photoplethysmogram signals using feature selection. IEEE Transactions on Biomedical Engineering 2022.
- Yang, L.; Zhang, S.; Li, X.; Yang, Y. Removal of pulse waveform baseline drift using cubic spline interpolation. 2010 4th International Conference on Bioinformatics and Biomedical Engineering. IEEE, 2010, pp. 1–3.
- Kasambe, P.; Rathod, S. VLSI wavelet based denoising of PPG signal. Procedia Computer Science 2015, 49, 282–288.
- Rojano, J.F.; Isaza, C.V. Singular value decomposition of the time-frequency distribution of PPG signals for motion artifact reduction. Int. J. Signal Process. Syst 2016, 4, 475–482.
- Zhang, Y.; Liu, B.; Zhang, Z. Combining ensemble empirical mode decomposition with spectrum subtraction technique for heart rate monitoring using wrist-type photoplethysmography. Biomedical Signal Processing and Control 2015, 21, 119–125.
- Jarchi, D.; Salvi, D.; Tarassenko, L.; Clifton, D.A. Validation of instantaneous respiratory rate using reflectance PPG from different body positions. Sensors 2018, 18, 3705.
- Norouzi, M.; Fleet, D.J.; Salakhutdinov, R.R. Hamming distance metric learning. Advances in neural information processing systems 2012, 25.
- Akoglu, H. User’s guide to correlation coefficientsTurkish Journal of Emergency Medicine. Emergency Medicine Association of Turkey 2018, 1.
- Chen, T.; Guestrin, C. XGBoost: A Scalable Tree Boosting System. Proceedings of the 22nd ACM SIGKDD International Conference on Knowledge Discovery and Data Mining; Association for Computing Machinery: New York, NY, USA, 2016; KDD ’16, p. 785–794. [CrossRef]
- Friedman, J.H. Greedy function approximation: a gradient boosting machine. Annals of statistics 2001, pp. 1189–1232.
- David, H.; Gorbatov, E.; Hanebutte, U.R.; Khanna, R.; Le, C. RAPL: Memory power estimation and capping. Proceedings of the 16th ACM/IEEE international symposium on Low power electronics and design, 2010, pp. 189–194.
- Rotem, E.; Naveh, A.; Ananthakrishnan, A.; Weissmann, E.; Rajwan, D. Power-Management Architecture of the Intel Microarchitecture Code-Named Sandy Bridge. IEEE Micro 2012, 32, 20–27. [CrossRef]
- Khan, K.N.; Hirki, M.; Niemi, T.; Nurminen, J.K.; Ou, Z. RAPL in Action: Experiences in Using RAPL for Power measurements. ACM Transactions on Modeling and Performance Evaluation of Computing Systems (TOMPECS) 2018, 3, 1–26.
Figure 1.
Comparison between (a) conventional processing flow which using one algorithm for all signals, (b) proposed processing flow that selective choosing algorithm regarding to signal quality.
Figure 1.
Comparison between (a) conventional processing flow which using one algorithm for all signals, (b) proposed processing flow that selective choosing algorithm regarding to signal quality.
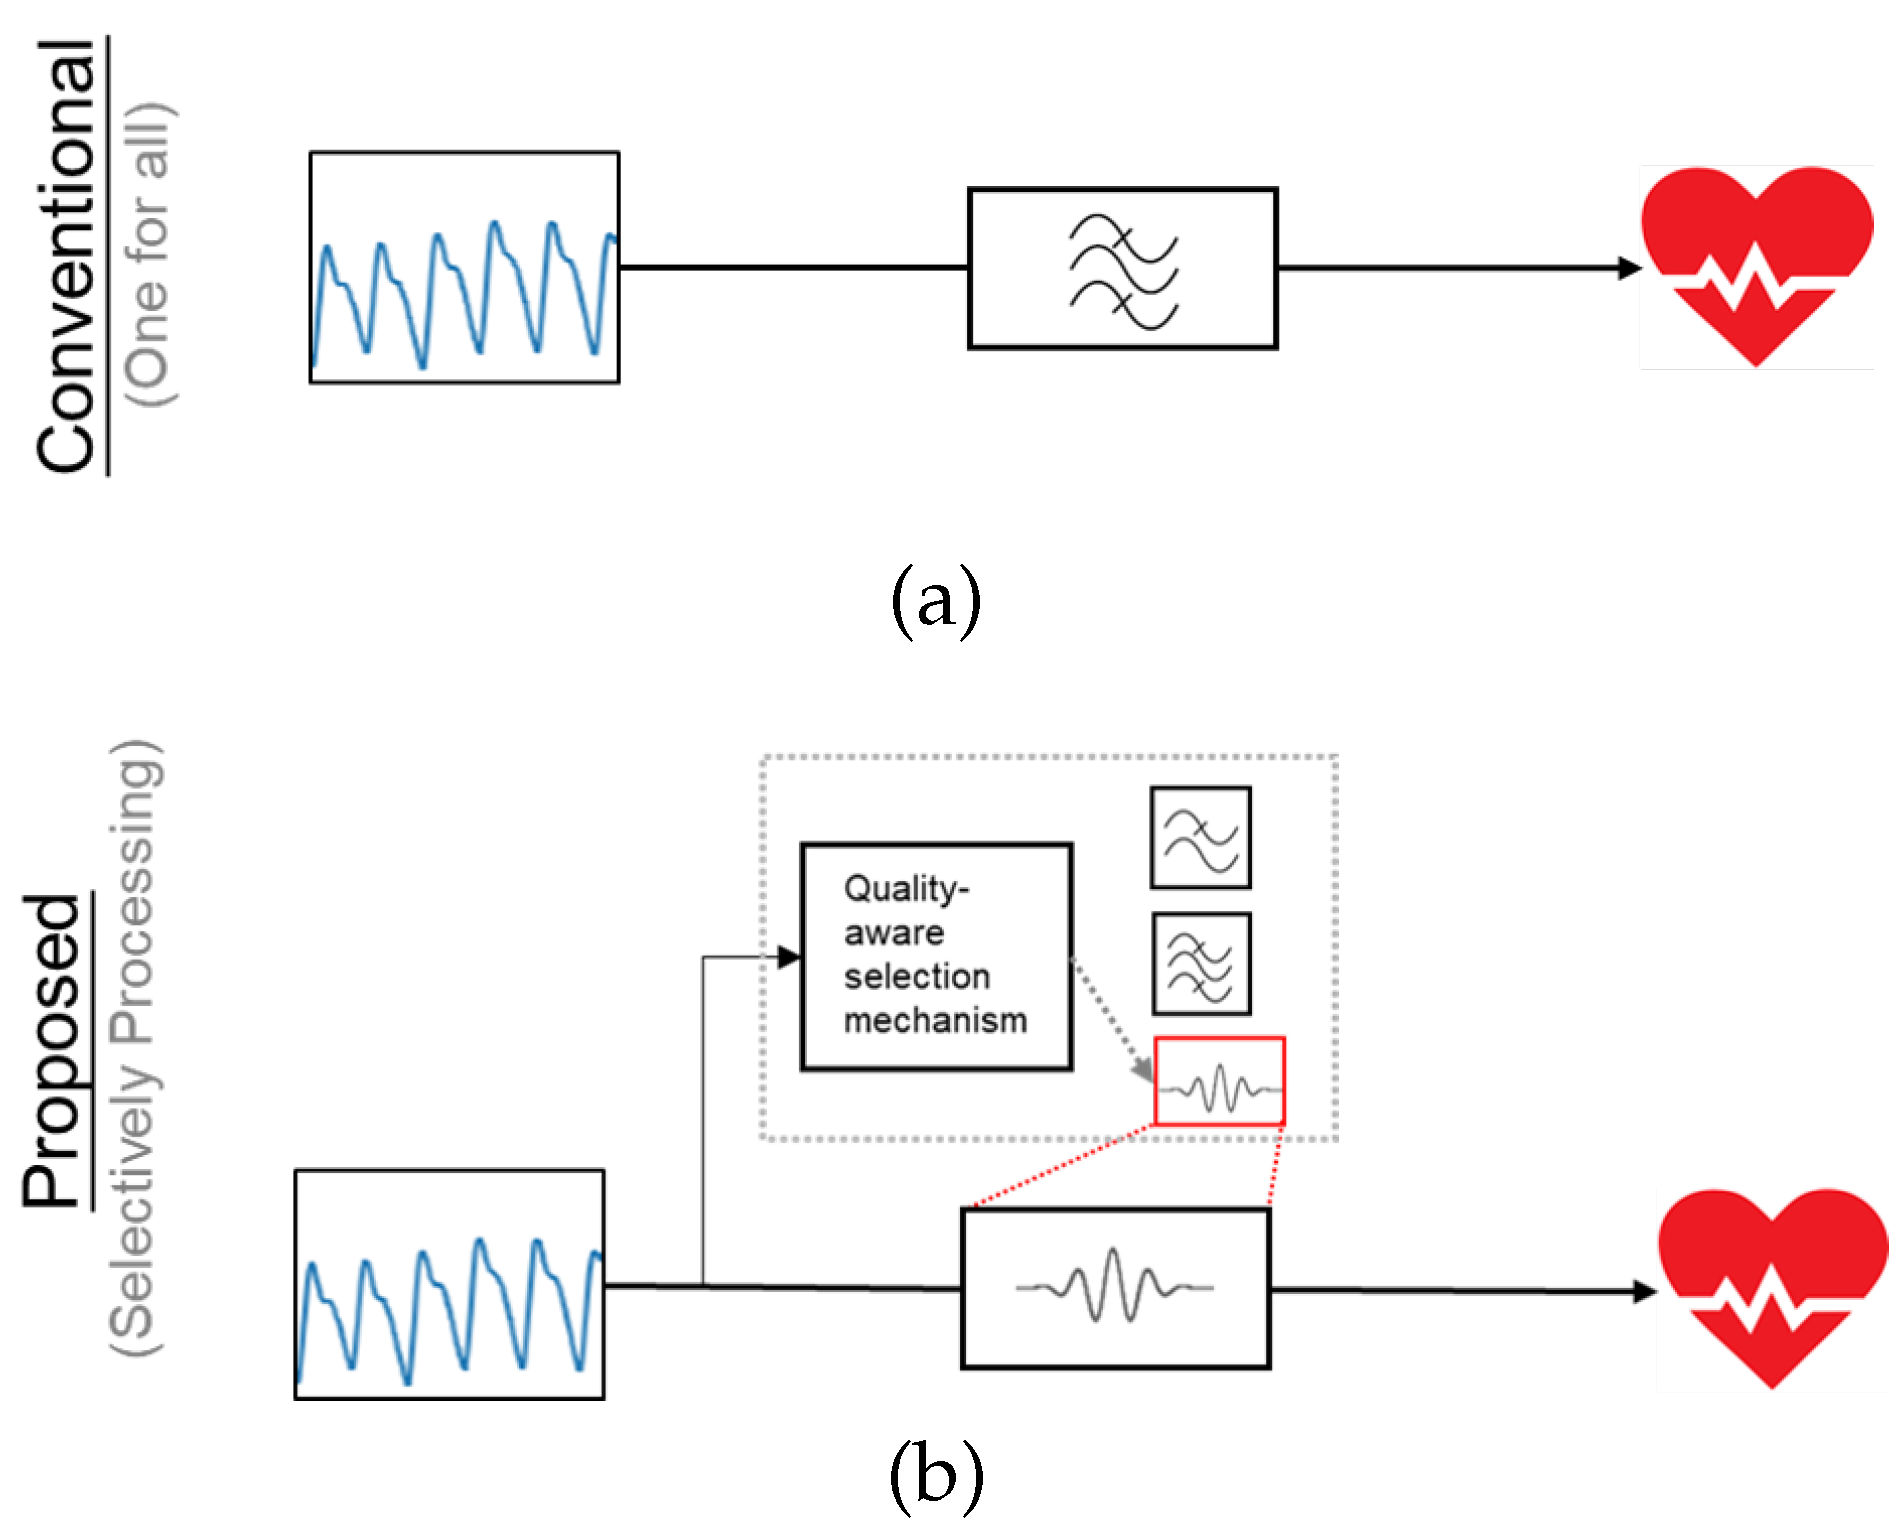
Figure 2.
H.R. error heatmap of PPGs with (a) no process, (b) applying bandpass (0.5-15Hz) filter, (c) applying SSA. Corresponding RMSE of (a) 14.74 BPM, (b) 11.60 BPM, (c) 8.69 BPM.
Figure 2.
H.R. error heatmap of PPGs with (a) no process, (b) applying bandpass (0.5-15Hz) filter, (c) applying SSA. Corresponding RMSE of (a) 14.74 BPM, (b) 11.60 BPM, (c) 8.69 BPM.
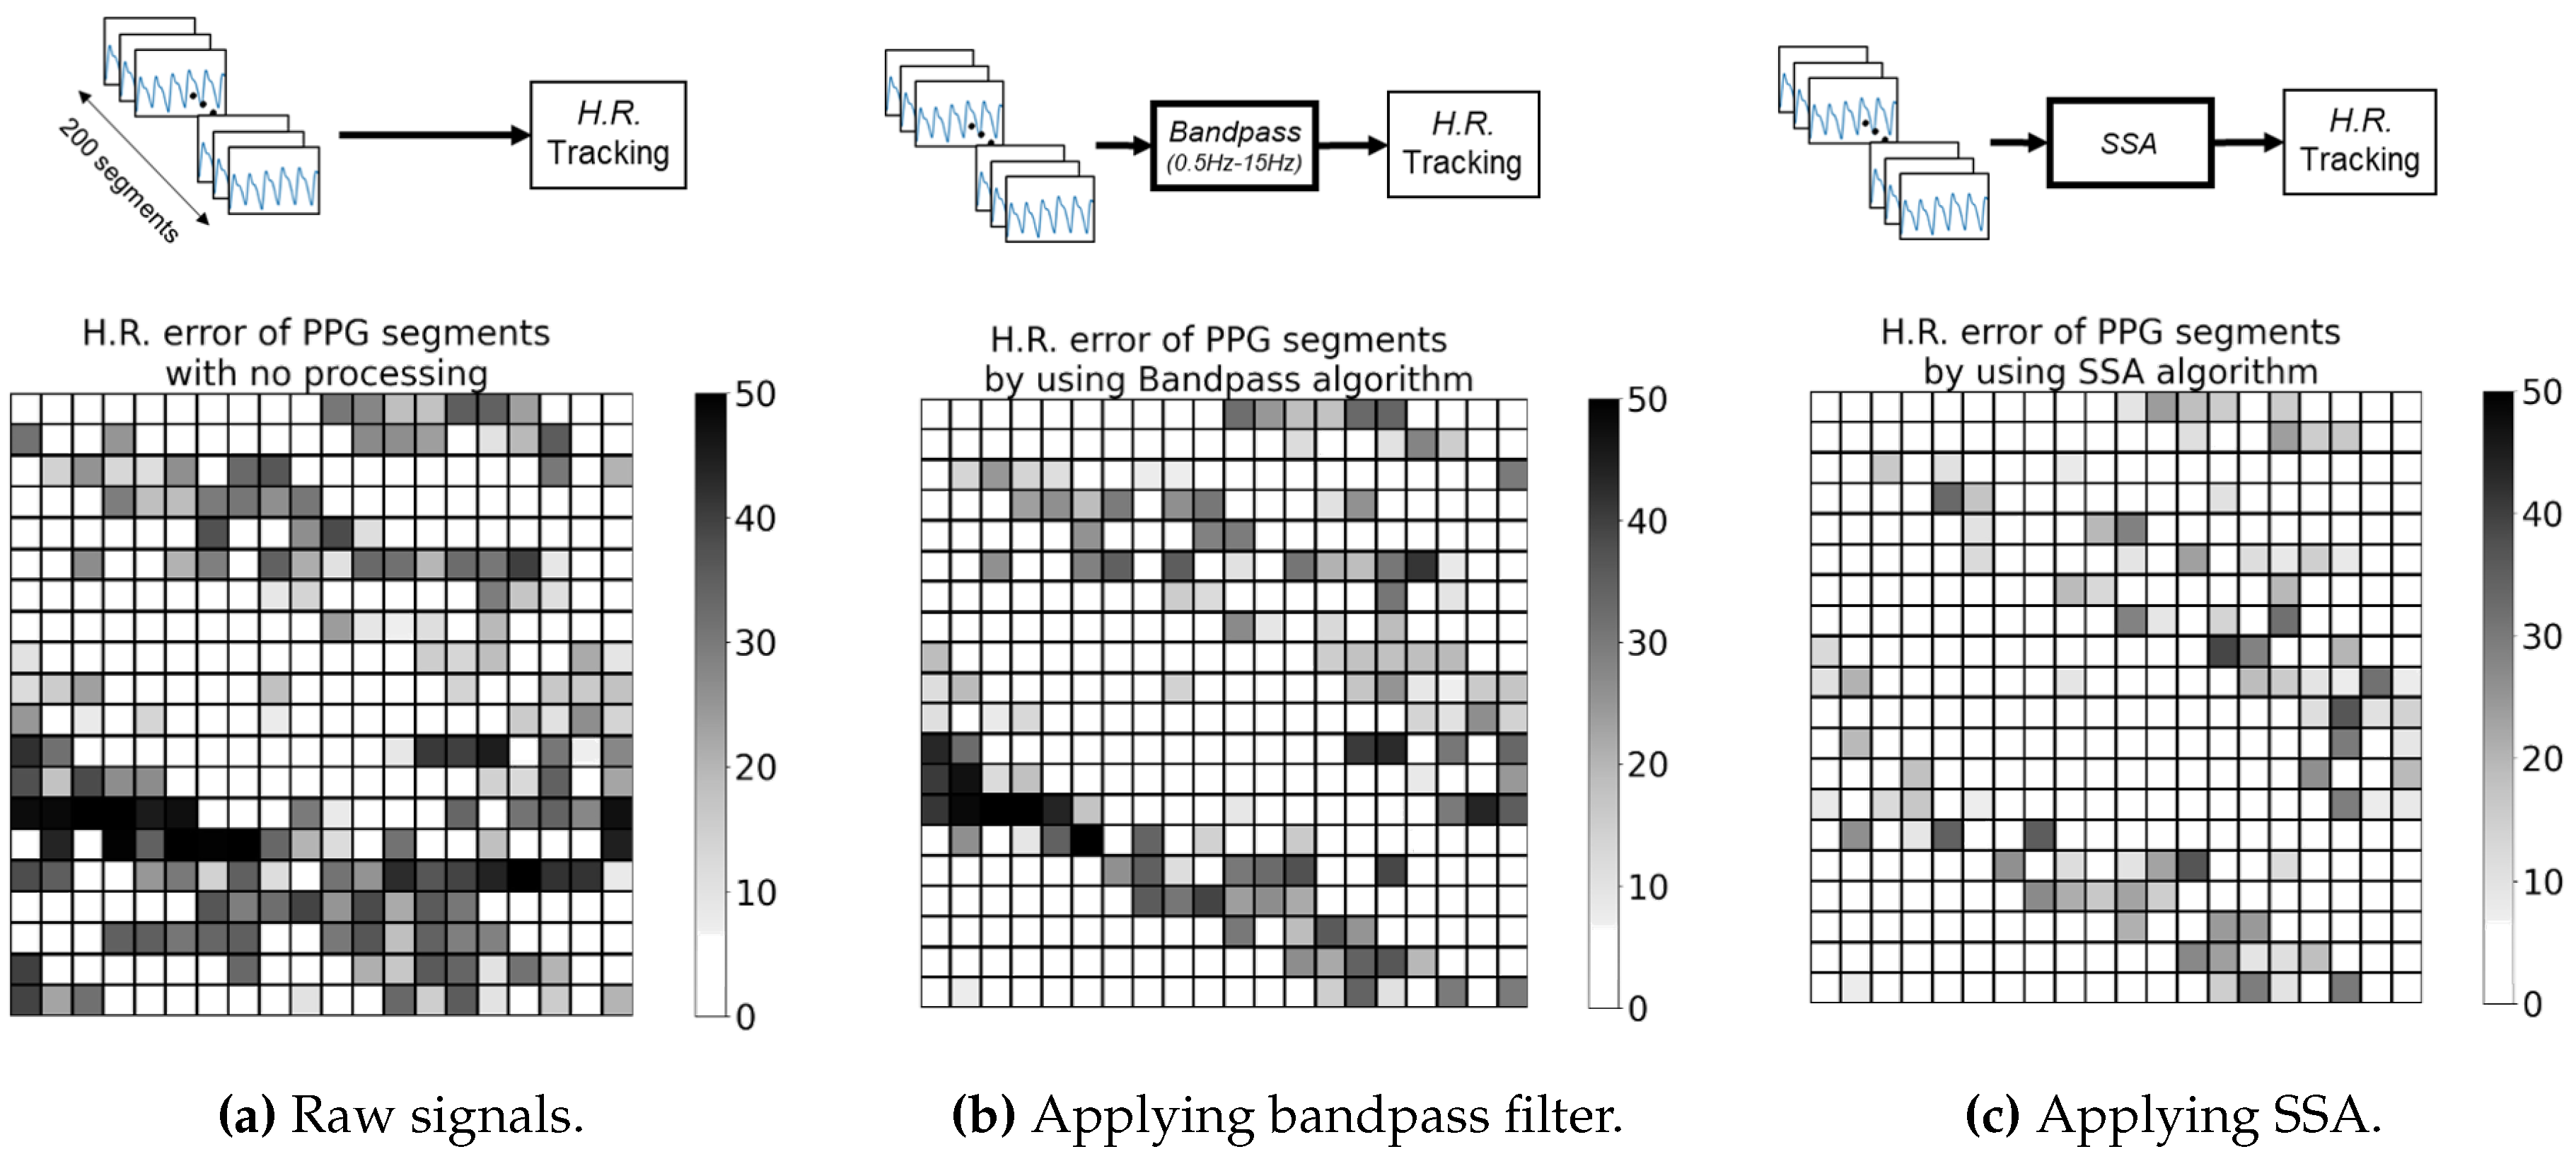
Figure 3.
Venn diagram for describing the set of PPGs, which error ≤ 5 BPM, after applying processing algorithm.
Figure 3.
Venn diagram for describing the set of PPGs, which error ≤ 5 BPM, after applying processing algorithm.
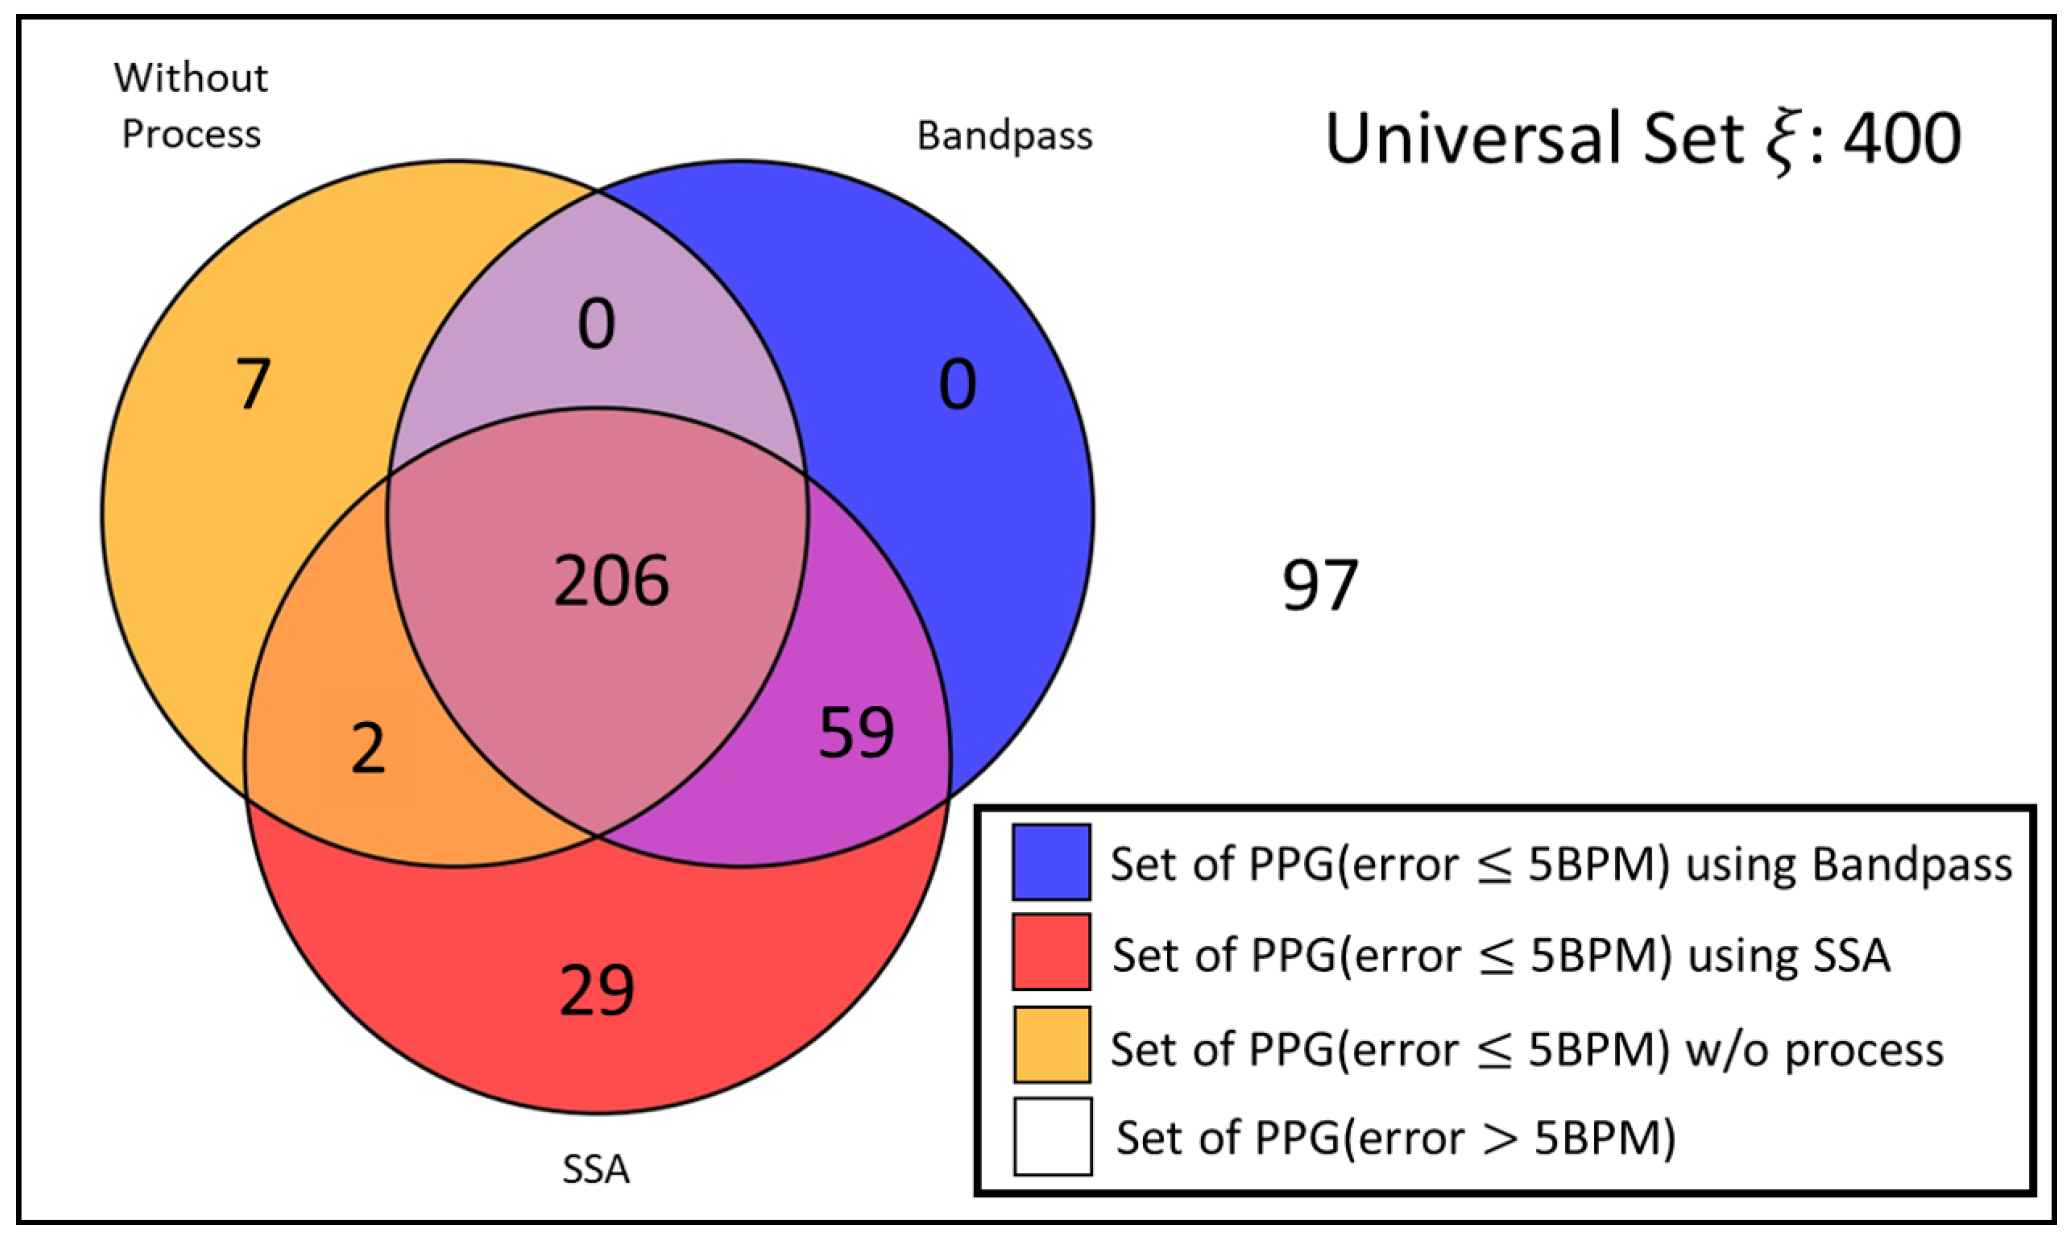
Figure 4.
Schematic diagram of proposed mechanism.
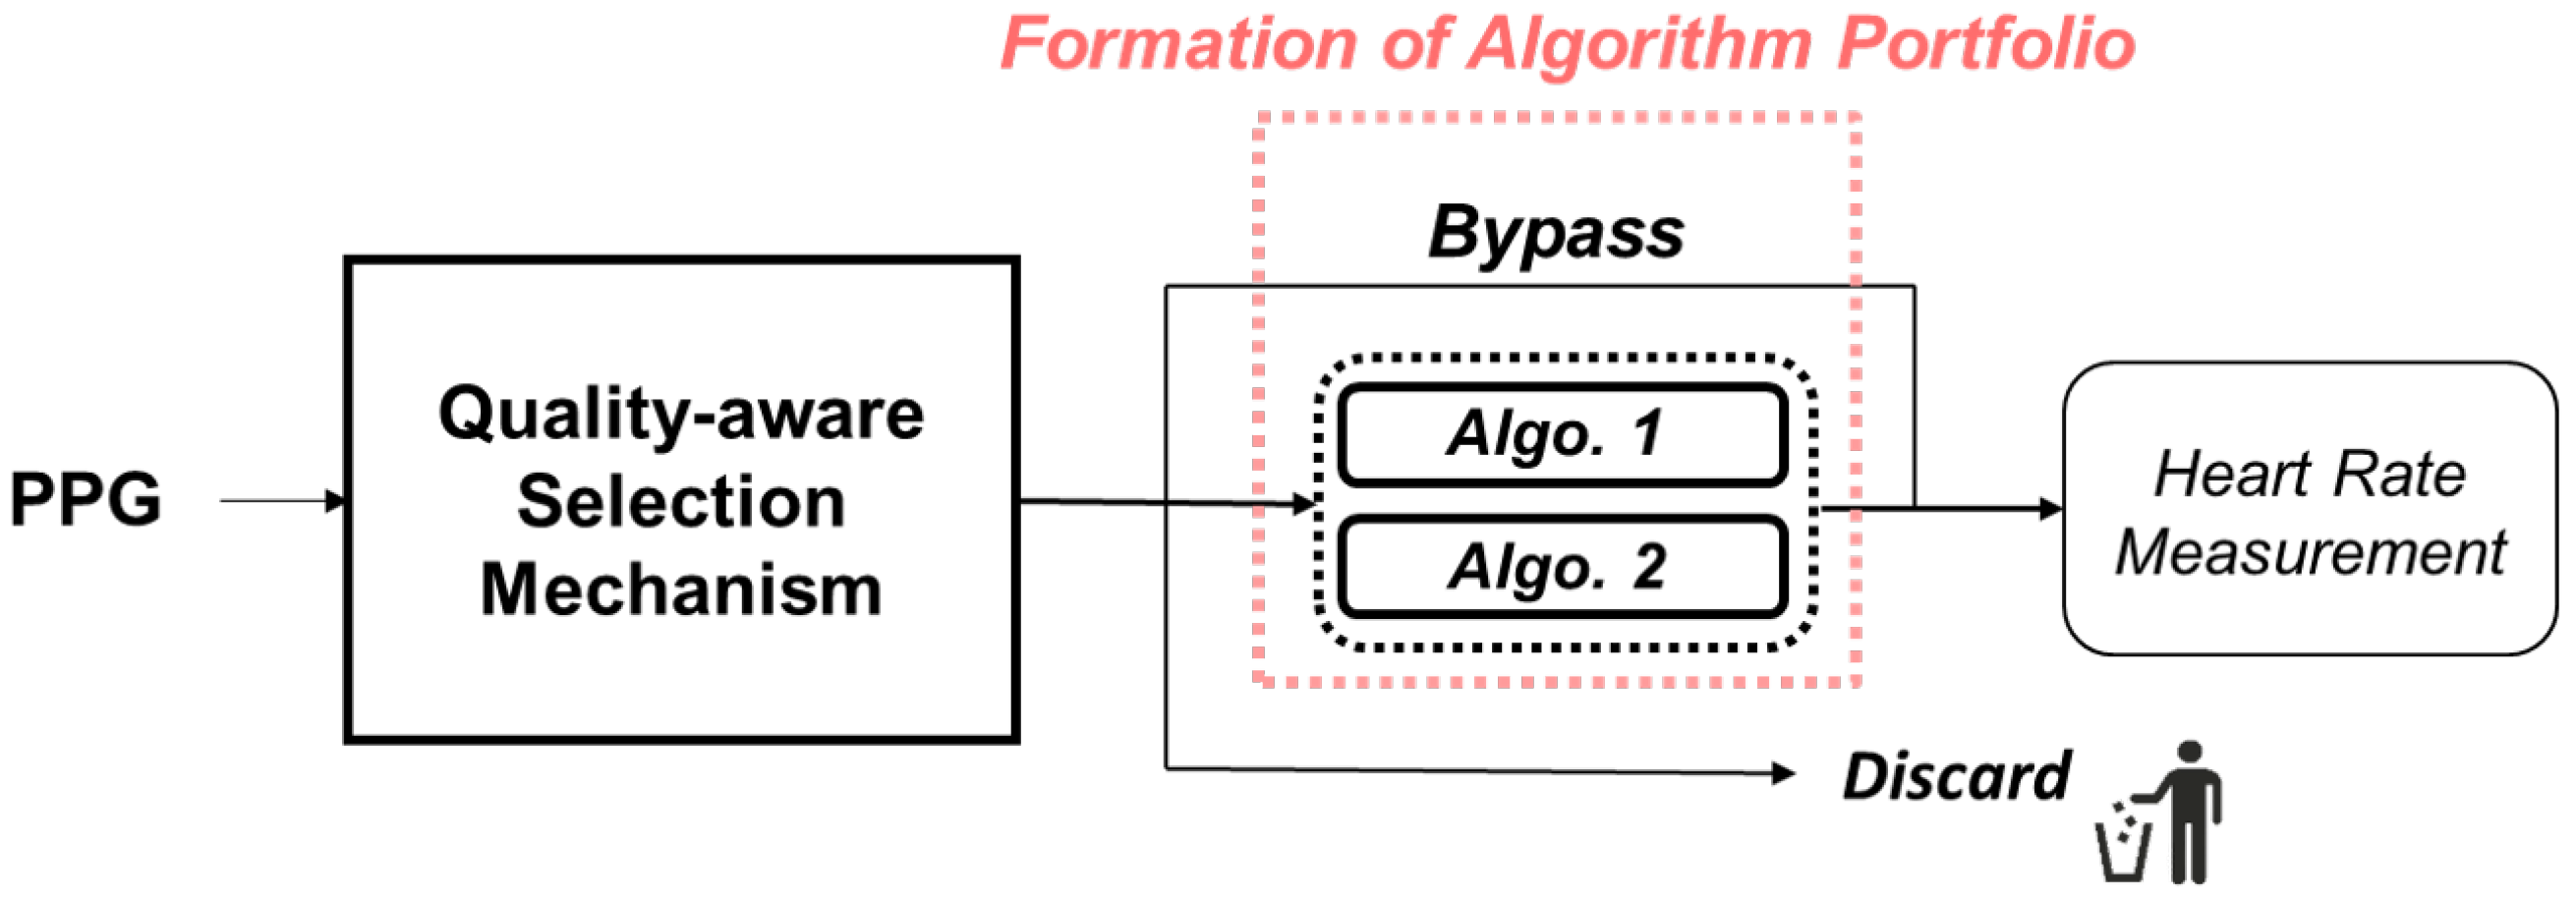
Figure 5.
Schematic diagram of showing the effect brought by different processing algorithms.
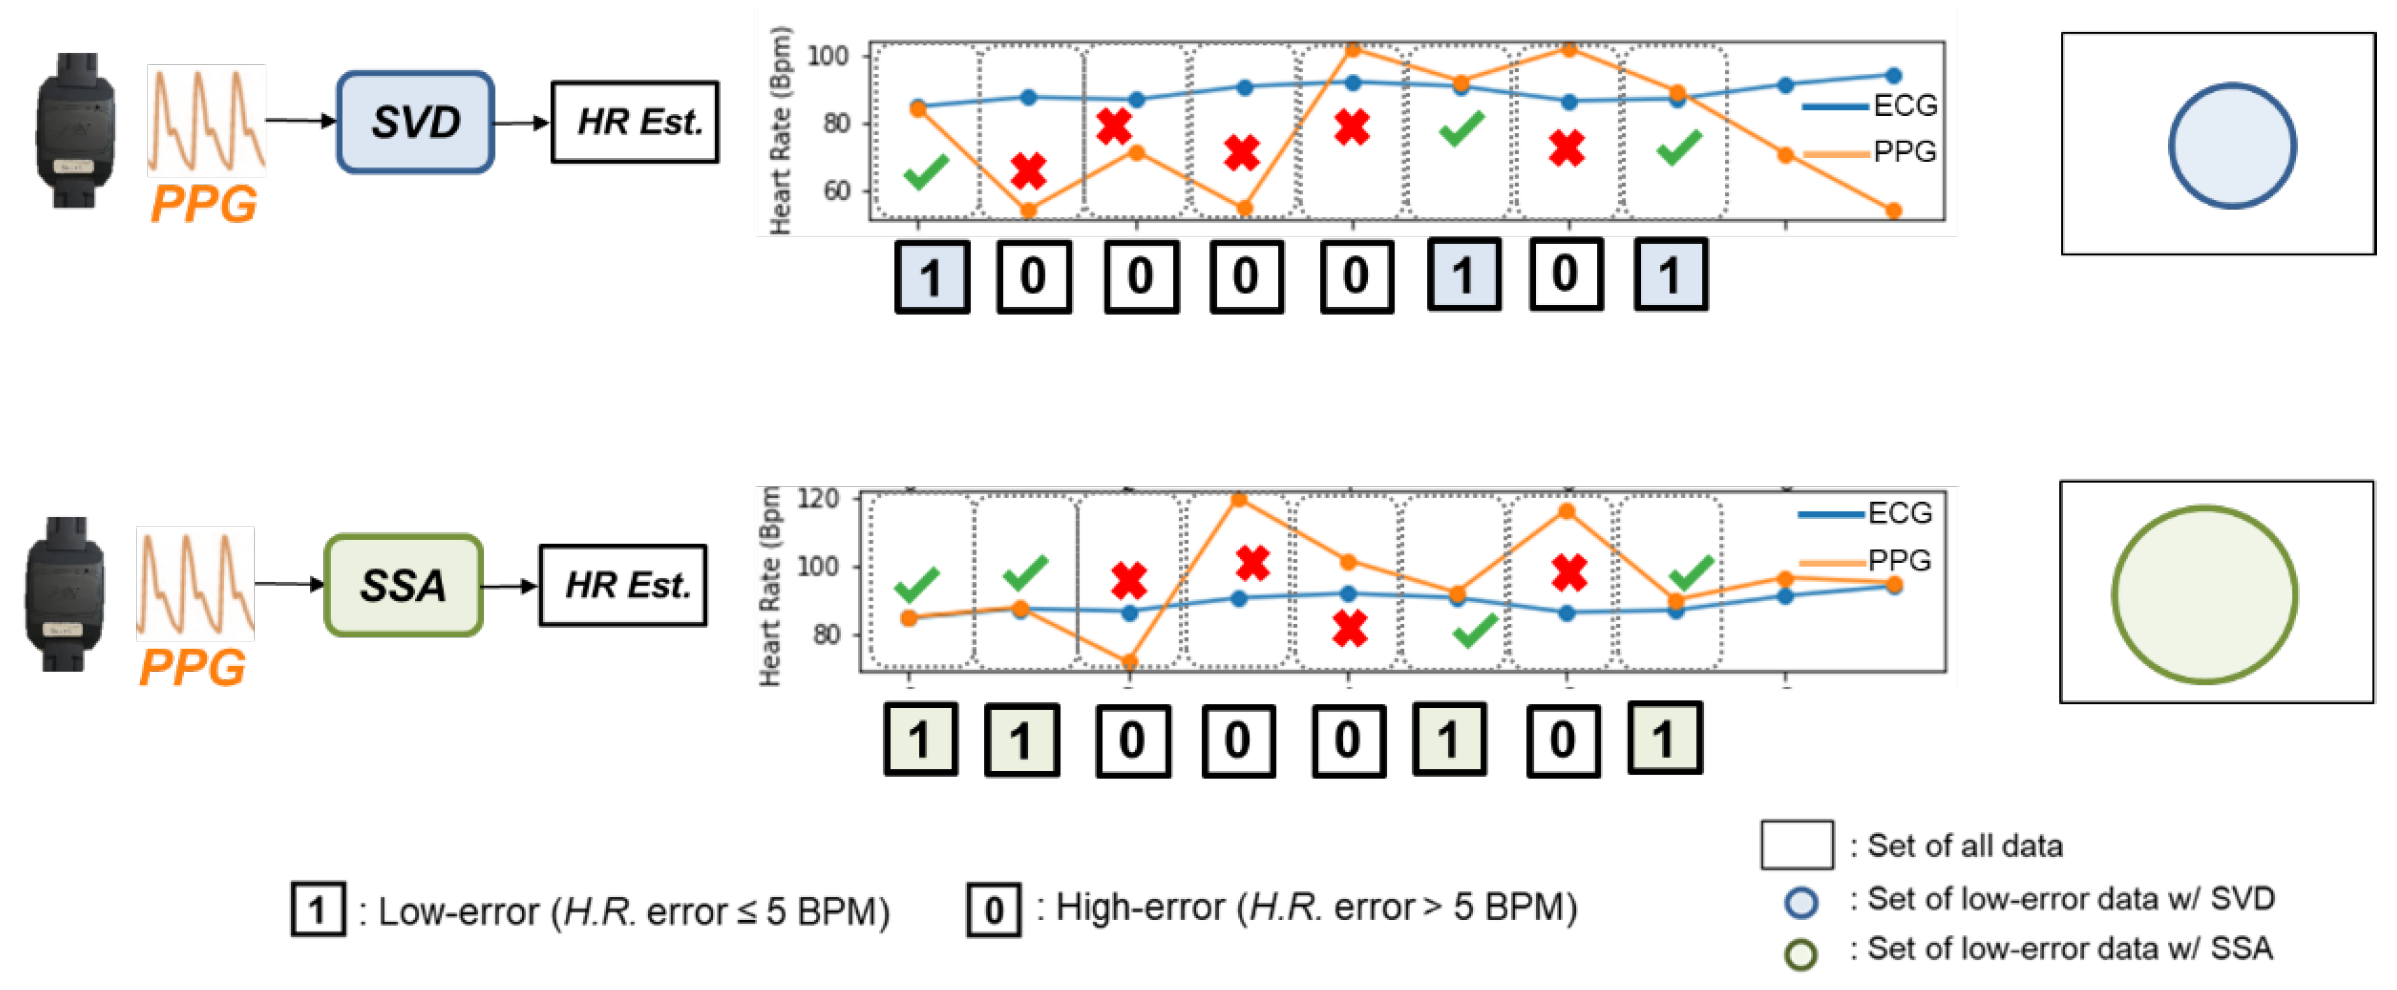
Figure 6.
Schematic diagram of the calculation process of hamming distance.
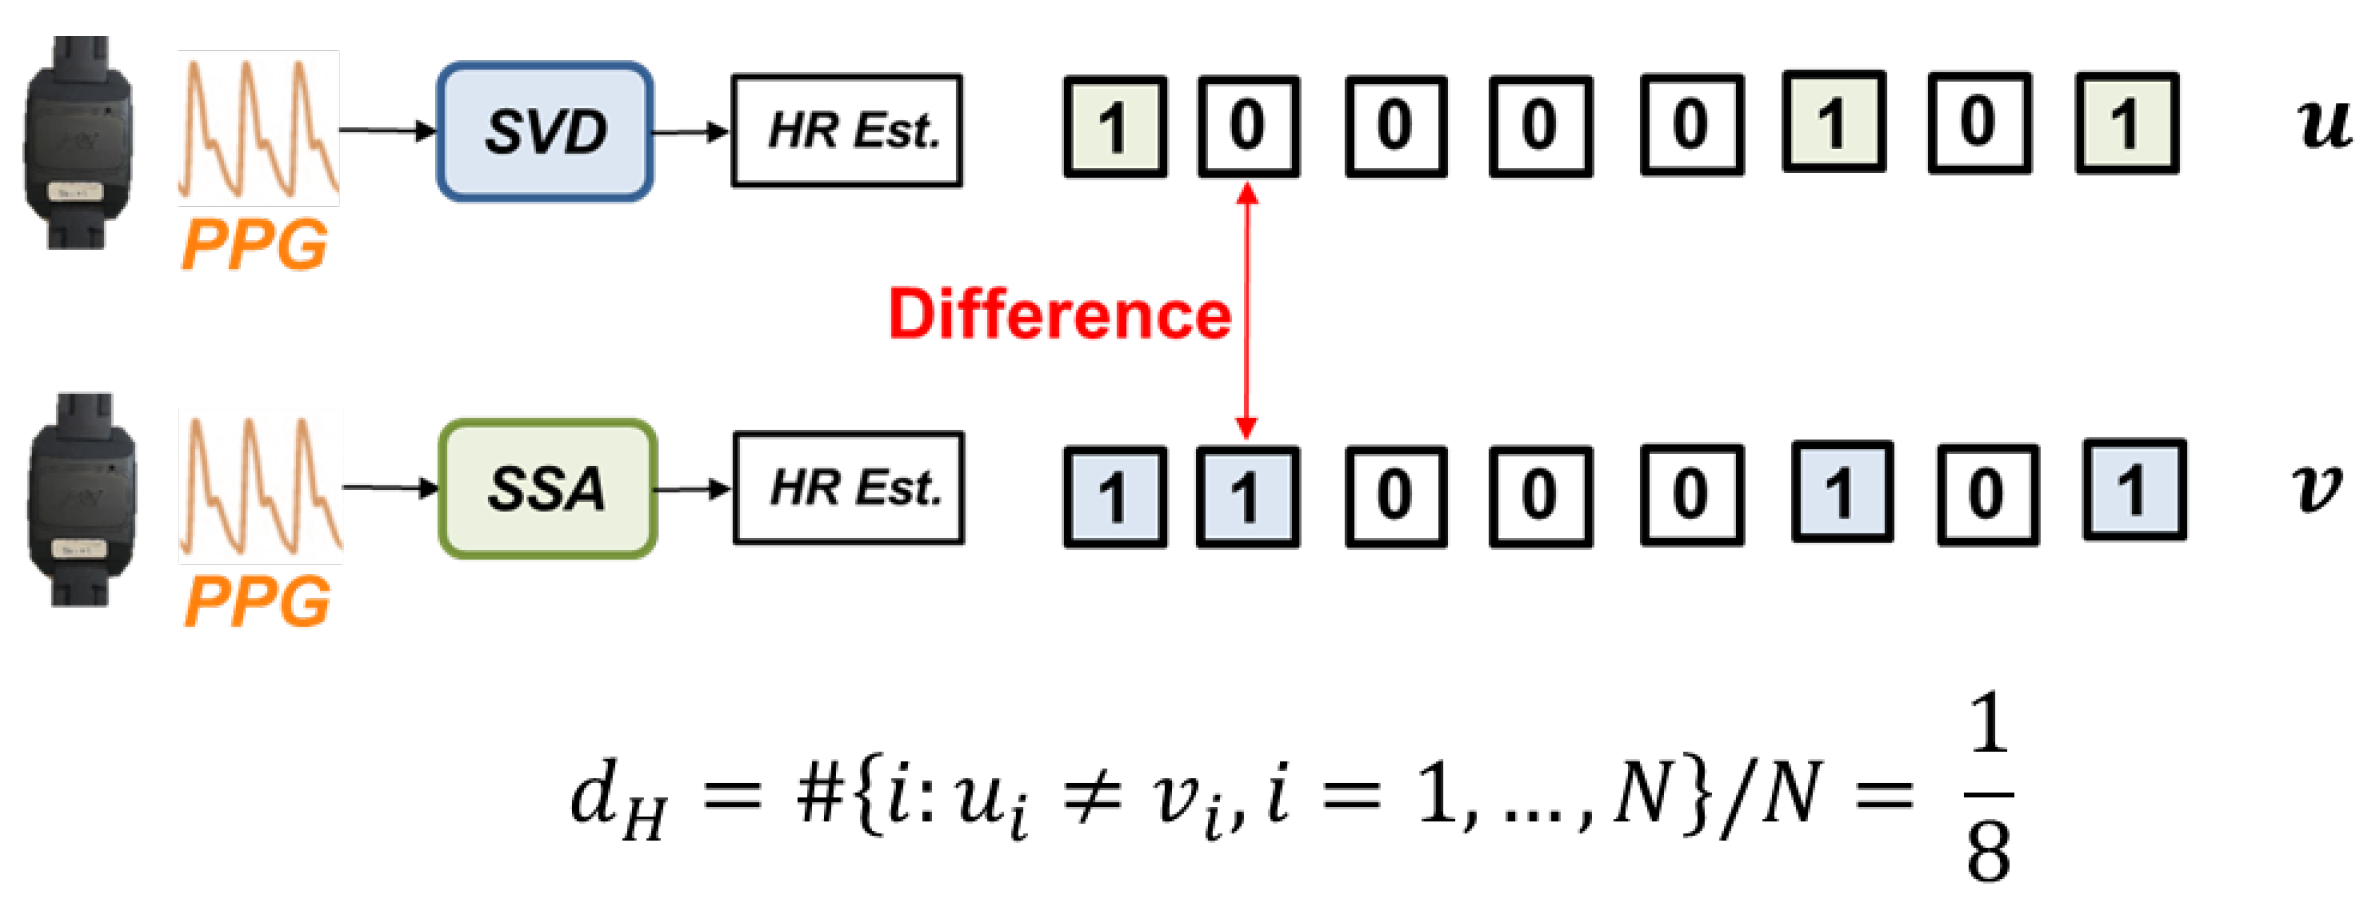
Figure 7.
H.R. accuracy against average hamming distance between algorithm within same portfolio.
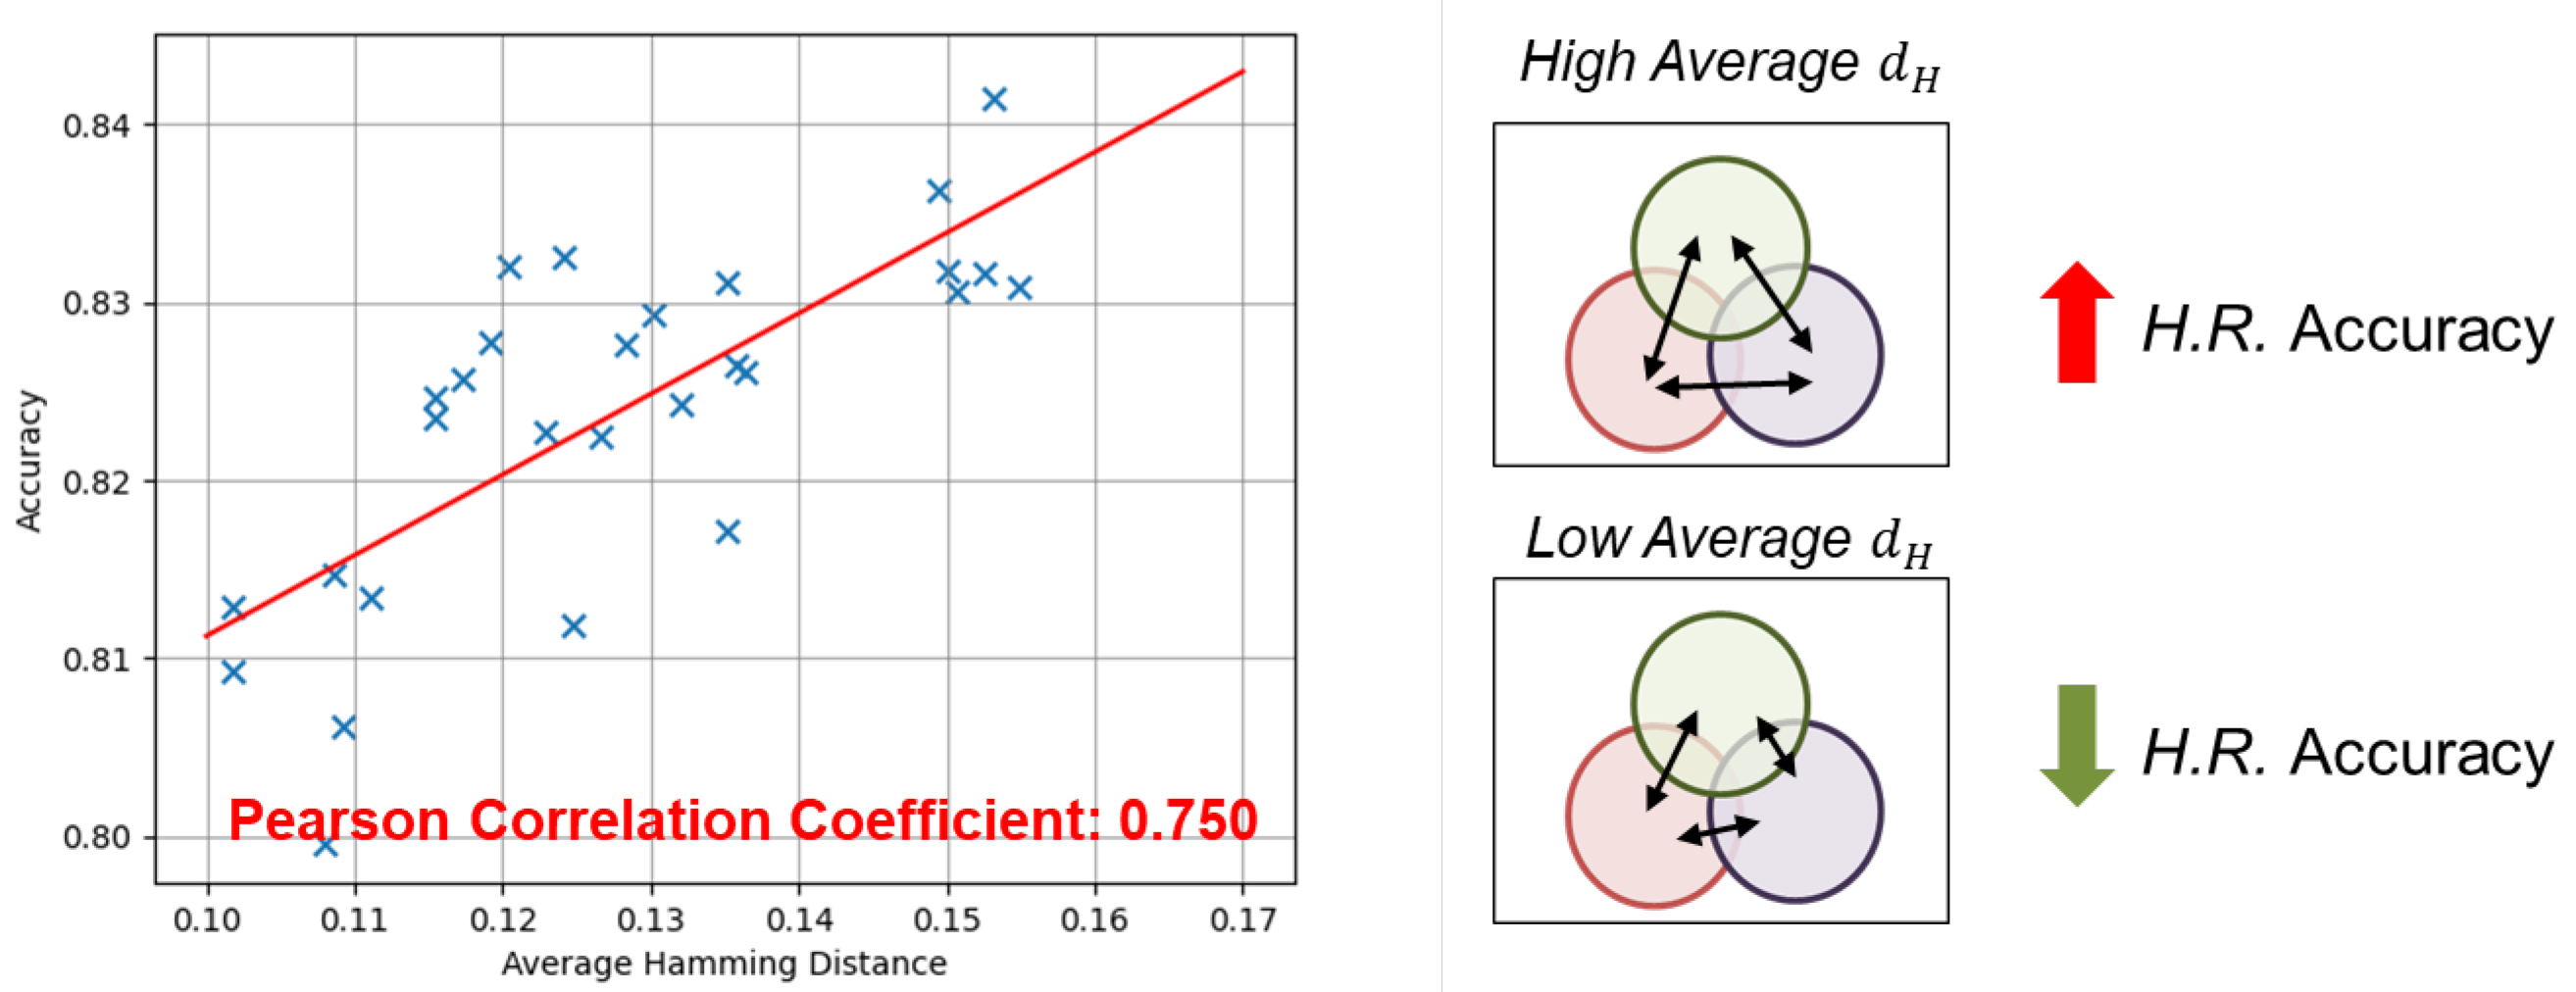
Figure 11.
Each PPG is eligible for several processing algorithms.
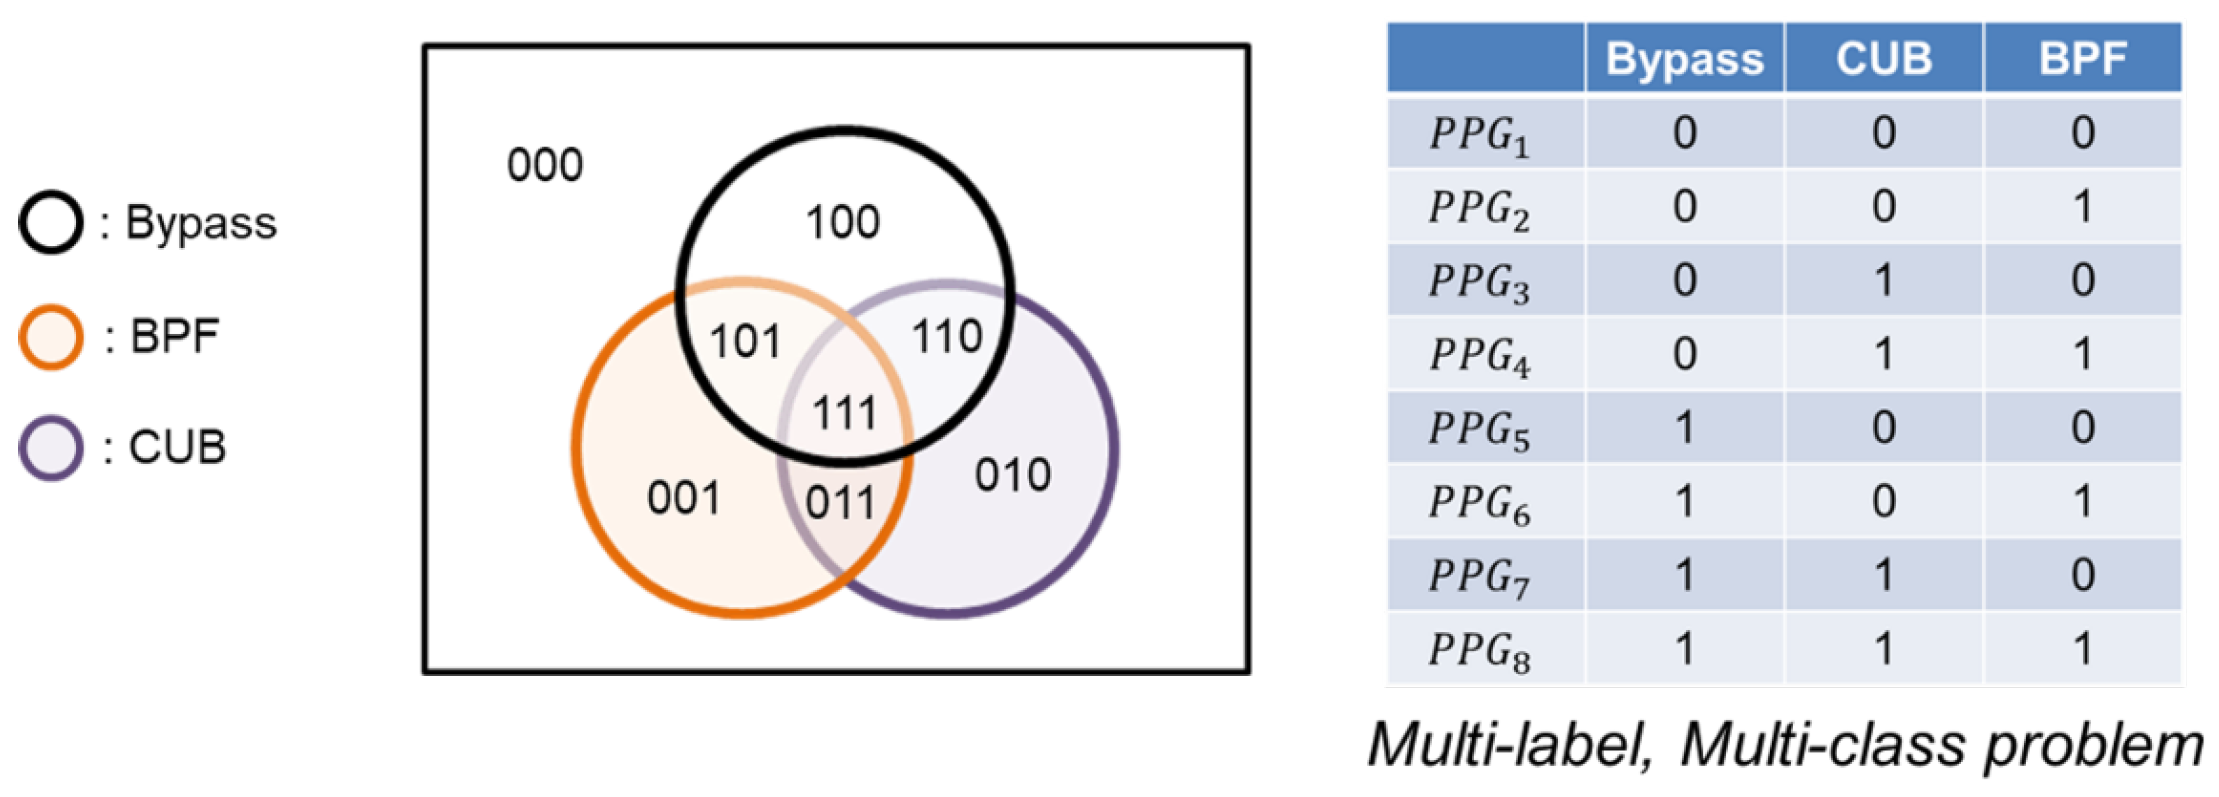
Figure 12.
Schematic diagram of classification problem simplification.

Figure 13.
Illustration diagram of cascade classifier.

Figure 14.
Process of acquire label for training XGBoost classifier.
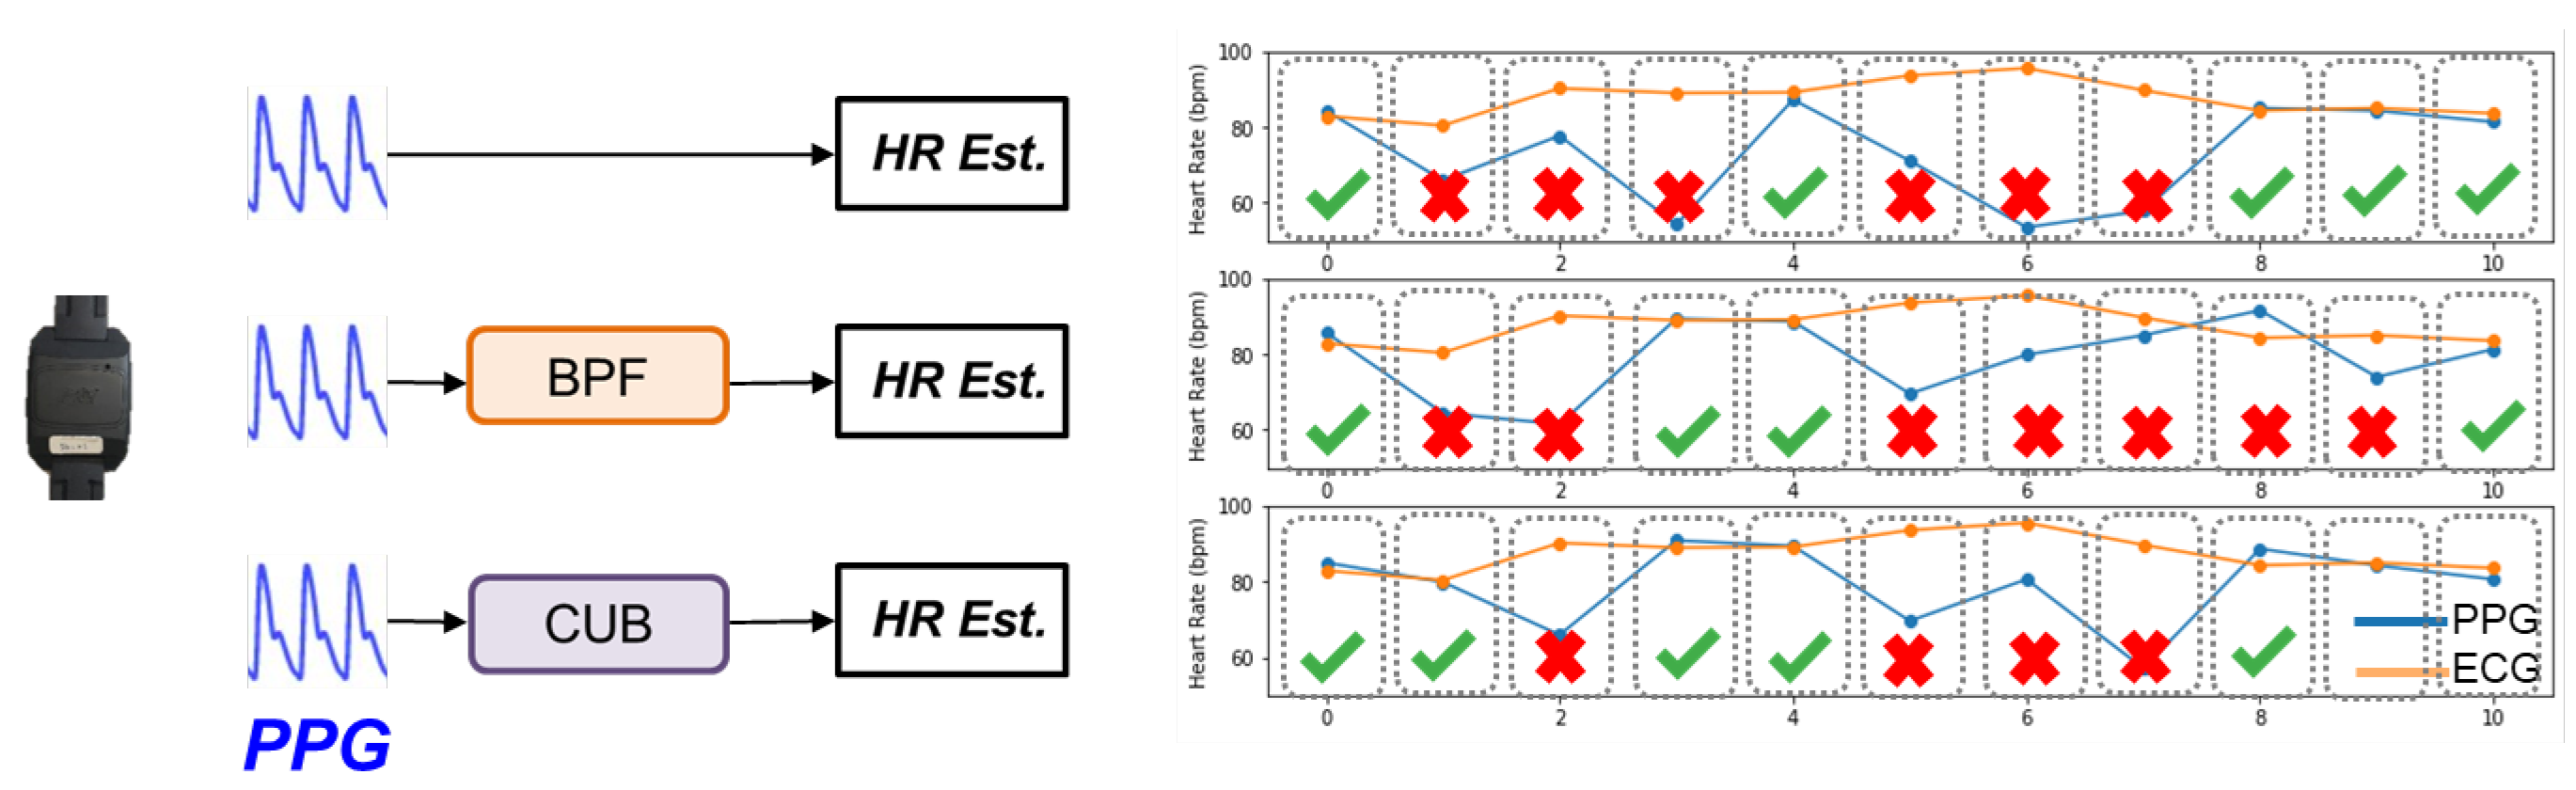
Figure 15.
Training stage of three XGBoost classifiers to distinguish the data usability under Bypass, BPF, CUB.
Figure 15.
Training stage of three XGBoost classifiers to distinguish the data usability under Bypass, BPF, CUB.
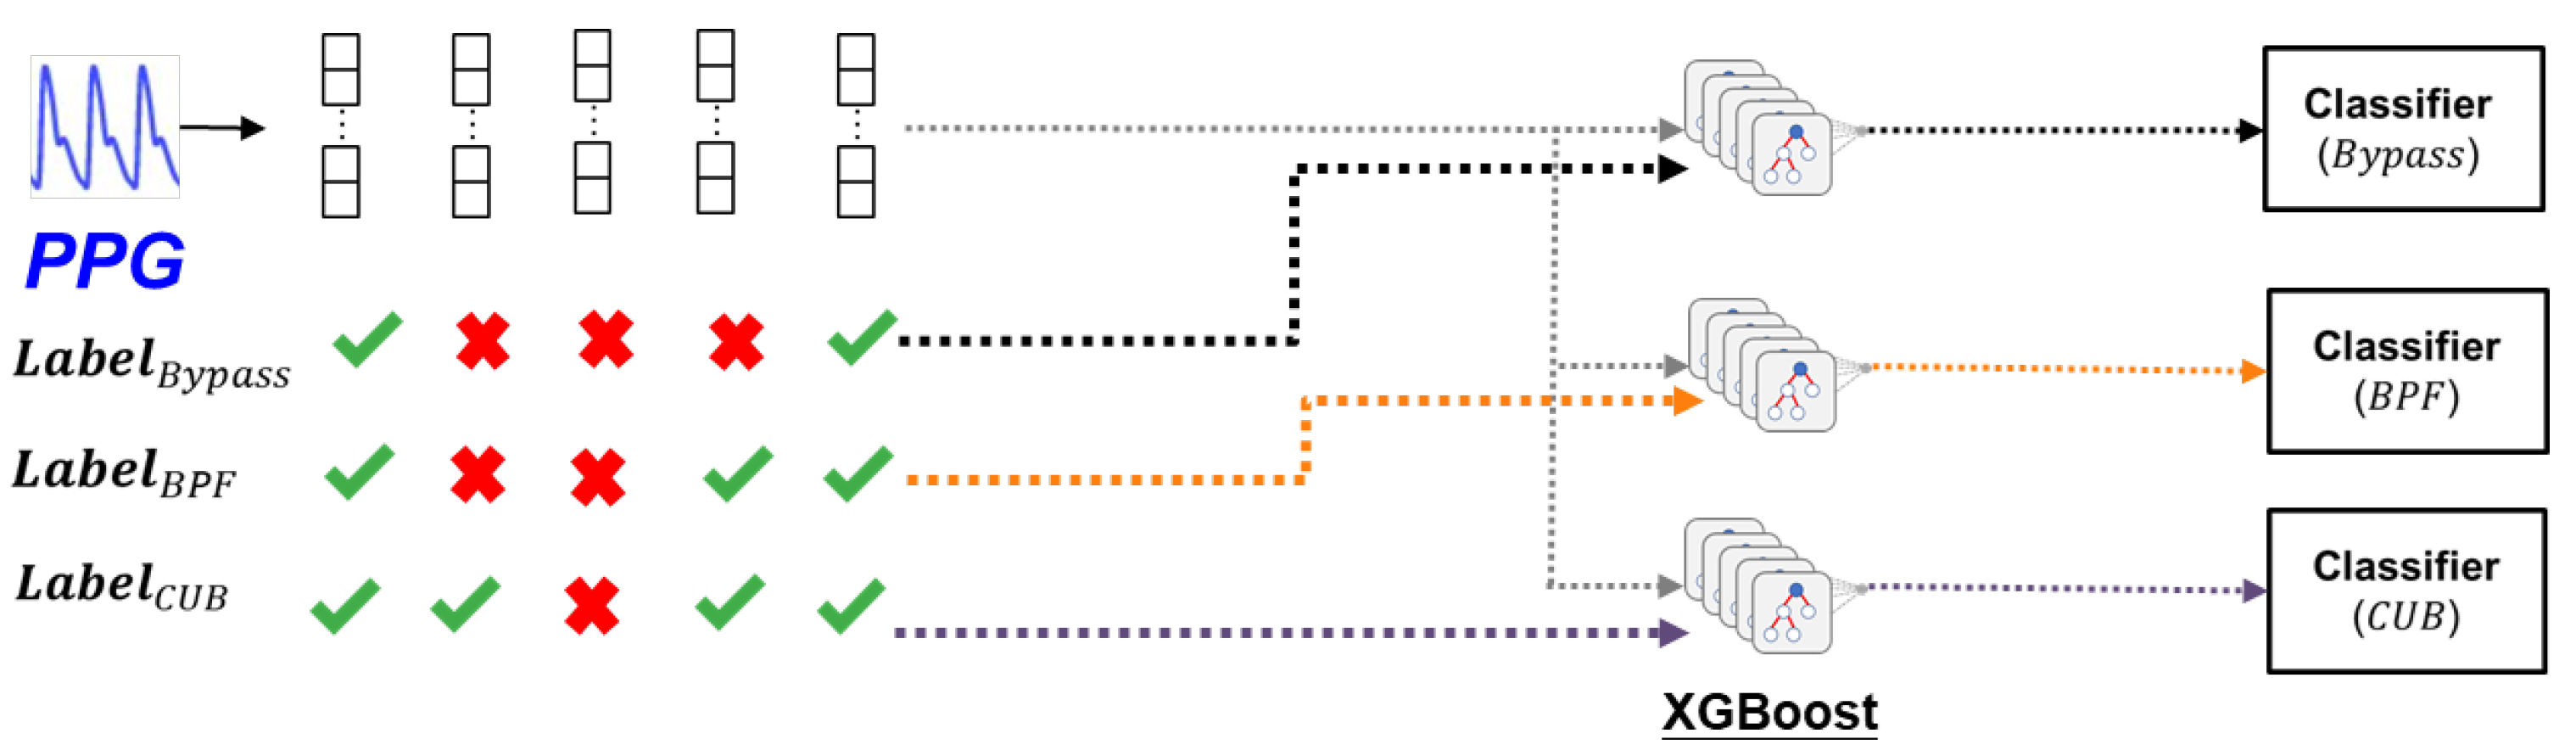
Figure 16.
Illustration diagram of determining the order of binary classifier.

Figure 17.
Box plot of energy consumption between classifiers with and without reorder by algorithm’s energy consumption.
Figure 17.
Box plot of energy consumption between classifiers with and without reorder by algorithm’s energy consumption.
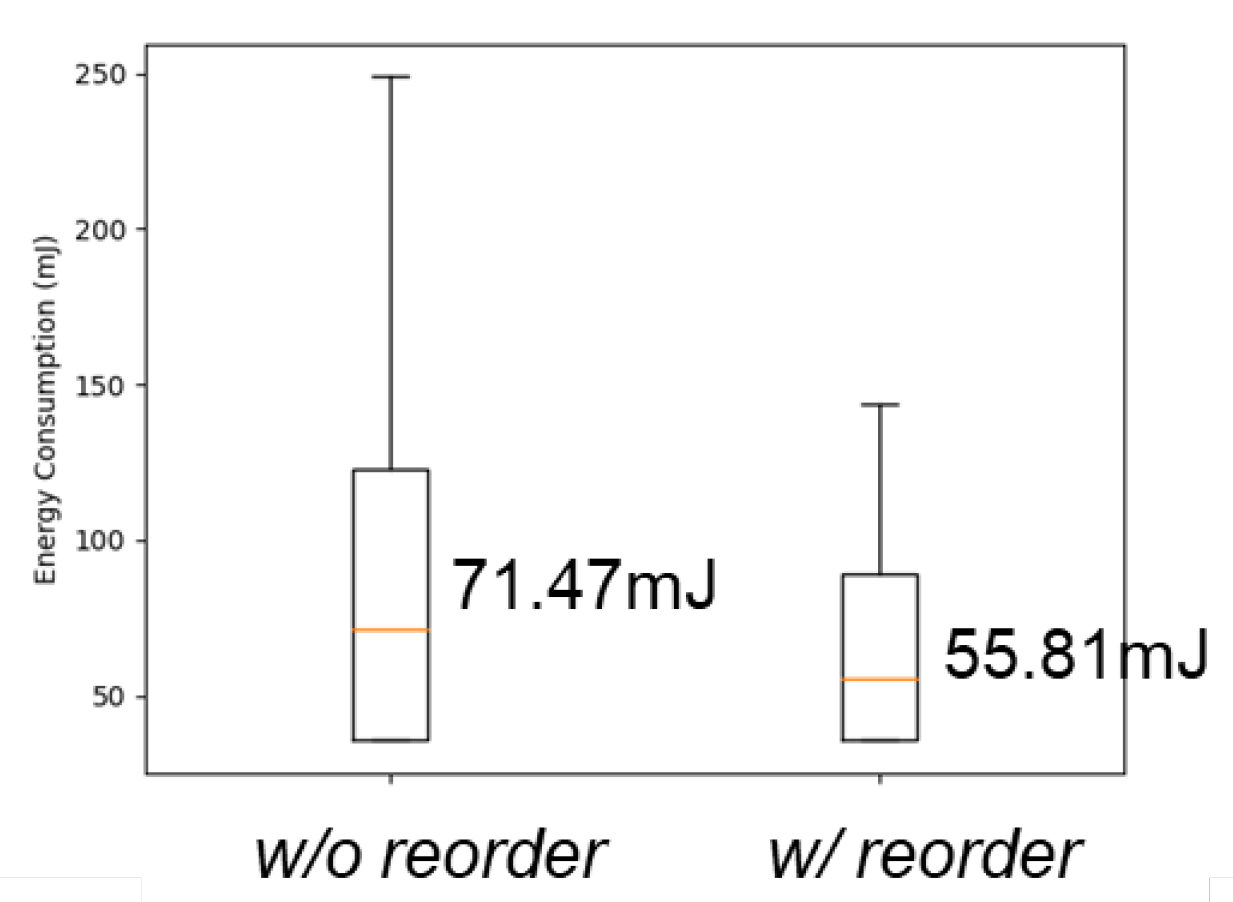
Figure 18.
Experimental flow of the data collection

Figure 19.
Different algorithm portfolio under resource-limited and resource-abundant scenario.
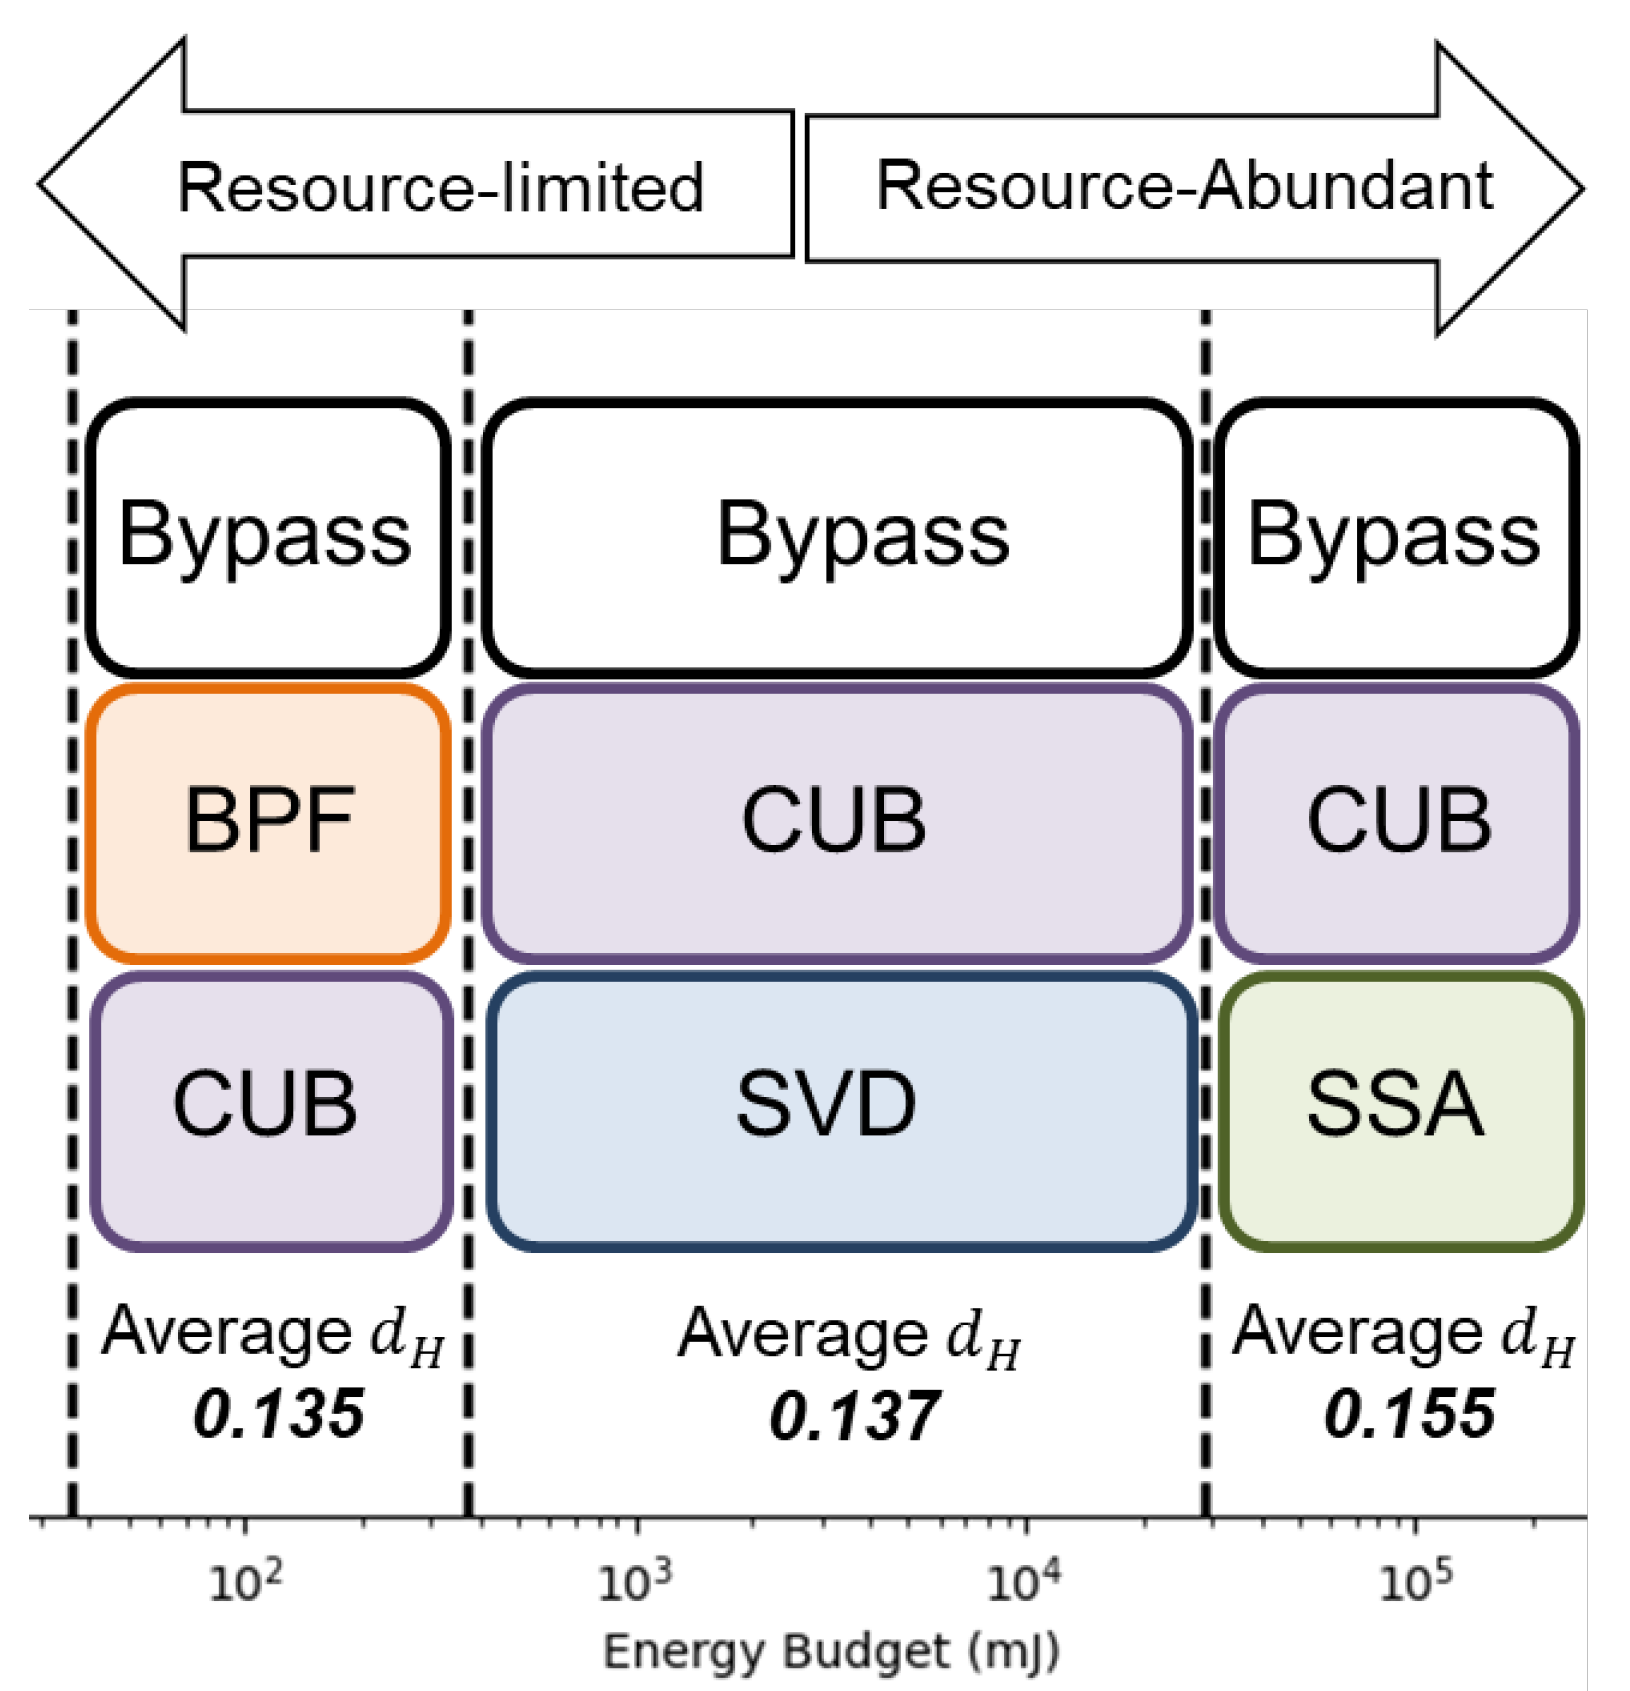
Figure 20.
Comparison of selected pre-processing algorithm between frameworks.
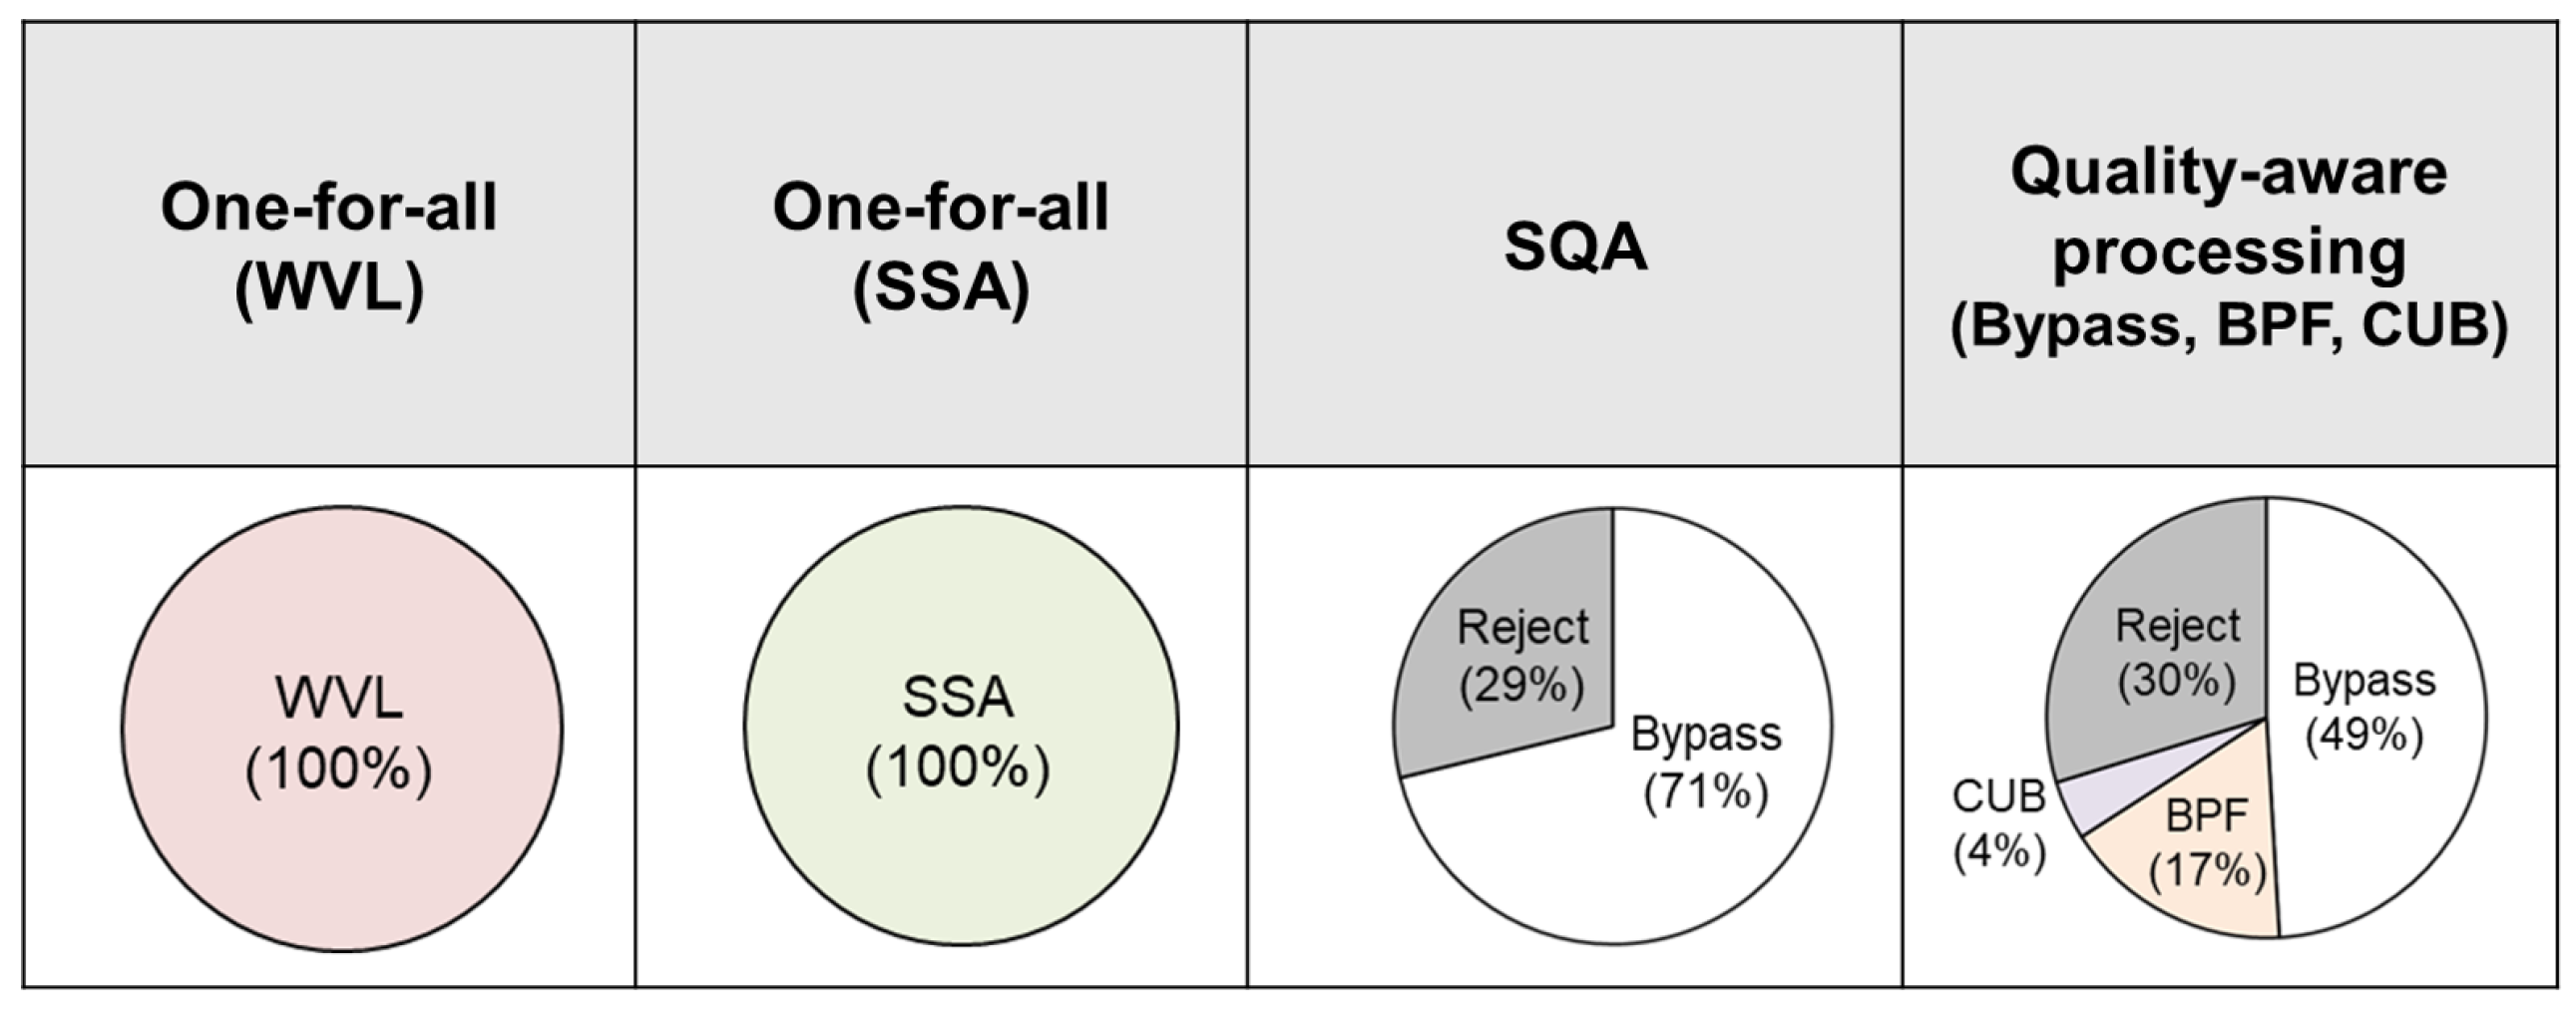
Figure 21.
The portion of signals passing each classifier.
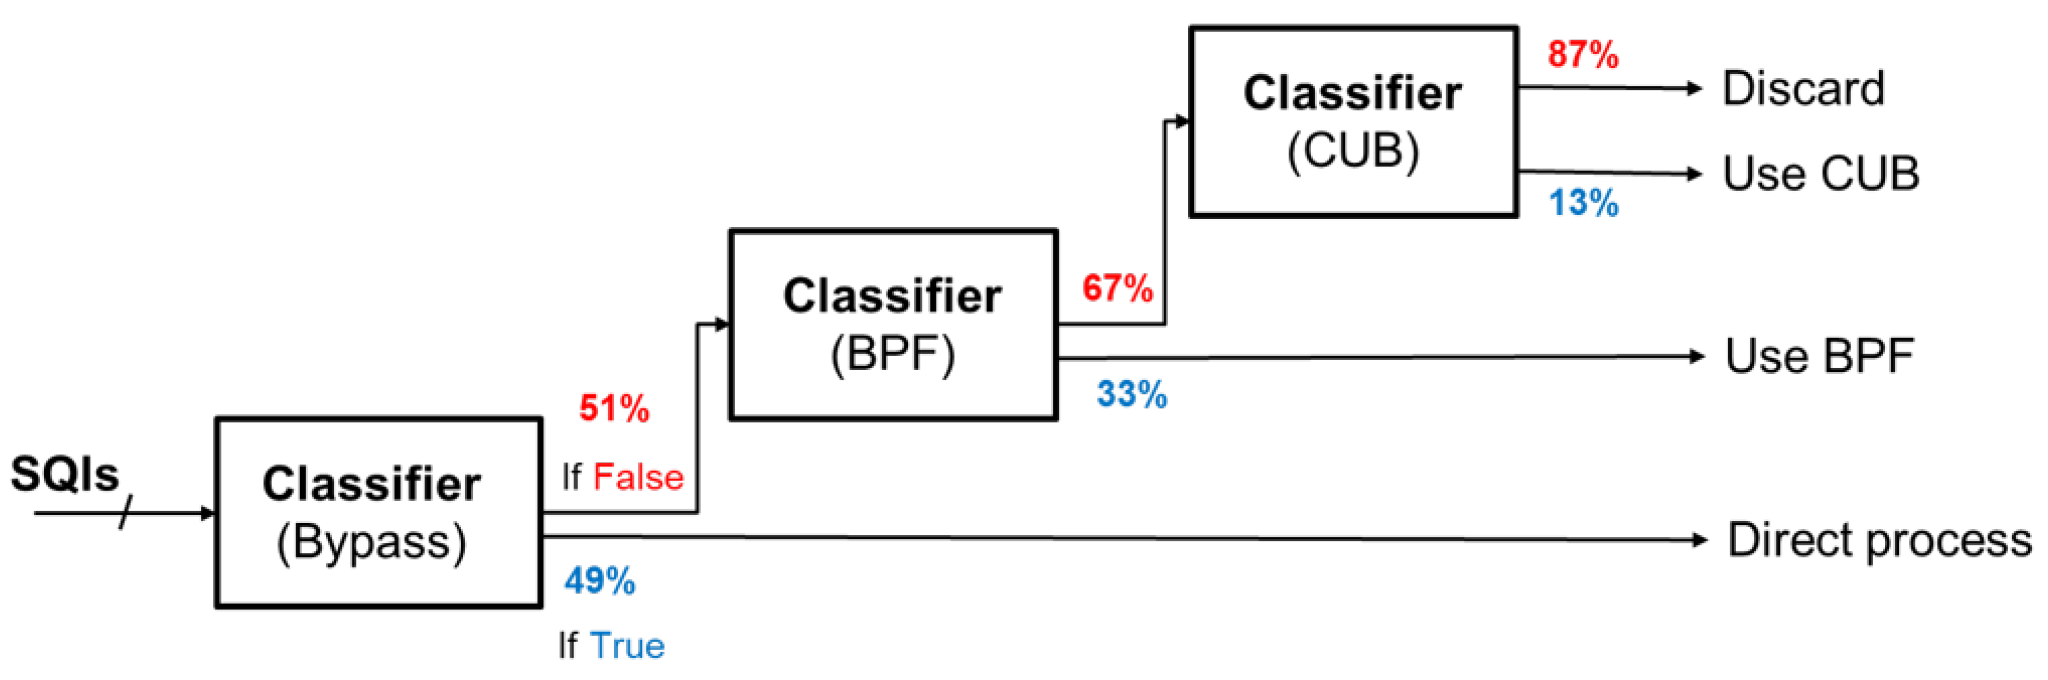

Table 1.
Setting for processing algorithm implementation.
| Category | Algorithm | Description |
|---|---|---|
| Filtering | Band-pass Filter | 5th order Butterworth (0.5-15Hz) |
| Low-pass Filter | 5th order Butterworth (2.5 Hz) | |
| High-pass Filter | 5th order Butterworth (0.5Hz) | |
| Decompose | Cubic Spline Interpolate [15] | - |
| Wavelet Filtering [16] | Daubechies 8 (db8) | |
| SVD of T-F Distribution (SVDTFD) [17] | First and second components | |
| Empirical Mode Decomposition (EMD) [18] | Remove EMD components 0.25 Hz | |
| Singular Spectrum Analysis (SSA) [1,19] | Remove SSA components 1 Hz |
Table 2.
Hamming distance between each algorithms, lower hamming distance between algorithm means higher similarity.
Table 2.
Hamming distance between each algorithms, lower hamming distance between algorithm means higher similarity.
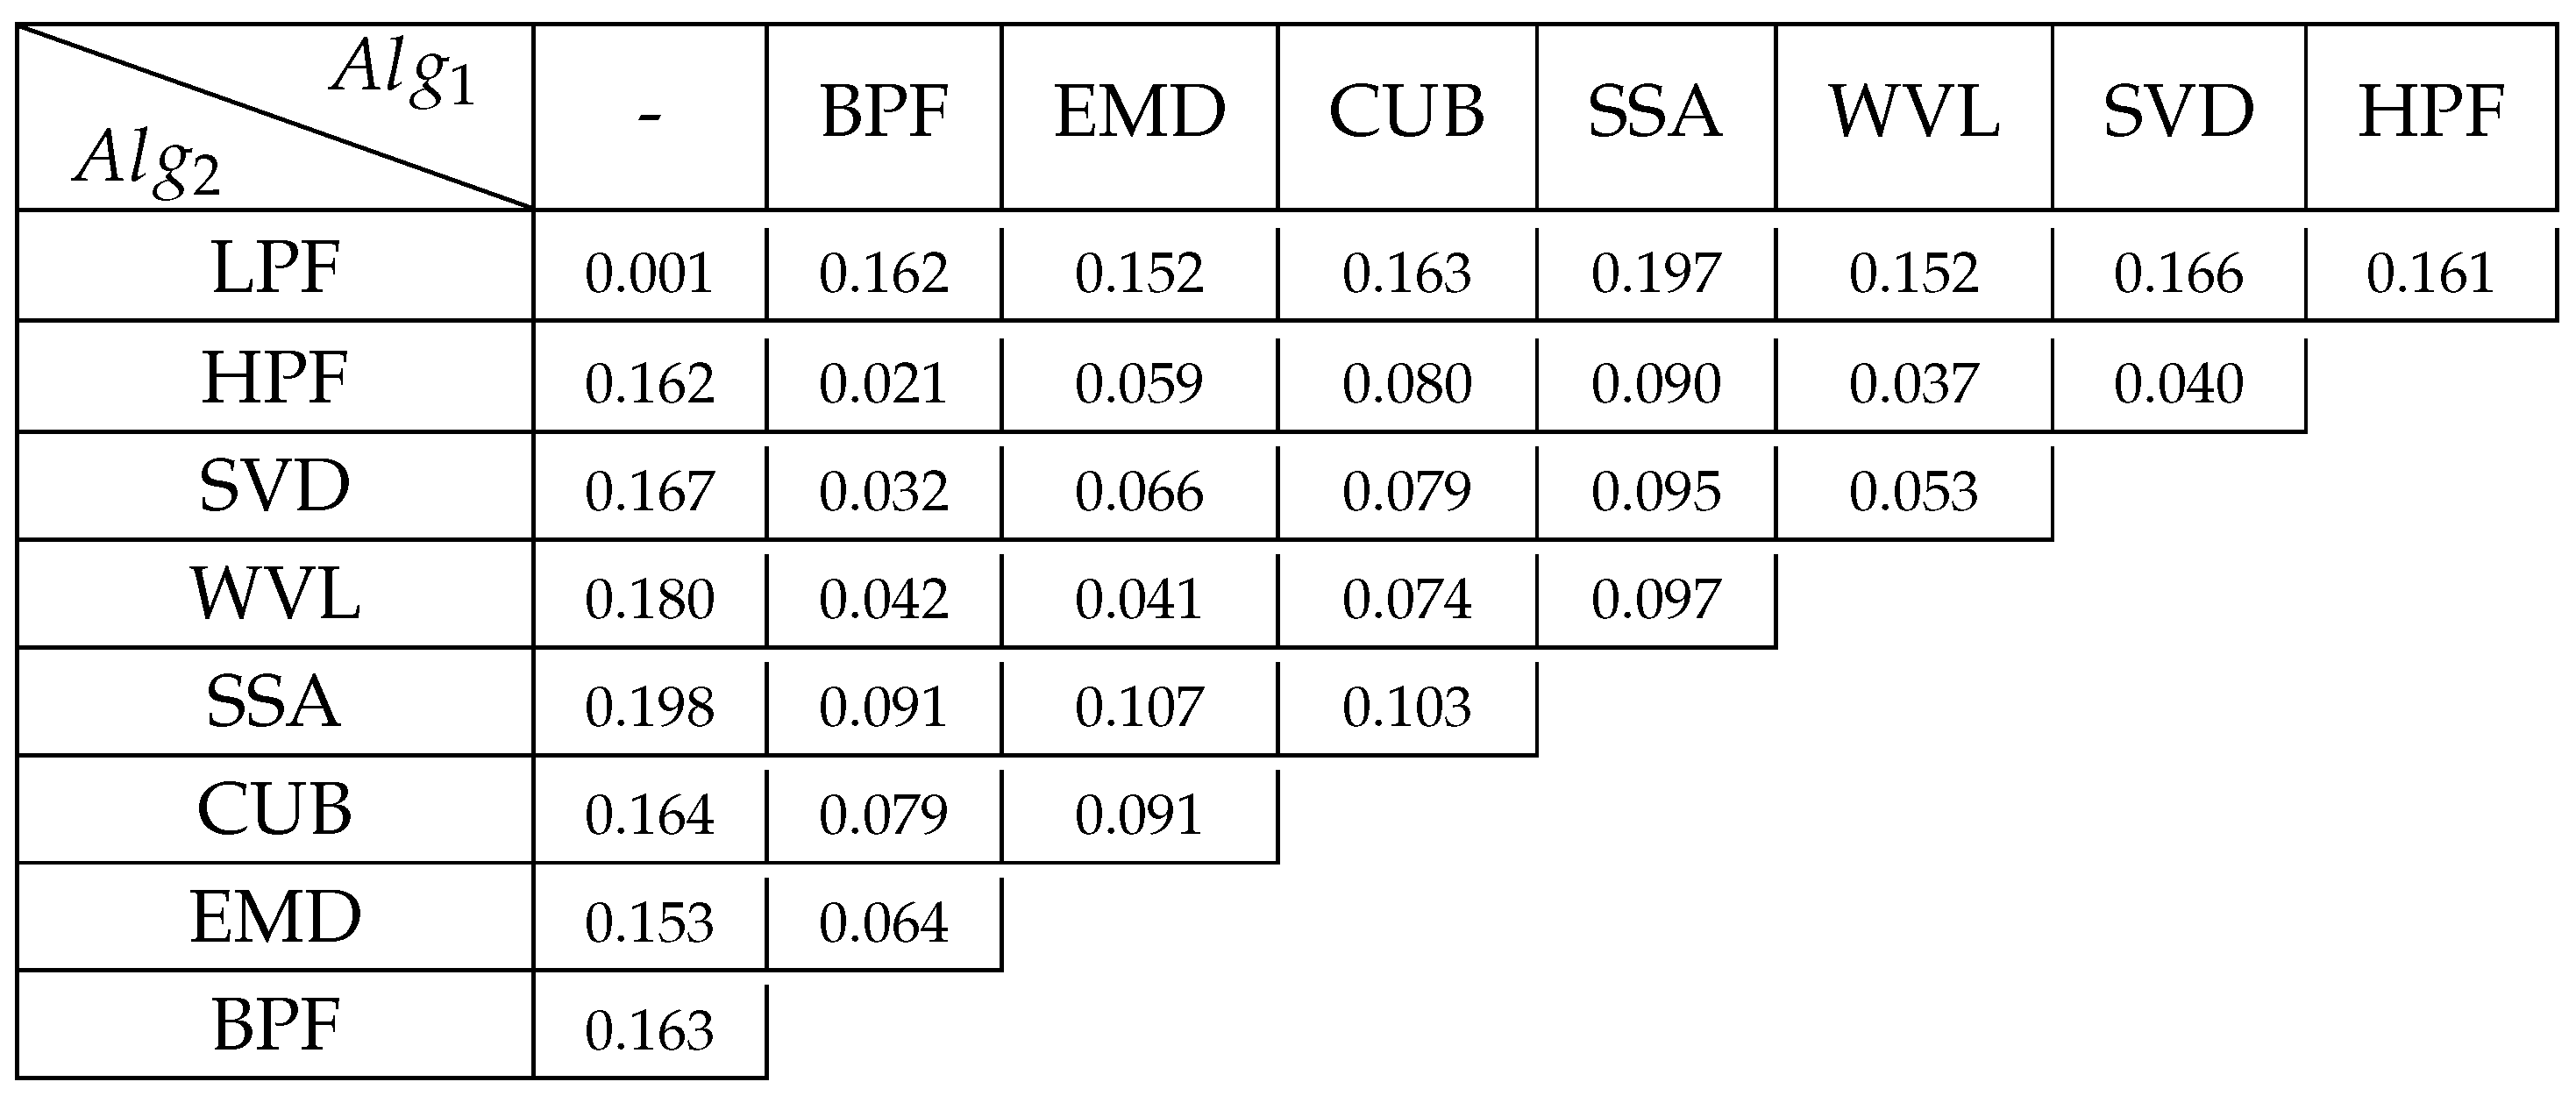
Table 3.
All candidate features
| Feature Type | Features |
|---|---|
| Statistics Features |
Median |
| Range | |
| Standard Deviation | |
| Kurtosis | |
| Skewness | |
| Entropy | |
| Frequency Domain Features |
PSD in {1Hz, 3Hz, 5Hz, 7Hz, 0.01-1Hz, 1-3Hz} |
| PSD Ratio of {1-3Hz/0.01-1Hz} | |
| STD of Frequency Spectrum |
Table 4.
Energy consumption of each algorithm estimated by RAPL.
| Algo. | Energy Consumption (mJ) |
|---|---|
| Bypass | 0 |
| Bandpass Filter (BPF) | 10.05 |
| Empirical Mode Decomposition (EMD) | 2268.50 |
| Cubic Spline Interpolation (CUB) | 10.85 |
| Singular Spectrum Analysis (SSA) | 28767.42 |
| Wavelet Decomposition (WVL) | 9.73 |
| Singular Value Decomposition (SVD) | 333.03 |
| High-pass Filter (HPF) | 14.57 |
| Low-pass Filter (LPF) | 10.28 |
Table 5.
Algorithm Portfolio under different energy budget.
| Energy Budget (mJ) | Selected Portfolio | ||
|---|---|---|---|
| E < 35.54 | One-For-All processing | ||
| 35.54 ≤ E < 368.57 | Bypass | CUB | BPF |
| 368.57 ≤ E < 28802.96 | Bypass | CUB | SVD |
| E ≥ 28802.96 | Bypass | CUB | SSA |
Table 6.
Comparison between frameworks in the application of heart rate monitoring.
| One-for-all (WVL) |
One-for-all (SSA) |
SQA | QAP (Bypass, BPF, CUB) |
|
| H.R. Accuracy (%) |
74.5 | 80.2 | 77.8 ± 13.8 | 83.2 ± 11.0 |
| Mean Absolute Error (BPM) |
6.02 ± 10.3 | 4.1 ± 7.6 | 6.1 ± 10.7 | 4.7 ± 9.2 |
| Per sample Energy Consumption (mJ) |
9.73 | 28767.4 | 35.5 | 37.8 |
Table 7.
The accuracy of each signal group without processing in proposed mechanism.
| Accuracy w/o process |
MAE w/o process |
|
| Group I | 0.84 | 4.42 ± 8.82 |
| Group II | 0.63 | 9.96 ± 13.86 |
| Group III | 0.62 | 8.37 ± 10.85 |
| Group IV | 0.37 | 14.70 ± 12.79 |
Disclaimer/Publisher’s Note: The statements, opinions and data contained in all publications are solely those of the individual author(s) and contributor(s) and not of MDPI and/or the editor(s). MDPI and/or the editor(s) disclaim responsibility for any injury to people or property resulting from any ideas, methods, instructions or products referred to in the content. |
© 2024 by the authors. Licensee MDPI, Basel, Switzerland. This article is an open access article distributed under the terms and conditions of the Creative Commons Attribution (CC BY) license (http://creativecommons.org/licenses/by/4.0/).
Copyright: This open access article is published under a Creative Commons CC BY 4.0 license, which permit the free download, distribution, and reuse, provided that the author and preprint are cited in any reuse.