Submitted:
08 April 2024
Posted:
09 April 2024
You are already at the latest version
Abstract
The NP method was used to elucidate the contributions of vehicles and coal combustion to seasonal and long-term atmospheric PM-bound Pyr and 1-NP concentrations in Kanazawa, Kitakyushu, Shenyang, and Shanghai in the Western Pacific region from 1997 to 2021. Among the four cities, Kanazawa demonstrated the lowest Pyr concentration. The contribution of vehicles to Pyr before and after 2010 were 35% and 5%, respectively. The 1-NP concentration reduced by a factor of more than 1/10. These changes can be attributed to the emission control from vehicles. Kitakyushu revealed the second lowest Pyr and the lowest 1-NP concentrations. Coal combustion was found to be the main contributor to Pyr, while its contribution to 1-NP increased from 9% to 19%. The large contribution of coal combustion is attributed to iron manufactures. Shenyang demonstrated the highest atmospheric Pyr concentration with its largest seasonal change. Vehicles are the largest contributors to 1-NP. However, coal combustion, including winter coal heating, contributed 97% or more to Pyr and more than 14% to 1-NP. Shanghai revealed the second highest Pyr and 1-NP concentrations, but the former was substantially lower than in Shenyang. Coal combustion was the major contributor, but the contribution of vehicles to Pyr was larger before 2010 similar to Kanazawa.
Keywords:
Western Pacific
; vehicle
; coal combustion
; source contribution
; pyrene
; 1-nitropyrene
1. Introduction
Air pollution causes millions of deaths every year in the world [1]. Particulate matters (PMs) and several types of harmful pollutants, including polycyclic aromatic hydrocarbons (PAHs) and their nitro-, hydroxy-, and quinoid derivatives, can be attributed to the incomplete combustion of organic matters. A variety of combustion sources, including vehicles, factories, power stations, incinerators, home heaters and ovens, postharvest field burning, and forest fires, emit several PAHs such as benzo[a]pyrene and nitropolycyclic aromatic hydrocarbons (NPAHs) such as dinitropyrens (DNPs), demonstrating carcinogenicity/mutagenicity. Most of these toxic hydrocarbons are contained in fine inhalable particles with a diameter of 2.5 µm and smaller (PM2.5) in the air and implicated in respiratory and cardiovascular diseases [2,3].
The rapid increase in the number of vehicles intensified urban air pollution in Japan in the 1980s to 1990s. As a result, the number of respiratory disease patients increased. The Japanese government lowered allowable PM and nitrogen oxide (NOx) emissions from new vehicles to improve air quality [4]. To clarify the trends in air pollution due to PAHs and NPAHs in the Western Pacific, total suspended particulates (TSPs) were collected in Tokyo, Sagamihara, Sapporo, and Kanazawa (Japan), Shenyang, Beijing, and Shanghai (China), Vladivostok (Russia), and Busan (Korea) in summers and winters from 1997 to 2014 [5,6]. Atmospheric concentrations of PAHs and NPAHs significantly decreased in Japanese commercial cities in the 2000s. By contrast, northern Chinese and far-eastern Russian cities showed one order or more higher PAH concentrations due to a considerable amount of coal combustion. Thus, vehicles and coal combustion were found to be the main sources for urban atmospheric PAHs and NPAHs in this region. However, PAH and NPAH concentrations and their long-term and seasonal changes varied greatly from city to city [7]. Therefore, determining the exact amount of contribution of each source is necessary to identify effective measures against air pollution.
The NP method, a new calculation approach for the contributions of major sources to atmospheric combustion-derived PM (Pc), PAHs, and NPAHs using 1-nitropyrene (1-NP) and pyrene (Pyr) as markers, was recently developed [8,9]. Using this method, atmospheric Pc concentrations and the long-term and seasonal contributions of vehicles and coal combustion to Pc in the above 10 cities were calculated [10]. These cities were then divided into two groups with high- and low-Pc concentrations. The former group included Shenyang, Beijing, and Vladivostok, which consumed substantial amounts of coal for winter heating, and the latter group included Tokyo, Sagamihara, Sapporo, Kanazawa, Kitakyushu, Shanghai, and Busan. The latter cities were thoroughly divided into two groups based on emission source types. The first group included Tokyo, Sagamihara, Sapporo, Kanazawa, Shanghai, and Busan whose main emission sources were vehicles, and the second group included Kitakyushu whose main emission source was coal combustion for coke oven plants in steel manufactures. However, the contribution amount of each emission source to atmospheric PAHs and NPAHs is still unknown.
From the 10 aforementioned cities, Kanazawa, Kitakyushu, Shenyang, and Shanghai, which demonstrated distinctive source contributions to Pc, were selected to address the above issues. This paper calculated the contributions of vehicles and coal combustion using the NP method to clarify the causes of long-term and seasonal changes in the atmospheric PAH and NPAH concentrations.
2. Materials and Methods
2.1. Airborne particulate samples
TSP or PM2.5 samples were collected in residential areas in Kanazawa, Kitakyushu, Shenyang, and Shanghai (Fig. S1). Table S1 summarizes the fundamental characteristics of these cities (locations, populations, temperatures, and main industries). Kanazawa, which is a typical local commercial city, uses electricity or kerosene for winter heating. Kitakyushu is an iron-manufacturing city that consumes a considerable amount of coal in steel manufactures. Shenyang is an agricultural and industrial mega city that has a large amount of coal consumption for winter heating. As a business and commercial mega city, Shanghai does not use winter heating. A high-volume air sampler equipped with a quartz fiber filter (8 × 10 in, 2500QAT-UP, Tokyo Dylec, Tokyo, Japan) was set in a residential area in each city, and 24 h sampling was continued for two consecutive weeks in each season [5,6].
2.2. Data of PAHs and NPAHs concentrations
Sampling cities, periods, cities, and sizes of PM samples are presented in Table 1 with references: Analytical results of TSP collected in Kanazawa, Kitakyushu, Shenyang, and Shanghai from summer 1997 to winter 2014; PM (PM≤2.1 + PM>2.1) in Kanazawa in summer 2017 and winter 2018; and PM2.5 in Shanghai from summer 2015 to winter 2018, autumn 2018, and spring 2019 were used. Additionally, PM2.5 in Kanazawa from winter 2020 to winter 2021 were collected in this study.
A high-performance liquid chromatograph (HPLC) equipped with a fluorescence detector was used in accordance with the USEPA standard method to quantify nine PAHs: fluoranthene, Pyr, benz[a]anthracene (BaA), chrysene (Chr), benzo[b]fluoranthene, benzo[k]fluoranthene, benzo[a]pyrene (BaP), benzo[ghi]perylene, and indeno[1,2,3-cd]pyrene [11]. An HPLC equipped with a reducing column packed with platinum/rhodium-coated particles and a chemiluminescence detector was used to quantify six NPAHs, namely, 9-nitroanthracene, 1-NP, 6-nitrocrysene (6-NC), 7-nitrobenz[a]anthracene (7-NBaA), 3-nitroperylene, and 6-nitrobenzo[a]pyrene (6-NBaP) [12,13]. Instead of the chemiluminescence detection system, the same HPLC equipped with a fluorescence detector was also used for several samples.

Table 1.
Sampling cities and periods of PM samples used in this study.
| City (Period) | PM size | Ref. |
| Kanazawa, Kitakyushu, Shenyang, Shanghai (summer 1997–winter 2014) | TSP | [5] |
| Kanazawa (summer 2017 and winter 2018) | PM≤2.1 + PM>2.1 | [14] |
| Kanazawa (winter 2020–winter 2021) | PM2.5 | This study |
| Shanghai (summer 2015–winter 2018) | PM2.5 | [15] |
| Shenyang (autumn 2018 and spring 2019) | PM2.5 | [16] |
2.3. Calculation of source contributions
Among the PAH and NPAH concentrations in PM samples in Table 1, data sets of Pyr and 1-NP were used for the NP method analysis. The outline of this method to calculate source contributions [8] is presented below. PM-bound Pyr in the atmosphere is divided into the high-temperature combustion-derived Pyr (Pyrh) and low-temperature combustion-derived Pyr (Pyrl). PM-bound 1-NP in the atmosphere is also categorized into high-temperature combustion-derived 1-NP (1-NPh) and low-temperature combustion-derived 1-NP (1-NPl). Let the fractions of 1-NPh in 1-NP (= 1-NPh + 1-NPl) and Pyrh in Pyr (= Pyrh + Pyrl) in the atmosphere be a (0 < a < 1) and b (0 < b < 1), respectively. Thus, Equations (i) and (ii) can be obtained.
[1-NPh] = [1-NP]a and [1-NPl] = [1-NP](1 - a) (i)
[Pyrh] = [Pyr]b and [Pyrl] = [Pyr](1 - b) (ii)
Equations (iii) and (iv) can be obtained by dividing Equation (i) by Equation (ii).
[1-NPh]/[Pyrh] = [1-NP]a/[Pyr]b (iii)
[1-NPl]/[Pyrl] = [1-NP](1 – a)/[Pyr](1 – b) (iv)
The nitration reaction of organic compounds is temperature dependent, and a substantial increase in the yield of NPAHs from mother PAHs with temperature is observed [17]. As described above, the two major contributors to PAHs and NPAHs are vehicles and coal combustion around the sampling sites in the four cities. The combustion temperatures of vehicle engines and coal combustion were 2,700 °C–3,000 °C and 1,100 °C–1,200 °C, respectively, and the molar concentration ratio of 1-NP to Pyr ([1-NP]/[Pyr]) of vehicles (= 0.425) was substantially larger than that of coal combustion (= 0.0013) [7]. The values of a (= [1-NPh]/[1-NP]) and b (= [Pyrh]/[Pyr]), which correspond to the contributions of vehicles to atmospheric 1-NP and Pyr, respectively, can be calculated by introducing these ratios into Equations (iii) and (iv). The values of a and b with atmospheric concentrations of Pyr and 1-NP for all samples are presented in Table S2.
3. Results
3.1. Long-term and seasonal changes in Pyr and 1-NP
As shown in Figure 1, Figure 2, Figure 3 and Figure 4, considerable differences in atmospheric Pyr and 1-NP concentrations were observed in Kanazawa, Kitakyushu, Shenyang, and Shanghai. First, a big difference of the Pyr profile was observed among the four cites (Figures 1 to 4(A)). Shenyang demonstrated the highest mean annual Pyr concentrations (at 16,900 pg/m3 before 2010 and 7430 pg/m3 after 2010), while Kanazawa showed the lowest concentrations (338 and 154 pg/m3, respectively) (Table 2). The long-term and seasonal changes in the four cities also demonstrated substantial differences. The decreasing factor (d/c) of the mean annual Pyr concentration ratio (c) before 2010 and (d) after 2010 in Kanazawa and Shenyang were 0.46 and 0.44, respectively, indicating a decreasing tendency. However, Kitakyushu, whose d/c was 1.3, did not reveal such a decreasing tendency. By contrast, Shanghai, whose d/c was 2.6, demonstrated an increasing tendency despite an insufficiently short monitoring period. This finding can be attributed to the continuous increase of the winter Pyr concentration by 2014. A seasonal difference (winter > summer) in the Pyr concentration in all cities was also observed. Among them, Shenyang revealed the largest winter/summer ratio (= 25), which was more than one order of magnitude larger than the other cities (Table 3).
Second, Figures 1 to 4 (B) show the long-term and seasonal variations in 1-NP concentrations in the four cities. Shanghai demonstrated the highest 1-NP concentration (371 pg/m3) in summer 2007 (Table S2). However, the mean annual 1-NP concentrations were highest in Shenyang in both periods (88 and 85 pg/m3 before and after 2010, respectively) and lowest in Kitakyushu (8.3 and 5.2 pg/m3 before and after 2010, respectively) (Table 4). Despite the lowest mean annual 1-NP concentrations among the four cities, Kanazawa demonstrated a decreasing tendency of the 1-NP concentration (d/c = 0.08), which was substantially clearer than that of the Pyr concentration. It should be noted that Shenyang and Kitakyushu had larger fractions of 1-NPl to Pyr (1-NPl/1-NP) than the other two cities. However, the decreasing tendency of the 1-NP concentration was absent in Shenyang (d/c = 0.97) (Table 4). All cities revealed seasonal changes (winter > summer) in the 1-NP concentration. Among them, Shenyang showed the largest winter to summer ratio of 1-NPl (W/S = 5.1) (Table 5). However, this ratio was substantially smaller than that of Pyr in this city described above, indicating that the seasonal change in the 1-NP concentration was considerably weaker.
3.2. Long-term and seasonal change in source contributions
The contribution of the two combustion sources to the atmospheric Pyr and 1-NP were examined using the NP method. First, Equations in 2.3 were used to calculate fractions of Pyrh (b) and Pyrl (1 - b) in Pyr. As shown in Figures 1 to 4 (C), Pyrl was constantly over 50% of the atmospheric Pyr in all cities over the monitoring period. However, the fraction of Pyrh markedly varied from city to city and from time to time. In Kanazawa, regardless of the lowest Pyr concentration among the four cities, the fraction (%) of Pyrh in Pyr (Pyrh/Pyr) was over 35% in the 1990s (Fig. 1(C)). The fraction of Pyrh in Pyr was 35% before 2010, which was the highest among the four cities (Table 2). However, the fraction of Pyrh in Pyr was 5% with decreasing the Pyrh concentration to the lowest (= 7.4 ng/m3) among the four cities after 2010. The fraction of Pyrh in Pyr in Kitakyushu remained at the low level not more than 4% over the periods. The Pyr concentration abruptly increased in the winter 2014 (Fig. 2(C)). But the fraction of Pyrh was less than 1% (Table 2). The rise in the Pyl concentration contributed to the aforementioned increase in the Pyr concentration. Shenyang revealed the highest Pyr concentration among the four cities with a decreasing tendency (Fig. 3(C)). The fraction of Pyrl in Pyr was considerably large (more than 97%) over the period, while the fraction of Pyrh was not more than 3% (Table 2). The seasonal difference in the Pyrl concentration (winter/summer ratio = 26) was also the largest among the four cities (Table 3), contributing to the remarkable seasonal change in the Pyr concentration as described above. In Shanghai, the fraction of Pyrh in Pyr (= 18%) was the second largest before 2010 (Fig. 4(C)). But the fraction of Pyrh sharply decreased to 3% after 2010 (Table 2). This decreasing tendency in Shanghai was similar to Kanazawa, but the phase was later by several years.
Second, the fractions of 1-NPh (a) and 1-NPl (1 - a) in 1-NP were calculated using Equations in 2.3. Contributions of the two sources to 1-NP were completely different from those to Pyr. a value in the four cities. From Table S2, the fraction of 1-NPh in 1-NP was always larger than that of 1-NPl. By contrast, the fraction of 1-NPl in 1-NP was larger than 35% several times in Shenyang and Kitakyushu, but not more than 8% in Kanazawa and Shanghai over the period. The fractions of 1-NPl in 1-NP were 27% and 14%, respectively, in Shenyang before and after 2010 and 19% in Kitakyushu after 2010 (Table 4). Notably, among the four cities, Shenyang revealed the largest seasonal difference (W/S ratio = 23) in the 1-NPl concentration. However, such a considerable seasonal difference was not found in 1-NP in all for cities (Table 5). These results indicated that large amounts of coal combustions for heating increased the 1-NPl concentration only in Shenyang in winter.
4. Discussion
The combustion of organic materials emits PAHs and NPAHs. The production of high molecular weight PAHs increases with the combustion temperature [18]. The nitration reaction is also temperature dependent, which increases the concentration ratio of NPAH to its corresponding PAH. In exhaust PM, concentration ratios of [1-NP]/[Pyr], [6-NC]/[Chr], [7-NBaA]/[BaA], and [6-NBaP]/[BaP] were larger from vehicle engines with higher-combustion temperature than in coal combustion facilities with lower-combustion temperature [7]. Therefore, several NPAHs have become exposure markers for diesel vehicles [19].
For gasoline engine vehicles, three-way catalyst systems that could reduce carbon mono-oxide (CO), hydrocarbon (HC) and NOx in emission gas were developed. The installation of this system has progressed since the 1970s. However, urban air pollution did not improve in Japan at all. As mentioned above, its health effects became a major problem in the 1980s. The reason for this was the rapid increase in the number of vehicles equipped with diesel engines, which produce far more PM and NOx than gasoline engines [20]. Therefore, technological improvements were made to diesel engines and fuel, and the government's PM and NOx emission regulations for diesel vehicles were gradually tightened. In response to the Japanese governmental control values, atmospheric concentrations of BaP and 6-NBaP in Kanazawa, which were high in the 1990s, dramatically reduced in the 2000s [21]. Therefore, vehicles were identified as the major contributor to the atmospheric 1-NP. A similar reduction in the atmospheric PAH and NPAH concentration was also observed in other Japanese commercial cities [5]. By contrast, the fraction of Pyrh in Pyr was over 35% in Kanazawa in the 1990s, indicating that the mixture of coal combustion and vehicles contributed to Pyr. However, as described above, the emission control against vehicles effectively reduced their atmospheric concentrations after the 2000s.
Kitakyushu is a typical steel manufacturing city, where coke oven plants consume considerable amounts of coal. The air sampling site is located 6 to 17 km west–southwest of steel mills and is on the leeward side of the westerly wind that blows from Asian continent to Japan Islands. This finding indicated the strong effects of iron manufactures on the atmospheric PAHs and NPAHs. A previous report revealed that combustion sources with low temperature largely contributed to Pc emission in this city than in Kanazawa [10]. A major contributor to Pyr involved the combustion of large amounts of coal, especially in iron manufactures. Meanwhile, vehicles were the major contributors to 1-NP.
Coal energy in Shenyang used for winter heating is 70% of the primary energy [22]. Coal combustion was reported to contribute more largely to the atmospheric Pc than vehicles in this city [10]. Moreover, the atmospheric Pyr concentration demonstrated a large seasonal difference (winter > summer). Therefore, coal combustion, especially for winter heating, was identified as the major contributor to Pyr. Although the major contributor to 1-NP was vehicles, coal heating also contributed to the atmospheric1-NP to some extent.
The contribution of vehicles to the atmospheric Pc in Shanghai was larger than that of coal combustion [10]. The contribution of vehicles to Pyr was over 30% in Shanghai in the summer 2007, although the contribution of coal combustion to Pyr was much larger than that of vehicles over the period. Subsequently, it decreased gradually, similar to Kanazawa. These results indicated that the effects of technological innovations of vehicle engines and oils emerged several years later in this city than in Kanazawa.
For 47 samples in Table S1, the correlations between Pyr and nine PAHs and 1-NP and two NPAHs (= 1-NP + 6-NBaP) were 0.963 and 1.00, respectively. The strong relations indicated the above results of Pyr and 1-NP are regarded as the results of the primary emitted PAHs and NPAHs, respectively [13].
5. Conclusion
As two major combustion sources, contributions of vehicles and coal combustion to long-term and seasonal changes in atmospheric PM-bound Pyr and 1-NP concentrations in Kanazawa, Kitakyushu, Shenyang, and Shanghai in the Western Pacific region were elucidated using the NP method.
- (1)
- Kanazawa demonstrated the lowest Pyr concentration among the four cities. The contribution of vehicles to Pyr before and after 2010 were 35% and 5%, respectively. By contrast, the atmospheric 1-NP concentration, of which more than 95% was emitted from vehicles, markedly decreased after 2010 by a factor of more than 1/10. These changes can be attributed to the effective control against PM/NOx emissions from vehicles.
- (2)
- The second lowest Pyr concentration and the lowest 1-NP concentration were observed in Kitakyushu. The contribution of coal combustion was more than 96% to the atmospheric Pyr, while that to 1-NP before and after 2010 was 9% and 19%, respectively. The large contribution of coal combustion to Pyr and 1-NP can be attributed to iron manufactures, where a large amount of coal was consumed in coke oven plants.
- (3)
- The highest Pyr concentration with its largest seasonal change (winter/summer) was found in Shenyang. Although vehicles were the major contributor to 1-NP, coal combustion, including winter coal heating, contributed 97% or more to the atmospheric Pyr and around 14%–27% to the atmospheric 1-NP.
- (4)
- Shanghai revealed the second highest atmospheric Pyr and 1-NP concentrations, but the former concentration was substantially lower than that in Shenyang. Coal combustion was the major contributor to Pyr and 1-NP, but vehicles still contributed 18% to the atmospheric Pyr before 2010. However, their contribution decreased to 1% after 2010 due to the development of technology on vehicle emissions.
- (5)
- Strong correlations between Pyr and PAH concentrations and between 1-NP and NPAH concentrations in the four cities indicate that the above results for Pyr and 1-NP can be considered in terms of the contributions of vehicles and coal combustion to PAHs and NPAHs, respectively.
Funding
This research was financially supported in part by the research fund from the Japan Automobile Research Institute.
Institutional Review Board Statement
Not applicable.
Informed Consent Statement
Not applicable.
Data Availability Statement
The data presented in this study are available in this article.
Acknowledgments
We would like to thank Professor Tang. N. and students belonging to Kanazawa University for their contribution to analyzing PAHs and NPAHs. We would like to thank MARUZEN-YUSHODO Co., Ltd., and Professor Nagato, G. E., Shimane University, Japan, for the English language editing.
Conflict of Interest
The authors declare no conflict of interest.
References
- World Health Organization, Air pollution and child health: Prescribing clean air, WHO reference number: WHO/CED/PHE/18.01.2018. Available online: https://who.int/bitstraam/handle/10665/275545/WHO-CED-PHE-18.1-erg.pdf.
- International Agency for Research on Cancer, Diesel and Gasoline Engine Exhausts and Some Nitroarenes, IARC Monographs on the Evaluation on Carcinogenic Risks to Humans; International Agency for Research on Cancer: Lyon, France, 2014; Volume 105, ISBN 978-92-832-01434.
- Hayakawa, K., Chapter 22, Polycyclic aromatic hydrocarbons. In Handbook of Air Quality and Climate Change, eBook, eds Akimoto, H. and Tanimoto, H., Springer, April 10, 2022, ISBN 978-981-15-2527-8. [CrossRef]
- Japan Society of Atmospheric Environment, History of Atmospheric Pollution in Japan (Jpn: Nippon No Taikiosen No Rekishi); Kouken-Kyokai: Tokyo, Japan, 2000. ISBN-13: 978484420101.
- Hayakawa, K.; Tang, N.; Nagato, E.G.; Toriba, A.; Sakai, S.; Kano, F.; Goto, S.; Endo, O.; Arashidani, K.-I.; Kakimoto, H. Long term trends in atmospheric concentrations of polycyclic aromatic hydrocarbons and nitropolycyclic aromatic hydrocarbons: A study of Japanese cities from 1997 to 2014. Environ. Pollut. 2018, 233, 474–482. [Google Scholar] [CrossRef] [PubMed]
- Hayakawa, K.; Tang, N.; Nagato, E.; Toriba, A.; Lin, J.-M.; Zhao, L.; Zhou, Z.; Qing, W.; Yang, X.; Mishukov, V.; et al. Long-Term Trends in Urban Atmospheric Polycyclic Aromatic Hydrocarbons and Nitropolycyclic Aromatic Hydrocarbons: China, Russia, and Korea from 1999 to 2014. Int. J. Environ. Res. Public Heal. 2020, 17, 431. [Google Scholar] [CrossRef] [PubMed]
- Hayakawa, K. Review: Environmental behaviors and toxicities of polycyclic aromatic hydrocarbons and nitropolycyclic aromatic hydrocarbons. Chem. Pharm. Bull. 2016, 64, 83–94. [Google Scholar] [CrossRef] [PubMed]
- Hayakawa, K.; Tang, N.; Toriba, A.; Nagato, E.G. Calculating sources of combustion-derived particulates using 1-nitropyrene and pyrene as markers. Environ. Pollut. 2020, 265, 114730. [Google Scholar] [CrossRef] [PubMed]
- Hayakawa, K.; Tang, N.; Matsuki, A.; Inomata, Y.; Toriba, A.; Nagato, E.G. Calculating source contributions to urban atmospheric polycyclic aromatic hydrocarbons and nitropolycyclic aromatic hydrocarbons using 1-nitropyrene and pyrene: An application to an Asian dust event. Chemosphere 2021, 280, 130662. [Google Scholar] [CrossRef] [PubMed]
- Hayakawa, K.; Tang, N.; Toriba, A. Long-term and seasonal changes in sources of urban atmospheric particulates in the western Pacific. Appl. Sci. 2022, 12, 2149. [Google Scholar] [CrossRef]
- Wise, S.A.; Phinney, K.W.; Sander, L.C.; Schantz, M.M. Review: Role of chromatography in the development of standard reference materials for organic analysis. J. Chromatogr. A 2012, 1261, 3–22. [Google Scholar] [CrossRef] [PubMed]
- Hayakawa, K.; Murahashi, T.; Butoh, M.; Miyazaki, M. Determination of 1,3-, 1,6-, and 1,8-dinitropyrenes and 1-nitropyrene in urban air by high-performance liquid chromatography using chemiluminescence detection. Environ. Sci. Technol. 1995, 29, 928–932. [Google Scholar] [CrossRef] [PubMed]
- Tang, N.; Taga, R.; Hattori, T.; Toriba, A.; Kizu, R.; Hayakawa, K. Simultaneous determination of twentyone mutagenic nitropolycyclic aromatic hydrocarbons by high-performance liquid chromatography with chemiluminescence detection. In: Tsuji A et. al. (eds) Proceedings of the 13th international symposium, bioluminescence and chemiluminescence progress and perspective. World Science, London 2005, 441–444. [Google Scholar] [CrossRef]
- Hayakawa, K.; Tang, N.; Xing, W.; Oanh, P.K.; Hara, A.; Nakamura, H. Concentrations and sources of atmospheric PM, polycyclic aromatic hydrocarbons and nitropolycyclic aromatic hydrocarbons in Kanazawa, Japan. Atmosphere 2021, 12, 256. [Google Scholar] [CrossRef]
- Yang, L.; Zhang, X.; Xing, W.; Zhou, Q.; Zhang, L.; Wu, Q.; Zhou, Z.; Chen, R.; Toriba, A.; Hayakawa, K.; et al. Yearly variation in characteristics and health risk of polycyclic aromatic hydrocarbons and nitro-PAHs in urban shanghai from 2010–2018. J. Environ. Sci. 2021, 99, 72–79. [Google Scholar] [CrossRef] [PubMed]
- Zhang, L.; Yang, L.; Kashiwakura, K.; Zhao, L.; Chen, L.; Han, C.; Nagao, S.; Tang, N. Autumn and spring observations of PM2.5-bound polycyclic aromatic hydrocarbons and nitro-polycyclic aromatic hydrocarbons in China and Japan. Environ. Pollut. 2024, 343, 123139. [Google Scholar] [CrossRef] [PubMed]
- Zajemska, M.; Poskart, A.; Musial, D. The kinetics of nitrogen oxides formation in the flame gas. Econ. Environ. Stud. 2015, 15, 445–460. Available online: https://www.econstor.eu/bitstream/10419/178898/1/ees_15_4_08.pdf.
- Hayakawa, K. Review: Recent research progress on nitropolycyclic aromatic hydrocarbons in outdoor and indoor environments. Appl. Sci. 2022, 12, 11259. [Google Scholar] [CrossRef]
- Miller-Schulze, J.P.; Paulsen, M.; Kameda, T.; Toriba, A.; Hayakawa, K.; Cassidy, B.; Naeher, L.; Villalobos, M.A.; Simpson, C.D. Nitro-PAH exposures of occupationally-exposed traffic workers and associated urinary 1-nitropyrene metabolite concentrations. J. Environ. Sci. 2016, 49, 213–221. [Google Scholar] [CrossRef] [PubMed]
- Ministry of Health, Labore and Welfare (MHLW) (2022), Japan. Available online: Demographic statistics. Available online: https://www.mhlw.go.jp/toukei/saikin/hw/jinkou/geppo/nengai03/index.html (accessed on 2 April 2024).
- Hama, H.; Tokuda, T.; Izaki, A.; Ohno, T.; Watanabe, Y.; Kanda, T.; Tang, N.; Kameda, T.; Toriba, A.; Hayakawa, K. Variation in polycyclic aromatic hydrocarbons and nitropolycyclic aromatic hydrocarbons in airborne particulates collected in urban Kanazawa, Japan, in last 12 years. J. Jpn. Soc. Atmos. Environ. 2012, 47, 1–8. [Google Scholar] [CrossRef]
- Yasuhiro, M. District heating in China and Japan: What both sides should learn. Dist. Heat. Coolong 2018, 119, 18–23. Available online: https://www.dhcjp.or.jp/cms_admin/wp-content/uploads/2018/03/119.pdf (accessed on 3 March 2024).
Figure 1.
Atmospheric Concentrations of Pyr and 1-NP and Their Sources in Kanazawa. (A) Pyr concentration, (B) 1-NP concentration, (C) Sources of Pyr, (D) Sources of 1-NP. S, summer; W, winter.
Figure 1.
Atmospheric Concentrations of Pyr and 1-NP and Their Sources in Kanazawa. (A) Pyr concentration, (B) 1-NP concentration, (C) Sources of Pyr, (D) Sources of 1-NP. S, summer; W, winter.
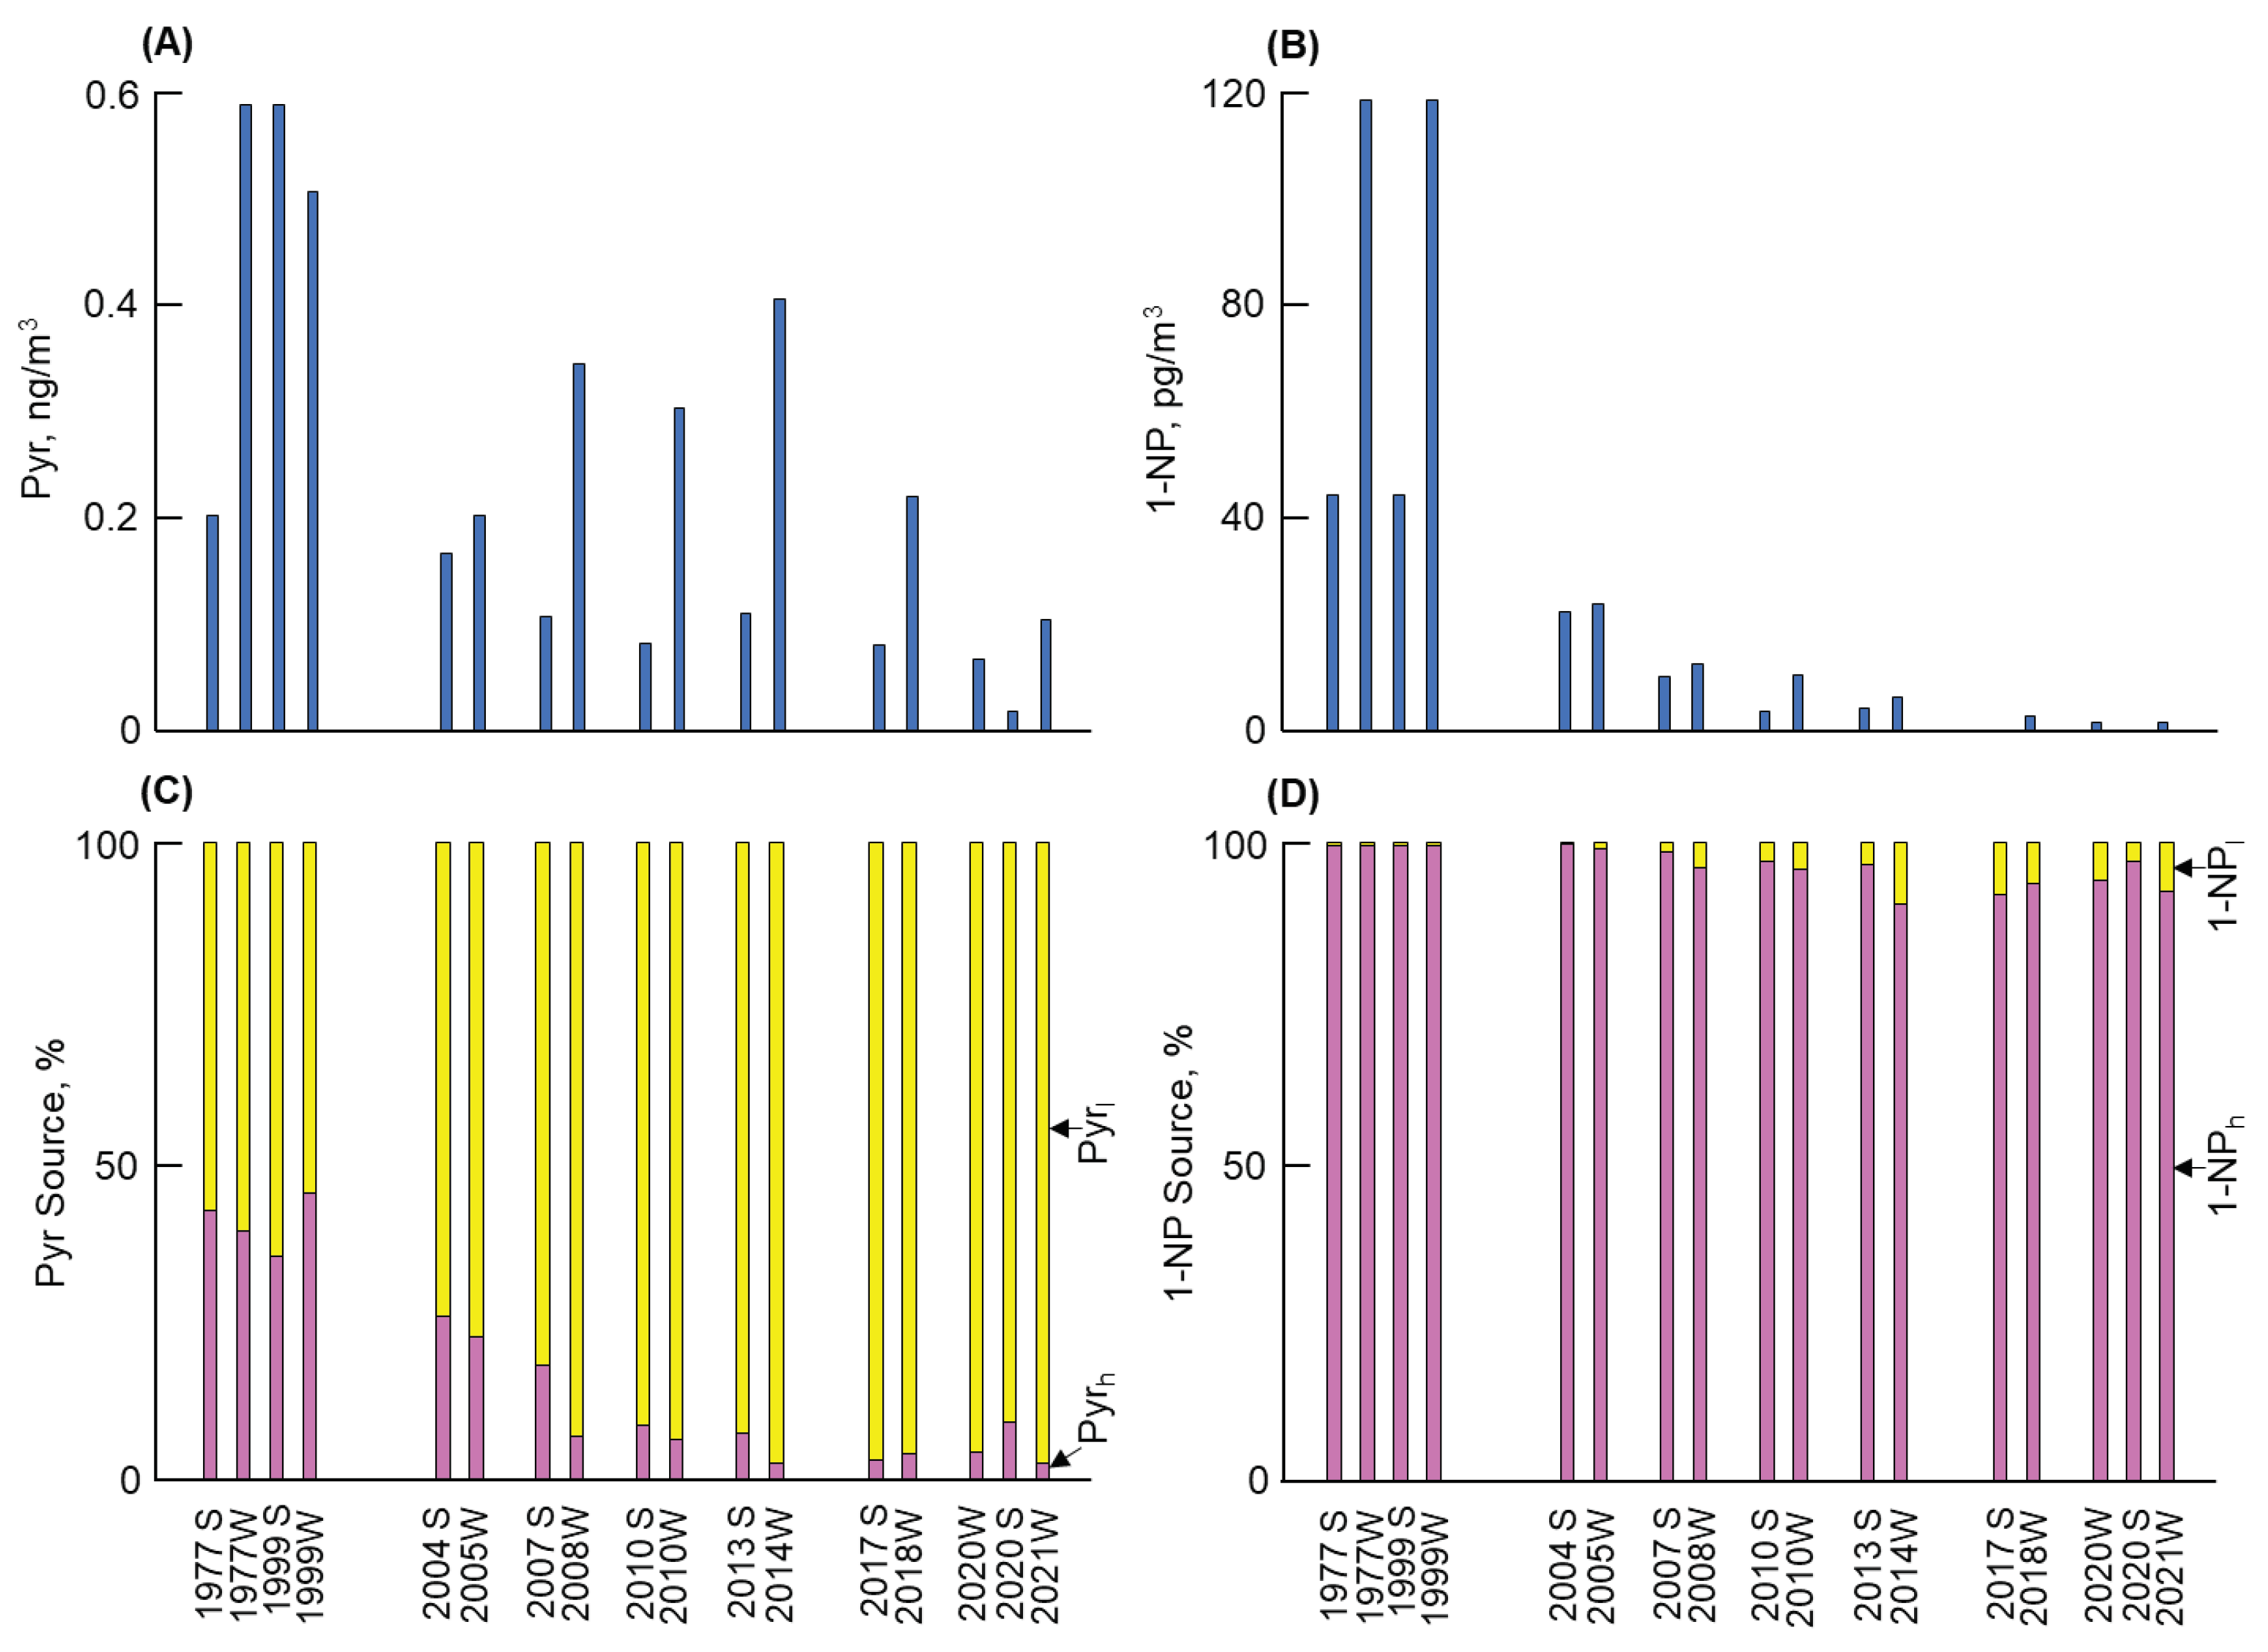
Figure 2.
Atmospheric Concentrations of Pyr and 1-NP and Their Sources in Kitakyushu. (A) Pyr concentration, (B) 1-NP concentration, (C) Sources of Pyr, (D) Sources of 1-NP. S and W, the same as in Fig. 1.
Figure 2.
Atmospheric Concentrations of Pyr and 1-NP and Their Sources in Kitakyushu. (A) Pyr concentration, (B) 1-NP concentration, (C) Sources of Pyr, (D) Sources of 1-NP. S and W, the same as in Fig. 1.
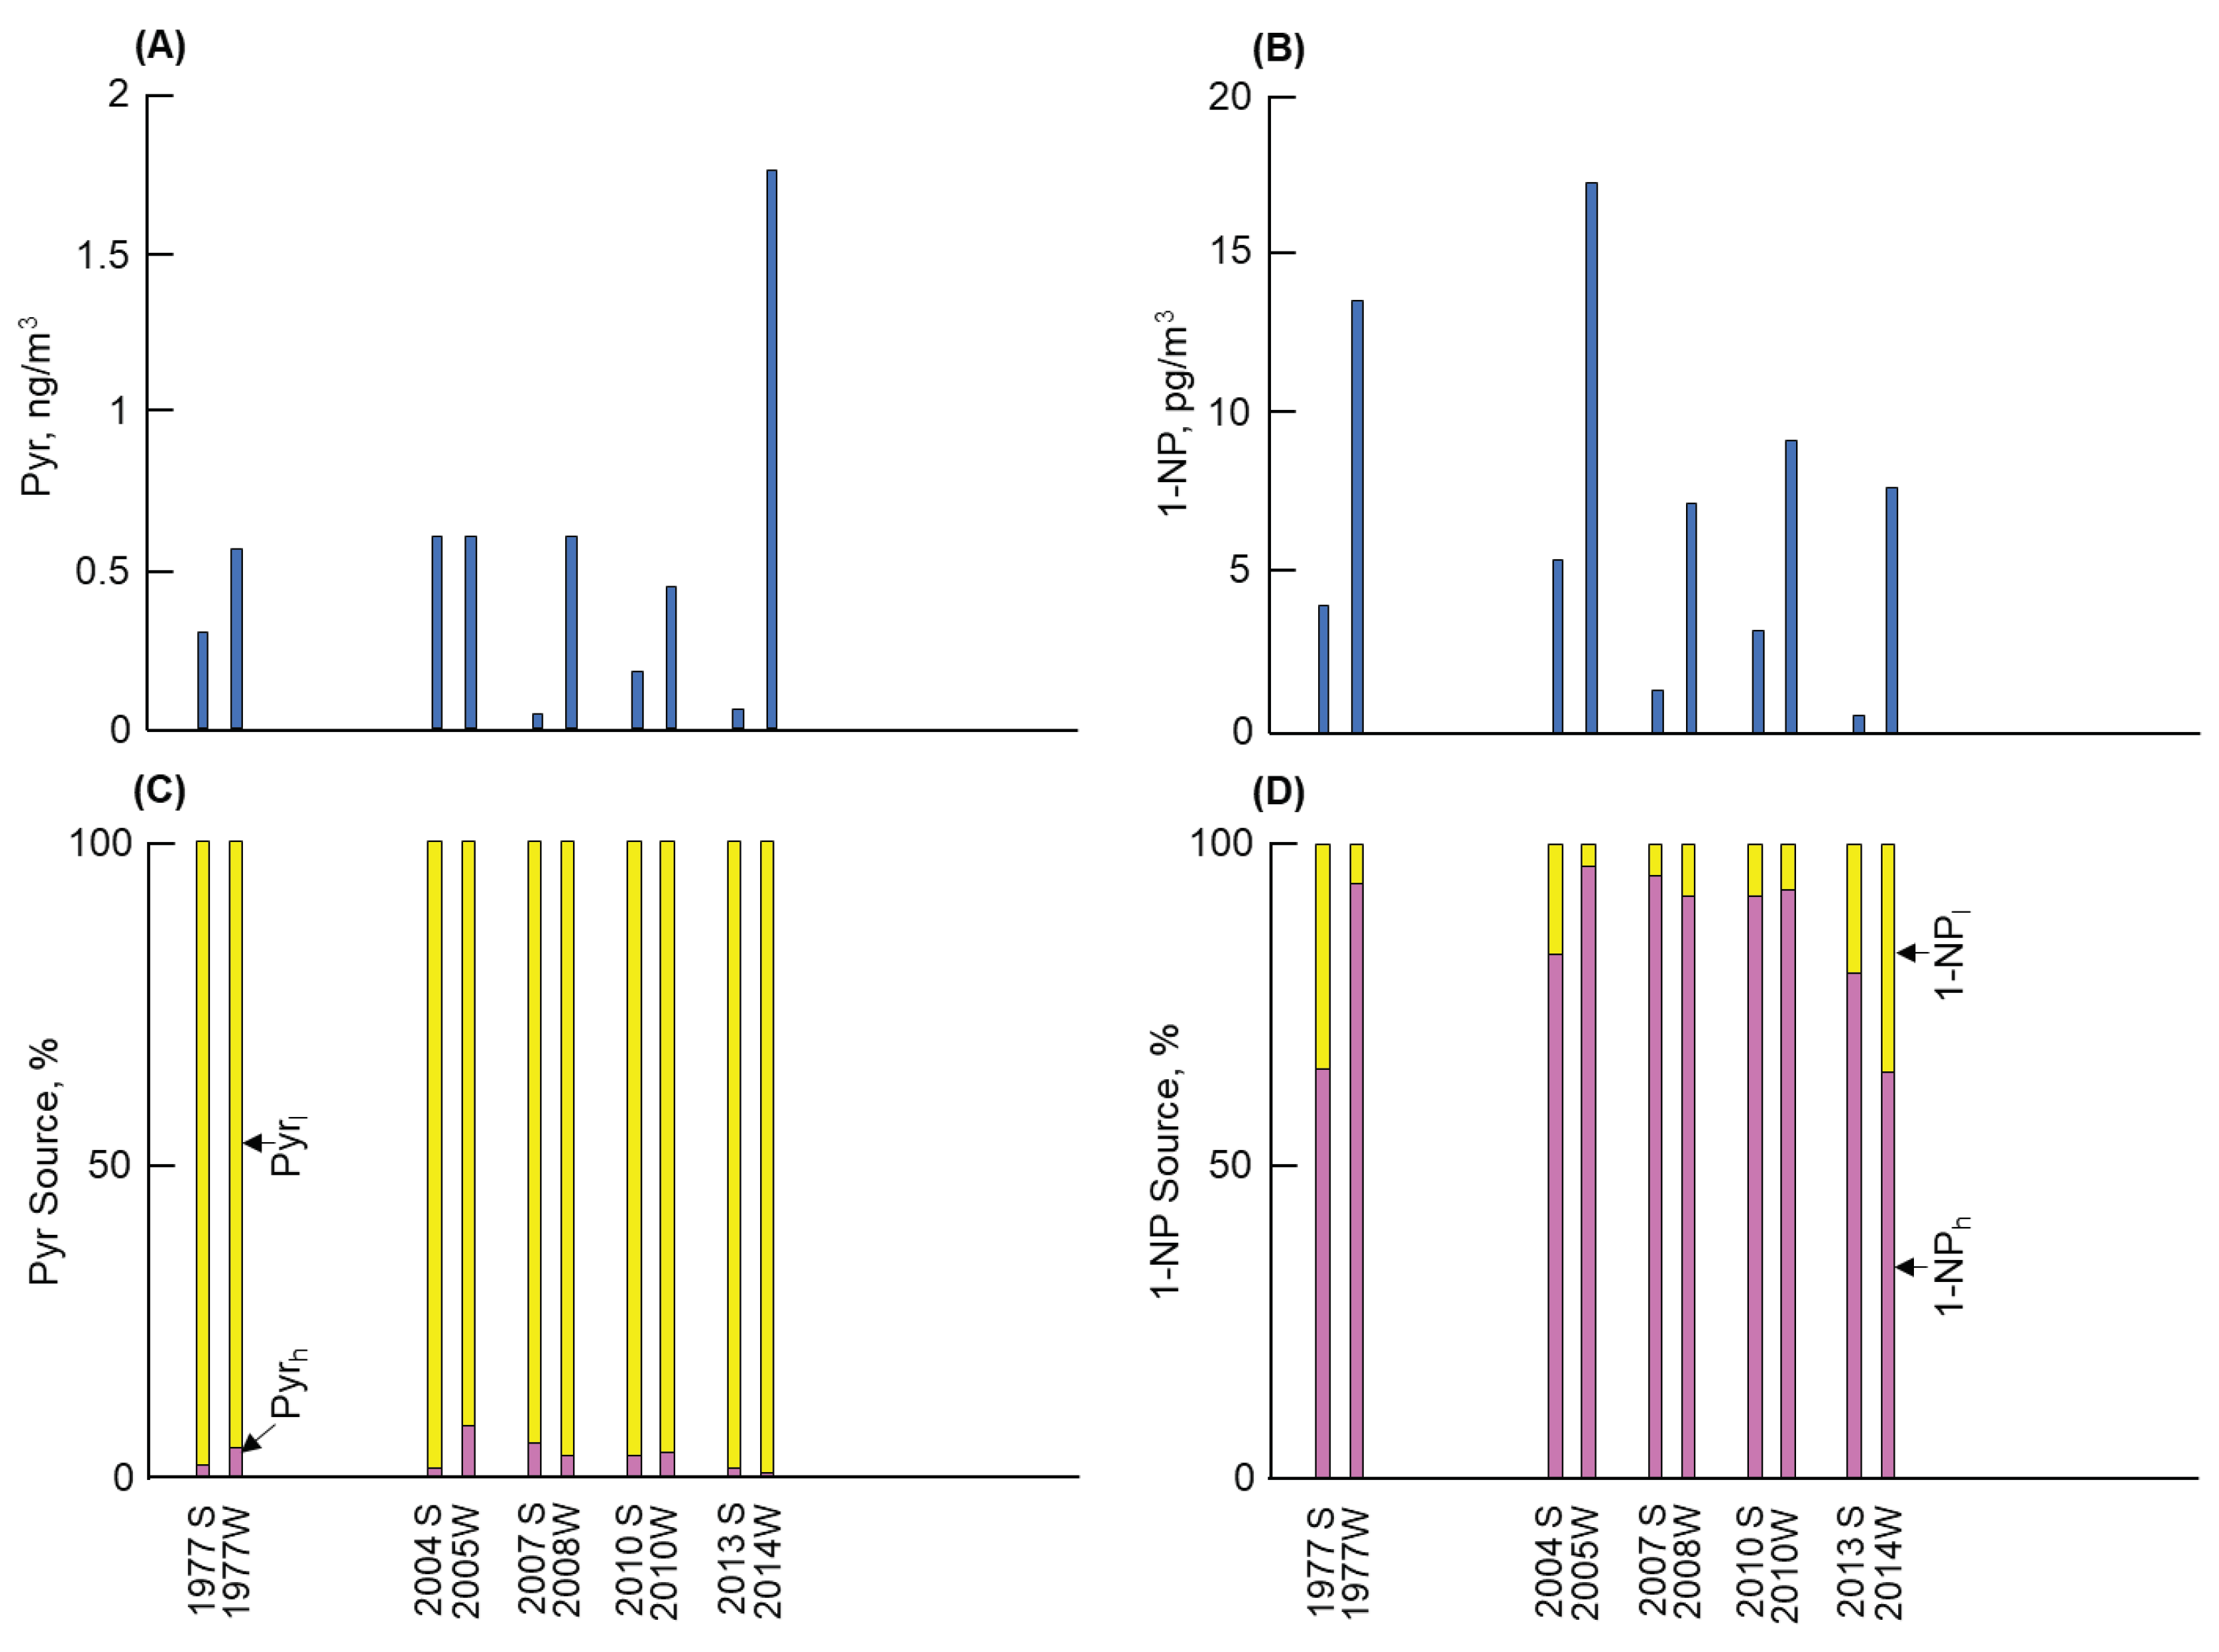
Figure 3.
Atmospheric Concentrations of Pyr and 1-NP and Their Sources in Shenyang. (A) Pyr concentration, (B) 1-NP concentration, (C) Sources of Pyr, (D) Sources of 1-NP. S, summer; W, winter; A, autumn, Sp, spring.
Figure 3.
Atmospheric Concentrations of Pyr and 1-NP and Their Sources in Shenyang. (A) Pyr concentration, (B) 1-NP concentration, (C) Sources of Pyr, (D) Sources of 1-NP. S, summer; W, winter; A, autumn, Sp, spring.
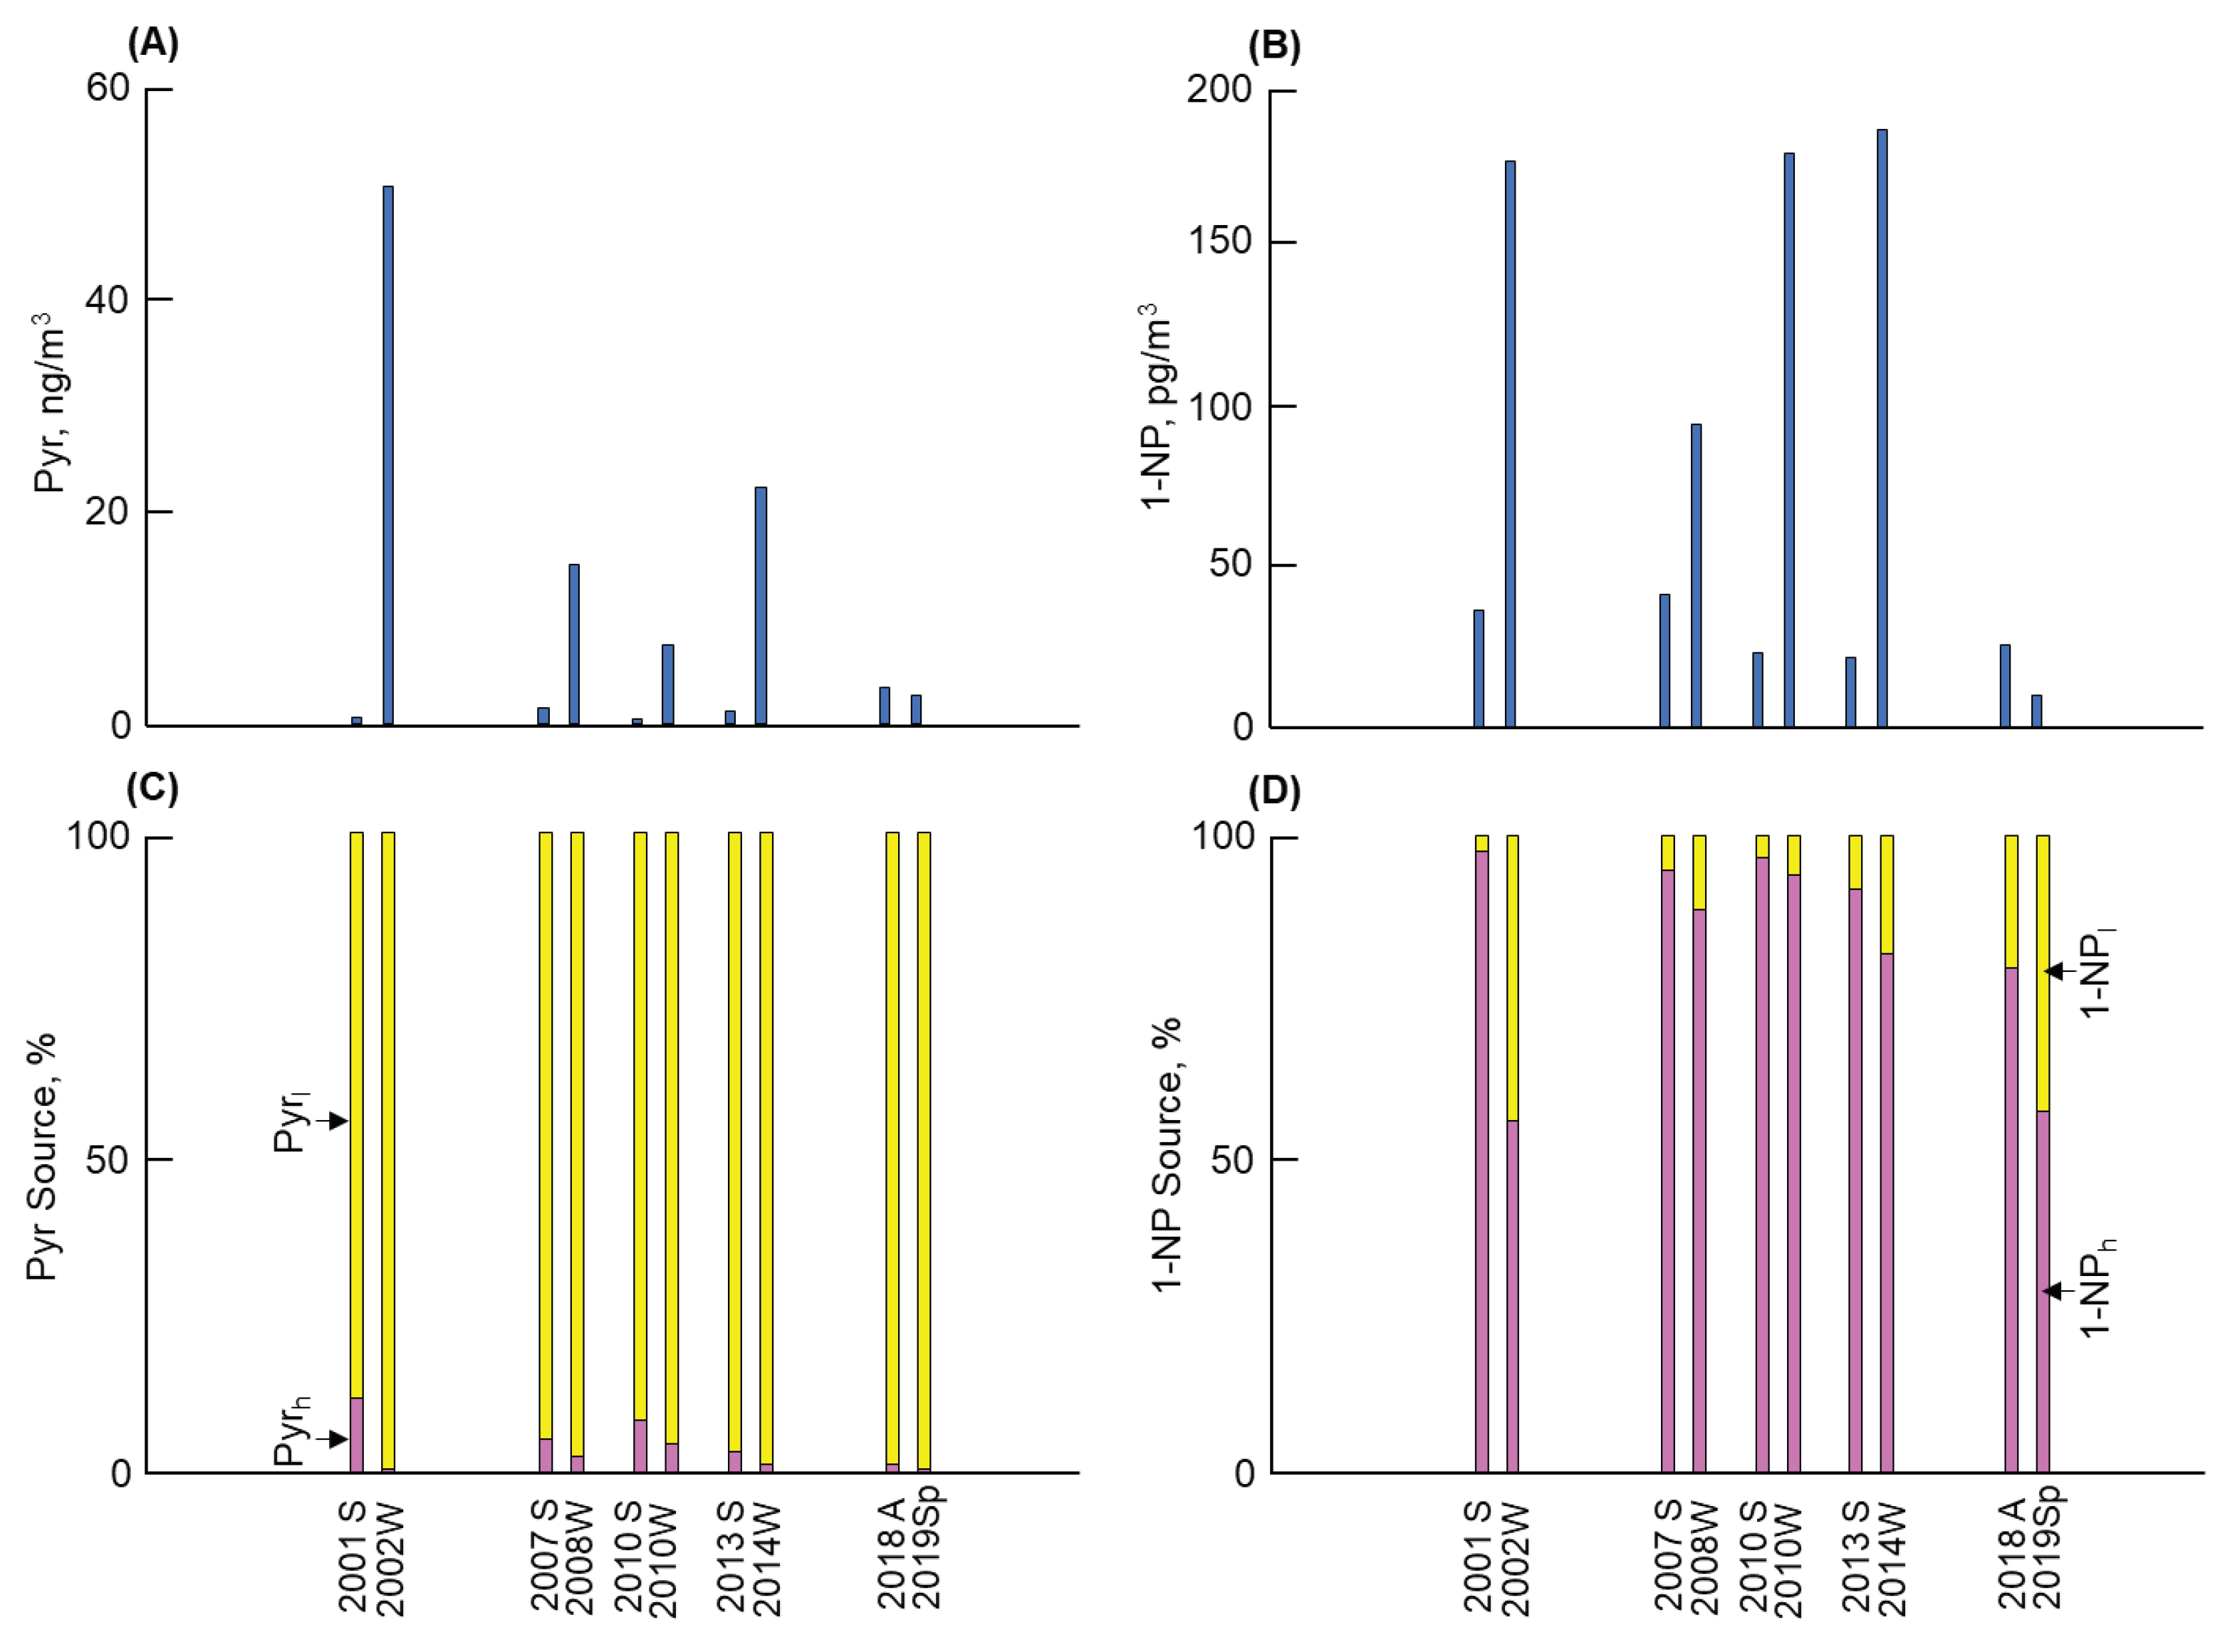
Figure 4.
Atmospheric Concentrations of Pyr and 1-NP and Their Sources in Shanghai. (A) Pyr concentration, (B) 1-NP concentration, (C) Sources of Pyr, (D) Sources of 1-NP. S and W, the same as in Fig. 1.
Figure 4.
Atmospheric Concentrations of Pyr and 1-NP and Their Sources in Shanghai. (A) Pyr concentration, (B) 1-NP concentration, (C) Sources of Pyr, (D) Sources of 1-NP. S and W, the same as in Fig. 1.
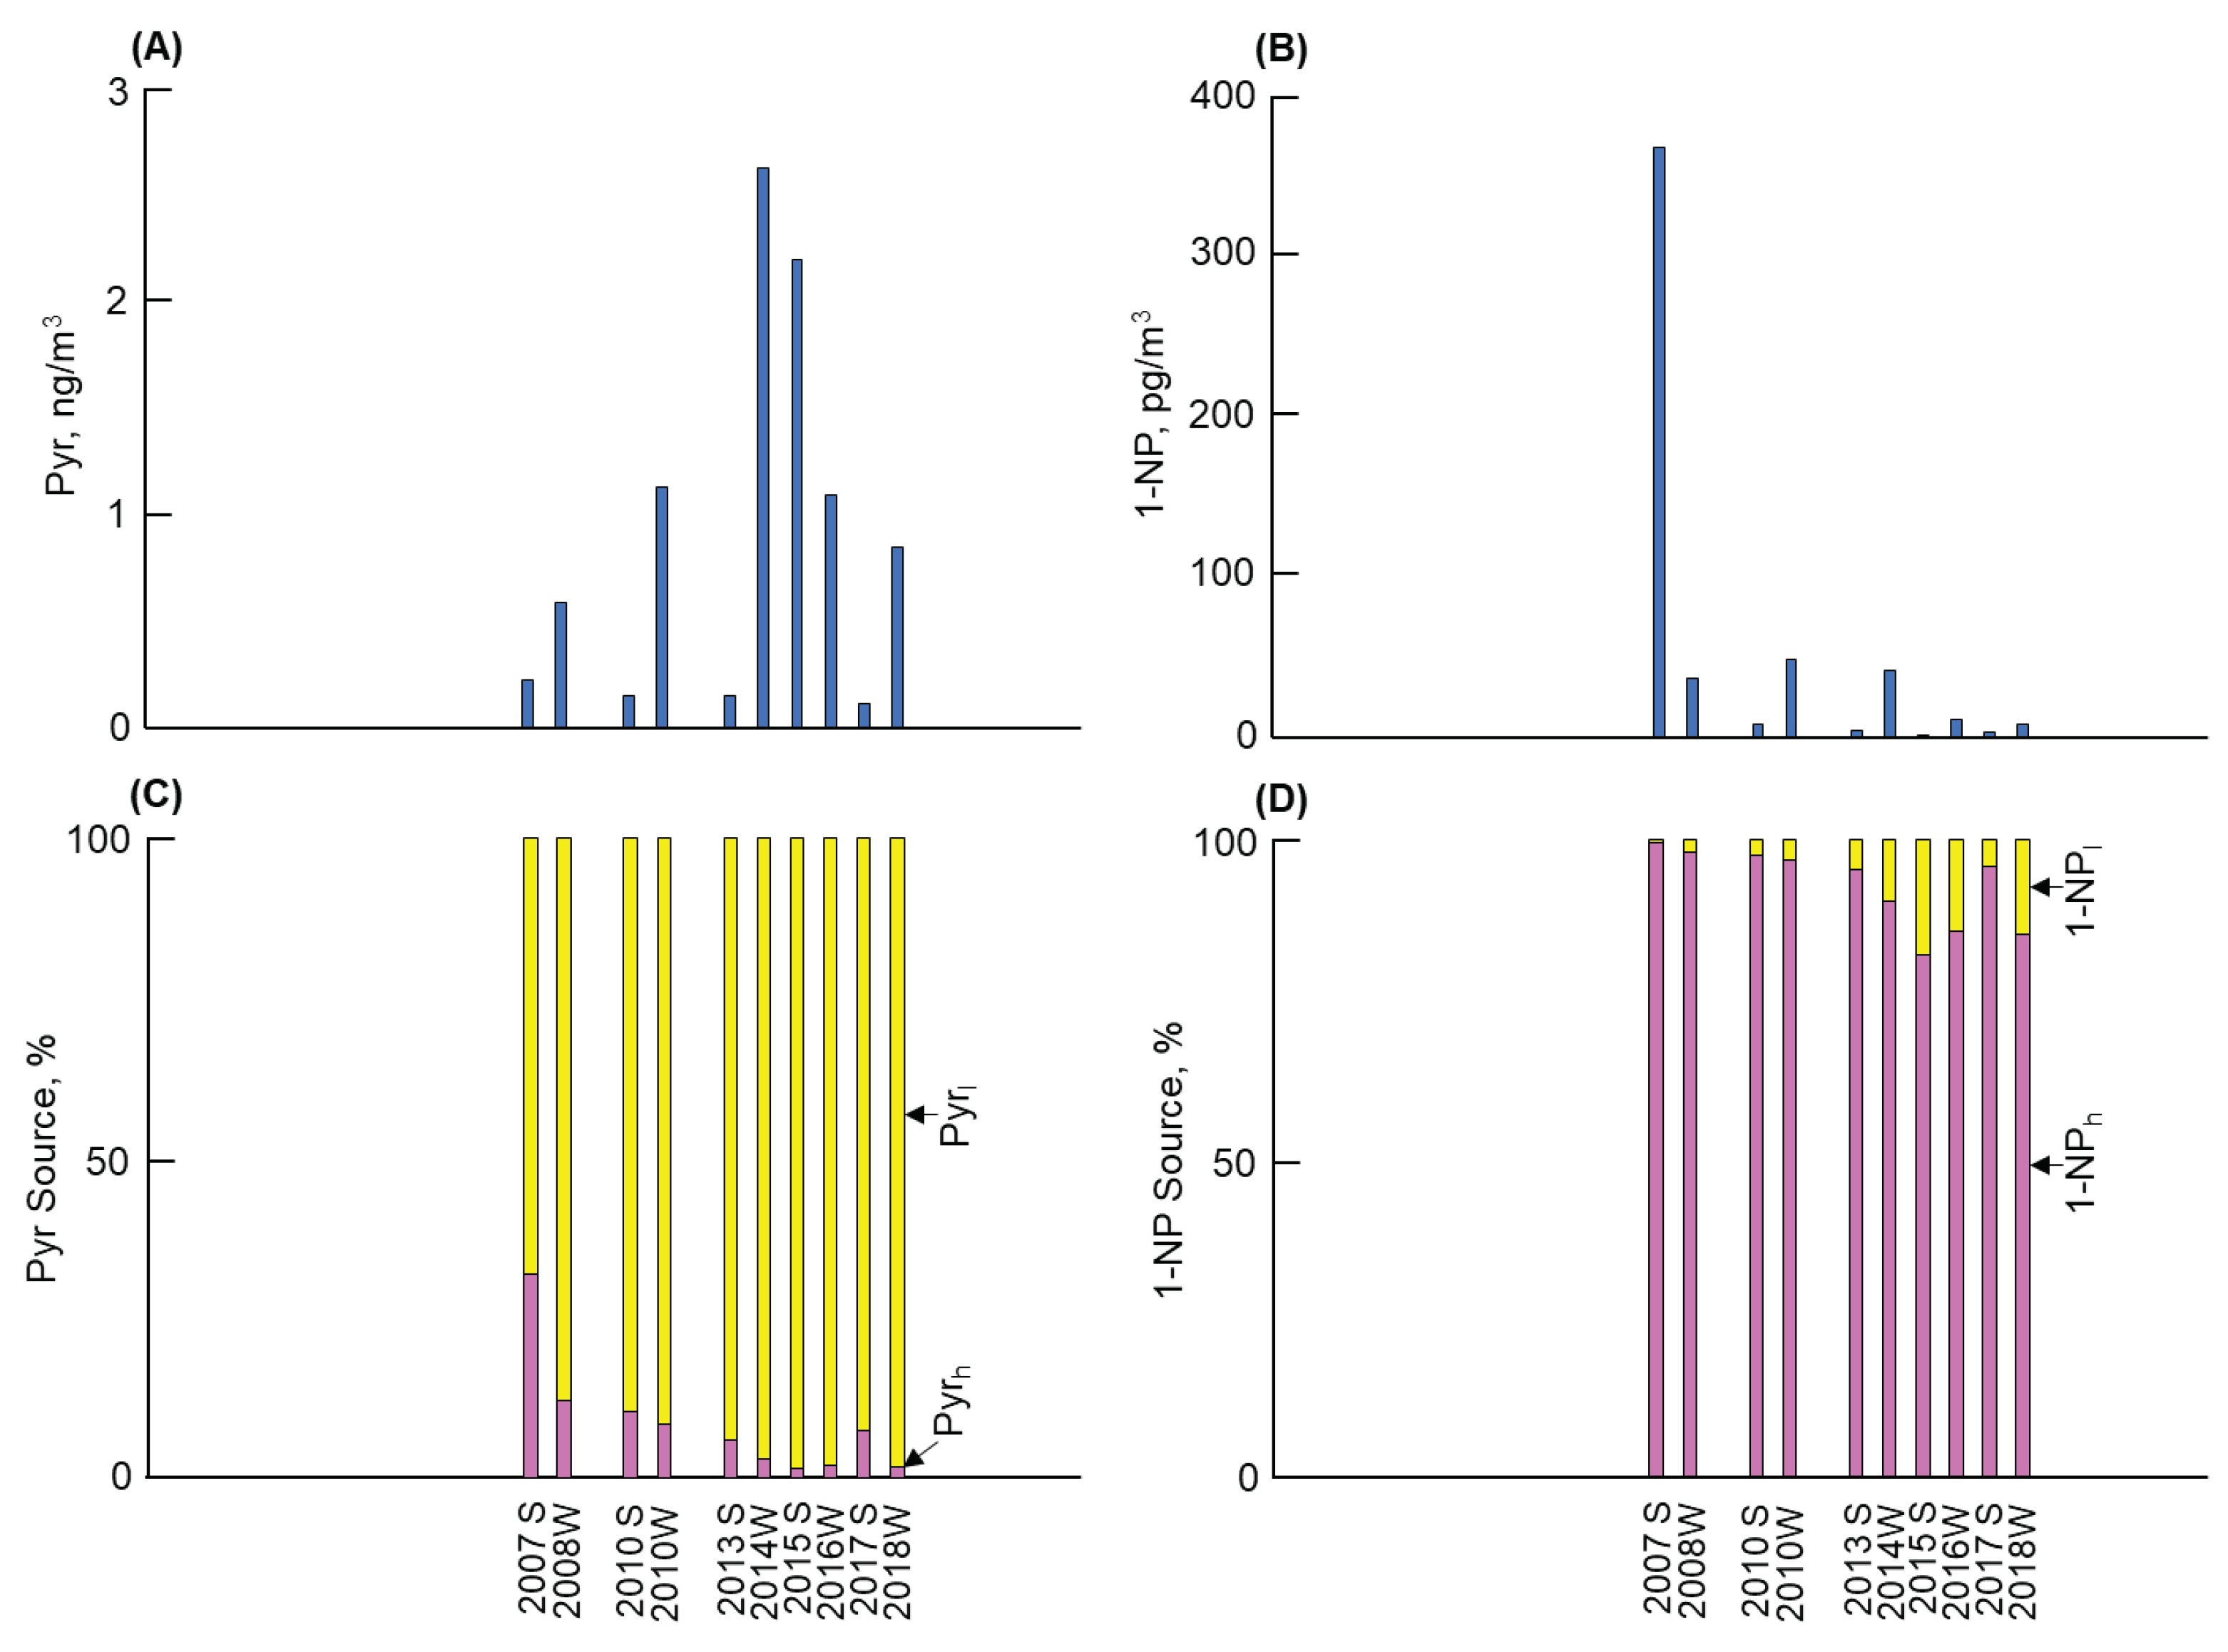
Table 2.
Comparison of mean annual concentrations of Pyr and Pyrh before and after 2010 in four cities.
Table 2.
Comparison of mean annual concentrations of Pyr and Pyrh before and after 2010 in four cities.
| City | Pyr | Pyrh | Pyrh/Pyr | |||||||
| ≤2008 pg/m3 |
(d) ≥2010 pg/m3 |
d/c | (e) ≤2008 pg/m3 | ≥2010 pg/m3 | f/e | ≤2008 % |
≥2010 % |
|||
| Kanazawa | 338 ± 197 | 154 ± 128 | 0.46 | 119 ± 88 | 7.4 ± 7.3 | 0.06 | 35 | 5 | ||
| Kitakyushu | 456 ± 234 | 611 ± 783 | 1.3 | 18 ± 17 | 8.0 ± 6.3 | 0.44 | 4 | 1 | ||
| Shenyang | 16,900 ± 23,400 | 7430 ± 8600 | 0.44 | 173 ± 129 | 193 ± 118 | 1.1 | 1 | 3 | ||
| Shanghai | 405 | 1040 ± 950 | 2.6 | 71 | 33 ± 32 | 0.46 | 18 | 3 | ||
Monitoring periods are the same as in Table 1.
Table 3.
Comparison of summer and winter concentrations of Pyr and Pyrl in four cities.
| City | Pyr | Pyrl | |||||
| S, pg/m3 | W, pg/m3 | W/S | S, pg/m3 | W, pg/m3 | W/S | ||
| Kanazawa | 169 ± 178 | 304 ± 176 | 1.8 | 122 ± 110 | 240 ± 115 | 2.0 | |
| Kitakyushu | 239 ± 231 | 797 ± 542 | 3.3 | 234 ± 228 | 774 ± 550 | 3.3 | |
| Shenyang | 971 ± 473 | 2380 ± 1880 | 25 | 913 ± 468 | 2360 ± 1880 | 26 | |
| Shanghai | 567 ± 914 | 1260 ± 797 | 2.2 | 540 ± 911 | 1200 ± 787 | 2.2 | |
W and S denote winter and summer, respectively. Monitoring periods are the same as in Table 1.
Table 4.
Comparison of annual concentrations of 1-NP and 1-NPl before and after 2010 in four cities.
Table 4.
Comparison of annual concentrations of 1-NP and 1-NPl before and after 2010 in four cities.
| City | 1-NP | 1-NPl | 1-NPl/1-NP | |||||||
| (c) ≤2008 pg/m3 |
≥2010 pg/m3 |
d/c | ≤2008 pg/m3 |
≥2010 pg/m3 |
f/e | ≤2008 % |
≥2010 % |
|||
| Kanazawa | 55 ± 45 | 4.5 ± 3.2 | 0.08 | 0.29 ± 0.21 | 0.24 ± 0.19 | 0.83 | 1 | 5 | ||
| Kitakyushu | 8.3 ± 6.1 | 5.2 ± 4.0 | 0.63 | 0.76 ± 0.42 | 0.98 ± 1.24 | 1.3 | 9 | 19 | ||
| Shenyang | 88 ± 66 | 85 ± 90 | 0.97 | 24 ± 38 | 12 ± 14 | 0.50 | 27 | 14 | ||
| Shanghai | 16 ± 18 | 1.2 ± 1.3 | 8 | |||||||
Monitoring periods are the same as in Table 1.
Table 5.
Comparison of summer and winter concentrations of 1-NP and 1-NPl in four cities.
| City | 1-NP | 1-NPl | |||||
| S, pg/m3 | W, pg/m3 | W/S | S, pg/m3 | W, pg/m3 | W/S | ||
| Kanazawa | 22 ± 39 | 33 ± 49 | 1.5 | 0.13 ± 0.08 | 0.36 ± 0.21 | 2.8 | |
| Kitakyushu | 2.9 ± 2.0 | 11 ± 4.3 | 3.8 | 0.6 ± 0.6 | 1.1 ± 1.0 | 2.0 | |
| Shenyang | 31 ± 9.8 | 161 ± 44 | 5.1 | 1.5 ± 0.7 | 34 ± 32 | 23 | |
| Shanghai | 4.8 ± 2.7 | 30 ± 18 | 6.2 | 0.23 ± 0.05 | 1.9 ± 1.3 | 8.3 | |
W and S denote winter and summer, respectively. Monitoring periods are the same as in Table 1.
Disclaimer/Publisher’s Note: The statements, opinions and data contained in all publications are solely those of the individual author(s) and contributor(s) and not of MDPI and/or the editor(s). MDPI and/or the editor(s) disclaim responsibility for any injury to people or property resulting from any ideas, methods, instructions or products referred to in the content. |
© 2024 by the authors. Licensee MDPI, Basel, Switzerland. This article is an open access article distributed under the terms and conditions of the Creative Commons Attribution (CC BY) license (http://creativecommons.org/licenses/by/4.0/).
Copyright: This open access article is published under a Creative Commons CC BY 4.0 license, which permit the free download, distribution, and reuse, provided that the author and preprint are cited in any reuse.


