Submitted:
07 April 2024
Posted:
08 April 2024
You are already at the latest version
Abstract
Improper sitting positions are known as the primary reason for back pain and the emergence of musculoskeletal disorders (MSD) among individuals who spend prolonged time working with computer screens, keyboards, and mice. At the same time, it is well understood that automated technological tools can play an important role in the process of unhealthy habit alteration, so plenty of research efforts are focused on research and technology development (RTD) activities that aim to provide support to the prevention of back pain or the development of MSD. Here, we report on creating a new resource in support of RTD activities aiming at the automated detection of improper sitting positions. It consists of multimodal multisensory recordings of 100 persons made with a video recorder, camera, and wrist-attached sensors that capture physiological signals (PPG, EDA, Skin temperature), as well as motion sensors (three-axis accelerometer). Our multimodal multisensory dataset (MMD-MSD) opens new opportunities for modeling the body stance (sitting posture and movements), physiological state (stress level, attention, emotional arousal, valence), and performance (success rate on the Stroop test) of people working with a computer. Finally, we demonstrate two use cases: improper neck posture detection from pictures and cognitive load detection from physiological signals.
Keywords:
multimodal dataset
; musculoskeletal disorders prevention
; computer-oriented working environment
; performance evaluation
; Stroop test
; PPG
; EDA
; skin temperature
; pictures
; video
; three-axis accelerometer
1. Introduction
Back pain and musculoskeletal disorders (MSD) bear well-understood social significance because they influence people's productivity and quality of life [1,2]. In numerous studies, it has been reported that back pain and the emergence of MSD often occur among individuals who spend prolonged time working with computer screens, keyboards, and mice. The primary reason for MSD, chronic back or neck pain, as well as other chronic pain conditions, is improper sitting positions for prolonged hours. The improper sitting positions are most often due to the non-ergonomic environment set by the old-fashioned paradigm, which forces computer users to adapt to ad-hoc computer tables/desks at home or in the office [3,4]. Even well-informed computer users and professional software developers who are working in an ergonomic environment (including office chairs, desks, keyboards, mice, etc.) tend to complain of body pain, most often due to the prolonged hours in front of the computer and the inevitable deviations from the proper sitting posture caused by the accumulation of fatigue or relaxing of muscles due to intense focusing on work tasks [4,5].
In recent years, plenty of research efforts have focused on research and innovation activities that aim to provide technological support for the prevention of back and neck pain or the development of MSD. These studies have demonstrated that despite some well-understood shortcomings, technological tools can play an important role in the process of unhealthy habit alteration, including MSD prevention through smartphone-based applications or other specialized technology [6,7,8]. The development of automated technology based on machine learning methods typically requires the availability of resources, such as large datasets or recordings, images, or other sensor readings, which are needed for the training and fine-tuning of models. The development of detectors of specific conditions of interest depends on the availability of annotated datasets. This requires that some portions of the available data must be annotated by highly qualified professionals with extensive domain knowledge about the specific condition of interest, which is a tedious and costly process. To this end, various resources have been created including datasets made with cameras [9,10,11,12,13,14,15], wearable motion capture sensors [16,17,18,19], Kinect devices [13,20,21,22,23], etc. These and other resources were developed with one or a few types of sensors and were focused on specific technologies or applications. These resources typically focus on providing data for the development of a specific technological tool or validation of a newly proposed method in a specific setup.
Our primary motivation for developing MMD-MSD was to provide a resource that would enable research of a wider scope and a multifaced study of neck pain and back pain issues frequently developed by computer users. Besides the long-term effects of pain and MSD, we intended to investigate whether proper sitting posture would have any short-term effects on performance. Thus, MMD-MSD was conceived as a multimodal multisensory dataset that offers the unique opportunity to study simultaneously the physiological and psychological aspects of human-computer interaction in the most general setup for computer users. This includes proper and typical sitting and standing positions, with and without a sitting pillow, the performance (success rate) on simple tasks requiring close attention, and typical behaviors while working within a typical computer setup.
The rest of this article is organized as follows. In the section Method, we outline the dataset collection setup, protocol, data types, and tagging, along with the dataset structure and file formats. In Section Results, we report baseline detection results which demonstrate two use cases of the MMD-MSD dataset. Finally, we conclude this article with a summary and conclusions.
2. Materials and Methods
MMD-MSD was designed and collected for the needs of the ErgoResearch project, which among other goals aimed at the creation of resources (datasets, software, models) in support of research and technology development (RTD) that helps for the prevention of MSD. The data collection was based on photogrammetry as it provides a nonintrusive way to assess the human body posture in various scenarios and a wearable wristband for the acquisition of peripheral physiological signals.
The focus of the MMD-MSD data collection process aimed at implementing an experimental setup and scenarios, which allow for assessing the performance of a person while working in a typical office scenario. This involves a person sitting on an office chair next to an office desk equipped with a desktop computer configuration with standard interface devices, such as a monitor, keyboard, and mouse. The dataset comprises scenarios involving people sitting in a spontaneous posture, the one that a sitting person takes naturally while concentrating on computer-bound tasks, in contrast to the scenario when the body position is manually adjusted by a medical doctor, who specialized in the field of MSD rehabilitation, to sitting in the recommended ergonomic health-friendly posture. Besides, each participant was instructed on how to keep a proper ergonomic posture while working with the specific desktop computer configuration. For capturing the person-specific body structure, the dataset also registered spontaneous and corrected standing positions, which were adjusted with the help of a physiotherapist in enface and profile perspectives.
To elicit spontaneous sitting positions, we engaged the volunteers in various computer-based tasks, starting with filling in a questionnaire, resolving the Stroop test, as well as with a discussion about their experiences during the data collection process. Here, we made use of the Stroop test as a low-complexity mental task, which does not induce a high cognitive load but requires concentration and attention. In the Stroop tests, we started with a low-complexity stimulus and subsequently alternated episodes with lower and higher difficulty to motivate higher attention of the volunteers.
Each participant implemented the Stroop test twice -- when the person was sitting on an office chair without and with an air-cushion sitting disk placed on the chair. The sitting disk requires the sitting person to maintain balance, which is feasible only when sitting in a proper working posture. Thus, here we consider the scenario when people were sitting on the air-cushioned disk as enforced to a proper sitting posture. We recorded each volunteer's performance on the Stoop test when sitting in spontaneous and manually corrected body positions.
Finally, here we ought to mention that for the selected set of 100 volunteers involved in the database creation, who were mostly students and university staff, we deem that the observed differences in individual performance were primarily due to differences in their concentration and attention during the Stroop tests and shall not be interpreted as linked to their person-specific cognitive capacity.
In the following subsections, we outline the data collection setup, protocol, types of data and their tagging, and the dataset organization and file formats.
2.1. Data Collection Setup
The MMD-MSD data collection setup consists of a typical non-adjustable office desk with a chair, a desktop computer configuration with standard computer peripherals, and a wall grid. The office desk height is 73 cm, the chair height is 42 cm, and the 24’ monitor's bottom edge was set to 13 cm from the desk. During a major part of the data collection process, we considered a sitting person in a spontaneous working posture while using a 24’ monitor, a typical 89-button keyboard, and a right-handed 3-button computer mouse. An air-cushioned stability disk (The THERABAND Stability Disc) is used for forcing an active sitting position. Two cameras (Go Plus F800 1080P HD 30fps) were used to register images and overhead video recordings during the data collection campaign. An Empatica E4 wristband was used for the acquisition of peripheral physiological signals, such as BVP (Blood Volume Pulse), Electro-Dermal Activity (EDA), and Skin Temperature (ST), as well as three-axis accelerometer data. These physiological signals have different dynamics and were registered with different sampling rates (Table 1).
A purposely created software tool implemented the stimulus generation and kept logs of the success rates during the color-to-text matching Stroop test [24]. Our Stoop test consisted of 20 questions divided equally into two groups – with low and with higher complexity. In the first group of questions, the font color matched the written word, and in the second group, the color differed from the color specified by the written word. Each participant chose the correct answer from among three possible answers. In a participant-specific log file, the responses and reaction time for each stimulus were recorded.
In Figure 1, we show the arrangement of equipment during the creation of MMD-MSD along with typical body postures registered during the subsequent steps of the data collection process.
A software environment was purposely developed for the recording of physiological signals and the temporal synchronization of all recording channels. The timestamp synchronization was implemented through the generation of specific markers that serve as reference points for the beginning and end of every episode during the data collection process. The team, that implemented the dataset collection and annotation, consisted of:
- a data collection supervisor, who welcomed and instructed the volunteers and guided them throughout the data collection process;
- an assistant with expertise in ergonomics, who designed and administrated the consensus forms and questionaries;
- a technical assistant, who ensured that the equipment was operational, assisted the participants with the equipment use, and also served as a photographer;
- a medical doctor with a specialty physiotherapist, who assisted in correcting the standing and sitting postures of participants during the data collection campaign;
- a senior medical doctor with habilitation in MSD prevention, who implemented the data annotation process.
2.2. Dataset Collection Protocol
The MMD-MSD dataset was recorded in a single 45-minute session per participant, with short breaks between the data collection episodes. The data collection protocol aimed at the acquisition of motion data, pictures, videos, and physiological signals. We used a common data acquisition workflow (cf. Figure 2) implemented for each of the 100 volunteers who were recruited as participants in the data collection campaign. None of the volunteers reported previous experience with an ergonomics-oriented data collection campaign and nobody had previous exposure to the Stroop test.
Each participant was admitted individually to the premises of the laboratory accompanied only by the team specified above, which is directly involved in implementing the data collection process. The access to the laboratory by other people was restricted to lower the degree of discomfort and distraction during the data acquisition.
Timestamp synchronization between all recording channels was implemented through a universal marker event, which was generated by the software tool at the beginning and the end of each data collection step. As shown in Figure 2, the data collection starts with a briefing about the data collection process, filling in a consent declaration, and the entry questionnaire. The questionnaire collected general demographic information about the volunteers, their activity/sport/sleep habits as well as self-reported pain issues, which were later used as self-assessment tags.
After the entry questionnaire, each participant was invited to stand next to the wall with grid wallpaper, and photographs were taken in spontaneous and corrected standing positions. Pictures were taken of each person standing en face (front-on view) and profile (left side view) (cf. Figure 1), including spontaneous and corrected posture. The spontaneous standing posture for each participant corresponds to the uncorrected comfortable position that the participant takes naturally, while the corrected ones refer to the positions after the professional physiotherapist manually adjusts the body posture of each person according to the established MSD prevention recommendations.
Next, the participant was asked to sit on an office chair next to the office desk with a computer configuration and perform several tasks using the computer. The technical assistant helps each participant to put on the Empatica E4 wristband. The recording sessions begin with a baseline recording and each participant is instructed on how to perform the Stroop test. This corresponds to the start of the core part of the data collection, beginning with the initial baseline recording of physiological signals and finishing with the end of the second Stroop test. These data collection steps were registered from an overhead perspective using a video camera. The video recordings capture each participant's positions and sitting behavior during the implementation of the assigned computer-bound tasks.
All participants in the experiment were asked to solve the Stroop test twice – sitting on a chair in their usual comfortable work posture and sitting on a stability disc placed on the chair. When performing the Stroop Test #1, each participant is sitting in an office chair in their usual working position with a computer. While working on the Stroop Test #1 assignment, a picture of the spontaneous sitting posture is taken from the perspective of the left profile. At some time, the medical doctor corrects the sitting position of the participant to correspond to the ergonomic body position and then another picture of the corrected sitting posture (i.e. condition “corrected”) is taken.
When performing the Stroop Test #2, the participant is sitting on the stability disk placed on the chair, which forces active sitting and helps to maintain the ergonomic body posture. While working on the Stroop Test #2, another picture of the participant is taken from the perspective of the left profile.
After the Stoop Test#2, we proceed with the recording of the second baseline recording of the physiological signals. At this stage, each participant shares experiences and observations during the experiment and answers questions about whether they feel any desk sitting-related pain in general.
2.3. Tagging of Signals and Pictures
The pictures of each of the 100 participants, standing and sitting in various positions were post-processed and tagged by two medical doctors, who have specialization in physiotherapy and have practiced this profession for more than 10 years. They manually placed body markers on the pictures at precisely specified locations on the human body, such as the head, neck, shoulder, thorax, and lower back (cf. Figure 3).
As shown in Figure 3, two markers were used for the en face position, and ten markers were used for the profile positions. The precise marker positions in standing and sitting body postures are specified in Table 2.
Based on the manually positioned body markers, we calculated various postural angles. These angles are useful for the postural assessment of the head, neck, shoulder, thorax, and lower back (cf. Figure 4) as well as in the analysis of the reasons for self-reported pain if reported in the entry questionnaire.
In Table 3 we summarize the postural angles of interest and their reference values. These measurements provide crucial insights into postural alignment and serve as benchmarks for evaluating ergonomic practices.
2.4. Dataset Organisation
The MMD-MSD dataset is organized into six main folders, which contain the raw data (physiological signals, pictures, videos), annotated data (pictures with markers, timestamps for the physiological recordings), and data descriptors (angles and features). The folder names correspond to the type of information they contain:
- Physiological_Signals_raw – with 100 subfolders, one folder per participant;
- Pictures_raw – pictures in .jpg SOOC (Straight Out Of Camera).
- Pictures_with_markers – either 10 or 2 posture-specific markers, manually placed;
- Video – overhead recorded videos;
- Angles – computed based on manually adjusted markers;
- Features – computed from the physiological signals PPG, EDA, ST.
Besides, the root folder also contains three files:
- QuestionnaryResponses.csv – responses of all 100 participants to the 29 questions of the MSD questionnaire. (Available at: http://isr.tu-varna.bg/ergo/index.php/resursi);
- StrooptestPerformance.csv – Stoop tests data, including participant ID; question number; task complexity (L-low; H-high); participant’s response; correct answer; reaction time (test1; test2);
- Dataset Description.docx – technical documentation of MMD-MSD.
Details about the file names and formats are available in Appendix A.
2.5. Participants - Demographic Information
The MMD-MSD dataset was collected with the help of 100 volunteer participants, among which 64 males and 36 females. The demographic information of these participants is summarized in Table 4. Most of the male participants were students and teaching assistants and few were technical staff. The mean age of males is 24.71±7.17 years, weight 82.32±17.06 kg, and height 177.5±8.3 centimeters. Approximately half of the female participants were students, and the others were teaching or administrative staff at the Technical University of Varna. The mean age of female participants is 34.53±14.03 years, a weight of 63.06±12.9 kg, and a height of 169.0±11.02 centimeters. As seen in the pictures, the non-adjustable office desk was not comfortable for the tallest and heaviest participants. The same holds for the shortest females.
2.6. Questionnaire Self-Reported Data
A summary of the self-reported information provided by the participants concerning their weekly frequency of sports activity and hours of computer use on a per-day basis is presented in Table 5 and Table 6. Two-thirds of the participants reported that they are engaged in some sports activities, and only one-third reported that they get involved in sports activities at most once per week or not at all. However, there are some differences in the sports activity of men (73.4% active) and women (55.6% active). As shown in Table 4, the distribution of hours spent working with computers is nearly uniform among the four selected categories for both male and female participants. The percentages concerning hours of computer use are nearly identical for men and women.
3. Results
We illustrate the complexity of the MMD-MSD dataset and show different research aspects related to working on computer-bound tasks through two baseline scenarios. These are related to computer-supported MSD detection or the performance evaluation of office workers using computers. In both cases, we consider person-independent automated detection scenarios.
The first one evaluates the fundamental concept of automated detection of proper versus improper body postures utilizing postural angles derived from the MMD-MSD picture set. The proper vs. improper posture models were developed using two categories of tags: those established by medical experts and those reflecting volunteers' self-reported levels of discomfort or pain in specific body regions based on the answers to questions 25 and 26 in the introductory questionnaire.
The second scenario evaluates the feasibility of automated detection of cognitive load induced by the Stroop tests against the baseline condition. The cognitive load induced by the Stroop test corresponds to low mental challenge. The active answering/conversation recorded during the initial baseline and the second baseline recordings is equivalent to effort for human-to-human communication while the person fills in questionaries or discusses her/his experience.
3.1. Detection of Improper Body Posture
The cranial vertebral angle (CVA) serves as a widely recognized measure for evaluating forward head posture (FHP). FHP is characterized by a CVA measurement below the threshold of 48°-50°. It is noteworthy that the degree of FHP severity escalates with a reduction in CVA. Hence, there exists an inverse relationship between FHP and CVA magnitude, indicating that FHP tends to increase as CVA diminishes. In our study, 84% of participants exhibited a CVA of less than 50° while engaged in computer work [25]. This posture imposes a strain on the neck muscles and skeletal structure, potentially leading to muscular imbalances attributable to uneven distribution of muscle load. This is why we consider it important and attempt to detect this condition based on the MMD-MSD dataset. Thus, in the following, we consider the task of improper head position detection (protracheal head posture) in a person-independent scenario, which is further reduced to a two-class classification problem -- proper vs improper head positions. Particularly, we seek the automated detection of improper head position based on the postural angles #3 and #4, which are derived from MMD-MSD pictures, while the volunteers are in their spontaneous sitting posture. We experimented with two scenarios:
- Experiment 1 (self-reported tags related to neck pain – question #25 with body area 2),
- Experiment 2 (tags defined by medical doctors),
and evaluated the applicability of three classifiers: Naïve Bayes, Decision tree C4.5, and Random Forest using 10-fold cross-validation.
In Table 7, we show the average classification accuracy obtained for the two different sets of tags. The best average classification accuracy of 80% (Experiment 2) was obtained with the Random Forest classifier. The observed lower accuracy for the self-reported tags (Experiment 1) can be explained by the fact that most of the participants were young people, with most of them actively involved in sports. Their bodies are fit, which partially compensates for the improper body position and does not immediately result in neck pain. The tags established by the medical doctors (Experiment 2) correspond to an improper neck posture that increases the risk of pain in the specific area, even if this pain is not felt chronically or reported yet.
For the other classifiers, namely Naïve Bayes and Decision Tree C4.5, we observed much lower detection accuracy in both scenarios. We deem that the lower classification accuracy of the Naïve Bayes classifier is primarily due to the high correlation and the significant redundancy of information carried by angles #3 and #4, which violates the feature independence assumption implicit in the Naïve Bayes classifier. The lower accuracy observed for the C4.5 decision tree can be explained by the loss of information forced by choosing either angle #3 or angle #4 as the top-level node. None of these angles is decisive and this limits the opportunity for making proper decisions at the second node if an error is made at the upper node.
3.2. Detection of Cognitive Activity
We considered a person-independent scenario for the detection of cognitive activity. Specifically, using the physiological signals available in the MMD-MSD dataset, we aim at the discrimination of task-specific mental workload. For that purpose, we used the elicited task-specific cognitive activity (Stroop Test #1 and Stroop Test #2) vs. the baseline active listening/answering while (a) the user was instructed and filled in the entry questionaries and (b) talked about the experiences during the Stroop tests with and without the sitting disk. In this scenario, the two-class classification is based on feature vectors with 39 dimensions computed from the peripheral physiological signals (PPG and EDA) [26] (Table 8).
The physiological recordings were split into model training data (90%) and test data (10%). Ten-fold cross-validation was assumed in all tests. In Table 9, we report comparative results for six well-known machine learning methods in terms of average classification accuracy for the 100 participants in the MMD-MSD dataset. We compared the averaged classification accuracy for the Generalized Linear Model, Naïve Bayes, Decision Tree C4.5, Support Vector Machine (SVM) with RBF kernel, Random Forest, and a Feed-Forward Neural Network classifier with four layers 33-50-50-2, where the first three layers consist of neurons with ReLU activation function, and the two output neurons have softmax activation function. The performance of each classifier was optimized via grid-search of the adjustable parameters, based only on the training data.
The relatively low recognition accuracy obtained for all classifiers can be explained by the high person-specific variability in the physiological parameters of the 100 participants. In Figure 5 we show the mean values of HRV in the four recording scenarios (Initial baseline, Stroop Test #1, Stroop Test #2, Baseline #2), which makes it difficult to model all data with a unified approach, and perhaps requires much more complex modeling methods and/or more discriminative feature vectors.
4. Conclusion
The multimodal multisensory dataset in support of musculoskeletal disorders research and technology development described in this article provides new opportunities for modeling the body stance (sitting posture and movements), physiological state (stress level, attention, emotional arousal & valence), and performance (success rate on the Stroop test) of people working with a computer. The Stroop test success rates obtained for 100 people confirmed that active sitting on an air-cushioned stability disk improves both the sitting posture and performance of people when compared to sitting on a desk chair. This is in excellent agreement with previous studies investigating stability-disk effectiveness. Furthermore, our experimental results on the recognition of improper neck posture and the detection of cognitive activity illustrate two use cases of the MMD-MSD dataset. Summary of the main benefits that the MMD-MSD offers when compared to other publicly available resources:
- With 100 participants MMD-MSD is the largest publicly available dataset, which is currently available in support of automated postural angle detection research, ergonomic assessment of body postures in office environment, and cognitive load detection.
- The dataset provides a unique combination of sensor recordings in support of multidisciplinary research.
- The dataset provides the means and resources required for technology development in support of early MSD prevention.
Author Contributions
Conceptualization, V.M., S.F. and T.G.; methodology, V.M., T.G., S.F., M.M.; validation, V.M.; formal analysis, T.G.; investigation, V.M., M.M; resources, V.M.; data curation, S.F.; writing—original draft preparation, V.M. and T.G.; writing—review and editing, T.G.; supervision, V.M.; project administration, V.M.; funding acquisition, V.M. All authors have read and agreed to the published version of the manuscript.
Funding
This research was funded by the Bulgarian National Science Fund, grant number КП-06-H37/1 “Ergonomic research on work-related health problems by innovative computer models with a focus on the prevention of Musculoskeletal Disorders”.
Data Availability Statement
A subset of the MMD-MSD recordings of 5 persons is publicly available online at the URL: http://isr.tu-varna.bg/ergo/index.php/resursi. The complete dataset is at https://drive.google.com/drive/folders/15W4aos5B8kdhbAZkQvr1CSN5_6UllcyZ?usp=sharing. The video recordings are provided on request due to their enormous size (over 100 GB).
Acknowledgments
We acknowledge the administrative and technical support we received from the entire ErgoResearch project team.
Conflicts of Interest
The authors declare no conflicts of interest. The funders had no role in the design of the study; in the collection, analyses, or interpretation of data; in the writing of the manuscript; or in the decision to publish the results.
Appendix A. Dataset File Formats
The MMD-MSD folder and file names correspond to the type of information they contain:
Folder Physiological_Signals_raw – contains 100 subfolders, one per participant. The subfolder names correspond to the participant ID. Each contains raw recordings of the physiological signals. For example, subfolder 001 contains the raw physiological signals for Participant 1. Each subfolder contains the following files:
- File ACC.csv – the three-axis accelerometer data in separate columns per axis.
| Timestamp start | Timestamp start | Timestamp start |
| Sampling rate | Sampling rate | Sampling rate |
| Data start | Data start | Data start |
| … | … | … |
| Data end | Data end | Data end |
- 2.
- File BVP.csv – recording with the BVP/PPG signal.
| Timestamp start |
| Sampling rate |
| 9 rows of zeros |
| Data start |
| … |
| Data end |
- 3.
- File EDA.csv – recording with the EDA signal.
| Timestamp start |
| Sampling rate |
| 0 |
| Data start |
| … |
| Data end |
- 4.
- File HR.csv – average heart rate based on the BVP/PPG signal.
| Timestamp start |
| Sampling rate |
| Data start |
| … |
| Data end |
- 5.
- File IBI.csv – inter-beat intervals based on the BVP/PPG signal.
| Timestamp start | IBI |
| Relative time in seconds | Data start (IBIs in seconds) |
| … | … |
- 6.
- File TEMP.csv – contains the calculated temperature.
| Timestamp start |
| Sampling rate |
| Data start |
| … |
| Data end |
- 7.
- File tags.csv – timestamp for each event. Each tags.csv file contains 4 events: start and end of Stroop Test #1, start and end of Stroop Test #2.
- 8.
- File Info.txt – information about each file in the folder.
Folder Pictures_raw – contains pictures in .jpg SOOC (Straight Out Of Camera).
Folder Pictures_with_markers – contains pictures in .jpg with markers. Participants' IDs correspond to the questionnaire's IDs. The picture files were named as follows:
| Picture ID | Note |
| ID.1 | Uncorrected Standing on face |
| ID.2 | Uncorrected Standing left profile |
| ID.3 | Corrected Standing on face |
| ID.4 | Corrected Standing left profile |
| ID.5 | Uncorrected Sitting left profile |
| ID.6 | Corrected Sitting left profile |
| ID.7 | Sitting left profile with stability disk |
Folder Video – contains overhead camera video of the participants. The video files are SOOC (straight out of the camera). For the recording order refer to the file “Participants_ID_and_record_order.xlsx”.
Folder Angles – Postural angle calculations for all body postures captured in pictures are documented for each participant in separate .csv files: Sitting_profile_position_corrected; Sitting_profile_position_uncorrected; Sitting_profile_position_with_stability_disk; Standing_facing_position_corrected; Standing_facing_position_uncorrected; Standing_profile_position_corrected; Standing_profile_position_uncorrected.
Folder Features – contains feature vectors computed from the peripheral physiological signals (PPG and EDA).
References
- Bonanni R., Cariati I., Tancredi V., Iundusi R., Gasbarra E., Tarantino U. (2022). Chronic Pain in Musculoskeletal Diseases: Do You Know Your Enemy? Journal of Clinical Medicine, 11 (9), art. no. 2609. [CrossRef]
- Garnaes K.K., Mørkved S., Salvesen Ø., Tønne T., Furan L., Grønhaug G., Vasseljen O., Johannessen H.H. (2021). What factors are associated with health-related quality of life among patients with chronic musculoskeletal pain? A cross-sectional study in primary health care. BMC Musculoskeletal Disorders, 22 (1), art. no. 102. [CrossRef]
- Chim J.M.Y., Chen T.L. (2023). Prediction of Work from Home and Musculoskeletal Discomfort: An Investigation of Ergonomic Factors in Work Arrangements and Home Workstation Setups Using the COVID-19 Experience. International Journal of Environmental Research and Public Health, 20 (4), art. no. 3050. [CrossRef]
- Malińska M., Bugajska J., Bartuzi P. (2021). Occupational and Non-Occupational Risk Factors for Neck and Lower Back Pain Among Computer Workers: A Cross-Sectional Study. International Journal of Occupational Safety and Ergonomics, 27 (4), pp. 1108 – 1115. [CrossRef]
- Sivapriya K.R., Shah P.B., Gopal P. (2019). Assessment of Musculoskeletal Problems Among Women IT Professionals. Indian Journal of Public Health Research and Development, 10 (8), pp. 12 – 17. [CrossRef]
- Coe-O’Brien R., Joseph L., Kuisma R., Paungmali A., Sitilertpisan P., Pirunsan U. (2020). Outcome measures used in the smartphone applications for the management of low back pain: a systematic scoping review. Health Information Science and Systems, 8 (1), art. no.5. [CrossRef]
- Didyk C., Lewis L.K., Lange B. (2022). Availability, content, and quality of commercially available smartphone applications for the self-management of low back pain: a systematic assessment. Disability and Rehabilitation, 44 (24), pp. 7600 - 7609. [CrossRef]
- Beneciuk J.M., Michener L.A., Sigman E., Harrison T., Buzzanca-Fried K.E., Lu X., Shan G., Hill J.C. (2024). Validation of the Keele STarT MSK Tool for Patients with Musculoskeletal Pain in United States-based Outpatient Physical Therapy Settings. Journal of Pain. [CrossRef]
- bin Ngali M.Z., binti Jemain N.B., An W.C., bin Abdol Rahman M.N., Bin Kaharuddin M.Z., Razak S.B.B.K. (2018). Analysis of Musculoskeletal Disorder Due to Working Postures Via Dual Camera Motion Capture System. International Journal of Integrated Engineering, 10 (5), pp. 164 - 169. [CrossRef]
- Capecci M., Ceravolo M.G., Ferracuti F., Iarlori S., Monteriu A., Romeo L., Verdini F. (2019). The KIMORE Dataset: KInematic Assessment of MOvement and Clinical Scores for Remote Monitoring of Physical REhabilitation. IEEE Transactions on Neural Systems and Rehabilitation Engineering, 27 (7), art. no. 8736767, pp. 1436 - 1448. [CrossRef]
- Wijekoon A., Wiratunga N., Cooper K., Bach K. (2020). Learning to Recognise Exercises for the Self-Management of Low Back Pain. Proceedings of the 33rd International Florida Artificial Intelligence Research Society Conference, FLAIRS-2020, pp. 347 – 352.
- Girase H., Nyayapati P., Booker J., Lotz J.C., Bailey J.F., Matthew R.P. (2021). Automated assessment and classification of spine, hip, and knee pathologies from sit-to-stand movements collected in clinical practice. Journal of Biomechanics, 128, art. no. 110786. [CrossRef]
- Marusic A., Nguyen S.M., Tapus A. (2023a). Evaluating Kinect, OpenPose, and BlazePose for Human Body Movement Analysis on a Low Back Pain Physical Rehabilitation Dataset. ACM/IEEE International Conference on Human-Robot Interaction, pp. 587 - 591. [CrossRef]
- Marusic A., Annabi L., Nguyen S.M., Tapus A. (2023b). Analyzing Data Efficiency and Performance of Machine Learning Algorithms for Assessing Low Back Pain Physical Rehabilitation Exercises. Proceedings of the 11th European Conference on Mobile Robots, ECMR 2023. [CrossRef]
- Liu Y.-P., Chen H.-C., Hung T.-Y., Yu C.-Y. (2023). Development and assessment of a visual-aid system for reducing the risk of neck injuries for computer users. Journal of Ambient Intelligence and Humanized Computing, 14 (11), pp. 14541 - 14549. [CrossRef]
- Feradov F., Markova V., Ganchev T. (2022). Automated Detection of Improper Sitting Postures in Computer Users Based on Motion Capture Sensors, Computers 2022, 11, 116. [CrossRef]
- Olugbade T., Buono R.A., De C Williams A.C., De Ossorno Garcia S., Gold N., Holloway C., Bianchi-Berthouze N. (2022). EmoPain(at)Home: Dataset and Automatic Assessment within Functional Activity for Chronic Pain Rehabilitation. Proceedings of the 10th International Conference on Affective Computing and Intelligent Interaction, ACII-2022. [CrossRef]
- Wang C., Peng M., Olugbade T.A., Lane N.D., De Williams A.C.C., Bianchi-Berthouze N. (2019). Learning Temporal and Bodily Attention in Protective Movement Behavior Detection. Proceedings of the 8th International Conference on Affective Computing and Intelligent Interaction Workshops and Demos, ACIIW 2019, art. no. 8925084, pp. 324 - 330. [CrossRef]
- Wang C., Olugbade T.A., Mathur A., Williams A.C.D.E.C., Lane N.D., Bianchi-Berthouze N. (2021). Chronic Pain Protective Behavior Detection with Deep Learning. ACM Transactions on Computing for Healthcare, 2 (3), art. no. 23. [CrossRef]
- Aung M.S.H., Kaltwang S., Romera-Paredes B., Martinez B., Singh A., Cella M., Valstar M., Meng H., Kemp A., Shafizadeh M., Elkins A.C., Kanakam N., De Rothschild A., Tyler N., Watson P.J., Williams A.C.D.C., Pantic M., Bianchi-Berthouze N. (2016). The Automatic Detection of Chronic Pain-Related Expression: Requirements, Challenges, and the Multimodal EmoPain Dataset. IEEE Transactions on Affective Computing, 7 (4), art. no. 7173007, pp. 435 - 451. [CrossRef]
- Ekambaram D., Ponnusamy V., Natarajan S.T., Khan M.F.S.F. (2023). Artificial Intelligence (AI) Powered Precise Classification of Recuperation Exercises for Musculoskeletal Disorders. Traitement du Signal, 40 (2), pp. 767 - 773. [CrossRef]
- Nair B.B., Sakthivel N.R. (2023). A Deep Learning-Based Upper Limb Rehabilitation Exercise Status Identification System. Arabian Journal for Science and Engineering, 48 (2), pp. 1237 - 1271. [CrossRef]
- Tokas P. (2023). Machine Learning Based Text Neck Syndrome Detection Using Microsoft Kinect Sensor. Materials Today: Proceedings, 80, pp. 3751 - 3756. [CrossRef]
- Markova V., Stoyanova D. (2022). Active Sitting as a Factor for Increasing Concentration During Computer Activities, Proc. of the 2022 International Conference on Communications, Information, Electronic and Energy Systems (CIEES-2022), 22-24 Nov. 2022. [CrossRef]
- Filkova S., Markov M., Markova V. (2023). Assessment of Sagittal Alignment of Cervical Spine in Seated Individuals on Stable and Unstable Base. Proc. of the 2023 IEEE International Workshop on Technologies for Defense and Security, TechDefense-2023, November 20-22, Rome, Italy.
- Kalinkov K., Ganchev T., Markova V. (2019). Adaptive Feature Selection through Fisher Discriminant Ratio. Proc. of the 2019 International Conference on Biomedical Innovations and Applications, BIA-2019, pp. 1-4. [CrossRef]
| [1] | The ErgoResearch project, entitled “Ergonomic research on work-related health problems by innovative computer models with a focus on the prevention of Musculoskeletal Disorders”, was funded by the Bulgarian National Science Fund under contract KP-06-N37/1 (Dec. 2019 – March 2024). |
| [2] | Empatica E4 wristband webpage: https://store.empatica.com/products/e4-wristbands?variant=17719039950953. |
Short Biography of Authors
Prof. Valentina Markova, Ph.D., is Head of the Department of Communication Engineering and Technologies, Technical University of Varna. She is a co-author of over 100 scientific publications with more than 200 citations. She has participated in 15 national and international projects, funded by the Bulgarian National Science Fund, the Ministry of Education and Science, the Institute of Electrical and Electronics Engineering, EIT, Horizon 2020, etc. She supervised 40 graduate students and 7 doctoral students. Since 2021 she has served as the Chair of the IEEE Bulgaria Section (mandates 2021-2023 and 2023-2025).
Prof. Todor Ganchev, PhD, is the Titular Professor of Artificial Intelligence at the Department of Computer Science and Engineering and the founding Head of the Artificial Intelligence Laboratory at the Technical University of Varna. He authored/co-authored over 200 publications, which received over 3000 citations. He has been involved in over 30 national and international RTD projects focused on the application of signal processing and machine learning methods in Biometrics, Bioacoustics, and Human-Machine Interaction. Prof. Ganchev served as the Vice-Rector of Research at TU-Varna (mandate 2019-2023). Since 2010 he has been a Senior Member of IEEE and currently serves as the Vice-Chair of the IEEE Bulgaria Section (mandate 2023-2025).
Figure 1.
Typical body postures registered during the subsequent steps of the data collection process: (a) regular standing en face (front-on view); (b) regular profile (left side view); (c) corrected standing en face (front-on view); (d) corrected profile (left side view); (e) regular sitting posture; (f) corrected sitting posture; (g) active sitting posture with air-cushioned sitting disk.
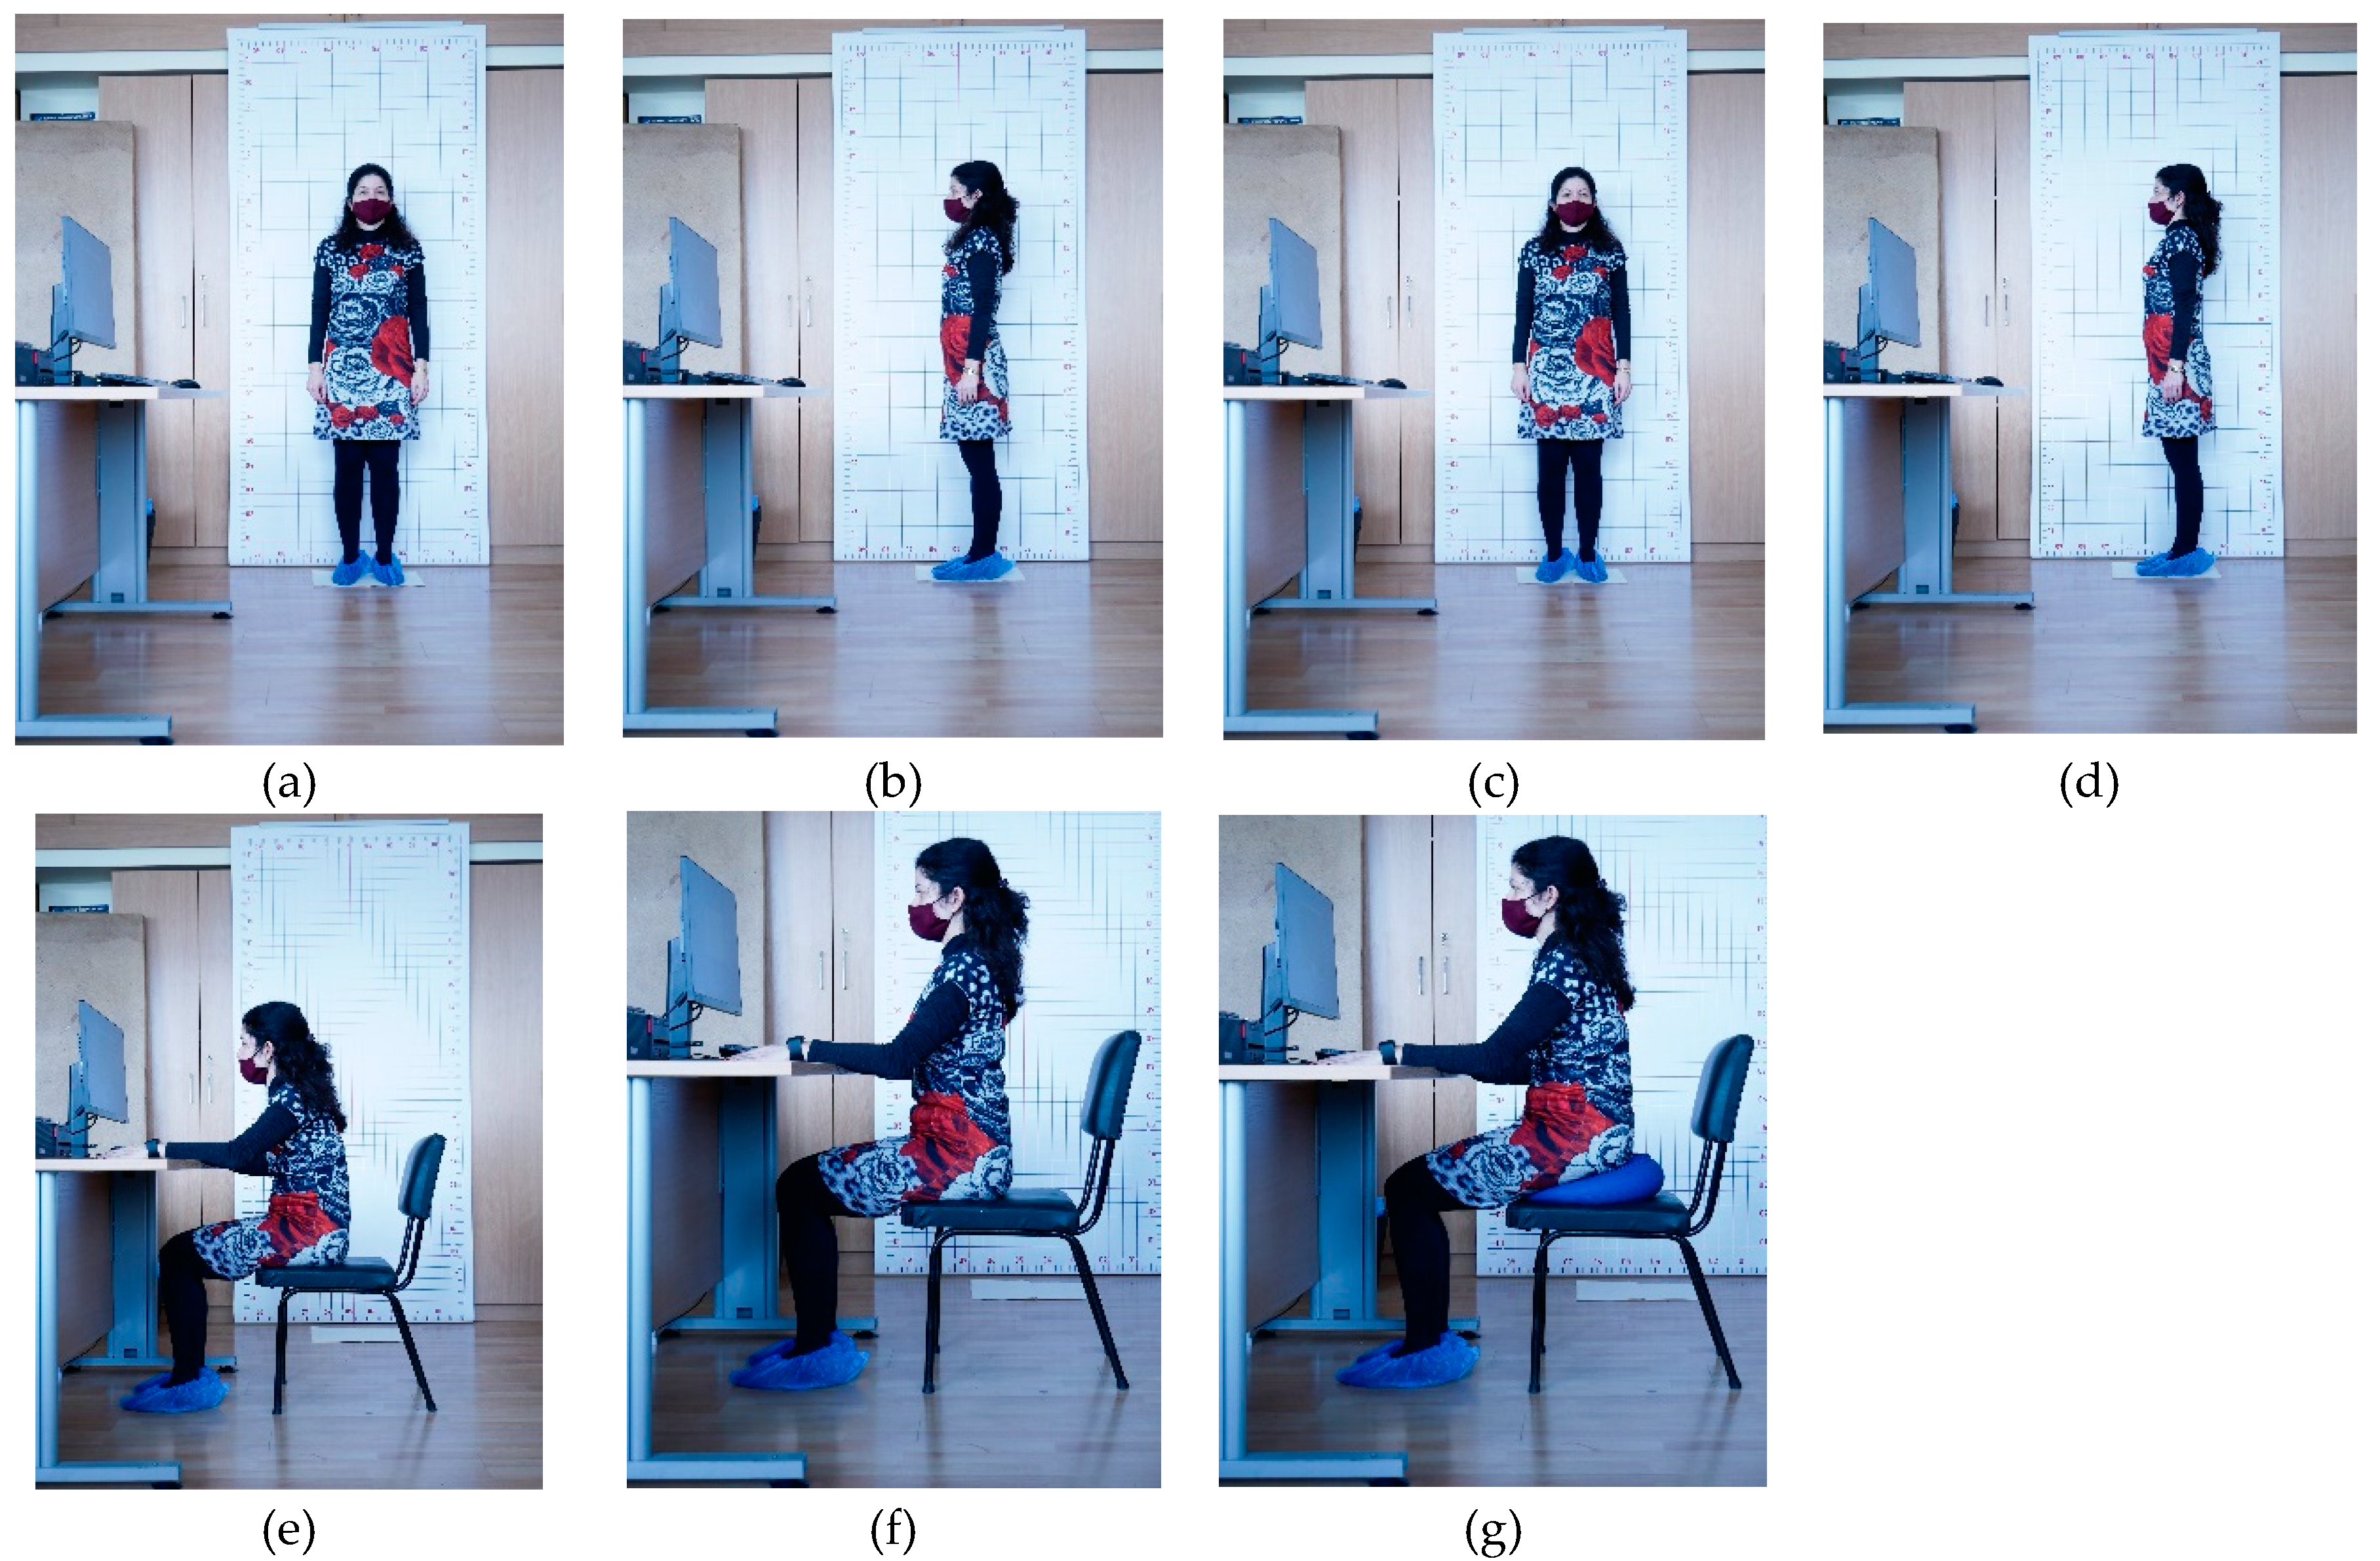
Figure 2.
Data acquisition workflow implemented during the MMD-MSD collection campaign.
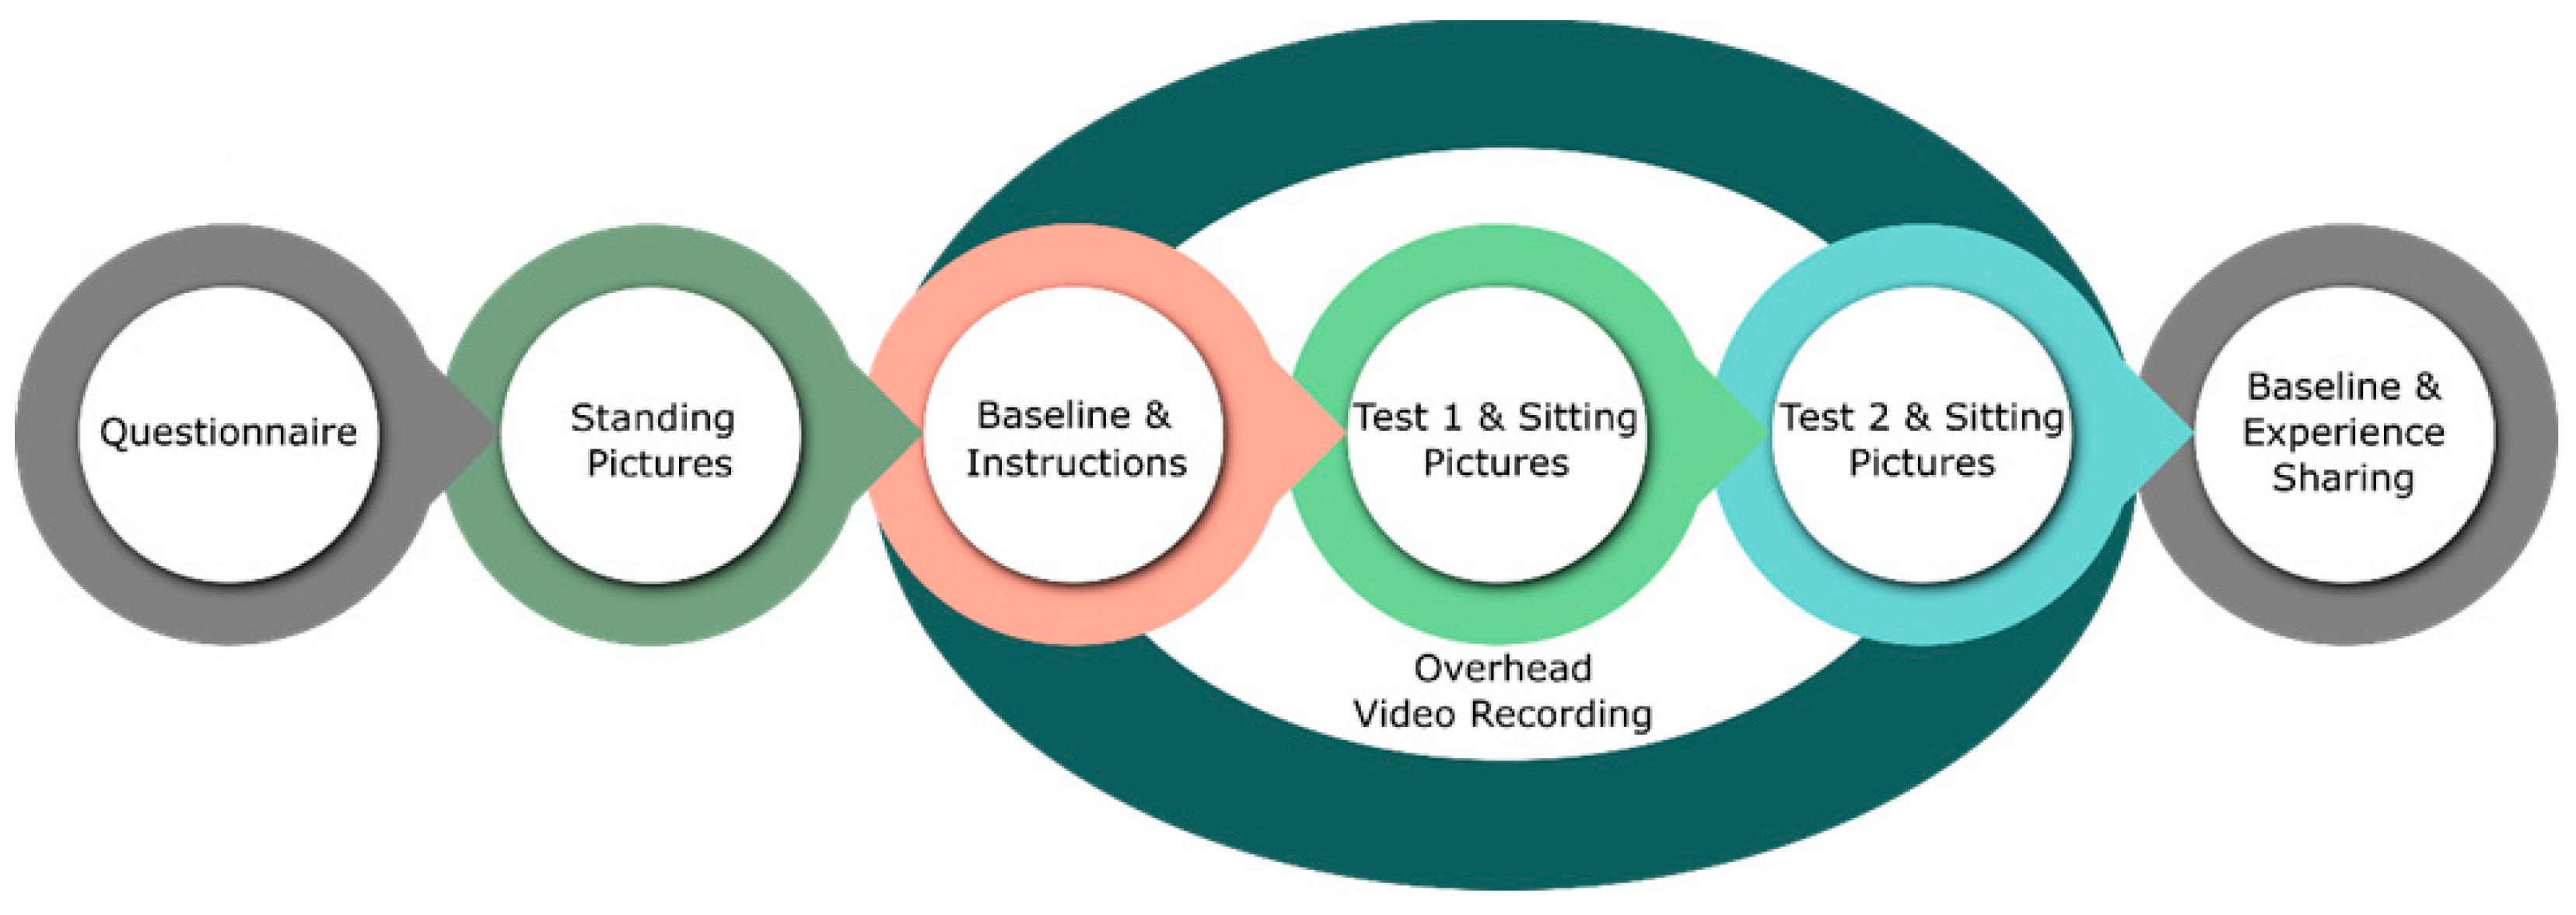
Figure 3.
Marker positions in standing and sitting body postures.
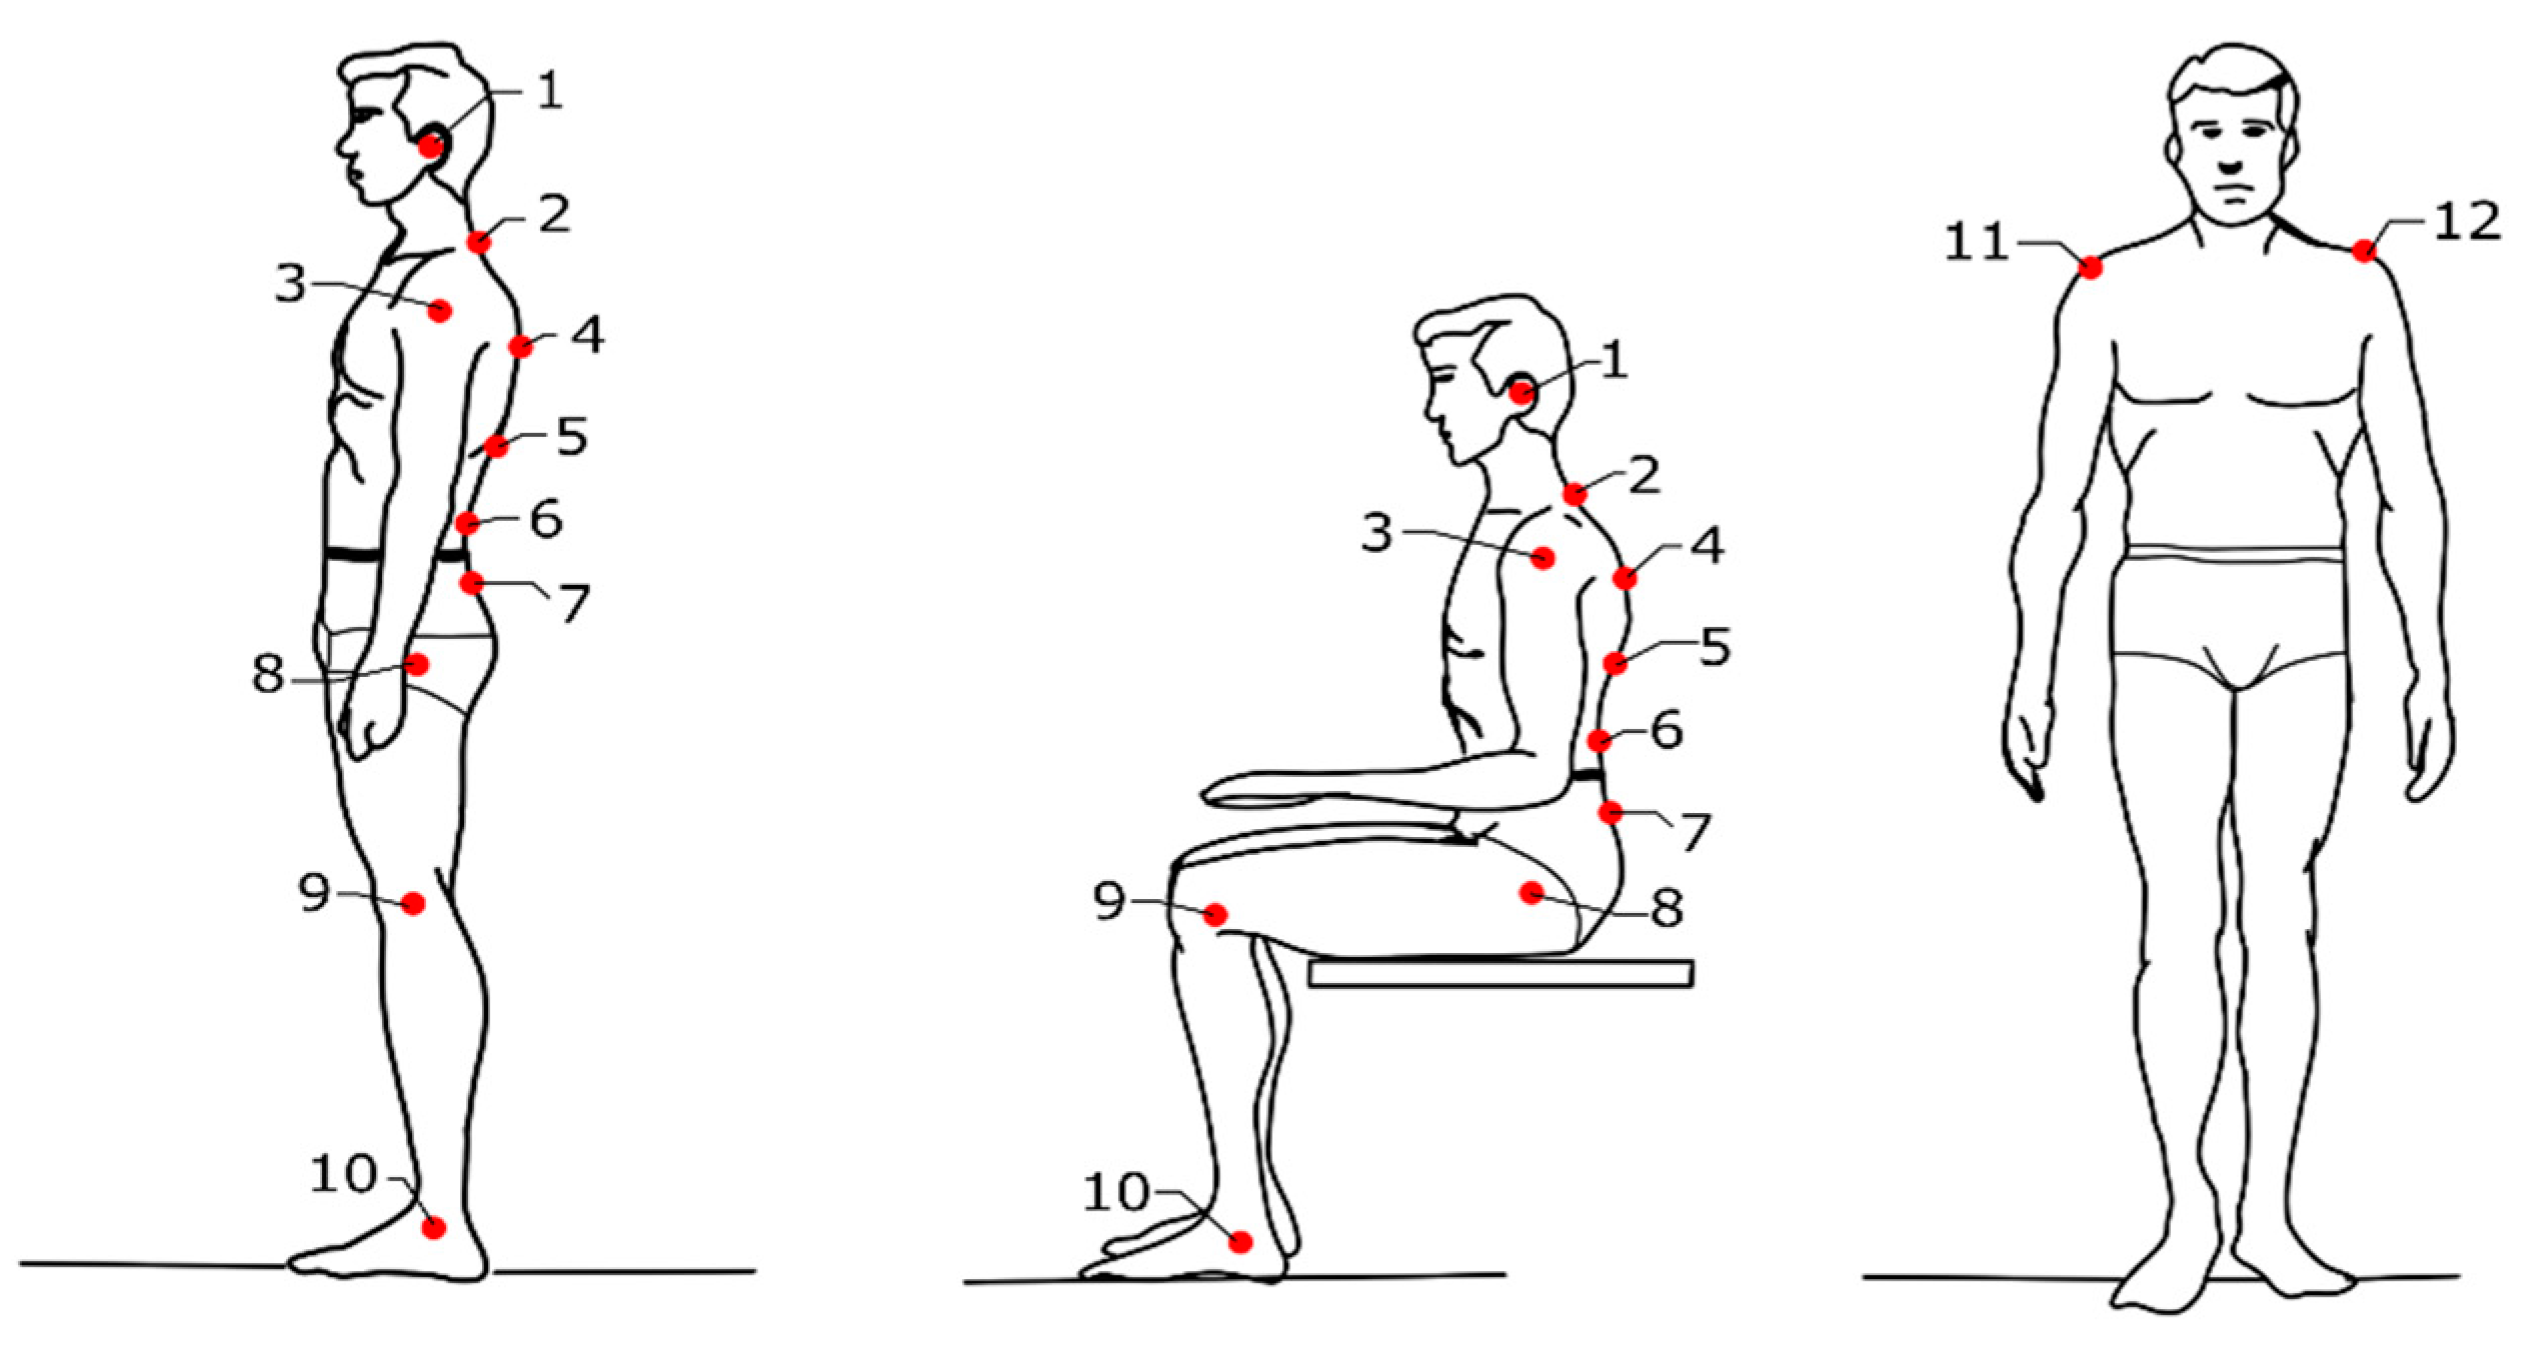
Figure 4.
Important postural angles computed for the needs of MSD detection.
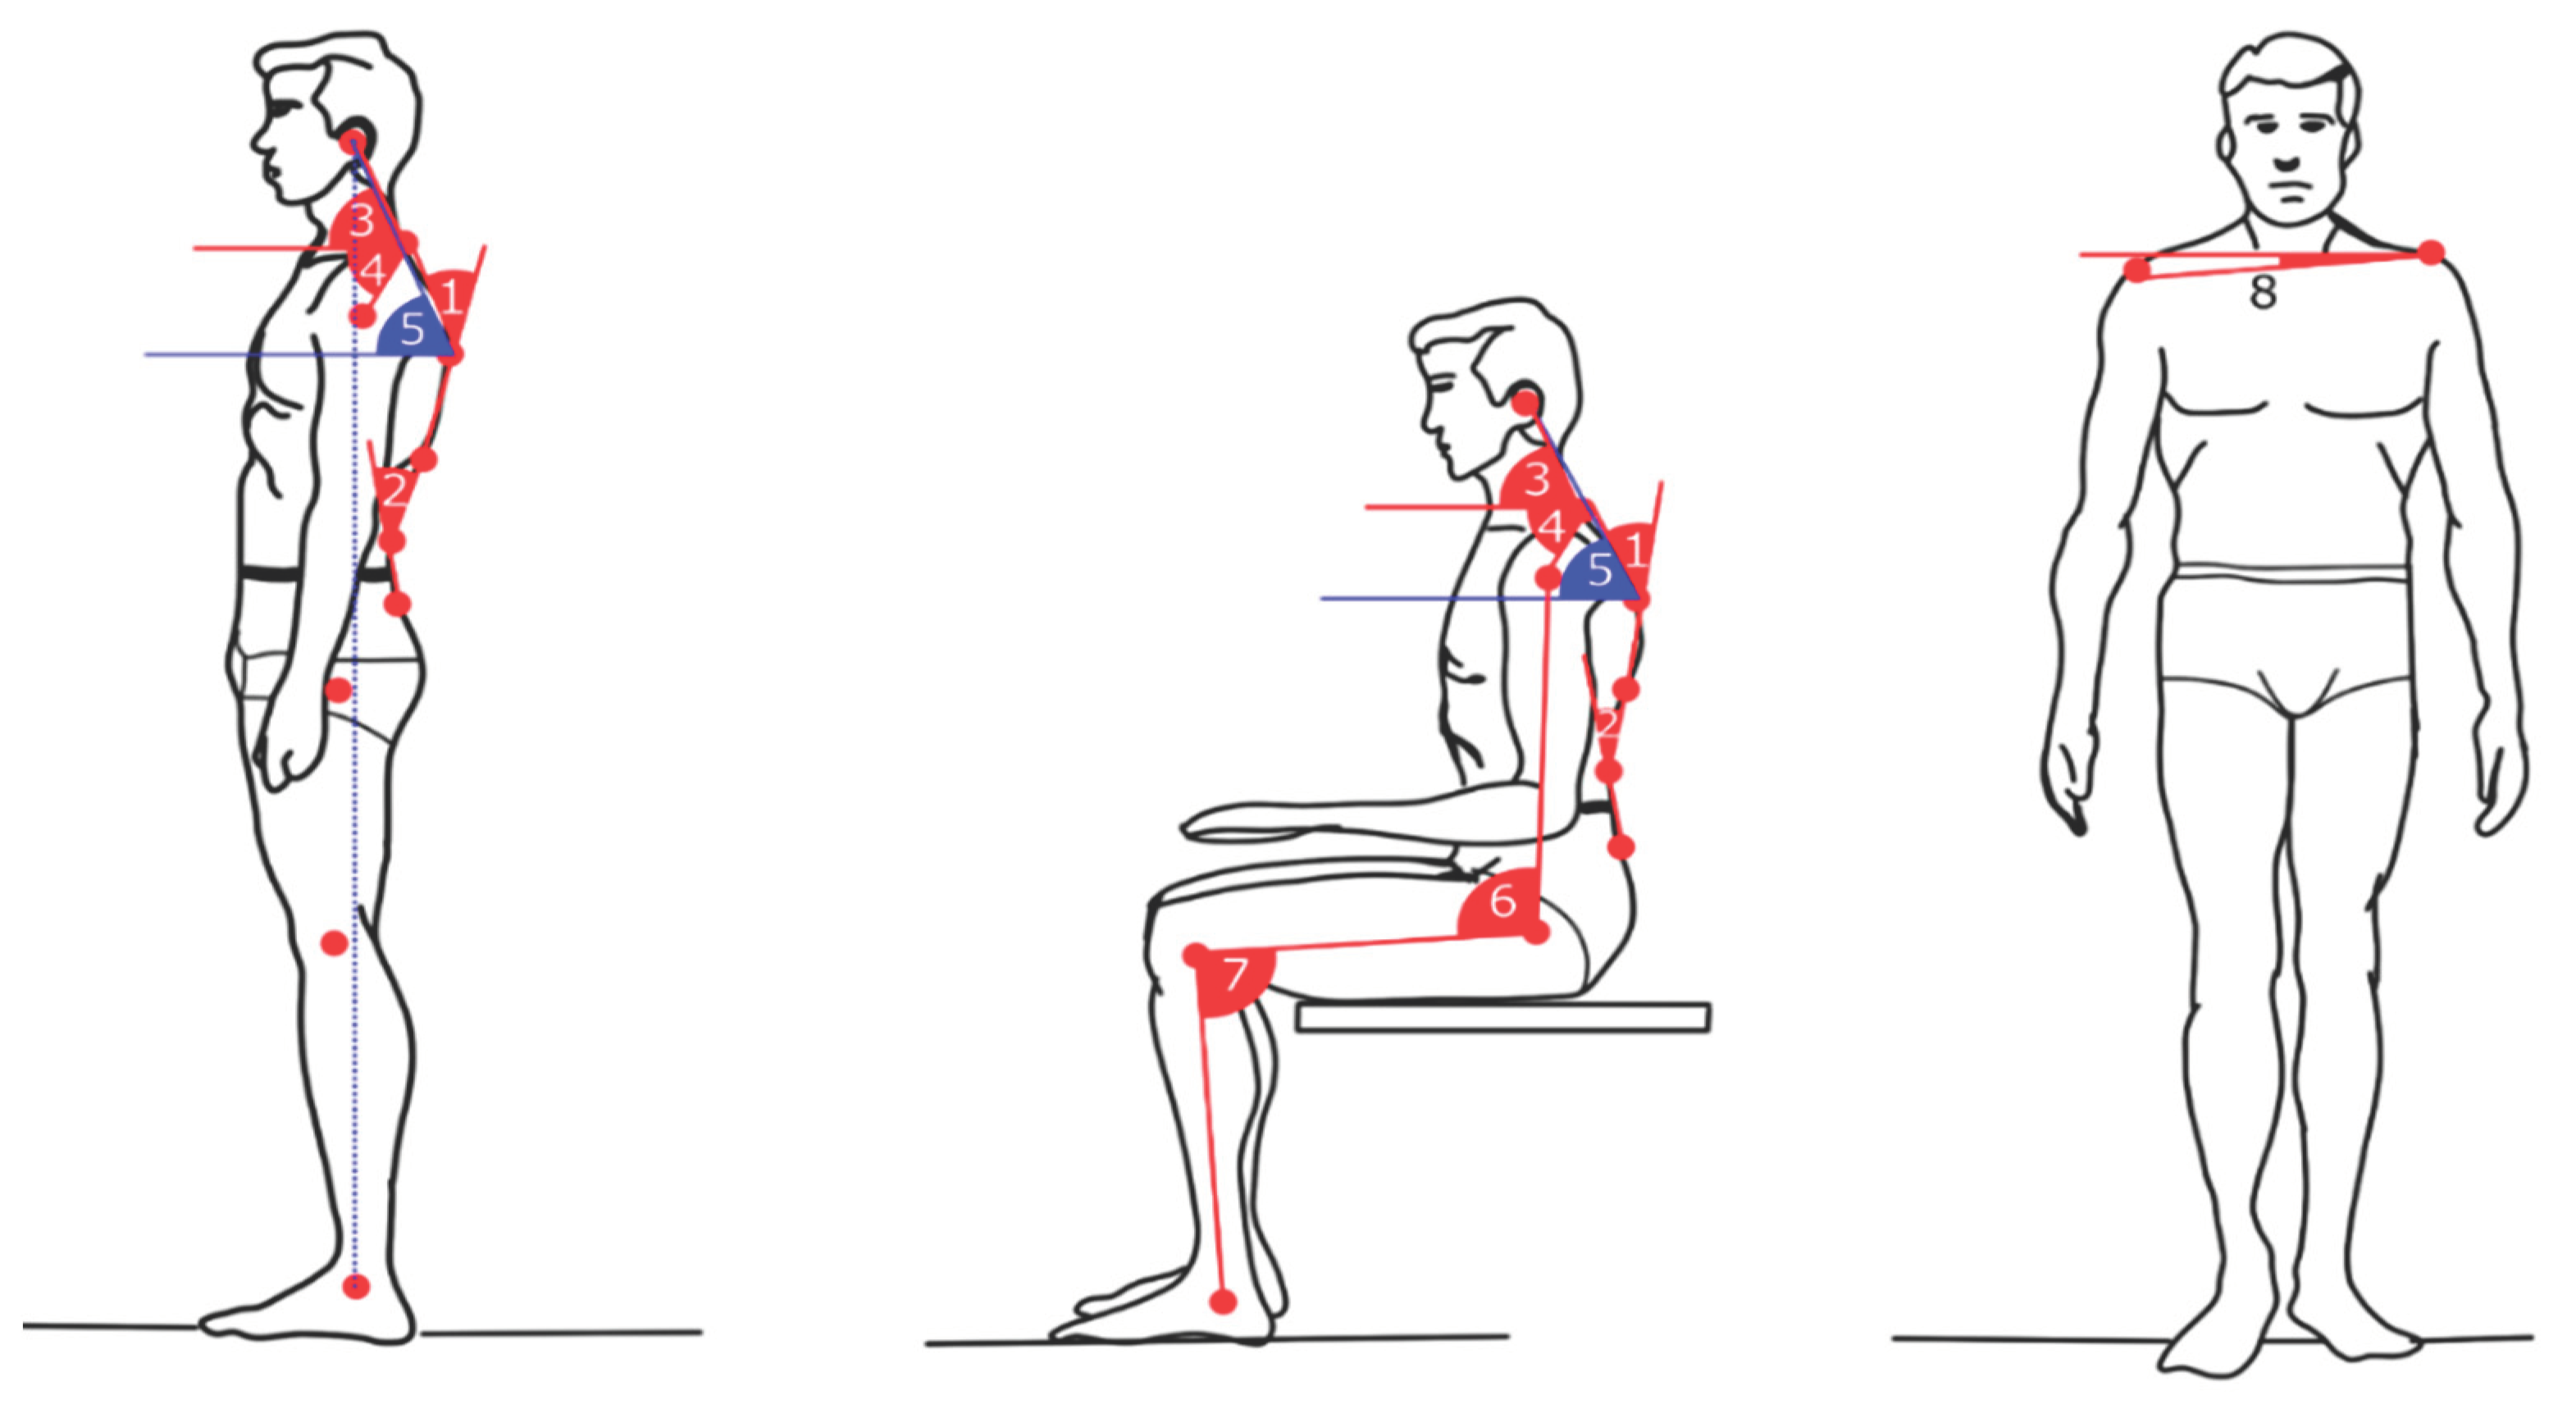
Figure 5.
Significant person-specific differences between the heart rate variability (HRV) were observed. HRV ranges for the initial baseline recording #1 (blue), Stroop Test #1 (orange), Stroop Test #2 (grey), and Baseline recording #2 (yellow).
Figure 5.
Significant person-specific differences between the heart rate variability (HRV) were observed. HRV ranges for the initial baseline recording #1 (blue), Stroop Test #1 (orange), Stroop Test #2 (grey), and Baseline recording #2 (yellow).
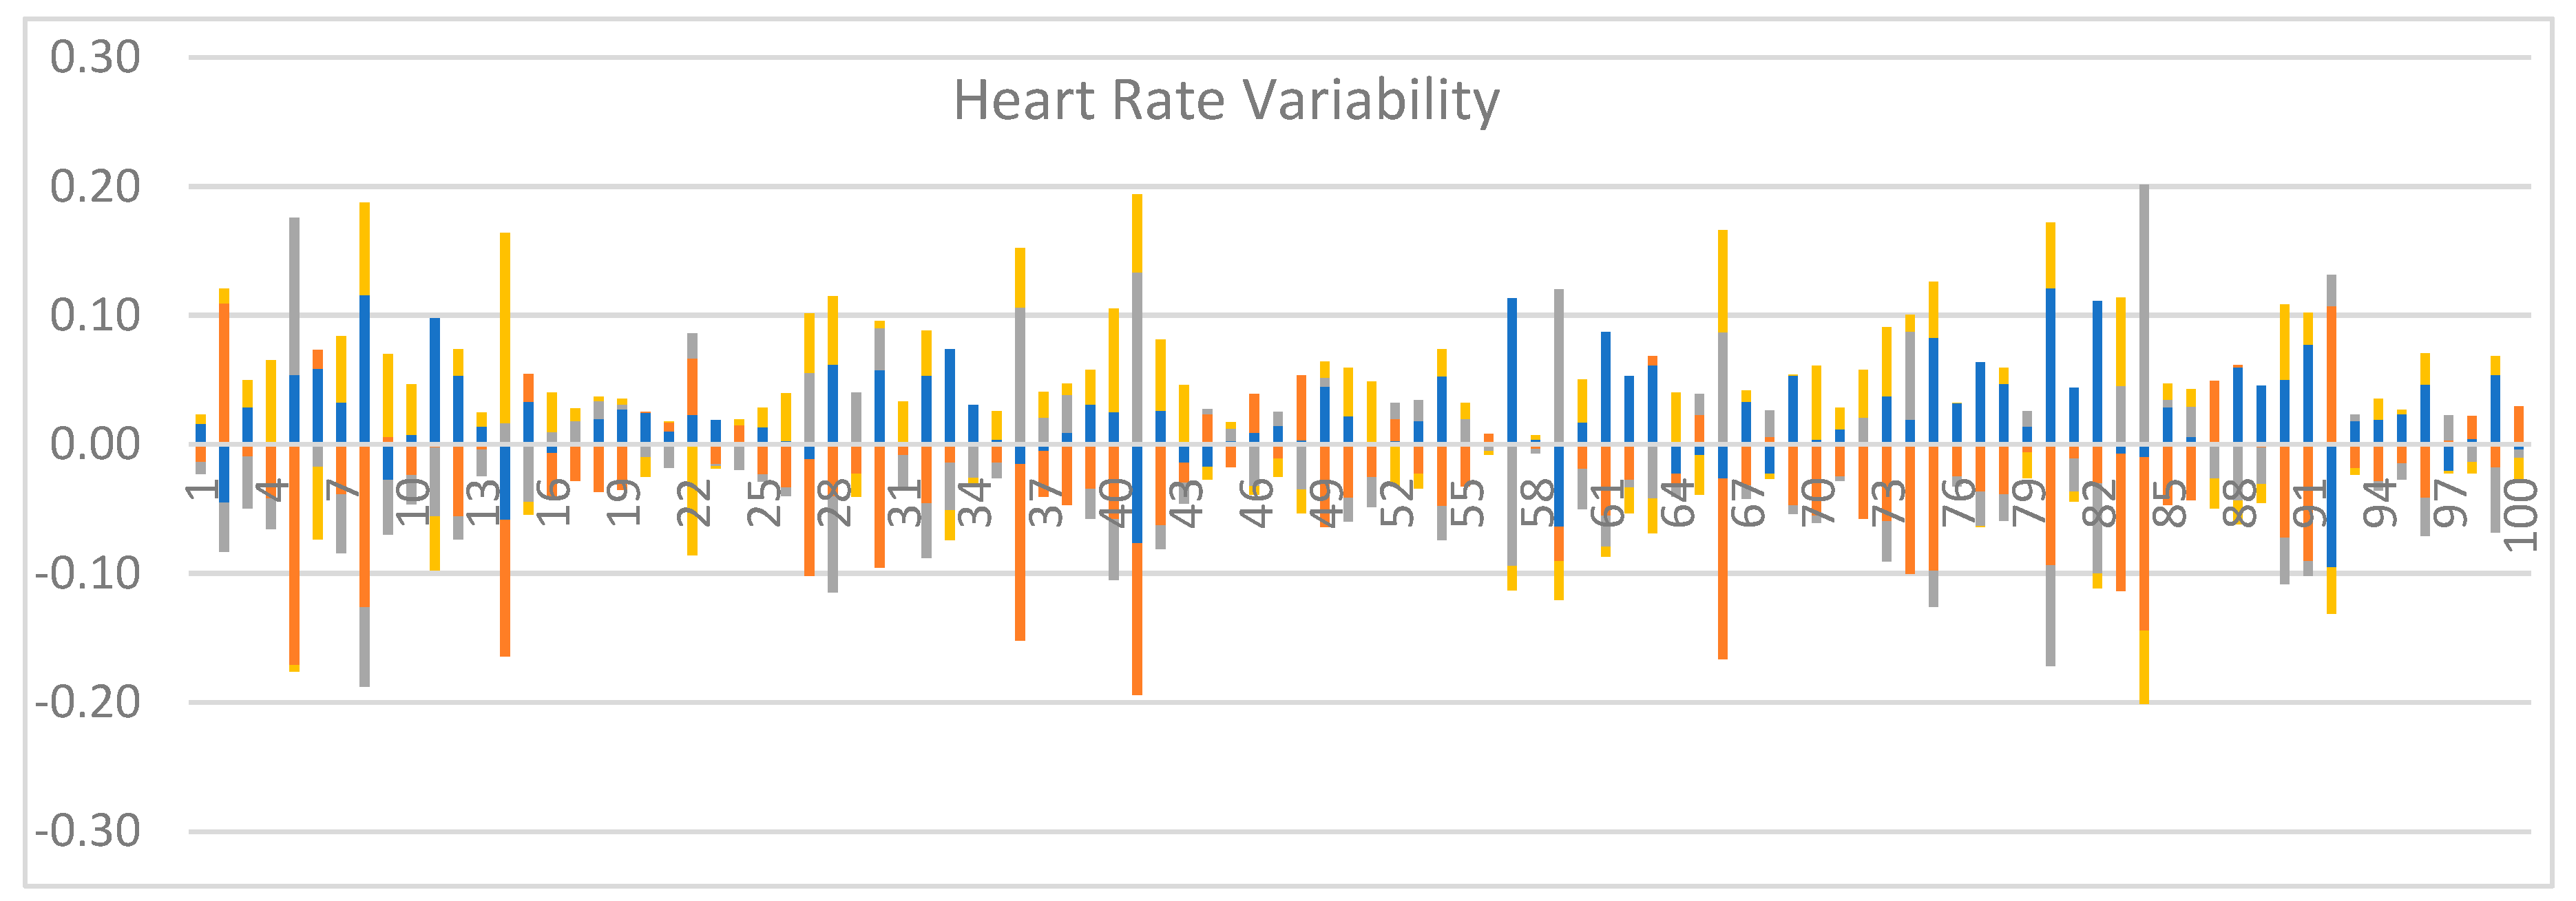

Table 1.
List of data collected with the Empatica E4 wristband[2].
| Signal type | Sampling rate (Hz) |
|---|---|
| BVP (Blood Volume Pulse) | 64 |
| EDA (Electro-Dermal Activity) | 4 |
| Skin Temperature (ST) | 4 |
| Three Axis Accelerometer (TAA) | 32 |
Table 2.
Position of markers on the human body.
| № | Marker Position |
|---|---|
| 1 | Tragus of the ear |
| 2 | The C7 vertebra |
| 3 | The lateral shoulder |
| 4 | The Th 5 vertebra |
| 5 | The Th 12 vertebra |
| 6 | The L5 vertebra |
| 7 | The S 1 vertebra |
| 8 | Hip joint |
| 9 | Knee joint |
| 10 | Ankle joint |
| 11 | Coracoid process of scapula |
| 12 | Anterior shoulder |
Table 3.
Position of markers on the human body.
| Angle of measurement | Reference values |
|---|---|
| The craniovertebral angle (CVA) is identified as the intersection of a horizontal line passing through the C7 (2) spinous process and a line joining the midpoint of the tragus of the ear (1) to the skin overlying the C7 spinous process. | CVA < 48°–50° is defined as Forward head posture |
| Rounded shoulder angle: the angle formed by the horizontal line passing through the middle of the humerus (3) and the line from the midpoint of the humerus to the spinous process of C7 (2). | Rounded shoulder angle ≤52° |
| Coronal shoulder angle: Also known as the anterior shoulder alignment, this is defined as the angle between a horizontal line and a line joining the coracoid processes (2). It is used to determine whether the left and the right shoulders are level or not. | Its normal value should be 180° |
| Thoracic kyphosis angle: the angle between the segments of C7 (2) – T11 (5). | 20° to 45-50° |
| Normal lumbar lordosis is characterized by an average lumbosacral angle. These included measurements from the inferior endplate of T11 (5) to the superior endplate of S1 (7). | 39° - 53° |
Table 4.
Position of markers on the human body.
| Gender | Num. | Age (years) | Weight (kg) | Height (cm) | ||||||
|---|---|---|---|---|---|---|---|---|---|---|
| Mean (±sd) | Min | Max | Mean (±sd) | Min | Max | Mean (±sd) | Min | Max | ||
| Male | 64 | 24.71(7.17) | 18 | 47 | 82.32(17.06) | 53 | 145 | 177.5(8.30) | 163 | 200 |
| Female | 36 | 34.53(14.03) | 19 | 61 | 63.06(12.90) | 43 | 106 | 169.0(11.02) | 152 | 193 |
| All | 100 | 28.11(11.06) | 18 | 61 | 75.65(18.19) | 43 | 145 | 174.5(10.14) | 152 | 200 |
Table 5.
Self-reported sports activities for the participants.
| 6-7 times per week | 4-5 times per week | 2-3 times per week | Once a week | No sport activities | |
|---|---|---|---|---|---|
| All, N (%) | 11 | 25 | 31 | 15 | 18 |
| Male, NM (%) | 10 | 19 | 18 | 7 | 10 |
| Female, NF (%) | 1 | 6 | 13 | 8 | 8 |
Table 6.
Self-reported time spent daily on computer-bound work tasks.
| Up to 4 hours | 4-6 hours per day | 6-8 hours per day | 8-12 hours per day | |
|---|---|---|---|---|
| All, N (%) | 21 | 25 | 27 | 27 |
| Male, NM (%) | 14 | 16 | 17 | 17 |
| Female, NF (%) | 7 | 9 | 10 | 10 |
Table 7.
Averaged Accuracy and standard deviation (std) for proper head posture vs. protracheal head posture classification, based on postural angles #3 and #4.
Table 7.
Averaged Accuracy and standard deviation (std) for proper head posture vs. protracheal head posture classification, based on postural angles #3 and #4.
| Classifier | Accuracy ± std, [%] | |
|---|---|---|
| self-reported tags | tags by medical doctors | |
| Random Forest | 68.0 ± 3.0 | 80.0 ± 2.0 |
| Naïve Bayes | 60.0 ± 2.0 | 70.0 ± 1.0 |
| Decision tree C4.5 | 60.0 ± 1.0 | 71.0 ± 1.0 |
Table 8.
The complete set of PPG and GSR-based features.
| Signal | № | Description | Features |
|---|---|---|---|
| PPG | 1÷11 | Time-domain statistics on the signal | mean heart rate; mean RR; mean, max and min NN interval; pNN50; SDNN; RMSSD; Standard deviation of the difference of successive NN intervals; SD1(Short term variability); SD2(Long term variability); |
| 12÷20 | Frequency domain features | Power in (0-0.04) Hz, (0.04-0.15) Hz, (0,15-0.4) Hz bands; normalized powers in the three bands; the power in the three bands in percent; HRV | |
| GSR | 21÷29 | Time-domain statistics on the SCL peaks | number of peaks; max and min amplitude of the peaks; mean conductance of the peaks; RMS, standard deviation and mean absolute value of the peaks; skewness and kurtosis of the peak’s distribution |
| 30 | Frequency domain features | Power in band (0-2.4) Hz | |
| 31÷39 | Statistical parameters of the signal | Mean resistance; First quartile; Second quartile; Third quartile; Interquartile range; Percentile 2.5; Percentile 10; Percentile 90; Percentile 97.5 |
Table 9.
Averaged Accuracy and standard deviation (std) for cognitive activity vs. baseline activity, based on feature vectors computed from PPG and EDA.
Table 9.
Averaged Accuracy and standard deviation (std) for cognitive activity vs. baseline activity, based on feature vectors computed from PPG and EDA.
| Classifier | Accuracy ± std, [%] | |
|---|---|---|
| raw features | with z-norm | |
| Naive Bayes | 67.0 ± 3.9 | 67.0 ± 3.9 |
| Decision Tree | 64.0 ± 9.4 | 64.0 ± 4.8 |
| Random Forest | 66.0 ± 3.9 | 63.0 ± 5.0 |
| SVM with RBF | 77.5 ± 9.8 | 74.0 ± 4.4 |
| Generalized Linear Model | 79.0 ± 4.8 | 77.2 ± 5.0 |
| FFNN 33-50-50-2 | 76.0 ± 4.3 | 76.0 ± 5.0 |
Disclaimer/Publisher’s Note: The statements, opinions and data contained in all publications are solely those of the individual author(s) and contributor(s) and not of MDPI and/or the editor(s). MDPI and/or the editor(s) disclaim responsibility for any injury to people or property resulting from any ideas, methods, instructions or products referred to in the content. |
© 2024 by the authors. Licensee MDPI, Basel, Switzerland. This article is an open access article distributed under the terms and conditions of the Creative Commons Attribution (CC BY) license (http://creativecommons.org/licenses/by/4.0/).
Copyright: This open access article is published under a Creative Commons CC BY 4.0 license, which permit the free download, distribution, and reuse, provided that the author and preprint are cited in any reuse.


