Submitted:
03 April 2024
Posted:
08 April 2024
You are already at the latest version
Abstract
The fungus Xylaria sp. Z184, harvested from the leaves of Fallopia convolvulus (L.) Á. Löve, has been isolated for the first time. Chemical investigation of the methanol extract of this strain’s culture broth led to the discovery of three new pyranone derivatives fallopiaxylaresters A-C (1–3) and a new bisabolane-type sesquiterpenoid named fallopiaxylarol A (4), along with the first complete set of spectroscopic data for the previously-reported pestalotiopyrone M (5). Known pyranone derivatives (6–11), sesquiterpenoids (12–14), isocoumarin derivatives (15–17), and an aromatic allenic ether (18) were co-isolated. Their structures were elucidated by the interpretation of HRESIMS, 1D, 2D NMR spectroscopy and quantum chemical computation method. The antimicrobial, anti-inflammatory, and α-glucosidase inhibitory activities of selected compounds and crude extract were evaluated in vitro. The extract inhibited nitric oxide (NO) production induced by lipopolysaccharide (LPS) in murine RAW264.7 macrophage cells, with an inhibition rate of 77.28 ± 0.82% at a concentration of 50 μg/mL. The compounds 5, 7 and 8 displayed weak antibacterial activity against Staphylococcus areus subsp. aureus at a concentration of 100 μM.
Keywords:
Xylaria sp.
; pyranone derivative
; sesquiterpenoid
; antimicrobial activity
1. Introduction
Natural products (NPs) have always been an indispensable source of new drugs [1]. As an important source of NPs with novel structures and high-value biological activities, plant endophytic fungi always attracted broad attentions from natural product chemists and pharmacologists [2,3]. Xylariaceae is one of the largest, most commonly encountered, and highly diverse fungal families of the Ascomycota [4]. The genus Xylaria, belonging to the family Xylariaceae, is medicinal fungi commonly found in decaying plant tissues and is widely distributed in temperate, tropical, and subtropical regions[5,6]. So far, more than two hundred bioactive compounds (> 100 new ones) were isolated from Xylaria, including cytochalasins, α-pyrones, cyclopeptides, terpenoids, lactones, and succinic acid derivatives [7]. Besides, the secondary metabolites produced by species of Xylaria were found to exert wide range of biological activities, such as anti-inflammatory, antifungal, antibacterial, anti-tumor, and α-glucosidase inhibitory activities [7,8].
As part of our group’s ongoing effort to identify bioactive natural products from medicinal plants and endophytic fungi[9,10,11], the fungus Xylaria sp. Z184, isolated from the leaves of Fallopia convolvulus (L.) Á. Löve for the first time, has attracted our attention for its impressive compound abundance in TLC and HPLC analyses (Figure). Our current investigation on this strain led to the isolation of three new pyranone derivatives, called fallopiaxylaresters A–C (1–3), a new bisabolane-type sesquiterpenoid fallopiaxylarol A (4) (Figure 1), and the first complete set of the spectroscopic data for the previously-disclosed pestalotiopyrone M (5), as well as a suite of known compounds consisting of six pyranone derivatives (6–11), three sesquiterpenoids (12–14), three isocoumarin derivatives (15–17), and one aromatic allenic ether (18). Herein, the details of the isolation, structure elucidation of all new compounds and their anti-inflammatory, anti-microbial, and α-glucosidase inhibitory activities were described.
2. Results and Discussion
Compound 1, named fallopiaxylarester A, was obtained as a white solid. Its molecular formula C12H16O6 was determined by the HRESIMS molecular ion peak at m/z 279.0837 [M + Na]+ (calcd for C12H16O6Na, 279.0839). The IR absorption bands showed the presence of hydroxyl (3426 cm-1) and carbonyl (1733 cm-1) functionalities. Detailed comparison of 1H and 13C NMR spectra of 1 and 10 revealed that structure of 1 is almost identical with that of 10, which was supported by the further analysis of 2D NMR spectra (Table 1). The HMBC correlations of 1 from H-2 (δH 5.56) to C-1/C-3/C-4, from H3-12 (δH 3.87) to C-3, from H-4 (δH 6.22) to C-3/C-5/C-6, from H-6 (δH 4.35) to C-5 and C-8, showed the same settlement with compound 10 (Figure 2). The main difference between 1 and 10 was found at C-10 of the side chain of the pyranone core, replaced by the fragment of methyl valerate group. This deduction was further identified by the HMBC correlations from H3-11 (δH 3.66) and H2-9 (δH 2.38) to C-10. Thus, the planar structure of 1 was established. Since there was only one chiral center in the molecule, the relative configuration was arbitrarily assigned as 6R*. The absolute configuration of C-6 was subsequently assigned to be R by comparing the optical rotational value [α +56.2 (c 0.11, MeOH) with [α +96.0 (c 0.10, MeOH) of compound 10 [12]. Besides, the deduction was also confirmed by a time-dependent density functional theory-electronic circular dichroism (TDDFT-ECD) approach. As shown in Figure 3, the Boltzmann-averaged ECD spectrum of (6R)-1 displayed a similar curve compared to the experimental one. Thus, the absolute configuration at C-6 in 1 was unambiguously assigned as 6R (Figure 1).
Compound 2, a white solid, was determined to possess the molecular formula of C19H28O9 with six degrees of unsaturation by using HRESIMS {m/z 423.1626 [M + Na]+, (calcd for C19H28O9Na, 423.1626)}. The spectra of 2 showed the similar absorption bands, indicating the same presence of hydroxyl (3359 cm-1) and carbonyl (1696 cm–1) functionalities. The 1H NMR spectra (Table 2) data showed signals of a typical sugar moiety at δH 5.12 (d, J = 3.7 Hz), 3.53 (dd, J = 10.0, 3.7 Hz), 3.78 (t, J = 9.3 Hz), 3.45 (t, J = 9.3 Hz), 3.90 (m), and 3.76 (m). Analysis of the 13C NMR and DEPT spectra of 2 indicated the presence of 19 carbon signals, assignable to two methyl carbons (one methoxyl, δC 57.0 and 14.4), five methylene carbons (δC 27.1, 30.0, 32.8, 23.6 and 62.1), eight methine carbons (three olefinic, δC 89.4, 100.2, 125.0, 102.8, 73.4, 74.4, 71.0, and 75.5), one ester carbonyl carbon (δC 166.7), and three olefinic quaternary carbons (δC 174.0, 157.9 and 145.8). These substructures accounted for four out of five degrees of unsaturation, indicating one cyclic system in 2. The 1H–1H COSY spectrum revealed three spin systems: (a) H-7/H-8/H-9; (b) H-11/H-12 and (c) H-1'/H-2'/H-3'/H-4'/H-5'/H-6' (Figure 2). And those spin systems were connected by the key HMBC correlations from H-2 (δH 5.59) to C-1/C-3/C-4, from H3-13 (δH 3.87) to C-3, from H-4 (δH 6.95) to C-3/C-5/C-6, from H-7 (δH 6.07) to C-5, and from H2-9 (δH 1.48) to C-10/C-11.
Subsequently, the long range HMBC correlation from H-1' (δH 5.12) to the anomeric carbon C-6 suggested the sugar was attached at C-6 of the side chain. Acid hydrolysis of 2 followed by HPLC analysis of the sugar derivative was applied to determine the type of sugar moiety but without success. Then, different deuterated solvent, pyridine-d5, was used to analyze the proton signals on the sugar. Besides, the isolated anomeric proton signal was probed by a selective 1D-TOCSY experiment. In the 1D-TOCSY experiment, irradiation of the signal at δH 5.68 (1H, d, J = 3.7 Hz) enabled the identification of H-2' (δH 4.27, dd, J = 10.5, 4.1 Hz), H-3' (δH 4.71, t, J = 9.3 Hz), H-4' (δH 4.35, t, J = 10.0 Hz), H-5' (δH 4.66, dt, J = 10.0, 3.5 Hz), H2-6' (δH 4.48, br s) in the same conjugated system (Figure 4, Table 2). The J values of JH-5'/H-4' (10.0 Hz) and JH-5'/H-6' (3.5 Hz) in 1H NMR in pyridine-d5 of 2 combined with the 1D-TOCSY experiment suggested an α-D-glucose. Besides, those chemical shift values of anomeric carbon at δC 102.8 (C-1'),four tertiary carbons at δC 73.4 (C-2'), 74.4 (C-3'), 71.0 (C-4'), 75.5 (C-5'), and a methylene oxide carbon at δC 62.1 (C-6') in methanol-d4 was highly similar to 6-Buty-AA-2G along with other derivatives of AA-2G in the literature [13], which also confirmed the inference that the sugar unit was α-D-glucose. Besides, the geometry of the double bond between C-6 and C-7 was inferred by the ROESY spectrum in DMSO-d6. The ROESY correlations between H2-8 (δH 2.33) and H-1' (δH 4.96)/H-3' (δH 3.70)/H-5' (δH 3.54), and between H-4 (δH 6.98) and H-1'/H-3' demonstrated the Z geometry of Δ6,7 (Figure 5 and Figure S15). Thus, this undescribed 2 was established as shown in Figure 1 and named fallopiaxylarester B.
Compound 3, named fallopiaxylarester C, was isolated as a white solid. Its molecular formula of C19H30O9 with five degrees of unsaturation was based on HRESIMS analysis {m/z 425.1780 [M + Na]+, (calcd for C19H30O9Na, 425.1782)}. Like 2, the presence of α, β-unsaturated γ-lactone and hydroxyl groups in 3 was obvious by its IR absorption bands at vmax 3380, and 1700 cm–1. Besides, with the analysis of 1D NMR spectra, a sugar moiety in 3 was also quickly recognized. Besides, the HMBC correlation from H-6 (δH 4.52) to C-1' suggested the same set with 2. The main difference between these two compounds was the hydrogenation of the trisubstituted olefinic group at C-6/C-7 in 2, according to 2 mass unit difference between 2 and 3. Subsequently, an acid hydrolysis of 3 afforded the products including a pyrone aglycone 3a and a sugar moiety 3b. The absolute configuration of C-6 in 3a was assigned to be R form by comparing its optical value [α +52.5 (c 0.11, MeOH) with +67.6 (c 0.25, MeOH) of nodulisporipyrones A [14]. According to the detailed analysis of 1H NMR and 1D-TOCSY experiment of 3, H-1' (δH 5.42, d, J = 3.8Hz), H-2' (δH 4.22, dd, J = 9.6, 3.8 Hz), H-3' (δH 4.67, t, J = 9.6 Hz), H-4' (δH 4.24, t, J = 9.6 Hz), H-5' (δH 4.44, t, J = 9.6 Hz), H2-6' (δH 4.57, dd, J = 9.6, 5.6 Hz; δH 4.43, m), the sugar moiety was indicated as α-D-glucose (Figure 4, Table 3). Moreover, large similarities were observed by comparison of NMR data in DMSO-d6 of 3 with 5-(α-D-glucopyranosyloxymethyl)-2-furancarboxylic acid and other analogs in the literature [15]. Thus, the structure of 3 was established as shown (Figure 1).
Compound 4 was isolated as a colorless oil. Its molecular formula of C16H28O5 with three degrees of unsaturation was also based on HRESIMS analysis {m/z 323.1829 [M + Na]+, (calcd for C16H28O5Na, 323.1829). The IR spectrum of 4 demonstrated characteristic absorption bands for hydroxyl (3425 cm−1) and carbonyl (1687 cm−1) groups. The 1D NMR and HSQC spectra of 4 revealed 16 carbon signals, including four methyl groups, five sp3 methylene groups, one sp2 methine, two sp3 methine groups and four quaternary carbons (three oxygenated carbons). The above information accounted for two degrees of unsaturation, indicating one cyclic system in compound 4. The 1H–1H COSY spectrum revealed two spin systems: (a) H-5/H-6/H-1/H-2/H-3 and (b) H-8/H-9/H-10 (Figure 2). Furthermore, the HMBC correlations from H3-15 (δH 1.04) to C-3/C-5; from H2-2 (δH 1.59, 1.53)/H-3 (δH 3.36) to C-4; from H2-2 (δH 1.59, 1.53)/H2-6 (δH 1.29) to C-7; from H3-14 (δH 0.96) to C-1/C-8; from H-10 (δH 6.71) to C-8/C-12/C-13; from H3-13 (δH 1.77) to C-11/C-12 and from H3-16 (δH 3.64) to C-12 made those two spin systems connected. Thus, the planar structure of 4 was established as shown (Figure 1) and named fallopiaxylarol A.
Initially, the ROESY correlation between H3-13 and H2-9 and the lack of correlation of H3-13/H-10 assigned the E-geometry of Δ10, 11, which was also supported by the J value of H-10 (7.5) (Figure 5). Besides, the ROESY correlations of H-1/3-OH/H3-15/H-5α/H-6α suggested the cis orientation of the H-1, 3-OH, and H3-15. Furthermore, the literature survey revealed that the NMR data of the six-membered ring and the optical rotation values of 4 were almost identical to those of (1S,3R,4R,7S)-3,4-dihydroxy-α-bisabolol [16]. Thus, the absolute configuration of 4 was tentatively determined as shown in Figure 1.

Table 4.
1H NMR (δH, 600 MHz) and 13C NMR (δC, 150 MHz) data for 4.
| No. | δH, mult (J Hz)a | δC, Typea | δH, mult (J Hz)b | δC, Typeb |
| 1 | 1.72, m | 39.1, CH | 1.59, m, overlap | 38.8, CH |
| 2 | 1.80, m | 29.3, CH2 | 1.59, m, overlap | 29.2, CH2 |
| 1.53. m | ||||
| 3 | 3.66, br s | 74.0, CH | 3.36, m, overlap | 72.6, CH |
| 4 | 70.9, C | 69.5, C | ||
| 5 | 1.74, m | 33.6, CH2 | 1.49, m | 33.5, CH2 |
| 1.55, m | 1.29, m, overlap | |||
| 6 | 1.49, m | 22.1, CH2 | 1.29, m, overlap | 21.7, CH2 |
| 1.40, m | ||||
| 7 | 74.0, C | 72.0, C | ||
| 8 | 1.60, m | 38.8, CH2 | 1.41, m | 38.1, CH2 |
| 9 | 2.26, m | 22.9, CH2 | 2.18, q (8.0) | 22.7, CH2 |
| 10 | 6.77, td (7.5, 1.2) | 142.6, CH | 6.71, td (7.5, 0.9) | 143.5, CH |
| 11 | 127.6, C | 126.4, C | ||
| 12 | 168.8, C | 0.90, t (6.8) | 167.7, C | |
| 13 | 1.84, s | 12.4, CH3 | 1.77, s | 12.2, CH3 |
| 14 | 1.14, s | 23.7, CH3 | 0.96, s | 23.8, CH3 |
| 15 | 1.26, s | 27.6, CH3 | 1.04, s | 27.9, CH3 |
| 16 | 3.73, s | 51.8, CH3 | 3.64, s | 51.6, CH3 |
| 3-OH | 4.36, d (4.0) | |||
| 4-OH | 3.96, s | |||
| 7-OH | 3.88, s |
aMeasured in chloroform-d, bmeasured in DMSO-d6.
After literature survey, as for the secondary metabolites produced by the genus Xylaria, the main structural differences between the co-isolated new pyranone derivatives in this case and the other analogues of the genus are the variation of substituents in the side chain attached pyranone core [7,12,16]. Although compound 5 has previously been reported as a natural product from fermentation extracts of endophytic fungi [17], this is the first report of its existence to be accompanied by a full suite of supporting spectroscopic data. The fourteen known compounds, pestalotiopyrone M (5), 4-methoxy-6-nonyl-2-pyrone (6) [18], xylariaopyrone A (7) [19], xylariaopyrone H (8) [12], xylariaopyrone I (9) [12], xylapyrone D (10) [20], scirpyrone H (11) [21], 1α,10α-epoxy-3α,13-dihydroxyeremophil-7(11)-en-12,8β-olide (12) [4], 3α-hydroxymairetolide A (13) [4], mairetolide A (14) [22], (−)-5-methylmellein (15) [23], diaporthin (16) [24], mucorisocoumarin B (17) [25], eucalyptene (18) [26], were also isolated from Xylaria sp. Z184. The structures of these compounds (5–18) were identified by comparing the spectral data to those reported in the respective references.
Given the secondary metabolites generated by stains of Xylaria usually show obvious anti-inflammatory and antifungal activities [7,8]. In this case, compounds 2–10 and 15–18 and the crude extract were selected to evaluate the antimicrobial, anti-inflammatory and α-glucosidase inhibition activities due to the limitation of samples. In antimicrobial assay, compounds 5, 7, and 8 displayed weak activity against Staphylococcus areus subsp. aureus with inhibition ratios of 25.9%, 31.5% and 25.3% at a concentration of 100 μM. Unfortunately, in anti-inflammatory and α-glucosidase assay, only the crude extract potently inhibited LPS-induced NO production in RAW264.7 mouse macrophages, with an inhibition rate of 77.28 ± 0.82% at a concentration of 50 μg/mL, although it was cytotoxic at this concentration, reducing the concentration to 6.25 μ/mL abrogated the cytotoxicity (Table 5).
Table 5.
Inhibitory activities of compounds selected and crude extract on LPS-stimulated NO production.
Table 5.
Inhibitory activities of compounds selected and crude extract on LPS-stimulated NO production.
| Compounds | Concentration | NO production inhibition (%)a |
|---|---|---|
| 2 | 50 μM | 4.51 ± 0.35 |
| 3 | 50 μM | –3.93 ± 2.43 |
| 4 | 50 μM | 1.85 ± 3.18 |
| 5 | 50 μM | –1.61 ± 0.53 |
| 12 | 50 μM | 0.92 ± 2.97 |
| 13 | 50 μM | 4.67 ± 2.36 |
| 14 | 50 μM | 3.54 ± 1.26 |
| 18 | 50 μM | –0.92 ± 2.21 |
| Crude extract | 50 μg/mL | 77.28 ± 0.82 |
| 6.25 μg/mL | 7.78 ± 3.29 | |
| L-NMMAb | 50 μM | 53.75 ± 1.28 |
aAll compounds examined in a set of triplicated experiment. bPositive control.
3. Materials and Methods
3.1. General Experimental Procedures
Optical rotations were determined with a PerkinElmer 341 polarimeter (PerkinElmer, Waltham, MA, USA). UV absorptions were obtained by using a Waters UV-2401A spectrophotometer equipped with a DAD and a 1 cm path length cell. Methanolic samples were scanned from 190 to 400 nm in 1 nm steps. Measurements of IR spectra were performed using a Bruker Vertex 70 FT-IR spectrometer (Bruker, Karlsruhe, Germany). NMR spectra were recorded on Bruker AM-400 and AM-600 NMR spectrometers (Bruker, Karlsruhe, Germany) with TMS as internal standard, and NMR data were referenced to selected chemical shifts of methanol-d4 (1H: 3.31 ppm, 13C: 49.0 ppm), chloroform-d (1H: 7.26 ppm, 13C: 77.0 ppm) and dimethyl sulfoxide-d6 (1H: 2.50 ppm, 13C: 39.5 ppm), respectively. HRESIMS data were acquired on a Thermo Fisher LTQ XL LC/MS (Thermo Fisher, Palo Alto, CA, USA). Semi-preparative HPLC was performed on an Agilent 1220 instrument equipped with a UV detector with a semi-preparative column (RP-C18, 5 μm, 250 × 10 mm, Welch Materials, Inc.). Column chromatography was performed using SephadexTM LH-20 gel (40–70 μm; Merck KGaA, Darmstadt, Germany), and precoated silica gel plates (GF254, Qingdao Marine Chemical Co. Ltd., Qingdao) were used for TLC analyses. Spots were visualized by heating silica gel plates sprayed with 10% H2SO4 in EtOH. All HPLC solvents were purchased from Guangdong Guanghua Sci-Tech Co. Ltd (Guangzhou, China). All solvents were of analytical grade (Guangzhou Chemical Regents Company, Ltd., Guangzhou, China).
3.2. Fungal Material
The fungus Xylaria sp. Z184 was isolated from the leaves of Fallopia convolvulus (L.) Á. Löve collected in Zhuyang Town, Henan province, P. R. China (N 34°14′12″ W 110°47′09″) in June 2022. Leaves of F. convolvulus (L.) Á. Löve were processed within 24 hours and rinsed with sterile water. On a sterile workbench, after 30 minutes of ultraviolet light exposure, the leaves underwent sequential treatment with a 5% sodium hypochlorite solution, sterile water, and 75% ethanol, either soaked or rinsed, followed by drying with sterile filter paper. Leaves were trimmed into small squares with sterile scissors and placed into previously prepared PDA monoclonal agar plates, inoculating three petri plates in parallel. These plates were incubated at 30 °C for 3–7 days, until mycelial growth was observed extending from the inside of the tissue block to its surroundings. Distinct morphological colonies were subsequently transferred to new media for continued cultivation. This procedure was repeated until the fungal strains showed uniform growth, leading to the isolation of purified strains.
To identify the strains, the standardized operating procedure was performed, which included genomic DNA extraction, 16S/18S amplification, PCR product detection and purification, and comparison of sequencing results with the NCBI-BLAST database (https://www.ncbi.nlm.nih.gov/), using ITS1 and ITS4 primers for both amplification and sequencing. The sequence data for this strain was submitted to the GenBank under accession No. KU645984. The fungal strain was deposited on 20% aqueous glycerol stock in a −80 °C freezer at the School of Pharmaceutical Sciences (Shenzhen), Shenzhen Campus of Sun Yat-sen University, Shenzhen, China.
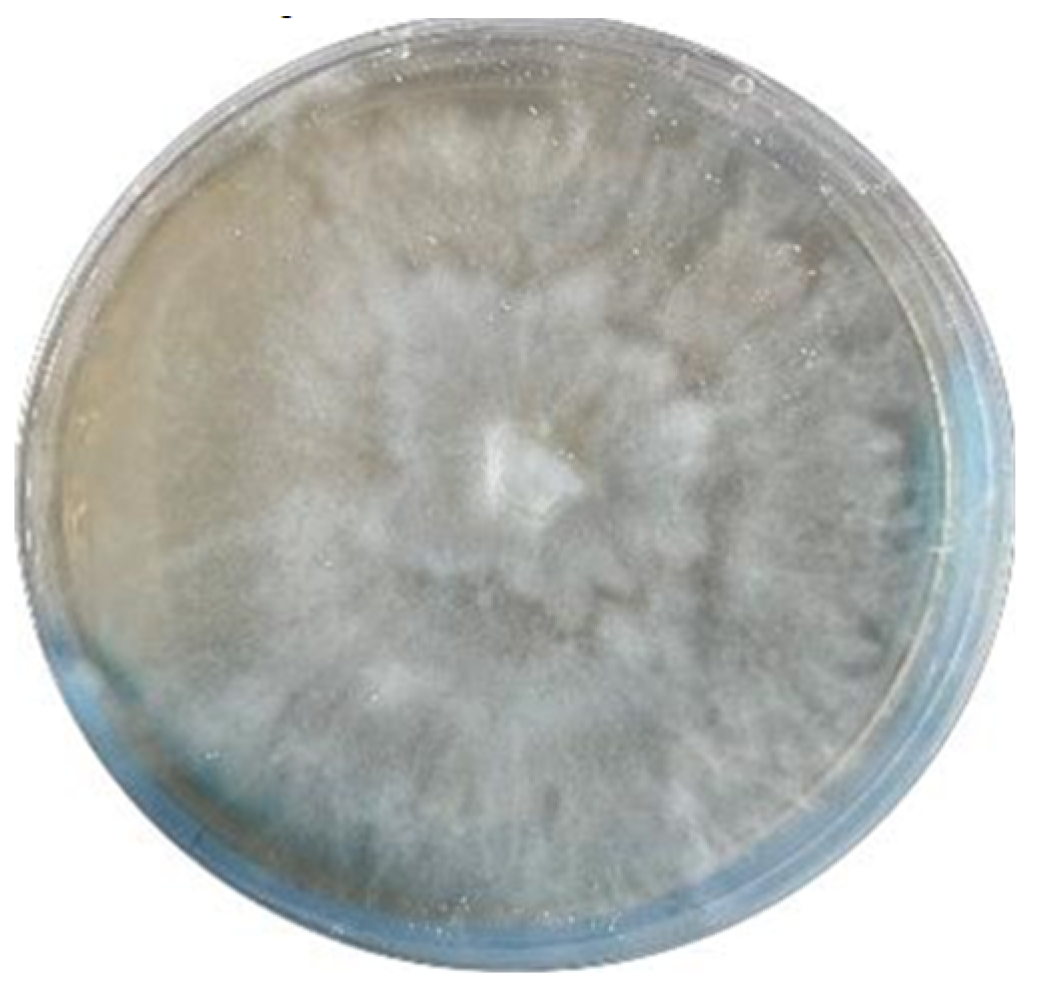
Figure 6.
Photo of the fungus Xylaria sp. Z184.
3.3. Fermentation, Extraction and Isolation
Xylaria sp. Z184 was cultured on potato dextrose agar for 5 days at 28 °C to prepare the seed culture. The cultured agar plates were cut into small pieces, which were then inoculated into 30 previously-autoclaved Erlenmeyer flasks (350 mL), each containing 50 g of rice and 45 mL of distilled water. All flasks were incubated at 28 °C for 40 days. Cultural media was extracted with methanol four times, and the solvent was evaporated under reduced pressure at 45 °C. Then the extract was suspended in water and extracted four times with ethyl acetate. The combined ethyl acetate layers were concentrated under reduced pressure to yield a brown extract (7.5 g).
The crude extract was chromatographed on Sephadex LH-20 (MeOH) to give eight fractions (Fr.1–Fr.8). Fr. 3 (2.8 g) was separated with silica gel column chromatography (CC) with petroleum ether (PE)/EtOAc (20:1–0:1, v/v) to give seven subfractions (Fr. 3.1–Fr. 3.7). Fr. 3.3 (306.2 mg) was purified with silica gel CC using PE/EtOAc (15:1–1:1, v/v) to yield six further subfractions (Fr. 3.3.1–Fr. 3.3.6). Fr. 3.3.4 (25.8 mg) was purified by semi-preparative HPLC (MeOH/H2O, 48:52, v/v, 3.0 mL/min) to yield compound 7 (4.3 mg, tR 22.0 min). Fr. 4 (1.7 g) was separated by silica gel CC with CH2Cl2/MeOH (80:1–0:1, v/v) to obtain seven subfractions (Fr. 4.1–Fr. 4.7). Fr. 4.3 (277.5 mg) was purified by semi-preparative HPLC (MeCN/H2O, 25:75, 0–14 min, then MeCN/H2O, 50:50, 14.01–33 min, v/v, 3.0 mL/min) to yield compounds 13 (4.6 mg, tR 12.1 min), 14 (1.6 mg, tR 27.6 min), and 6 (4.1 mg, tR 31.5 min). Fr. 4.5 (239.9 mg) was purified by semi-preparative HPLC (MeCN/H2O, 20:80, 0–10 min, then MeCN/H2O, 40:60, 10.01–21 min, v/v, 3.0 mL/min) to yield compounds 10 (8.7 mg, tR 13.2 min) and 4 (6.0 mg, tR 19.5 min). Fr. 4.6 (225.9 mg) was purified by semi-preparative HPLC (MeOH/H2O, 40:60, v/v, 3.0 mL/min) to yield compounds 2 (3.9 mg, tR 30.1 min) and 3 (12.1 mg, tR 35.5 min). Fr. 5 (1.3 g) was separated with silica gel CC with CH2Cl2/MeOH (25:1–0:1, v/v) to give six subfractions (Fr. 5.1 – Fr. 5.6). Fr. 5.1 (44.0 mg) was further purified by semi-preparative HPLC (MeOH/H2O, 55:45, 0–23 min, then MeOH/H2O, 65:35, 23.01–47 min, v/v, 3.0 mL/min) to yield compounds 15 (3.1 mg, tR 21.8 min) and 18 (1.4 mg, tR 45.5 min). Fr. 5.3 (399.7 mg) was purified by semi-preparative HPLC (MeOH/H2O, 35:65, 0–19 min, then MeOH/H2O, 54:46, 19.01–40 min, v/v, 3.0 mL/min) to yield compounds 1 (1.2 mg, tR 6.0 min), 17 (8.3 mg, tR 18.1 min), 16 (2.7 mg, tR 31.9 min), and 11 (2.4 mg, tR 38.2 min). Similarly, Fr. 5.4 (355.8mg) was purified by semi-preparative HPLC (MeCN/H2O, 10:90, v/v, 3.0 mL/min) to yield compounds 5 (3.5 mg, tR 6.5 min), 8 (1.3 mg, tR 8.1 min), 9 (8.3 mg, tR 10.9 min), and 12 (2.1 mg, tR 15.5 min).
3.4. Spectral and Physical Data of Compounds 1–5
Fallopiaxylarester A (1): White solid; [α +56.2 (c 0.11, MeOH); UV (MeOH) λmax (log ε): 279 (0.19), 204 (0.72) nm; IR (KBr) vmax: 3426, 2922, 1733, 1648, 1569, 1457, 1412, 1384, 1247, 1032, 832 cm–1; ECD (MeOH) λmax (Δε): 279 (+3.0), 206 (–4.0) nm. 1H and 13C NMR data, see Table 1; HRESIMS (m/z): 279.0837 [M + Na]+ (calcd for C12H16O6Na, 279.0839).
Fallopiaxylarester B (2): White solid; [α +102.9 (c 0.38, MeOH); UV (MeOH) λmax (log ε): 310 (0.16), 260 (0.06), 219 (0.41) nm; IR (KBr) vmax: 3359, 2928, 2858, 1696, 1623, 1560, 1456, 1409, 1260, 1230, 1080, 1018, 817, 539 cm–1; ECD (MeOH) λmax (Δε): 310 (+3.4), 231 (–4.1), 205 (–3.3) nm. 1H and 13C NMR data, see Table 2; HRESIMS (m/z): 423.1626 [M + Na]+ (calcd for C19H28O9Na, 423.1626).
Fallopiaxylarester C (3): White solid; [α +124.2 (c 0.39, MeOH); UV (MeOH) λmax (log ε): 281 (0.11), 204 (0.45) nm; IR (KBr) vmax: 3380, 2927, 2857, 1700, 1649, 1569, 1458, 1414, 1384, 1250, 1025, 836, 700 cm–1; ECD (MeOH) λmax (Δε): 280 (+4.5), 232 (+0.9), 205 (+3.0) nm; 1H and 13C NMR data, see Table 3; HRESIMS (m/z): 425.1780 [M + Na]+ (calcd for C19H30O9Na, 425.1782).
Fallopiaxylarol A (4): Colorless oil; [α –31.8 (c 0.10, MeOH); UV (MeOH) λmax (log ε): 205 (0.36), 218 (0.48) nm; IR (KBr) vmax: 3546, 3426, 2945, 2930, 1688, 1287, 1150, 1036 cm–1; 1H and 13C NMR data, see Table 4; HRESIMS (m/z): 323.1829 [M + Na]+ (calcd for C16H28O5Na, 323.1829).
Pestalotiopyrone M (5): White solid; UV (MeOH) λmax nm (log ε) 206 (0.45), 293 (0.16); IR (KBr) νmax 3311, 2961, 2928, 1711, 1565, 1365, 1014, 989 cm–1; 1H NMR (methanol-d4, 600 MHz) δH: 4.54 (2H, s, H-7), 4.41 (2H, s, H-8), 4.18 (3H, s, H-10), 2.35 (3H, s, H-9); 13C NMR (methanol-d4, 150 MHz) δC: 171.6 (C, C-4), 167.4 (C, C-2), 163.0 (C, C-6), 115.2 (C, C-5), 110.1 (C, C-3), 63.1 (CH3, C-10), 55.5 (CH2, C-8), 55.1 (CH2, C-7), 17.3 (CH3, C-9); HRESIMS (m/z): 223.0578 [M + Na]+ (calcd for C9H12O5Na, 223.0577).
3.5. Computational Details (TDDFT-ECD) of 1
The conformational search of (6R)-1 was performed by using the torsional sampling (MCMM) conformational searches with OPLS_2005 force field within an energy window of 21 kJ/mol. Conformers above 1% Boltzmann populations were re-optimized at the B3LYP/6-31G(d) level with the IEFPCM solvent model for methanol. The following TDDFT calculations of the re-optimized geometries were all performed at the B3LYP/6-311G(d,p) level with the IEFPCM solvent model for methanol. Frequency analysis was performed as well to confirm that the re-optimized geometries were at the energy minima. Finally, the SpecDis 1.62 [27] software was used to obtain the Boltzmann-averaged ECD spectra of 1 and visualize the result.
3.6. Biological Assays
3.6.1. Antimicrobial Activity
Compounds 2–10 and 15–18, and the crude extract were evaluated for antimicrobial activities against Staphylococcus aureus subsp. aureus, and fluconazole-resistant Candida albicans. The antimicrobial assay was conducted according to a previously-described method [28]. Samples were added into a 96-well culture plate with a maximum test compound concentration of 100 μM. Bacterial liquid was added to each well until the final concentration was 5 × 10⁵ CFU/mL. The plate was then incubated at 37 °C for 24 h, and the OD values at 595 nm were measured using a microplate reader. Blank bacterial medium served as control.
3.6.2. Anti-inflammatory Activity
The RAW 264.7 cells (2 × 10⁵ cells/well) were incubated in 96-well culture plates with or without 1 µg/mL lipopolysaccharide (LPS, Sigma Chemical Co., USA) for 24 h in the presence or absence of the test compounds. Supernatant aliquots (50 µL) were then treated with 100 µL Griess reagent (Sigma Chemical Co., USA). The absorbance was measured at 570 nm by using a Synergy TMHT microplate reader (BioTek Instruments Inc., USA). In this study, NG-methyl-L-arginine acetate (L-NMMA, Sigma Chemical Co., USA) was used as a positive control. In the remaining medium, an MTT assay was carried out to determine whether the suppressive effect was related to cell viability. The inhibitory rate of nitric oxide (NO) production = (NO level of blank control – NO level of test samples)/NO level of blank control. The percentage of NO production was evaluated by measuring the amount of nitrite concentration in the supernatants with Griess reagent, as described previously [29].
3.6.3. Alpha-Glucosidase Inhibition Activity
The α-glucosidase inhibition was assessed according to the slightly modified method of Ma et al [30]. All samples were dissolved in DMSO at a concentration of 50 μM. The α-glucosidase (Sigma Chemical Co., USA) and substrate (4–Nitrophenyl α-D-glucopyranoside, PNPG, Sigma Chemical Co., USA) were dissolved in potassium phosphate buffer (0.1 M, pH 6.7). The samples were preincubated with α-glucosidase at 37 °C for 10 min. Then, PNPG was quickly added to the 96-well enzyme label plate to start the reaction, and the plate was incubated at 37 °C for 50 min. At the same time, a blank control without samples and a positive control of quercetin (10 mM) were set up. All samples were thoroughly mixed and analyzed in triplicate. The OD value was measured at 405 nm using a microplate reader. The inhibition percentage (%) was calculated by the following equation: Inhibition (%) = (1 – OD sample)/OD control blank × 100.
4. Conclusion
In this paper, three new pyranone derivatives (1–3) and a new bisabolane-type sesquiterpenoid (4) were discovered from the fungus Xylaria sp. Z184. Moreover, we co-isolated 14 previously-reported compounds (5–18), and reported the first complete set of spectroscopic data for pyranone 5. In vitro bioassays were performed with a number of the isolated compounds and crude fungal extract. Compounds 5, 7, and 8 were demonstrated to be weak growth inhibitors of Staphylococcus aureus subsp. Aureus, and the extract was shown to be a potent inhibitor of NO production in LPS-stimulated RAW 264.7 mouse macrophages, with an inhibition rate of 77.28 ± 0.82% at 50 μg/mL. Although the crude fungal extract showed certain inhibitory activity of NO production in LPS-stimulated RAW 264.7 mouse macrophages. Unfortunately, in the subsequent isolated compounds, no such convenient activity was found, which suggested that there may still be other structural types of compounds in the extract that exhibit anti-inflammatory activity. Anyway, in addition to revealing four novel compounds, this work enhances understanding of the structural diversity within the Xylaria metabolomes.
Supplementary Materials
The following supporting information can be downloaded at the website of this paper posted on Preprints.org, Figures S1–S79: 1D, 2D NMR spectra and HRESIMS of compounds 1–5.
Author Contributions
Yan Zhang carried out the isolation and data curation at leading degree. Yang Jin conducted the writing of original draft. Wensi Yan was responsible for fungal isolation, fermentation, and identification of the samples. Peishan Gu, and Ziqian Zeng contributed to data curation and analysis at supporting degree. Ziying Li, Guangtao Zhang, and Mi Wei contributed to the evaluation of antimicrobial activity. Yongbo Xue contributed to funding acquisition and project administration at leading degree. All authors read and approved the final manuscript.
Funding
This work was financially supported by the National Natural Science Foundation of China (No. 21977120 and 32270296), and the Key Basic Research Program of the Science, Technology and Innovation Commission of Shenzhen Municipality (JCYJ20200109142215045).
Institutional Review Board Statement
Not applicable.
Informed Consent Statement
Not applicable.
Data Availability Statement
The authors declare that all relevant data supporting the results of this study are available within in the article and its Supplementary Materials file.
Acknowledgments
The authors thank Dr. Xiaonian Li, Jianchao Chen, and the Shenzhen Bay Laboratory for their helpful assistance in NMR measurement. And we express our sincere thanks to Kunming Institute of Botany, Chinese Academy of Sciences for providing support in quantum chemical calculation.
Conflicts of Interest
The authors declare no conflict of interest.
Sample Availability
Samples of the compounds are not available from the authors.
References
- Newman, D.J.; Cragg, G.M. Natural products as sources of new drugs over the nearly four decades from 01/1981 to 09/2019. J. Nat. Prod. 2020, 83, 770–803. [Google Scholar] [CrossRef] [PubMed]
- Liu, H.; Tan, H.; Chen, Y.; Guo, X.; Wang, W.; Guo, H.; Liu, Z.; Zhang, W. Cytorhizins A-D, four highly structure-combined benzophenones from the endophytic fungus Cytospora rhizophorae. Org. Lett. 2019, 21, 1063–1067. [Google Scholar] [CrossRef] [PubMed]
- Han, W.B.; Wang, G.Y.; Tang, J.J.; Wang, W.J.; Liu, H.; Gil, R.R.; Navarro-Vázquez, A.; Lei, X.X.; Gao, J.M. Herpotrichones A and B, two intermolecular [4+2] adducts with anti-neuroinflammatory activity from a Herpotrichia Species. Org. Lett. 2020, 22, 405–409. [Google Scholar] [CrossRef] [PubMed]
- Yoiprommarat, S.; Unagul, P.; Suvannakad, R.; Klaysuban, A.; Suetrong, S.; Bunyapaiboonsri, T. Eremophilane sesquiterpenes from the mangrove fungus BCC 60405. Phytochem. Lett. 2019, 34, 84–90. [Google Scholar] [CrossRef]
- Wu, W.; Dai, H.; Bao, L.; Ren, B.; Lu, J.; Luo, Y.; Guo, L.; Zhang, L.; Liu, H. Isolation and Structural Elucidation of Proline-Containing Cyclopentapeptides from an Endolichenic Xylaria sp. J. Nat. Prod. 2011, 74, 1303–1308. [Google Scholar] [CrossRef] [PubMed]
- Xu, K.; Li, R.; Zhu, R.; Li, X.; Xu, Y.; He, Q.; Xie, F.; Qiao, Y.; Luan, X.; Lou, H. Xylarins A–D, two pairs of diastereoisomeric isoindoline alkaloids from the endolichenic fungus Xylaria sp. Org. Lett. 2021, 23, 7751–7754. [Google Scholar] [CrossRef] [PubMed]
- Chen, W.; Yu, M.; Chen, S.; Gong, T.; Xie, L.; Liu, J.; Bian, C.; Huang, G.; Zheng, C. Structures and Biological Activities of Secondary Metabolites from Xylaria spp. J. Fungi 2024, 10, 190. [Google Scholar] [CrossRef]
- Han, W.-B.; Zhai, Y.-J.; Gao, Y.; Zhou, H.-Y.; Xiao, J.; Pescitelli, G.; Gao, J.-M. Cytochalasins and an Abietane-Type Diterpenoid with Allelopathic Activities from the Endophytic Fungus Xylaria Species. J. Agric. Food Chem. 2019, 67, 3643–3650. [Google Scholar] [CrossRef]
- Jia, S.; Li, J.; Li, J.; Su, X.; Li, X.; Yao, Y.; Xue, Y. Anti-Neuroinflammatory Activity of New Naturally Occurring Benzylated Hydroxyacetophenone Analogs from the Endophytic Fungus Alternaria sp. J030. Chem. Biodivers. 2022, 19, e202200751. [Google Scholar] [CrossRef]
- Jia, S.; Su, X.; Yan, W.; Wu, M.; Wu, Y.; Lu, J.; He, X.; Ding, X.; Xue, Y. Acorenone C: A New Spiro-Sesquiterpene from a Mangrove-Associated Fungus, Pseudofusicoccum sp. J003. Front. Chem. 2021, 9. [Google Scholar] [CrossRef]
- Wu, Y.; Su, X.; Lu, J.; Wu, M.; Yang, S.Y.; Mai, Y.; Deng, W.; Xue, Y. In Vitro and in Silico Analysis of Phytochemicals From Fallopia dentatoalata as Dual Functional Cholinesterase Inhibitors for the Treatment of Alzheimer’s Disease. Front. Pharmacol. 2022, 13, 905708. [Google Scholar] [CrossRef] [PubMed]
- Yang, W.W.; Lu, L.W.; Zhang, X.Q.; Bao, S.S.; Cao, F.; Guo, Z.Y.; Deng, Z.S.; Proksch, P. Xylariaopyrones E-I, five new α-pyrone derivatives from the endophytic fungus Xylariales sp. (HM-1). Nat. Prod. Res. 2022, 36, 2230–2238. [Google Scholar] [CrossRef] [PubMed]
- Yamamoto, I.; Tai, A.; Fujinami, Y.; Sasaki, K.; Okazaki, S. Synthesis and Characterization of a Series of Novel Monoacylated Ascorbic Acid Derivatives, 6-O-Acyl-2-O-α-d-glucopyranosyl-l-ascorbic Acids, as Skin Antioxidants. J. Med. Chem. 2001, 45, 462–468. [Google Scholar] [CrossRef] [PubMed]
- Zhao, Q.; Wang, C.X.; Yu, Y.; Wang, G.Q.; Zheng, Q.C.; Chen, G.D.; Lian, Y.Y.; Lin, F.; Guo, L.D.; Gao, H. Nodulisporipyrones A-D, new bioactive α-pyrone derivatives from Nodulisporium sp. J. Asian Nat. Prod. Res. 2015, 17, 567–575. [Google Scholar] [CrossRef] [PubMed]
- Lichtenthaler, F.W.; Martin, D.; Weber, T.; Schiweck, H. Studies on Ketoses, 7–5-(α-D-Glucosyloxymethyl)furfural: preparation from isomaltulose and exploration of its ensuing chemistry. Eur. J. Org. Chem. 1993, 9, 967–974. [Google Scholar] [CrossRef]
- Miyazawa, M.; Nankai, H.; Kameoka, H. Biotransformation of (–)-α-bisabolol by plant pathogenic fungus, Glomerella cingulata. Phytochemistry 1995, 40, 69–72. [Google Scholar] [CrossRef]
- Xu, J. The preparation method and application of a pyranoid compound with immunosuppressive activity. CN 108913731. 2018.
- Cook, L.; Ternai, B.; Ghosh, P. Inhibition of human sputum elastase by substituted 2-pyrones. 2. J. Med. Chem. 1987, 30, 1017–1023. [Google Scholar] [CrossRef] [PubMed]
- Guo, Z.Y.; Lu, L.W.; Bao, S.S.; Liu, C.X.; Deng, Z.S.; Cao, F.; Liu, S.P.; Zou, K.; Proksch, P. Xylariaopyrones A-D, four new antimicrobial α-pyrone derivatives from endophytic fungus Xylariales sp. Phytochem. Lett. 2018, 28, 98–103. [Google Scholar] [CrossRef]
- Zhang, H.; Deng, Z.; Guo, Z.; Peng, Y.; Huang, N.; He, H.; Tu, X.; Zou, K. Effect of Culture Conditions on Metabolite Production of Xylaria sp. Molecules 2015, 20, 7940–7950. [Google Scholar] [CrossRef]
- Tian, J.F.; Yu, R.J.; Li, X.X.; Gao, H.; Guo, L.D.; Tang, J.S.; Yao, X.S. ¹H and ¹³C NMR spectral assignments of 2-pyrone derivatives from an endophytic fungus of sarcosomataceae. Magn. Reson. Chem. 2015, 53, 866–871. [Google Scholar] [CrossRef] [PubMed]
- Pérez-Castorena, A.-L.; Arciniegas, A.; Guzmán, S.L.; Villaseñor, J.L.; de Vivar, A.R. Eremophilanes from Senecio mairetianus and Some Reaction Products. J. Nat. Prod. 2006, 69, 1471–1475. [Google Scholar] [CrossRef] [PubMed]
- Arora, D.; Sharma, N.; Singamaneni, V.; Sharma, V.; Kushwaha, M.; Abrol, V.; Guru, S.; Sharma, S.; Gupta, A.P.; Bhushan, S.; et al. Isolation and characterization of bioactive metabolites from Xylaria psidii, an endophytic fungus of the medicinal plant Aegle marmelos and their role in mitochondrial dependent apoptosis against pancreatic cancer cells. Phytomedicine 2016, 23, 1312–1320. [Google Scholar] [CrossRef] [PubMed]
- Hallock, Y.F.; Clardy, J.; Kenfield, D.S.; Strobel, G. De-O-methyldiaporthin, a phytotoxin from Drechslera siccans. Phytochemistry 1988, 27, 3123–3125. [Google Scholar] [CrossRef]
- Feng, C.C.; Chen, G.D.; Zhao, Y.Q.; Xin, S.C.; Li, S.; Tang, J.S.; Li, X.X.; Hu, D.; Liu, X.Z.; Gao, H. New isocoumarins from a cold-adapted fungal strain Mucor sp. and their developmental toxicity to zebrafish embryos. Chem. Biodivers. 2014, 11, 1099–1108. [Google Scholar] [PubMed]
- Lin, Y.; Wu, X.; Feng, S.; Jiang, G.; Zhou, S.; Vrijmoed, L.; Jones, E. A novel N-cinnamoylcyclopeptide containing an allenic ether from the fungus Xylaria sp. (strain #2508) from the South China Sea. Tetrahedron Lett. 2001, 42, 449–451. [Google Scholar] [CrossRef]
- Bruhn, T.; Schaumlöffel, A.; Hemberger, Y.; Bringmann, G. SpecDis: Quantifying the comparison of calculated and experimental electronic circular dichroism spectra. Chirality 2013, 25, 243–249. [Google Scholar] [CrossRef] [PubMed]
- Zhang, N.; Shi, Z.; Guo, Y.; Xie, S.; Qiao, Y.; Li, X.N.; Xue, Y.; Luo, Z.; Zhu, H.; Chen, C.; Hu, L.; Zhang, Y. The absolute configurations of hyperilongenols A–C: rare 12,13-seco-spirocyclic polycyclic polyprenylated acylphloroglucinols with enolizable β, β′-tricarbonyl systems from Hypericum longistylum Oliv. Org. Chem. Front. 2019, 6, 1491–1502. [Google Scholar] [CrossRef]
- Wu, Y.; Xie, S.-S.; Hu, Z.-X.; Wu, Z.-D.; Guo, Y.; Zhang, J.-W.; Wang, J.-P.; Xue, Y.-B.; Zhang, Y.-H. Triterpenoids from Whole Plants of Phyllanthus urinaria. Chin. Herb. Med. 2017, 9, 193–196. [Google Scholar] [CrossRef]
- Ma, Y.-Y.; Zhao, D.-G.; Zhou, A.-Y.; Zhang, Y.; Du, Z.; Zhang, K. α-Glucosidase Inhibition and Antihyperglycemic Activity of Phenolics from the Flowers of Edgeworthia gardneri. J. Agric. Food Chem. 2015, 63, 8162–8169. [Google Scholar] [CrossRef]
Figure 1.
Chemical structures of compounds 1–18.
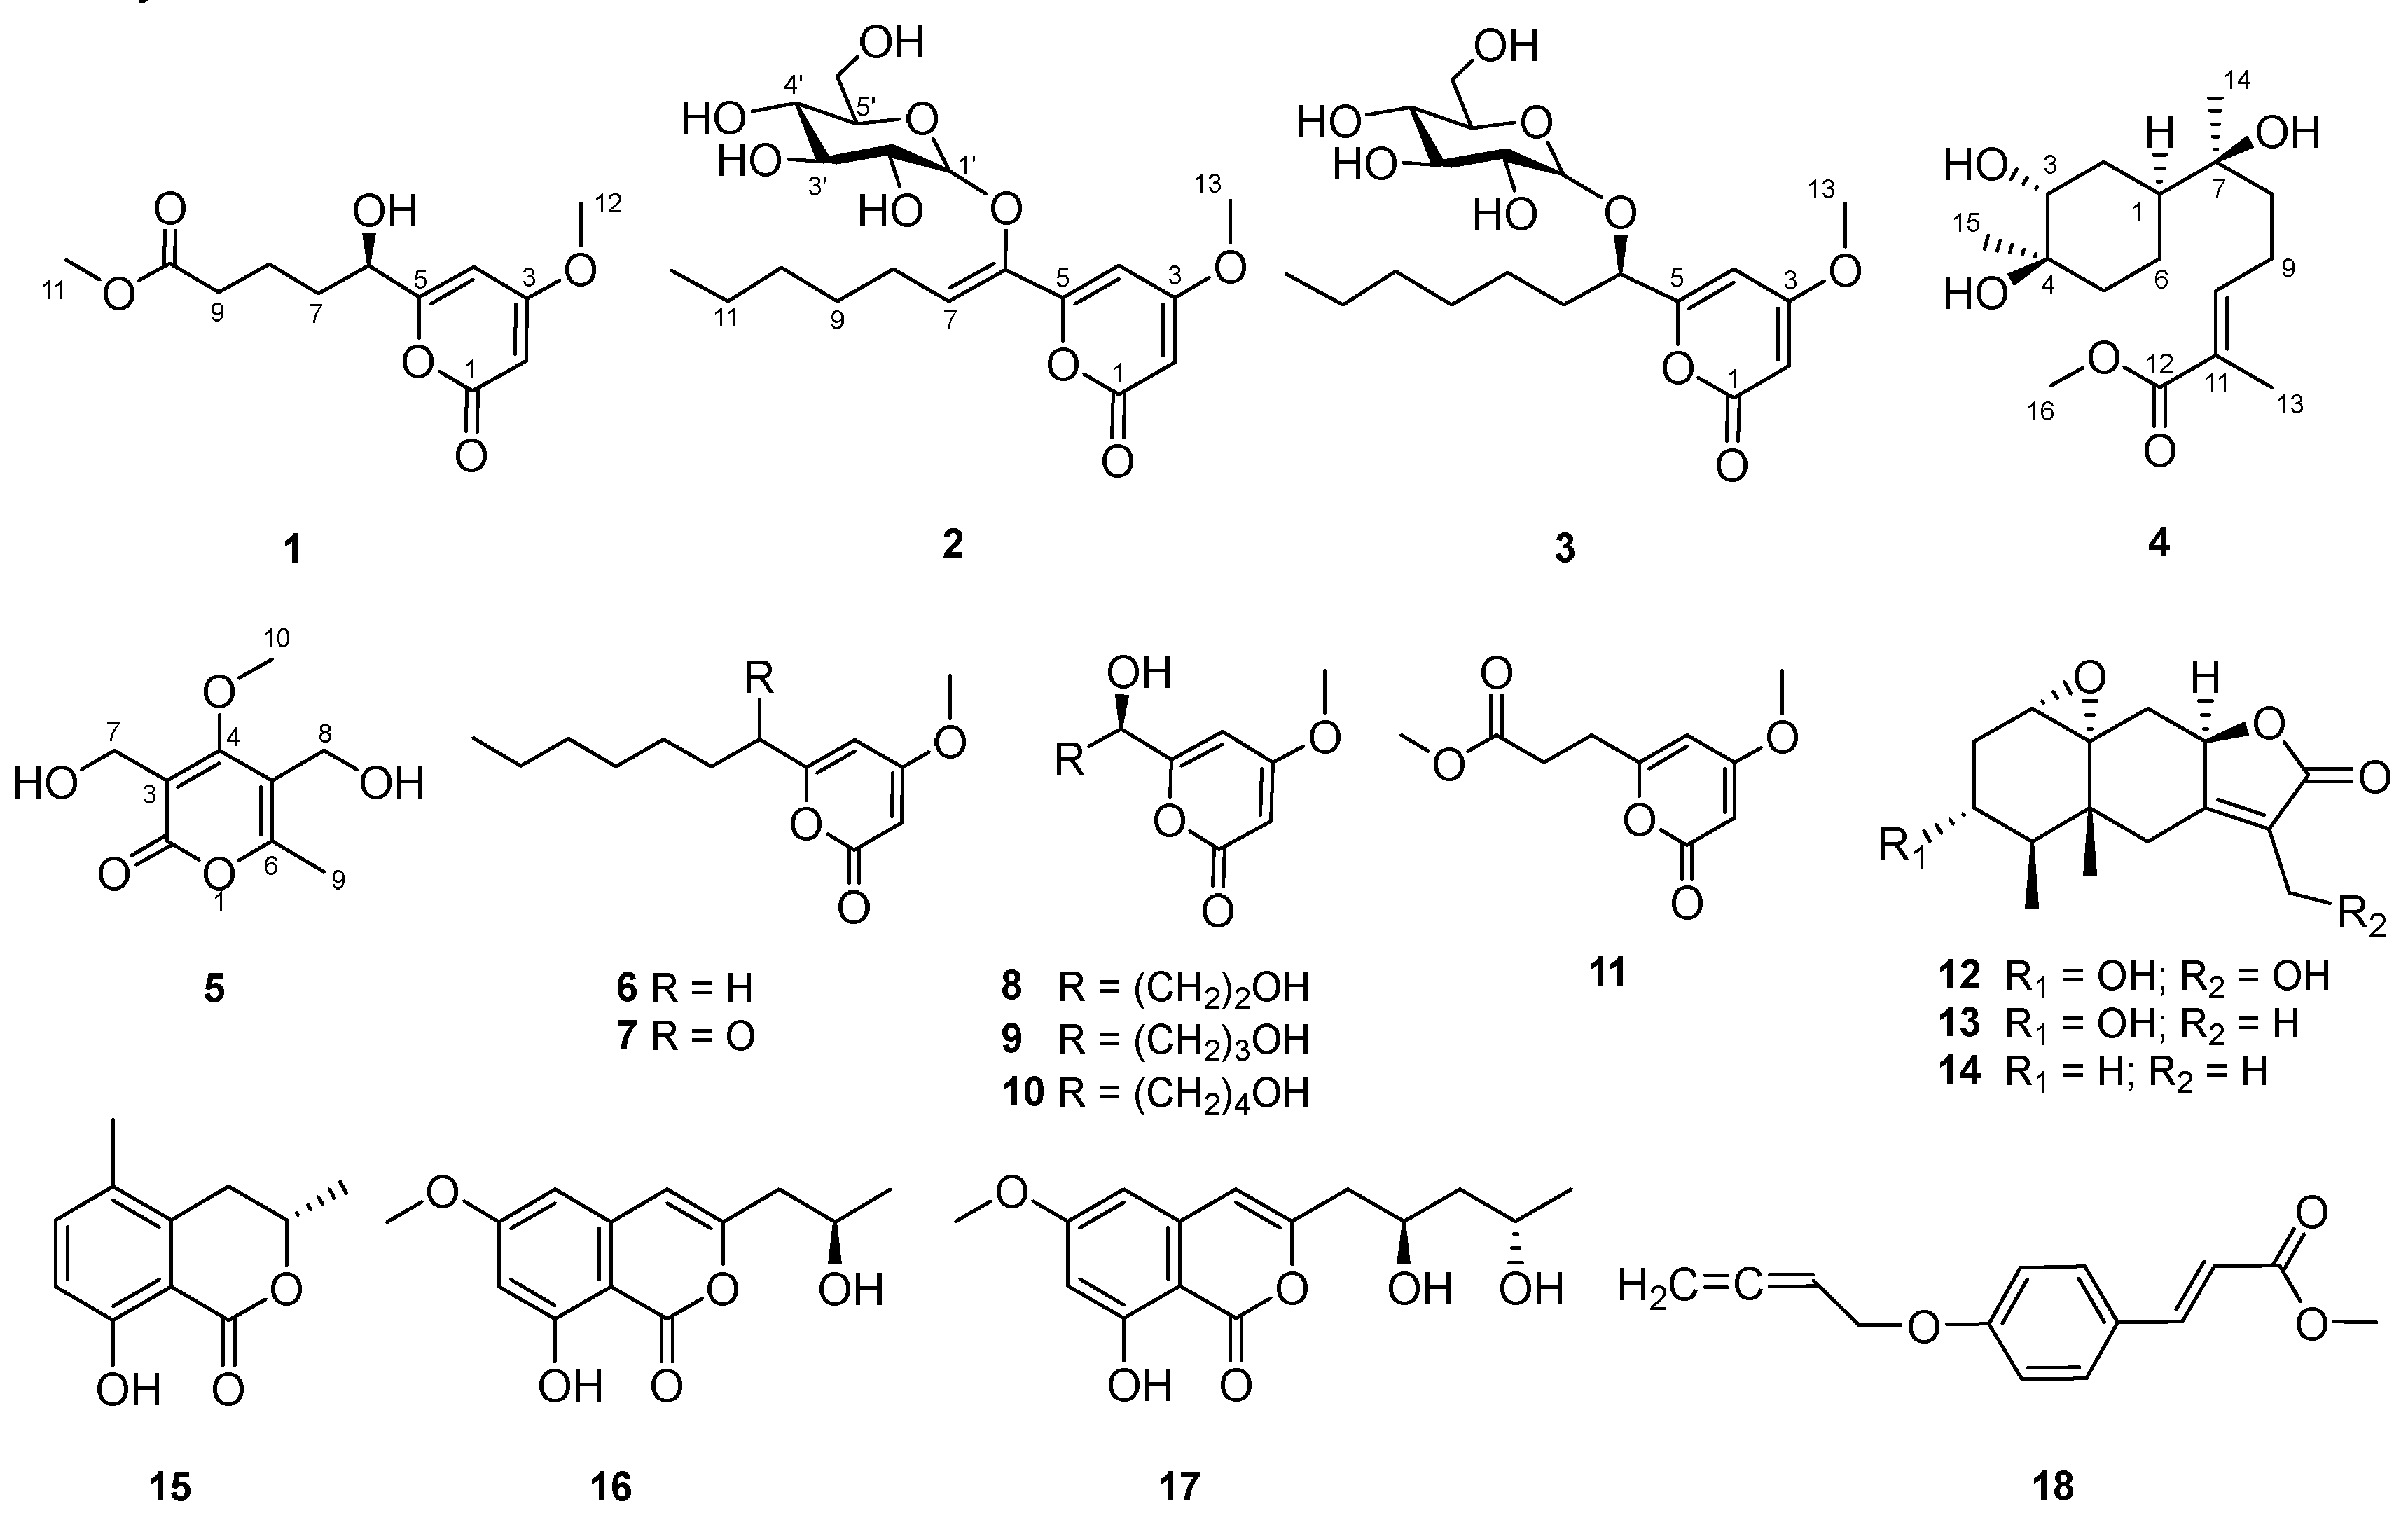
Figure 2.
The key 1H–1H COSY and HMBC correlations of 1–4.
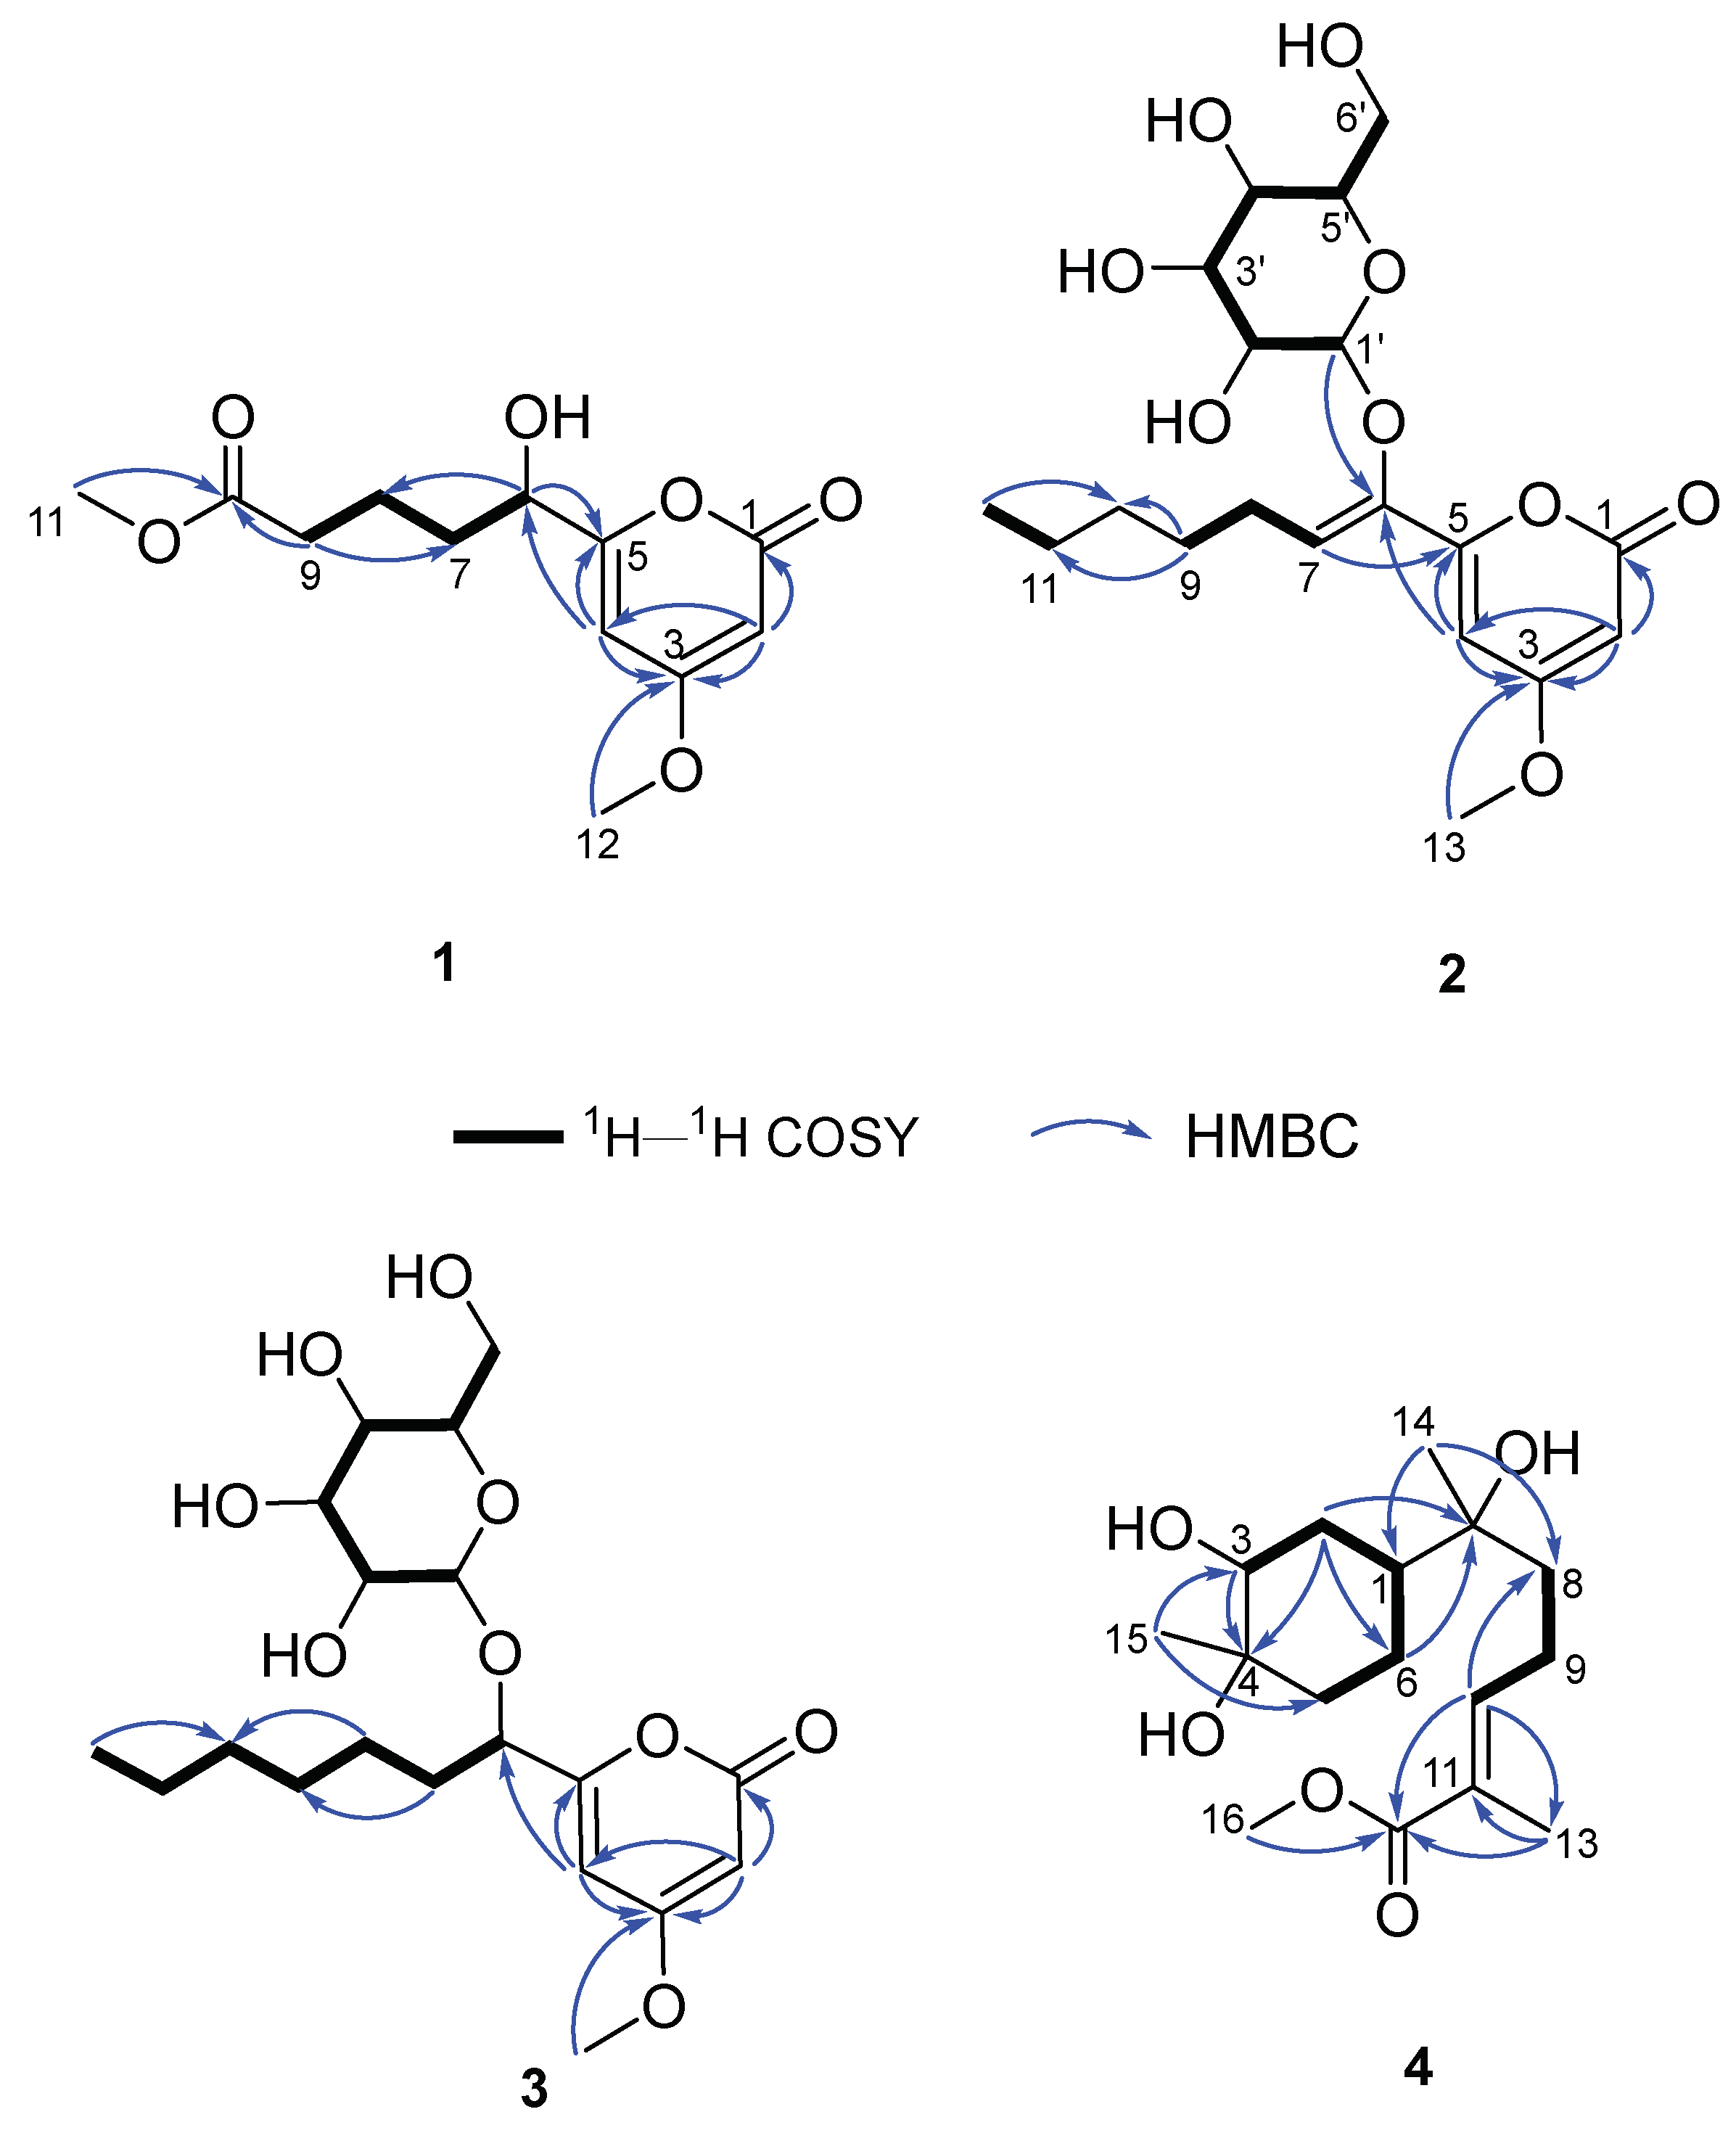
Figure 3.
Experimental ECD spectrum of fallopiaxylarester A (1) (black); calculated ECD of (6R)-1 (red); mirrored spectrum of calculated ECD (blue).
Figure 3.
Experimental ECD spectrum of fallopiaxylarester A (1) (black); calculated ECD of (6R)-1 (red); mirrored spectrum of calculated ECD (blue).
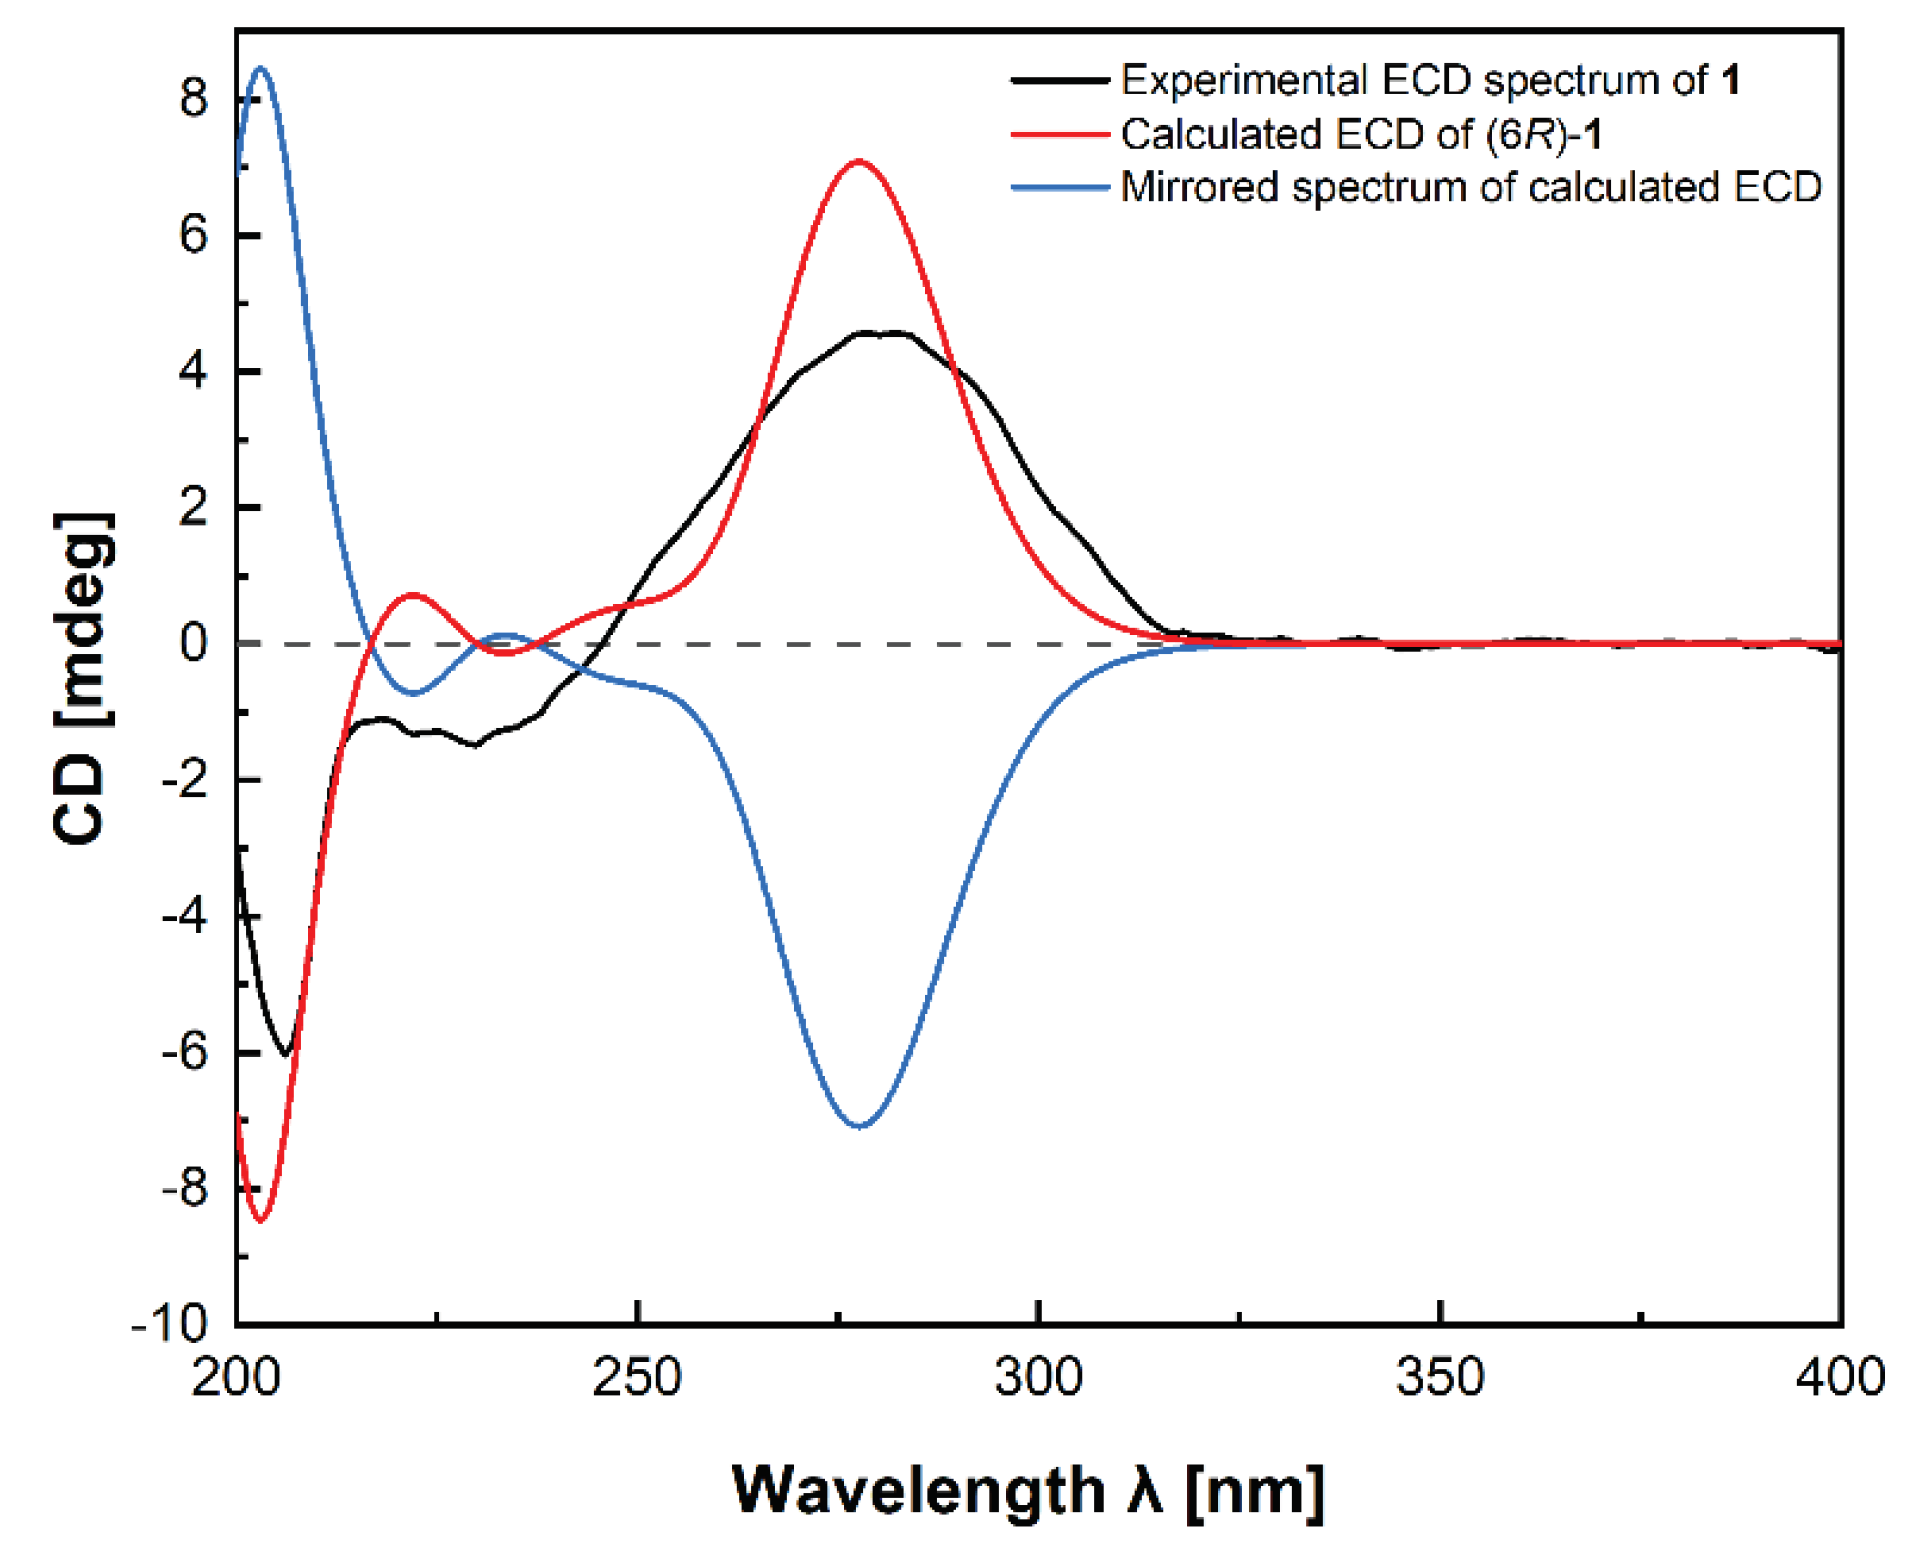
Figure 4.
1D-TOCSY spectra of compounds 2 (purple) and 3 (green).
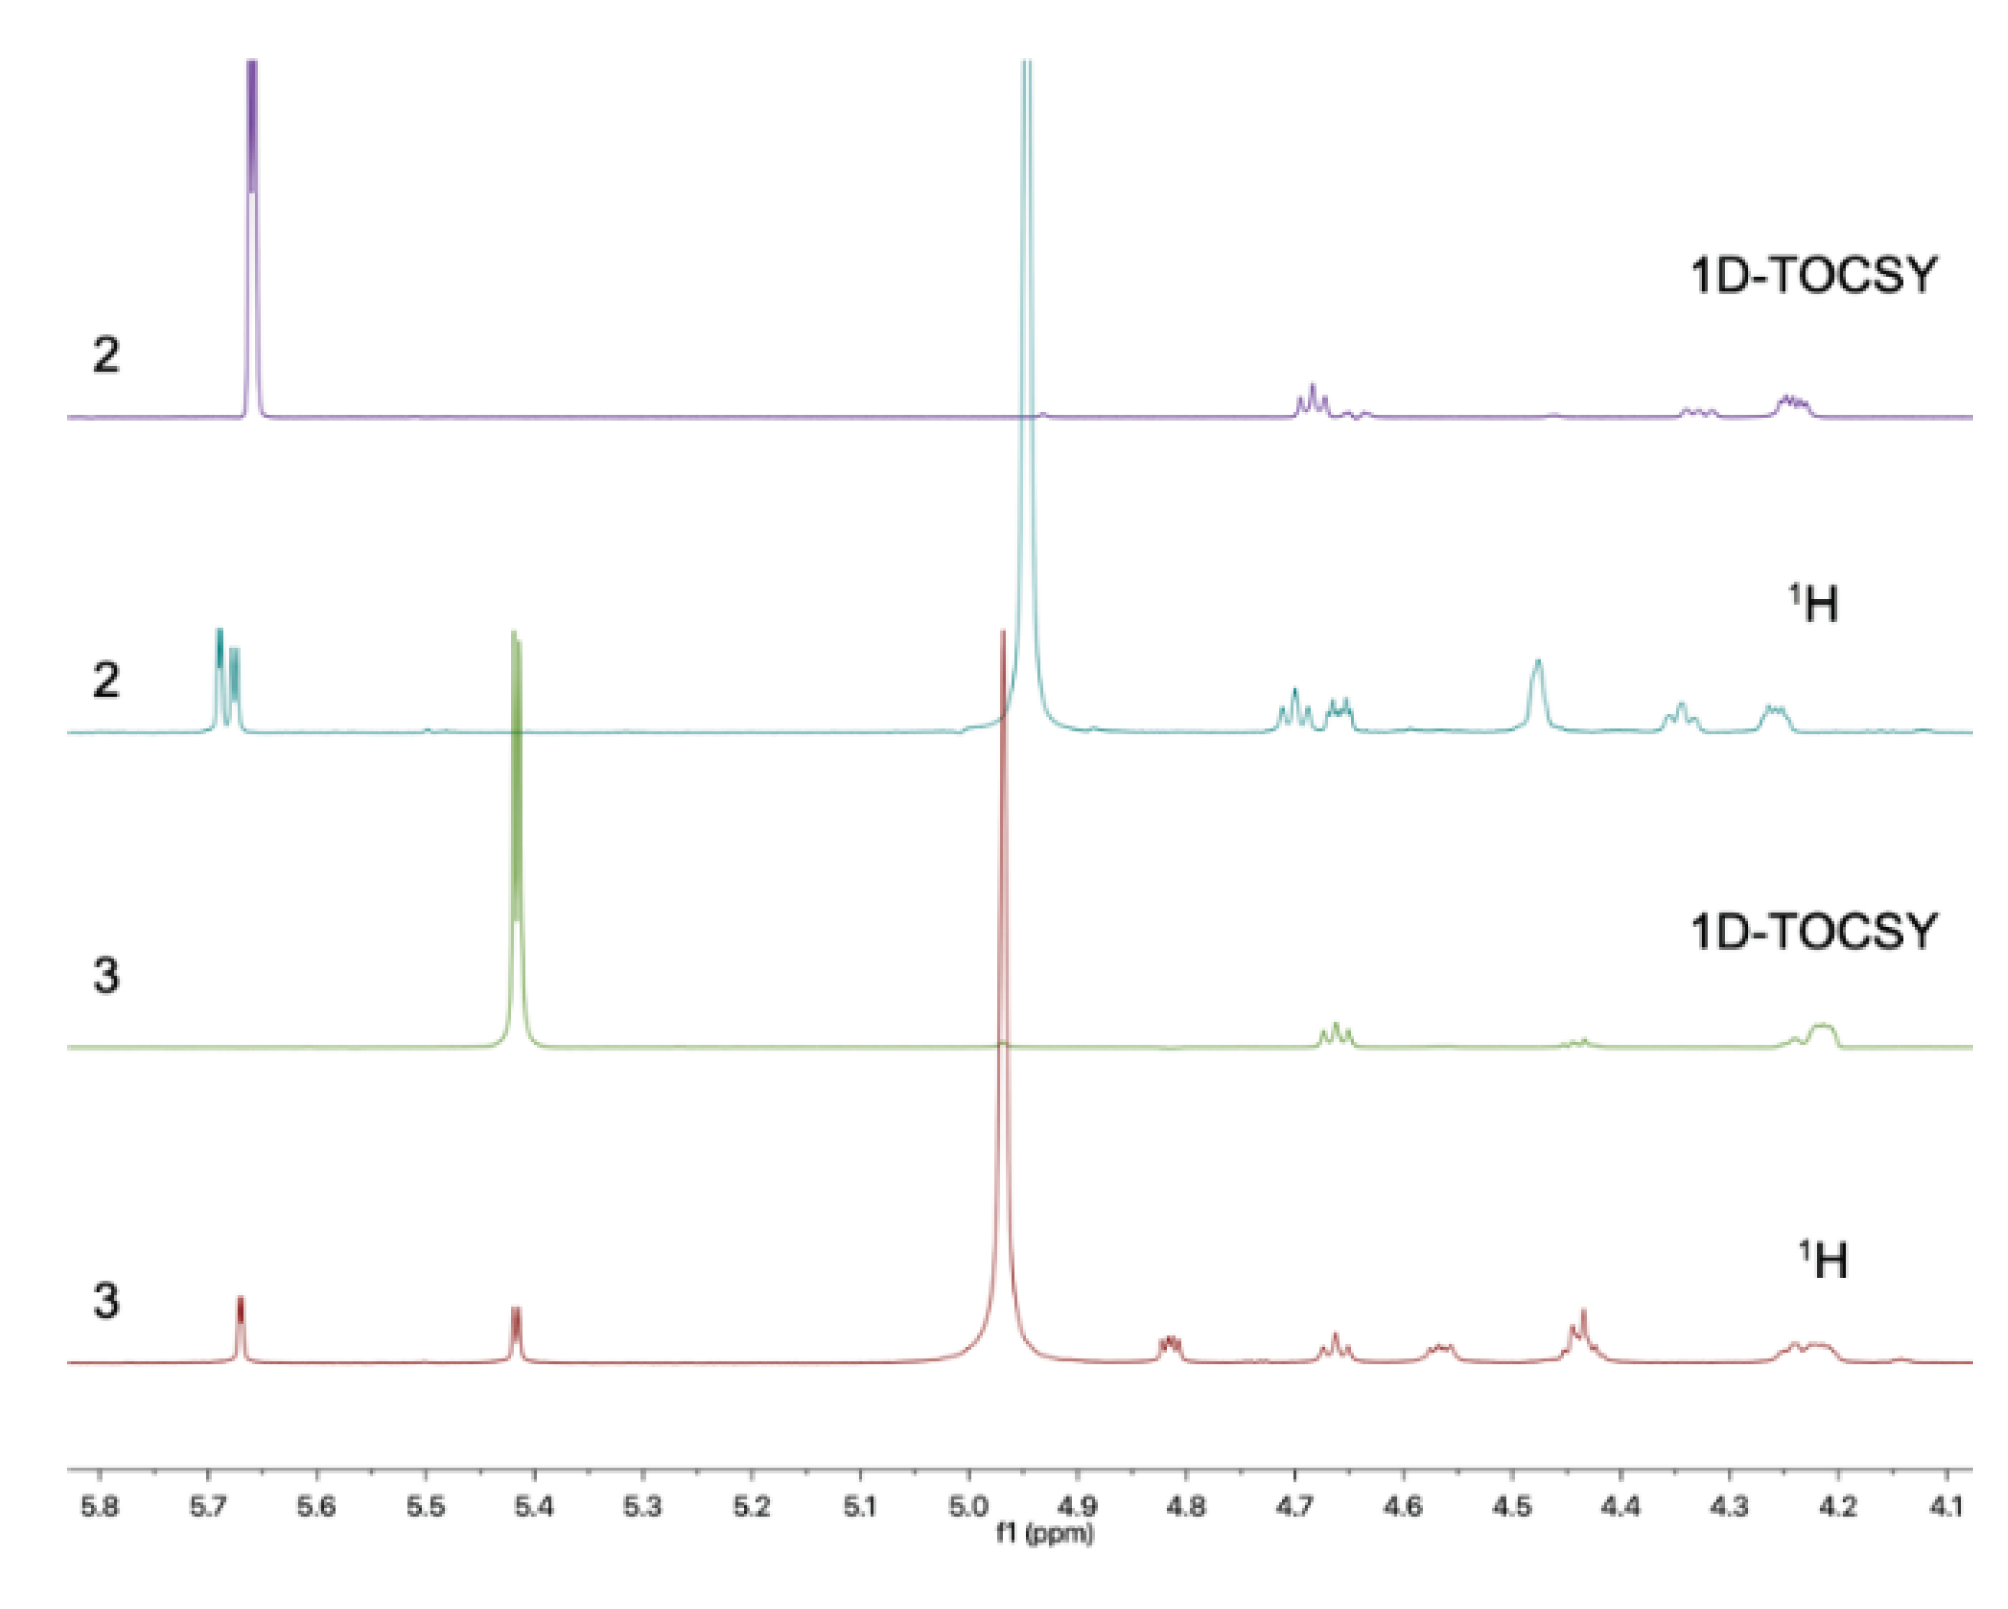
Figure 5.
Energy-minimized structures of 2 and 4 with the key ROESY correlations.
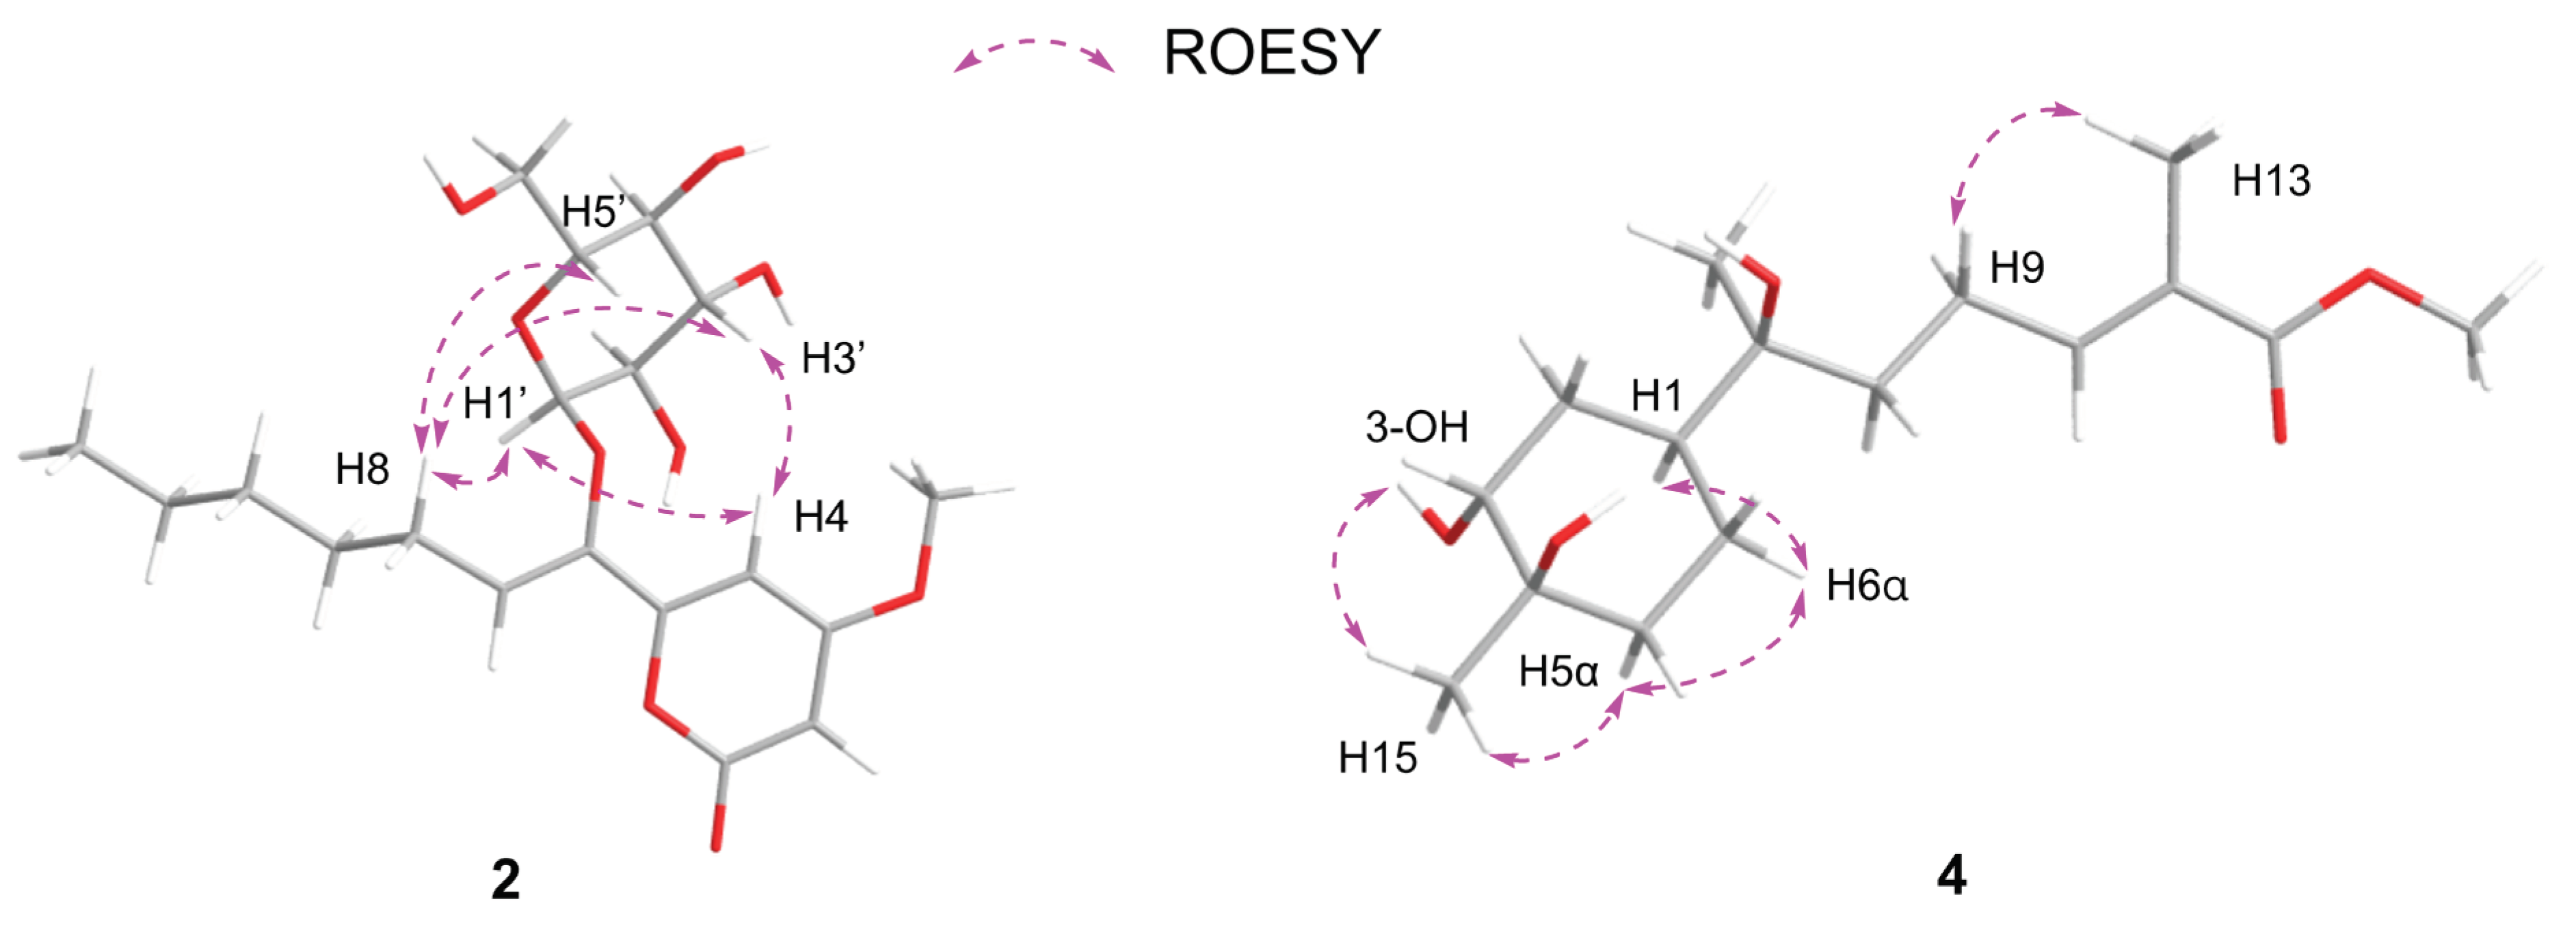
Table 1.
1H NMR (δH, 600 MHz) and 13C NMR (δC, 150 MHz) data for 1 in methanol-d4.
| No. | δH, mult (J Hz) | δC, Type |
| 1 | 167.0, C | |
| 2 | 5.56, d (2.1) | 88.6, CH |
| 3 | 173.8, C | |
| 4 | 6.22, d (2.1) | 99.9, CH |
| 5 | 168.7, C | |
| 6 | 4.35, dd (7.2, 4.8) | 70.7, CH |
| 7 | 1.83, m | 35.2, CH2 |
| 1.68, m, overlap | ||
| 8 | 1.76, m | 21.7, CH2 |
| 1.69, m, overlap | ||
| 9 | 2.38, t (6.7) | 34.4, CH2 |
| 10 | 175.6, C | |
| 11 | 3.66, s | 52.0, CH3 |
| 12 | 3.87, s | 57.0, CH3 |
Table 2.
1H NMR (δH, 600 MHz) and 13C NMR (δC, 150 MHz) data for 2.
| No. | δH, mult (J Hz)a | δC, Typea | δH, mult (J Hz)b | δC, Typeb | δH, mult (J Hz)c | δC, Typec |
| 1 | 166.7, C | 164.1, C | 162.7, C | |||
| 2 | 5.59, d (2.2) | 89.4, CH | 5.70, d (2.2) | 89.7, CH | 5.61, d (2.2) | 88.6, CH |
| 3 | 174.0, C | 172.3, C | 171.2, C | |||
| 4 | 6.95, d (2.2) | 100.2, CH | 7.64, d (2.2) | 99.7, CH | 6.98, d (2.2) | 98.3, CH |
| 5 | 157.9, C | 157.5 C | 155.8, C | |||
| 6 | 145.8, C | 146.1, CH | 144.3, C | |||
| 7 | 6.07, t (7.5) | 125.0, CH | 6.24, t (7.5) | 123.6, CH | 5.91, t (7.5) | 122.8, CH |
| 8 | 2.42, m | 27.1, CH2 | 2.61, q (7.5) | 26.9, CH2 | 2.33, dd (15.0, 7.6) | 25.3, CH2 |
| 9 | 1.48, m | 30.0, CH2 | 1.33, m | 29.7, CH2 | 1.39, m | 28.4, CH2 |
| 10 | 1.36, m, overlap | 32.8, CH2 | 1.19, m, overlap | 32.3, CH2 | 1.28, m, overlap | 31.1, CH2 |
| 11 | 1.37, m, overlap | 23.6, CH2 | 1.18, m, overlap | 23.2, CH2 | 1.29, m, overlap | 22.0, CH2 |
| 12 | 0.92, t (6.9) | 14.4, CH3 | 0.75, t (7.0) | 14.6, CH3 | 0.87, t (6.9) | 13.9, CH3 |
| 13 | 3.87, s | 57.0, CH3 | 3.60, s | 56.5, CH3 | 3.81, s | 56.4, CH3 |
| 1' | 5.12, d (3.7) | 102.8, CH | 5.68, d (3.7) | 103.4, CH | 4.96, d (3.7) | 101.3, CH |
| 2' | 3.53, dd(10.0, 3.7) | 73.4, CH | 4.27, dd (10.5, 4.1) | 74.0, CH | 3.32, m, overlap | 71.7, CH |
| 3' | 3.78, t (9.3) | 74.4, CH | 4.71, t (9.3) | 75.2, CH | 3.70, m | 72.5, CH |
| 4' | 3.45, t (9.3) | 71.0, CH | 4.35, t (10.0) | 71.9, CH | 3.22, m | 69.4, CH |
| 5' | 3.90, m | 75.5, CH | 4.66, dt (10.0, 3.5) | 76.8, CH | 3.54, m, overlap | 74.7, CH |
| 6' | 3.76, m | 62.1, CH2 | 4.48, br s | 62.9, CH2 | 3.55, m, overlap | 60.3, CH2 |
| 2'-OH | 5.52, d (4.9) | |||||
| 3'-OH | 5.10, m | |||||
| 4'-OH | 5.10, m | |||||
| 6'-OH | 4.53, t (5.8) |
aMeasured in methanol-d4, bmeasured in pyridine-d5, cmeasured in DMSO-d6.
Table 3.
1H NMR (δH, 600 MHz) and 13C NMR (δC, 150 MHz) data for 3.
| No. | δH, mult (J Hz)a | δC, Typea | δH, mult (J Hz)b | δC, Typeb | δH, mult(J Hz)c | δC, Typec |
| 1 | 167.1, C | 164.5, C | 164.2, C | |||
| 2 | 5.57, d (2.2) | 89.1, CH | 5.68, d (2.3) | 89.1, CH | 5.57, d (2.2) | 88.0, CH |
| 3 | 173.6, C | 171.9, C | 170.9, C | |||
| 4 | 6.55, d (2.2) | 101.9, CH | 6.99, d (2.3) | 100.5, CH | 6.50, d (2.2) | 99.4, CH |
| 5 | 165.5, C | 165.8, C | 163.3, C | |||
| 6 | 4.52, t (6.2) | 75.3, CH | 4.82, dd (7.8, 4.4) | 74.8, CH | 4.38, dd (6.8, 4.8) | 72.9, CH |
| 7 | 1.85, dd(14.0, 7.6) | 35.1, CH2 | 1.89, m | 35.2, CH2 | 1.70, m | 33.5, CH2 |
| 1.84, m | ||||||
| 8 | 1.43, m | 26.2, CH2 | 1.51, m | 26.2, CH2 | 1.32, m | 24.4, CH2 |
| 9 | 1.35, m | 30.1, CH2 | 1.18, m, overlap | 29.7, CH2 | 1.27, m, overlap | 28.4, CH2 |
| 1.33, m | 1.10, m, overlap | |||||
| 10 | 1.31, m, overlap | 32.8, CH2 | 1.08, m, overlap | 32.2, CH2 | 1.23, m, overlap | 31.1, CH2 |
| 11 | 1.32, m, overlap | 23.7, CH2 | 1.16, m, overlap | 23.3, CH2 | 1.25, m, overlap | 22.0, CH2 |
| 12 | 0.90, t (6.8) | 14.4, CH3 | 0.78, t (7.3) | 14.7, CH3 | 0.85, t (6.8) | 14.0, CH3 |
| 13 | 3.87, s | 57.0, CH3 | 3.63, s | 56.4, CH3 | 3.81, s | 56.4, CH3 |
| 1' | 4.80, d (3.8) | 98.5, CH | 5.42, d (3.8) | 99.3, CH | 4.66, d (3.8) | 97.2, CH |
| 2' | 3.41, dd (9.8, 3.8) | 73.2, CH | 4.22, dd (9.6, 3.8) | 74.0, CH | 3.22, m | 71.5, CH |
| 3' | 3.68, m, overlap | 74.8, CH | 4.67, t (9.6) | 75.6, CH | 3.45, m, overlap | 73.7, CH |
| 4' | 3.29, m | 71.7, CH | 4.24, t (9.6) | 72.6, CH | 3.07, m | 70.1, CH |
| 5' | 3.68, m, overlap | 74.6, CH | 4.44, t (9.6) | 75.8, CH | 3.45, m, overlap | 73.0, CH |
| 6' | 3.68, m, overlap | 62.7, CH2 | 4.57, dd (9.6, 5.6) | 63.3, CH2 | 3.61, m | 60.9, CH2 |
| 3.83, m | 4.43, m | 3.45, m, overlap | ||||
| 2'-OH | 5.04, d (5.9) | |||||
| 3'-OH | 4.92, d (4.1) | |||||
| 4'-OH | 4.99, d (5.2) | |||||
| 6'-OH | 4.52, t (5.4) |
aMeasured in methanol-d4, bmeasured in pyridine-d5, cmeasured in DMSO-d6.
Disclaimer/Publisher’s Note: The statements, opinions and data contained in all publications are solely those of the individual author(s) and contributor(s) and not of MDPI and/or the editor(s). MDPI and/or the editor(s) disclaim responsibility for any injury to people or property resulting from any ideas, methods, instructions or products referred to in the content. |
© 2024 by the authors. Licensee MDPI, Basel, Switzerland. This article is an open access article distributed under the terms and conditions of the Creative Commons Attribution (CC BY) license (http://creativecommons.org/licenses/by/4.0/).
Copyright: This open access article is published under a Creative Commons CC BY 4.0 license, which permit the free download, distribution, and reuse, provided that the author and preprint are cited in any reuse.


