Submitted:
02 April 2024
Posted:
03 April 2024
You are already at the latest version
Abstract
This study investigates the mean annual water temperature trends at the confluence of the Sava and Danube Rivers, along with air temperature trends at the Belgrade meteorological station, spanning from 1956 to 2020. Results reveal a consistent increase in temperature across all three measuring stations, with the Danube experiencing a rise of 0.34°C/10 years, the Sava at 0.44°C/10 years, and Belgrade's air temperature increasing by 0.39°C/10 years. Employing the RAPS method, sharp rises in water temperature were pinpointed in 1989 for the Sava and 1990 for the Danube, while Belgrade's air temperature surge began in 1998. The highest intensity of air temperature increase within the recent period (1998-2020) was observed at the Belgrade observatory, reaching 0.76°C/10 years. Notably, the Sava exhibited a faster increase in water temperature over the last thirty years compared to the Danube. August marked the peak average water temperature for both rivers, while July recorded the highest average air temperature in Belgrade. Despite differing flow rates, both rivers exhibit similar hydrological regimes, with maximum flows occurring in April and minimum flows in August for the Sava, and October for the Danube. Seasonal temperature increases were most pronounced in summer, notably in August, with the smallest rises occurring during cold periods. Additionally, an inverse proportional relationship between mean annual water temperatures and discharges was observed at both river stations.
Keywords:
air temperature
; water temperature
; time series
; trend analysis
; climate change
; Sava River
; Danube River
; confluence
; Belgrade
; Serbia
1. Introduction
Climate change, particularly global warming, has far-reaching consequences on a planetary scale, notably evident in the increasing temperatures of both air and river water (Rabi et al., 2015). This phenomenon affects diverse aspects of life on Earth, garnering interest not only from climatologists and geophysicists but also from economists, politicians, and sociologists [1,2,3,4]. It's crucial to recognize that the manifestation of the warming process varies across locations, influenced by both natural and anthropogenic factors. Consequently, accurate determination of the respective contributions of natural and human-induced impulses to warming is essential for each region [5,6,7,8,9,10,11,12,13,14]. For instance, Talke et al. analyze the temperature increase of the Willamette River in Oregon [15], USA, concluding that approximately 30% of the rise is attributed to system changes, while 70% is attributed to the warming air temperature, indicative of climate change.
River water temperature, an obvious indicator of climate change, significantly affects all physical, chemical, and biological processes within riverbeds and throughout the basin, particularly in large rivers. The escalating trend of global warming has led to a substantial increase in water temperatures worldwide [11,16,17,18,19,20,21,22,23,24,25,26,27]. Water temperature serves as a vital indicator of river health and vulnerability [28,29]. Seyedhashemi et al. detailed daily discharge and water temperature reconstructions from 1963 to 2019 along with projections spanning from 1976 to 2100, for 52,278 reaches across the Loire River basin in France (117,000 km2) [30],. The water temperature of rivers increased across nearly all reaches and seasons from 1963 to 2019, with the most significant increases observed in spring and summer, with median increases of 0.38 ºC and 0.44 ºC per decade, respectively.
Insufficient attention is often given to the profound impact of rising river water temperatures on societal and social processes in areas surrounding watercourses, where much of the global population resides [31,32,33]. These detrimental situations primarily occur during warm, rainless periods characterized by low river water levels [34]. Mohseni and Stefan underscore water temperature as a primary factor in studies on the potential effects of global climate change on freshwater ecosystems [35]. Van Vliet et al. predict an increase in river water temperature and a decrease in low flows in many regions worldwide [36]. Consequently, this could lead to increased deterioration of water quality and freshwater habitats, along with reduced availability of water for human consumption and drinking water production.
River water temperature extremes are significantly influenced during drought events [37]. This is a consequence of the combined effects of intense solar radiative forcing and lower river discharges. During drought episodes, flow depths and velocities are reduced, as well as the river's thermal buffering capacity. Tong et al. found that global lakes are warming slower than surface air temperature due to accelerated evaporation [38]. Nam et al. indicate that spatial and temporal differences in thermal responses of stream water temperature to water levels are controlled by catchment-scale effects under rapidly changing rainfall patterns [39]. Analyzing lake surface water temperatures for 92,245 lakes during the 1981-2020 period, Tong et al. concluded that global lake surface water temperature is warming slower than surface air temperature due to accelerated evaporation [38].
Understanding the response processes and mechanisms of climate change and human activities is imperative for assessing the sustainable development of river ecological environments [40]. These findings are crucial for guiding water resource management, protecting river eco-hydrological processes, and comprehending their impact on aquatic ecology. Restoring riparian vegetation and shading can mitigate future increases in river water temperature [6,41,42]. Perry et al. suggest that this approach can alleviate the impacts of climate change on flood damage to human infrastructure, riparian biodiversity, ecosystem vulnerability, and changes in river discharge [43].
Caissie categorized the factors influencing river water temperature into four groups: atmospheric (including solar radiation, air temperature, wind speed, precipitation, evaporation, and condensation); topographic (involving the altitude, latitude, orientation of the flow, riparian vegetation, and subsoil); hydrologic (encompassing discharge, flow velocity, stream depths, width of the water surface, level, and groundwater temperatures); and anthropogenic (influenced by the discharge of urban and industrial wastewater, reductions in flow, artificial reservoirs and diversion canals, removal of riparian vegetation, etc.) [6].
This paper will analyze the specific case of the development of water and air temperature processes at the confluence of the Sava River and the Danube in Belgrade (Serbia). This area represents an important and sensitive environment where the water masses of two large European rivers intersect with the urban area of a rapidly expanding city. It is essential to recognize that these rivers flow through different climatic regions of Europe and meet in the heart of Belgrade, Serbia's capital. Thus, these rivers are an integral part of the city's urban structure. A detailed study and understanding of the trends in air and water temperature of both the Danube and Sava rivers is vital for ensuring the sustainable development of Belgrade.
2. Materials and Methods
2.1. Study Area
After the Volga, the Danube stands as the second-largest European river, with a basin area of 817,000 km² and a total length of 2850 km. At its confluence with the Black Sea, the Danube has an average flow of 6700 m³/s. The Danube basin area up to the confluence with the Sava is 412,800 km². The geographical coordinates of the Sava and Danube confluence are 40°49′27″N - 20°26′38″E. At the confluence point, the Danube's average flow is estimated at 3600 m³/s, and the distance to the Black Sea is 1,170 km.
The Sava River, the largest tributary of the Danube in terms of water volume, has an average annual flow of around 1720 m³/s at its confluence near Belgrade. With a catchment area of 95,179 km² and a length of 945 km, the Sava is smaller than the Tisa River, which has a catchment area of 157,183 km² and a length of 1,358 km. The mean elevation of the Sava River Basin varies from 2,864 m above sea level (a.s.l.) to 70 m a.s.l. at its confluence with the Danube in Belgrade, Serbia. The Sava River basin is home to 8.1 million people across six countries.
At the confluence of the Sava and the Danube (Figure 1), a distinct contrast in water colour is noticeable, indicating the distinct origins of the rivers' waters. This difference is most evident during low water levels in the summer months.
It's important to note the considerable pressures faced by both the Danube River and the Sava River due to various anthropogenic activities and procedures. The Danube, which courses through nine countries, contends with significant challenges arising from these activities. Similarly, the Sava River, with a basin extending across six countries in Southeastern Europe, faces a comparable situation. Figure 2A schematically illustrates the positions of the water measuring stations where water temperatures are monitored along the Danube and Sava rivers. This figure provides values for their datum plane "0" in meters above sea level (m a.s.l.) and the respective basin area A in square kilometres (km2).
The literature on the Danube River and its catchment water temperature is extensive [7,44,45,46,47,48,49,50,51,52].
Analysis of Danube water temperature in Austria by Webb and Nobilis concluded that there were significant increases in annual mean values, closely following changes in air temperature [44]. They also suggest that characteristics of the catchment area influence trends in seasonal mean values. Contrasts were observed between sites in a headwater tributary, at the outlet of a catchment with a substantial lake area, and on the mainstream of the Danube. Additionally, evidence suggests that inter-annual variations in water temperature were influenced by the climate pattern of the North Atlantic Oscillation, particularly during the winter months.
The Danube River section in Serbia spans a total length of 587.5 km. During periods of low water flow, the river stretch downstream of Novi Sad is impacted by the Iron Gate backwater [53]. Trend analysis of a 70-year time series (1951-2019) for annual characteristic water levels, including minimum, mean, and maximum values, confirmed a decreasing trend across all parameters [54]. River regulation activities, industrial dredging, and reductions in natural sediment load are identified as the primary factors driving this decline [55]. However, the time series for characteristic annual discharges showed neither an increasing nor decreasing trend.
Belgrade, the capital of the Republic of Serbia, is situated at the confluence of the Sava River and the Danube River, marking the boundary between Southeast and Central Europe. As per the 2022 population census, the city is home to 1,685,563 inhabitants. The climate in the broader Belgrade area is classified as continental [56]. According to the Köppen-Geiger scheme developed by Köppen and Geiger in 1936, Belgrade's climate falls under the Cfa category [57]. In this classification: C indicates that the temperature of the warmest month is equal to or greater than 10°C, and the temperature of the coldest month is less than 18°C but greater than -3°C; f denotes precipitation that is fairly evenly distributed throughout the year; and a indicates that the temperature of the warmest month is 22°C or above [58].
An analysis of air temperatures recorded at 64 stations across Serbia from 1961 to 2010 revealed a trend of increasing temperatures in line with observations across Europe [59]. Ruml et al. further examined the correlation between annual temperature indices and large-scale circulation features at 26 Serbian meteorological stations over the same period [60]. They found that the average annual maximum temperature at these stations exhibited a decreasing trend from 1961 to 1980 but a significant increasing trend from 1981 to 2010, with a regional average rate of 0.56°C per decade. Their analysis also showed that the East Atlantic pattern demonstrated a stronger association with the examined indices compared to the North Atlantic Oscillation and the East Atlantic/West Russia pattern.
A noticeable impact of the urban heat island effect in Belgrade is evident in the significant rise in the average annual mean temperature [61,62]. At the beginning of the century, this increase averaged 0.04°C per year, whereas in the last six decades, it amounted to 0.09°C. This escalation can be attributed to the rapid population growth and extensive developmental activities within the city. Notably, the UHI effect attains its peak values during the winter season. Comparatively, during the period from 1961 to 1990, Belgrade's average annual temperature was 0.4 to 1.0°C higher than that of smaller surrounding cities [61]. The water temperature of the Sava River is significantly influenced by the thermal power plant located in Obrenovac, which releases a portion of its water into the river. Consequently, the Sava River does not freeze, even during the coldest days of winter. The thermal power plant in Obrenovac is situated on the Sava River, approximately 20 km upstream from its confluence with the Danube. The first block of this thermal power plant commenced operations in March 1970.
2.2. Materials
The paper undertook an analysis of the mean annual and monthly water temperatures of the Sava and Danube rivers at their confluence, along with air temperatures in Belgrade, Serbia's capital, spanning 65 years (1956-2020). Mean daily water and air temperatures were collected for each year in a temperature time series, and the annual and monthly averages of these values were calculated.
At the confluence of the Sava and the Danube in Belgrade, flow measurements are not taken for either river. Therefore, the paper utilized Sava flow data from the Sremska Mitrovica water measuring station. The Sava basin area up to Sremska Mitrovica encompasses 87,996 km², accounting for 92.45% of the Sava basin before its confluence with the Danube. For the Danube, flow data from the Bogojevo water station (area: 251,593 km²) were utilized, supplemented by the flows of the Tisza near Senta (area: 141,715 km²). This approach covers 95.29% of the area of the Danube basin before its confluence with the Sava. Figure 2B illustrates the positions of the water measuring stations where flow data were obtained for this study.
All data used in the analysis were sourced from the Republic Hydrometeorological Service of Serbia in Belgrade.
2.3. Methods
The time series of mean annual water and air temperatures were analyzed using the Rescaled Adjusted Partial Sums (RAPS) method [63]. The expression for the calculations RASP is given by:
where Qav is the average value of the analyzed time series consisting of n members, and σQ denotes the standard deviation of the same series. The counter k=1,2..., n represents the summation index.
Linear trend time series were computed, and in one instance, a parabolic trend was considered. The regression line equation for the linear trend of the analyzed time series is as follows:
Here, Y denotes one of the five parameters in the year t, while a and b represent linear regression coefficients calculated using the least squares method. The coefficient a represents the slope of the regression line, measured in degrees Celsius per year during the analyzed time series. It indicates the average intensity of the trend of increasing or decreasing values of the analyzed time series.
Determination coefficients R2 were defined for linear trends, while correlation index IR2 was calculated for parabolic trends. The statistical significance of linear trends was assessed using the Mann-Kendall test [64,65,66].
The F-test and t-test were utilized to determine the statistical significance of differences between the variances and average values of adjacent time sub-periods. The F-test was employed to assess the statistical significance of the variances, while the t-test was used to evaluate the statistical significance of the average values of two adjacent time sub-periods [67]. Probability values p<0.01 and 0.01<p<0.05 were utilized as the levels of statistical significance for the differences in all three tests.
3. The Analysis of Mean Annual Water and Air Temperatures
The series of mean annual water temperatures of the Danube (blue), Sava (red), and the air temperature of Belgrade (green) for the period 1956-2020 are presented in Figure 3. The directions of the increasing trends are illustrated, along with their respective linear regression expressions. Additionally, the values of the determination coefficients (R2) and the probability values (p) determined by the Mann-Kendall (M-K) test are provided.
During the 65 years analyzed (1956-2020), the average values of mean annual water temperatures were recorded as 13.7ºC for the Sava, 12.3ºC for the Danube, and 12.5ºC for Belgrade mean annual air temperature. Notably, the minimum and maximum mean annual water temperatures measured at the Sava were 12.0ºC (in 1976) and 15.6ºC (in 2000), respectively. For the Danube, corresponding values were 10.6ºC (in 1980) and 14.2ºC (in 2018), while for Belgrade air temperature, they were 10.8ºC (in 1976) and 14.8ºC (in 2019).
Across all three analyzed series, statistically significant increasing trends were observed. Specifically, the largest increase was noted in the Sava water temperature range, with a rate of 0.44ºC per decade. For the Danube, this increase amounted to 0.39ºC per decade, while for the series of mean annual air temperatures in Belgrade, the increase amounted to 0.34ºC per decade.
Using the RAPS method, the behaviour of the time series of mean water and air temperatures analyzed in this work was examined. Figure 4 illustrates the behaviour of their RAPS values during the 1956-2020 period.
In the Danube water temperature series, RAPS proved the existence of two subseries: 1956-1988 and 1989-2020. The average values of the first and second subseries are 11.7ºC and 12.9ºC, respectively. The F-test indicates no statistically significant difference between the variances of the subsets (p=0.629), while the t-test indicates a statistically significant difference in the average values of the subsets (p=4.5E-11).
Similarly, in the Sava water temperature series, RAPS identified two subseries: 1956-1989 and 1990-2020. The average values of the first and second subseries are 12.9ºC and 14.6ºC, respectively. The F-test indicates no statistically significant difference between the variances of the subsets (p=0.053), while the t-test indicates a statistically significant difference in the average values of the subsets (p=8.2E-15).
For the Belgrade air temperature series, RAPS identified two subseries: 1956-1997 and 1998-2020. The average values of the first and second subseries are 12.0ºC and 13.5ºC, respectively. The F-test indicates no statistically significant difference between the variances of the subsets (p=0.151), while the t-test indicates a statistically significant difference in the average values of the subsets (p=2.0E-12).
Figure 5 displays pairs of subseries defined by the RAPS method (Figure 4). It is notable that all six subseries exhibit increasing trends, yet in the initial sub-period, none of the trends are statistically significant at the p<0.01 level. However, in recent sub-periods, all growth trends become statistically significant. The most substantial increase is observed in the series of mean annual air temperatures in Belgrade during the sub-period 1998-2020, averaging 0.762ºC per decade. This increase is over 3.7 times higher than in the previous sub-period (1956-1997), where it was 0.207ºC per decade. The trends of water temperature rise in both rivers appear similar, indicating a notable intensification of the Urban Heat Island (UHI) effect in Belgrade in recent years.
In Figure 6, the series of differences between the mean annual temperatures measured at the three stations analyzed in this paper are depicted. While all three cases exhibit increasing trends, none are statistically significant. Notably, the difference between Sava water temperatures and Belgrade air temperatures (ΔT=TWS-TAB) has decreased since the early 1990s, possibly due to the sudden increase in the UHI effect in Belgrade. Drawing a parabola instead of a line emphasizes this decreasing trend more clearly.
Figure 7 illustrates the relationship between the mean annual water temperatures of the Sava and Danube rivers. The coefficient of determination (R2=0.736) indicates a significant similarity in water temperature regimes. Only in 1974 was the mean annual water temperature of the Danube higher than that of the Sava.
Table 1 presents the values of the determination coefficients (R2) between the series of mean annual water temperatures of the Danube (TWD), Sava, (TWS), the mean annual air temperatures of Belgrade (TAB), and the flow of the Danube (QD) and Sava (QS) for the period 1956-2020.
It is noteworthy to observe the high degree of coincidence between the water temperatures of both rivers and the air temperatures of Belgrade.
3.1. The Examination of the Relationship between the Mean Annual Water and Air Temperatures and the River Discharges
River discharge is significantly influenced by water temperature, and their interaction varies for each open stream flow. Understanding this interplay is crucial for ensuring the sustainable development of rivers and their catchments. To achieve this, comprehensive interdisciplinary analyses integrating climate, hydrology, and environmental factors are necessary [10].
Probst and Mauser highlighted shifts in the discharge seasonality of the Danube River, noting an increase in winter runoff and a decrease in summer runoff [68]. They also observed an elevated risk of both high and low flows along different sections of the Danube mainstream. Accurate estimations of future river water temperatures and their interconnection with discharges are of paramount importance, particularly during low water and warm periods of the year [36]. For example, in the Loire River basin, France, Seyedhashemi et al. found strong evidence of basin-wide increases in water temperature due to rising air temperatures and decreasing streamflow [42]. They proposed that some of these effects of climate change could be alleviated through the restoration and maintenance of riparian forests. Additionally, Prohaska et al. conducted extensive analyses of low-water discharges in the Sava River around the Drina River confluence [69].
Figure 8 illustrates the relationships between mean annual water temperatures and the flow of the Sava and Danube rivers from 1956 to 2020. It reveals an inverse proportionality, where an increase in flow corresponds to a decrease in water temperatures.
Notably, this relationship is stronger with the Sava River, as indicated by a coefficient of determination (R2) of 0.228, compared to the Danube River, where the R2 value is 0.090.
4. The Analysis of Mean Monthly Water and Air Temperatures
The study of temperature data on shorter time scales than a year provides insights into the specific behaviour of the analyzed phenomena within the year, often influenced by seasonal climate variations.
Table 2 presents the values of the slope of the regression line (a), the coefficient of determination (R2) and the probability of the M-K test (p) for the series of mean monthly water and air temperatures observed at the three stations from 1956 to 2020. It is noteworthy that in each month of the year, there are trends of increasing mean monthly temperatures at all three analyzed stations. However, those trends vary significantly throughout the year and across different locations. Probabilities (p) less than 0.01 are highlighted in red, while probabilities between 0.01 and 0.05 are highlighted in blue.
The analysis reveals that water temperatures in the Sava and Danube rivers exhibit a statistically significant increase in all months of the year, whereas this is not consistently observed in the air temperatures recorded in Belgrade. Overall, the findings suggest that a more pronounced rise in both water and air temperatures occurs during the warmer part of the year.
Figure 9 presents histograms of average monthly flows of the Sava and Danube rivers over the analyzed period from 1956 to 2020. While there is a similarity between their hydrological regimes, they are not identical. Minimum flows on the Danube occur in October, two months later than on the Sava, while maximum flows are observed in April for both rivers.
Figure 10 shows histograms of average monthly water temperatures of the Danube (blue) and Sava (red) and the air temperature of Belgrade (green) from 1956 to 2020. For a detailed examination of differences across the months,
Figure 11 displays histograms depicting the differences between pairs of average monthly temperatures for all three analyzed stations.
Observations indicate that the water temperature of the Sava consistently exceeds that of the Danube throughout the year. The largest difference is observed in August (2.3ºC), while the smallest difference occurs in May (0.2ºC). Furthermore, the water temperature of the Sava surpasses the air temperature of Belgrade from July to February. Conversely, from March to June, the air temperature in Belgrade exceeds that of the Sava River, with the difference being minimal in March (0.04ºC). Additionally, the water temperature of the Danube is lower than the air temperature in Belgrade from February to August, while it exceeds the air temperature from September to January.
5. Conclusions
Protecting the city of Belgrade from the impacts of climate change, particularly the adverse effects of global warming, stands as a critical, intricate, and ongoing endeavour. Given its strategic location at the confluence of two major rivers, the climate of Belgrade is significantly influenced by these water bodies. It is imperative to enhance our understanding and elucidate the interconnections between urban spaces and river dynamics. Scientists, water managers, and policymakers bear the responsibility of implementing measures to prevent or mitigate both natural and anthropogenic impacts on river and urban ecosystems [70].
The initial step in this multifaceted process involves accurately identifying the causes and implications of future changes in water and air temperatures. Understanding the factors governing the water temperature at the confluence of the Danube and Sava rivers holds immense importance for a major urban agglomeration such as Belgrade. Investigating the response processes and mechanisms of river water temperature to climate change and anthropogenic activities is crucial for assessing the sustainable development of river ecosystems as well as human well-being. The analysis of how thermal regimes have evolved in the past and may evolve in the future is invaluable for the city’s evolution and governance, particularly in light of the escalating air temperatures attributed to climate change [36].
Harris suggests that given the anthropogenic drivers behind contemporary climate change, it is imperative to incorporate humanity’s impact into climate models, particularly in the context discussed in this paper [9].
Beaufort et al. highlight the concept of thermal sensitivity, which is based on the relationship between air and water temperature, as a means to quantify a river's sensitivity to future climate change [10]. With river water temperatures expected to rise, understanding the underlying drivers becomes crucial for developing effective mitigation strategies [71].
The main conclusions drawn from the analyses conducted in our study are as follows:
- Across all three analyzed locations, a consistent upward trend in both water and air temperatures was observed;
- The highest average temperature over the 65 years was recorded in the Sava River;
- Sharp increases in water temperatures were observed in 1989 for the Sava and 1990 for the Danube, while the air temperature in Belgrade began rising somewhat later in 1998;
- The most significant increase in air temperature in the recent period (1998-2020) was observed at the Belgrade observatory, reaching 0.76 ºC per decade;
- The rate of temperature increase in the Sava's water over the last three decades slightly outpaced that of the Danube;
- Peak average water temperatures for both the Sava and Danube rivers occurred in August, while the highest average air temperature in Belgrade was recorded in July;
- The average annual flow of the Danube near Belgrade is approximately 2.4 times higher than that of the Sava;
- While the hydrological regimes of both rivers throughout the year are similar, they are not identical;
- Maximum average flows for both rivers occur in April, with the minimum average monthly flow occurring in August for the Sava and October for the Danube;
- The most substantial temperature increases were observed during the summer months, particularly in August, while smaller increases were noted during colder periods of the year;
- There is an inversely proportional relationship between mean annual water temperatures and river discharges at both observed river stations.
In conclusion, while there are numerous potential causes for the significant upward trends in water and air temperatures observed in the rivers of Belgrade, existing databases and knowledge about these complex processes are insufficient to provide definitive answers to many pressing questions. Further research and understanding of these phenomena are necessary to address these challenges effectively.
Author Contributions
Conceptualization, O.B.; methodology, O.B.; software, D.B.; validation, S.P., S.Č. and T.R.-B.; formal analysis, A.Ž.-Č.; investigation, A.Ž.-Č.; resources, S.Č.; data curation, S.P. and D.B.; writing—original draft preparation, O.B.; writing—review and editing, A.Ž.-Č.; visualization, A.Ž.-Č. and S.P.; supervision, T.R.-B.; project administration, T.R.-B.; funding acquisition, A.Ž.-Č. All authors have read and agreed to the published version of the manuscript.
Data Availability Statement
The data that support the findings of this study is available from the corresponding author upon request. All the data used in this paper is available to the interested parties on demand.
Conflicts of Interest
The authors declare no conflicts of interest.
References
- Demeritt, D. The construction of global warming and the politics of science. Annals of the Association of American Geographers 2001, 91, 301–337. [Google Scholar] [CrossRef]
- Weston D (2015) The political economy of global warming—the terminal crisis. Routledge, Abingdon, UK.
- Lehman J (2020) Making an Anthropocene ocean: synoptic geographies of the International Geophysical Year (1957–1958). Ann Assoc Am Geogr 110(3):606-622. [CrossRef]
- Miller T (2020) Inviting critical political economy to the table. Clim Chang 163(1):155–160. [CrossRef]
- Webb BW (1996) Trends in stream and river temperature. Hydrol Proces 10(2):205-226. [CrossRef]
- Caissie, D. The thermal regime of rivers: a review. Freshwater Biology 2006, 51, 1389–1406. [Google Scholar] [CrossRef]
- Webb BW, Nobilis F (1994) Water temperature behaviour in the River Danube during twentieth century. Hydrobiol 291 (2):105-113. [CrossRef]
- Žganec K (2012) The effects of water diversion and climate change on hydrological alteration and temperature regime of karst rivers in central Croatia. Environ Monit Assess 184(9):5705–5723. [CrossRef]
- Harris MD (2022) The trouble with modeling the human into the future climate. GeoHumanities 8(2):382-398. [CrossRef]
- Beaufort, A.; Moatar, F.; Sauquet, E.; Loicq, P.; Hannah, D.M. Influence of landscape and hydrological factors on stream–air temperature relationships at regional scale. Hydrological Processes 2020, 34, 583–597. [Google Scholar] [CrossRef]
- Kędra M (2020) Regional response to global warming: water temperature trends in semi-natural mountain river systems. Water 12(1):283. [CrossRef]
- Heggenes J, Stickler M, Alfredsen K, Brittain JE, Adeva-Bustos A, Huusko A (2021) Hydropower-driven thermal changes, biological responses and mitigating measures in northern river systems. River Res Appl 37(5):743–765. [CrossRef]
- Seyedhashemi H, Moatar F, Vidal J-P, Diamond JS, Beaufort A, Chandesris A, Valette L (2020) Thermal signatures identify the influence of dams and ponds on stream temperature at the regional scale. Sci Total Environ 766(1):142667. [CrossRef]
- Zaidel PA, Roy AH, Houle KM, Lambert B, Letcher BH, Nislow KH, Smith C (2020) Impacts of small dams on stream temperature. Ecological Indicators 120(2):106878. [CrossRef]
- Talke SA, Jay DA, Diefenderfer HL (2023) Warming of the Willamette River, 1850–present: the effects of climate change and direct human interventions. EGUsphere. [CrossRef]
- Bartholow, J. M. Recent water temperature trends in the Lower Klamath River, California. North American Journal of Fisheries Management 2005, 25, 152–162. [Google Scholar] [CrossRef]
- Huguet F, Parey S, Dacumb-Castelle D, Malek F (2008) Is there a trend in extremely high river temperature for the next decades? A case study for France. Nat Haz Earth Syst Sci 8(1): 67–79. [CrossRef]
- Isaak D, Wollrab S, Horan D, Chandler G (2012) Climate change effects on stream and river temperatures across the northwest US from 1980–2009 and implications for salmonid fishes. Climat Chang 113(2):499–524. [CrossRef]
- Garner, G.; Hannah, D. M.; Sadler, J. P.; Orr, H. G. River temperature regimes of England and Wales: spatial patterns, inter-annual variability and climatic sensitivity. Hydrological Processes 2013, 28, 5583–5598. [Google Scholar] [CrossRef]
- Marković D, Scharfenberger U, Schmultz S, Pletterbauer F, Wolter C (2013) Variability and alterations of water temperatures across the Elbe and Danube River Basins. Climat Chang 119(2):375-389. [CrossRef]
- Hadzima-Nyarko M, Rabi A, Šperac M (2014) Implementation of artificial neural networks in modeling the water-air temperature relationship of the river Drava. Water Resour Manag 28(5):1379–1394. [CrossRef]
- Rabi A, Hadzima-Nyarko M, Šperac M (2015) Modelling river temperature from air temperature: Case of the river Drava (Croatia). Hydrol Sci J 60(9):1490–1507. [CrossRef]
- Arora, R.; Tockner, K.; Venohr, M. Changing river temperatures in northern Germany: trends and drivers of change. Hydrological Processes 2016, 30, 3084–3096. [Google Scholar] [CrossRef]
- Dokulil, M. T. Climate warming affects water temperature in the River Danube and tributaries – present and future per-spectives. Geomorphologica Slovaca et Bohemica 2018, 18, 57–63. [Google Scholar]
- Graf R, Wrzesiński D (2020) Detecting patterns of changes in river water temperature in Poland. Water 12(5):1327. [CrossRef]
- Michel A, Brauchli T, Lehning M, Schaefli B, Huwald, H (2020) Stream temperature and discharge evolution in Switzerland over the last 50 years: annual and seasonal behaviour. Hydrol Earth Syst Sci 24(1):115–142. [CrossRef]
- Drainas, K.; Kaule, L.; Mohr, S.; Uniyal, B.; Wild, R.; Geist, J. Predicting stream water temperature with artificial neural networks based on open-access data. Hydrological Processes 2023, 37, e14991. [Google Scholar] [CrossRef]
- Fidelibus, M. D.; Pulido-Bosch, A. Groundwater temperature as an indicator of the vulnerability of karst coastal aquifer. Geosciences 2019, 9, 23. [Google Scholar] [CrossRef]
- Zhu S, Bonacci O, Oskoruš D, Hadzima-Nyarko M, Wu S (2019) Long term variations of river temperature and the influence of air temperature and river discharge: case study of Kupa River watershed in Croatia. J Hydrol Hidromec 67(4):305–313. [CrossRef]
- Seyedhashemi H, Vidal J-P, Diamond JS, Thiéry D, Monteil C, Hendrickx F, Maire A, Moatar F (2022) Regional, multi-decadal analysis on the Loire River basin reveals that stream temperature increases faster than air temperature. Hydrol Earth Syst Sci 26(9): 2583–2603. [CrossRef]
- Nelson KC, Palmer MA (2007) Stream temperature surges under urbanization and climate change: data, models, and responses. J Am Water Resour As 43(2):440–452. [CrossRef]
- Ducharne, A. Importance of stream temperature to climate change impact on water quality. Hydrology and Earth System Sciences 2008, 12, 797–810. [Google Scholar] [CrossRef]
- Bonacci, O. River - the bloodstream of landscape and catchment. Acta Hydrotechnica 2016, 29, 1–12. [Google Scholar]
- Miranda VFVV, dos Santos DM, Peres LF, Salvador C, Nieto R, Müller GV, Thielen D, Libonati R. (2024) Heat stress in South America over the last four decades: a bioclimatic analysis. Theor Appl Climatol 155(1-2). [CrossRef]
- Mohseni O, Stefan HG (1999) Stream temperature/air temperature relationship: a physical interpretation. J Hydrol 218(3-4):128–141. [CrossRef]
- van Vliet MTH, Franssen, WHP, Yearsley JR, Ludwig F, Haddeland I, Lettenmaier DP, Kabat P (2013) Global river discharge and water temperature under climate change. Global Environ Change 23(2):450–464. [CrossRef]
- White JC, Khamis K, Dugdale SJ, Jackson FL, Malcolm IA, Krause S, Hannah DM (2023) Drought impacts on river water temperature: A process-based understanding from temperate climates. Hydrol Proces 37(10):e14958. [CrossRef]
- Tong Y, Feng L, Wang X, Pi X, Xu W, Woolway RI (2023) Global lakes are warming slower than surface air temperature due to accelerated evaporation. Nature Water. [CrossRef]
- Nam S, Lim H, Choi B, Li Q, Moon H, Choi HT (2023) Responses of stream water temperature to water levels in forested catchments of South Korea. Forests 14(10):2085. [CrossRef]
- Guo W, He N, Wang H, Zhang H, Fu Y (2023) Protecting river eco-hydrological processes: insights from water temperature studies. Aquatic Sci 85(4):110. [CrossRef]
- Kail J, Palt M, Lorenz A, Hering D (2021) Woody buffer effects on water temperature: The role of spatial configuration and daily temperature fluctuations. Hydrol Proces 35(1): e14008. [CrossRef]
- Seyedhashemi H, Moatar F, Vidal J-P, Thiéry D (2023) Past and future discharge and stream temperature at high spatial resolution in a large European basin (Loire basin, France). Earth System Science Data 15(7):2827-2839. [CrossRef]
- Perry LG, Reynolds LV, Beechie TJ, Collins MJ, Shafroth P (2015) Incorporating climate change projections into riparian restoration planning and design. Ecohydrol 8(5):863-879. [CrossRef]
- Webb BW, Nobilis F (2007) Long-term changes in river temperature and the influence of climatic and hydrological factors. Hydrol Sci J 52(1):74 – 85. [CrossRef]
- Bonacci, O.; Trninić, D.; Roje-Bonacci, T. Analysis of the water temperature regime of the Danube and its tributaries in Croatia. Hydrological Processes 2008, 22, 1014–1021. [Google Scholar] [CrossRef]
- Pekárová P, Halmova D, Miklanek P, Onderka M, Pekar J, Skoda P (2008) Is the water temperature of the Danube River at Bratislava, Slovakia, rising? J Hydrometeorol 9(5):1115–1122. [CrossRef]
- Lovasz G (2012) Water Temperatures of the Danube and Tisza Rivers in Hungary. 3: Hungarian Geographical Bulletin 61(4).
- Ducić, V. , Milenković, M., Milijašević, C., Vujačić, D. M., Bjeljac, Ž., Lovrić, S. L., Gajić, M., Anđelković, G., & Đorđević, A. (2015). Hiatus in global warming - the example of water temperature of the Danube river at Bogojevo gauge (Serbia). Thermal Science, 19(Suppl. 2), S467-S476. [CrossRef]
- Basarin, B.; Lukić, T.; Pavić, D.; Wilby, R. Trends and multi-annual variability of water temperatures in the River Danube, Serbia. Hydrological Processes 2016, 30, 3315–3329. [Google Scholar] [CrossRef]
- Bonacci, O., Đurin, B., Roje-Bonacci, T., & Bonacci, D. (2022). The Influence of reservoirs on water temperature in the downstream part of an open watercourse: a case study at Botovo Station on the Drava River. Water, 14, 3534. [CrossRef]
- Pandžić K, Likso T, Trninić D, Oskoruš D, Macek K, Bonacci O (2022) Relationships between large-scale atmospheric circulation and monthly precipitation and discharge in the Danube River Basin. Theor Appl Climatol 148(1-2):767–777. [CrossRef]
- Pekárová P, Bajtek Z, PekárJ, Výleta R, Bonacci O, Miklánek P, Belz JU, Gorbatchova L (2023) Monthly stream temperatures along the Danube River: Statistical analysis and predictive modelling with incremental climate change scenarios. J Hydrol Hydromec 71(4). [CrossRef]
- Babić Mladenović, M.; Kolarov, V.; Damjanović, V. Sediment regime of the Danube River in Serbia. International Journal of Sediment Research 2013, 28, 470–485. [Google Scholar] [CrossRef]
- Đorđević, D.; Tamás, E. A.; Mihajlović, L. J.; Abonyi, C.; Vujnović, A.; Kalocsa, B. Estimation of changes in sediment transport along the free-flowing middle Danube river reach. Applied Sciences 2023, 13, 10513. [Google Scholar] [CrossRef]
- Goda L, Kalocsa B, Tamás EA (2007) River bed erosion on the Hungarian section of the Danube. J Environ Sci Sustain Soc 1:47–54. [CrossRef]
- Milovanović B, Ducić V, Radovanović M, Milivojević M (2017) Climate regionalization of Serbia according to Köppen climate classification. J Geographical Institute Jovan Cvijic SASA 67(2):103–114. [CrossRef]
- Köppen W, Geiger R (1936) Handbuch der Klimatologie: Das geographische System der Klimate.
- Encyclopedia Britannica. "Köppen climate classification." Available at: https://www.britannica.com/science/Koppen-climate-classification (Accessed: 1 Oct. 2023).
- Bajat, B., Blagojević, D., Kilibarda, M., Luković, J., & Tošić, I. (2015). Spatial analysis of the temperature trends in Serbia during the period 1961–2010. Theoretical and Applied Climatology, 121, 289–301. [CrossRef]
- Ruml M, Gregorić E, Vujadinović M, Radovanović S, Matović G, Vuković A, Počuča V, Stojičić D (2017) Observed changes of temperature extremes in Serbia over the period 1961−2010. Atmosph Res 183:26-41. [CrossRef]
- Anđelković, G. (2003). Osnovne karakteristike beogradskog ostrva toplote. Glasnik Srpskog Geografskog Društva, LXXXIII(1), 15-30.
- Milovanović B (2015) Air temperature changes in Serbia and the Belgrade heat island. J Geographical Institute Jovan Cvijic SASA 65(1):33-42. [CrossRef]
- Garbrecht, J.; Fernandez, G. P. Visualization of trends and fluctuations in climatic records. Water Resources Bulletin 1994, 30, 297–306. [Google Scholar] [CrossRef]
- Mann HB (1945) Non-parametric test against trend. Econometrica 13(3):245-259. [CrossRef]
- Kendall MG (1975) Rank correlation methods 4th edition. Charles Griffin, London.
- Husain Shourov MM, Mahmud I (2019) pyMannKendall: a python package for non-parametric Mann Kendall family of trend tests. J Open Source Software 4(9):1556. [CrossRef]
- McGhee JW (1985) Introductory statistics. West Publishing Company, St Paul and New York.
- Probst E, Mauser W (2023) Climate change impacts on water resources in the Danube river basin: a hydrological modelling study using EURO-CORDEX climate scenarios. Water 15(1):8. [CrossRef]
- Prohaska S, Plavšić J, Ćatović S, Bartoš Divac V, Prohaska O, Ilić A, Petković D (2023) Sveobuhvatna analiza malih voda na širem sektoru ušća reke Drine u reku Savu. Hrvatske Vode 31(123):37-54. (in Serbian).
- Bloesch, J. Danube under pressure-a personal analysis. Geomorphologica Slovaca et Bohemica 2018, 18, 9–15. [Google Scholar]
- Hannah DM, Webb BW, Nobilis F (2008) River and stream temperature: dynamics, processes, models and implications. Hydrol Proces 22(7):899-901. [CrossRef]
Figure 1.
Study area with measurement stations: 1-Danube Zemun; 2-Sava Belgrade; 3-Belgrade observatory.
Figure 1.
Study area with measurement stations: 1-Danube Zemun; 2-Sava Belgrade; 3-Belgrade observatory.
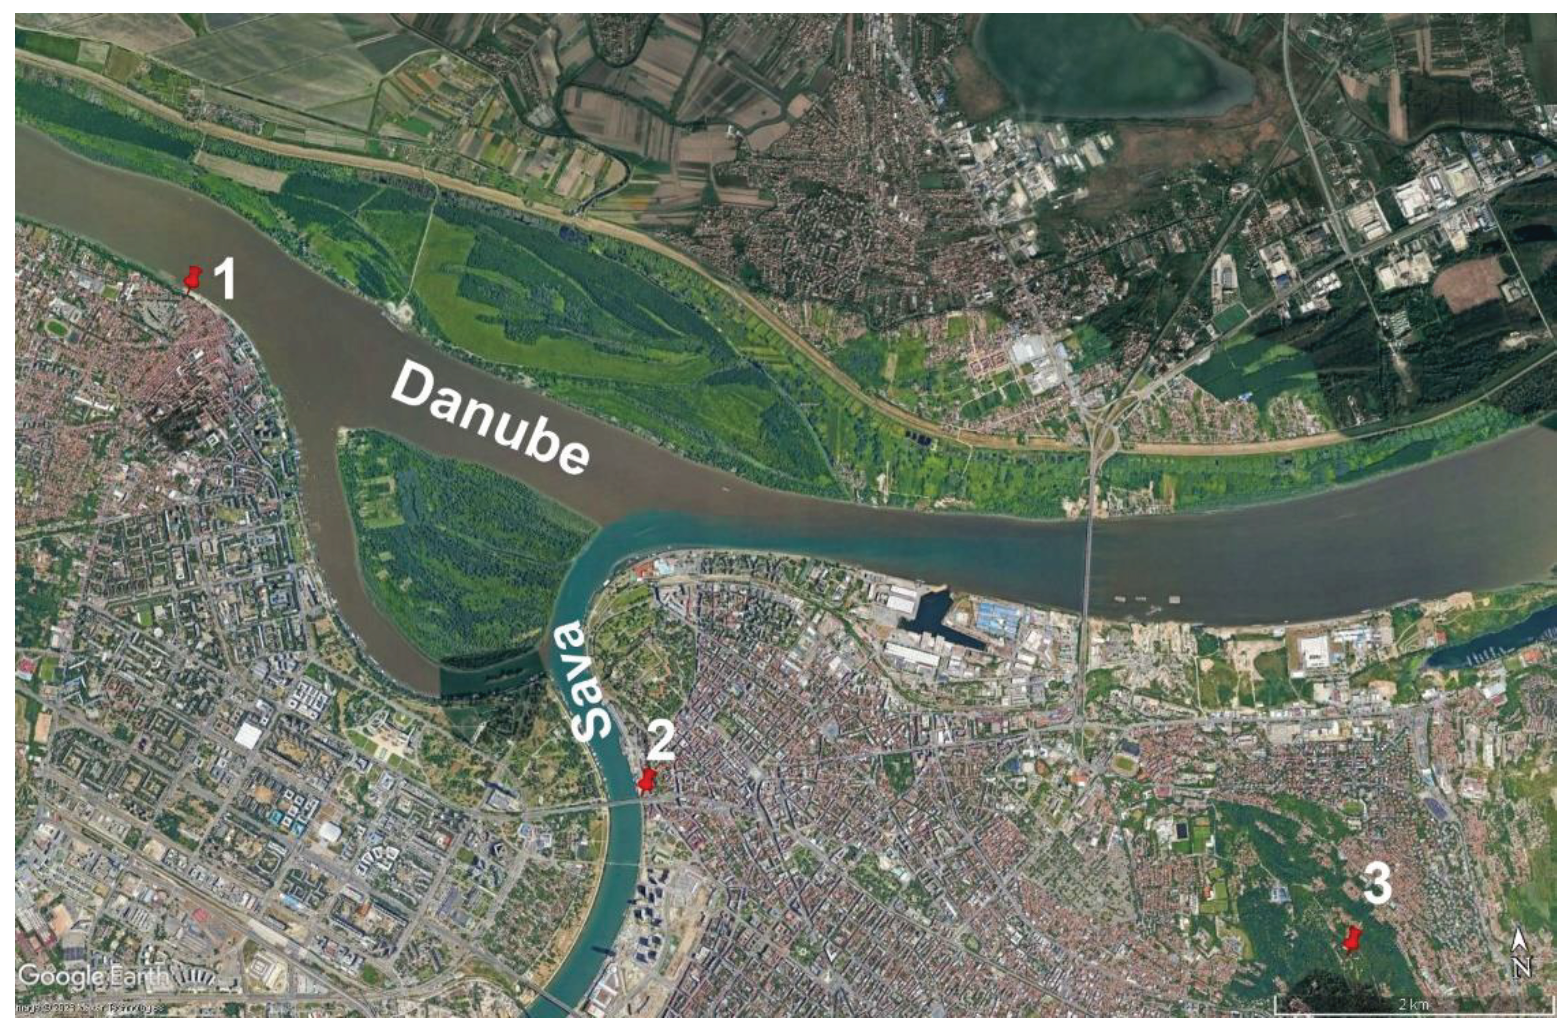
Figure 2.
This is a figure. Schemes follow the same formatting.
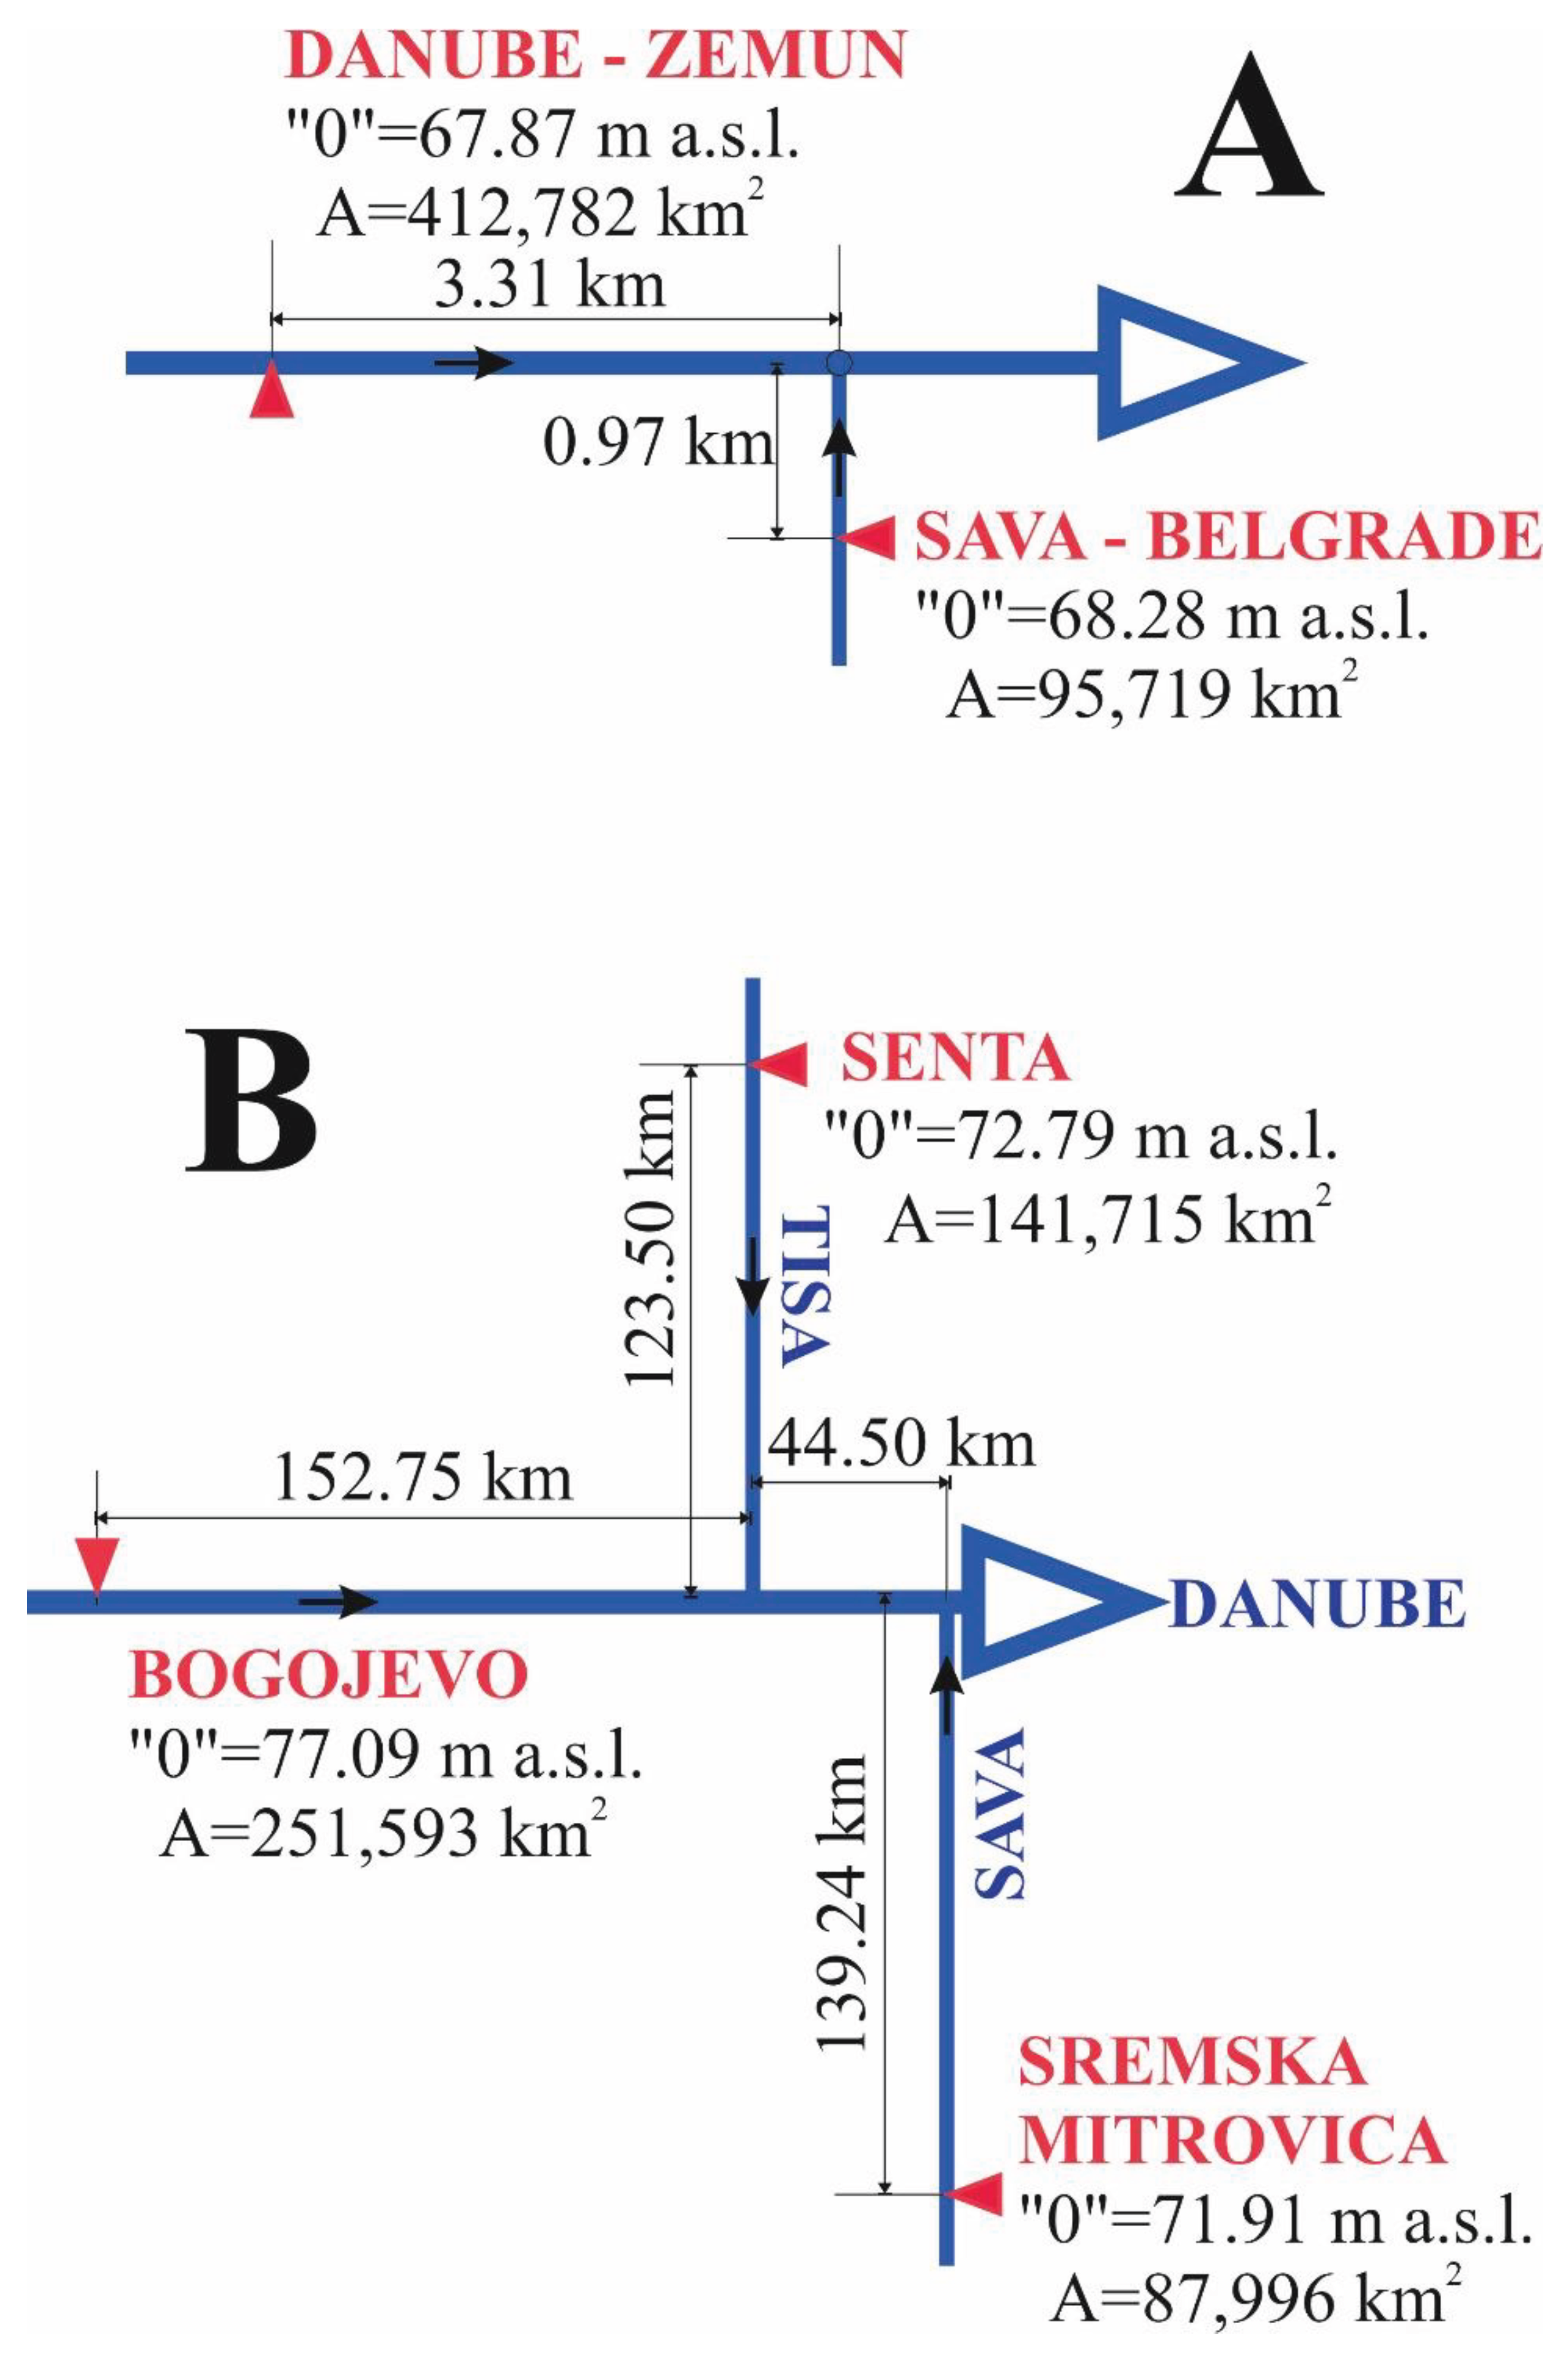
Figure 3.
Time series of the mean annual water temperature measured at Danube Zemun (blue), Sava Belgrade (red), and air temperature measured at Belgrade observatory (green) during the 1956-2020 period.
Figure 3.
Time series of the mean annual water temperature measured at Danube Zemun (blue), Sava Belgrade (red), and air temperature measured at Belgrade observatory (green) during the 1956-2020 period.
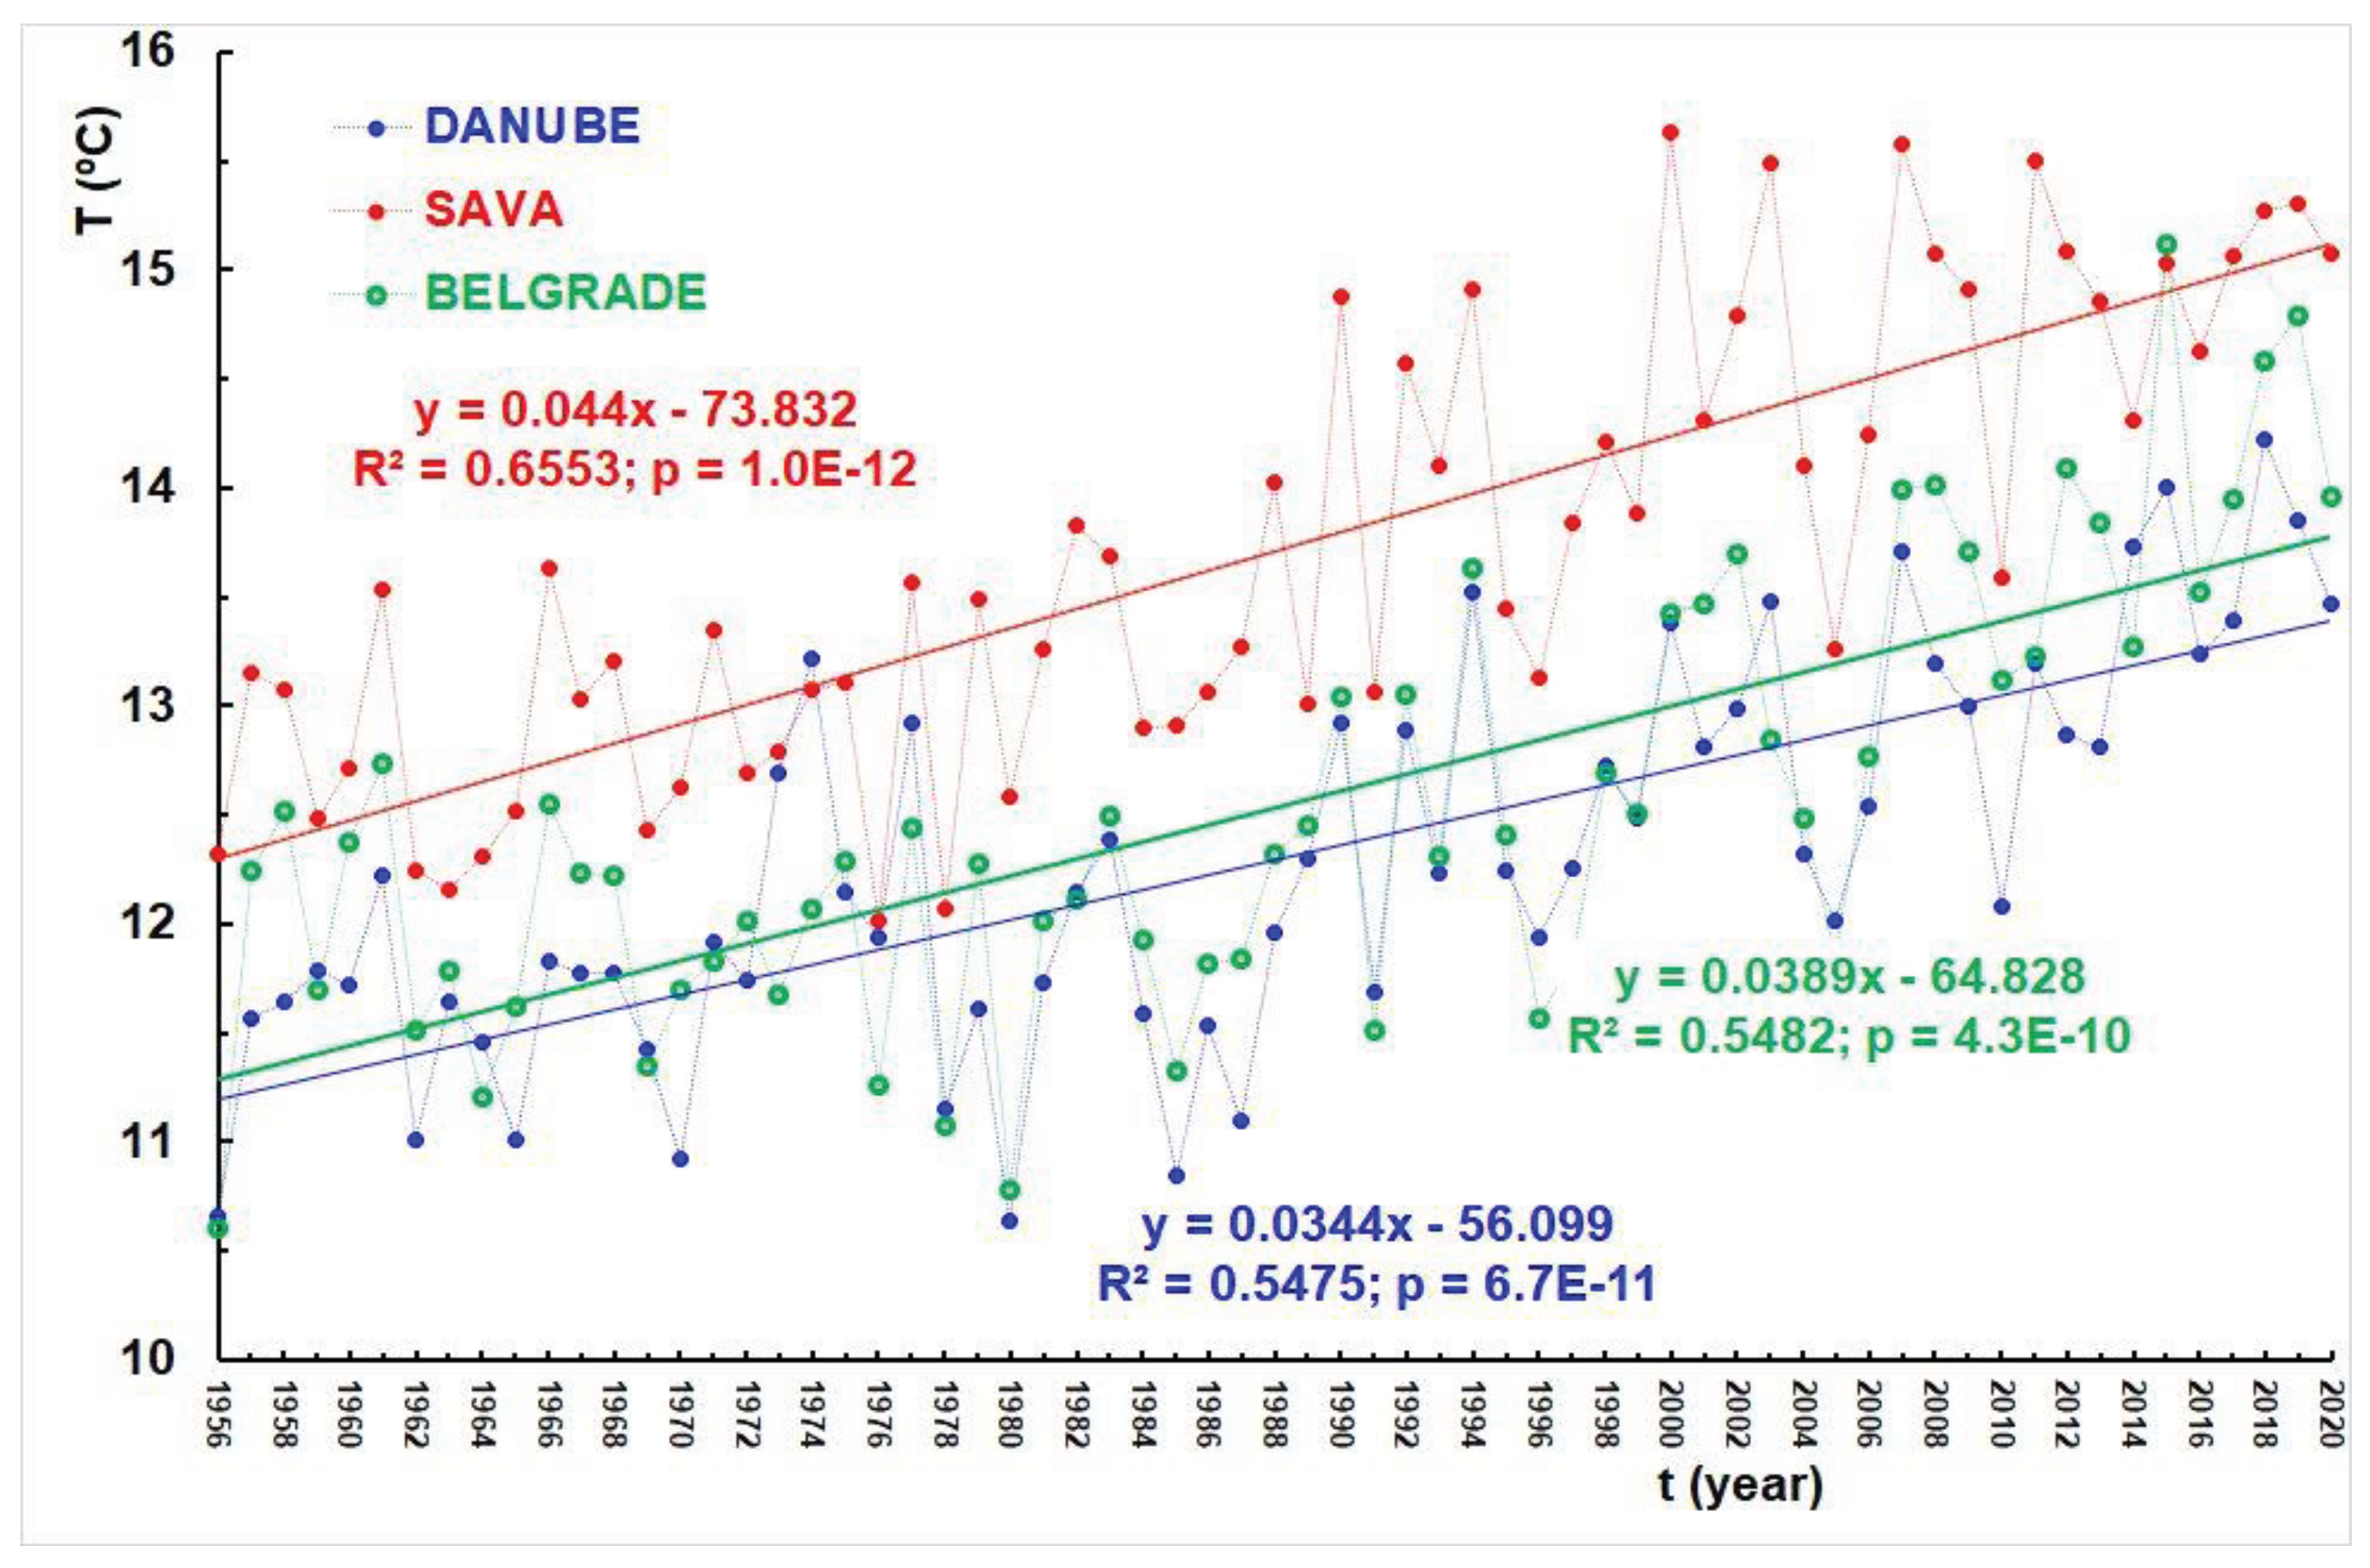
Figure 4.
RAPS arrays: Danube Zemun (blue), Sava Belgrade (red), Belgrade observatory (green).

Figure 5.
Time series of the mean annual water temperature measured at Danube Zemun (blue), Sava Belgrade (red), and the mean annual air temperature measured at Belgrade observatory (green), calculated for two sub-periods defined by the results of the RAPS method (see Figure 4).
Figure 5.
Time series of the mean annual water temperature measured at Danube Zemun (blue), Sava Belgrade (red), and the mean annual air temperature measured at Belgrade observatory (green), calculated for two sub-periods defined by the results of the RAPS method (see Figure 4).

Figure 6.
Time series of differences, ΔT, between the mean annual temperatures: TWS –TWD (Sava Belgrade – Danube Zemun), TAB-TWD (Belgrade observatory - Danube Zemun), TWS-TAB (Sava Belgrade - Belgrade observatory) during the 1956-2020 period.
Figure 6.
Time series of differences, ΔT, between the mean annual temperatures: TWS –TWD (Sava Belgrade – Danube Zemun), TAB-TWD (Belgrade observatory - Danube Zemun), TWS-TAB (Sava Belgrade - Belgrade observatory) during the 1956-2020 period.
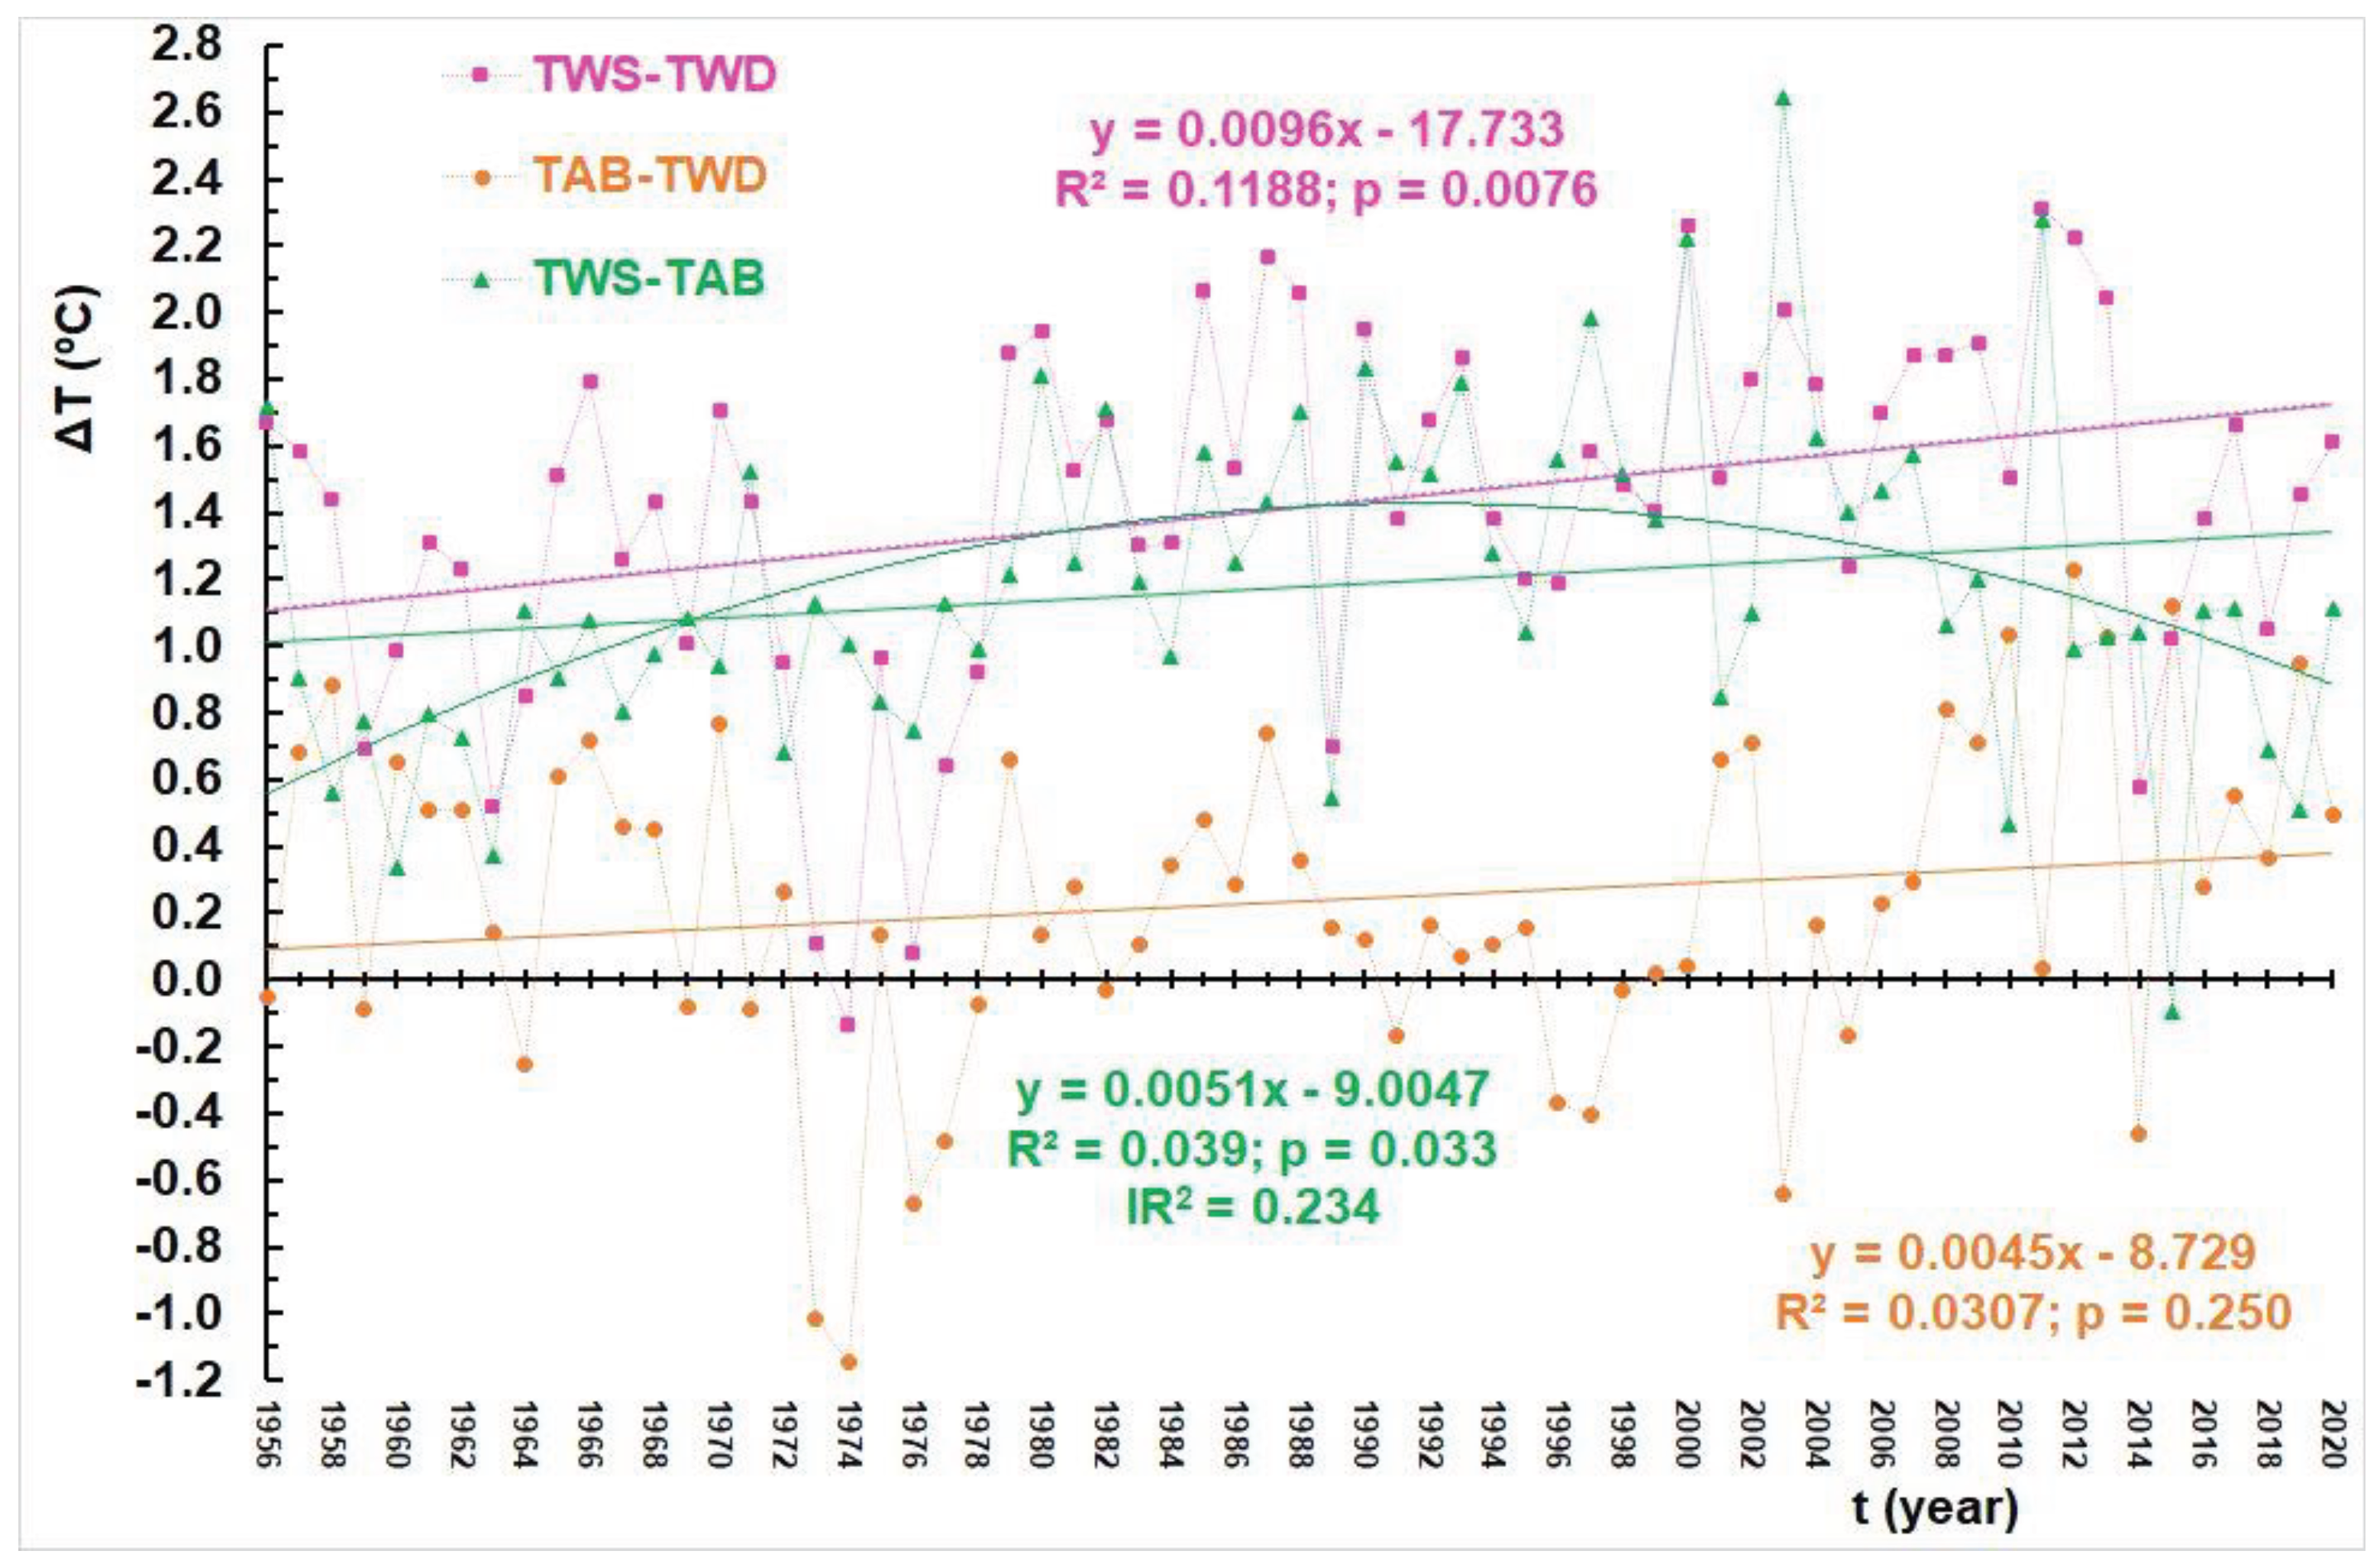
Figure 7.
Relationship between the mean annual water temperature measured at Sava Belgrade and Danube Zemun during the 1956-2020 period.
Figure 7.
Relationship between the mean annual water temperature measured at Sava Belgrade and Danube Zemun during the 1956-2020 period.
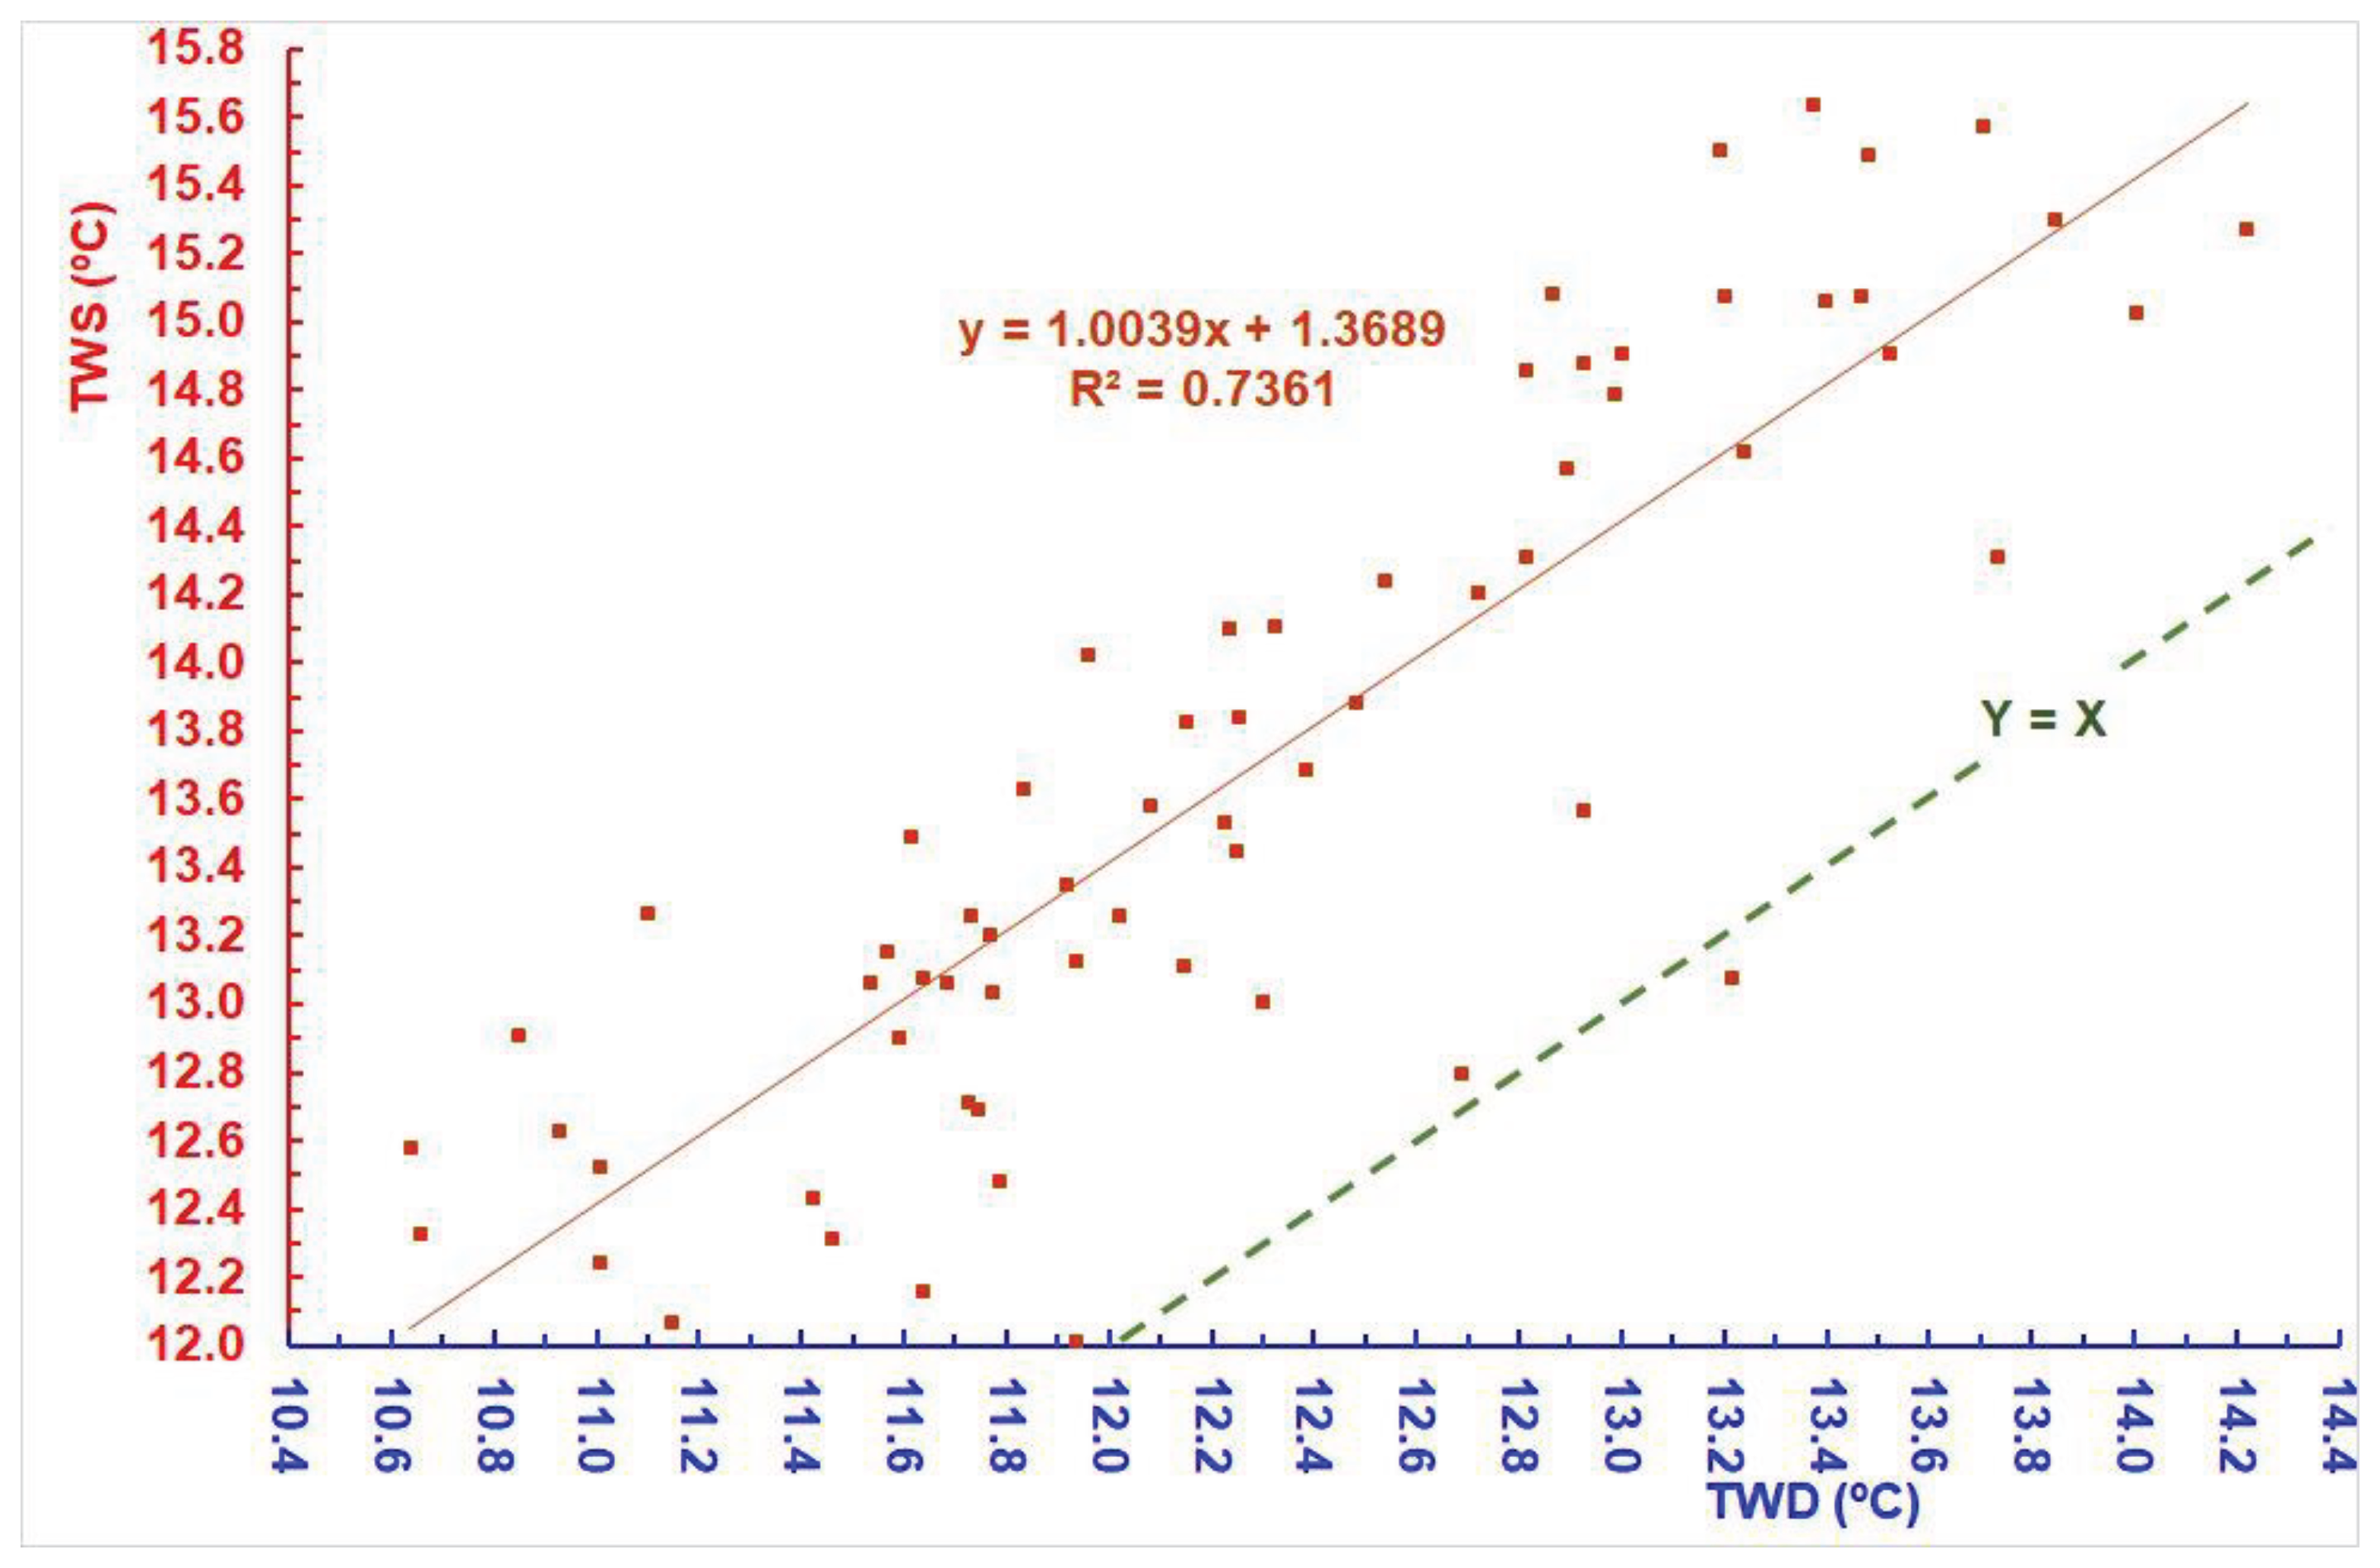
Figure 8.
Relationships between the mean annual water temperature and mean annual discharges for Danube Zemun (blue) and Sava Beograd (red) during the 1956-2020 period.
Figure 8.
Relationships between the mean annual water temperature and mean annual discharges for Danube Zemun (blue) and Sava Beograd (red) during the 1956-2020 period.
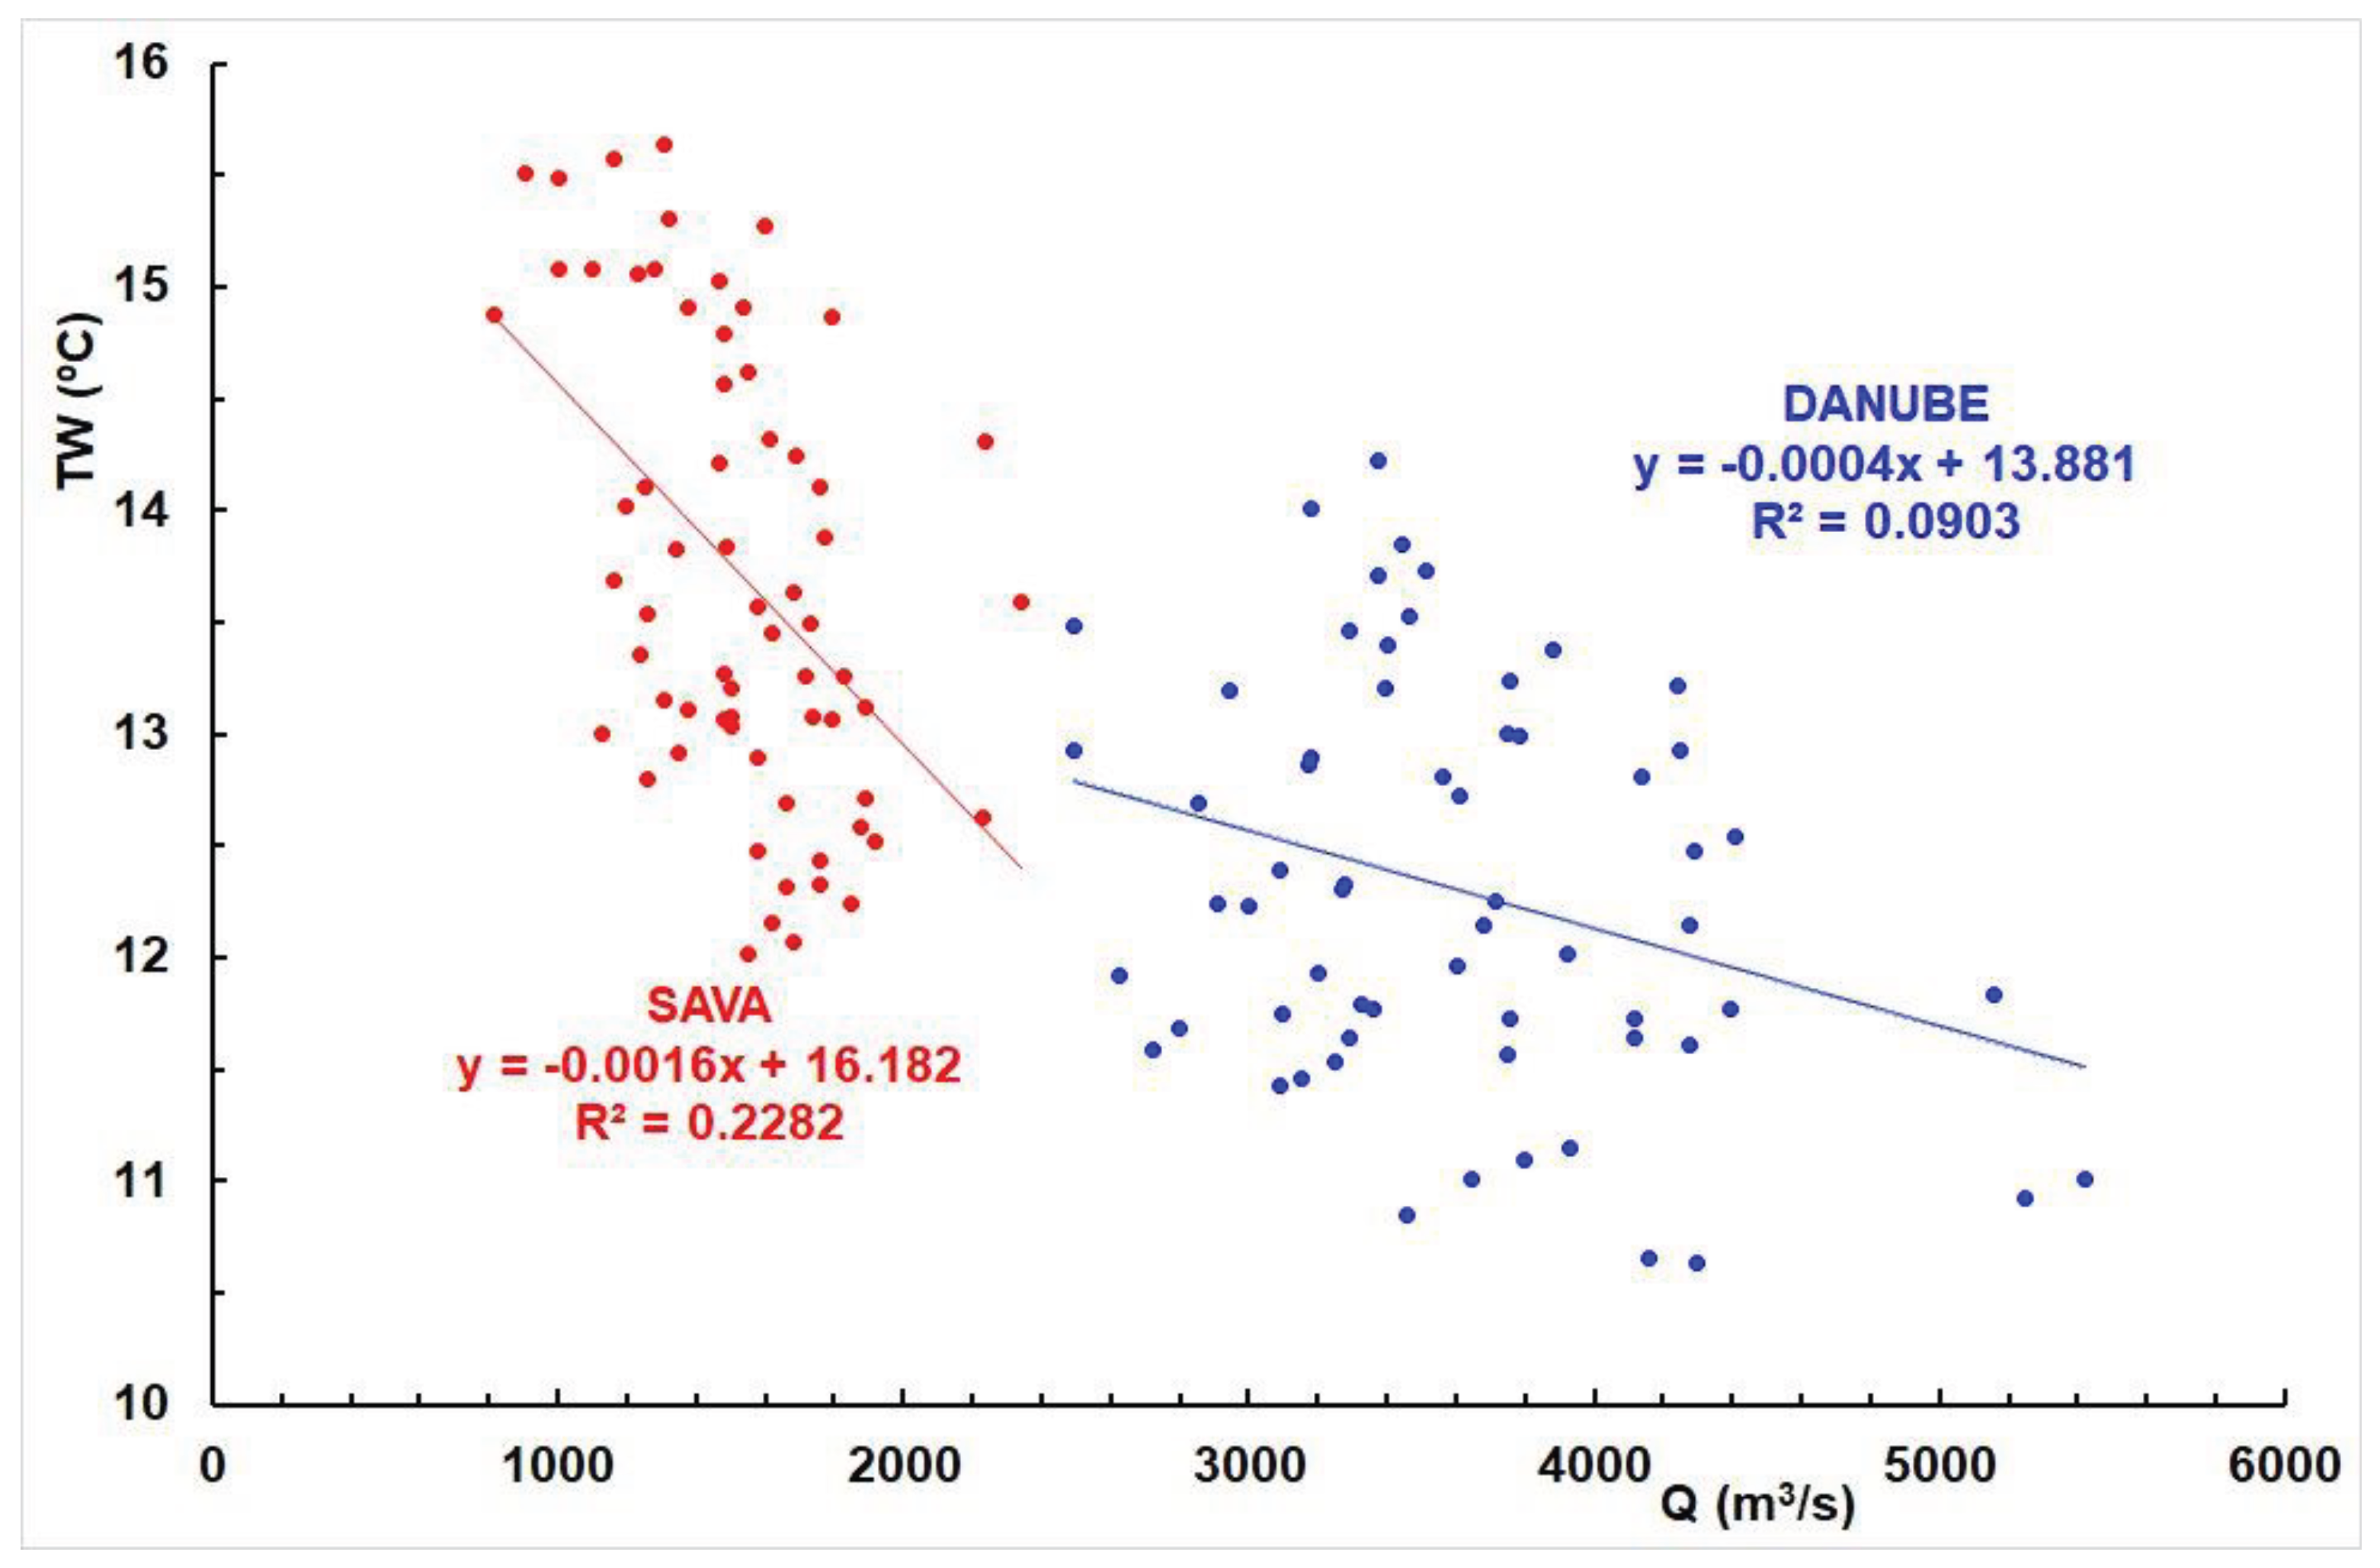
Figure 9.
Histograms of the average monthly discharges of Sava (red) and Danube (blue) during the 1956-2020 period.
Figure 9.
Histograms of the average monthly discharges of Sava (red) and Danube (blue) during the 1956-2020 period.
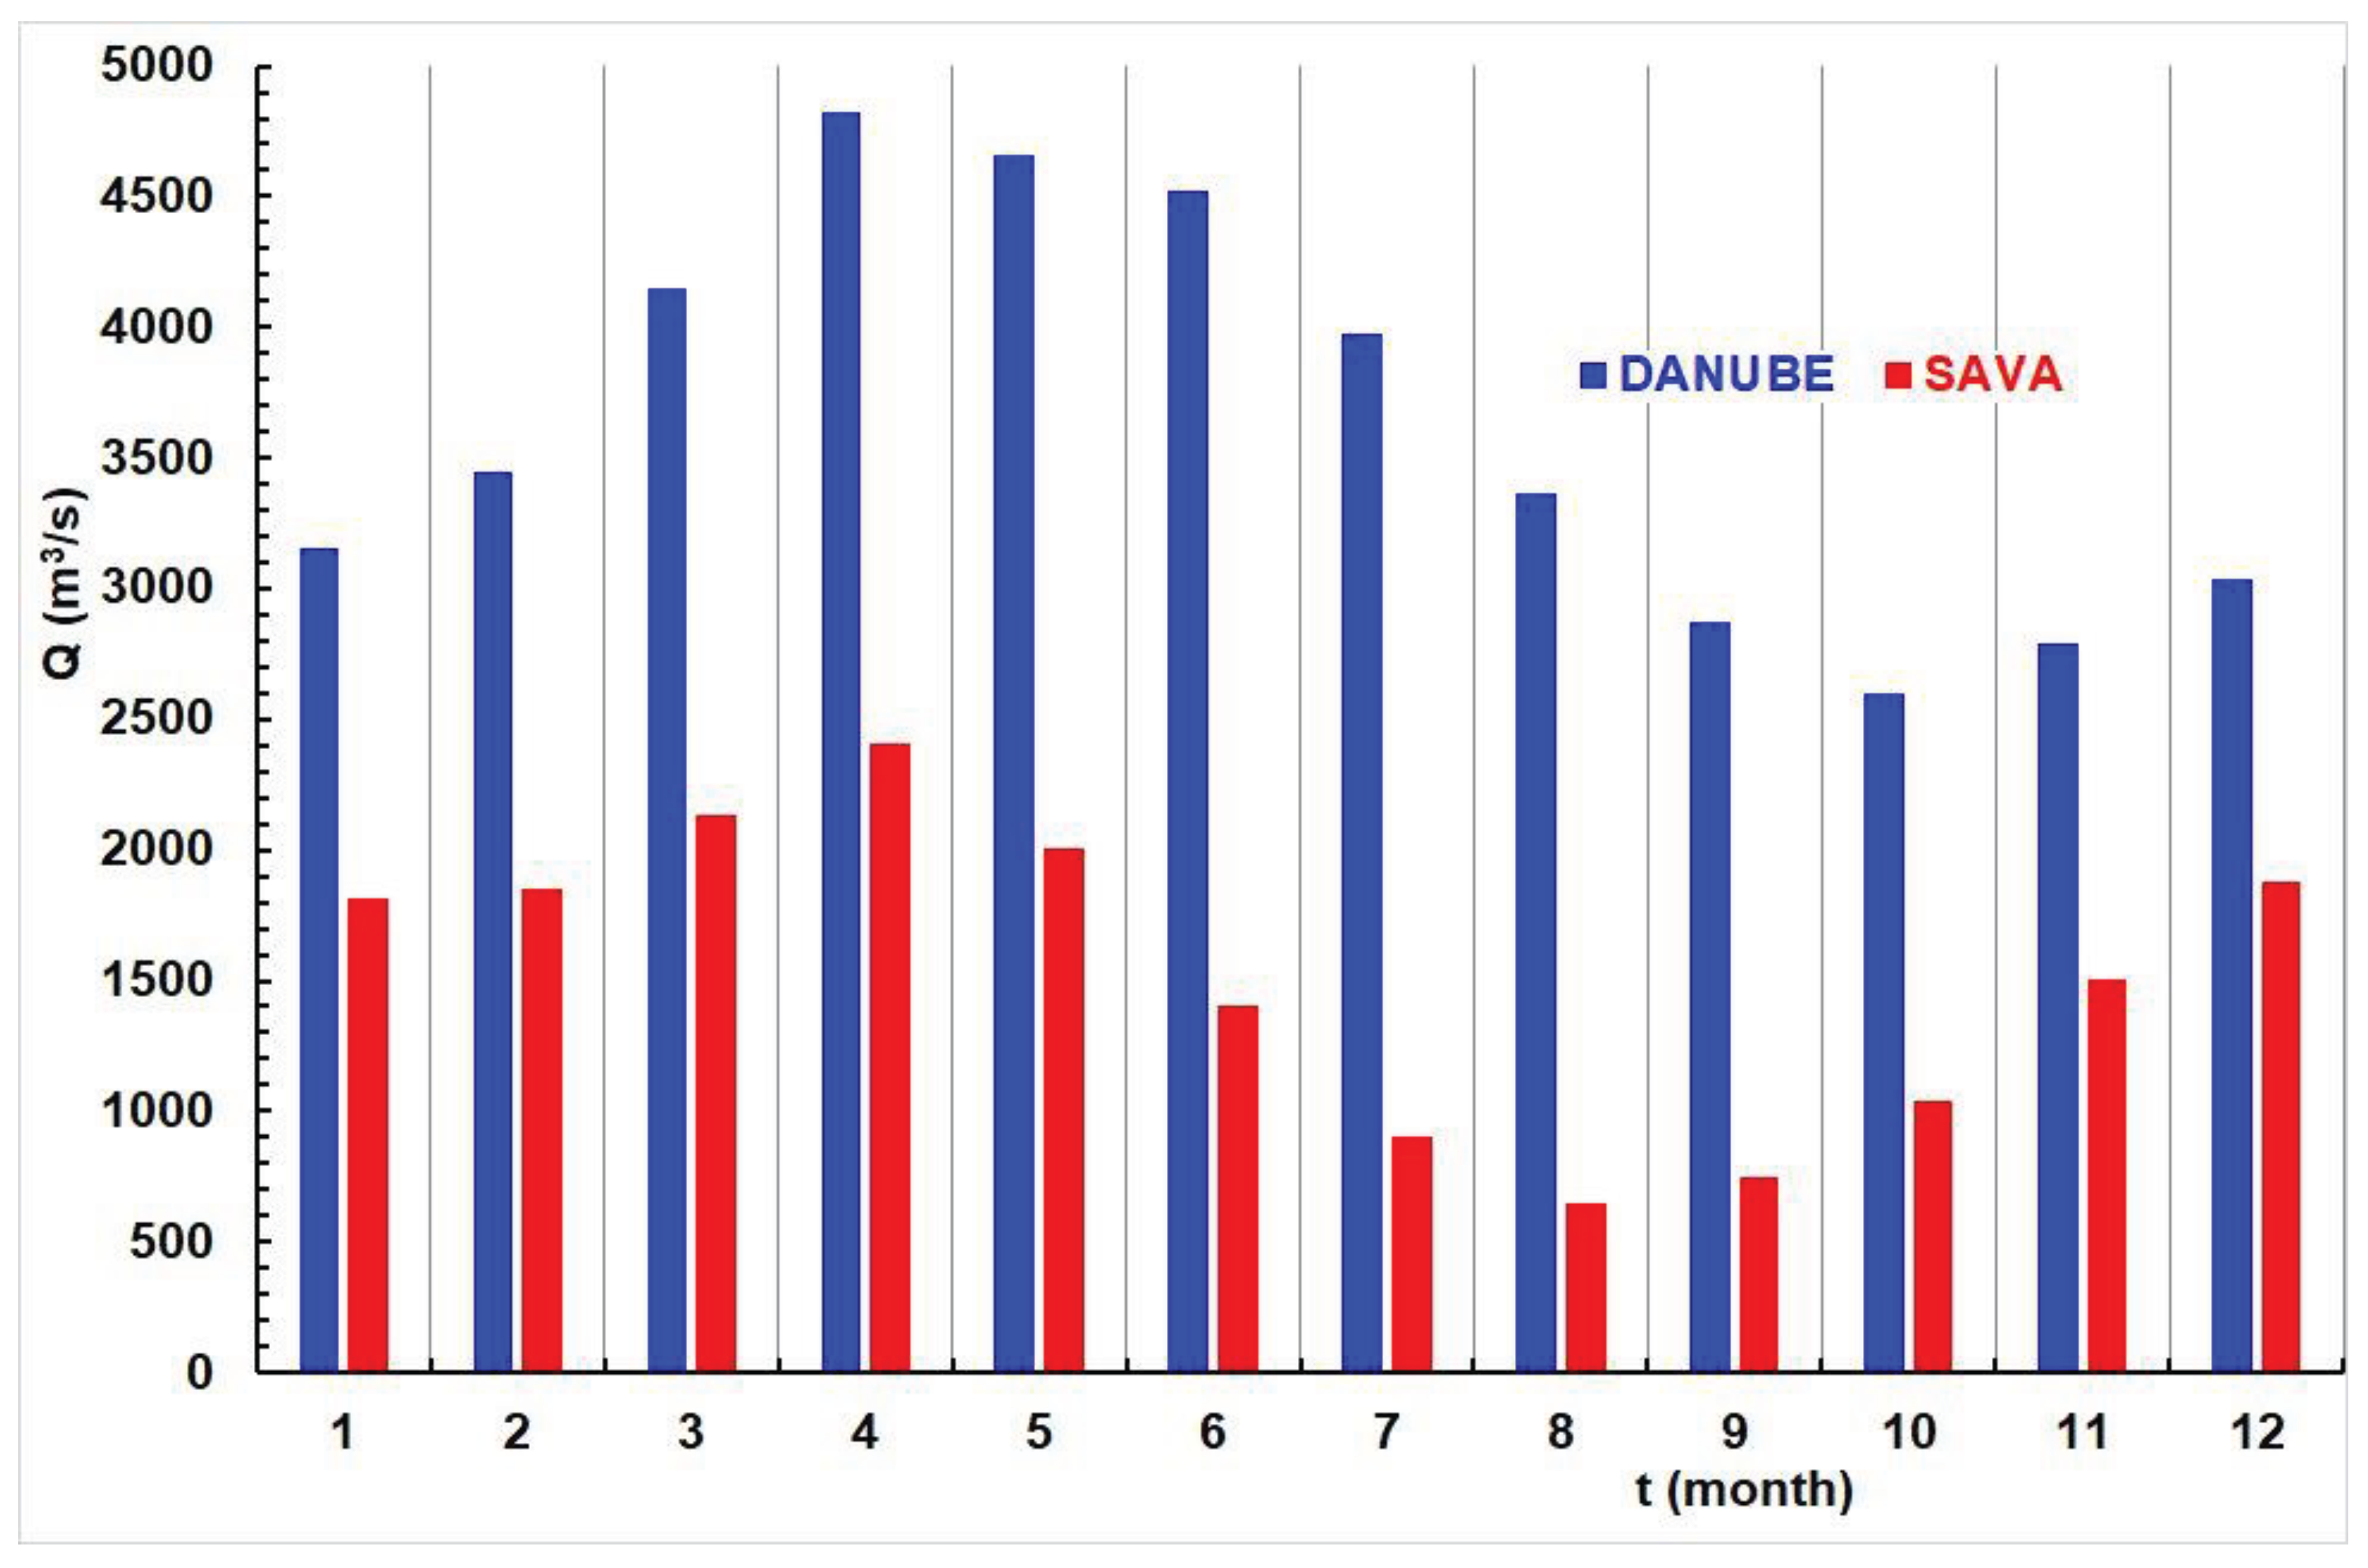
Figure 10.
Histograms of the average monthly Danube Zemun (blue) and Sava Belgrade (red) water temperature and Belgrade Observatory air temperature during the 1956-2020 period.
Figure 10.
Histograms of the average monthly Danube Zemun (blue) and Sava Belgrade (red) water temperature and Belgrade Observatory air temperature during the 1956-2020 period.
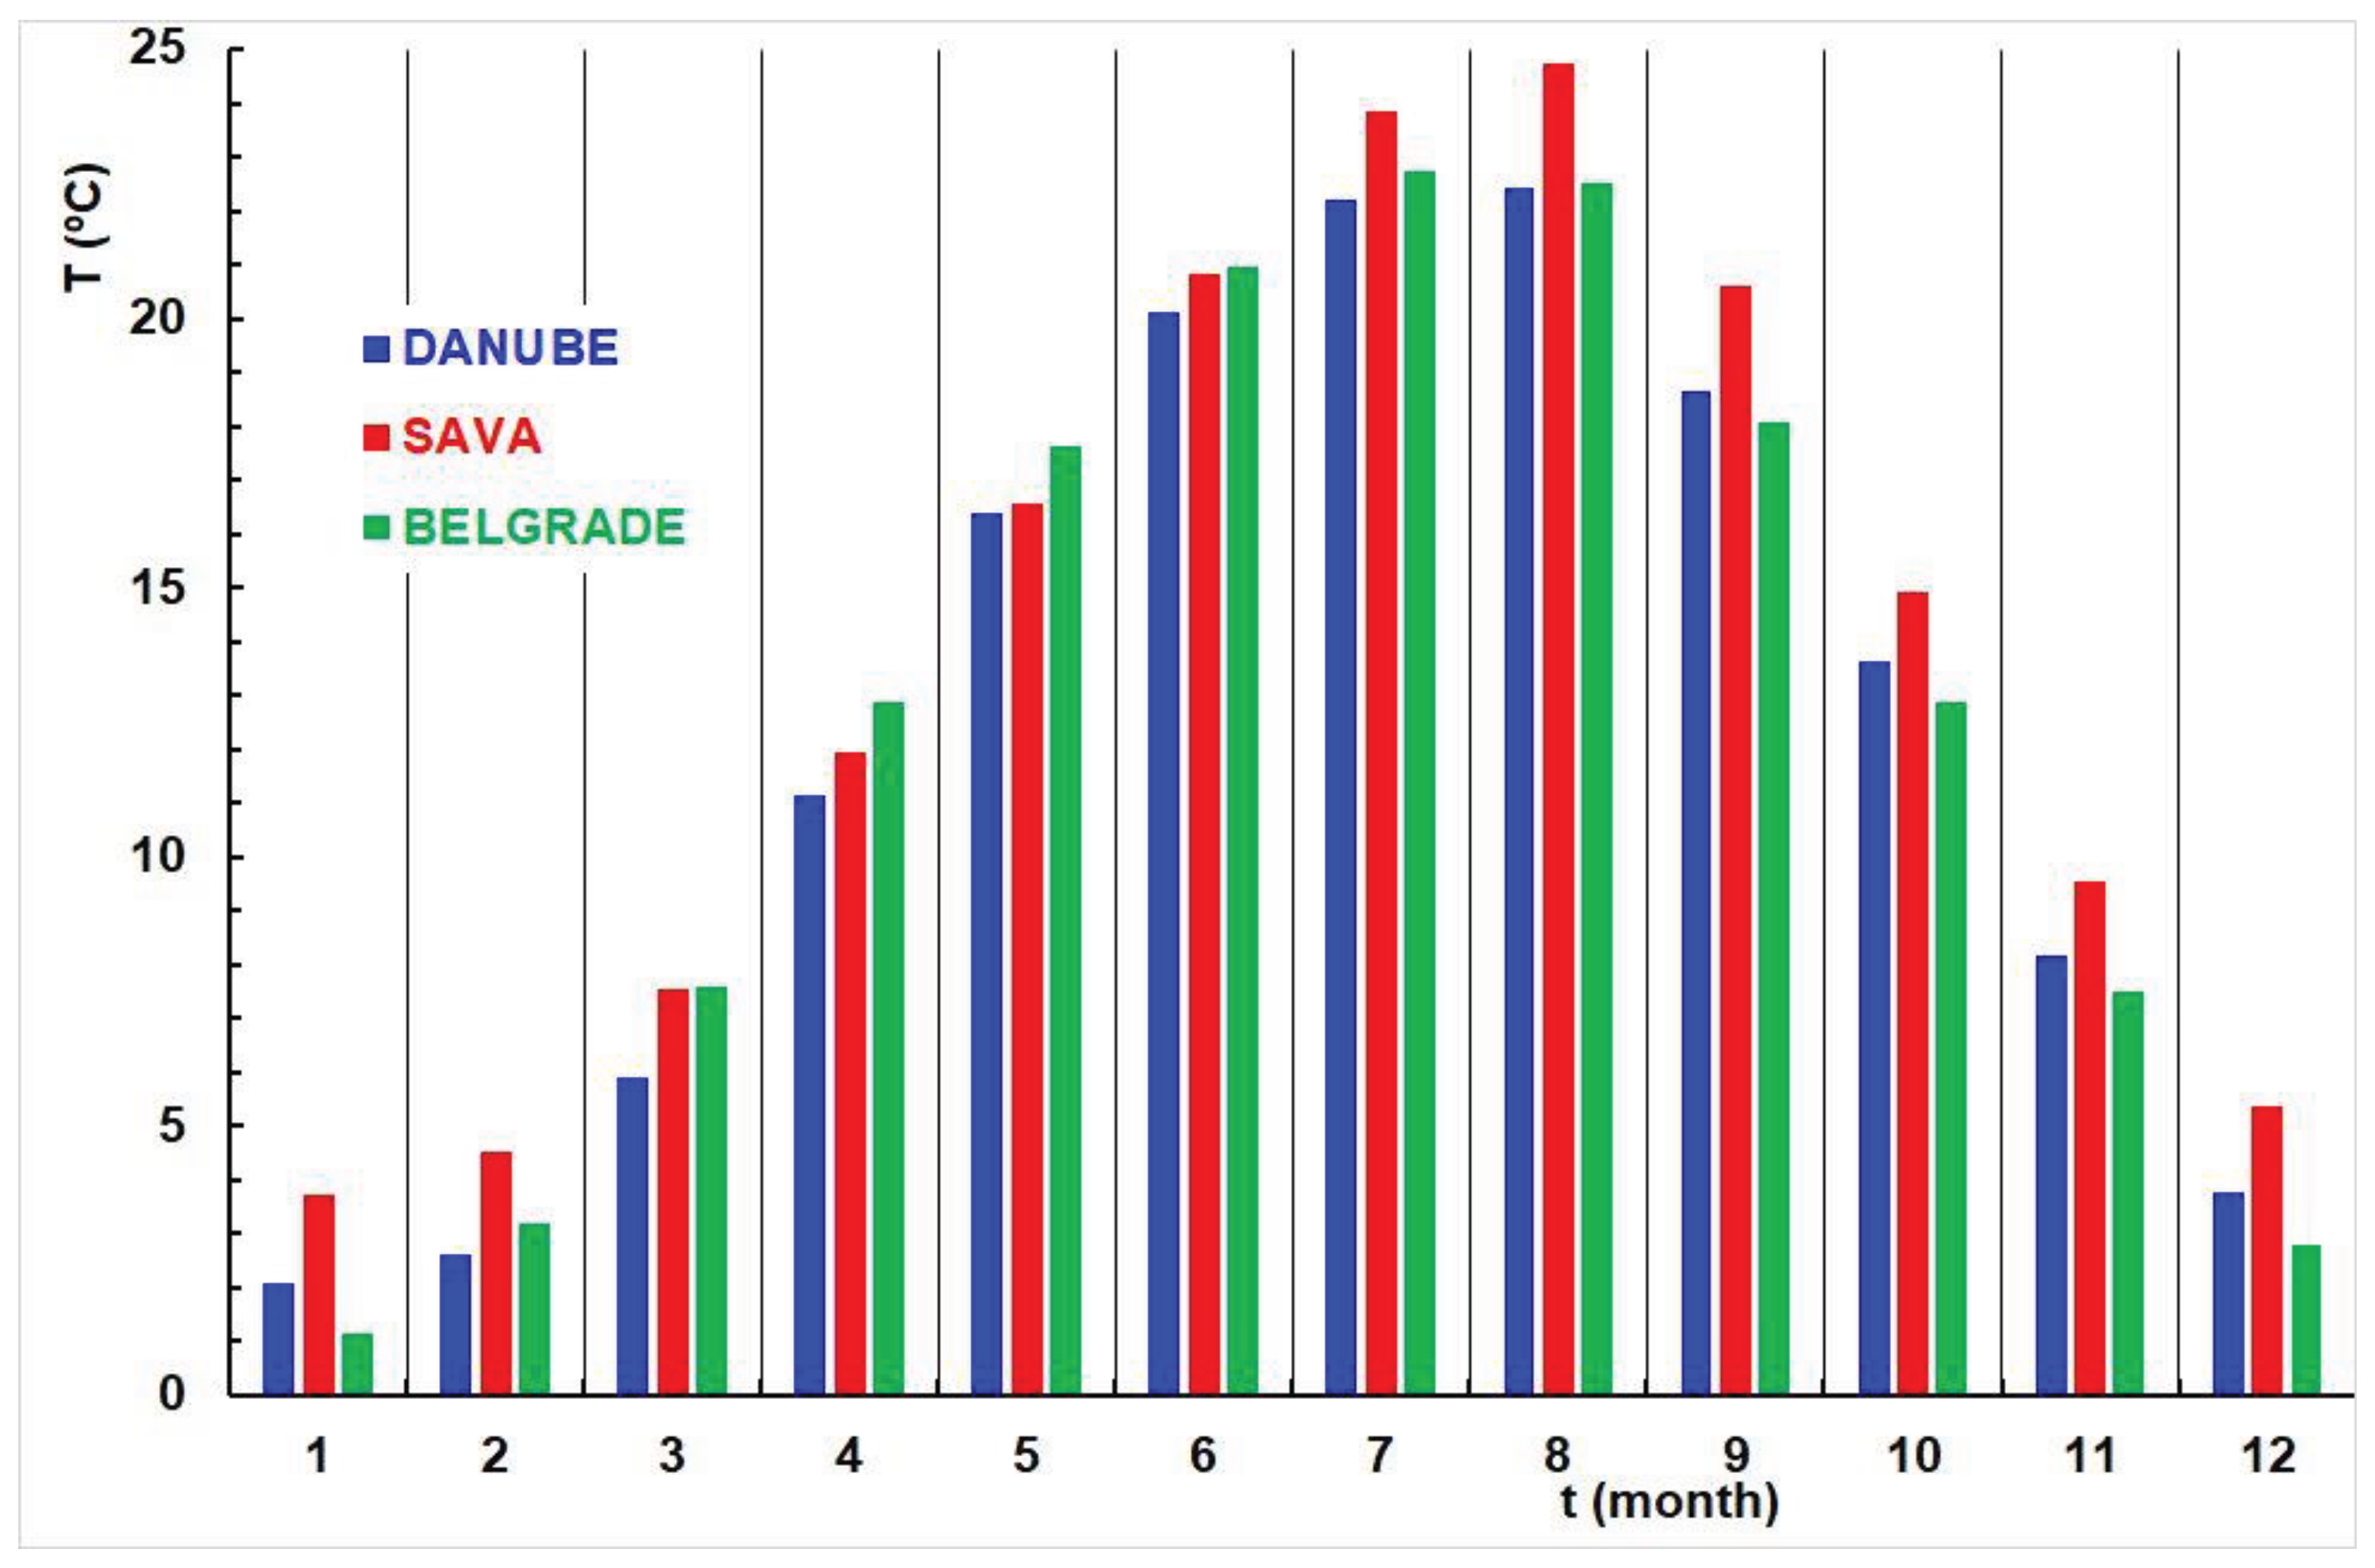
Figure 11.
Histograms of differences, ΔT, between the average monthly temperatures: TS –TD (Sava Belgrade – Danube Zemun), TB-TD (Belgrade observatory - Danube Zemun), TS-TB (Sava Belgrade - Belgrade observatory) during the 1956-2020 period.
Figure 11.
Histograms of differences, ΔT, between the average monthly temperatures: TS –TD (Sava Belgrade – Danube Zemun), TB-TD (Belgrade observatory - Danube Zemun), TS-TB (Sava Belgrade - Belgrade observatory) during the 1956-2020 period.
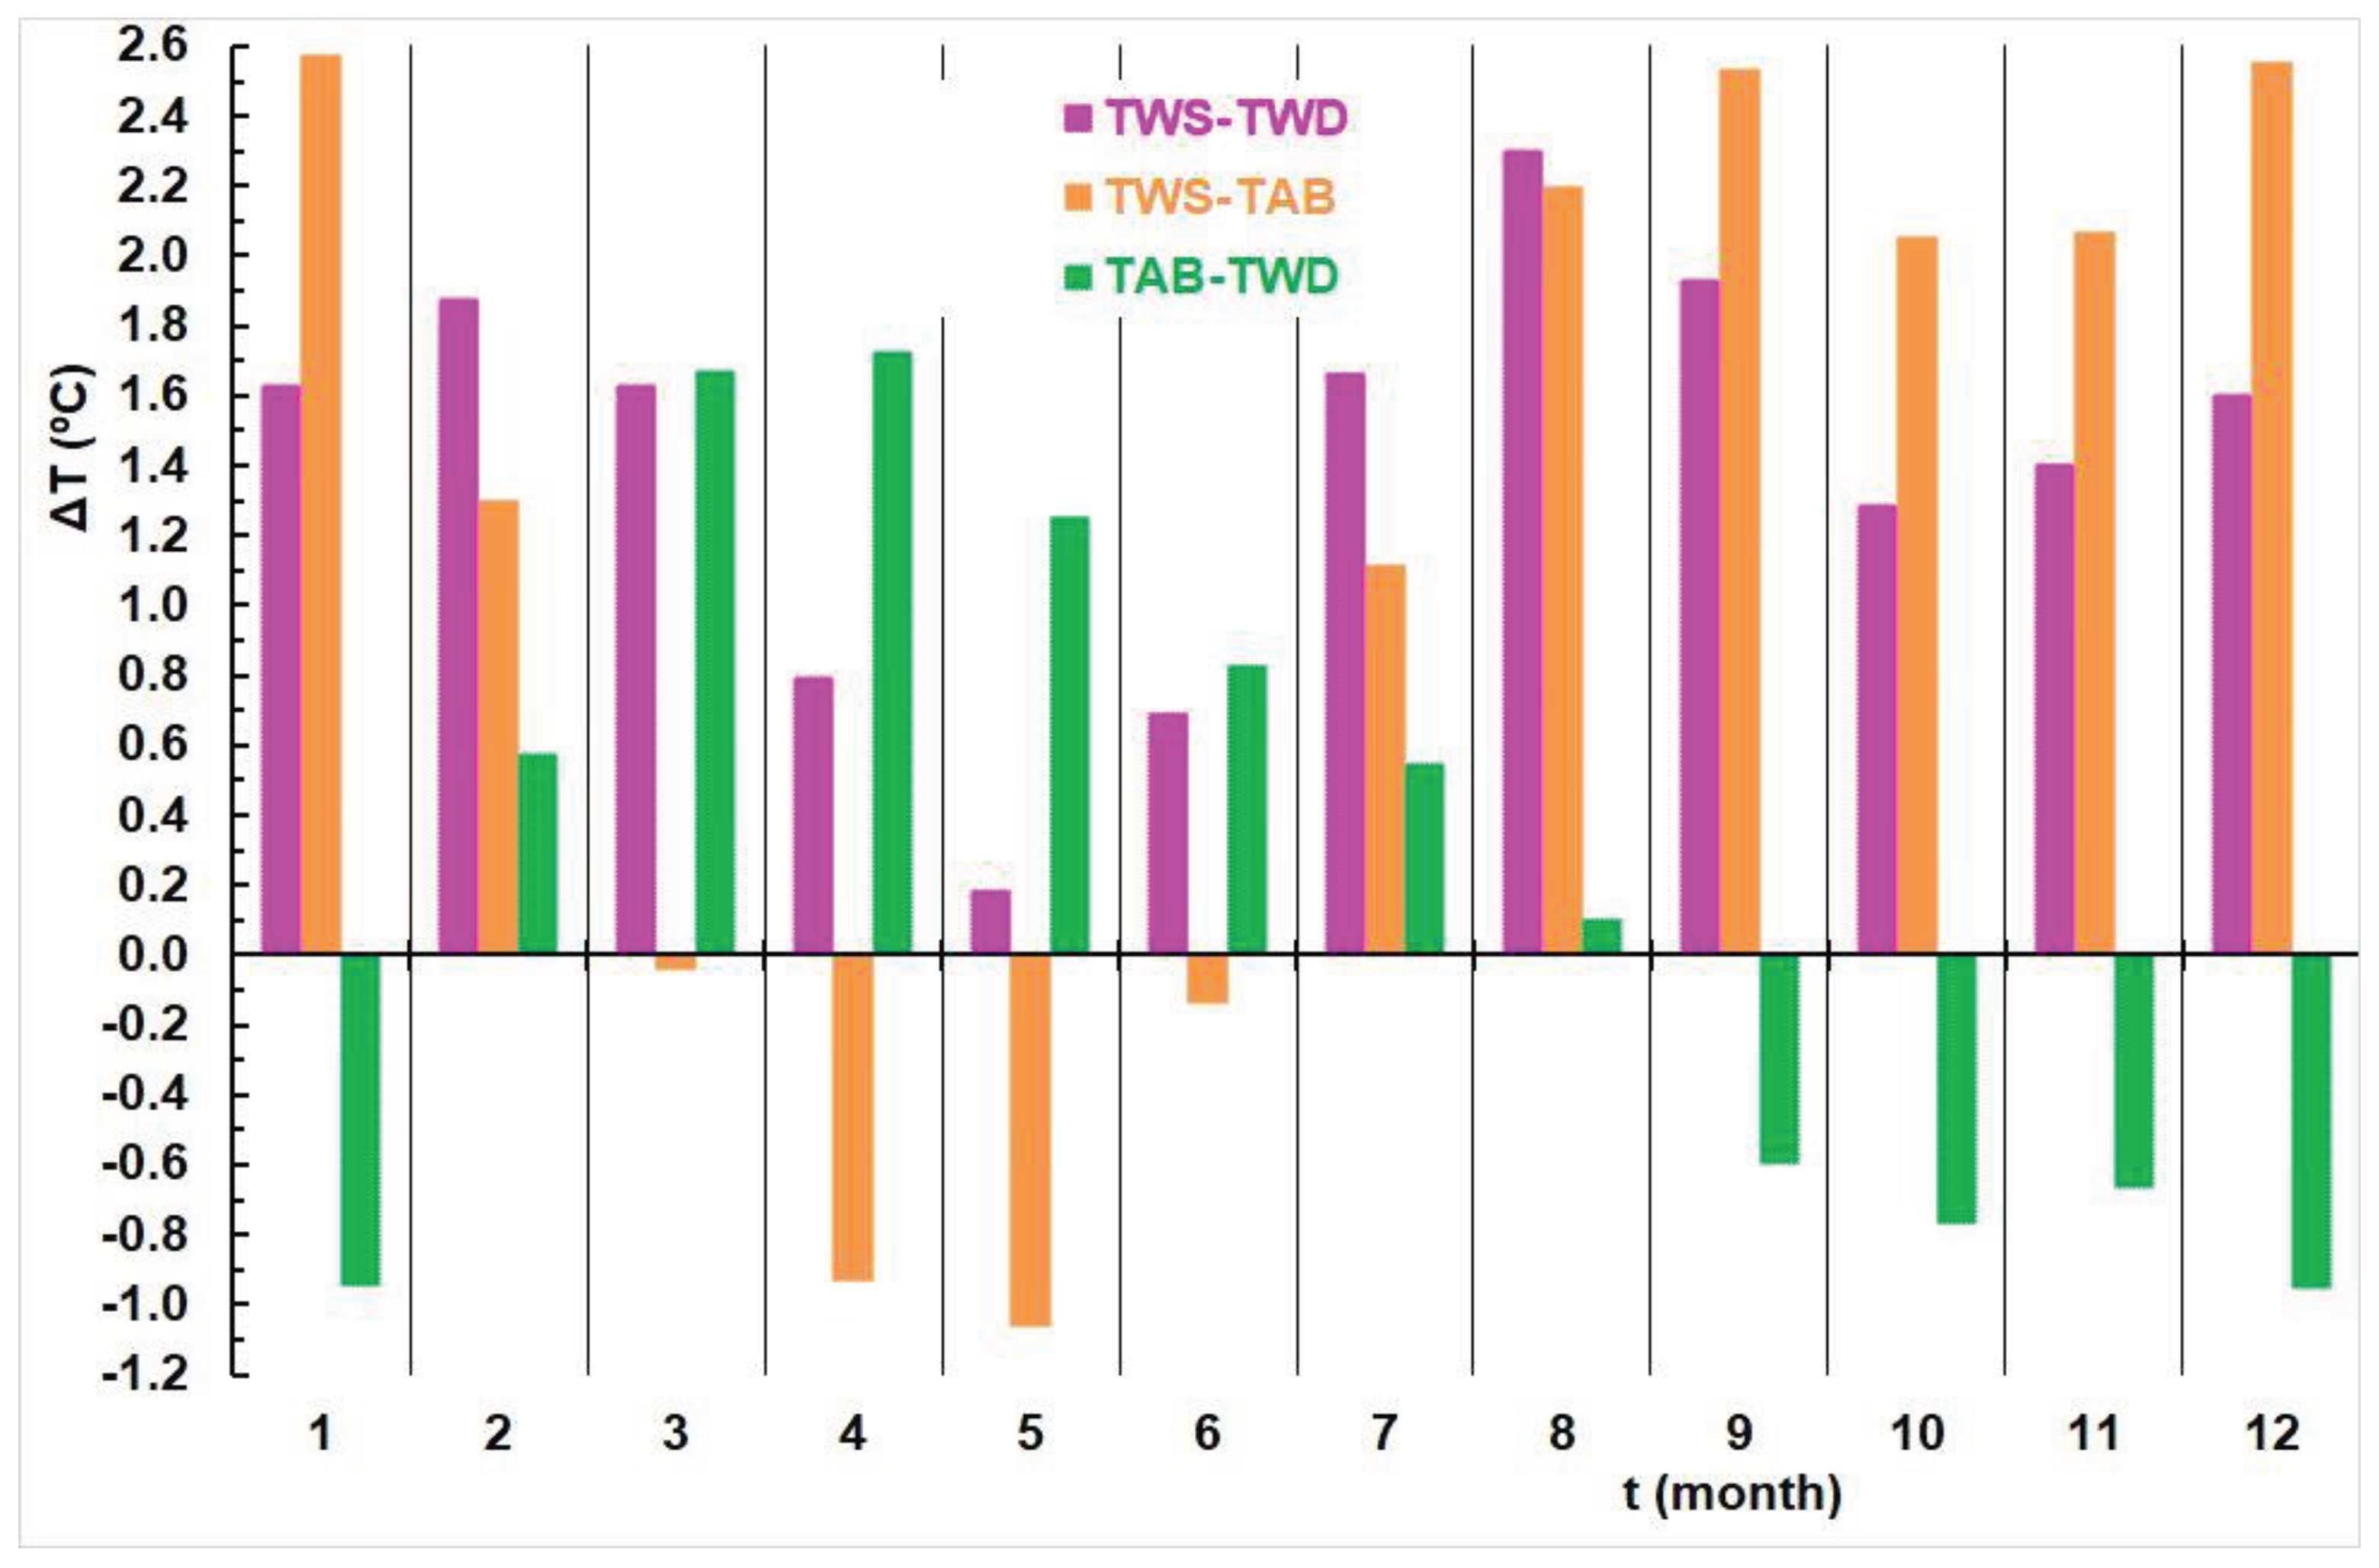

Table 1.
Coefficients of determination, R2, between time series of mean annual Danube water temperature, TWD, Sava water temperature, TWS, Belgrade air temperature, TAB, Danube discharge, QD, and Sava discharge, QS, during the 1956-2020 period.
Table 1.
Coefficients of determination, R2, between time series of mean annual Danube water temperature, TWD, Sava water temperature, TWS, Belgrade air temperature, TAB, Danube discharge, QD, and Sava discharge, QS, during the 1956-2020 period.
| R2 | TWD | TWS | TAB | QD | QS |
|---|---|---|---|---|---|
| TWD | 1 | 0.736 | 0.760 | -0.088 | 0.149 |
| TWS | 1 | 0.780 | -0.047 | -0.228 | |
| TAB | 1 | -0.017 | -0.113 | ||
| QD | 1 | 0,348 | |||
| QS | 1 |
Table 2.
List of the slope of the linear equation, a, the coefficient of determination, R2, and M-K probability values, p, calculated from the time series of the mean monthly and annual water and air temperatures at three analyzed stations during the 1956-2020 period.
Table 2.
List of the slope of the linear equation, a, the coefficient of determination, R2, and M-K probability values, p, calculated from the time series of the mean monthly and annual water and air temperatures at three analyzed stations during the 1956-2020 period.
| Danube | Sava | Belgrade | |||||||
|---|---|---|---|---|---|---|---|---|---|
| Month Year |
a (ºC/dec) |
R2 | p | a (ºC/dec) |
R2 | p | a (ºC/dec) |
R2 | p |
| January | 0.297 | 0.179 | 0.0001 | 0.407 | 0.292 | 3.2E-06 | 0.428 | 0.108 | 0.019 |
| February | 0.270 | 0.111 | 0.005 | 0.402 | 0.193 | 0.0007 | 0.415 | 0.0537 | 0.063 |
| March | 0.383 | 0.140 | 0.006 | 0.414 | 0.187 | 0.002 | 0.492 | 0.136 | 0.006 |
| April | 0.246 | 0.131 | 0.004 | 0.258 | 0.139 | 0.003 | 0.397 | 0.172 | 0.0005 |
| May | 0.280 | 0.124 | 0.009 | 0.316 | 0.109 | 0.012 | 0.314 | 0.112 | 0.011 |
| June | 0.331 | 0.155 | 0.001 | 0.427 | 0.182 | 0.002 | 0.421 | 0.233 | 0.0001 |
| July | 0.461 | 0.303 | 5.8E-06 | 0.549 | 0.292 | 3.5E-05 | 0.538 | 0.387 | 4.8E-07 |
| August | 0.593 | 0.394 | 1.9E-07 | 0.625 | 0.374 | 2.2E-07 | 0.602 | 0.332 | 2.9E-06 |
| September | 0.327 | 0.201 | 0.0005 | 0.573 | 0.285 | 1.9E-05 | 0.310 | 0.109 | 0.022 |
| October | 0.289 | 0.234 | 2.7E-05 | 0.454 | 0.274 | 8.6E-06 | 0.235 | 0.0695 | 0.024 |
| November | 0.320 | 0.214 | 0.0003 | 0.414 | 0.329 | 4.3E-06 | 0.257 | 0.0418 | 0.121 |
| December | 0.339 | 0.216 | 0.0002 | 0.436 | 0.346 | 9.2E-07 | 0.229 | 0.0417 | 0.064 |
| Year | 0.344 | 0.548 | 6.7E-11 | 0.440 | 0.655 | 1.0E-12 | 0.389 | 0.548 | 4.3E-10 |
1 Numbers highlighted in blue indicate statistical significance with 0.01 <p < 0.05 while numbers highlighted in red signify higher significance with p < 0.01.
Disclaimer/Publisher’s Note: The statements, opinions and data contained in all publications are solely those of the individual author(s) and contributor(s) and not of MDPI and/or the editor(s). MDPI and/or the editor(s) disclaim responsibility for any injury to people or property resulting from any ideas, methods, instructions or products referred to in the content. |
© 2024 by the authors. Licensee MDPI, Basel, Switzerland. This article is an open access article distributed under the terms and conditions of the Creative Commons Attribution (CC BY) license (http://creativecommons.org/licenses/by/4.0/).
Copyright: This open access article is published under a Creative Commons CC BY 4.0 license, which permit the free download, distribution, and reuse, provided that the author and preprint are cited in any reuse.


