Submitted:
02 April 2024
Posted:
02 April 2024
You are already at the latest version
Abstract
The performance of OpenFOAM in strong scaling tests on HPC systems with AMD EPYC processors exhibits a pronounced superlinear speedup. Simple test cases show superlinear speedups of over 300%, which significantly impacts the efficient use of computing resources. With the last generation of HPC architectures, a superlinear speedup of about 10% to 20% was well expected and accepted by CFD users. The measured superlinear speedup is much more pronounced and withstands the communication overhead to even larger scales. A detailed performance analysis of OpenFOAM follows, employing various High-Performance Computing (HPC) architectures, including AMD, ARM and Intel systems. The performance metric FVOPS (Finite VOlumes solved Per Second) is introduced to compare the performance of Computational Fluid Dynamics (CFD) applications when varying the grid size, as occurs in a strong scaling test. The achievable FVOPS depends on various factors, including the simulation type, boundary conditions, and especially the grid size of a use case. Analysing FVOPS on a single node level with varying grid size shows a significant difference in performance and cache utilization, which explains the large superlinear speedups seen in the strong scaling tests. Furthermore, FVOPS can be used as a simple benchmark to determine the optimal number of grid elements per rank to simulate a given use case at peak efficiency on a given platform, resulting in time, energy, and cost savings. The FVOPS metric also facilitates the direct comparison between different HPC architectures. The tests using AMD, ARM, and Intel processors show a peak in performance when employing around 10,000 grid elements per core. The presence of a large L3 cache on AMD processors is particularly advantageous, as indicated by L3 cache miss rates observed on AMD EPYC processors. Our results suggest that future HPC architectures with larger caches and higher memory bandwidth would benefit the CFD community.
Keywords:
OpenFOAM
; CFD
; HPC
; superlinear speedup
1. Introduction
Computational Fluid Dynamics (CFD) accounts for a large share of the utilisation of High-Performance Computing (HPC) systems, particularly supercomputers. An example is the supercomputer Hawk from HLRS, where the proportion of projects using CFD is over 60% [2].
The exaFOAM project [3] aims at exploring the use of massively parallel HPC architectures for CFD simulations using the software OpenFOAM [4]. There is a particular interest in scalable simulations using different HPC architectures. The study focuses explicitly on AMD, ARM, and Intel systems. The findings reveal a noteworthy phenomenon – specific HPC systems demonstrate a remarkable superlinear speedup, i.e., that the speedup is greater than the number of processors that are used [5].
The investigation encompasses two test cases: the exaFOAM Grand Challenge with the DLR Combustor and a more straightforward laminar flow case. A superlinear speedup ranging from 10% to 20% is usually seen when using HPC systems for CFD [1]; however, some current HPC architectures display much larger speedups. Notably, strong scaling tests on AMD EPYC processors exhibit superlinear speedups exceeding 300%. Such a large difference in performance impacts the efficient utilisation of computer resources.
The core methodology involves strong scaling tests in which the total number of grid elements remains constant while the number of computing nodes increases. This approach reduces the number of solved grid elements per rank as more compute nodes are added to the calculation. Recognizing that OpenFOAM and CFD applications are memory-bound by nature is essential. Hence, the bottleneck for CFD applications lies in the bandwidth with which the data is fed to the CPU in HPC architectures.
This study also investigates the reason for the observed superlinear scaling. Superlinear scaling is expected in scenarios where the available memory bandwidth increases with the number of nodes. However, we show that with the AMD EPYC platform, the better utilization of the L3 cache is the main reason for the superlinear speedup. It is also emphasised that the advantages resulting from the better use of resources come up against limits imposed by the communication overhead at larger scales. Using the AMD EPYC platform, the superlinear speedup withstands the anticipated communication overhead, extending its influence even to larger scales. This phenomenon is analyzed in detail, and its implications are explored.
2. Strong Scaling Tests
The strong scaling tests used the Hawk supercomputer from HLRS, which is an HPE Apollo system with 5632 compute nodes, each with dual socket AMD EPYC Rome 7742 processors (2 x 64 cores @ 2.25GHz), 256 GB of RAM and InfiniBand HDR200 network. The AMD EPYC CPUs have a hierarchical L3-cache configuration, with each socket having 16 Core Complexes (CCX), and each CCX having, in turn, four Zen2 cores and 16MB of shared L3-cache, making 256 MB per socket. OpenFOAM v2112 and v2212 were used in the benchmarks, compiled with GCC 10.2 and HPE MPT 2.26.
2.1. DLR Combustor
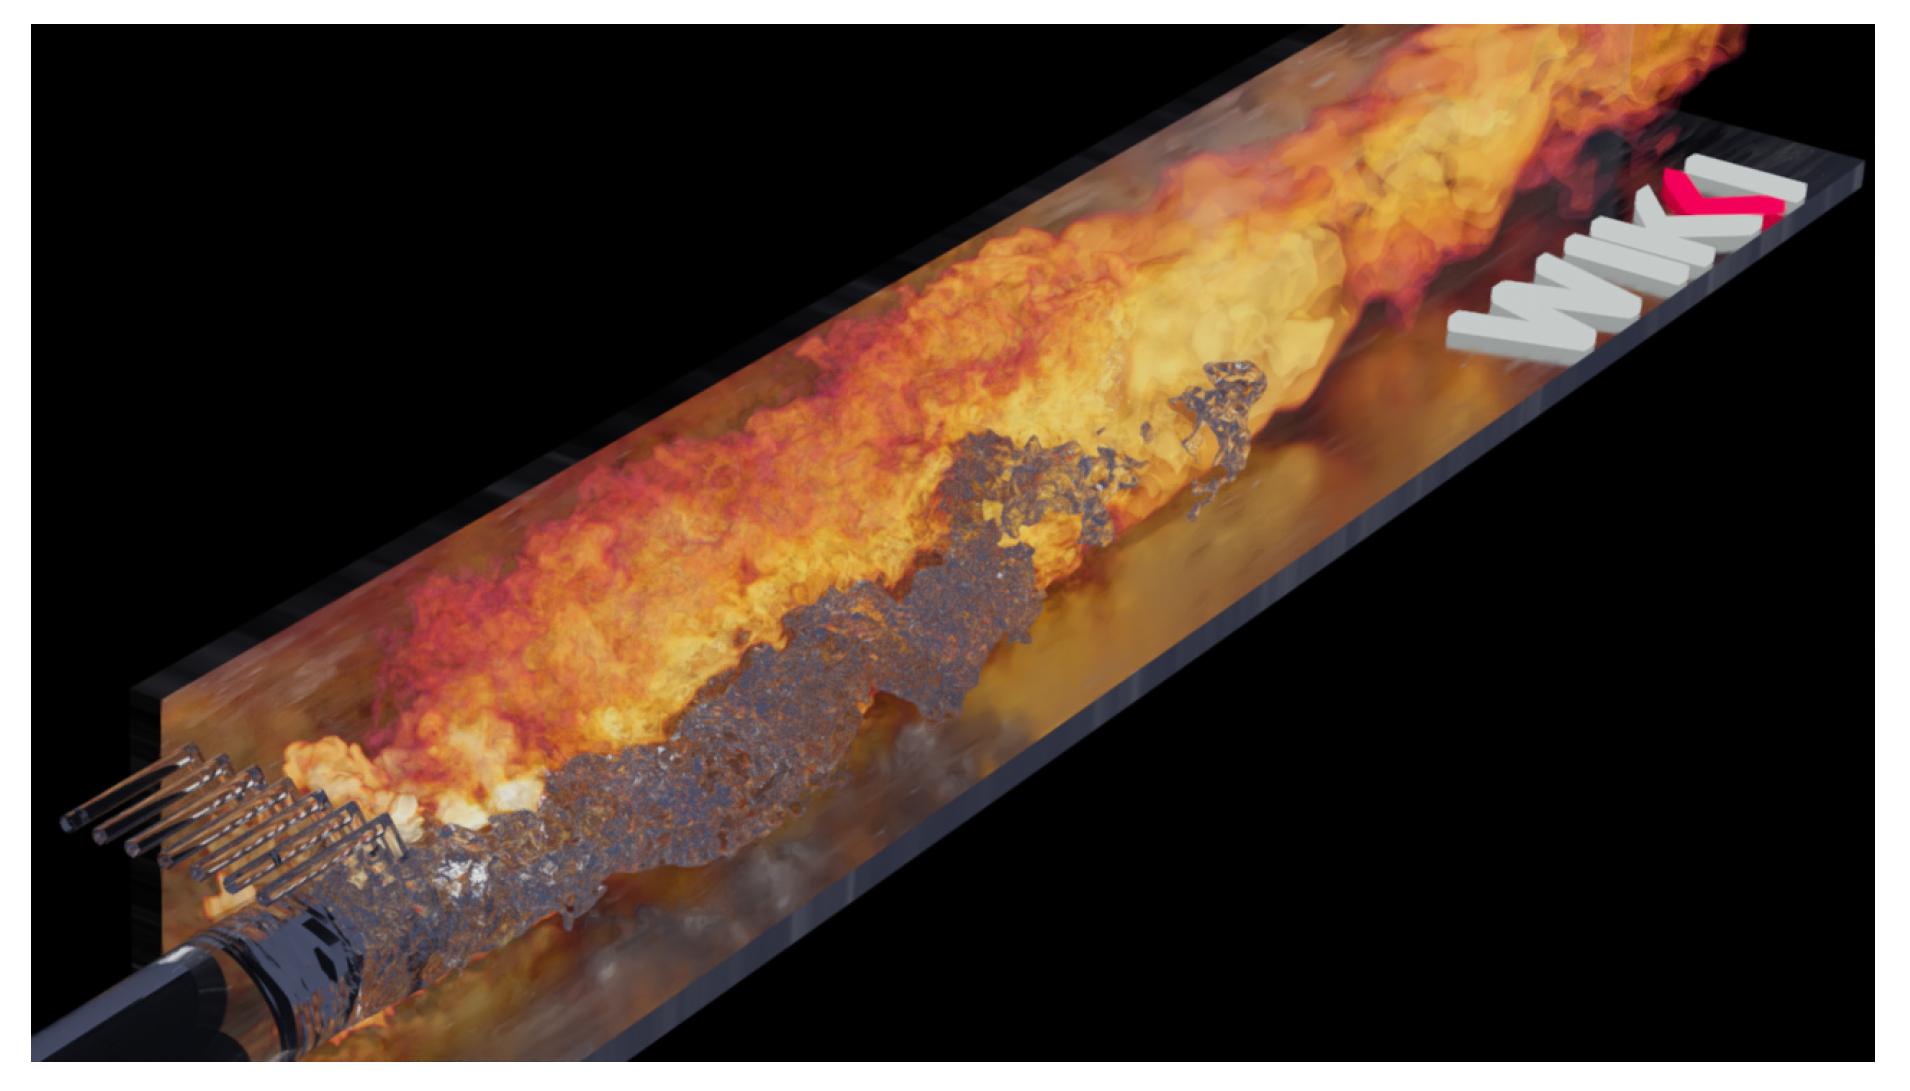
The considered combustor stems from an experimental setup constructed by Severin [6] at the Institute of Combustion Technology of the German Aerospace Center (abbreviated as DLR in German). The burner is based on the Recirculation-Stabilized Jet Flame (RSJF) concept, which is better known as FLOX. Initially developed for industrial furnaces, this technology has great potential in the application of gas turbines. Compared to the widespread swirl burners, RSJF combustors feature lower NOx emissions, more homogeneous temperature distribution, and operate with a broader range of fuels and loads. The main goal of the experimental work was to clarify how the recirculation contributes to flow stabilization. Apart from the experiments, several numerical investigations with the same geometry were performed, e.g. by Ax et al. [7] and Gruhlke et al. [9]. The exaFOAM Grand Challenge GC2 test case files [12] and grid and restart files [13] are available.
Figure 1.
Renderingof the DLRCJH combustor flame with fuel.
We consider here the strong scaling with the case consisting of 489 million cells. The metric used is wall-clock time per time step, whereby I/O and initialization (i.e. the first time step) were not accounted for. The smallest run was performed on 8 nodes (1,024 cores) due to memory limitations, and the largest run with 256 nodes (32,768 cores). Figure 2 shows two series of measurements. The “pre-exaFOAM” series demonstrates the speed-up that was measured before the improvements made by the exaFOAM project. Due to this measurement, the most efficient run was on 32 nodes with a superlinear speedup of 42% over the ideal one. The most performant run was on 64 nodes. Profiling of the case identified an inefficiency in the algorithm responsible for the turbulence modelling, which triggered expensive MPI communication every time step. An algorithmic improvement drastically reduced the amount of MPI communication. The corresponding speedup is presented under the label “exaFOAM”. With the improvements, the speedup is superlinear for all decompositions using more than 8 nodes. The most efficient is at the same time the run with the highest performance carried out on 256 nodes with the superlinear speedup of 98 being 206% higher than the corresponding ideal speedup of 32. Comparing performance before and after the improvement, the total time-to-solution is decreased by one order of magnitude, whereby the highest speedup improved from 10 (64 nodes) to 98 (256 nodes).
2.2. Lid-Driven Cavity
The flow inside a cavity driven by the movement of its upper boundary (lid) is one of the most standardized and ubiquitous test cases for CFD software (see Figure 3). Its simple geometry and boundary conditions make the test case easy to set up and validate. The lid-driven cavity has been used for more than 50 years to test and benchmark fluid dynamics codes [10], and has been adapted in the exaFOAM microbenchmark MB1. The test case files are available at Ref [11].
The strong scaling study employed the test case variant with a fixed number of iterations and 64 million grid elements. Figure 4 shows the strong scaling results, with the speedup with 32 nodes (4,096 cores) being 340% of the ideal (linear) speedup. The results maintain a superlinearity for up to 256 compute nodes (32,768 cores).
3. Single Node Performance
The performance of OpenFOAM in the AMD EPYC architecture with increasing grid size is analyzed to support the findings of the strong scaling. For this purpose, the performance metric FVOPS (Finite VOlumes solved Per Second) is introduced, similar to the MLUPS (Mega Lattice Updates Per Second) metric used for Lattice Boltzmann codes [19]. The FVOPS metric is defined as:
For unsteady simulations, the runtime per time step is used, while for steady-state simulations, the runtime per iteration is the chosen divisor. By combining simulation size and runtime, FVOPS offers a comprehensive performance evaluation. As the MLUPS metric, FVOPS reflects the system’s efficiency in CFD applications. Various simulation parameters affect the FVOPS metric, including grid size, partitioning, parallel efficiency, and the number of variables being solved. It is also a versatile metric for cross-system comparisons when using the same set of parameters.
Focusing on the FVOPS results in Figure 5 and Table 1, the difference in performance between the simulation with the largest grid (27M) and the sweet spot (1.9M) with approximately 15k grid elements per rank is 438%. This result supports the superlinear speedup seen in the strong scaling test, as the system performance increases dramatically with the decrease in grid size.
In the strong scaling test with the lid-drive cavity case (Figure 4), the superlinearity is highest with 15k elements per core, which correlates well with the FVOPS performance in a single node. Although being a different setup, the DLR combustor results (Figure 2) show the same trend, with clearly superlinear scalability with 29k or 15k grid elements per core.
4. Analysis Using Different Architectures
The analysis using the AMD EPYC 7742 showed a pronounced difference in performance when using grids of different sizes. To evaluate the impact of the CPU architecture on the performance, different architectures were studied, described in Table 2. Although the same case configuration and sizes have been used in all platforms, the amount of grid elements per core varies, as each system has a different core count per node.
In Figure 6, FVOPS is calculated per node, as this is the most important metric. However, the amount of grid elements per core is used in the x-axis to facilitate the comparison. Most systems show peak performance using around 10k grid elements per rank, with only the Armida AMD system showing better performance at around 50k grid elements per rank. In the systems using Intel, ARM, and the Armida AMD CPU, the performance difference is between 140% and 250% when using the largest grid size and the grid with peak performance. This difference is more pronounced using the Hawk system with AMD EPYC 7742 CPU, with the peak performance being 438% higher. It can be argued that the more significant difference in the performance with the AMD EPYC 7742 CPU is due to its larger core count (64 cores per socket) and its larger L3 cache (256 MB).
In summary, the AMD EPYC 7742 CPU platform has a significant performance advantage. The performance of the other platforms is lower, especially when using less than 60k grid elements per core.
5. Profiling of L3 Cache and MPI Overhead
It is often claimed that the reason for the superlinear speedup is that more memory bandwidth is available in parallel execution [1,5]. In the particular example being analyzed, however, it is argued that the better utilization especially of the L3 cache is the main reason for the superlinear speedup. To study the behaviour of the system regarding the L3 cache utilization, the L3 ratio is defined as the ratio between L3 cache misses and hits:
The measurements using L3 cache counters with the AMD EPYC 7742 are, unfortunately, not as accurate as they could be. The L3 ratio has been measured using the tool perf [14], accounting for total (system and user) L3 cache hits and misses. The AMD Zen2 platform does not differentiate between L3 cache counters from the system and user spaces. That prevents the use of PAPI counters [15], for example, as PAPI uses counters from the user space. This can be different in new AMD architectures. Nevertheless, user space L3 cache hits and misses are likely to dominate the total cache metric, as the compute nodes in Hawk use an operating system with minimal system processes.
Although not as accurate as L3 cache counters from the user space, the L3 ratio using total counters is shown in Figure 5 and Table 1. With the largest grid, the L3 ratio is over 80%, showing that, at this point, the performance is limited by the main memory access. On the contrary, at the sweet spot, the L3 ratio is minimal, which translates into less access to the main memory and, consequently, more useful computation by the compute cores. These results corroborate the finding that the system performance increases with a decrease in grid size, but even considering that the L3 ratio increases at grid sizes below the sweet spot, it still does not explain the pronounced drop in performance at the smallest grid sizes.
To investigate the drop in performance at the smallest grid sizes, which imply small memory footprints and short runtimes, the MPI communication has been profiled using the tool mpiP [16]. Figure 5 shows the MPI ratio as the fraction of compute time and time spent in MPI communication. The MPI ratio increases as the grid size decreases. It is observed that as the runtime per time step gets shorter (for 15k grid elements it is about 0.007s), the importance of the MPI latency increases, being finally dominant.
6. Modeling the FVOPS Behavior Using POP Metrics
To measure L3 cache counters, the user has to have administrator privileges in most systems. In the case the user has no access to the L3 cache counters, the use of POP metrics [17] measured with the tool extrae [18] is an option to evaluate the performance. Figure 7 shows the FVOPS for one node, along with two of the POP metrics: Instructions per cycle (IPC) and parallel efficiency (PE). IPC represents the number of instructions executed by the CPU for each clock cycle. Lower values of IPC indicate a low rate of computation, which typically comes from stalled processes waiting for data. PE measures the efficiency of the distributed computation and the communication associated with it. PE is a compound metric defined as the product of the load balance and the communication efficiency.
The IPC follows the pattern of FVOPS when decreasing the grid size, although the IPC does not drop significantly for small grid sizes as the FVOPS. The PE, on the other hand, decreases steadily with the decrease of the grid size. When multiplying these two metrics, the new metric IPC*PE shows a similar behaviour as measured with FVOPS (see Figure 8), and can also be used as a guide to finding the sweet spot in a particular system. The POP metrics can also be seen in Table 1.
7. Summary
Strong scaling tests showed significant superlinear speedups of up to 340% using OpenFOAM on the Hawk supercomputer, which is much higher than that obtained with the previous generation of computing platforms.
The driving force behind the observed superlinear speedups is the better performance of simulations with a specific grid size. This outlines that all platforms, regardless of processor type, exhibit an optimal performance threshold at a specific grid element per rank ratio. This knowledge can guide CFD practitioners seeking to optimize the performance of their simulations on diverse HPC architectures.
A contribution of this study is the proposal of the FVOPS metric, which allows the direct comparison of the system performance when changing the simulation grid size. FVOPS also serves as a practical tool to determine the optimal number of grid elements per rank on a specific HPC architecture. With this metric, users can make informed decisions about the optimal number of compute nodes to use for a given simulation, which translates into tangible savings in time, energy, and cost, making it a valuable tool.
The Hawk supercomputer uses AMD EPYC Rome 7742 CPUs, which showed a significant performance advantage over the other platforms in this study, including Intel, ARM and other AMD platforms. The large performance difference observed between runs with very large grid sizes and with the optimal number of grid elements per rank explains the significant superlinear speedup seen in the strong scaling tests.
Finally, the results indicate that future HPC architectures with larger L3 cache sizes and higher memory bandwidth would benefit the CFD community.
Acknowledgments
The simulations were performed on the national supercomputer HPE Apollo Hawk at the High Performance Computing Center Stuttgart (HLRS) under the grant number HLRSexaFOAM/44230. This work is carried out in the scope of the exaFOAM project, which has received funding from the German Federal Ministry of Education and Research and the European High-Performance Computing Joint Undertaking (JU) under grant agreements No 16HPC024 and No 956416, respectively. The JU receives support from the European Union’s Horizon 2020 research and innovation programme and France, Germany, Spain, Italy, Croatia, Greece, and Portugal.
References
- Axtmann, G., Rist, U. (2016). Scalability of OpenFOAM with Large Eddy Simulations and DNS on High-Performance Systems. In: Nagel, W.E., Kröner, D.H., Resch, M.M. (eds) High Performance Computing in Science and Engineering ´16. Springer, Cham. [CrossRef]
- C. M. Williams, E. Gedenk. HLRS Jahresbericht 2022, 2023. Available online: https://www.hlrs.de/de/about/profile/jahresbericht (accessed on 30 January 2024).
- exaFOAM project website. Available online: https://exafoam.eu (accessed on 30 January 2024).
- H. G. Weller, G. Tabor, H. Jasak, C. Fureby. A tensorial approach to computational continuum mechanics using object-oriented techniques. Comput. Phys. 12 (6): 620–631, 1998. [CrossRef]
- S. Ristov, R. Prodan, M. Gusev and K. Skala. Superlinear speedup in HPC systems: Why and when?, 2016 Federated Conference on Computer Science and Information Systems (FedCSIS), Gdansk, Poland, pp. 889-898, 2016.
- Severin, M., 2019. Analyse der Flammenstabilisierung intensiv mischender Jetflammen für Gasturbinenbrennkammern (PhD Thesis). Universität Stuttgart.
- Ax, H., Lammel, O., Lückerath, R., Severin, M., 2020. High-Momentum Jet Flames at Elevated Pressure, C: Statistical Distribution of Thermochemical States Obtained From Laser-Raman Measurements. Journal of Engineering for Gas Turbines and Power 142, 071011. [CrossRef]
- Gruhlke, P., Janbazi, H., Wlokas, I., Beck, C., Kempf, A.M., 2020. Investigation of a High Karlovitz, High Pressure Premixed Jet Flame with Heat Losses by LES. Combustion Science and Technology 192, 2138–2170. [CrossRef]
- Gruhlke, P., Janbazi, H., Wollny, P., Wlokas, I., Beck, C., Janus, B., Kempf, A.M., 2021. Large-Eddy Simulation of a Lifted High-Pressure Jet-Flame with Direct Chemistry. Combustion Science and Technology 1–25. [CrossRef]
- AbdelMigid, T.A.; Saqr, K.M.; Kotb, M.A.; Aboelfarag, A.A. Revisiting the lid-driven cavity flow problem: Review and new steady state benchmarking results using GPU accelerated code. Alexandria engineering journal 2017, 56, 123–135. [Google Scholar] [CrossRef]
- MB1 Microbenchmark - Lid-driven cavity 3D. Available online: https://develop.openfoam.com/committees/hpc/-/tree/develop/incompressible/icoFoam/cavity3D (accessed on 30 Janaury 2024).
- GC2 Grand Challenge - DLR Confined Jet High Pressure Combustor. Available online: https://develop.openfoam.com/committees/hpc/-/tree/develop/combustion/XiFoam/DLRCJH (accessed on 30 Janaury 2024).
- Lesnik, Sergey and Rusche, Henrik, exaFOAM Grand Challenge GC2 - DLR Confined Jet High Pressure Combustor, DaRUS, V1. [CrossRef]
- Available online: https://perf.wiki.kernel.org (accessed on 1 Janaury 2024).
- Available online: https://icl.utk.edu/papi (accessed on 1 Janaury 2024).
- Available online: https://github.com/LLNL/mpiP (accessed on 1 Janaury 2024).
- Available online: https://pop-coe.eu/node/69 (accessed on 1 Janaury 2024).
- Available online: https://tools.bsc.es/extrae (accessed on 1 Janaury 2024).
- Ma, J.; Wu, K.; Jiang, Z.; Couples, G.D. SHIFT: An implementation for lattice Boltzmann simulation in low-porosity porous media, Phys. Rev. E 2010, 81, 056702. [Google Scholar] [CrossRef] [PubMed]
Figure 2.
Strong scaling test done with the Hawk supercomputer for the 489M grid.
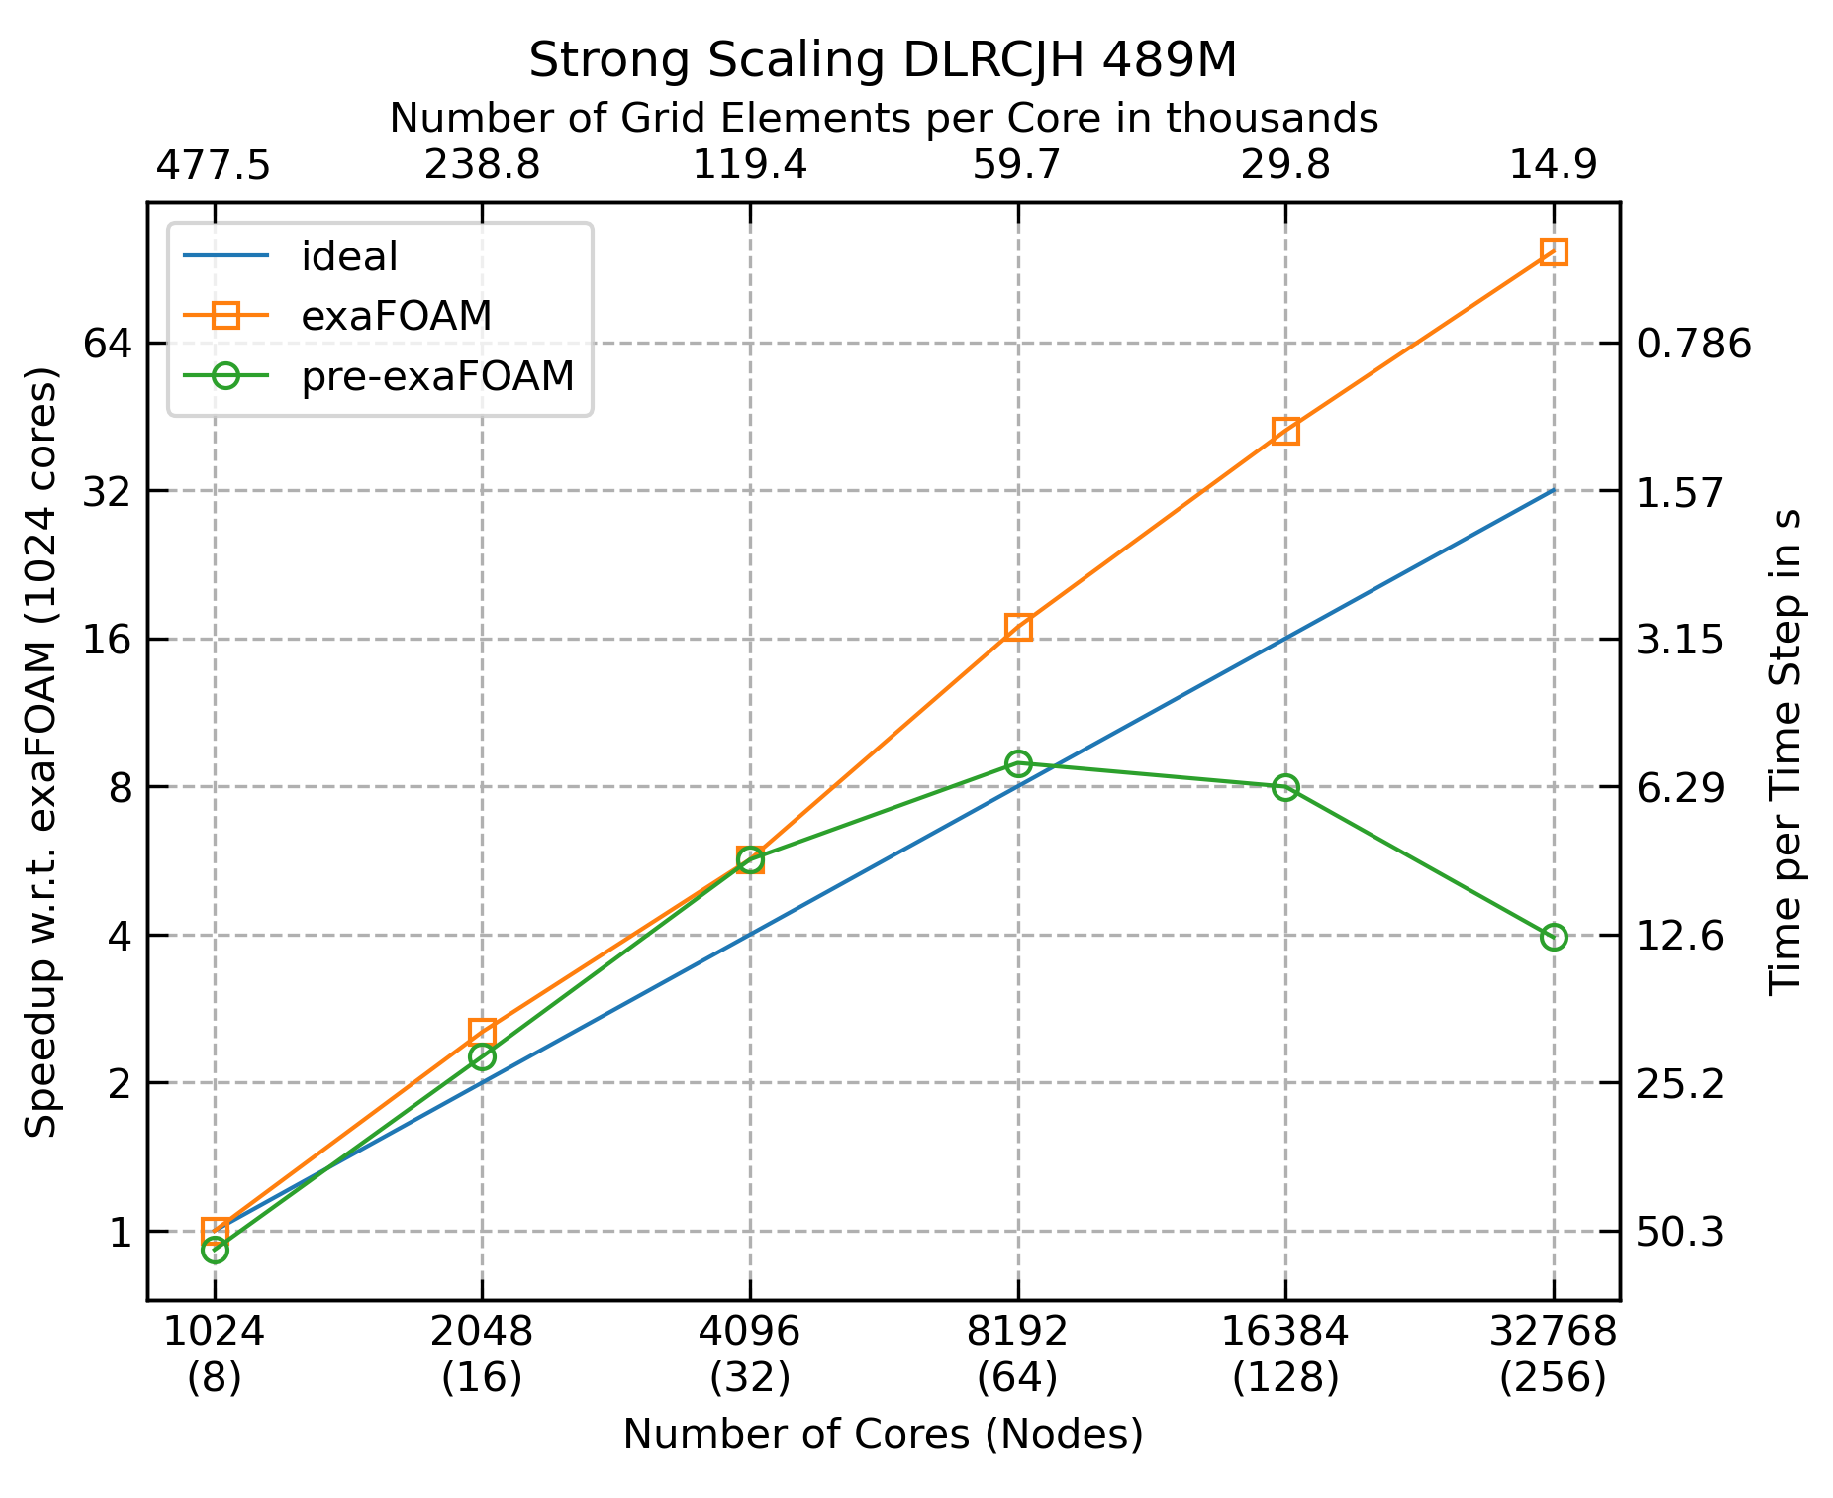
Figure 3.
Visualization of the 3D lid-driven cavity flow.
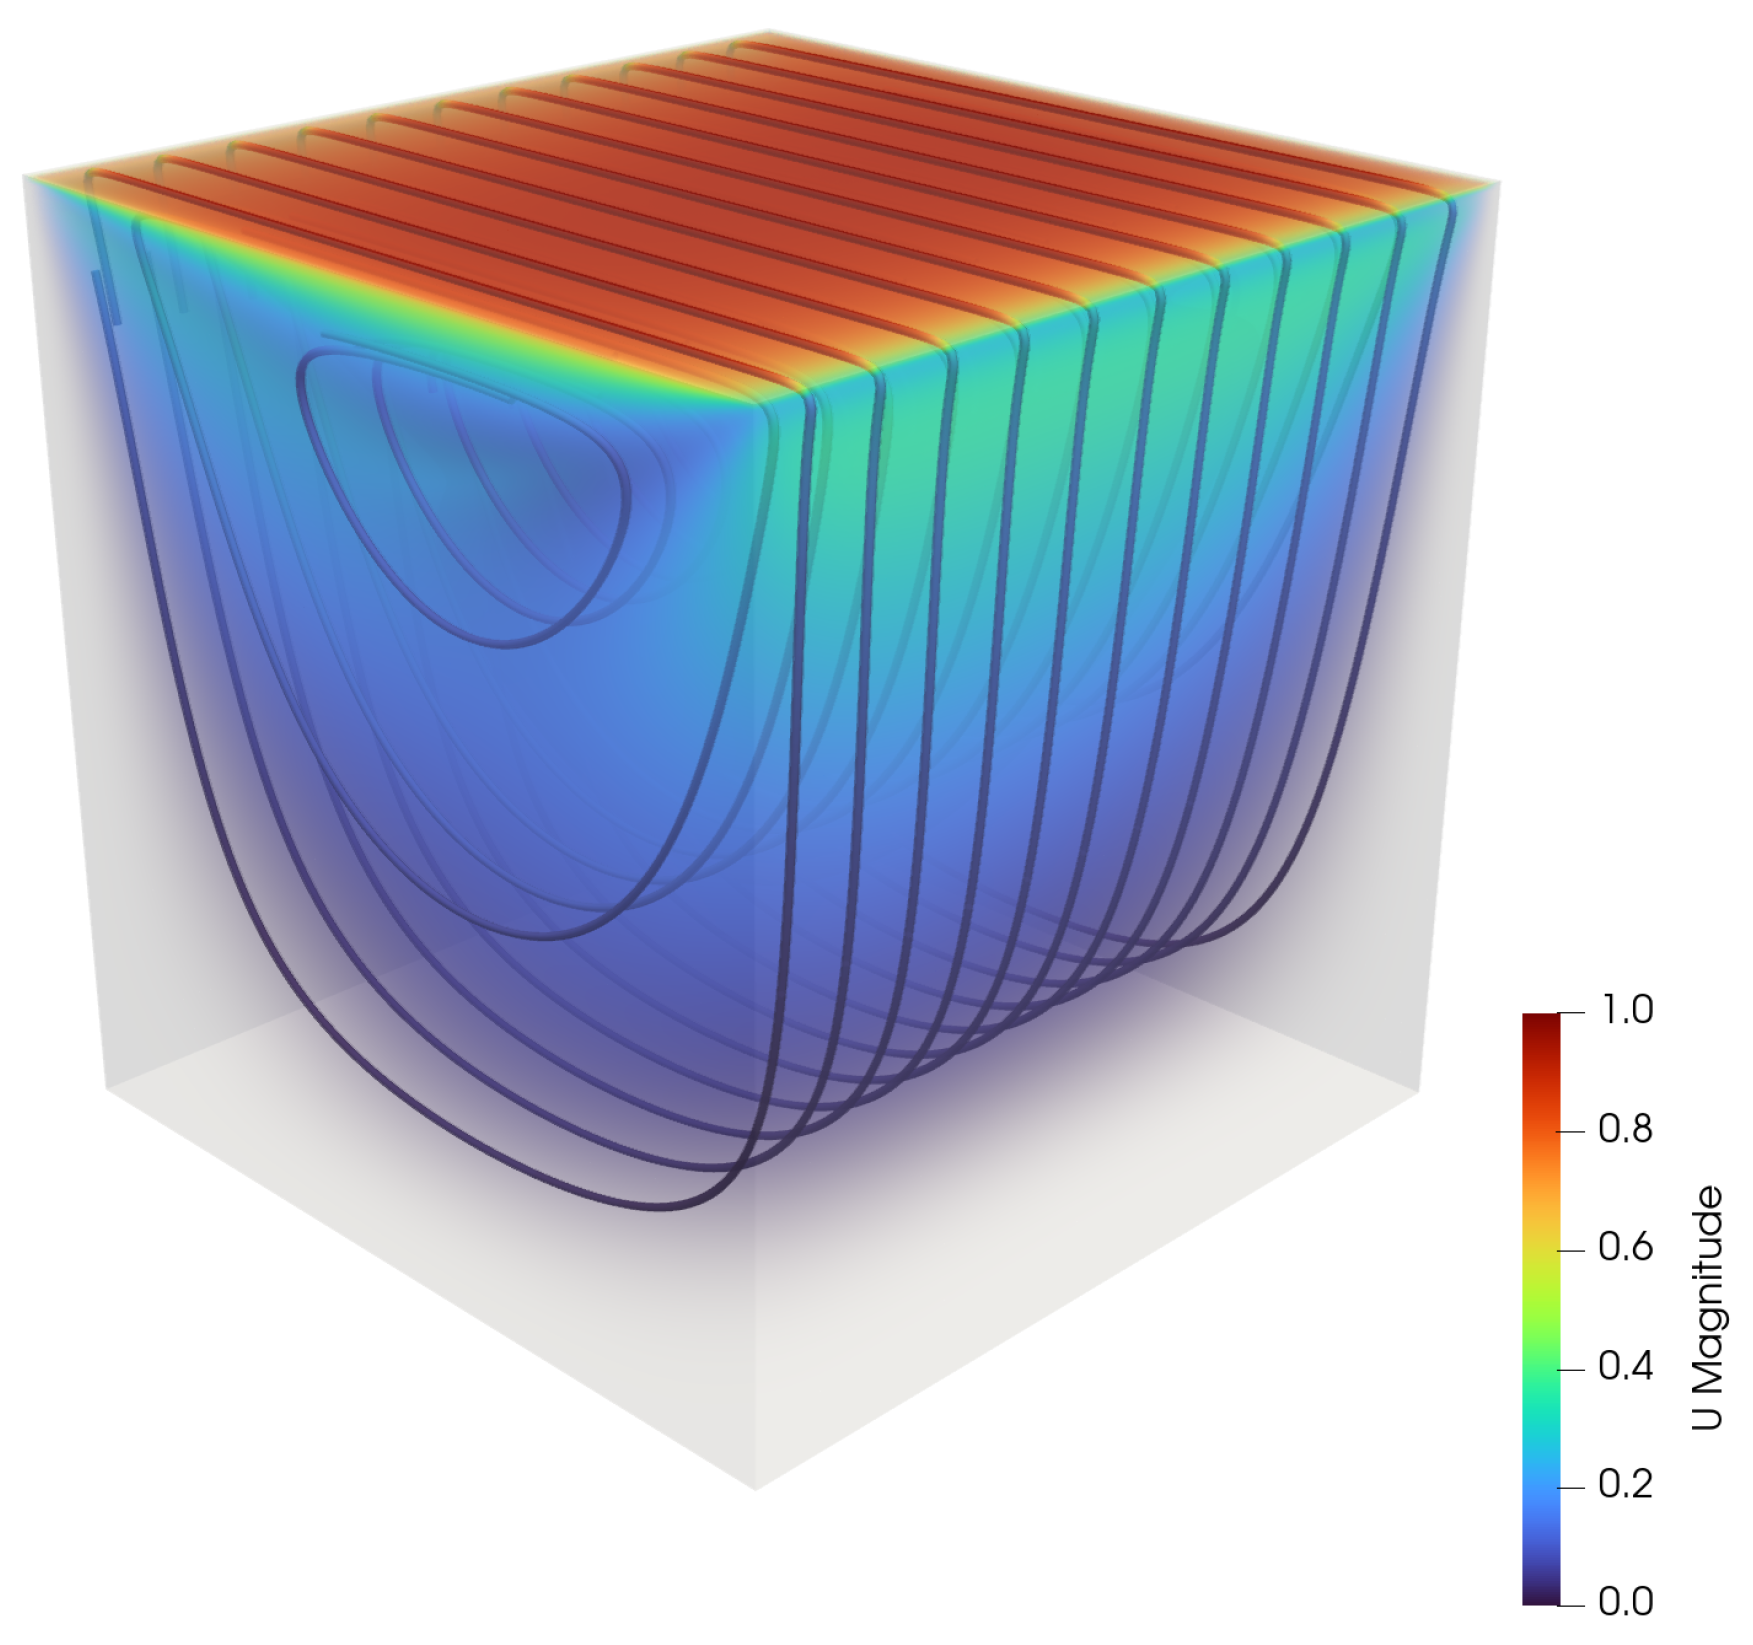
Figure 4.
Strong scaling benchmark for the lid-drive cavity case with pronounced superlinear speedups.
Figure 4.
Strong scaling benchmark for the lid-drive cavity case with pronounced superlinear speedups.
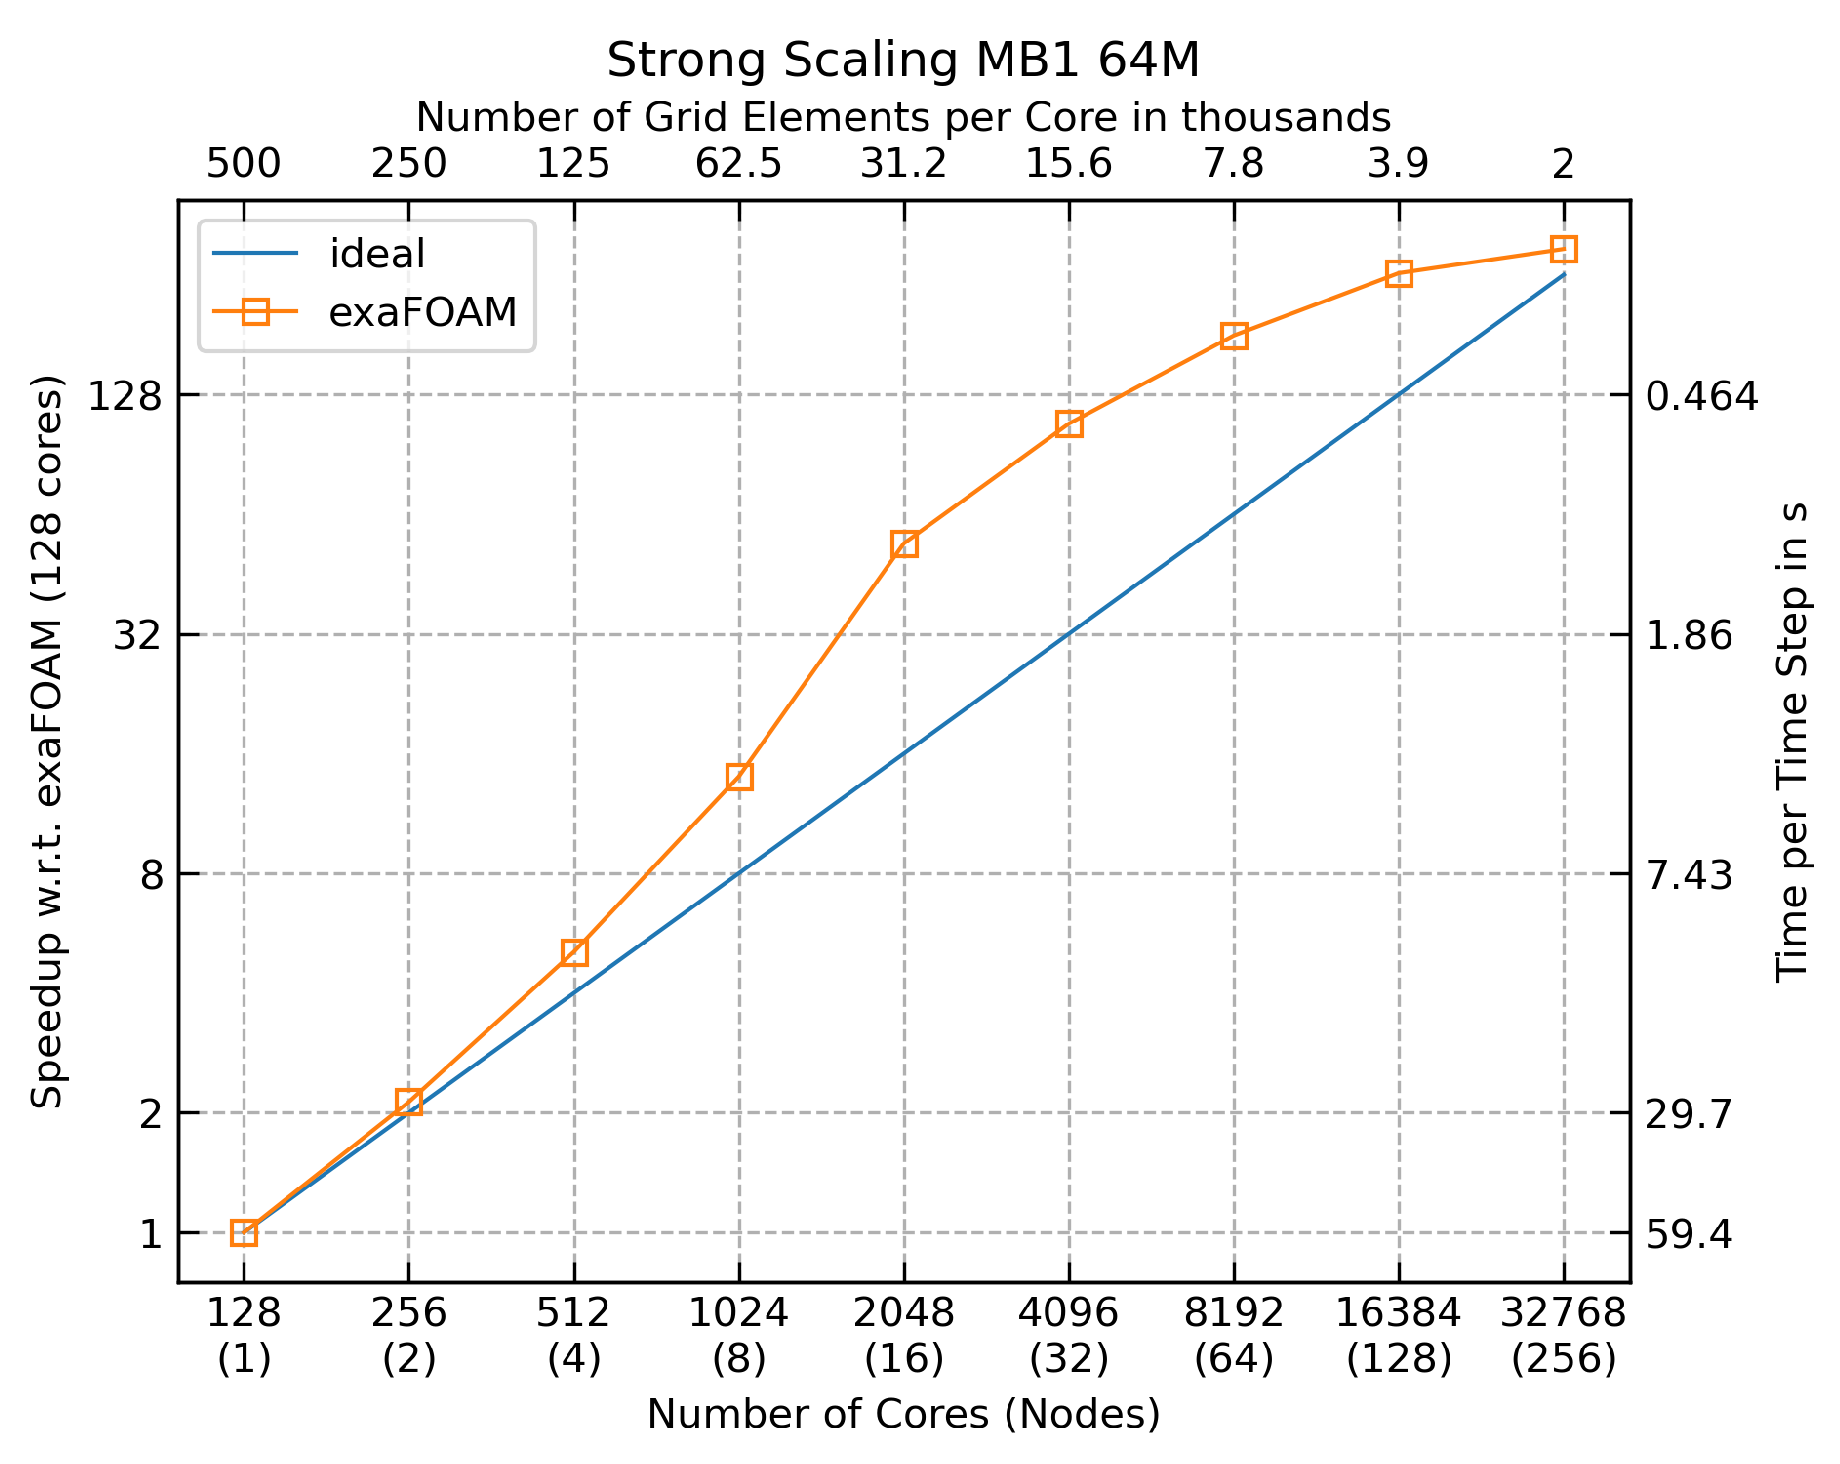
Figure 5.
FVOPS, L3 ratio and MPI ratio for grids sizes from 27M to 15k elements, using one node.
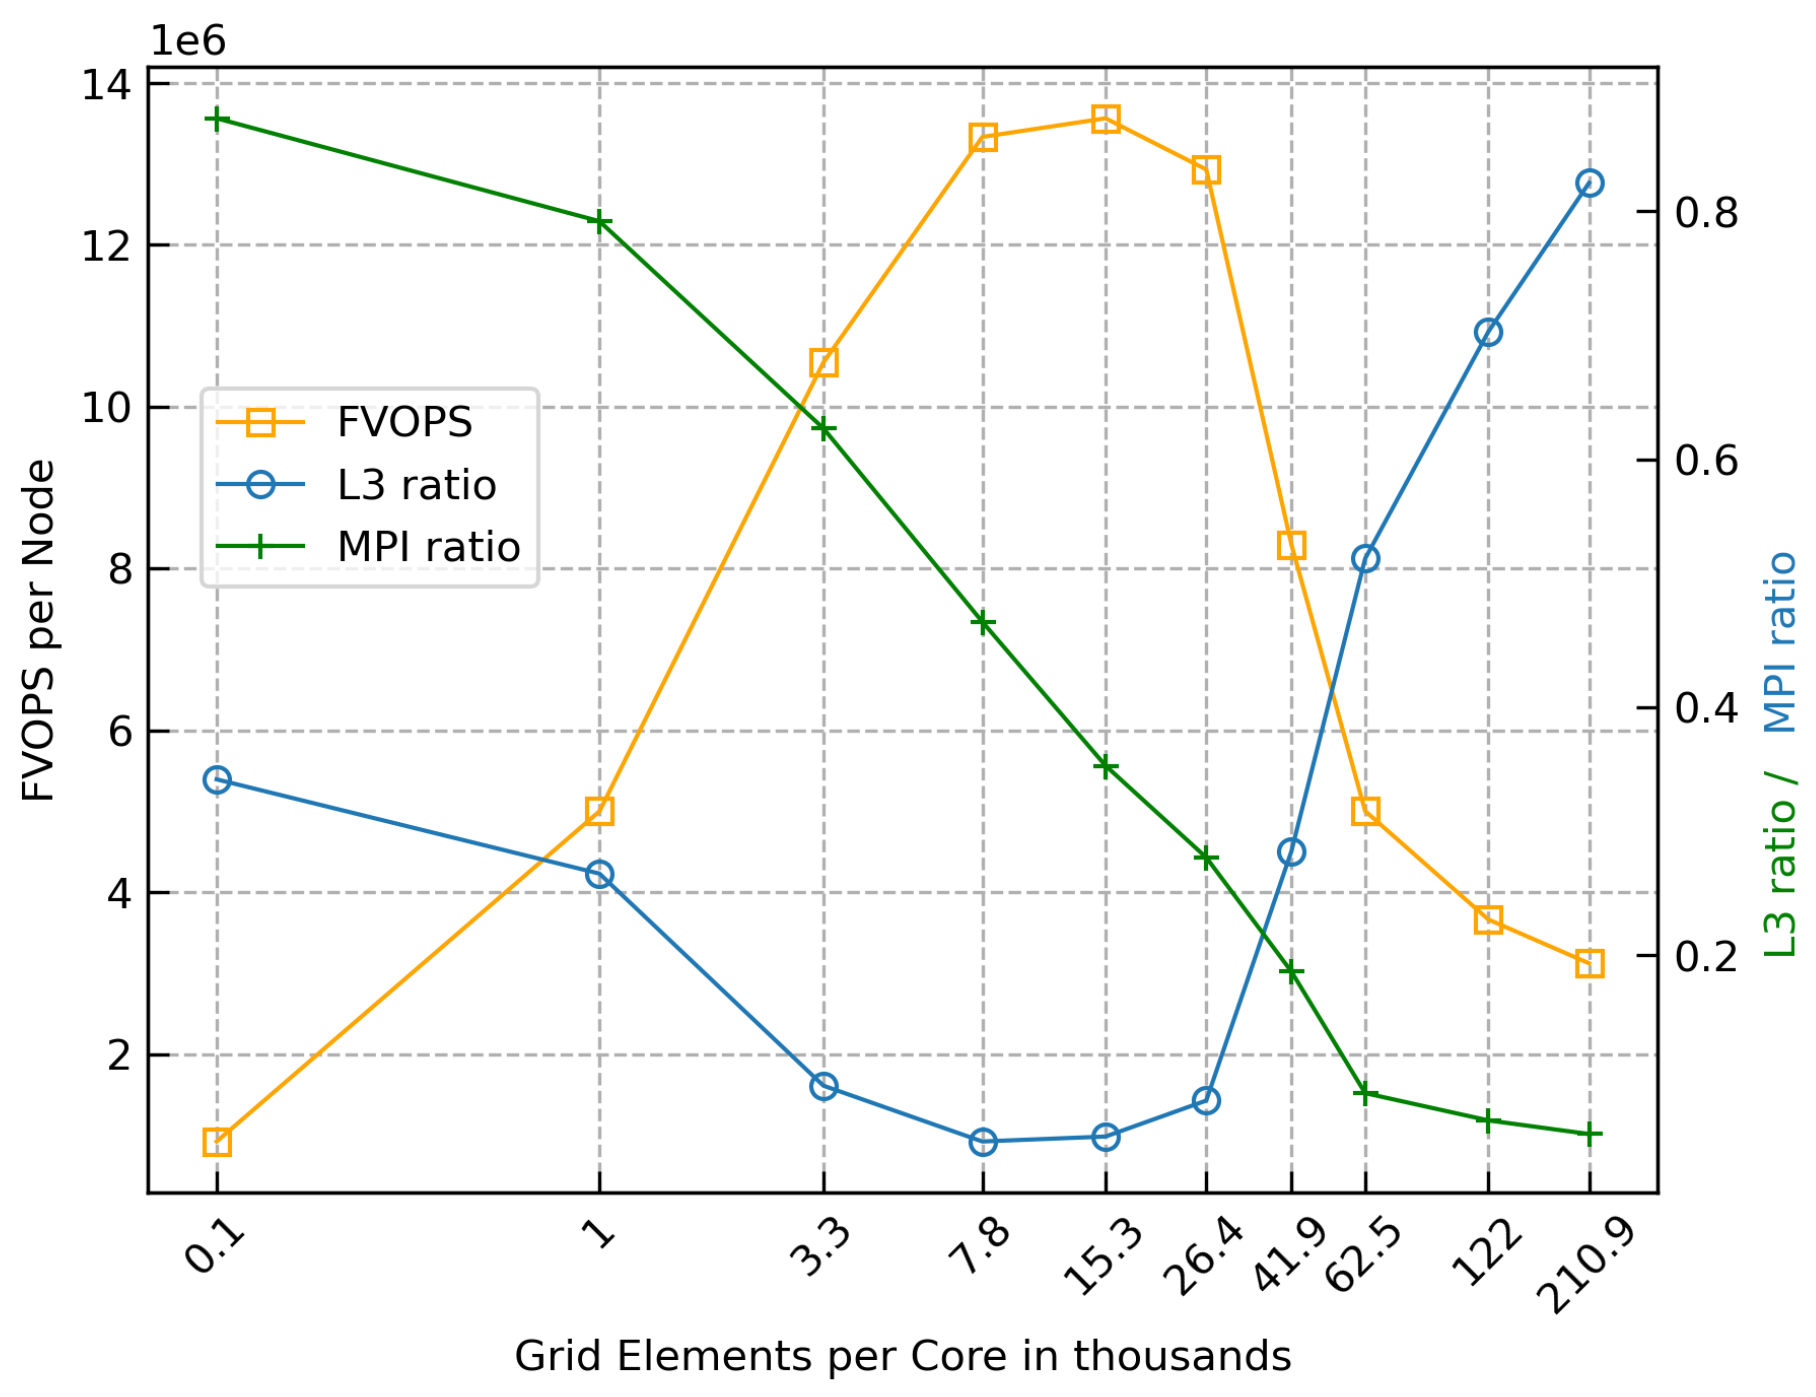
Figure 6.
FVOPS using different architectures.
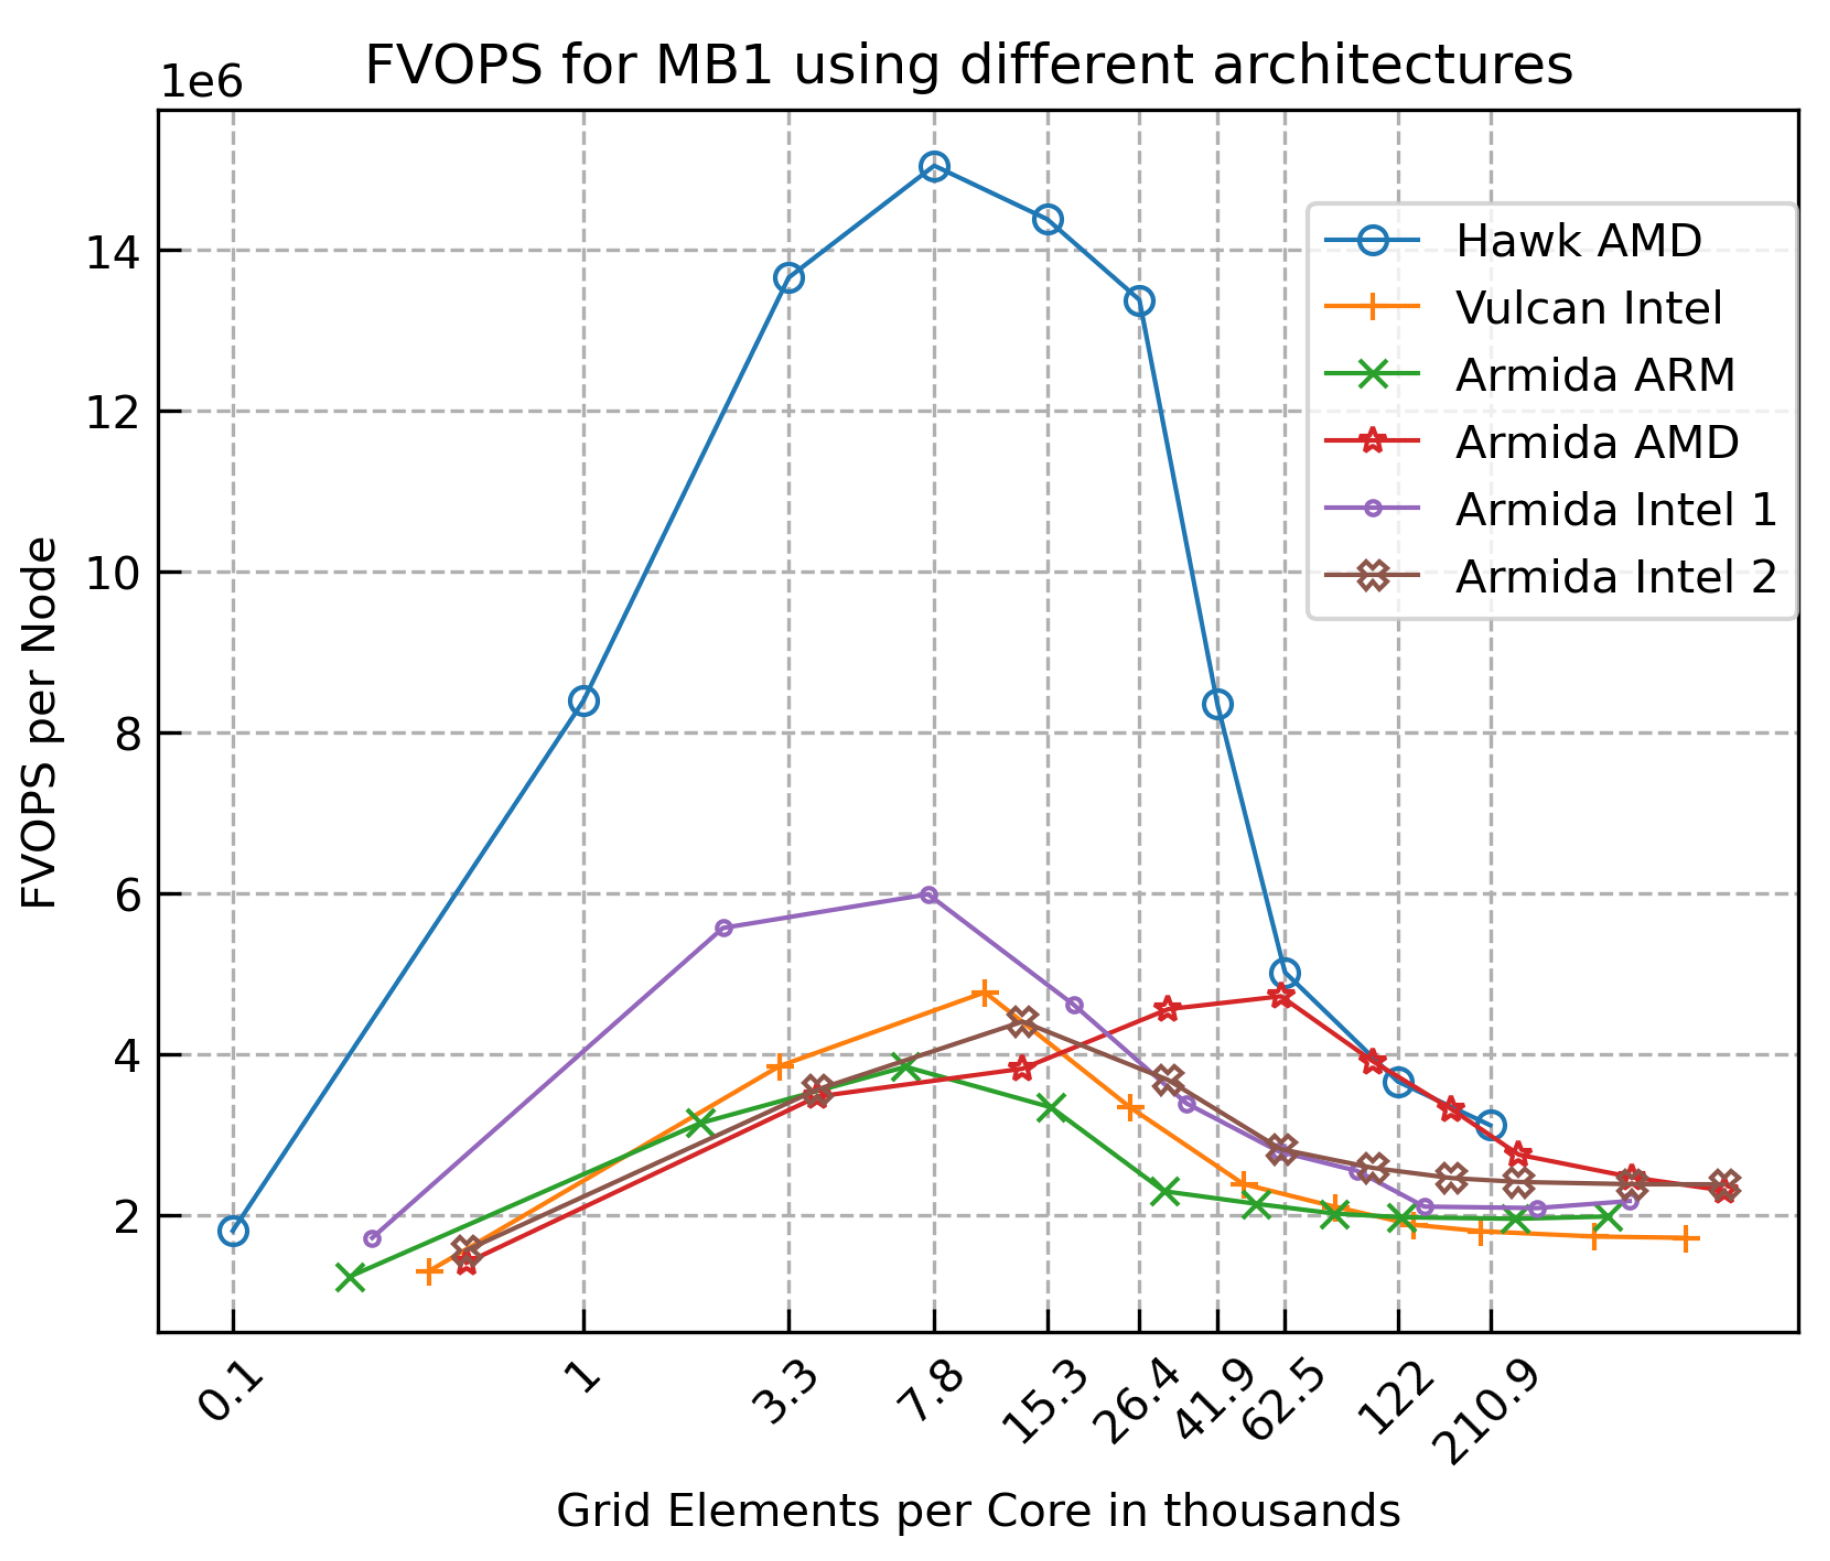
Figure 7.
FVOPS, IPC, and PE for grids sizes from 27M to 15k elements, using one node.
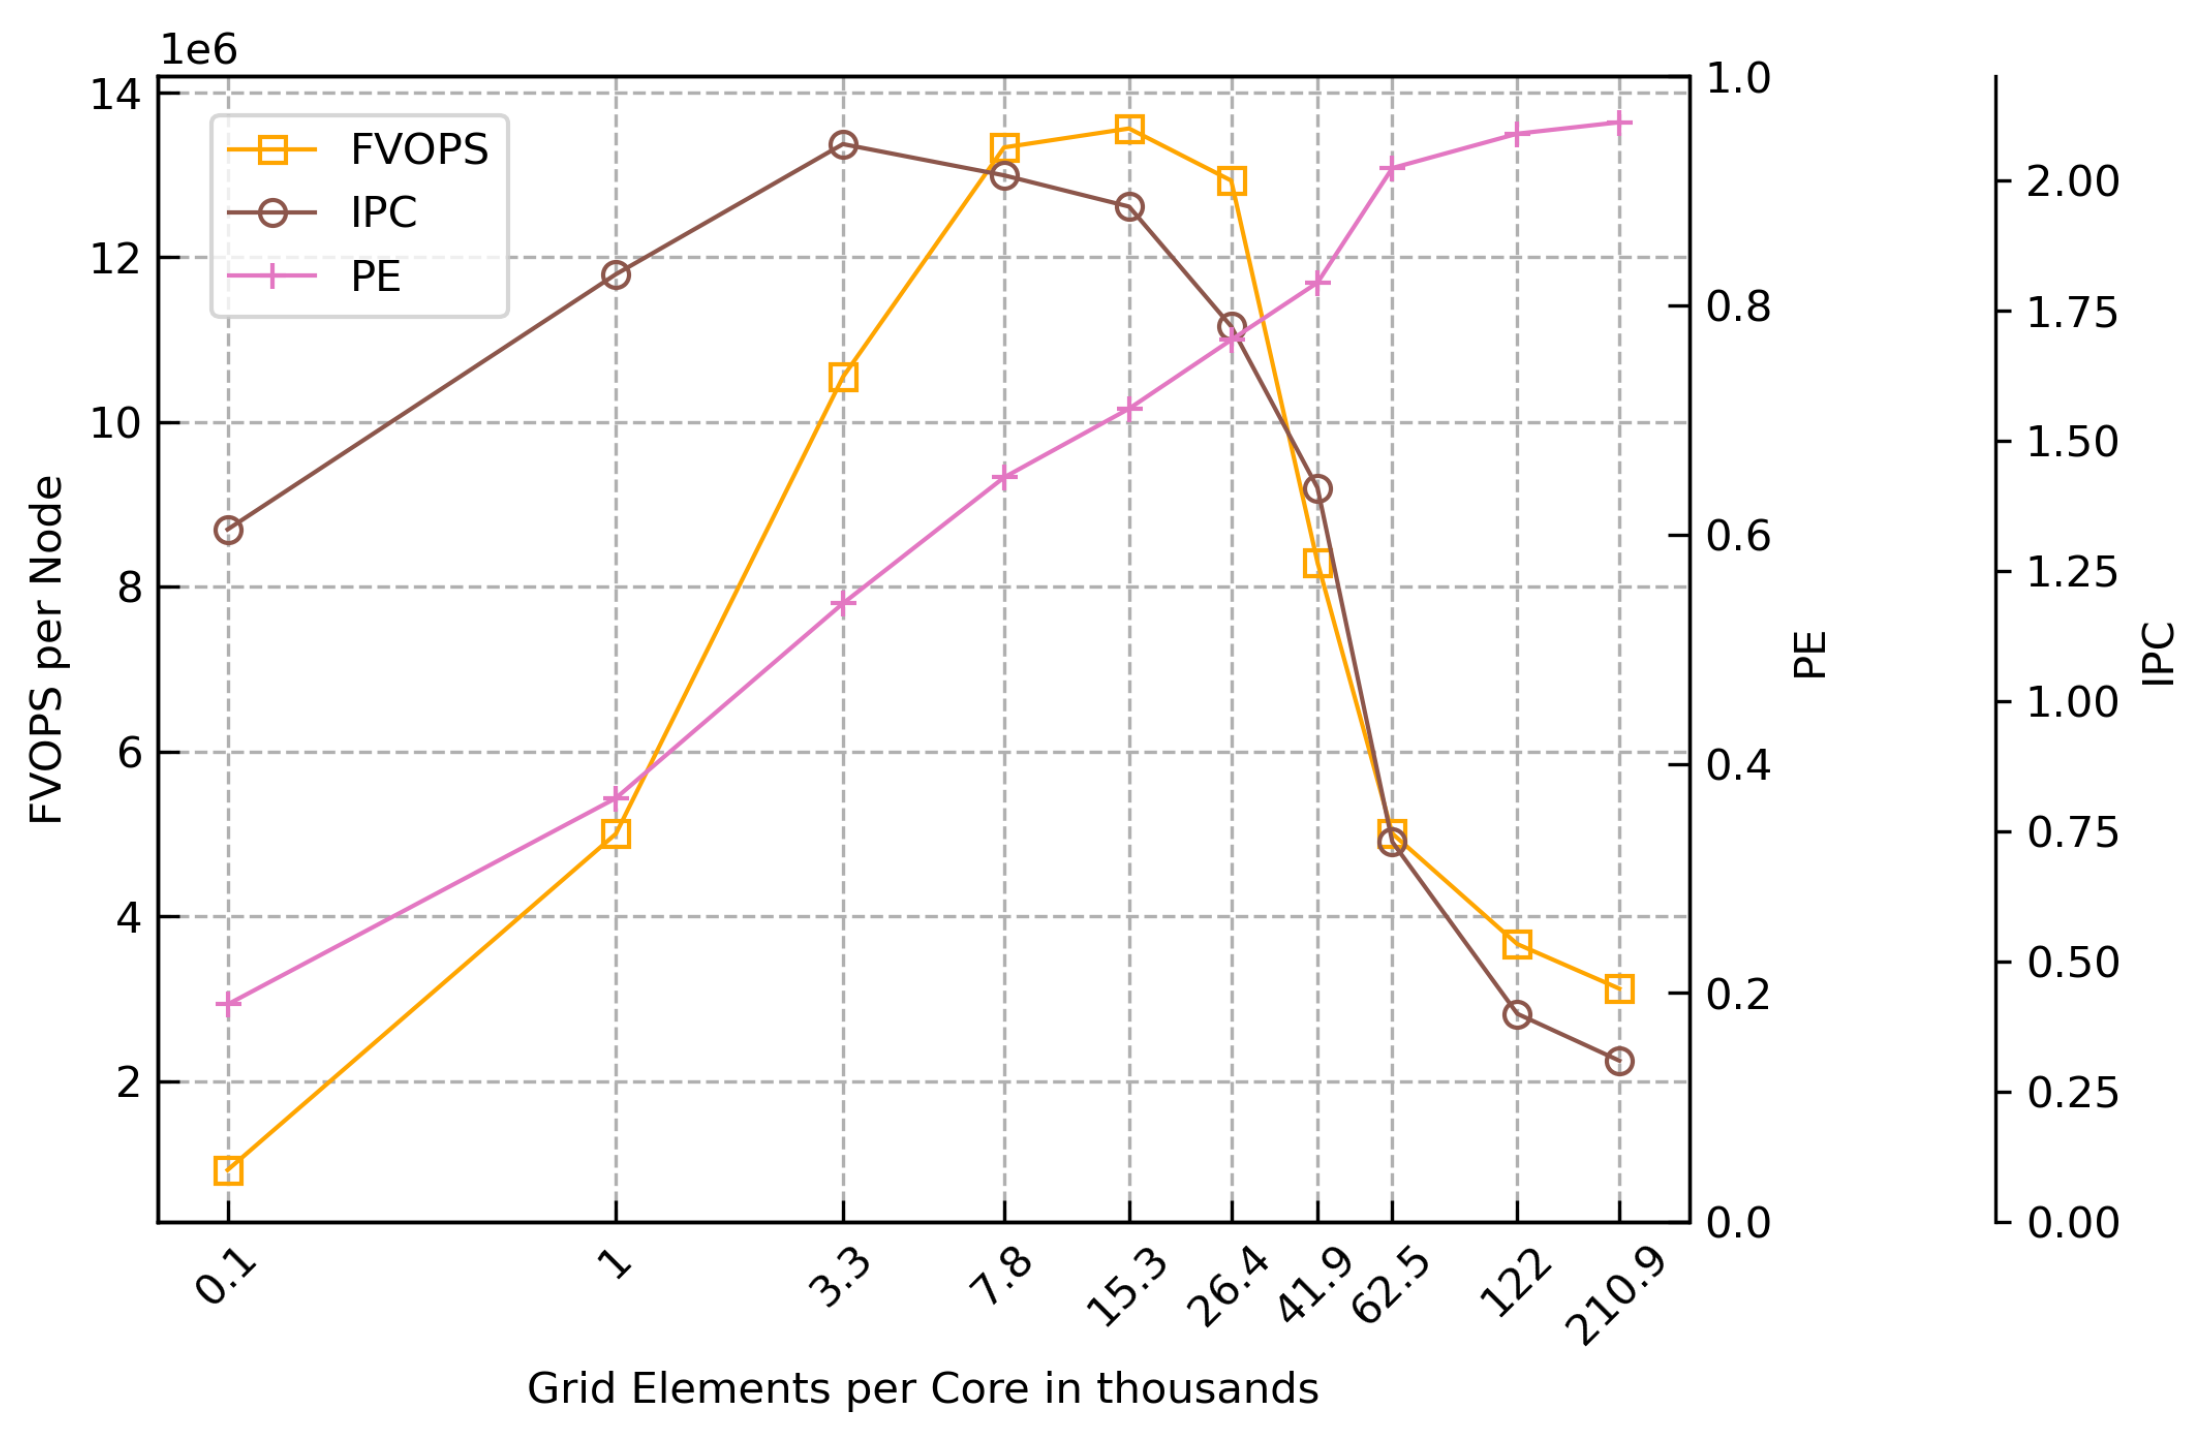
Figure 8.
FVOPS and IPC*PE for grids sizes from 27M to 15k elements, using one node.
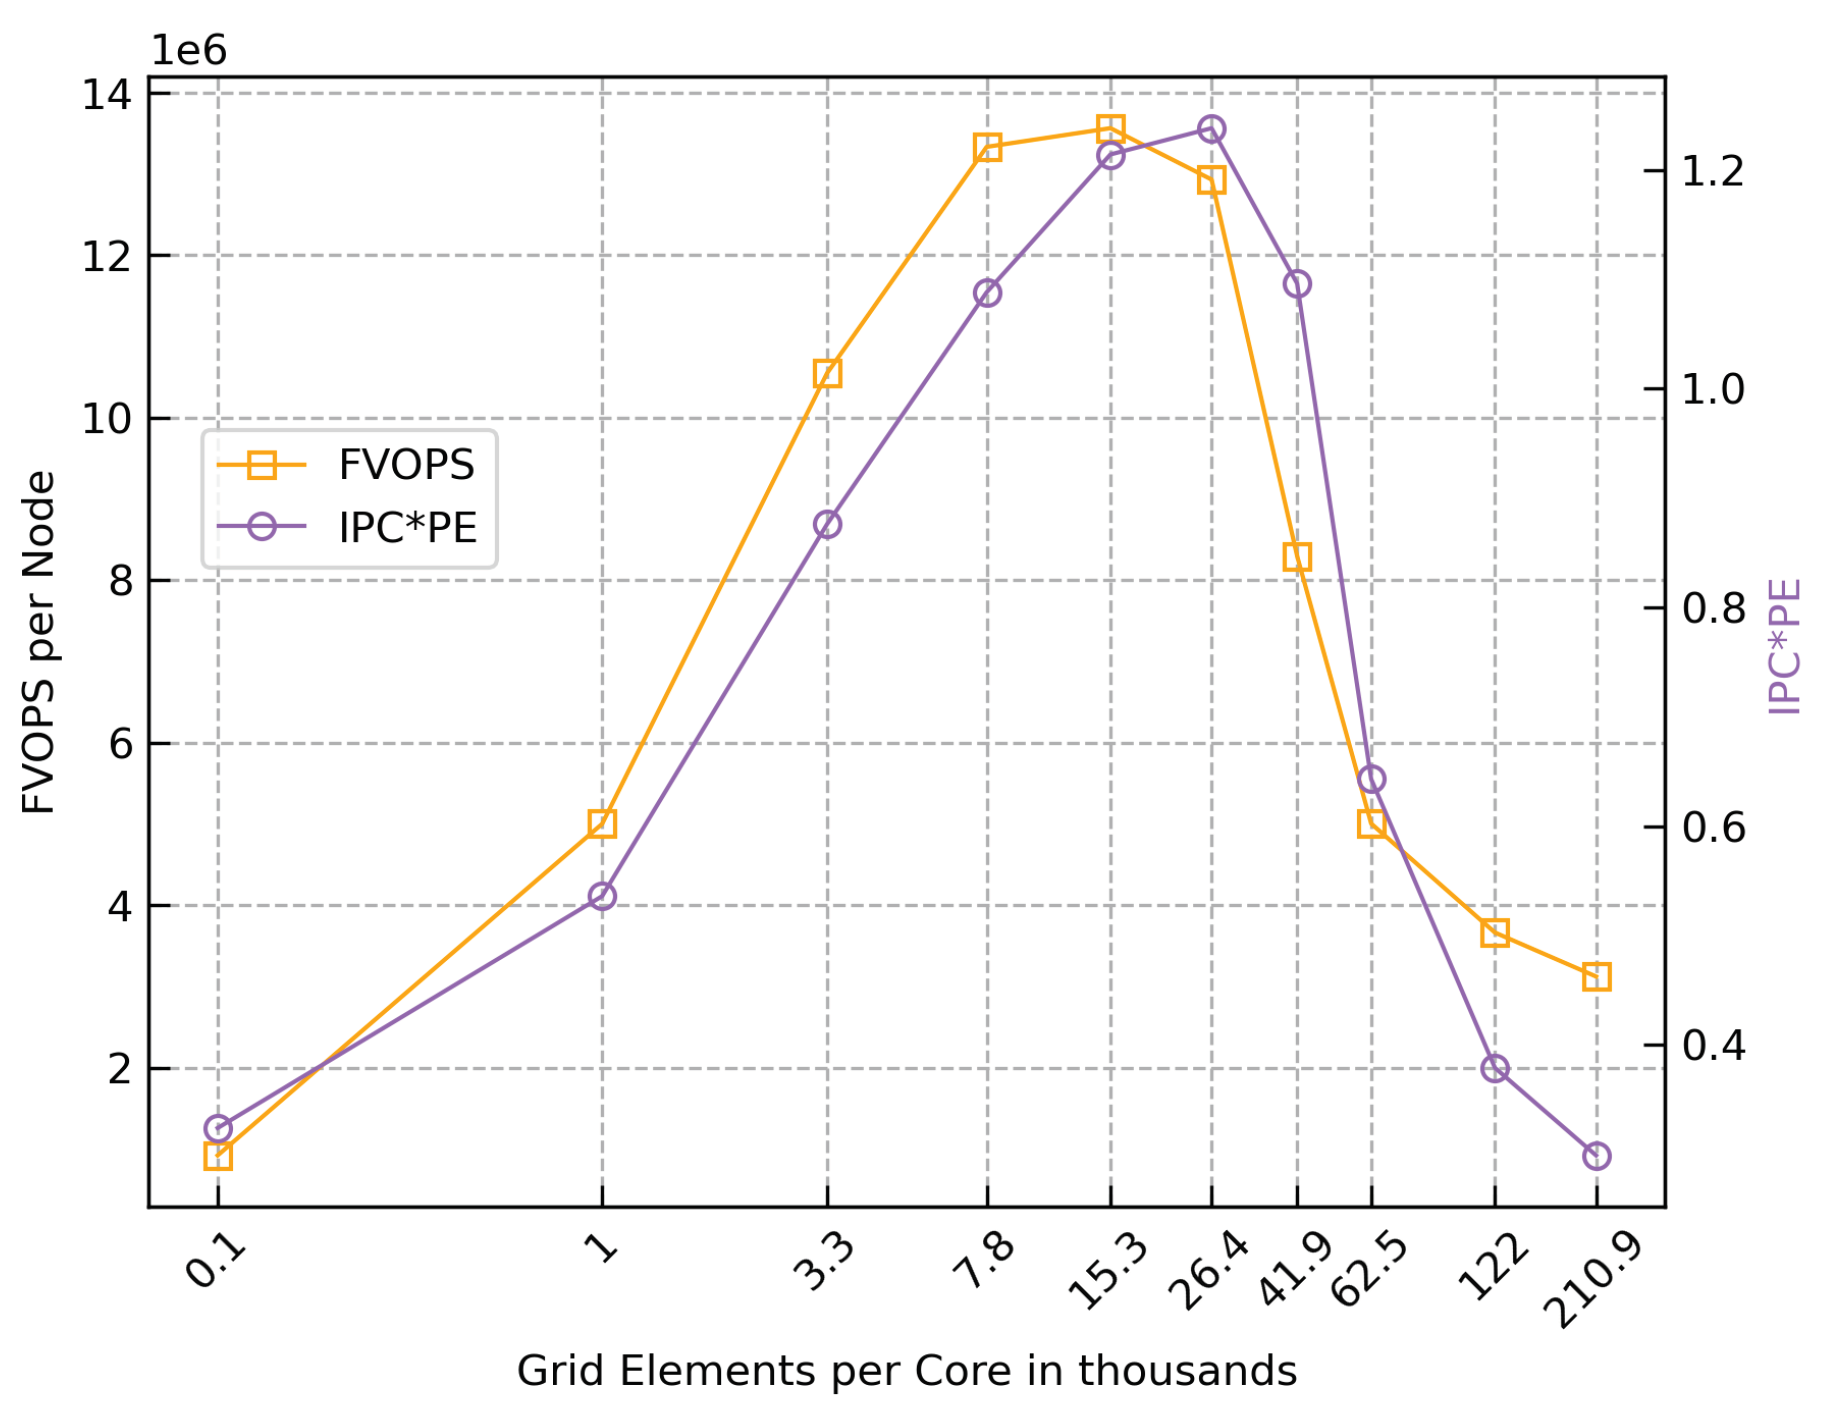

Table 1.
Results for grids sizes from 27M to 15k elements. The different metrics are explained in the following sections.
Table 1.
Results for grids sizes from 27M to 15k elements. The different metrics are explained in the following sections.
| Total grid elements | Runtime per time step [s] | Grid elements per rank | FVOPS per node | L3 ratio | MPI ratio | Parallel efficiency | IPC | IPC*PE |
|---|---|---|---|---|---|---|---|---|
| 27,000,000 | 8.651 | 210,938 | 3.1M | 0.823 | 0.056 | 0.96 | 0.31 | 0.299 |
| 15,625,000 | 4.267 | 122,070 | 3.6M | 0.703 | 0.067 | 0.95 | 0.4 | 0.379 |
| 8,000,000 | 1.599 | 62,500 | 5.0M | 0.520 | 0.089 | 0.92 | 0.73 | 0.643 |
| 5,359,375 | 0.646 | 41,870 | 8.3M | 0.284 | 0.187 | 0.82 | 1.41 | 1.096 |
| 3,375,000 | 0.261 | 26,367 | 12.9M | 0.083 | 0.279 | 0.77 | 1.72 | 1.238 |
| 1,953,125 | 0.144 | 15,259 | 13.6M | 0.054 | 0.353 | 0.71 | 1.95 | 1.214 |
| 1,000,000 | 0.075 | 7,813 | 13.4M | 0.050 | 0.469 | 0.65 | 2.01 | 1.088 |
| 421,875 | 0.040 | 3,296 | 10.5M | 0.095 | 0.625 | 0.54 | 2.07 | 0.876 |
| 125,000 | 0.025 | 977 | 5.0M | 0.266 | 0.792 | 0.37 | 1.82 | 0.536 |
| 15,625 | 0.017 | 122 | 0.9M | 0.342 | 0.875 | 0.19 | 1.33 | 0.324 |
Table 2.
Hardware of the computer systems used in the performance analysis.
| CPUs | Cores per node | Memory | L3 cache | |
|---|---|---|---|---|
| Hawk | AMD EPYC 7742 @ 2.25 GHz | 2 x 64 | 256 GB | 256 MB |
| Vulcan | Intel Xeon Gold 6138 @ 2,0 GHz | 2 x 20 | 192 GB | 27.5 MB |
| Armida ARM | Cavium ThunderX2 @ 2.5 GHz | 2 x 32 | 256 GB | 32 MB |
| Armida AMD | AMD EPYC 7313 @ 3.0 Ghz | 2 x 16 | 256 GB | 128 MB |
| Armida Intel 1 | Intel Xeon Gold 6330 @ 2.0 GHz | 2 x 28 | 256 GB | 42 MB |
| Armida Intel 2 | Intel Xeon Gold 6326 @ 2.9 GHz | 2 x 16 | 512 GB | 24 MB |
Disclaimer/Publisher’s Note: The statements, opinions and data contained in all publications are solely those of the individual author(s) and contributor(s) and not of MDPI and/or the editor(s). MDPI and/or the editor(s) disclaim responsibility for any injury to people or property resulting from any ideas, methods, instructions or products referred to in the content. |
© 2024 by the authors. Licensee MDPI, Basel, Switzerland. This article is an open access article distributed under the terms and conditions of the Creative Commons Attribution (CC BY) license (http://creativecommons.org/licenses/by/4.0/).
Copyright: This open access article is published under a Creative Commons CC BY 4.0 license, which permit the free download, distribution, and reuse, provided that the author and preprint are cited in any reuse.


