
Submitted:
26 March 2024
Posted:
28 March 2024
You are already at the latest version
Abstract
This study aimed to develop multifunctional nanoplatforms for both cancer imaging and therapy using superparamagnetic iron oxide nanoparticles (SPIONs). Two distinct synthetic methods, reduction-precipitation (MR/P) and co-precipitation at controlled pH (MpH), were explored, including the assessment of coating’s influence, namely dextran and gold, on their magnetic properties. These SPIONs were further functionalized with gadolinium to act as dual T1/T2 contrast agents for magnetic resonance imaging (MRI). Parameters such as size, stability, morphology, and magnetic behavior were evaluated by a detailed characterization analysis. To assess their efficacy in imaging and therapy, relaxivity and hyperthermia experiments were performed, respectively. The results revealed that both synthetic methods lead to SPIONs with similar average, 9 nm. Mössbauer spectroscopy indicated that samples obtained from MR/P consist of approximately 11-13% of Fe present in magnetite, while samples obtained from MpH have higher content, of 33%-45%. Despite coating and functionalization, all samples exhibited superparamagnetic behavior at room temperature. Hyperthermia experiments showed increased SAR values with higher magnetic field intensity and frequency. Moreover, the relaxivity studies suggested potential dual T1/T2 contrast agent capabilities for the coated SPpH-Dx-Au-Gd sample, thus demonstrating its potential in cancer diagnosis.
Keywords:
superparamagnetism
; iron oxides nanoparticles
; gold nanoparticles
; gadolinium
; hyperthermia
; magnetic resonance imaging
1. Introduction
Cancer is currently the second leading cause of death, only behind cardiovascular disease [1,2]. Treatments such as chemotherapy, radiotherapy and surgical removal of tumors are the most frequent approaches. However, patients’ survival mainly depends on an accurate and early diagnosis of the disease [2]. Inorganic nanoparticles (NPs) have been widely studied in biomedicine due to their attractive properties. These include non-toxicity, size similar to biomolecules, relative ease of preparation and functionalization with various imaging agents, biological targeting moieties and drugs. When combining therapeutic and diagnostic functions in the same tool we have the so-called theranostic nanoparticles. Although this concept is promising, NPs need to overcome several hurdles to reach clinical applications [3,4]. Currently, most of the iron oxide drugs approved in the 1990s as clinical MRI contrast agents have been withdrawn from the market. Nanotherm® is the only iron oxide nanoparticle drug clinically approved, since 2010, for the treatment of magnetic hyperthermia glioblastoma [5,6,7].
The development and success of targeted delivery nanoplatforms depend on the knowledge of the mechanisms and interactions of NPs with the tumor as their pharmacokinetics and pharmacodynamics are strongly dependent on their physical and chemical properties and surface composition. Among the myriad of possible nanoparticles for biomedical application, magnetic nanoparticles are most suitable for theranostic applications in cancer. Settled that these materials can be influenced by an external magnetic field, it is clear why they are so interesting for biomedical applications. Below a certain diameter, magnetic nanoparticles behave as a single domain, a single magnetic spin, and are currently classified as a superparamagnetic material [8]. Superparamagnetism is the main physical property of the superparamagnetic iron oxide nanoparticles (SPIONs), and plays an important role in cell separation, drug and gene delivery, immunoassay, magnetic resonance imaging (MRI), surgery, magnetic hyperthermia treatment (MHT) and other therapies [8,9,10]. This behavior presents a moderately strong magnetization in the presence of an external applied field, which disappears as the field is removed, leaving no trace of magnetization in the particles. Nonetheless, SPIONs have some shortcomings, mainly their tendency to oxidize and aggregate in vivo and their high uptake by macrophages. Thus, such nanoparticles typically require some form of functionalization to increase biocompatibility, decrease toxicity and improve properties such as stability and dispersity [8,11,12]. A current strategy relies on the use of biocompatible coating agents, containing an organic and/or inorganic material, to improve NPs stability and make them more versatile [12,13]. A dextran vs polyethylene glycol (PEG) coating study has been reported, highlighting the effect of the nature of the organic coating polymer on the magnetization performance of SPIONs. Indeed, dextran-based polymer with short chains does not affect the magnetization performance of SPIONs, while longer chain polymer-based PEG led to a substantial magnetization decrease [14]. Thanks to their high versatility, gold-coated magnetic nanoparticles can be used for many applications. Their optical and magnetic properties can be tuned and tailored by changing their size, gold shell thickness, shape, charge, and surface modification by the conjugation of various biomolecules such as peptides, antibodies, aptamers and (radio) metals. Nevertheless, depending on the gold shell thickness, charge, and surface modification, the gold coating can dramatically affect the magnetic properties of the final nanoparticles, ultimately affecting their biomedical performance [15].
We have previously reported on gold nanoparticles (AuNPs) functionalized with a macrocyclic thiol-DO3A derivative, and with a bombesin peptide analog which have shown favorable affinity towards gastrin-releasing peptide receptor (GRPR), remarkably high internalization into human pancreatic PC3 cancer cells, T1/T2 MRI properties and promising properties as radiosensitizers [16,17,18,19].
Motivated by the above reported results, we decided to evaluate and compare multifunctional nanoplatforms based on superparamagnetic iron oxide nanoparticles (Naked SPIONs) synthesized by two different chemical methods: reduction-precipitation (MR/P) and co-precipitation at controlled pH (MpH) of the iron precursor. The obtained naked SPIONs were protected with a dextran-based polymer, coated with a gold shell, and functionalized with gadolinium, to act as dual T1/T2 contrast agents for MRI.
This study aims to improve the understanding of the parameters that influence the good magnetic performance and, consequently, the imaging and therapeutic properties of SPIONs. All the nanomaterials were characterized in terms of size, stability, and morphology by a combination of techniques such as UV-vis, PXRD, FTIR, TEM, DLS, and Zeta Potential. A thorough and systematic magnetic study by Mössbauer spectroscopy and by static magnetization, allowed us to assess their magnetic performance, namely in terms of superparamagnetic (single domain) and blocking behavior. Once the magnetic properties have been determined, the most promising nanostructures were selected for assessment of their potential use as dual T1/T2 MRI contrast agents and for hyperthermia to assess their theranostic behavior.
2. Results
In this work, SPIONs were synthesized by two different methodologies based on previously described procedures, reduction-precipitation and controlled co-precipitation (NH4OH, pH 9.6) of iron salts. To evaluate the effect of the type of stabilizing coating used to protect them, the obtained SPIONs were coated with a dextran polymer and with gold and functionalized with gadolinium. Table 1 summarizes the denomination of each SPION sample according to the methods obtained.
2.1. UV-Vis and ATR-FTIR
As already mentioned, coatings help to preserve the superparamagnetic properties of SPIONs, allowing them to respond to external magnetic fields. Dextran is a natural and biodegradable polysaccharide with high biocompatibility, which reduces the risk of adverse immune responses or toxicity when used in vivo. Dextran coatings can improve the colloidal stability of SPIONs under physiological conditions, preventing rapid elimination by the immune system and prolonging their circulation time in the bloodstream. Although these advantages make dextran coated SPIONs a promising nanomaterial for various in vivo applications, it is important to note that these polymeric coatings can also modify, among other parameters, the size and surface charge of the particles, which are key factors to maximize the potential of coated SPIONs in specific applications.
Metal nanoparticles interact strongly with specific wavelengths of light exhibiting strong dipolar excitations in the form of localized surface plasmon resonances (LSPR). Small changes that occurred in the molecular layer of the metal surface usually result in dramatic changes in the position and pattern of the LSPR. Accordingly, SPR is a powerful tool to evaluate the success of the synthesis and post-synthesis of successive functionalization of SPIONs. Therefore, the formation of the SPIONs as well as the presence of the different conjugated coatings were first confirmed by UV-Vis spectroscopy. As an example, Figure 1 shows the UV-Vis absorbance spectra of the bare SPIONs obtained by the co-precipitation method and of the corresponding SPIONs with the successive coatings. The UV-Vis spectrum of the naked SPpH show two large and broad absorption peaks that are positioned in the region of 220-270 nm and 310-390 nm, characteristic of iron oxide nanoparticles, namely magnetite nanoparticles [21,25,26,27,28,29]. The pattern of the SPpH-Dx spectrum is quite different from that of its precursor SPpH, with a noticeable decrease in absorption with the increasing of the wavelength light (200 to 800 nm). The broad peak around 390 nm indicates that the SPIONs are surrounded by the dextran polymer. The more pronounced SPR bands observed in the spectra of SPpH-Dx-Au and SPpH-Dx-Au-Gd, with maxima in the 520-530 nm regions, clearly indicate the presence of Au on the surface of the respective SPIONs [16,17].
The pattern of the SPpH based SPIONs’ spectra is similar to those of the respective ones, obtained by the reduction/precipitation method (Figure S1). The absorption maxima observed for each nanostructure are listed in Table S1 of the supplementary material.
The ATR-FTIR spectra are consistent with the coating of SPIONs with Dextran (see Figure 2 and Table S2). The spectra of the naked SPR/P and SPpH show a broad band at about 3400 cm-1, characteristic of the stretching vibrations of -OH groups in water molecules and hydroxyl groups present on the surface of the SPIONs. The band near 1640 cm-1 is also associated with bending vibrations of H2O adsorbed on the surface of the nanoparticles. In the SPR/P spectrum a band centered at 580 cm-1 is related to the bending vibrations of Fe-O bonds in the nanoparticles. The SPpH spectrum shows the corresponding bond at 590 cm-1 and, in addition, shows a band at 870 cm-1 related to the stretching vibrations of the Fe-O excited bonds from the γ-Fe2O3 [30,31]. In the spectra of the SPIONs coated with Dextran new peaks are observed. The peaks around 2920 cm-1 and around 2850 cm-1 are due to the asymmetric and symmetric stretching vibration of the CH2 groups of the Dextran polymer, respectively. Dextran contains repeating units of glucose molecules, and the CH2 groups in these units contribute to these peaks. The band at 1110 cm-1 is probably related to the C-O stretching vibration of the glycosidic bonds and the band at 1010 cm-1 is attributed to the C-O stretching vibration of the hydroxyl groups in the Dextran polymer [32].
2.2. Powder X-Ray Diffraction (PXRD)
Powder X-ray diffraction (PXRD) analysis was performed to obtain information on the structural nature, phase, and approximate crystalline core size of the SPIONs allowing the identification of the main peaks of a spinel phase (Figure 3). Unit-cell parameters estimated from the PowderCell program are between those of magnetite with ideal stoichiometry Fe3O4 (JCPDS file 19–629) and maghemite γ-Fe2O3 (JCPDS file 39–1346). Fe3O4 and γ-Fe2O3 are isostructural having diffraction peaks at approximately the same diffraction angles. This fact makes it difficult to distinguish between magnetite and maghemite with this technique. The diffraction pattern showed peaks at 2θ of approximately 18.50°, 30.31°, 35.72°, 43.40°, 53.80°, 57.35° and 62.94°, allowing the identification of the main peaks of a spinel phase. These peaks correspond to the crystallographic planes (111), (220), (311), (400), (422), (511) and (440). Figure 3 shows the diffractograms of SPIONs, SPR/P and SPpH.
As confirmed below by Mössbauer spectroscopy, magnetite is partially oxidized. There is no reason to believe that all the spinel grains have the same oxidation degree. Most probably magnetite grains with different oxidation degrees up to the maghemite limit where all the Fe cations are in the 3+ oxidation state, are present in the studied samples leading to a mixture of spinel grains with different unit-cell parameters. This further broadens the XRD peaks, in addition to the small grain size effect. The diffractogram of SPR/P shows a peak at 21.26° that reveal the presence of a very low amount of goethite [33]. The diffractogram of the naked SPIONs, SPpH, indicates the presence of an ammonium chloride salt phase (NH4Cl). The main peaks of this salt represented in the diffractogram are 23.05°, 32.76°, 40.39°, 46.94°, 52.86°, 58.31°, which agree with those reported in the literature (JCPDS file 73-1491) [34].
Figures S3 and S4 shows the powder X-ray diffractogram of the coated SPR/P (samples 2 and 3) and SPpH (samples 6 and 7), respectively. The X-ray diffraction measurements for SPR/P-Dx-Au-Gd, and SPpH-Dx-Au-Gd, displayed peaks at 2θ for the gold phase at, approximately, 38.15°, 44.32°, 64.56°, 77.53°. Comparing with the JCPDS card for gold (Au0) (JCPDS 04-0784), these peaks correspond to the crystallographic planes (111), (200), (220), and (311) of the face-centered cubic structure. Figure 4 shows the diffractograms of SPR/P-Dx-Au-Gd and SPpH-Dx-Au-Gd nanoparticles. Even though the samples have a higher percentage of iron than gold, the peaks for gold are more intense due to the higher scattering factor of the gold nanoparticles [35], causing the iron oxide peaks to be somewhat faded. Using the 3 main peaks from the PXRD data of the samples, the crystallite size (DXRD) of the iron core of each sample was estimated by the Debye Scherrer’s equation (see section 2.3.3.) [21]. The values are summarized in Table 2. The closeness of DXRD values for both types of naked SPIONs, SPR/P and SPpH: 9.04±0.6 nm and 9.98±0.5 nm, respectively, indicates that the two different synthetic routes lead to similar magnetite crystalline sizes. These values are also in agreement with those usually reported for naked SPIONs [36,37]. For the dextran-coated SPIONs, a wider range of values was obtained: from 7.38 ± 0.9 nm for SPR/P-Dx to 12.04 ± 0.6 nm for SPpH-Dx. At first consideration, this fact may be only due to differences on the synthetic route and coating. However, it could also be related to the crystal shape of the nanoparticles. Indeed, the variable K in the Scherrer’s equation is associated with the crystal shape, and the value of K = 0.9 is commonly accepted, although it can vary between 0.62 and 2.08. In fact, this definition is only strictly adequate when the size and shape of the crystals are fairly uniform. These values are consistent with those found in other SPIONs coated with dextran-based polymers [14,20,21,35,38,39,40,41,42,43,44].
2.3. Transmission Electron Microscopy (TEM) and Dynamic Light Scattering (DLS)
The transmission electron microscopy (TEM) technique was used to evaluate the size, shape, and size dispersion (σ) of the different produced SPIONs (Equation 2). The average nanoparticle size (DTEM) was calculated from the TEM images using the Image-J program.
The obtained values are shown in Table 2 and corroborate the calculations performed previously using PXRD, indicating that the nanoparticles are mainly single crystallites [45]. They are also in line with those reported in the literature for this type of nanoparticles [42,43,46,47,48]. From the obtained values, the histograms presented were constructed using sample sizes (N) of 100 and 200.
The SPR/P nanoparticles (Figure 5a and Figure S5) are relatively well dispersed, with a DTEM of 10.02 ± 2.10 nm. A mixture of spherical, cubic and some undefined shapes can be observed, with a σ of 20.9% (Figure 5a, Table 2). As expected, DTEM values are slightly higher than DXRD since the former is related to the particle size and the latter only to its crystallite. As evidenced from the PXRD technique, the SPR/P sample presents a peak related to goethite, an iron oxide-hydroxide. Through TEM images, it was possible to confirm its presence, as shown by the elongated crystals next to the nanoparticles (Figure 5a, inset). If the presence of goethite is predominant in the sample, it may affect the efficacy of these nanoparticles for biomedical applications, since its shape is not favorable, and the hydroxide groups are not biocompatible. In addition, goethite has a lower magnetic moment when compared to magnetite or maghemite. The TEM images for the SPpH SPIONs (Figure 5b and Figure S6) showed good results with a size dispersion of 20.8%, a well-defined spherical shape with a few variations, and a DTEM of 12.19 ± 2.54 nm. In addition, they are better dispersed than SPR/P. Larger nanoparticles are found to be close but not aggregated, which may result from long range magnetic dipole-dipole interaction between the nanoparticles [45]. Coating the naked SPR/P with dextran and gold, SPR/P-Dx-Au (Figure S3) produced nanoparticles with DTEM = 10.91 ± 2.71 nm and σ = 24.84%.
Functionalization of these SPIONs with gadolinium, SPR/P-Dx-Au-Gd (Figure 5c), had no noticeable influence on their size, with a DTEM = 11.34 ± 2.8 nm, σ = 24.2%. In contrast, the successive coating of SPpH SPIONs consistently resulted in an increase of their size. Namely, there was an increase of more than 50% on the size for SPpH-Dx-Au-Gd (Figure 5e) compared to SPpH (19.98 ± 5.0 nm vs 12.02 ± 2.5 nm, respectively). It is however noteworthy that the nanoparticles are moderately dispersed, with some areas of higher nanoparticle concentration.
The Dynamic Light Scattering (DLS) analyses of the SPIONs showed different hydrodynamic sizes, comprehended between 25 nm and 352 nm. As can be inferred from Table 2, the hydrodynamic size of the SPIONs is very sensitive to changes in the surface coating and functionalization with gadolinium. The observed increase in hydrodynamic size from the naked SPIONs and the coated SPIONs with Dextran is expected. Dextran is a hydrophilic polymer that forms a protective layer around the nanoparticles. The hydrodynamic diameter of SPR/P-Dx is about 6-fold higher than that of the SPR/P and the one of SPpH-Dx about 5-fold higher than SPpH. A significant reduction in hydrodynamic size is observed after gold coating, indicating the formation of a thin, relatively closely packed gold layer on the surface of the SPIONs previously coated with Dextran. It was observed that the coatings rearrangements post stable coordination of Gd3+ ions led to an increase in the hydrodynamic size of the nanoparticles coated with Dextran and gold (SPR/P-Dx-Au-Gd and SPpH-Dx-Au-Gd).
The polydispersity index (PDI) observed for SPIONs shows a relatively low monodispersity distribution and is consistent with the tendency of these nanoparticles to agglomerate/aggregate in aqueous solution during the DLS measurement process [41,49]. Concerning MRI issues, polydispersity can have both advantages and disadvantages. The size of SPIONs influences their relaxivity, impacting MRI contrast. A polydisperse sample might have a broader range of relaxivities, potentially leading to improved contrast for certain imaging applications. However, it can also introduce challenges in reproducibility and control, which are essential for consistent imaging results [42,44,50,51].
The zeta potential is a measure of the electric charge on the surface of nanoparticles in a colloidal suspension. It indicates the extent of repulsion between charged particles, which affects their stability and interactions with other particles or surfaces. Thus, this parameter is a keystone factor used to predict the stability of nanoparticles in terms of monodispersity (or agglomeration) in solution. Values above ± 25 mV are indicative of a high stability whereas values between 0 mV and ± 5 mV are indicative of a fast aggregation of the particles [52].
Zeta values determined for all samples are also presented in Table 2. Naked samples SPR/P and SPpH show a ζ of 40.3 ± 8.1 and 43.80 ± 9.7 mV, respectively. This indicates good stability and dispersion of the particles, as also confirmed from the TEM analyses. SPIONs SPR/P-Dx-Au and SPpH-Dx-Au coated with dextran have a slightly negative zeta potential due to the presence of dextran functional groups that confer a negative charge. Functionalization of these SPIONs nanoplatforms with gadolinium leads to an increase in the zeta potential, indicating a modification in the surface charge of the particles.
2.4. 57Fe Mössbauer Spectroscopy
57Fe Mössbauer spectroscopy measurements were carried out in order to better characterize the iron oxides in the NPs based on the iron coordination and oxidation state. The spectra of the SPR/P, SPR/P-Dx and SPR/P-Dx-Au samples taken at room temperature (Figure S7), showing six broad absorption bands, as well as an additional doublet, are consistent with superparamagnetic iron oxides. These spectral features arise when crystallites are nanosized and consist of single magnetic domain particles. They are so small that thermally induced energy fluctuations change the direction of the magnetization of the NPs from one easy axis to another with a frequency higher than the Larmor precession frequency of the nuclear magnetic moment in the local field [53]. If NPs with a finite range of volumes are present, they will give rise to a superposition of spectra with different relaxation frequencies.
Decreasing the temperature to 4 K slows down the relaxation of the direction of the magnetic moments and allows the observation of sharper peaks (Figure S7). The 4 K spectra cannot be fitted by a single magnetic sextet. Three sextets are necessary to adequately analyse the spectra. The estimated parameters (Table S3) suggest that two sextets are due to tetrahedrally and octahedrally coordinated Fe3+ in maghemite and magnetite [14,15] and the third sextet with the highest isomer shift suggests Fe2+ in magnetite below the Verwey transition [14,55]. These data allow the estimate of the Fe fraction in maghemite and magnetite domains. For instance the analysis of the SPR/P spectrum at 4 K shows that ~3.8% of Fe is present as Fe2+. This implies that approximately 11% of the Fe in the sample is present in magnetite nano domains (3.8% Fe2+, plus 3.8% Fe3+ on the octahedral sites, plus 3.8% Fe3+ on the tetrahedral sites). For SPR/P-Dx and SPR/P-Dx-Au approximately 11% and 13% of the Fe is present in magnetite nano domains, respectively.
The room temperature spectra of SPR/P, SPR/P-Dx and SPR/P-Dx-Au may be fitted with distributions of magnetic hyperfine fields, Bhf, in order to simulate the magnetic relaxation signals, and a quadrupole doublet which corresponds to the particles with the fastest magnetic relaxation [14,56]. No additional structural information may be obtained from these spectra whose shape is mainly determined by the magnetic relaxation effects. Reasonable fits may be obtained assuming isomer shifts, IS, consistent with high-spin Fe3+ and Fe2.5+. These IS values are kept constant during the refinement procedures, which lead to results consistent with those obtained for the 4 K spectra.
The room temperature spectra of SPpH, SPpH-Dx, SPpH-Dx-Au and SPpH-Dx-Au-Gd (Figure 6 and Figure S8) reveal that the magnetic relaxation of the iron oxide NPs in these samples is significantly slower than in SPR/P, SPR/P-Dx and SPR/P-Dx-Au.56 The spectra of the SPpH samples show no quadrupole doublet and only six asymmetrically broadened absorption peaks, but significantly less broadened than the distribution of Bhf observed for the SPR/P samples at 295 K. The SPpH spectra at this temperature may therefore be properly analyzed if three magnetic splittings are considered [20]. One of the sextets is typical of the fast electron hopping observed between Fe2+ and Fe3+ on the octahedral sites of magnetite above the Verwey transition (Table S3). These Fe cations are usually reported as Fe2.5+ [55,57]. The remaining two sextets are consistent with Fe3+ on octahedral sites of maghemite and unresolved contributions of Fe3+ on tetrahedral sites of both magnetite and maghemite domains. Mössbauer data suggest, therefore, that approximately 33-45% of the Fe cations in the SPpH samples are in magnetite domains while the remaining Fe cations are on maghemite domains.
2.5. Magnetic Characterization by Magnetometry
Considering the importance of having magnetic nanoparticles with superparamagnetic behaviour at room temperature to improve their potential therapeutic applications, such hyperthermia and MRI3,4, the magnetic characterization of all samples was performed at each step of coating procedures. This characterization used static (DC) magnetization, by measuring the hysteresis loops at two different temperatures, 300 K and 10 K, and the thermal dependence of the magnetization after the zero-field-cooling (ZFC) and field-cooling (FC) cycles.
2.5.1. Samples Obtained with the Reduction-Precipitation Process (SPR/P)
The temperature dependence of the ZFC/FC magnetization curves of this series of SPION samples are presented in Figure 7 and Figure S9. At zero field (ZFC curve) the magnetic moments of the SPIONs are randomly distributed, showing a very low net magnetic moment.
On the contrary, when the sample is cooled under a magnetic field (FC curve), the alignment along the field direction, is takes place and a larger net moment is observed. ZFC increases in all the range of measured temperatures, from 4 K up to 310 K, indicating that the magnetic moments gradually align along the magnetic field direction. Irreversibility of both ZFC and FC curves are observed with the ZFC curves showing broad maxima which indicate the appearance of a superparamagnetic state, typical for particles with such small dimensions although with some particle size distribution. Larger nanoparticles require a higher temperature for the thermal energy to exceed the energy barrier and to behave as superparamagnets [40]. Estimated blocking temperatures, TB are shown in Table 4. SPR/P exhibits a TB of 85 K indicating they have superparamagnetic behaviour at RT. In fact, as revealed by the curves of the magnetic field dependence of the magnetization, M(B), up to 5 T, the absence of both coercivity (Hc) and magnetic remanence (MR), at 300 K (Figure 8), confirms this behaviour while at low temperature, 10 K, a small coercive field, Hc, is observed (Figure S10). SPIONs usually present a large surface-to volume ratio, which generally results in high chemical activity and loss of dispersibility. In this way this magnetic behaviour is a good advantage for its use in theranostic, suggesting no tendency to form clusters.
As the SPIONs core gradually becomes more covered, the saturation of magnetization (Ms) values tends to decrease, from samples SPR/P to SPR/P-Dx-Au-Gd (Figure 8) with values varying between 51.00 and 38.30 Am2/Kg, respectively, although the superparamagnetic behaviour remains unchanged. The Ms value for the naked sample, 1, is in good agreement with the literature of synthesized SPIONs through similar co-precipitation methods [14,20]. On the other hand, the saturation of magnetization for the completed covered sample, SPR/P-Dx-Au-Gd, 4, decreased by 24.9% relative to its naked version, however, this Ms reduction is significantly lower when compared to other reported values [39,40] where SPIONs after gold coating lost more than 30% of their Ms values. Therefore, the small Ms reduction that was obtained after the coating and functionalization processes may be a breakthrough in this research. Overall, these magnetic results ensure the use of such nanoparticles for biomedical applications.
At 10 K (Figure S10), quite below their TB, all samples exhibit higher saturation of magnetization and hysteresis loop as the field changes, meaning that at this temperature it is necessary to apply a coercive field to reach a magnetization of zero, which reveals the ferrimagnetic behaviour of the iron oxides nanoparticles.
2.5.2. Samples Obtained with the Co-Precipitation with Controlled pH (SPpH).
Like measurements performed for samples prepared by the R/P method, ZFC/FC cycles were performed for samples where SPIONs were obtained with controlled pH, 5-8, as shown in Figure 7 and Figure S11. These measurements revealed blocking temperatures, TB, relatively higher than samples 1-4, as expected considering the differences in their particle size according to TEM and XRD; samples obtained via MR/P have smaller sizes than samples via MpH, and consequently TB occurs at lower temperature. It is important to note the different path of these ZFC/FC cycles, more pronounced in sample 5, SPpH, when compared to the correspondent sample 1, SPR/P. An additional kink at temperature lower than 100 K is observed which is probably related to the Verwey transition characteristic of magnetite observed in the Mössbauer spectra. The fact that this occurs at temperatures lower than the Verwey transition temperature (observed at 122–125 K for bulk magnetite with the ideal stoichiometry) may be explained by several factors, among which are the partial oxidation and small size of the magnetite particles [14,20,57]. The narrow range of temperatures where this transition occurs in sample “pH”, 33–38 K, is possibly related to the similar sizes of these nanoparticles (see Table 2). The absence of this kink in samples obtained from the MR/P method can be due to the lower content of magnetite nanodomains as well as the smaller size distribution of the nanoparticles, as revealed by the structural and Mössbauer data.
Isothermal magnetization curves were obtained up to 5 T, at fixed temperatures, 300 K and 10 K (Figure 9 and Figure S12), to estimate the saturation of magnetization (Table 3) and to confirm superparamagnetism. At room temperature a considerable value of Ms = 64.2 Am2/Kg for the naked version, SPpH was obtained. This value is comparable with the ones reported in the literature for magnetite nanoparticles with similar average size and spherical shape [20,41,42]. As seen in Figure 8 and Figure 9, and by comparing the “R/P” samples with these new ones, type by type, one can notice that the SPIONs obtained by the MpH method, show higher Ms values confirming the above XRD and the Mössbauer data lower oxidized spinel content, where a higher % of Fe3O4 was estimated. These good results validate this synthesis method as the one that may provide SPIONs with the best magnetic performance so far.
As expected, samples covered with Au and subsequently with Gd have their Ms values decreased by about 10% and 20%, respectively, although with a still significant magnetic signal of Ms which are in accordance with other reports of synthesized SPIONs through co-precipitation method [42,43,44,58]. The absence of both coercivity and remanence on the isothermal curves at 300 K in all the samples confirms their superparamagnetic behaviour at room temperature while at low temperature, 10 K (Figure S12), a small coercive field, Hc, is observed meaning that SPIONs become “blocked” at low temperature and resulting in the opening of the hysteresis loop.
2.6. Magnetic Hyperthermia
Naked SPIONs (sample SPR/P, 1) were submitted to an alternated magnetic field with different amplitudes (4, 12 and 16 kA/m) and different frequencies (45, 90, 140, 180 kHz). The acquired data include temperature stabilization (1 minute) and the heating of the sample until temperature saturation as shown in Figure 10a). The heating curves were fitted with Box-Lucas’s method [23,24] and the obtained specific absorption rate (SAR) is summarized in the Table 4. For the same frequency (140 kHz) the SAR value increases by increasing the intensity of the magnetic field. Increasing the intensity of the magnetic field means that more energy is being applied to the magnetic nanoparticles.

Table 4.
Specific absorption rate, SAR, values of samples at different frequencies and applied magnetic fields.
Table 4.
Specific absorption rate, SAR, values of samples at different frequencies and applied magnetic fields.
| H(kA/m) | 4 | 12 | 16 | 16 | 16 | 12 | |
| Sample | F(kHz) | 140 | 140 | 140 | 90 | 45 | 180 |
| SPR/P (1) | 424 | 794 | 934 | 872 | 513 | 997 | |
| SPR/P-Dx (2) | - | 0 | 0 | - | - | 247 | |
| SPR/P-Dx-Au-Gd (4) | - | 375 | 4726 | - | - | 3588 | |
| SPpH (5) | 0 | 607 | 730 | - | 2023 | 1860 | |
| SPpH-Dx-Au (7) | - | 2970 | 57082 | - | - | 32143 | |
| SPpH-Dx-Au-Gd (8) | - | 8970 | 97673 | - | - | 12991 |
As a result, more heat is generated through magnetic relaxation processes. Also, higher magnetic field intensity can lead to a greater alignment of the magnetic moments of the nanoparticles with the field. This enhanced alignment also makes the nanoparticles more effective at absorbing and dissipating the energy from the alternating magnetic field (AMF) [59]. Keeping constant the intensity of the magnetic field (12 kA/m) and varying the frequency (45, 90, 140 kHz) applied to the sample SPR/P, 1, the SAR value also significantly increases. This behaviour can be associated with hysteresis losses or relaxation time [60]. At higher frequencies, the hysteresis cycles occur more rapidly, leading to increased hysteresis losses and, consequently, higher heat generation [61]. Also, if the frequency of the AMF matches or is close to the relaxation time of the nanoparticles, it can result in enhanced energy absorption and heat generation.
When the SPIONs are functionalized with Dextran (SPR/P-DX, 2) the SAR value decreases significantly as shown in Table 4. Dextran coating increases the overall size of the SPIONs and affect their hydrodynamic behaviour. Larger particles may experience reduced Brownian motion and less efficient heat generation in response to an alternating magnetic field, especially at low frequencies. This can contribute to a lower SAR.
When Gd is introduced in the SPIONs (sample SPR/P-DX-Au-Gd, 4), the SAR values significantly increase (Figure 10b) and Table 4). Gadolinium is a lanthanide element with strong paramagnetic properties. When Gd ions are introduced into SPIONs, they increase the overall magnetic moment of the nanoparticles. This enhanced magnetic moment leads to a more efficient response to an external magnetic field and contributes to higher heat generation, resulting in an increased SAR.
Both SPIONs doped with Gd and coated with Dextran and gold (SPR/P-Dx-Au-Gd, 4, and SPpH-Dx-Au-Gd, 8) presents the same behaviour, however the overall value of SAR is higher for SPpH-Dx-Au-Gd (Figure 10c)). This sample presents the highest SAR value up to a frequency of 140 kHz and high magnetic field (16 kA/m) due to the high dimensions of these nanoparticles still in a superparamagnetic regime. The size of SPIONs plays a critical role in their response to an AMF. These larger nanoparticles present larger magnetic moments (as discussed in the previous sections) due to increased volume and magnetic properties. This resulted in higher energy absorption and, consequently, higher SAR.
2.3. Relaxitivity Studies
To assess the MRI potential application of the particles, we have imaged phantom tubes containing SPIONs samples in a 7 T Bruker scanner (300 MHz, room temperature, Figure 11) and measured the longitudinal (r1) and transverse (r2) relaxivities based on the T1 and T2 maps generated (Table 5). A sample of water has also been measured to determine the diamagnetic contribution of the solvent and this value was used for the relaxivity determination. Samples 0.14±0.04 mg/mL were prepared in water and their content on Fe, Gd and Au measured by ICP-OES. The relaxivity values were calculated using the Gd concentration for the r1 determination and the Fe concentration for the r2. Table 5 also depicts the r2/r1 ratio.
The influence of several parameters in the relaxivity of SPIONs has been studied [62,63,64,65]. These include mainly size, shape and surface structure and modifications. As a first observation, the naked SPIONs have r2 relaxivities similar to other SPIONs reported in the literature, and in the same range as the commercially available Feridex or Resovist (120 and 186 mM-1s-1, respectively, 1.5 T) [62].
The presence of Au and Gd induced a decrease in the relaxivity of functionalised particles prepared by both methods, which is consistent with the Ms decrease observed between samples functionalized with Gd, 4 and 8 and samples naked, 1 and 5 (Table 3), and coating effects partially attributed to the presence of the diamagnetic layer of Dx, as reported in the literature [66,67].
It is also clear that the presence of Gd enables a longitudinal relaxivity contribution, similar or higher than the r1 relaxivities of the typical Gd-based MRI contrast agents in clinical use (3.4 to 4.6 mM-1s-1 at 1 T (42 MHz), 37 °C) [68,69]. SPIONs functionalised with Gd and/or gold NPs typically present r1 relaxivities that can vary between 4 and 40 mM-1s-1 [62,63,65,67,70,71]. Data reported in the literature are acquired under different conditions, namely different magnetic fields which highly affect the relaxivity [69]. For example, at 7 T, Lip- DO3A@AuNP present a r1 of 4 mM-1s-1 [70] while Gd-Au-SPIONs have r1 of 43.6 mM-1s-1 and r2 of 123 mM-1s-1 [71]. Typically, probes presenting a transverse-to-longitudinal relaxivity ratio (r2/r1) smaller than 2 are considered as positive or T1- contrast agents. Ratios larger than 10 imply negative or T2- agents, while 2< r2/r1 <10 refers to potential dual-functional contrast agents [72,73]. Thus, sample SPpH-Dx-Au-Gd (8) can be potentially used a dual T1/T2 agent. Figure 11 illustrates MRI T1– and T2– weighted images obtained from phantom tubes containing SPIONs studied, confirming the detectability of these samples in a 7 T MRI scanner.
Importantly, when comparing SPIONs prepared by the two methods, we observe that the co-precipitation one, MpH, leads to particles with higher relaxivities. This is in fact consistent with the higher percentage of iron(III) present in SPpH, which in turn lead to higher Ms values, and also better hyperthermia properties.
3. Materials and Methods
3.1. Materials
All chemicals and solvents were of reagent grade and were used without additional purification, unless stated otherwise. The Milli-Q water was produced from a Millipore system Milli-Q ≥18 MΩcm (with a Millipak membrane filter 0.22 μm). Iron(III) chloride hexahydrate (FeCl3.6H2O), iron(II) chloride tetrahydrate (FeCl2.4H2O), sodium sulfite (NaSO3), ammonia solution (NH4OH, 25%), hydrochloric acid (HCl, 37%), sodium hydroxide in pellets (NaOH), tetrachloroauric(III) acid trihydrate 99% (HAuCl4.3H2O), sodium borohydride (NaBH4), gadolinium(III) chloride (GdCl3.6H2O) and dextran (Dx) from Leuconostoc mesenteroides (average mol wt. 9.000-11.000) were commercially acquired from Aldrich Chemical.
The ligand 2-[4,7-bis(carboxymethyl)-10-[2-(3-sulfanylpropanoylamino)ethyl]-1,4,7,10-tetrazacyclododec1-yl]acetic acid (TDOTA) was synthesized as previously reported.16
3.2. Synthesis of Naked SPIONs
3.2.1. Reduction-Precipitation Process (MR/P)
The synthesis of Naked SPIONs (SPR/P) was based on the method described by Matos et al.14, consisting of Fe3+ reduction with Na2SO3 followed by Fe3O4 precipitation through titration with NH4OH. In a representative reaction, a solution of 4.5 g (16.67 mmol) of FeCl3.6H2O in 2.5 mL of HCl (2 M) and 2.5 mL of Milli-Q water was carefully added to a solution of 420 mg (3.33 mmol) of Na2SO3 in 3 mL of Milli-Q water and stirred at a moderate level at r.t. and Patm, for 30 minutes. A solution containing 125 mL of NH4OH (25 % w/w) was then added dropwise to the previous solution. Due to the precipitation of Fe3O4, the color of the solution becomes dark during this phase. The final product was magnetically stirred for approximately 24 h, centrifuged at 4000 RPM for 10 min and washed twice with Milli-Q water. After freeze-drying the reaction product, 644 mg of SPR/P were obtained.
3.2.2. Co-Precipitation Process with Controlled pH (MpH)
SPpH nanoparticles were obtained based on the strategy of Saraiva et al. [209, which consists of a standard co-precipitation method at room temperature, using as precursors ferrous and ferric chlorides in a molar ratio [Fe3+/ Fe2+] = 1:2. In a typical reaction, two aqueous solutions of FeCl3.6H2O (0.01 M) and FeCl2.4H2O (0.02 M) were mixed. The resulting solution was de-aerated with nitrogen gas (N2) for 10 minutes to ensure the removal of oxygen during the co-precipitation process. To promote the precipitation of Fe3O4, NH4OH (25 % w/w) was slowly added until the pH of the solution was close to 9.6. The instantaneously formed SPIONs suspension was filtered through a 0.22 μm membrane, washed with Milli-Q water and the obtained precipitated SPpH were freeze-dried.
3.3. Post-synthesis of SPIONs Coating
3.3.1. Dextran Coating
Briefly, in the typical reaction, a solution of 241 mg of Dx in 6 mL of NaOH (0.5 M) was slowly added to a naked SPIONs suspension (SPR/P or SPpH) with a density of 8 mg/ mL under intense magnetic stirring and maintained at 175 ℃. After completed the addition, the solution was left under moderate magnetic stirring and room temperature for 24 h. The resulting dextran coated SPIONs (SPR/P-Dx and SPpH-Dx) were washed three times with new Milli-Q water to remove excess polymer and were lyophilized.
3.3.2. Gold Coating
In a typical reaction, SPR/P-Dx or SPpH-Dx (209 mg) were then spread in Milli-Q water (30 mL) and added drop by drop to a solution of 96 mg HAuCl4.3H2O in 10 mL of Milli-Q water (0.028 M) at 70 ℃. The color of the solution turns from dark brown to reddish brown after 15 minutes. Then the pH of the solution was raised up from 3 to around 9 by the addition of a solution NaBH4 (0.37 M) and left to react for 5 h under moderate stirring. The final products (SPR/P-Dx-Au, and SPpH-Dx-Au) were washed three times with Milli-Q water, centrifuged, at 5000 RPM for 10 minutes, and lyophilised.
3.3.3. Gadolinium Functionalization
In the final step the SPR/P-Dx-Au and SPpH-Dx-Au were functionalized with gadolinium. For that, a solution of 78.6 mg of TDOTA16 was added to a suspension of 132 mg of SPIONs, in 5 mL Milli-Q water and left to react during 7 h, at room temperature. Then, 61 mg of GdCl3.6H2O in 3 mL of Milli-Q water was slowly added to the former solution and left to react for 18 h under moderate stirring. The pH of the solution drops from about 8 to near 6, confirming the complexation of Gd3+ to the nanoplatform. Finally, to isolate SPR/P-Dx-Au-Gd and SPpH-Dx-Au-Gd, the suspensions were placed in a dialysis membrane and dialyzed for two days in Milli-Q water, changing the water three times a day. After dialysis, the solutions were centrifuged (5000 RPM, 12 min), washed with Milli-Q water three times, and freeze-dried for 48 h.
3.3. Characterization of the SPIONs
3.3.1. UV-Vis Spectrophotometry (UV-Vis)
The UV-Vis spectra of MILI-Q SPIONs dispersions with a concentration of 50 µg /mL were recorded at room temperature using a Varian Cary 50 UV/Vis spectrophotometer in a quartz cell (path length = 1 cm), in the range 200–800 nm.
3.3.2. Attenuated Total Reflectance Fourier-Transform Infrared Spectroscopy (ATR-FTIR)
The Fourier transform infrared (FTIR) spectra were measured using a FTIR Nicolet iS50 spectrometer equipped with an ATR diamond crystal accessory (Thermo Fisher Scientific, Madison, WI, USA), as a KBr pellets. The spectra were recorded at room temperature at a resolution of 4 cm-1, with 128 scans from 4000 to 400 cm-1.
3.3.3. Powder X-Ray Diffraction (PXRD)
The crystallinity of the synthesized SPIONs was checked by powder X-Ray diffraction (PXRD) using a Bruker D2 Phaser diffractometer equipped with a Cu Kα X-ray tube (monochromatic radiation, λ= 1.5406 Å). All the scans were performed in the 2θ range from 10° to 80°, after establishing the following operational settings: a voltage of 30 kV, a current of 10 mA, a step size of 0.02°, and a time per step of 10 s. The scans were collected electronically and processed using the DIFFRAC.EVA pattern processing software. The crystallite size of the SPIONs samples was estimated by Scherrer’s equation:
where D is the estimated value of the crystallite size (nm), λ is the X-ray wavelength (0.154 nm), K is the Scherrer constant of which the value varies from 0.62 to 2.08 (in the absence of any information related to the crystal shape, it is commonly accepted to use K = 0.9 for spherical particles), θ is the Braggs angle corresponding to the most intense reflection, and β is the full width at the half maximum of the peak (FWHM, in radians) [21]. The resulting crystallographic patterns were analyzed with the help of the software DIFFRAC.EVA, where the crystallite size and chemical matching were determined, combined with some corrections to the curve, such as background subtracting and smoothing of the lines. The intensity of each peak in the patterns was used as an estimate of the relative percentage of each compound, which was then compared to other quantifying techniques. The final graphs were then plotted with the help of the software Origin.
3.3.4. Transmission Electron Microscopy (TEM)
The size and the shape of the selected multifunctional nanoplatforms were characterized by TEM at Instituto Gulbenkian de Ciência (IGC). Samples were prepared by dipping a 300-mesh carbon-coated copper grid into a solution containing the SPIONs sample previously sonicated followed by air-dried at room temperature for 5 min. Images were obtained on a FEI Tecnai G2 Spirit BioTWIN transmission electron microscope. Software Image-J was used to process the obtained images to determine the average size and shape of the SPIONs. Size dispersion was calculated using equation 2:
3.3.5. Dynamic Light Scattering (DLS) and Zeta-Potential
The DLS measurements were performed using a Malvern Zetasizer Nano ZS (Malvern Instruments Ltd., Worcestershire, UK) equipped with a 633 nm He-Ne laser and operating at an angle of 173°. The software used to collect and analyze the data was the Dispersion Technology Software (DTS) version 5.10 from Malvern. In total, 600 µL of each sample was measured in low-volume semi-micro disposable sizing cuvettes (Fisher Scientific, USA) with a path length of 10 mm. Triplicate measurements were taken at a position of 4.65 mm from the cuvette wall with an automatic attenuator. For each sample, 15 runs of 10 s were performed. The size distribution, the Z-average diameter, and the polydispersity index (PDI) were obtained from the autocorrelation function using the “general purpose mode” for all the nanoparticle samples. The default filter factor of 50%, the default lower threshold of 0.05 and an upper threshold of 0.01 were used. The zeta potential measurements were performed in triplicates using water as a dispersant and the Huckel model. For each sample, 20 runs were performed in the auto-analysis mode.
3.3.6. Determination of the Iron, Gold, and Gadolinium Content
The iron (Fe) gold (Au) and gadolinium (Gd) content of the obtained nanoparticles was quantified using Inductively Coupled Plasma Optical Emission Spectrometry (ICP-OES). Spectrometric (ICP-OES) measurements were performed in an Agilent Technologies 5800 VDV ICP-OES. Fe, Gd and Au standard solutions were prepared in about 5-10 % Aqua regia matrix (HNO3:HCl, 1:3). A 200 µL sample of each NP solution prepared were digested following the protocol: 1) evaporation to dryness, 2) re-dissolved in 1 mL of concentrated Aqua Regia and evaporated to dryness, 3) addition of 100 µL of 30% H2O2 + 100 µL of Milli-Q water are then added and evaporated to dryness and finally retaken in 5 mL of about 5-10 % Aqua Regia for ICP measurements. The quantitative determinations were performed using the most accurate wavelenght: 342.246 nm for Gd; 259.940 nm for Fe and 267.594 nm for Au. All the measurements were done in triplicate.
3.3.7. Mössbauer Spectroscopy
Mössbauer spectra of the NP samples were collected at room temperature and at 4 K in transmission mode using a conventional constant acceleration spectrometer and a 25-mCi 57Co source in Rh matrix. The velocity scale was calibrated using an α-Fe foil at room temperature. Isomer shift values, IS, are given relative to this standard. Low-temperature measurements were performed with the sample immersed in liquid He in a Janis bath cryostat, model SVT-400. The spectra were fitted to Lorentzian lines using a non-linear least-squares method [20]. Relative areas and line widths of both peaks in a quadrupole doublet and of peak pairs 1-6, 2-5 and 3-4 in a magnetic sextet were constrained to remain equal during the refinement procedure. Distributions of magnetic splittings were fitted according to the histogram method [22].
3.3.8. SQUID Magnetometry
Static DC magnetic measurements were obtained using a 6.5 T SQUID (Superconducting Quantum Interference Device) magnetometer from Cryogenic Ltd. To assess the saturation of magnetization (Ms) and the superparamagnetic behavior at room temperature, isothermal curves were taken at temperatures of 300 K and 10 K for magnetic fields up to 5 T. Temperature dependence of the magnetization within the range 5–320 K in the presence of an external magnetic field of 100 Oe were also measured. The data was collected at increasing temperatures, from 10 to 300 K, after zero field cooling and field cooling (ZFC/FC) cycles.
3.3.9. Magnetic Hyperthermia
The heating efficiency of SPIONs dispersion in water ([Fe] = 4 mM/mL) was assessed using an alternating magnetic field (AMF) generated by AC GEN from Nanotech Solutions. The AMF had a frequency from 45 to 180 kHz and a magnetic field strength from 5 to 200 Oe, applied for a duration of 5 minutes (maximum H.f = 2.9x10⁹ Am-1s-1). These experimental results conform to the safety guidelines proposed by Hergt and Dutz, adhering to the criterion of H.f = 5x10⁹ Am-1s-1 for potential clinical applications of AMF. A sample volume of 500 μL, were introduced into Eppendorf tubes and individually positioned within the magnetic coils. Temperature changes were continuously monitored and recorded every second using a thermal infrared camera, located on the top of the coil cavity. The specific absorption rate (SAR) was calculated using the Box-Lucas’s method [23,24].
3.3.10. MRI Phantoms and Relaxometric Measurements
MR images of tubes containing water and the SPIONs solutions (0.14±0.04 mg/mL) were acquired on a 7 T Pharmascan 70/16 superconducting magnet (Bruker, Wissembourg, France) with a shielded gradient set (230 mT m−1 maximum gradient amplitude) and a transmit-receive quadrature coil with an inner diameter of 38 mm and Paravision 5.0 software (Bruker BioSpin, Wissembourg). Images were acquired using rapid spin echo sequence (RARE sequence, factor 8) with TE = 10 ms; 20 ms; 30 ms; 40 ms; and 50 ms and TR = 5.5 s; 3.0 s; 1.5 s; 0.8 s; 0.4 s; and 0.2 s. or TE = 8 ms; 25 ms; 41 ms; 58 ms; and 75 ms for the samples with very low T2. The resolution was 156 x 156 µm2 with a matrix of 128 x 128 and a F.O.V. of 4.0 x 4.0 cm. Slice thickness was 1.0 mm. T1 and T2 maps were generated with Paravision software, and T1 and T2 values were calculated from these maps. All measurements were performed at room temperature and a tube containing water was measured under the same conditions for visual comparison and as diamagnetic contribution at 7 T. The Fe, Au and Gd concentrations were assessed by ICP-OES (see above).
4. Conclusions
We have thoroughly investigated and comprehensively characterized a series of nanoplatforms based on superparamagnetic iron oxide nanoparticles (SPIONs), prepared through two distinct methods. Our findings collectively indicate that the co-precipitation method with controlled pH results in nanoparticles with enhanced magnetic properties, rendering them well-suited for theranostic applications. In addition to maintaining magnetic properties, SPIONs coated with gold (Au) and gadolinium (Gd) exhibited excellent Specific Absorption Rate (SAR) and Magnetic Resonance Imaging (MRI) properties. This suggests their potential as dual T1/T2 contrast agents, thereby demonstrating high efficacy for magnetic hyperthermia applications in these nanoplatforms.
Supplementary Materials
The following supporting information can be downloaded at the website of this paper posted on Preprints.org. Figure S1: title; Table S1: title; Video S1: title.
Author Contributions
V. Ferreira-Filho: Investigation, Methodology, Writing - original draft; B. Morais: Investigation, Methodology, Formal analysis; B.J.C. Vieira: Investigation, Formal analysis; J.C. Waerenborgh: Conceptualization, Investigation, Methodology, Validation, Writing - review & editing; M.J. Carmezim: Conceptualization, Investigation, Methodology, Validation. C.N. Tóth: Investigation, Formal analysis; S. Même: Investigation, Formal analysis; S. Lacerda: Conceptualization, Writing - review & editing; D. Jaquef: Investigation, Formal analysis; C.T. Sousa: Conceptualization, Writing - review & editing; M.P.C. Campello: Conceptualization, Formal analysis, Methodology, Validation, Project Administration, Writing - review & editing, Supervision; L.C.J. Pereira: Conceptualization, Formal analysis, Methodology, Validation, Funding acquisition, Project Administration, Validation, Writing - review & editing, Supervision.
Funding
This research received no external funding.
Institutional Review Board Statement
Not applicable.
Informed Consent Statement
Not applicable.
Data Availability Statement
The data are contained within the article and Supplementary Material.
Acknowledgments
This work was partially supported by FCT, Fundação para a Ciência e a Tecnologia, I.P, through contracts, UID/Multi/04349/2019 and LTHMFL-NECL LISBOA-01-0145-FEDER-022096 and PhD doctoral grant to V.F.F. (PRT/BD/12745/2024). Authors gratefully acknowledge the assistance of the Instituto Gulbenkian de Ciência - Electron Microscopy Facility that were used to perform the TEM analysis. S.L. gratefully acknowledge Agnès Pallier and Dr Zoltán Garda for fruitful discussions on ICP and relaxivity methods.
Conflicts of Interest
The authors declare no conflicts of interest.
References
- Paterson, D.; Wiebe, N.; Cheung, W.; Mackey, J.R.; Pituskin, E.; Reiman, A.; Tonelli, M. Incident cardiovascular disease among adults with cancer: a population-based cohort study. J Am Coll Cardiol CardioOnc. 2022, 4, 85. [Google Scholar]
- R. L.Siegel, R.L.; Miller, K.D.; Wagle, N.S.; Jemal, A. Cancer statistics, 2023. CA Cancer J Clin. 2023, 73, 17. [Google Scholar]
- Abed, A.; Derakhshan, M.; Karimi, M.; Shirazinia, M.; Mahjoubin-Tehran, M.; Homayonfal, M.; Hamblin, M.R.; Mirzaei, S.A.; Soleimanpour, H.; Dehghani, S.; Dehkordi, F.F.; Mirzaei, H. Cutting-Edge Applications of Nanomaterials in Biomedical Sciences. Frontiers in Pharmacology 2022, 13, 797804. [Google Scholar] [CrossRef]
- Khursheed, R.; Dua, K.; Vishwas, S.; Gulati, M.; Jha, N.K.; Aldhafeeri, G.M.; Alanazi, F.G.; Goh, B.H.; Gupta, G.; Paudel, K.R.; Hansbro, P.M.; Chellappan, D.K.; Singh, S.K. Biomedical applications of metallic nanoparticles in cancer: Current status and future perspectives. Biomedicine and Pharmacotherapy 2022, 150, 112951. [Google Scholar]
- Thakor, A.S.; Jokerst, J.V.; Ghanouni, P.; Campbell, J.L.; Mittra, E.; Gambhir, S.S. Clinically Approved Nanoparticle Imaging Agents. J Nucl Med 2016, 57, 1833. [Google Scholar] [CrossRef]
- Wu, L.; Wen, W.; Wang, X.; Huang, D.; Cao, J.; Qi, X.; Shen, S. Analysis of Experimental Data on Changes in Various Structures and Functions of the Rat Brain following Intranasal Administration of Fe2O3 Nanoparticles. Part Fibre Toxicol 2022, 19, 24. [Google Scholar] [CrossRef]
- Soetaert, F.; Korangath, P.; Serantes, D.; Fiering, S.; Ivkov, R. Cancer therapy with iron oxide nanoparticles: Agents of thermal and immune therapies. Adv. Drug Delivery Rev. 2020, 65, 163–164. [Google Scholar] [CrossRef]
- Aziz, O.A.A.; Arafa, K.; Dena, A.S.A.; El-Sherbiny, I.M. Superparamagnetic Iron Oxide Nanoparticles (SPIONs): Preparation and Recent Applications. J. Nanotech. & Adv. Mat. 2020, 8, 21. [Google Scholar]
- Gaeta, M.; Cavallaro, M.; Vinci, S.L.; Mormina, E.; Blandino, A.; Marino, M.A.; Granata, F.; Tessitore, A.; Galletta, K.; D’Angelo, T.; Visalli, C. Magnetism of materials: theory and practice in magnetic resonance imaging. Insights into Imaging 2021, 12, 179. [Google Scholar] [CrossRef]
- Dadfar, S.M.; Camozzi, D.; Darguzyte, M.; Roemhild, K.; Varvarà, P.; Metselaar, J.; Banala, S.; Straub, M.; Güvener, N.; Engelmann, U.; Slabu, I.; Buhl, M.; van Leusen, J.; Kögerler, P.; Sachweh, B.H.; Schulz, V.; Kiessling, F.; Lammers, T. Size-isolation of superparamagnetic iron oxide nanoparticles improves MRI, MPI and hyperthermia performance. J Nanobiotechnol 2020, 18, 22. [Google Scholar] [CrossRef]
- Liu, G.; Gao, J.; Ai, H.; Chen, X. Applications and potential toxicity of magnetic iron oxide nanoparticles. Small 2013, 9, 1533. [Google Scholar] [CrossRef]
- Dizaji, A.N.; Yilmaz, M.; Piskin, E. Silver or gold deposition onto magnetite nanoparticles by using plant extracts as reducing and stabilizing agents. Nanomedicine and Biotechnology 2016, 44, 1109. [Google Scholar]
- Yang, Q.; Li, Y.; Zhao, X.; Zhang, J.; Cheng, X.; Zhu, N. Nanoenzyme-Based Electrodes in Biomolecular Screening and Analysis. Appl Nanosci 2023, 13, 5489. [Google Scholar] [CrossRef]
- Matos, J.C.; Gonçalves, M.C.; Pereira, L.C.J.; Vieira, B.J.C.; Waerenborgh, J.C. SPIONs Prepared in Air through Improved Synthesis Methodology: The Influence of γ-Fe2O3/Fe3O4 Ratio and Coating Composition on Magnetic Properties. Nanomaterials 2019, 9, 943. [Google Scholar] [CrossRef]
- Wagner, W.R.; Sakiyama-Elbert, S.E.; Zhang, G.; Yaszemski, M.J. (Eds.) Biomaterials Science: An Introduction to Materials in Medicine; Academic Press, Elsevier, 2020. [Google Scholar]
- Silva, F.; Zambre, A.; Campello, M.P.C.; Gano, L.; Santos, I.; Ferraria, A.M.; Ferreira, M.J.; Singh, A.; Upendran, A.; Paulo, A.; Kannan, R. Interrogating the Role of Receptor-Mediated Mechanisms: Biological Fate of Peptide-Functionalized Radiolabeled Gold Nanoparticles in Tumor Mice. Bioconjugate Chemistry 2016, 27, 1153. [Google Scholar] [CrossRef]
- Silva, F.; Paulo, A.; Pallier, A.; Même, É.; Tóth, S.; Gano, L.; Marques, F.; Geraldes, C.F.G.C.; Castro, M.M.C.A.; Cardoso, A.M.; Jurado, A.S.; López-Larrubia, P.; Lacerda, S.; Campello, M.P.C. Dual Imaging Gold Nanoplatforms for Targeted Radiotheranostics. Materials 2020, 13, 513. [Google Scholar] [CrossRef]
- Marques, A.; Belchior, A.; Silva, F.; Marques, F.; Campello, M.P.C.; Pinheiro, T.; Santos, P.; Santos, L.; Matos, A.P.A.; Paulo, A. Dose rate effects on the selective radiosensitization of prostate cells by GRPR-targeted gold nanoparticles. International Journal of Molecular Sciences 2022, 23, 5279. [Google Scholar] [CrossRef]
- Silva, F.; Mendes, C.; D’Onofrio, A.; Campello, M.P.C.; Marques, F.; Pinheiro, T.; Gonçalves, K.; Figueiredo, S.; Gano, L.; Ravera, M.; Gabano, E.; Paulo, A. Image-guided nanodelivery of Pt (IV) prodrugs to GRP-receptor positive tumors. Nanotheranostics 2023, 7, 22. [Google Scholar] [CrossRef]
- Saraiva, A.S.; Ribeiro, I.A.C.; Fernandes, M.H.; Cerdeira, A.C.; Vieira, B.J.C.; Waerenborgh, J.C.; Pereira, L.C.J.; Cláudio, R.; Carmezim, M.J.; Gomes, P.; Gonçalves, L.M.; Santos, C.F.; Bettencourt, A.F. 3D-printed platform multi-loaded with bioactive, magnetic nanoparticles and an antibiotic for re-growing bone tissue. International Journal of Pharmaceutics 2021, 593, 120097. [Google Scholar] [CrossRef]
- Uvarov, V.; Popov, I. Metrological characterization of X-ray diffraction methods at different acquisition geometries for determination of crystallite size in nano-scale materials. Mater. Charact 2013, 85, 111–123. [Google Scholar] [CrossRef]
- Hesse, J.; Rübartsch, A. Model independent evaluation of overlapped Mossbauer spectra. Journal of Physics E 1974, 7, 526. [Google Scholar] [CrossRef]
- Box, G.E.P.; Lucas, H.L. Design of experiments in non-linear situations. Biometrika 1959, 46, 77. [Google Scholar] [CrossRef]
- Freitas, S.C.; Belo, J.H.; Granja, A.; Canhota, M.; Silva, A.S.; Reis, S.; Crespo, H.; Araújo, J.P.; Sousa, C.T. Key parameters in phototherapy with gold nanorods using continuous near infrared radiation. Adv. Mater. Interfaces 2023, 10, 2202214. [Google Scholar] [CrossRef]
- Devi, S.M.; Nivetha, A.; Prabha, I. Role of citric acid/glycine-reinforced nanometal oxide for the enhancement of physio-chemical specifications in catalytic properties. J Supercond Nov Magn 2020, 33, 3893. [Google Scholar] [CrossRef]
- Hernández, G.L.A. SN. Appl. Sci. 2020, 2, 1844. [Google Scholar]
- Samrot, A.V.; Justin, C.; Padmanaban, S.; Burman, U. A study on the effect of chemically synthesized magnetite nanoparticles on earthworm: Eudrilus eugeniae. Appl Nanosci 2017, 7, 17. [Google Scholar] [CrossRef]
- Zschiesche, L.; Janko, C.; Friedrich, B.; Frey, B.; Band, J.; Lyer, S.; Alexiou, C.; Unterweger, H. Biocompatibility of dextran-coated 30 nm and 80 nm sized spions towards monocytes, dendritic cells and lymphocytes. Nanomaterials, 2023, 13, 14. [Google Scholar] [CrossRef]
- Farhana, A.; Selvarani, A.J.; Samrot, A.V.; Alsrhani, A.; Raji, P.; Sahitya, C.S.; Cypriyana, P.J.J.; Senthikumar, P.; Ling, M.P.; Yishak, S. Utilization of superparamagnetic iron oxide nanoparticles (SPIONs) impregnated activated carbon for removal of hexavalent chromium. Journal of Nanomaterials 2022, 4326939. [Google Scholar] [CrossRef]
- Battisha, I.K.; Afify, H.H.; Ibrahim, M. Synthesis of Fe2O3 concentrations and sintering temperature on FTIR and magnetic susceptibility measured from 4 to 300 K of monolith silica gel prepared by sol–gel technique. J Magn Magn Mater 2006, 306, 211. [Google Scholar] [CrossRef]
- Singh, B.P.; Kumar, A.; Areizaga-Martinez, H.I.; Vega-Olivencia, C.A.; Tomar, M.S. Adsorption characteristics of magnetized biochar derived from Citrus limetta peels. Indian Journal of Pure & Applied Physics 2017, 55, 722. [Google Scholar]
- Ra’ad, Z.; Al-Karam, L.Q.; Abid Alsahib, N.K. Synthesis and Characterization of Dextran coated Iron Oxide Nanoparticles as a T1 Contrast Agent. J. Phys.: Conf. Ser. 2021, 2114, 012037. [Google Scholar] [CrossRef]
- Mahadevan, S.; Gnanaprakash, G.; Philip, J.; Rao, B.P.C.; Jayakumar, T. X-ray diffraction-based characterization of magnetite nanoparticles in presence of goethite and correlation with magnetic properties. Phys. E Low-Dimens. Syst. Nanostructures 2007, 39, 20. [Google Scholar] [CrossRef]
- Guo, Y.; Zhao, X.; Zhao, J.; Fu, W.; Ding, X.; Jiang, Y.; Yu, K.; Lv, X.; Wang, Z. Controlling the particle size of nanocrystalline titania via a thermal dissociation of substrates with ammonium chloride. Mater. Lett. 2006, 60, 494. [Google Scholar]
- Dorsey, J.F.; Sun, L.; Joh, D.Y.; Witztum, A.; Al Zaki, A.; Kao, G.D.; Alonso-Basanta, M.; Avery, S.; Tsourkas, A.; Hahn, S.M. Gold nanoparticles in radiation research: potential applications for imaging and radiosensitization. Transl Cancer Res 2013, 2, 280. [Google Scholar]
- Ferreira, L.F.P.; Oliveira, T.M.; Toma, S.H.; Toyama, M.M.; Araki, K.; Avanzi, L.H. Superparamagnetic iron oxide nanoparticles (SPIONs) conjugated with lipase Candida antarctica A for biodiesel synthesis. RSC Adv. 2020, 10, 38490. [Google Scholar] [CrossRef]
- Bhattacharya, D.; Sahu, S.K.; Banerjee, I.; Das, M.; Mishra, D.; Maiti, T.K.; Pramanik, P. Synthesis, characterization, and in vitro biological evaluation of highly stable diversely functionalized superparamagnetic iron oxide nanoparticles. J. Nanopart. Res. 2011, 13, 4173. [Google Scholar] [CrossRef]
- Rajendran, S.; Wanale, S.G.; Gacem, A.; Yadav, V.K.; Ahmed, I.A.; Algethami, J.S.; Kakodiya, S.D.; Modi, T.; Alsuhaibani, A.M.; Yadav, K.K.; Cavalu, S. Nanostructured iron oxides: structural, optical, magnetic, and adsorption characteristics for cleaning industrial effluents. Crystals 2023, 13, 472. [Google Scholar] [CrossRef]
- Kolen’ko, Y.V.; Bañobre-López, M.; Rodríguez-Abreu, C.; Carbó-Argibay, E.; Sailsman, A.; Piñeiro-Redondo, Y.; Cerqueira, M.F.; Petrovykh, D.Y.; Kovnir, K.; Lebedev, O.I.; Rivas, J. Large-Scale Synthesis of Colloidal Fe3O4 Nanoparticles Exhibiting High Heating Efficiency in Magnetic Hyperthermia. The Journal of Physical Chemistry C 2014, 118, 8691. [Google Scholar] [CrossRef]
- Ngo, T.H.; Tran, D.L.; Do, H.M.; Tran, V.H.; Le, V.H.; Nguyen, X.P. Facile and solvent-free routes for the synthesis of size-controllable Fe 3 O 4 nanoparticles. Adv. Nat. Sci: Nanosci. Nanotechnol. 2010, 1, 035001. [Google Scholar] [CrossRef]
- Yousuf, S.; Enoch, I.V.M.V.; Selvakumar, P.M.; Premnath, D. Loading of chromenones on superparamagnetic iron oxide-modified dextran core–shell nanoparticles: Openness to bind to β-cyclodextrin and DNA. New J. Chem. 2015, 39, 7879. [Google Scholar] [CrossRef]
- Khalkhali, M.; Rostamizadeh, K.; Sadighian, S.S.; Khoeini, F.; Naghibi, M.; Hamidi, M. The impact of polymer coatings on magnetite nanoparticles performance as MRI contrast agents: a comparative study. DARU J Pharm Sci 2015, 23, 45. [Google Scholar] [CrossRef] [PubMed]
- Bakhtari, A.; Nazari, S.; Alaee, S.; Kargar-Abarghouei, E.; Mesbah, F.; Mirzaei, E.; Molaei, M.J. Toxic Effects of Dextran-Coated Superparamagnetic Iron Oxide Nanoparticles on Mouse Embryo Development, Genes Expression of Antioxidant Enzymes and Apoptosis, and Ultrastructure of Sperm, Oocytes and Granulosa Cells. Int J Fertil Steril 2020, 14, 161. [Google Scholar] [PubMed]
- Unterweger, H.; Dézsi, L.; Matuszak, J.C.; Poettler, M.; Jordan, J.; Bäuerle, T.; Szebeni, J.; Fey, T.; Boccaccini, A.R.; Alexiou, C.; Cicha, I. Dextran-coated superparamagnetic iron oxide nanoparticles for magnetic resonance imaging: Evaluation of size-dependent imaging properties, storage stability and safety. Int J Nanomedicine 2018, 13, 1899. [Google Scholar] [CrossRef] [PubMed]
- Nurdin, I.; Johan, M.R.; Yaacob, I.I.; Ang, B.C. Effect of nitric acid concentrations on synthesis and stability of maghemite nanoparticles suspension. Sci. World J. 2014, 589479. [Google Scholar] [CrossRef] [PubMed]
- Chen, B.-W.; Hatamie, S.; Garu, P.; Heravi, P.; Chen, J.-Y.; Liu, B.-T.; Wei, Z.-H.; Yao, D.-J. Synthesis of iron-oxide magnetic nanoparticles coated with dextran of varied molecular mass using a facile ball-milling method. Micro & Nano Letters 2020, 15, 645. [Google Scholar]
- Osborne, E.A.; Atkins, T.M.; Gilbert, D.A.; Kauzlarich, S.M.; Liu, K.; Louie, A.Y. Rapid microwave-assisted synthesis of dextran-coated iron oxide nanoparticles for magnetic resonance imaging. Nanotechnology 2012, 23, 215602. [Google Scholar] [CrossRef] [PubMed]
- Maleki, H.; Simchi, A.; Imani, M.; Costa, B.F.O. Size-controlled synthesis of superparamagnetic iron oxide nanoparticles and their surface coating by gold for biomedical applications. Journal of Magnetism and Magnetic Materials 2012, 324, 3997. [Google Scholar] [CrossRef]
- Maguire, C.M.; Rösslein, M.; Wick, P.; Prina-Mello, A. Characterisation of particles in solution–a perspective on light scattering and comparative technologies. Science and Technology of Advanced Materials 2018, 19, 732. [Google Scholar] [CrossRef] [PubMed]
- Manescu, V.; Paltanea, G.; Antoniac, I.; Vasilescu, M. Magnetic nanoparticles used in oncology. Materials 2021, 14, 5948. [Google Scholar] [CrossRef] [PubMed]
- Lee, N.; Hyeon, T. Designed synthesis of uniformly sized iron oxide nanoparticles for efficient magnetic resonance imaging contrast agents. Chem. Soc. Rev. 2012, 41, 2575. [Google Scholar] [CrossRef]
- Samrot, A.V.; Sahithya, C.S.; Selvarani, A.J.; Pachiyappan, S.; Kumar, S.S. Surface-engineered super-paramagnetic iron oxide nanoparticles for chromium removal. Int. J. Nanomedicine 2019, 14, 8105. [Google Scholar] [CrossRef]
- Mørup, S. Mössbauer Effect Studies of Microcrystalline Materials. In Mössbauer Spectroscopy Applied to Inorganic Chemistry; Long, G.J., Ed.; Plenum Press: New York, USA; London, UK, 1987; Volume 2, pp. 89–124. [Google Scholar]
- Murad, E. Clays and clay minerals: What can Mössbauer spectroscopy do to help understand them? Hyperfine Interact. 1998, 117, 39. [Google Scholar] [CrossRef]
- Roca, A.G.; Marco, J.F.; Morales, M.D.P.; Serna, C.J. Uniform, and water stable magnetite nanoparticles with diameters around the monodomain–multidomain limit. J. Phys. Chem. C 2007, 111, 18577. [Google Scholar] [CrossRef]
- Predoi, D.; Kuncser, V.; Tronc, E.; Nogues, M.; Russo, U.; Principi, G.; Filoti, G. Magnetic relaxation phenomena and inter-particle interactions in nanosized γ-Fe2O3 systems. J. Phys. Condens. Matter 2003, 15, 1797. [Google Scholar] [CrossRef]
- Vandenberghe, R.E.; Barrero, C.A.; Da Costa, G.M.; Van San, E.; De Grave, E. Mössbauer characterization of iron oxides and (oxy) hydroxides: the present state of the art. Hyperfine Interact. 2000, 126, 247. [Google Scholar] [CrossRef]
- Singh, M.; Ulbrich, P.; Prokopec, V.; Svoboda, P.; Šantavá, E.; Štěpánek, F. Vapour phase approach for iron oxide nanoparticle synthesis from solid precursors. J. Solid State Chem. 2013, 200, 150. [Google Scholar] [CrossRef]
- Liu, N.N.; Pyatakov, A.P.; Saletsky, A.M.; Zharkov, M.N.; Pyataev, N.A.; Sukhorukov, G.B.; Gun’ko, Y.K.; Tishin, A.M. The “field or frequency” dilemma in magnetic hyperthermia: The case of ZnMn ferrite nanoparticles. Journal of Magnetism and Magnetic Materials 2022, 555, 169379. [Google Scholar] [CrossRef]
- Deatsch, A.E.; Evans, B.A. Heating efficiency in magnetic nanoparticle hyperthermia. Journal of Magnetism and Magnetic Materials 2014, 354, 163. [Google Scholar] [CrossRef]
- Cabrera, D.; Yoshida, T.; Rincón-Domínguez, T.; Cuñado, J.L.F.; Salas, G.; Bollero, A.; Puerto-Morales, M.; Camarero, J.; Teran, F.J. Superparamagnetic-blocked state transition under alternating magnetic fields: towards determining the magnetic anisotropy in magnetic suspensions. Nanoscale 2022, 14, 8789. [Google Scholar] [CrossRef]
- Blasiak, B.; van Veggel, F.C.J.M.; Tomanek, B. Applications of nanoparticles for MRI cancer diagnosis and therapy. Journal of Nanomaterials 2013, 148578. [Google Scholar] [CrossRef]
- Zhou, Z.; Yang, L.; Gao, J.; Chen, X. Structure–relaxivity relationships of magnetic nanoparticles for magnetic resonance imaging. Adv. Mater. 2019, 31, 1804567. [Google Scholar] [CrossRef]
- Xiang, Y.; Wang, J.; Hussain, S.M.; Krestin, G.P. Superparamagnetic iron oxide contrast agents: physicochemical characteristics and applications in MR imaging. Eur Radiol 2001, 11, 2319. [Google Scholar]
- Na, H.B.; Song, I.C.; Hyeon, T. Inorganic nanoparticles for MRI contrast agents. Adv. Mater. 2009, 21, 2133. [Google Scholar] [CrossRef]
- Bae, K.H.; Kim, Y.B.; Lee, Y.; Hwang, J.Y.; Park, H.W.; Park, T.G. Bioinspired Synthesis and Characterization of Gadolinium-Labeled Magnetite Nanoparticles for Dual Contrast T1- and T2-Weighted Magnetic Resonance Imaging. Bioconj. Chem. 2010, 21, 505. [Google Scholar] [CrossRef]
- Thapa, B.; Diaz-Diestra, D.; Beltran-Huarac, J.; Weiner, B.R.; Morell, G. Enhanced MRI T 2 Relaxivity in Contrast-Probed Anchor-Free PEGylated Iron Oxide Nanoparticles. Nanoscale Res. Lett. 2017, 12, 312. [Google Scholar]
- Wahsner, J.; Gale, E.M.; Rodríguez-Rodríguez, A.; Caravan, P. Chemistry of MRI contrast agents: current challenges and new frontiers. Chem. Rev. 2019, 119, 957. [Google Scholar] [CrossRef]
- Tóth, E.; Helm, L.; Merbach, A. Relaxivity of gadolinium (III) complexes: theory and mechanism. In The Chemistry of Contrast Agents in Medical Magnetic Resonance Imaging; André Merbach, Lothar Helm, Éva Tóth Eds; John Wiley & Sons, 2013; Chapter 2; pp. 25–81. [Google Scholar]
- Holbrook, R.J.; Rammohan, N.; Rotz, M.W.; MacRenaris, K.W.; Preslar, A.T.; Meade, T.J. Gd(III)-Dithiolane Gold Nanoparticles for T1-Weighted Magnetic Resonance Imaging of the Pancreas. Nano Lett. 2016, 16, 3202. [Google Scholar] [CrossRef] [PubMed]
- Cheng, K.; Yang, M.; Zhang, R.; Qin, C.; Su, X.; Chen, Z. Hybrid Nanotrimers for Dual T1 and T2-Weighted Magnetic Resonance Imaging. ACSNano 2014, 8, 9884. [Google Scholar] [CrossRef]
- Zhang, W.; Peters, J.A.; Mayer, F.; Helm, L.; Djanashvili, K. Prototropic Exchange Governs T1 and T2 Relaxivities of a Potential MRI Contrast Agent Nanozeolite Gd−LTL with a High pH Responsiveness. J. Phys. Chem. C 2015, 119, 5080. [Google Scholar] [CrossRef]
- Zhang, W.; Liu, L.; Chen, H.; Hu, K.; Delahunty, I.; Gao, S.; J. Xie. Surface impact on nanoparticle-based magnetic resonance imaging contrast agents. Theranostics 2018, 8, 2521. [Google Scholar] [CrossRef]
Figure 1.
UV-Vis spectra of “pH” samples, 5 to 8.
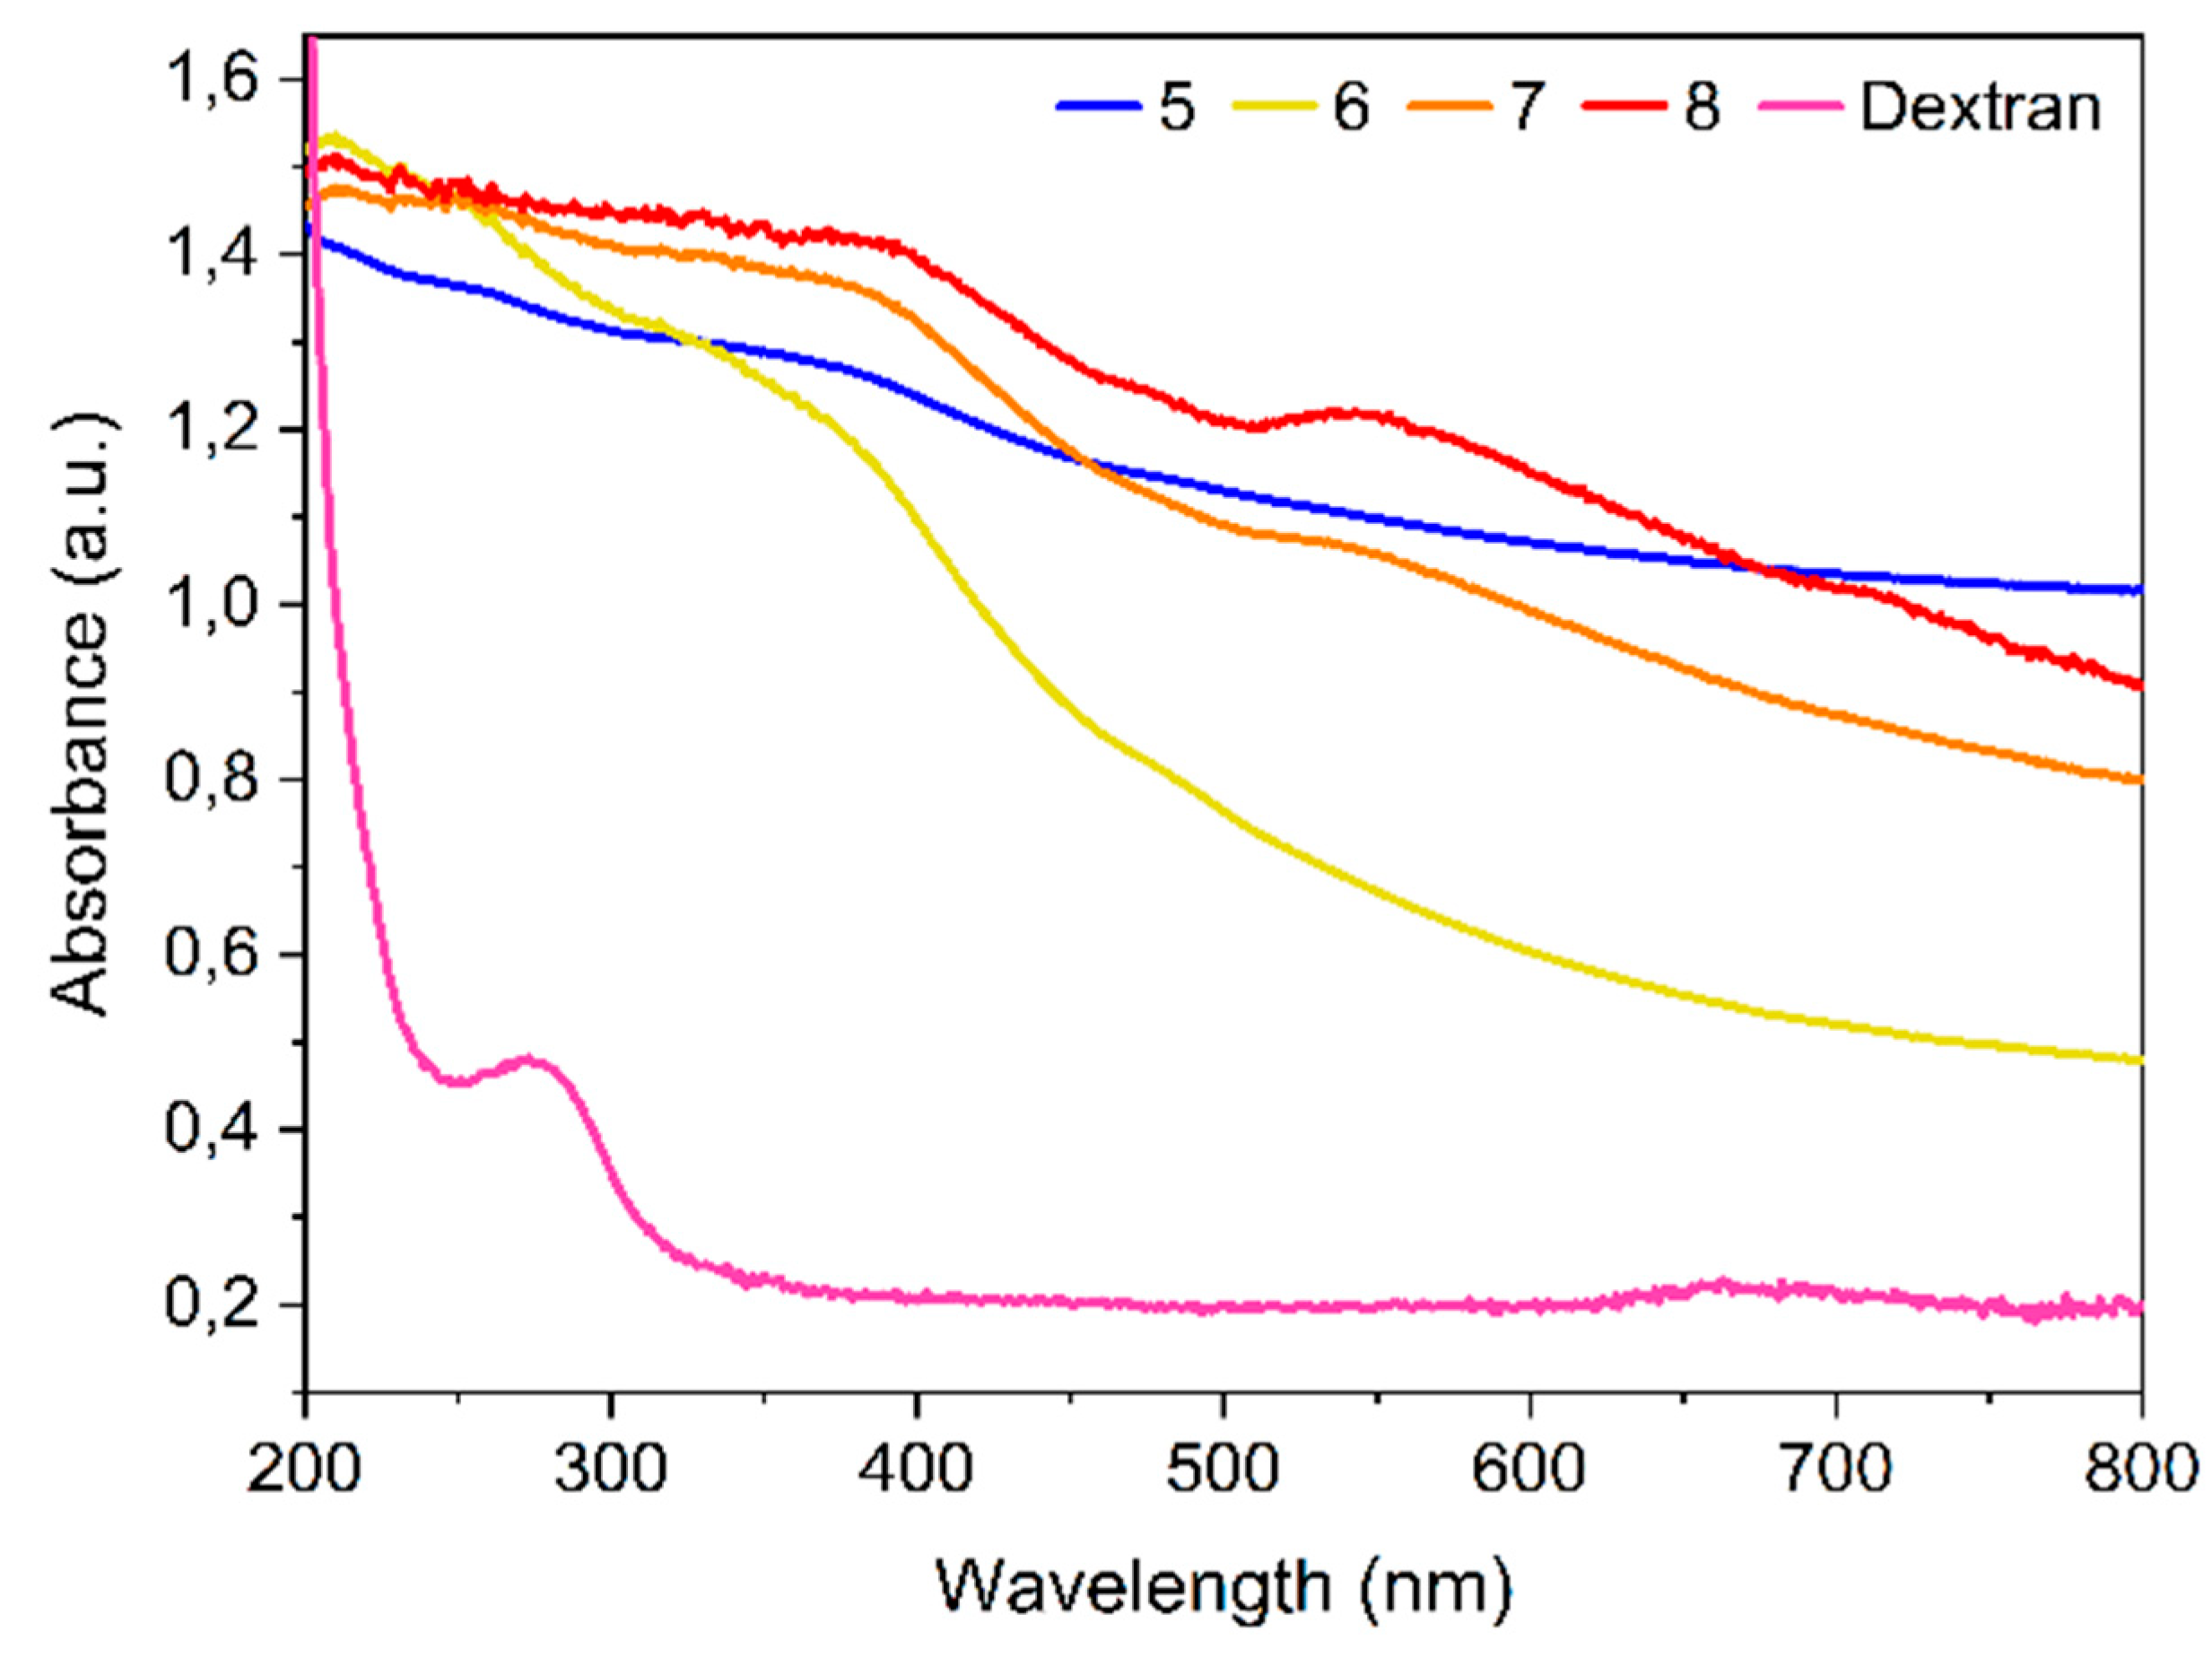
Figure 2.
ATR-FTIR spectra of SPpH samples.
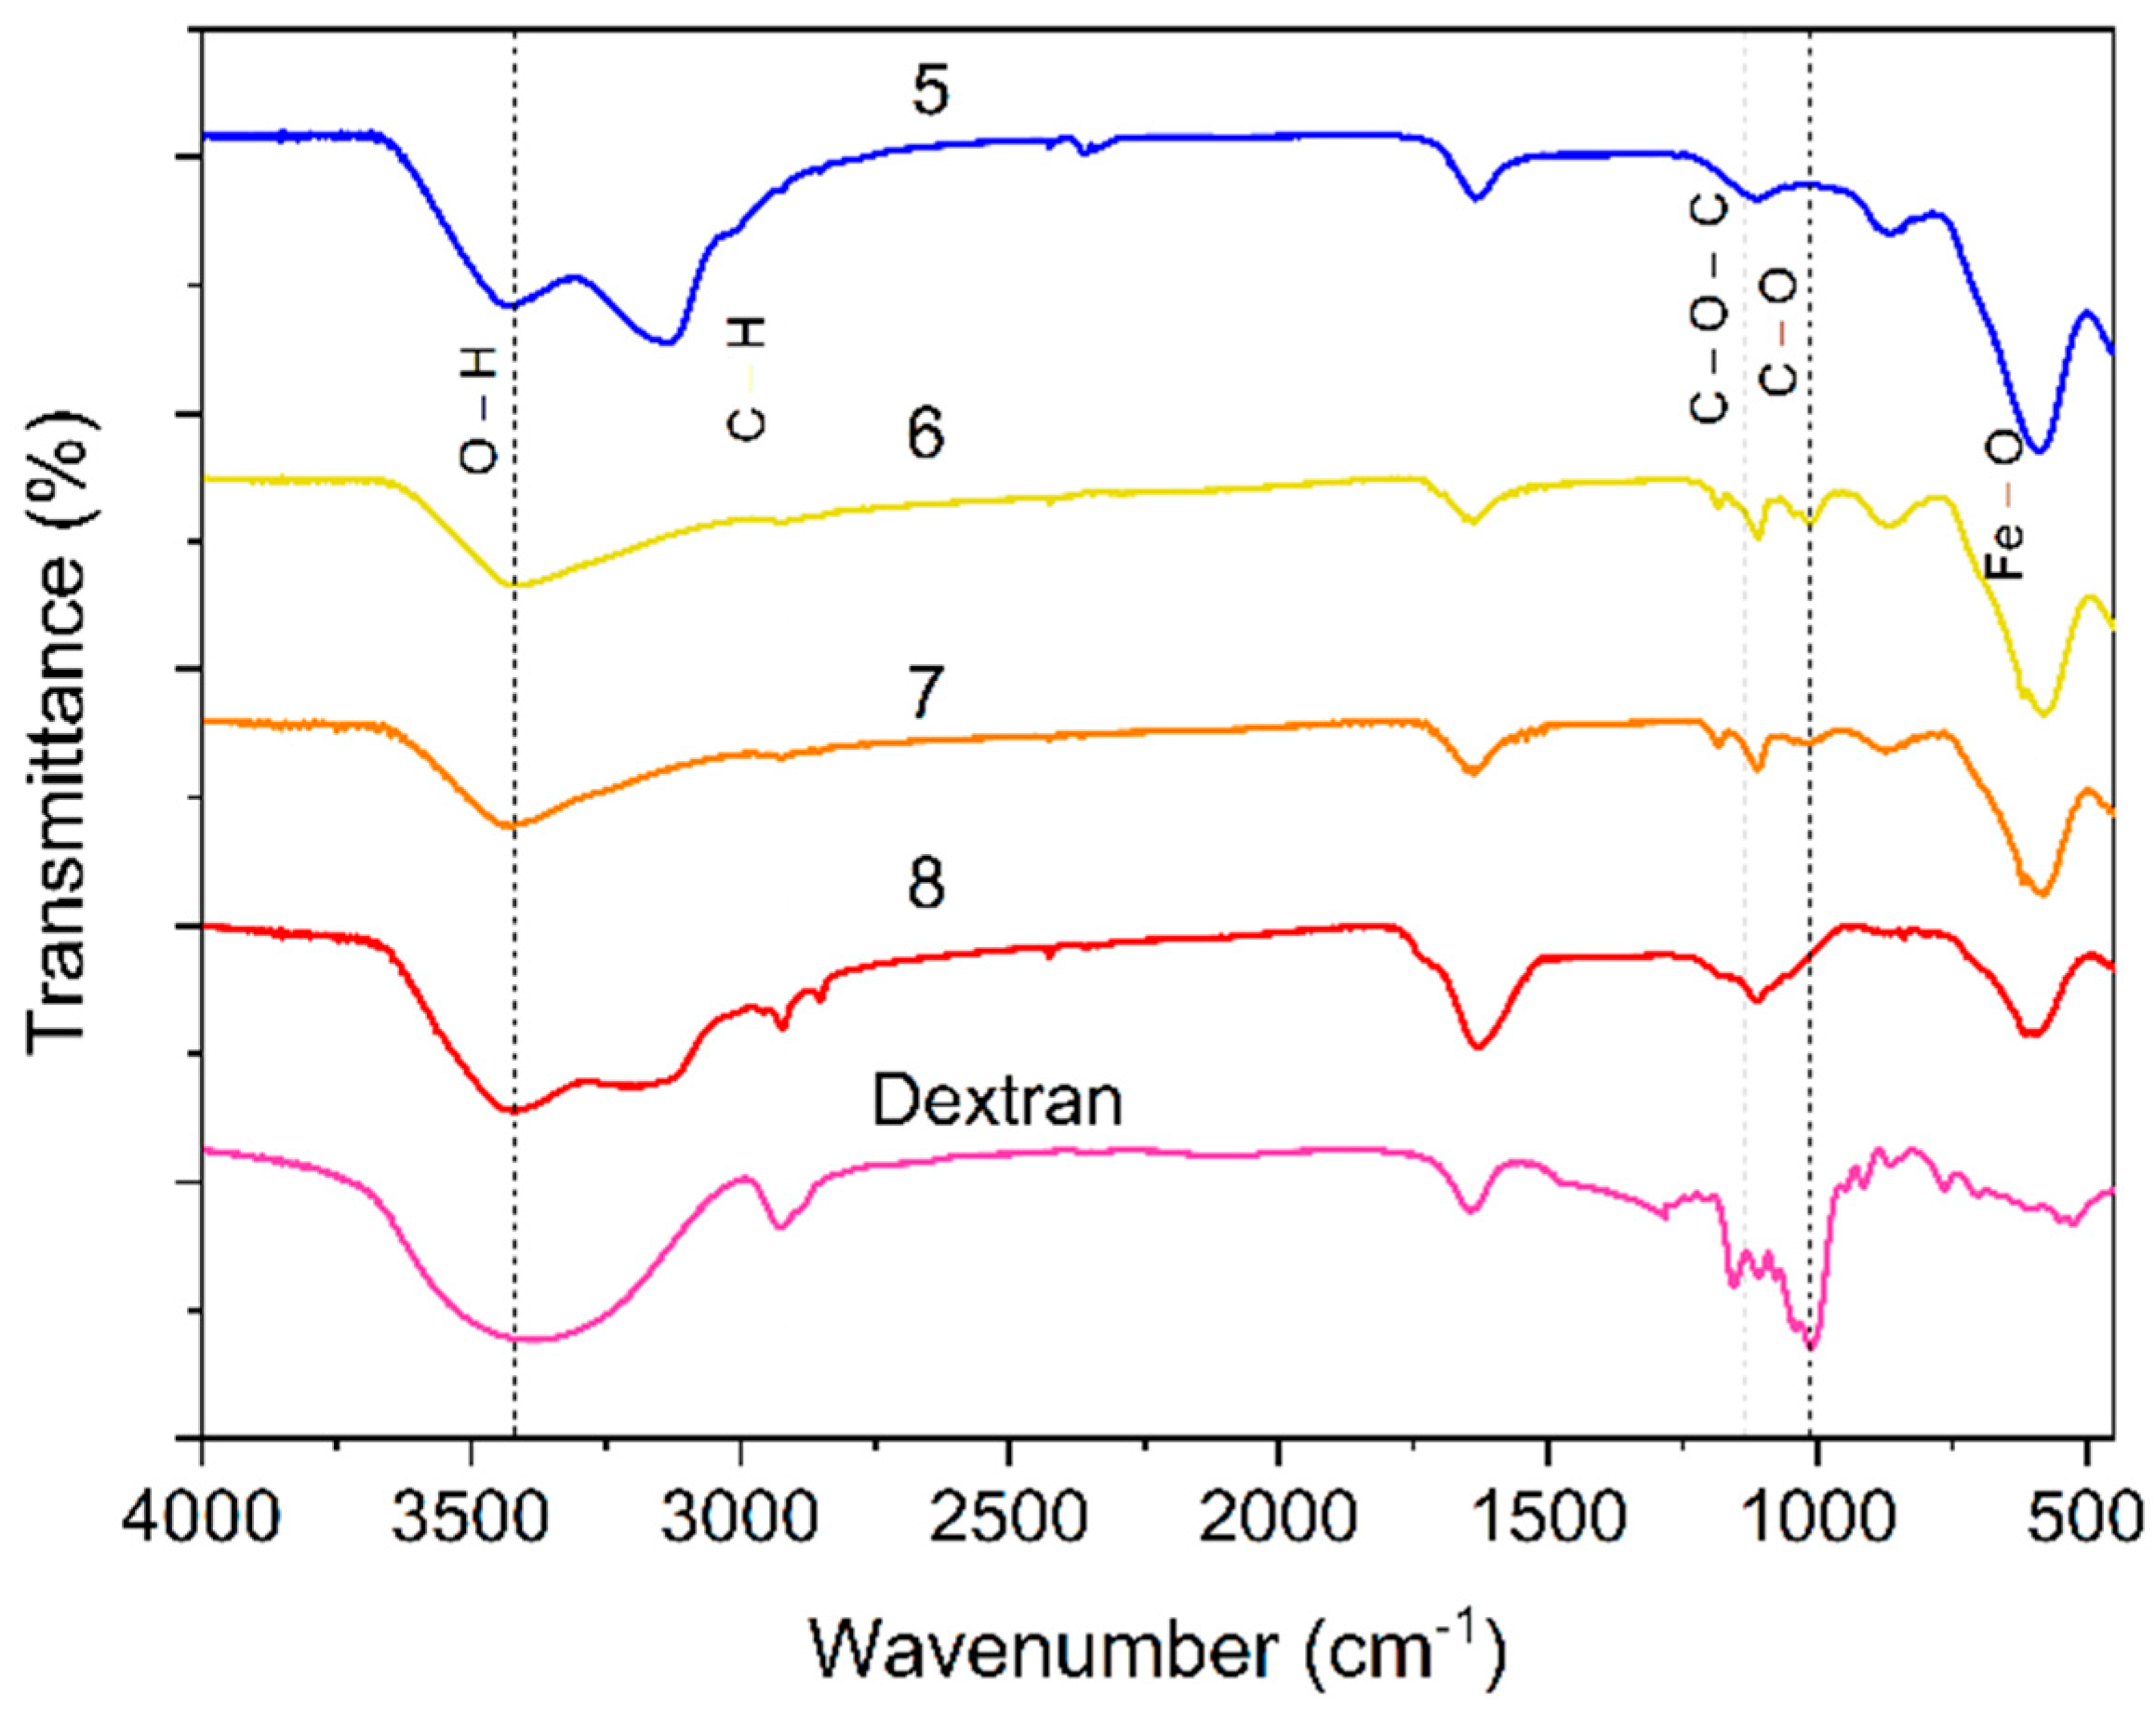
Figure 3.
Powder XRD diffractograms of samples (a) SPR/P, 1, and (b) SPpH, 5.
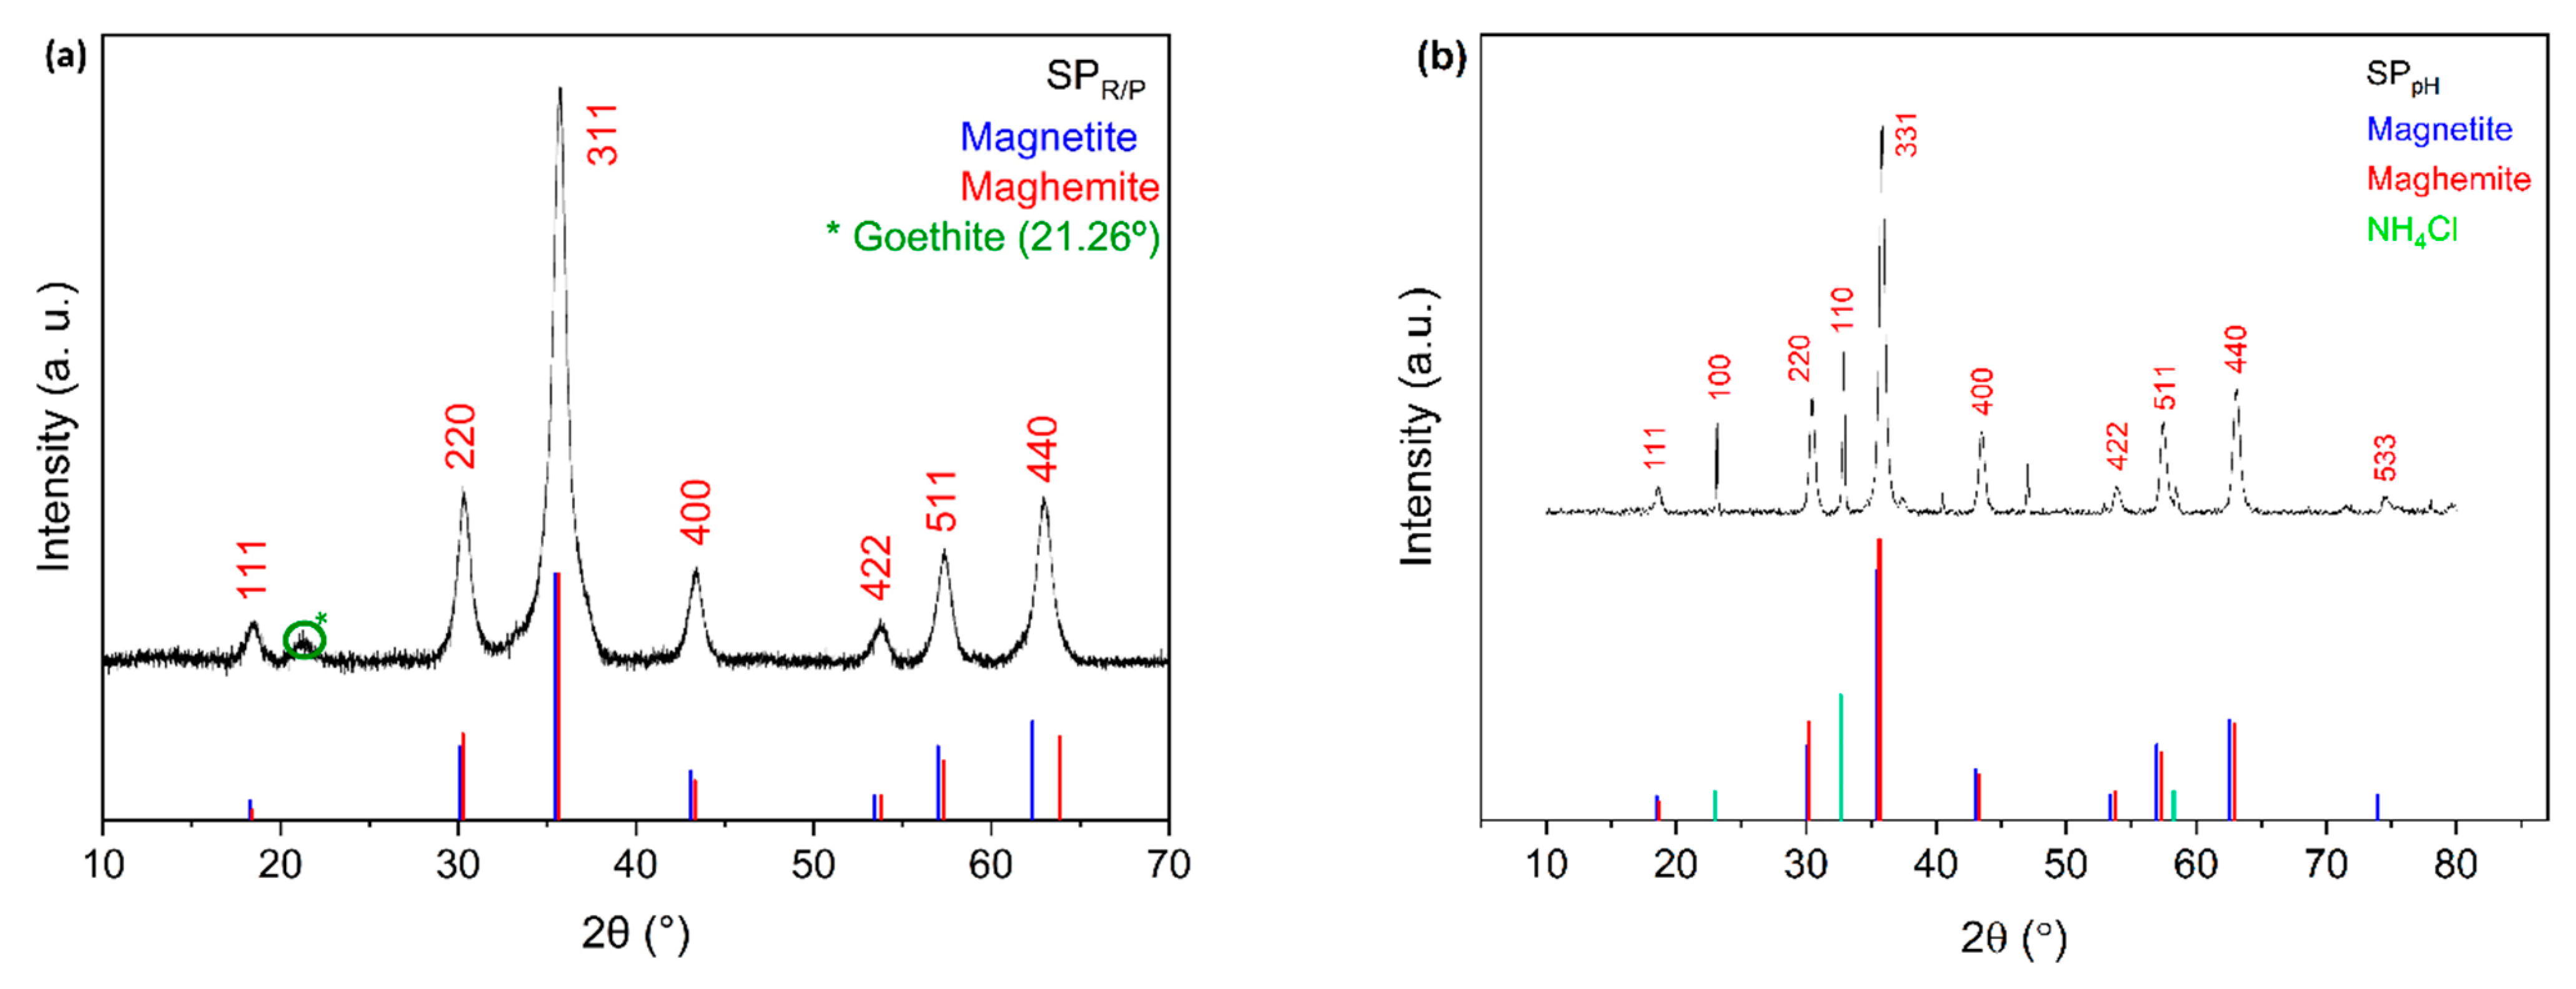
Figure 4.
Powder XRD diffractograms of samples (a) SPR/P-Dx-Au-Gd, 4, and SPpH-Dx-Au-Gd, 8.
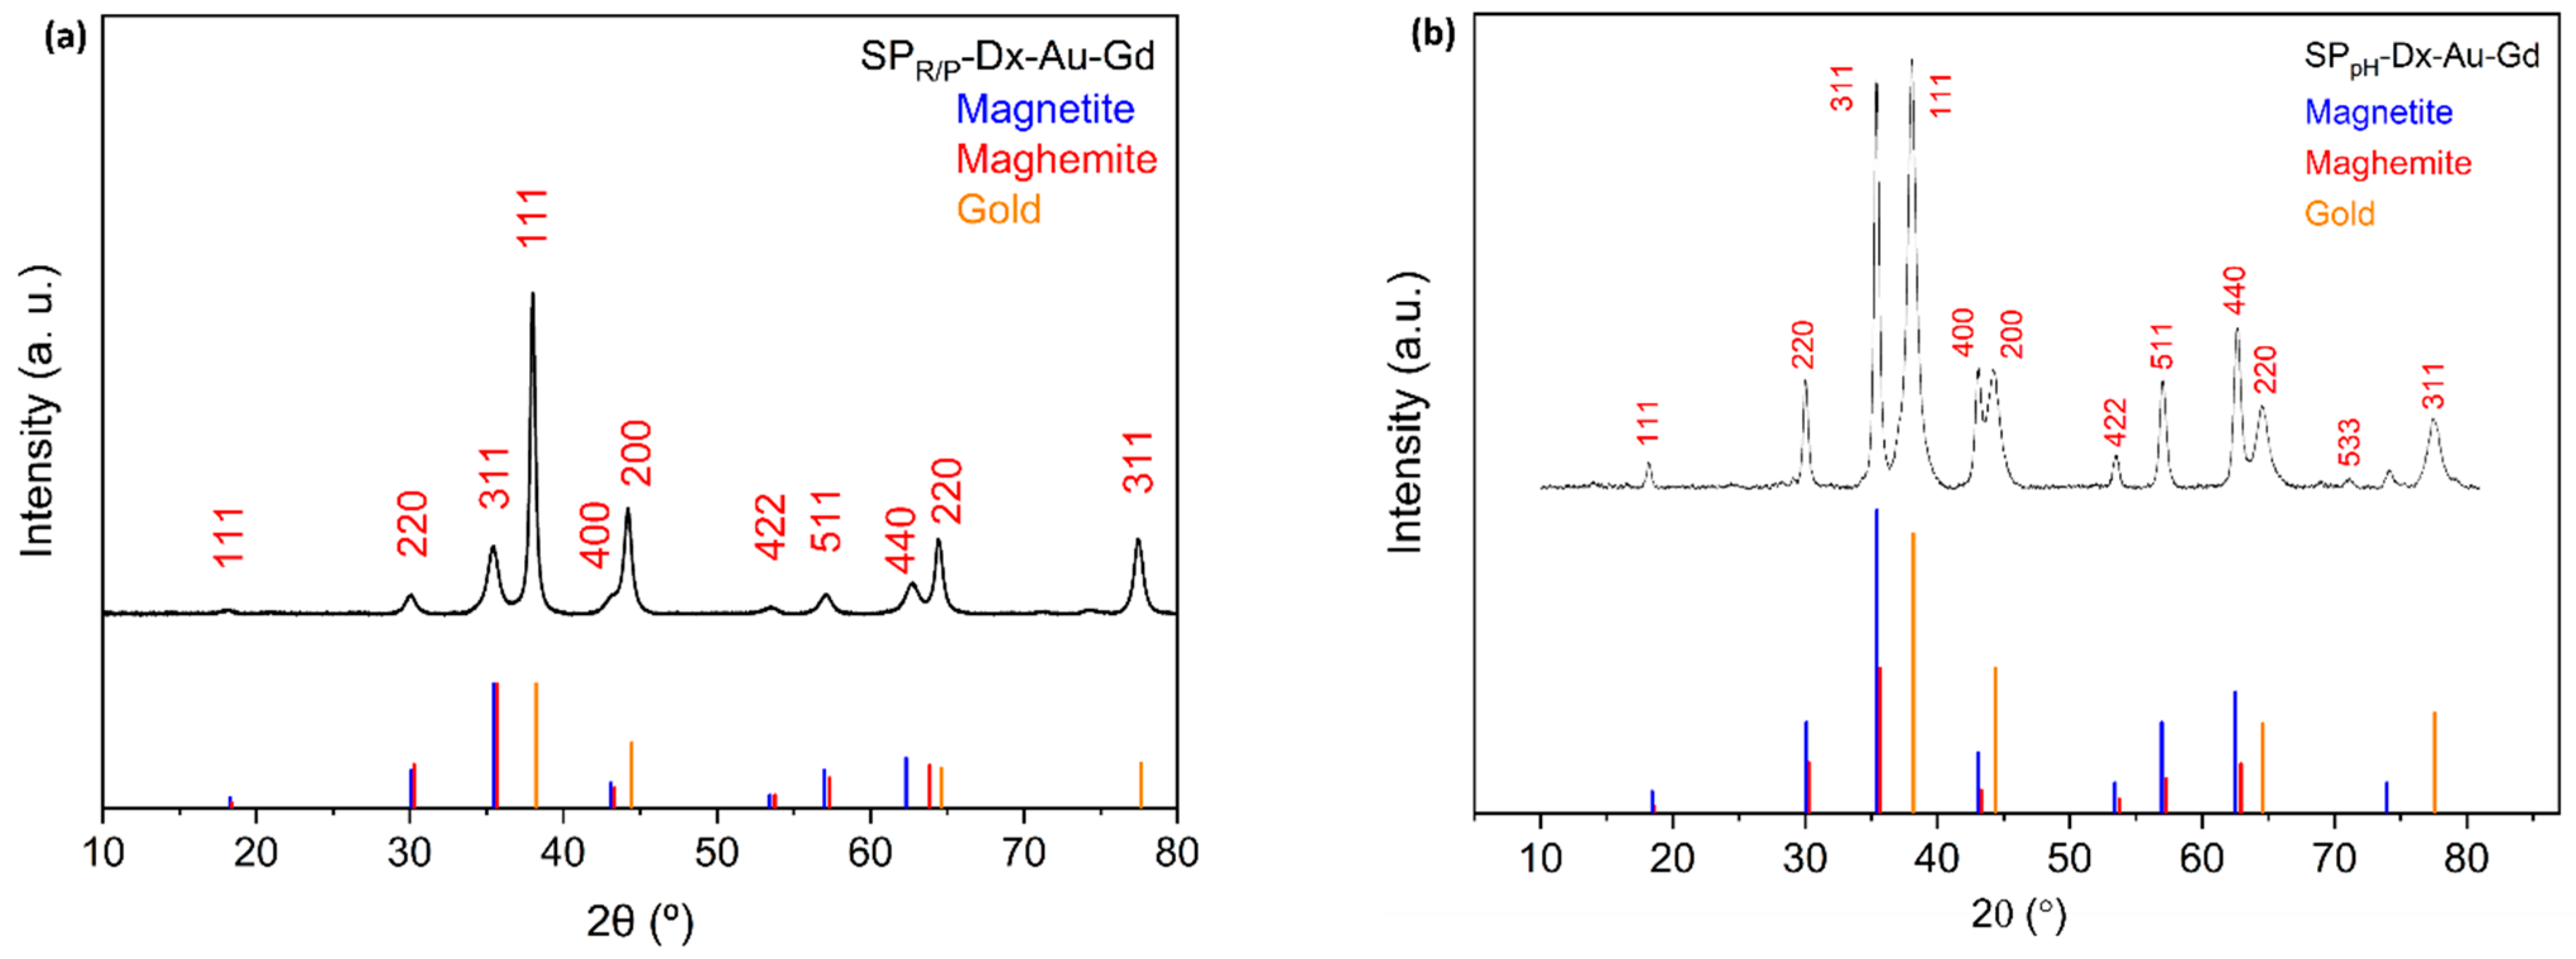
Figure 5.
Transmission electron microscopy images of the SPIONs and respective size histogram: a) SPR/P; b) SPpH; c) SPR/P-Dx-Au-Gd; d) SPpH-Dx-Au-Gd.
Figure 5.
Transmission electron microscopy images of the SPIONs and respective size histogram: a) SPR/P; b) SPpH; c) SPR/P-Dx-Au-Gd; d) SPpH-Dx-Au-Gd.
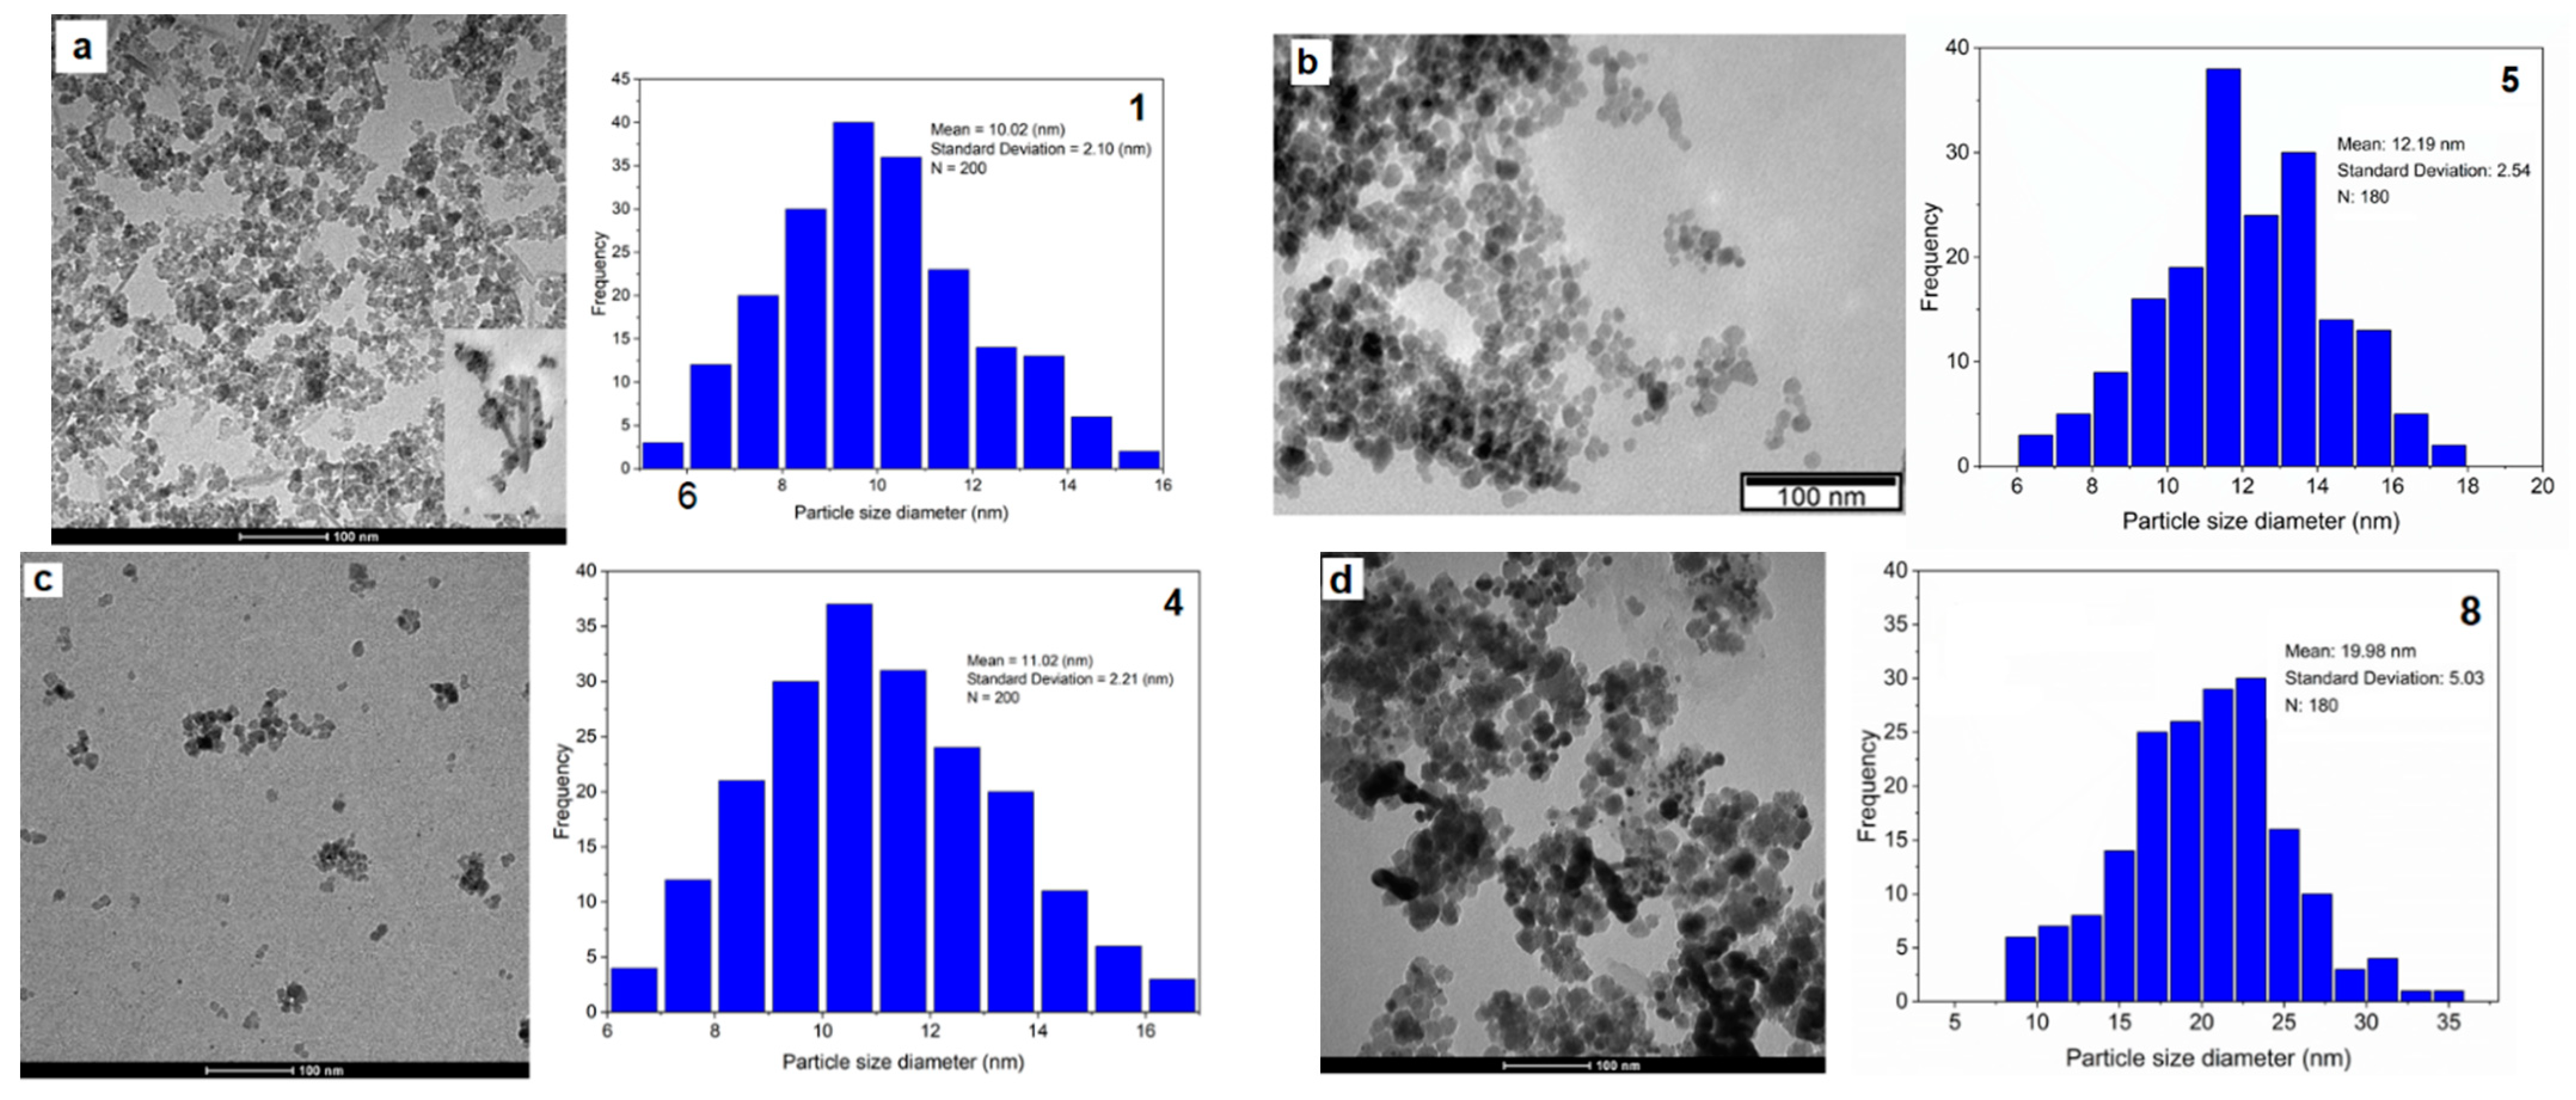
Figure 6.
Mössbauer spectra of SPpH sample taken at 295 K and 4 K. Calculated lines on the experimental points are the sum of three sextets shown slightly shifted for clarity (Table S3).
Figure 6.
Mössbauer spectra of SPpH sample taken at 295 K and 4 K. Calculated lines on the experimental points are the sum of three sextets shown slightly shifted for clarity (Table S3).
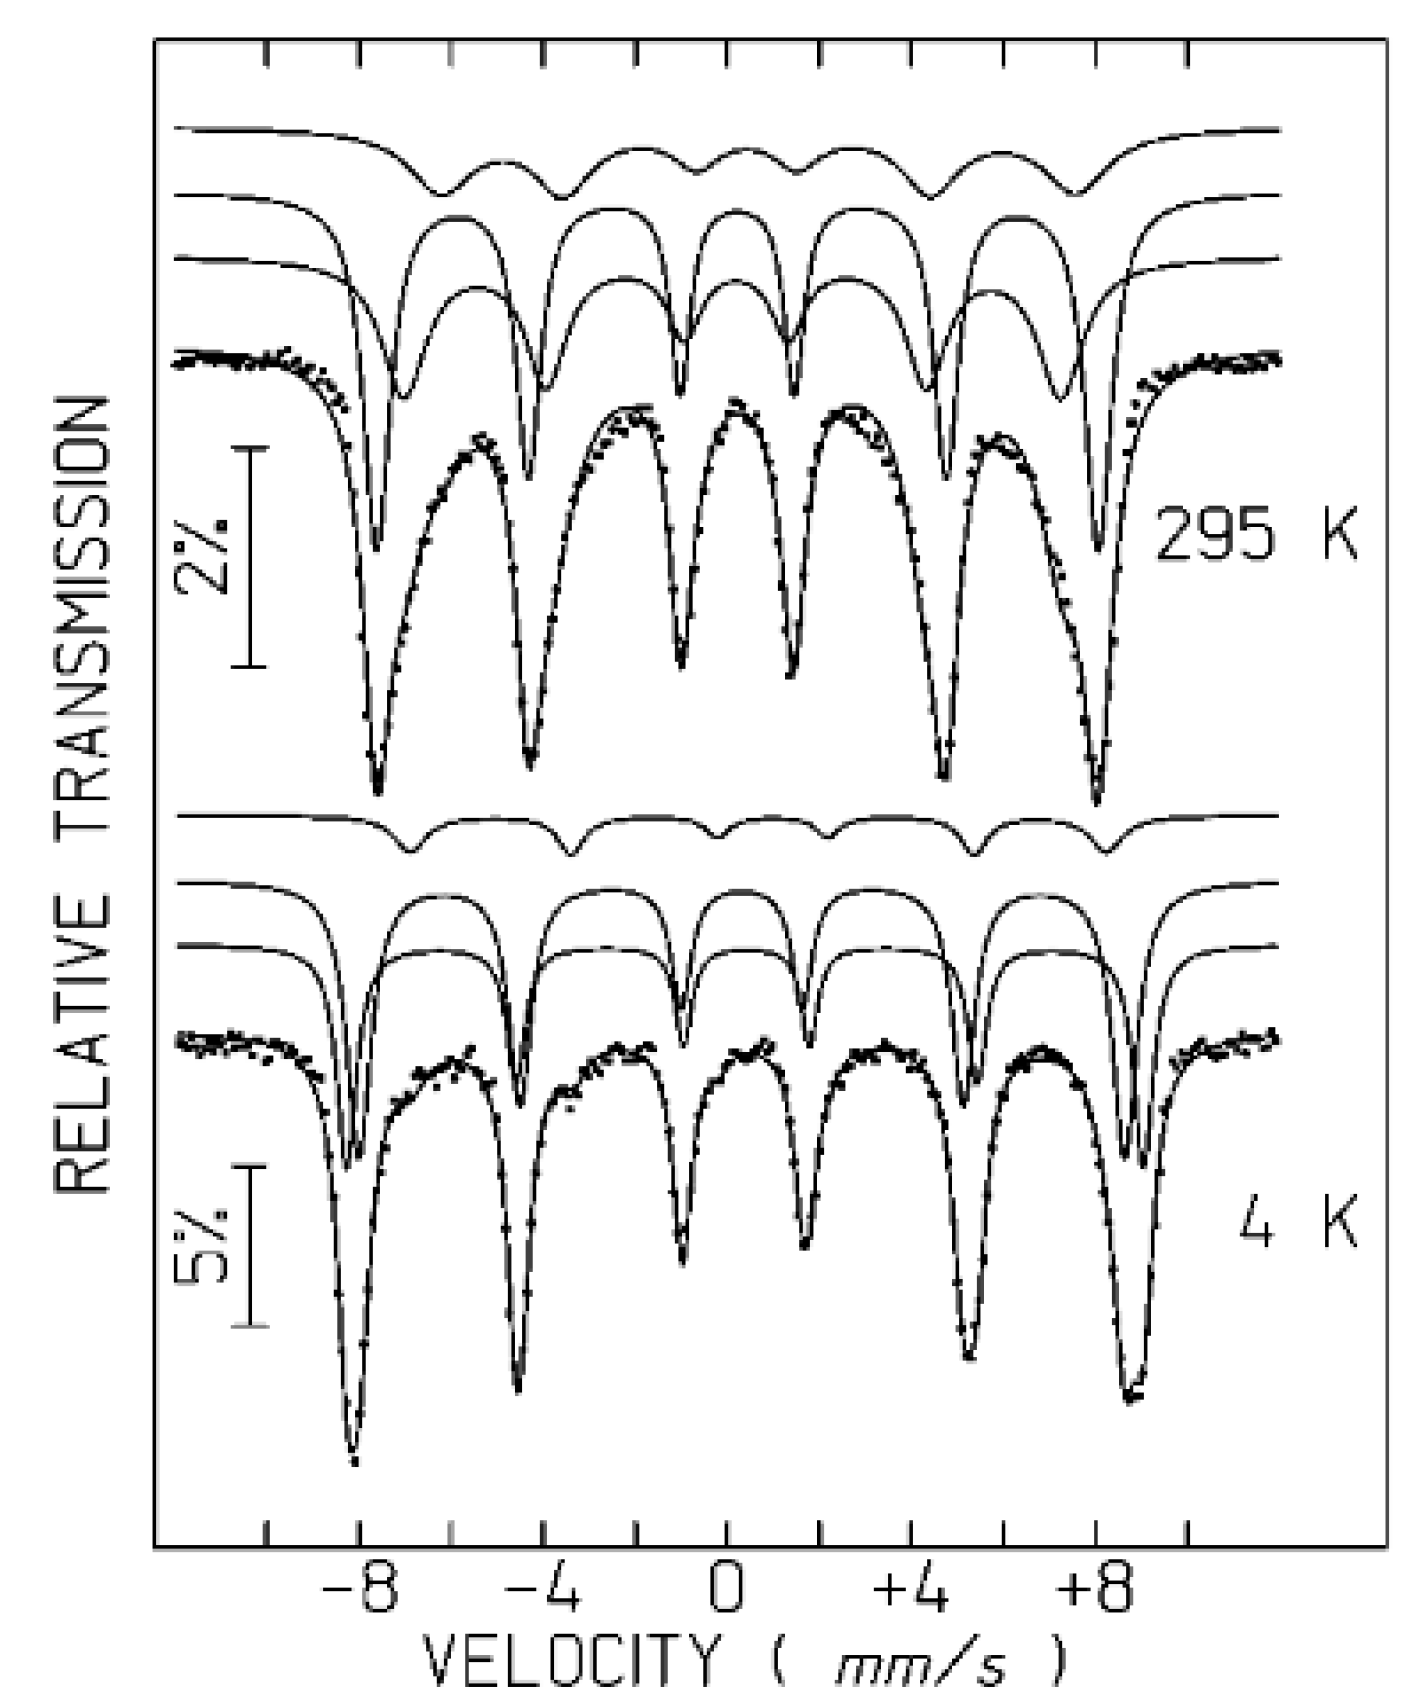
Figure 7.
Temperature dependence of the zero-field cooling (ZFC) and field cooling (FC) magnetization for samples SPR/P, 1, and SPpH, 5, at 10mT.
Figure 7.
Temperature dependence of the zero-field cooling (ZFC) and field cooling (FC) magnetization for samples SPR/P, 1, and SPpH, 5, at 10mT.
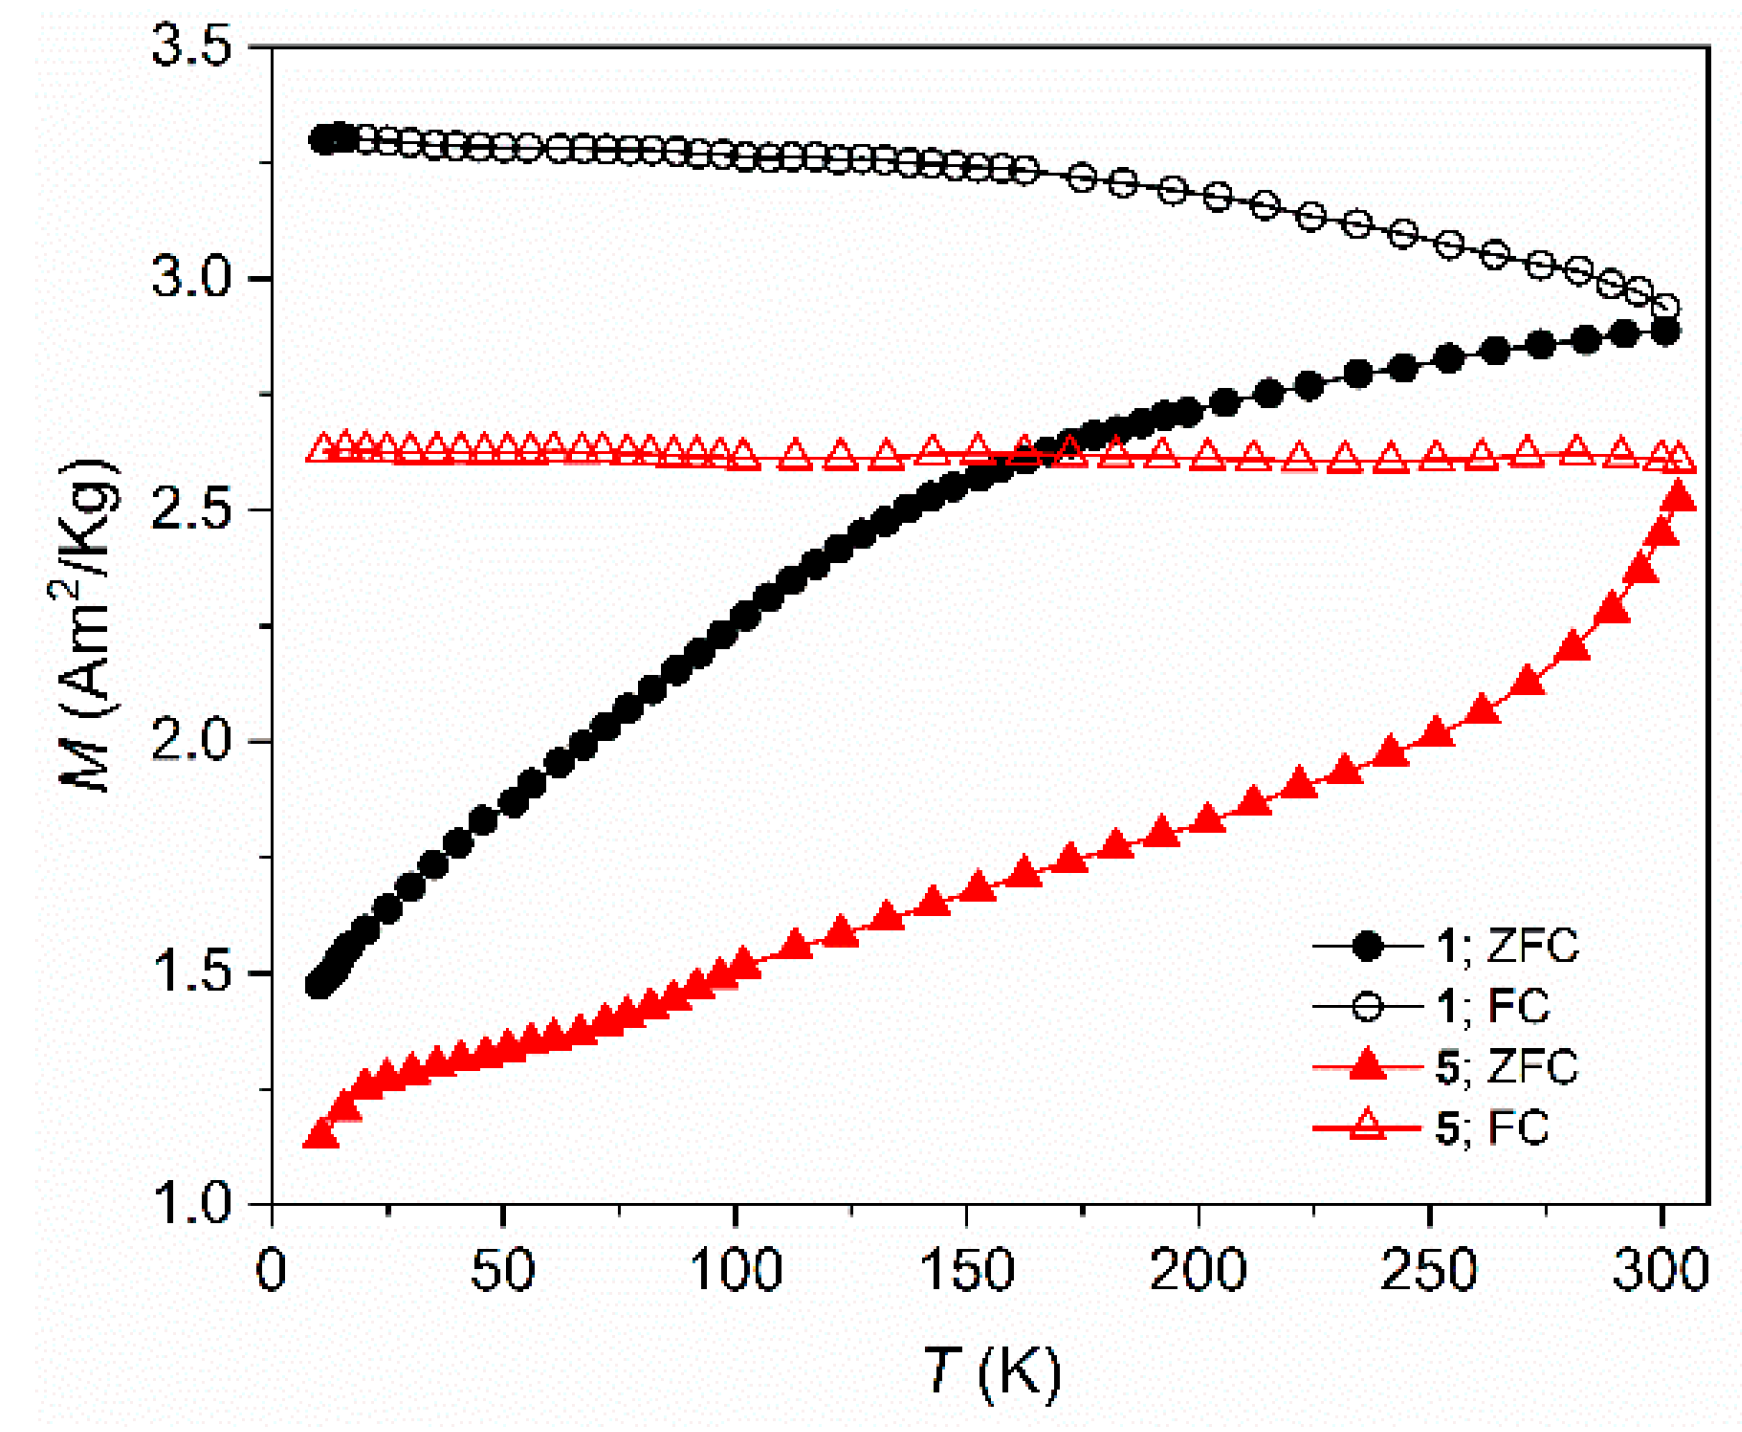
Figure 8.
Magnetic field (B) dependence of magnetization (M) at for “R/P”samples 1 to 4 at 300 K.
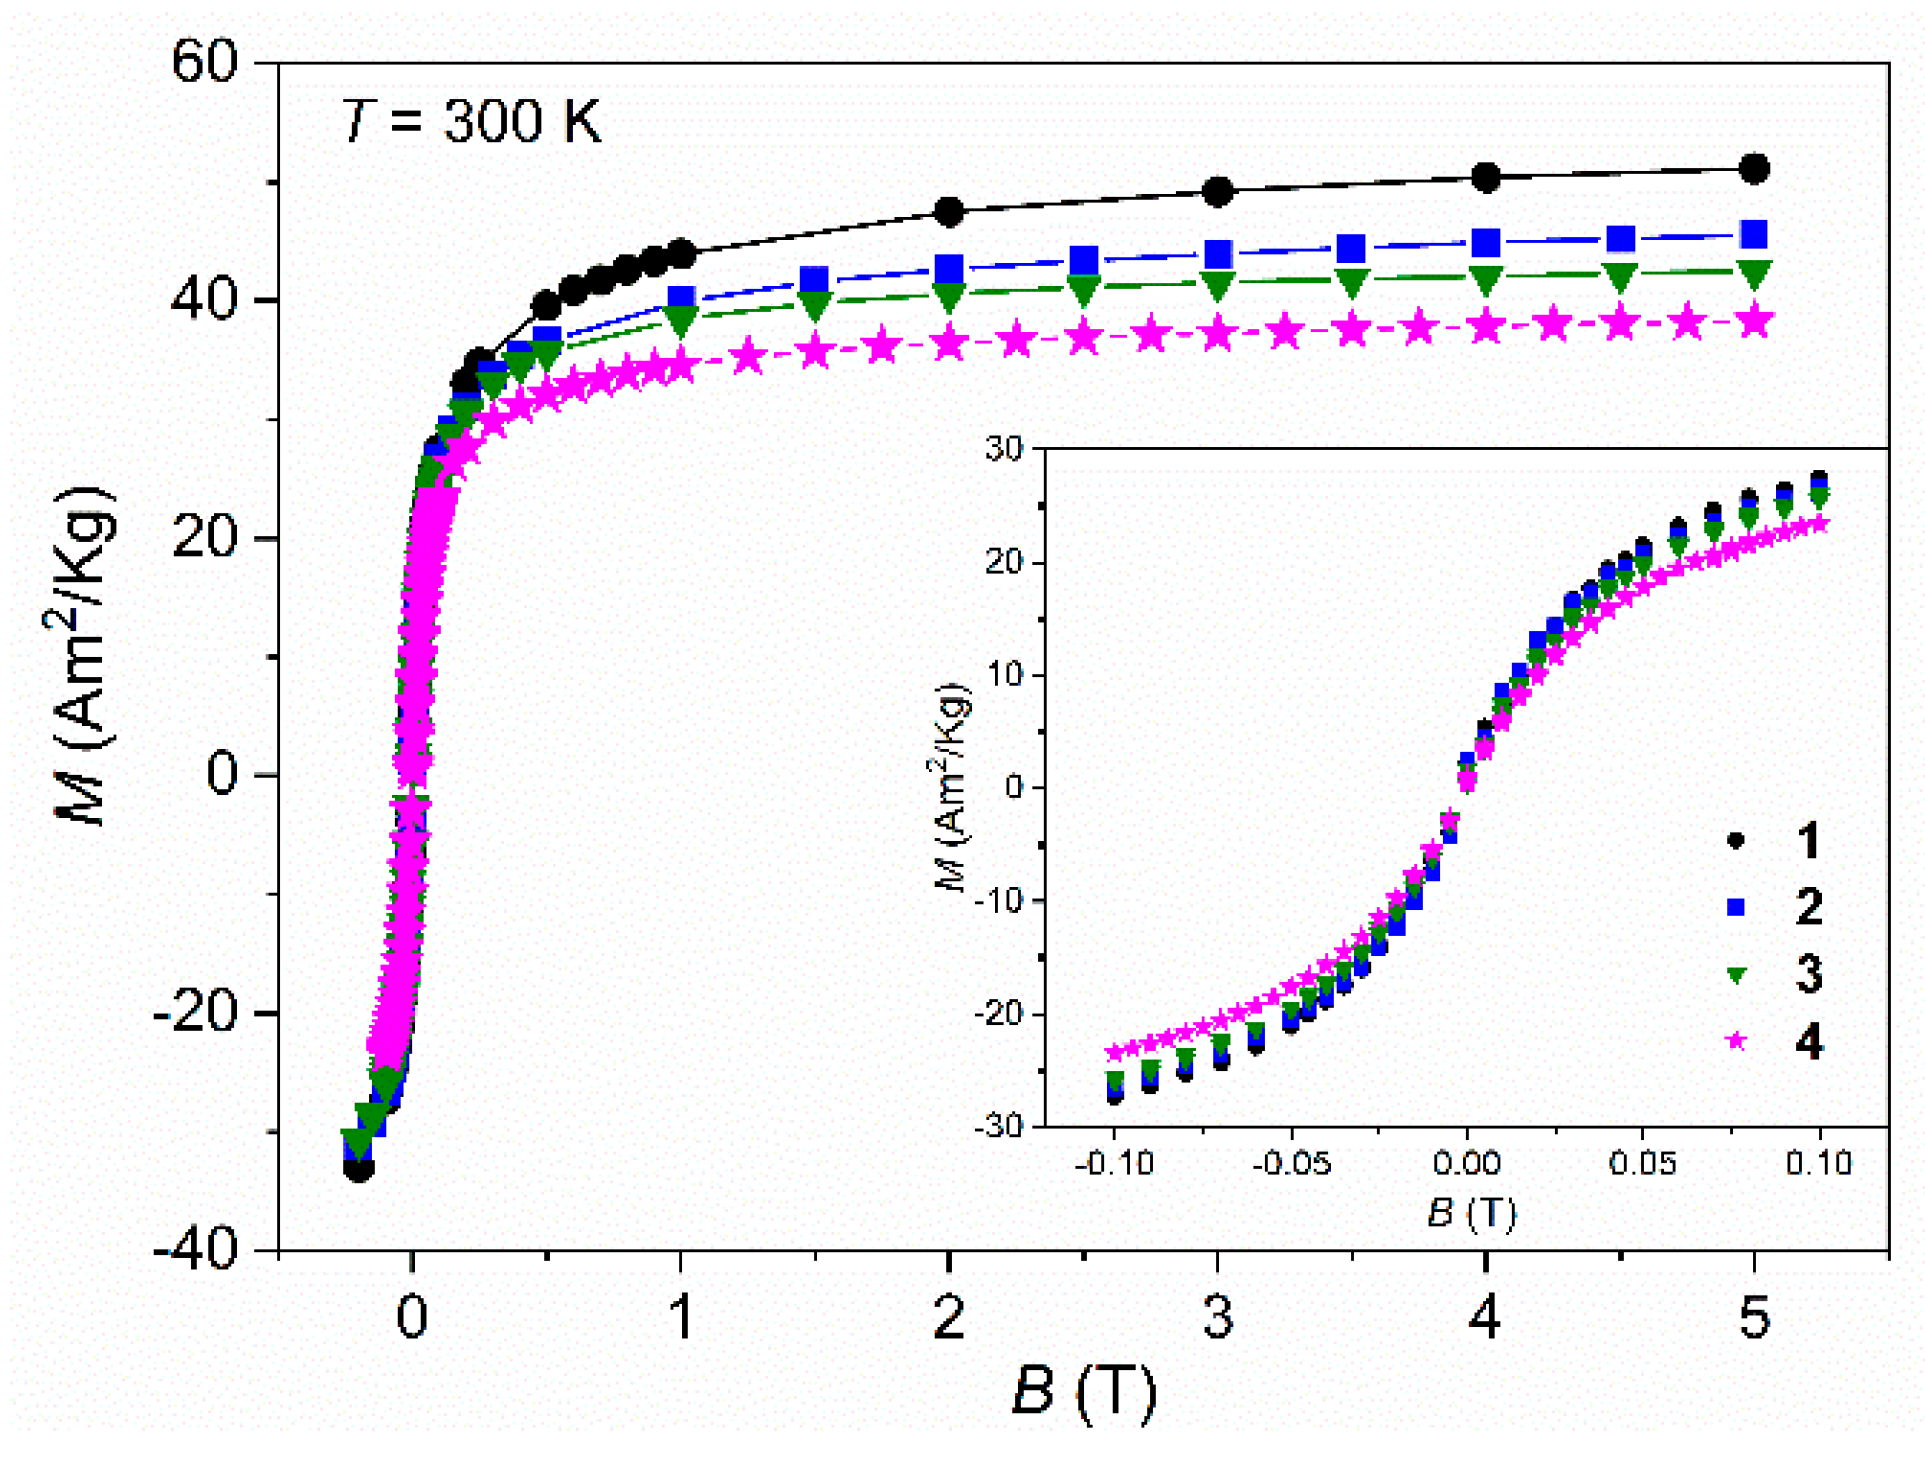
Figure 9.
Magnetic field (B) dependence of magnetization (M) at for “SPpH”samples 5 to 8 at 300 K.
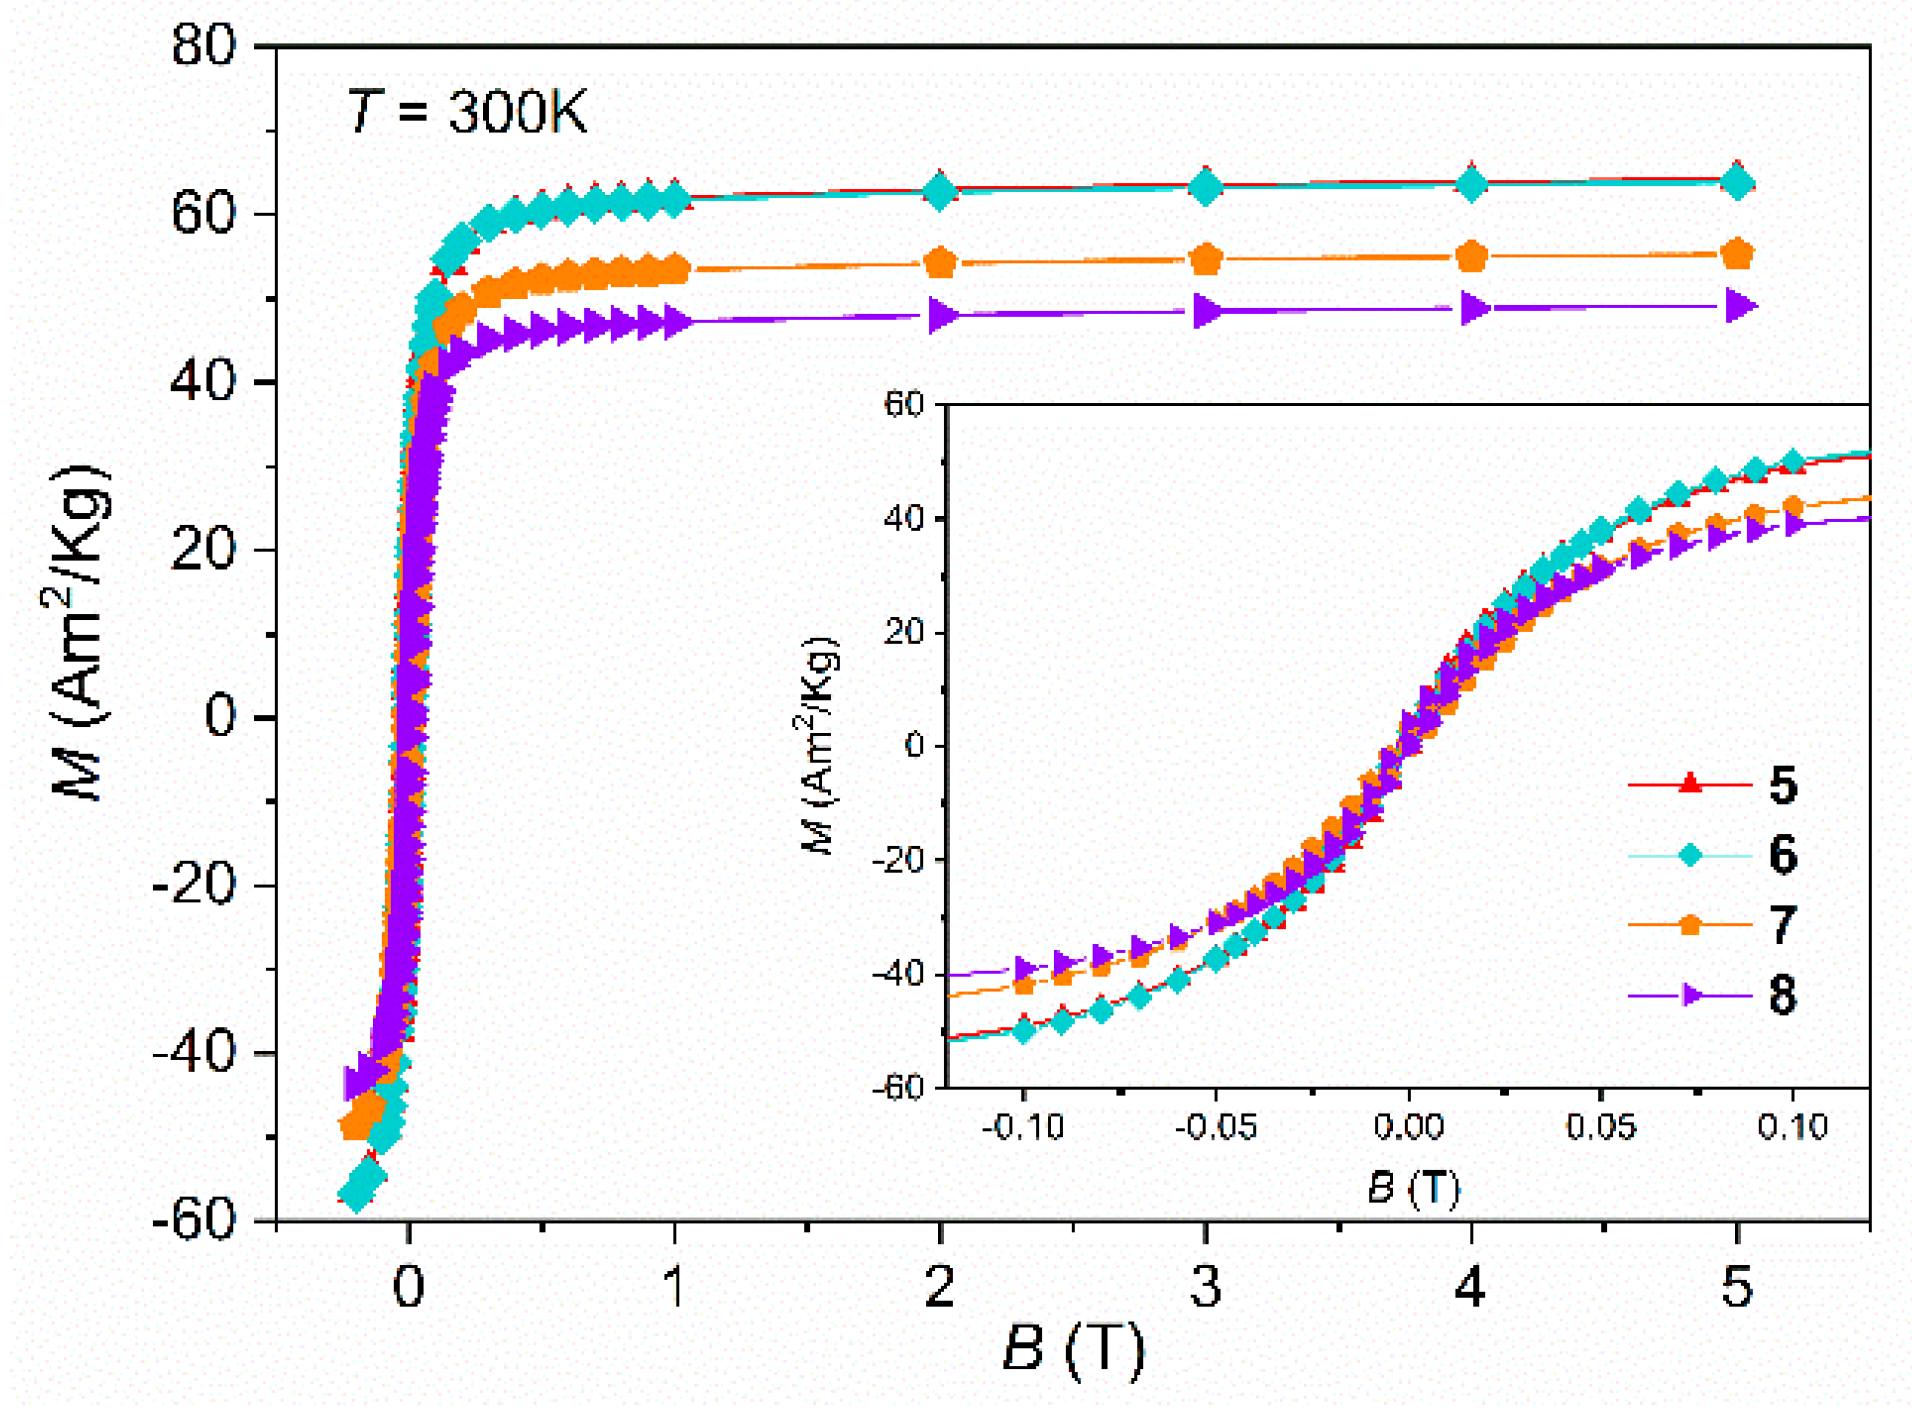
Figure 10.
Heating performance of SPIONs samples: (a) sample SPR/P, 1, measured at different conditions of frequency and field; (b) samples SPR/P, 1, and SPR/P-DX-Au-Gd, 4, measured at ƒ = 180 kHz and B= 12 kA/m (c) Samples SPR/P-DX-Au-Gd, 4, and SPpH-DX-Au-Gd, 8, measured at ƒ = 140 kHz and B= 16 kA/m.
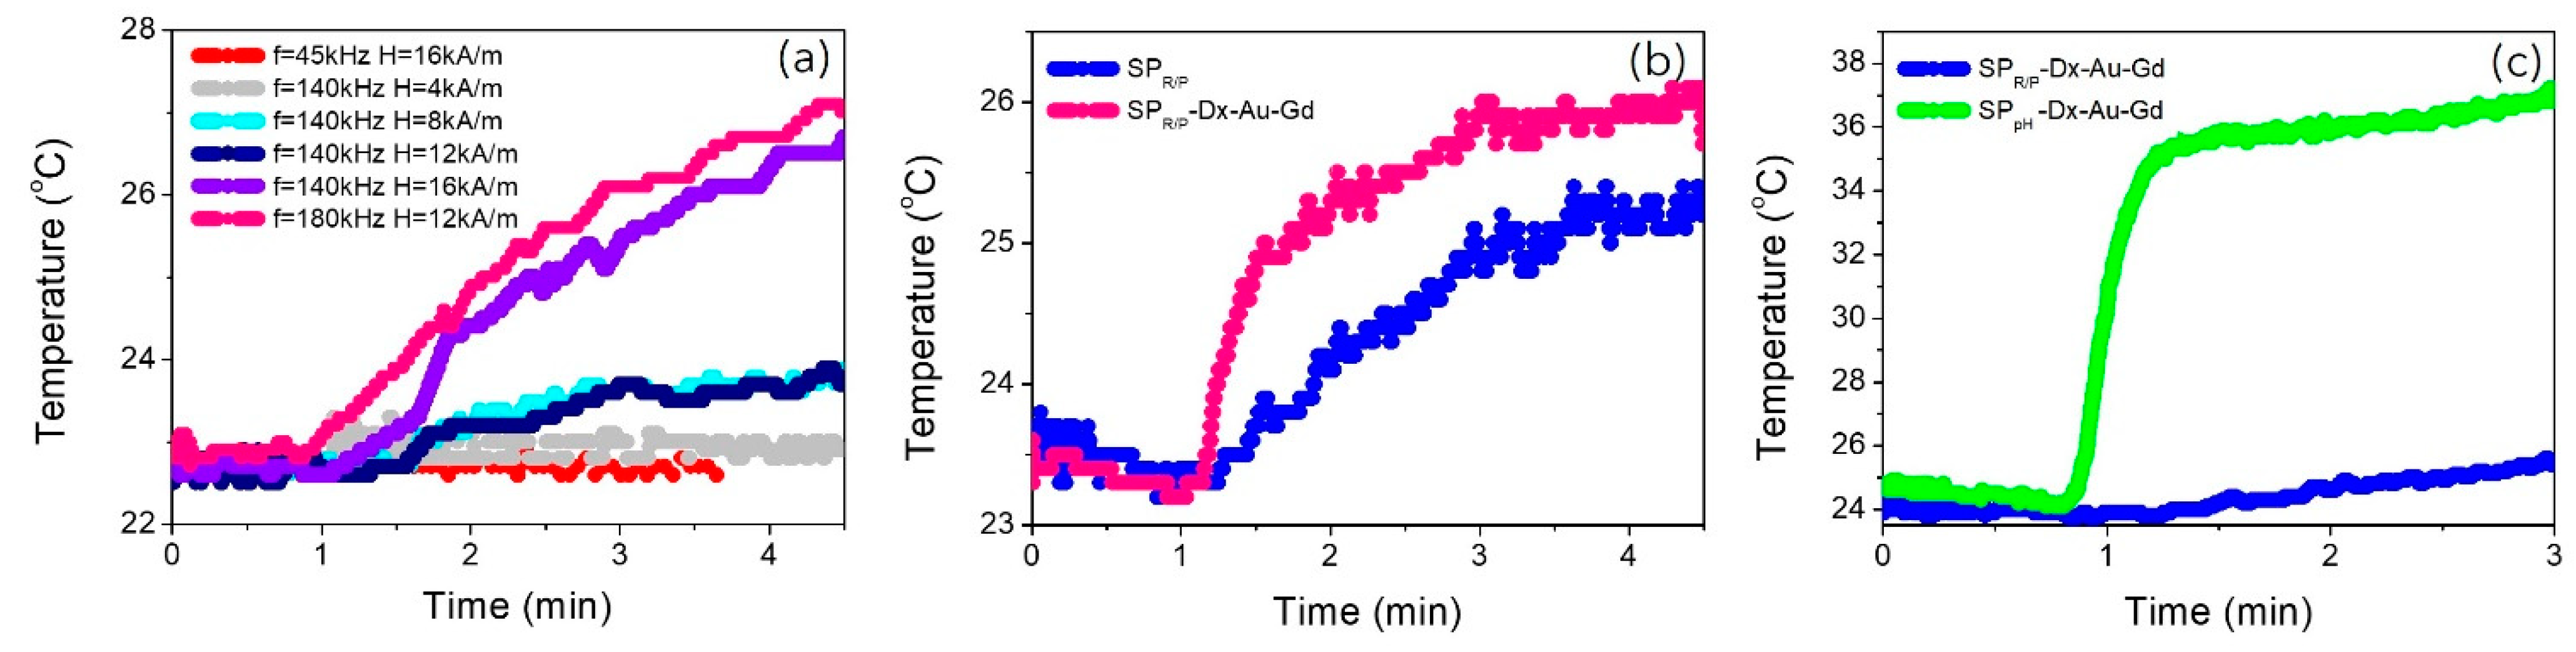
Figure 11.
MR Images of phantom tubes containing samples SPR/P (1) and SPR/P-Dx-Au-Gd (4) and SPpH (5), and SPpH-Dx-Au-Gd (8), as well as water, acquired at 7 T. a-b) T1–weighted images acquired at TE/TR=21/626 ms and TE/TR=8/200 ms, respectively. c-d) T2–weighted images acquired at TE/TR=80/2000 ms and TE/TR=8/3000 ms, respectively.
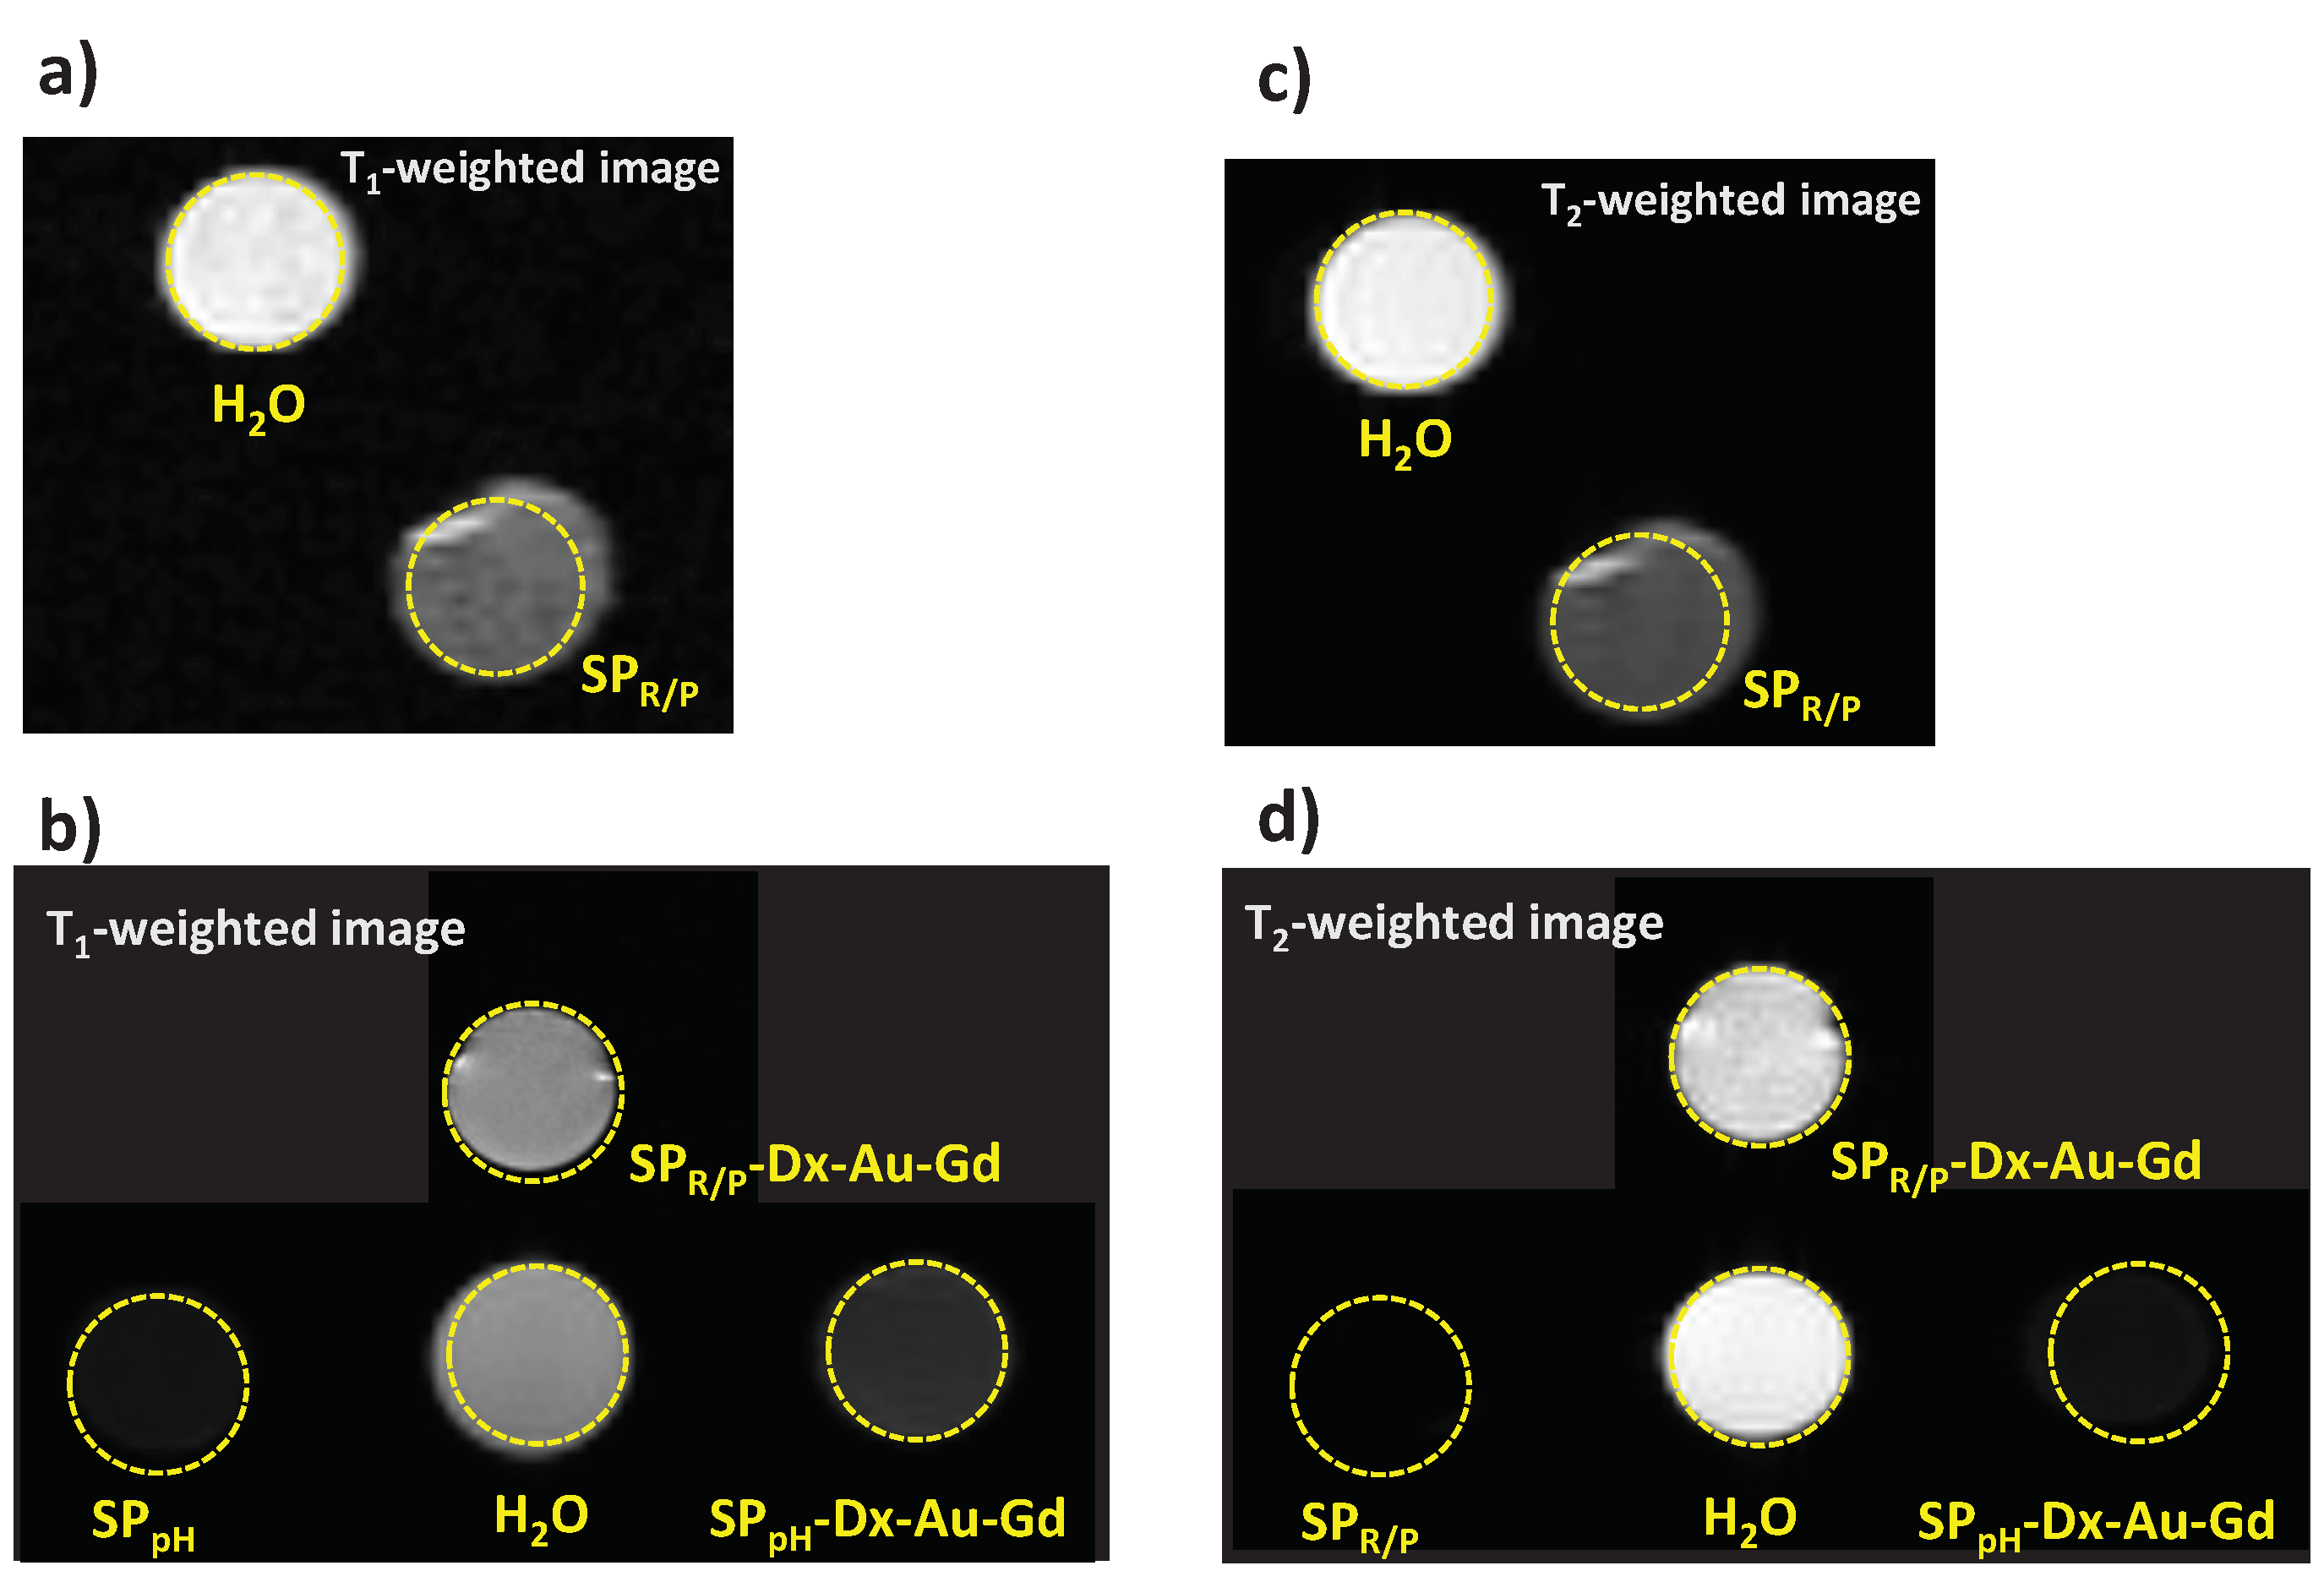
Table 1.
Samples, acronym, labels, and their respective synthetic plan.
| Sample | Label | Description | Precursor |
|---|---|---|---|
| SPR/P | 1 | SPIONs obtained by reduction-precipitation | FeCl3.6H2O/ Na2SO3 |
| SPR/P-Dx | 2 | SPR/P coated with dextran | SPR/P |
| SPR/P-Dx-Au | 3 | SPR/P-Dx coated with gold | SPR/P-Dx |
| SPR/P-Dx-Au-Gd | 4 | SPR/P-Dx functionalized with Gd3+ | SPR/P-Dx-Au |
| SPpH | 5 | SPIONs obtained by co-precipitation with controlled pH | FeCl3.6H2O/ FeCl2.4H2O |
| SPPh-Dx | 6 | SPpH coated with dextran | SPpH |
| SPPh-Dx-Au | 7 | SPpH-Dx coated with gold | SPpH-Dx |
| SPPh-Dx-Au-Gd | 8 | SPpH-Dx-Au functionalized with Gd3+ | SPpH-Dx-Au |
Table 2.
Measurements of sizes obtained by PXRD, TEM and DLS and zeta potential of all samples Crystallite size, particle size and associated size dispersion, magnetic nanoparticles diameter, and hydrodynamic mean size, for each sample.
Table 2.
Measurements of sizes obtained by PXRD, TEM and DLS and zeta potential of all samples Crystallite size, particle size and associated size dispersion, magnetic nanoparticles diameter, and hydrodynamic mean size, for each sample.
| Sample | Crystallite Size - DXRD (nm) | Particle Size - DTEM (nm) | Size Dispersion - σ (%) | Particle size - Dmag (nm) | Hydrodynamic size - DH (nm) (PDI) | Zeta Potential (mV) |
|---|---|---|---|---|---|---|
| SPR/P (1) | 9.04 ± 0.6 | 10.02 ± 2.10 | 20.94 | 10.51 | 52.51 (0.571) | 40.30 ± 8.31 |
| SPR/P-Dx (2) | 7.38 ± 0.9 | 9.63 ± 1.48 | 27.58 | 11.00 | 352.40 (0.373) | -6.21 ± 7.6 |
| SPR/P-Dx-Au (3) | 9.81 ± 0.8 | 10.91 ± 2.71 | 24.84 | 11.68 | 47.36 (0.602) | -19.10 ± 6.0 |
| SPR/P-Dx-Au-Gd (4) | 9.40 ± 0.7 | 11.02 ± 2.75 | 24.22 | 12.28 | 127.9 (0.324) | 35.35 ± 8.5 |
| SPpH (5) | 9.98 ± 0.5 | 12.19 ± 2.54 | 20.84 | 10.09 | 25.38 (0.129) | 43.80 ± 9.7 |
| SPpH-Dx (6) | 12.04 ± 0.6 | 16.45 ± 4.08 | 24.80 | 9.46 | 136.1 (0.620) | -15.10 ± 1.3 |
| SPpH-Dx-Au (7) | 18.23 ± 0.9 | 19.43 ± 5.56 | 28.62 | 9.65 | 28.23 (0.662) | -21.45 ± 0.7 |
| SPpH-Dx-Au-Gd (8) | 18.29 ± 1.3 | 19.98 ± 5.03 | 25.18 | 10.85 | 42.45 (0.482) | -16.65 ± 0.7 |
Table 3.
Magnetic parameters for all the studied samples.
| TB | T = 300 K | T = 10 K | |||
|---|---|---|---|---|---|
| Samples | K | ||||
| SPR/P (1) | 85 | 51.00 | 60.59 | 10.12 | 0.018 |
| SPR/P-Dx (2) | 72 | 45.50 | 53.60 | 10.90 | 0.018 |
| SPR/P-Dx-Au (3) | 87 | 42.54 | 48.32 | 8.83 | 0.017 |
| SPR/P-Dx-Au-Gd (4) | 90 | 38.30 | 45.20 | 7.76 | 0.016 |
| SPpH (5) | 91 | 64.20 | 74.90 | 16.00 | 0.013 |
| SPpH-Dx (6) | 82 | 63.90 | 73.68 | 14.00 | 0.014 |
| SPpH-Dx-Au (7) | 132 | 55.26 | 64.47 | 12.50 | 0.018 |
| SPpH-Dx-Au-Gd (8) | 140 | 49.16 | 64.02 | 14.00 | 0.012 |
Table 5.
Longitudinal (r1) and transverse (r2) relaxivity values determined for samples of the SPIONs at 300 MHz (room temperature, RT) and r2/r1 ratio.
Table 5.
Longitudinal (r1) and transverse (r2) relaxivity values determined for samples of the SPIONs at 300 MHz (room temperature, RT) and r2/r1 ratio.
| Sample | 7 T (300 MHz, RT) / mM-1s-1 | ||
|---|---|---|---|
| r1 | r2 | r2/r1 | |
| SPR/P (1) | -- | 122 | --- |
| SPR/P-Dx-Au-Gd (4) | 3.6 | 11.2 | 3.1 |
| SPpH (5) | -- | 188 | --- |
| SPpH-Dx-Au-Gd (8) | 37 | 57 | 1.5 |
Disclaimer/Publisher’s Note: The statements, opinions and data contained in all publications are solely those of the individual author(s) and contributor(s) and not of MDPI and/or the editor(s). MDPI and/or the editor(s) disclaim responsibility for any injury to people or property resulting from any ideas, methods, instructions or products referred to in the content. |
© 2024 by the authors. Licensee MDPI, Basel, Switzerland. This article is an open access article distributed under the terms and conditions of the Creative Commons Attribution (CC BY) license (http://creativecommons.org/licenses/by/4.0/).
Copyright: This open access article is published under a Creative Commons CC BY 4.0 license, which permit the free download, distribution, and reuse, provided that the author and preprint are cited in any reuse.


