Submitted:
25 March 2024
Posted:
26 March 2024
You are already at the latest version
Abstract
Cars are a highly inefficient mode of urban transport with significant negative impacts. Electric
vehicles make it possible to eliminate direct CO2 emissions (though the total over a vehicle’s
entire life cycle greatly offsets the advantages) but leave unchanged – or even aggravate – all
the other negative effects on the quality of urban environments. Three visions for urban
transport were presented: automobility, multimodality and accessibility. The first dominates
North American cities, the second European one. The anomalies of these two visions have been
examined. The automobility cities cannot manage the congestion and the attempts are self-
defeating. The anomalies of multimodality city are related to the public space consumption for
mobility and the impossibility to plan spatial proximity. The sustainable vision, that resolve the
anomalies, is represented by the accessibility city in the Triple Access System (TAS) version
which, however, still has a long way to go to be accepted and implemented.
Keywords:
behaviour
; evolutionary psychology
; public health
; land use
; mobility
; transport
; cities
; sustainability
; urban planning
1. Introduction
In the last two centuries, the number of people living in urban areas has grown rapidly. Many workers and families moved to cities for better jobs, education, and living standards. The first big cities emerged in Europe and North America, and then even bigger ones appeared in Latin America, Asia, and Africa. Now over half the world’s people are city dwellers, and this share is likely to increase further by 2050 [1].
Urban dwellers have usually been richer and healthier than rural ones on average. Instruction, residence, health and primary care have made people live longer and healthier in cities. But, while cities have seen less infectious diseases and malnutrition, more people have non-communicable diseases (NCDs), such as mental illnesses [2]. Now many rapidly urbanizing countries have an epidemic of NCDs with heart disease, diabetes, and cancer rates linked to inactive lifestyles, bad diets, and polluted environments [3].
Although the health of the urban population has improved, not all people have enjoyed these health gains. Urban slum dwellers, migrants, and poor people have suffered more from pollution, extreme weather, and dirty water and sanitation, especially in low- and middle-income countries.
Climate and demographic changes have worsened urban NCD death and illness [4], with severe impact on older adults, young children, and people with pre-existing conditions [5]. The high-density areas are more likely to experience heat-related issues [6]. These differences contribute to significant health and environmental disparities within the same urban areas [7]. Almost the entire world’s population (99%) lives in areas that do not respect the guidelines of the World Health Organization (WHO) [8].
The environmental issues associated with land use developments, energy, waste and transport have been worsened by the rapid growth of urban areas. Pollution in cities (air, water, and soil) has been linked to a rise in heart and lung diseases and cancer. For instance, prolonged contact with city air pollution can reduce lifespan [9] and hinder lung development in children [10]. Even brief contact with air pollution has been linked to a daily increase in mortality [11] and worsening of asthma in children [12].
The situation is exacerbated in urban and peripheral areas by the negative effects of a mobility that is often heavily dependent on the car.
The literature has approached the problem examining the visions and paradigms at the base of this developments. The visions are in general how is perceived the world, what are the goals, or purpose. The paradigms are theoretical frameworks in a particular field with basic assumptions, key concepts, models and methodology. A vision can emerge from a collective need for change, influenced by cultural, social factors, technology and a paradigm shift. After a paradigm shift, a vision of the kind of world in which we live or in which we want to live will change [13]. The old paradigms will survive in a limited field were their explicative power is still valid, but the new paradigm solves some of the anomalies, deliver more powerful predictions, offer fruitful research program in extended fields.
There has been several vision and paradigm shift related to urban transport.
The vision of automobility cities was immediately linked to the new technology by famous architect Le Corbusier and Wright.
Over the years, a paradigm, developed and refined in “a generalized international urban transportation planning process” (UTP), has dominated transport planning theory and applications, with land use taking a back seat [14]. Increasing capacity to accommodate the growing motorized mobility was used to guide investments in transport [15]. But the UTP paradigm revealed that normal goals of transport planning, such as avoiding congestion and maintaining a high level of service, which should have been solvable by UTP rules and procedures, resisted the repeated attempts of the ablest academics, experts, and practitioners. It was a vision and a paradigm failure, with cities stuck in traffic, trapped in a sort of path dependency with self-enforcing effects [16].
The evidence that the European cities were more resilient to the car domination thanks to a urban fabric more dense and more organized with transit prepared to a paradigm shift towards a multi-modal transport and demand management [17].
One of the first paper 30 years old point to the necessity of a paradigm shift from an automobility city to accessibility planning [18]. The paper is focused on people and places, not mobility. Accessibility planning relies on more compact, pedestrian-oriented community designs, telecommunications, transport demand management (TDM), and public and active transport (AT). Successive papers proposed a new paradigm for sustainable mobility [19,20]. The main transport measures are reducing the need to travel through ICT, as online shopping, modal shift in favor of AT, land-use policy measures for distance reduction and car technology innovations. In the face of a widely recognized increasing uncertainty a paper proposes a Triple Access System based on AT for accessibility by proximity, multimodal motorised transport for more distant destinations and ICT to be more adaptable in the face of change and adversity with policies and investments [21]. The paper approach is to question the present and pulls policy decisions based on an adaptable vision to assist in managing the uncertainty future.
The long-term data shows a market for cars in developed markets could be in structural decline with the km driven per capita and driven license, an accentuated tendency for young people [22]. This has inspired a vision of car free city where walking and cycling cater for a much higher proportion of urban transport needs than at present with positive effects on health and on better use of public spaces [23].
An effective description of the success of automobile, or Autopia, and some future visions “after the car mobility system” are in a book “What is the future?” [24].
The different visions and paradigms have been interpreted as an evolution of the urban mobility thru different stages and paradigms strongly influenced by the involvement of an increasing range of academic disciplines, with different data, models and methodologies and the interactions with the changing policies (or visions) [25].
The paper has three main objectives. The first objective is to understand the success of the car despite all the negative impacts. The second is to provide a comprehensive approach to studying the relationship between cars and urban areas and how is changing in European and North American cities thru three different visions and corresponding paradigms automobility, multimodality and accessibility cities.
The paper is structured in three parts. The first part gives a synthetic picture to explain the motives behind the resilient success of the car in spite of everything. The second part explores the main anomalies of the automobility city and the conventional paradigm based on traffic, mobility, and “predict and provide” that appear at this point to many experts, professionals and academics to be fundamentally in contrast with sustainable solutions. The third part is dedicated to the multimodality city to show how its paradigm no more based on traffic, but on mobility, is able to overcome the anomalies. The last part is dedicated to accessibility city, a new vision supported by academics, experts and some decision makers, but still in its infancy.
The Figure 1 shows the three visions with the main led cities with the results in term of the modal share of motorised private cars.
The paper’s methodology is based on a collection and selection of the individual insights of various disciplines to highlight the common complex problem of land use and transport in modern cities. Then it tries to integrate knowledge from different disciplines and perspectives, to address a complex issue that cannot be solved by one discipline alone.
2. The Success of Automobility
Private cars cause numerous important negative impacts [20]. Despite this, the car has had great market success and earned much admiration. Several studies [27] have found that owning a car may often be irrational behaviour because people underestimate its true cost [28]. A study [29] that tries to understand the value of car ownership has found that individuals often give a higher value on car ownership than its actual cost, implying that reducing car ownership is impeded more by the overestimate of its basic utility than by underestimate of its costs.
The automobile attracts thanks to a combination of physical and psychological signals, today shared to different degrees by all human beings. Through movement and speed, the automobile gives us the pleasure of showing skill and accepting risk. In this way, young people are able to show off their qualities, the so-called young male syndrome. The automobile is a status symbol used as an indicator of social prestige and to increase the chances of being chosen by a partner. The automobile protects us by surrounding our fragile, soft, and vulnerable human skin with a new shell of steel.
The core hypothesis put forward here is that the automobile has activated irresistible cues to our instincts. In Figure 2 the human being’s instincts are activated by four irresistible cues from the automobile, and the instinctive response is so immediate and natural as to compromise the use of the intelligence. A mismatch happens if we use Kahneman’s System 1 thinking [30], “a near-instantaneous process driven by instincts, to evolutionarily novel problems (like the car) or, the reverse, when applying System 2 thinking, slower conscious and logical reasoning, to evolutionarily ancient problems [31].”
Human behavior has evolved for millions of years in the Environment of our Evolutionary Adaptedness (EEA), the African savannah [32]. In that environment, running faster than others was a key element of survival. But in contrast to the great physical activity of the hunter-gatherer who covered daily distances of 15–20 km, in the evolutionary past a strong selection favored the survival of those who obtained the necessary calories with minimal effort [33] and exposure to risks [34]. The survivors, in other words, covered many kilometers but also spent many hours sitting and socializing in the group.
Today this balance between activity and inactivity no longer works. Food is available in abundance at the supermarket, which is reached by a car parked in a garage under the building or house, often reached by a lift. Figure 3 illustrates some of the consequences of the mismatch between psychological and behavioural mechanisms that evolution produced and that have been retained via natural selection.
Technology allows us to indulge our ancestral attraction to a sedentary lifestyle [36] to a level never seen in our evolutionary history (Figure 4).
In the 1910s, the automobile became a popular consumer good in the U.S., thanks to the introduction of the assembly line and components which drastically reduced its production costs. The oil and automotive alliance, supported by politics and the enthusiasm of millions of consumers, was the symbol and one of the main factors contributing to a period of unprecedented expansion in the economic history of humanity.
These same economic interests promoted the first policies to support the automobile, which were decisive for the affirmation of the new mass product. In particular, the expansion of the road system, urban restructuring, the different allocation of public spaces, and the decline of public transport were fundamental. The industry reaped the benefits of a product that appealed to both mass and elite markets. Politicians, who always like technically simple ideas with broad popular support, realized that the care could, in one fell swoop, solve complex problems of economic growth and employment.
Artists, writers, and visionaries have cemented automotive mobility into popular culture and consequently ensured its influence on national agendas. Engineers, fascinated by the new machine, provided the tools with which to design the city around the car. The most famous architect-urban planners of the period created visions of the city of the future based on the automobile. Le Corbusier imagines the city of tomorrow as vertical with a triple system of roads: underground for heavy traffic, at grade for urban distribution traffic, and elevated highways N-S and E-W for rapid traffic. The under-ground train station is in the centre. For Le Corbusier, mobility and speed are priorities for the success of the city. “Speed is on the side of simple dreams: but it is a brutal necessity. The conquest of speed has always been humanity’s dream, yet it has only taken shape in the last hundred years” [37].
The auto industry brought the idea back to Futurama, A display at the 1939 New York World’s Fair showcased a potential vision of the world two decades later (1959–1960). This exhibit, funded by General Motors Corporation, highlighted automated roads with life-sized models and expansive suburban areas, possibly reflecting the American ethos of individualism [38]. Frank Lloyd Wright captured this in an extreme vision, the end of the city, made obsolete by the individual mobility of the car, and the proposal of Broadacre City, a widespread low-density population with individual villas each surrounded by greenery, the American individualist dream, and the “sprawl”.
This strong attraction for the car prevents us from objectively judging the multiple damages resulting from their excessive use. A recent study [39] has shown how the use of the car automatically receives a systematically distorted treatment in favor of a positive judgement, an effect that the authors call motonormativity. This motor-normative thinking seems endemic among administrators and physicians as well as the population. As a result, policy makers systematically neglect fundamental issues of public health and sustainability.
3. The Automobility City
A new vision emerged of a city transport dominated by the cars, supported by enormous interests and the aspirations and ideals of societies and millions of individuals ready to reevaluate their life goals and values.
The automobility vision was prevalent in much of the second half of the 20th century, especially in north America, cars play a central role in transport and city planning, reflecting a culture and lifestyle that view every person as self-sufficient individual, deeply rooted in car ownership for daily transport.
Americans usually, and this idea is important to understanding the American value system.
The urban landscape key features include:
- Extensive road networks from the city centre to the rural areas, often with multiple lanes and multi-level road intersections well connected and allowing easy access to various parts of the area.
- Large parking lots including multi-level parking lots and dedicated parking zones, are strategically located near commercial areas, industrial zones, and public spaces.
- Wide streets and boulevards, manly auto-oriented and often neglecting the needs of pedestrians, cyclists, and public transport users. The intersections are carefully designed with traffic signals, turning lanes, and other features to optimize traffic flow.
- The emphasis on automobiles may result in limited public transport infrastructure. While some bus routes or other modes of transit may exist, they might not be as extensive or well-developed as in other urban models.
- Commercial and business districts are often aligned along major road arteries, making them easily accessible by car. Shopping centers, malls, and office complexes may be strategically positioned for convenient automotive access.
The term “suburb” gradually lost its relevance in describing the developments occurring on the outskirts of urban areas. By the 1980s, numerous former suburbs had become independent of central cities. A notable characteristic of the American built environment was the emergence of edge cities (Figure 5), where commercial and entertainment activities were concentrated outside the traditional urban core of the 19th century, typically located on the outskirts of metropolitan regions at the intersection of main highways, surrounded by the urban sprawl. They reinforced the reliance on cars, with their spatial designs prioritizing automobile circulation as the primary mode of transport.
A modern vision of an automotive city revolves around creating a dynamic, efficient, and sustainable urban environment tailored to the needs and preferences of individuals relying on cars (Figure 6). This involves minimizing traffic congestion, optimizing travel times, and integrating advanced technologies for efficient traffic management. Despite the focus on automobiles, the city aims to be a leader in environmental sustainability. This includes promoting electric, hybrid and autonomous vehicles, investing in green infrastructure, and implementing measures to offset the ecological impact of widespread car usage with innovative infrastructure. This includes smart roads, intelligent parking solutions, and cutting-edge technologies that enhance the overall experience of automotive travel. This involves smart traffic monitoring, strict enforcement of traffic regulations, and community engagement programs to promote responsible driving habits. The technological innovation is envisioned as a catalyst for economic prosperity. The city aims to be a hub for innovation, attracting investments, creating job opportunities, and contributing significantly to the local and national economy. In summary, the long-term vision for an automotive city want to create a well-balanced urban environment that leverages the benefits of car-centric transport while prioritizing sustainability, quality of life, economic growth, and technological innovation.
But this vision is challenged by many different obstacles. The detrimental impacts on the environment, society, and economy resulting from the relentless pursuit of an automotive city have been extensively emphasized.
It will never make sense the consumption of energy and space to move one 80 kg person in a 2-3 ton vehicle that occupies 10 m2 stand and 50 m2 at a speed of 30 km/h on a lane of 3 m.
The car can reach high speeds, but its maximum capacity is around 60 km/h, 1500–2000 p/h in a 3.5 m lane. Trains carry thousands of passengers, and their performance, speed, density, and capacity, unlike road vehicles, are controlled in maximum safety by signaling. Their capacity can reach up to 90,000 p/h. The pedestrian capacity of the 3.5 m lane is 15,000 p/h and the bicycle is 12,000 p/h.
The direct and indirect health impacts of the car are given in Figure 7. The list is not complete because there are also effects on some of the most common cancers [40]. The effects of car pollution are widespread and affect ecosystems and human health.
The average portion of household income spent on transport in the U.S. is 17%. Low-income groups spend as much on transport as on housing. The need for parking areas increases land requirements for retail and office use and the cost of housing by 25% (or more). Support and funding for cars are regressive tax. Individuals with lower to moderate incomes, who typically drive less than the average, end up financially supporting those who drive more than the average, who are usually people with higher incomes.
But more than 50% of the population cannot use a car for transport, the individual owned car is not a universal means of transport, it is not accessible to everyone. An estimate of the percentage of people in U.S. who can't use a car at any given moment is based on several key factors:
Licensed drivers: According to the data from the Federal Highway Administration, they were a total of 228,195,802 in the US in 2020, out of a resident population of about 329 million. This means that the percentage of US citizens with a driver license was about 69.4% in 2020. This percentage has been relatively stable since 1991, ranging from 68.3% to 70.5%2. The age of the individual also impacts their possibility to have a license. Those who are too young to drive or those who are too older cannot have a license.
Access to a Car: As of 2021, 91.7% of U.S. households had at least one car, 40% have just one car, and 8.3% did not have access to a car. However, this figure varies significantly based on income. A growing percentage of Americans are falling behind on their car payments due to rising auto cost and loan interest rates. Owning a car is a necessity for many Americans. Nearly one-third (32%) of respondents to a nationally representative online survey in November 2021 by Qualtrics without a car say they need a car but cannot afford one right now. The poorest quintile spends 32% of their income on their car.
Physical Disability: 16% of U.S. residents are physically disabled, and only 60.4% with disabilities drive a car.
License suspended: The number of driver’s licenses that are suspended in the US every year, according to a report by the “Fines and Fees Justice Center”, are approximately 11 million as a result of unpaid court fines and fees, often for reasons completely unrelated to driving. At least 75% of Americans who get their licenses suspended continue driving, according to the National Highway Traffic Safety Administration.
At the end approximately 50% of U.S. residents at any given moment can’t use an individual owned car to get in someplace. The automobility city is not for all, there are big discrimination between classes, gender and age.
The increase in traffic congestion is an inevitable situation that affects all major cities. The congestion has dynamic degradation effects on unprotected public transport that once started do not stop until hits the bottom. The process begins with declining utilization of the service, strongly reducing frequency of service and increasing fares. But these effects produce a further decline in traffic, leading in turn to yet another deterioration and so on, until is reduced at un minimum needed by the captives of the service. The proposed approach by the transport economist is to further reduce the number of people using the car charging peak-hour tolls, a very contradictory measure for an automotive city and politically inapplicable with a degraded public transport. The toll not by chance has been applied only in city with optimal public transport services in Europe and in US will be applied in New York, the American city with the best public transport services.

Table 1.
lists the adverse effects of car addiction on the environmental, economic, social, and institutional aspects.
Table 1.
lists the adverse effects of car addiction on the environmental, economic, social, and institutional aspects.
| Environment | Economy | Social | Institutional |
|---|---|---|---|
| Low-density spread in rural areas and edge cities | High energy consumption and oil addiction | Inequity in transport by income and gender | The institutions favours the car |
| Land consumption | Decline in transit and active transport (AT) | Loss of living space | The driver is in charge |
| CO2e, pollution, acid rain | High transport costs | Road accidents | Technical offices dedicated to traffic |
| Extraction and consumption of raw materials | Costs of pollution and sedentary lifestyle | Community severance | Administrations finance the renewal of the vehicle fleet |
| Congestion costs | GDP loss | Mental and physical health for sedentary life and pollution | Planning based on the predict-and-provide principle |
The automotive city has been supported and developed mainly by traffic engineers with a paradigm based on “predict and provide” and a three-step traffic model in Figure 8 with a hydraulic approach focused in verify a sufficient capacity for the incoming traffic with trip assignments to the existing and planned roads. The mode choice was absent, because the demand was divided in car users and transit captives.
The paradigm has been widely criticized for its self-defeating nature [16,42,43], because increasing road capacity in congested conditions can actually worsen congestion through induced traffic demand and decline of public transport.
There are fourth different perspectives on what constitutes induced traffic demand, which says that widening roadways or building new roadways will lead to new traffic beyond the pre-existing level to new travel by existing car travelers. Some of these interpretations hold more validity than others. The first perspective associates induced demand with existing car travel redistributing across the roadway network in order to shorten trips. The second perspective links induced demand with existing car travel adjusting their travel time to take advantage of additional capacity during desired hours. third perspective connects induced traffic demand from users of public transport due to new connections or increased capacity. This shift from non-auto modes to automobiles contributes to the increased volume of roadways and is a part of the new traffic that is generated. The fourth perspective associates induced demand with new trips or increases in trip length as the distribution patterns change. Some consider this to be the true measure of induced demand, as these are new trips taken by existing commuters. The reduced congestion and lower time cost of travel encourage commuters to travel more frequently and/or over longer distances, thereby stimulating urban expansion with sprawl and new developments.
The concept of induced demand, suggesting that expanding roadways will result in additional traffic, which rendered ineffective the increase in capacity, is old and supported by both theoretical and empirical foundations “On urban commuter expressways, peak-hour traffic congestion rises to meet maximum capacity [16].” The principle is widely accepted by the scientific community interested in urban transport.
But at the same time the road expansion seems still to have a strong appeal. U.S. transport authorities are spending billions widening urban freeways to fight traffic delays. In Europe highway expansions in Norway and Britain haven’t reduced congestion, in Italy a medium city like Rome has invested in road expansion adding tunnels, more lanes to radial highways and ring road, without success, and still has a project of a new radial highway and a bypass in the urban area.
Despite the apparently overwhelming evidence and consensus of the principle however, it continues to be disregarded with the strong support of a coalescing of vested interests consisting of automobile manufacturers, construction contractors, officials of transport and other related departments, vehicle owners, and politicians trying to please their voters and exploiting a profitable situation.
The principle of induced demand is counterintuitive, as the construction of highways seems appears to be a simple and straightforward answer to a lack of capacity. When drivers are in a stop and go traffic congestion, their instinctive linear reaction is to advocate for more road. It is the fast, automatic, and emotional mode of thinking in a situation of discomfort that our brains use to make quick judgments and decisions [30]. This type of thinking is unconscious and instinctive and requires little effort. It is driven by our experiences and instincts. Unfortunately, everyone thinks first of the linear simplistic solution, even engineers. Evolution did not equip humans with the mental ability to handle the complex systems of modern cities [44]. The solution of more of the same “more traffic, more roads” becomes the problem, “plus ça change, plus c'est la même chose” (the more things change, the more they stay the same or worse). But traffic keeps growing; cities were (and are) stuck in traffic; and the linear simplistic solution. The vision of an automobility city ends in a black hole of road investments [45] and in a bottomless pit that support the process.
A very influential book [46], published in 1989 based on ten years of data collection, derived from 32 cities worldwide, and several paper [47], based on this data, showed that the automobility US cities were significantly higher in their fuel consumption and distance traveled. The Figure 6 show the correlation between fuel consumption per capita y increasing from 40 to 70 (MJ/person*1000) with average car speed v1 and decreasing with average transit speed v2. The distances travelled are not matched by the increase in speed v1, so the time dedicated to car travels increases to the detriment of travels on other modes, especially on foot, if the time budget is respected. Low density cities, like Huston, have higher car speed, longer travel distances and slower transit speed. High density cities, like New York and Chicago, have slower car speed, shorter travel distances, higher transit speed and can increase proximity, by shortening the distance between origins and destinations, and can reduce the car dependency in favor of AT [48,49].
The per capita consumption (or vehicle-km), presented in Figure 9, is more than 4 times the European cities and this can be explained with the sprawl, low urban density, high level of supplying road capacity and the decay of transit. For the European cities the petrol consumption is stable and independent from the speed of car and transit.
The Figure 10 shows that v1 and v2 speed in US are negatively correlated and in Europe are positively correlated and this explain the differences in petrol consumption. In US the car speed and consumption increase with the increasing of car use and travel distances, in areas of low density, high sprawl, and marginal use of transit. Some cities, like New York, with a good provision of railways resisted to the automotive vision. In Europe the positive correlation of speed ensures competition between the two modes, to the point of keeping petrol consumption constant independently from the speed, an important positive effect of transit.
The trends took a turn around at the beginning of this century towards a reduction in automobile dependence. Urban density is reversing sustained earlier declines in most cities, and secondly, transport priorities in cities began to shift, particularly as the relative speed of rail transit to road vehicle transport became faster [47].
In the thirteen US cities of data collection, by 2005 the highest speed ratio between transit and automobile, however, was only 0.69, shared by New York and Atlanta, with Washington not far behind (0.64). However, many US cities such as Los Angeles, Phoenix, Portland and Houston with public transport speed ratios of only around 0.47, have been building more and more light rail, BRT and metro, in the case of LA, to avoid be fatally stuck in traffic congestion [48].
Consequently, enhancing the quality and quantity of collective transport is a prerequisite to reduce congestion in urban areas, benefiting both car users, transit users and the environment.
4. Multimodal City
Effective access to amenities and services in cities is a key measure of the performance of the urban transportation system. A fundamental principle, then, of sound urban and transportation planning is the delivery of effective ‘access for all’ without discrimination as to income, physical ability, housing location, mode of travel or any other factor [51]. Effective and equitable access means many different things – for example, the difference between an easy and difficult commute.
Now the policy focus switches from one of accommodating as many motor vehicles as possible on the urban road network, to one of moving people from their origin to destination in the most efficient manner possible - so that the mode of transport used becomes of less importance. Since public transport systems (buses, trams, trains, underground) use the limited available urban space much more efficiently than private cars and can accommodate much higher numbers of people per unit area (both in terms of movement and parking), then the solution to the conundrum of how to cater for the rapid growth in vehicle demand in a physically constrained area is to seek to switch much of this growth to other forms of passenger transport.
Building blocks of multimodal integration
In order to build a high-quality integrated multimodal system, cities must achieve integration in the following areas:
- Infrastructure and operational integration – different transport modes connected physically as well as operationally.
- Information integration – information systems help service providers achieve operational integration in addition to providing real-time information to passengers on various modes regarding connectivity options, routes, schedules, and fares.
- Fare integration – integrated payment solutions like smart cards allow seamless access and payment across different modes.
Additionally, a key enabling feature to achieving integration at these levels is the presence of a strong institutional framework, such as a unified metropolitan transportation authority, which can plan, coordinate, execute, and monitor the implementation of the above aspects.
The Europeans were attracted by the automobility vision like the US citizens but were refrained and constrained by the built environment, the high-density urban fabric and the public transport infrastructures. They never reached the motorisation level of US and the massive destruction of existing transit [], that occurred in US with the conspiracy of General Motors and other companies interested in the automobile business.
But the resistance to the automobile was not uniform and rigid, even in Europe there were some Robert Moses. In Rome in the far 1930s, therefore well in advance of the automobility vision, began the construction of a motorway from the center of Rome, that crossed the archaeological park, required the demolition of a hill and many houses, used the Colosseum as a traffic island, breaks through the Roman walls and arrives after 26 km at the sea. It is still there, but the initial central part has been eliminated and traffic finally skirts the coliseum.
The emotional vision of accommodating as many cars as possible on the urban road network even to the detriment of other uses and other modes of transport never dominated Europe as in US. The automobility vision was with alternating events mitigated by a vision of a multimodal city that optimises the transport modes to move people in the most efficient manner without discrimination as to income, physical ability, housing location, or any other factor.
A multimodal city recognises the importance of all aspects of mobility. A transport system must provide a wide range of demands in order to operate efficiently and equitably. People are using more than one mobility choice for their journey. Diverse mobility options are particularly crucial for individuals who are physically, economically, and socially disadvantaged. Main mobility choices include active transport (walking and bicycling), automobile, sharing and public transport (regular bus, bus rapid transit, light, heavy, and suburban rail). A good transport system must incorporate multiple modes of transport, ensure efficiency and effectiveness, be easy and convenient to use, fast, safe, inclusive and affordable.
Effective access to amenities and services is a key measure of the performance of a multimodal transport system. A fundamental principle, then, of sound urban and transport planning is the delivery of effective ‘access for all’ without discrimination as to income, physical ability, housing location, mode of travel or any other factor [51].
Two key benefits of multimodality are the big reduction of space necessary for mobility and the control of traffic congestion. The same lane wide 3.5 m can have a maximum of 2,000 person per hour with individually owned cars, 15,000 with active transport, walking and biking, 43,000 with a BRT single lane, and 90,000 with suburban rail. It is an enormous saving of urban space that can be dedicated to more interesting activities for a livable city.
The second benefit is the positive effects of public transport on rail or in reserved lane in reducing traffic congestion and the decline of public transport. This benefit was recognised theoretically with the Downs/Thomson paradox [16] in Figure 11. The effect of improvements to road and transit have completely different effects, both tend to attract users, but in the case of transit increases revenue and service and reduces road congestion. In contrast, the users attracted by road improvements increase congestion and dissolve the benefits, at equilibrium, the generalised costs of car and public transport (mass transit) will be equal, as presented in Figure 11. The cost of car increases rapidly with the flow, instead the cost of transit is the opposite, more users less generalised cost, and the two modes find an equilibrium in E. A better road the dotted line in Figure reduced the cost but the new equilibrium E’ is worse than before, with an improvement in the transit the new equilibrium E’’ is better than before.
The frequency of a transit service increases with demand, then a rise in demand shortens the waiting times and increase returns to scale for scheduled urban transport services the so called “Mohring effect” [52]. The opposite is with a road traffic, more vehicles use a road, the overall efficiency and speed of travel tend to decrease.
The paradox was practically confirmed in the cities of London and Paris by researchers at University College London [42]. Something similar found in Rome is showed in Figure 10. Despite the profound diversity of the situations also in Rome a new subway operated a certain rebalancing between the speed’s door-to-door of private transport and rail transport for journeys from concentric rings towards the central areas of the city (Figure 12).
The door-to-door speed increases with the distance from the centre, like the case of London. The private transport speed is a little higher along the sector of metro A, effect of a better modal split. In the other sectors of the city the public transport has a significant lower speed compared with the sector served by metro A and increases with the distance from the centre, where the public transport service is of less quality.
A study of the University of California, Berkeley [53] confirms that transit relieve traffic congestion. The study took vantage for a real-life example when the Los Angeles region’s transit was shut down due to a strike for 35 days, to understand how transit actually affects congestion experienced by drivers. A regression discontinuity design shows that average highway delay increases 47% during the strike in agreement with the predictions of a model and many times larger than earlier estimates of congestion relief of public transit. The effects are more relevant on roads along mass transit corridors. On U.S. 101 a freeway along the major Red Line subway, the average delay increased 90 percent during the strike and 123 percent during morning peak. For freeways without transit corridors, the average delay increased 29 percent and 56 percent during morning peak. More US studies on the effects of a transit strike are reported in a recent paper [54].
The new vision is supported by many trends that reflect a broader movement towards multimodal transport, reduced reliance on private vehicles, and an emphasis on sustainable mobility solutions.
The car as a means of urban transport par excellence, after about a century of continuous growth, seems to have reached its peak and begun to decline in cities with medium-high per capita income [55]. The phenomenon of stabilization and degrowth affects all developed countries [56]. The causes of this trend are multiple: recovery of TCs, demographic, economic, cultural and technological effects. The variations are strongly dependent on age. Young people are less likely to get a driving license [57]. The phenomenon is general in developed countries and causes a reduction in travel. Young people drive less, the maximum mileage occurs at the age of fifty. The car discriminates on people's income, age and even gender; women ride about 40% of men. European consumers are becoming more concerned about vehicle ownership in general and more interested in sharing, one in three European car owners could consider not having a personal car in the future, with 8% could “definitely” do it. Younger Europeans are keener to abandon personal cars, 40% say they could among those aged 18 to 34 years-old, with 12% “definitely”, and people living in large cities are also more inclined to do so.
As consequence of the new vision the planning paradigm shifted from traffic to mobility. The objective of transport planning in its modern version of Sustainable Urban Mobility Plan (SUMP), is to satisfy the needs of mobility, the movement of people and goods [58]. SUMPs represent a European approach vision-led in terms of multimodal planning, with greater emphasis on mode choice and the acknowledgment that a plan should be shaped trough a participatory process. The simple linear “predict and provide” based on forecasting vehicular traffic demand and supply new roads has shifted to a more complex and articulated approach based on Transport Demand Management (TDM) to reduce individual motorized travel, to promote public (PT) and active transport (AT), to move people, not cars, in the most efficient and sustainable manner possible. PT utilize urban space more efficiently than private cars, making them a solution for transforming the roads and managing improvements to AT, sharing vehicles and public spaces.
Since public transport systems (buses, trams, trains, underground) use the limited available urban space much more efficiently than private cars and can accommodate much higher numbers of people per unit area (both in terms of movement and parking), then the solution to the conundrum of how to cater for the rapid growth in vehicle demand in a physically constrained area is to seek to switch much of this growth to other forms of passenger transport.
vision-led “decide and provide” based on the backcasting approach [], after a desirable future has been formulated it focuses on how to get there. At its heart is deciding on a preferred future and providing a development path best suited to achieving it. The preferred future is a multimodal transport.
The model structure also changes to comprehend the multimodality it should have new models to evaluate modal split and multimodal assignment as in Figure 13.
The new paradigm has shifted from increasing the motor vehicles capacity of the urban road network, to moving people from their origin to destination in the most efficient manner possible – independently on the mode of transport used.
Ensuring effective access to amenities and services in cities is a fundamental principle of sound urban multimodal transport. This includes providing equitable access for all, regardless of income, physical ability, housing location, or mode of travel.
Today, most cities in Europe are fairly advanced in the deployment of integrated, multimodal transport systems due to a combination of factors, including key enabling policies like the presence of strong institutional frameworks and advanced information and technological systems. Looking to the future, the biggest opportunities for these cities lie in the integration of shared-mobility services with mass transport modes, and the advancement of new technologies, such as mobile payments for multimodal trips. In the developing world, achieving integrated multimodal mobility hinges on the ability of cities to develop strong unifying transport authorities, as well as the political will and vision to move toward integration. The proliferation of such systems is a significant advancement for people-oriented, sustainable transport systems that help urban residents move safely and efficiently through their cities.
To create a high-quality integrated multimodal system, cities must achieve:
- infrastructure and operational integration of different transport modes connected physically as well as operationally with the mobility hubs.
- real-time information sharing and integrate fare for passengers with a MaaS.
In Europe the multimodal vision and the new paradigm have given excellent results in terms of modal split as shown in the Figure 14 enabling the operation of multimodal, quicker and more punctual, and reliable services with real-time travel information and more operational efficiency. But also, in Europe the results are not uniform, there are some resistant laggards.
A report of European Commission [60] on the quality of life in 83 European cities summarises the result of a survey of 60,000 people on the satisfaction with various aspects of urban life, such as jobs, public transport and pollution. Residents in larger cities tended to use cars less and public transport more. Overall, three quarters of city residents were satisfied with public transport. Satisfaction with the frequency of public transport had the biggest impact on overall satisfaction with public transport. People use more public transport, if they are satisfied with the services (Figure 15).
Public transport services have a big impact on the overall satisfaction with the city and explain half the variation in general satisfaction in Figure 16.
The distance to American cities remains, even if there have been interventions of new rail or BRT transport services in several cities. But the built environment enormously hinders the success of these interventions, even if associated with new transit-oriented development (TOD).
5. Accessible City
A novel approach to planning is promoting a significantly broadened array of urban objectives and methods, extending beyond mere economic efficiency. The enhanced objectives encompass aspects such as social unity and inclusiveness, the physical and mental well-being of humans, environmental sustainability and the improvement of biodiversity. The new approach aims primarily at improving accessibility instead of traffic and mobility. It is a new transport planning paradigm developed with “a vision of a city beyond mobility” [61].
The distinction is critical for a sustainable transport policy. Focusing on traffic means that road capacity and speed are beneficial, while congestion for inadequate roads is the problem. But this approach did not solve the problems and is self-defeating. Positive feedback and circular processes of induced traffic and the cumulative decline of public transport increase traffic and car dependence. Attention to mobility means efficient movement of people and goods. This is more effective than a focus on traffic can give freedom of modal choice and can accommodate more mobility with a reduction of time and cost. But the modern world no longer has mobility needs unless for exercises. In the Stone Age, human mobility was important for food procurement, but today mobility is seldom an end in itself. Even recreational travel usually has a destination. Mobility is mainly a derived demand to satisfy accessibility to services, employment, and markets. The ultimate goal is access (or accessibility), the quantity of the desired destinations, opportunities or amenities, that can reach in a given time.
The access is provided through three different systems (TAS) digital connectivity, the active transports (AT) with spatial proximity and the motorized multimodal transports (MT). This triple access interconnected system serves as the essential facilitators of economic and social activities. The approach is to question the present and pulls policy decisions based on an adaptable vision to assist in managing a future, with a great uncertainty starting from the weight of the three elements and their complementarities in satisfying accessibility. The plan must be flexible and resilient to uncertainty by considering different scenarios and how they could perform in future developments.
Digital technologies allow more socialising at a distance more sustainably. The new places for virtual socialising have become a major component of the popular culture. They dominate life today with infinite interactions. They facilitate relations with anyone in the world via text messages, photos, and videos, all exchanged instantly at minimal cost. They influence the lifestyle of young people, who can share their thoughts and feelings with their contemporaries instantly. This has created a fracture between the rapidity of virtual contact and the slowness of physical contact. The change that is occurring is less car, greater attraction of the neighbourhood, and virtual connections.
A first group of applications utilise the virtual connection for teaching, lectures, meetings, remote working, and many other services that provide certificates, forms, and books and eliminate travel for distant face-to-face activities and services.
A second group is B2C e-commerce, which brings a sharp reduction of trips for shopping and of distance travelled but increases goods transport for delivery.
The increasingly digital connectivity allows numerous activities to be accomplished digitally without a transport. The main ones are presented in the Table 2.
The gains in time have rebound effects confirmed by several studies [62,63,64]. Such effects are consistent with the broader evidence on the constancy of the time budget dedicated to travel in many different contexts – at slightly over one hour a day. Many studies have investigated the changes in travel of teleworkers.
They travel less often for work, but they tend to travel more for other reasons and in different period. For example, the US teleworkers take 10.8% more non-work trips per day than non-teleworkers and that these are, on average, 15.7% farther [65]. A study in Newark, New Jersey (USA), found that vehicle use has not diminished with the online shopping [66]. Studies from the US, Canada and England all find that teleworkers engage in more cycling and walking than non-teleworkers [67,68] but also find that they engage in more car travel [69]. They could take advantage of their free time to engage in more social activities, or such activities may substitute for the reduced social interaction in workplaces. A study on teleworkers used the data from the English National Travel Survey to estimate the impact of teleworking on the travel patterns of English households over the period 2005–2019. They found the results suggesting that teleworking has made little contribution to sustainable travel in England over the last 15 years [63].
But digital accessibility is not just avoiding travel but can improve the modal choice and the multimodal integration.
The AT provides access through spatial proximity, like the city of 15 minutes, that allows to access urban daily services and amenities within walkable and biking distance. The concept helps to reduce dependence on motorised transport and address the exclusion that brings for those who cannot use such modes. It is also a counter for dormitory peripheries continually raise residential densities without providing all the amenities that make a livable neighborhood. A 15-minute neighbourhoods avoid car dependency and isolation through a mix land use.
The MT provide access to the centres and institutions of the city and region, that cannot be at the level of neighborhoods.
This represents a shift in the land-use plan. Central business districts’ dominance is rebalanced in favor of a polycentric and multi-timed city [70]. Public spaces and amenities at various distances from homes, centred on mobility hubs based on public transport, mobility sharing and micromobility. Active transport gives residents access to daily amenities in their neighbourhoods (15 minutes). Urban roads ought to be designed not merely as efficient traffic flow channel, but as green versatile public spaces.
The main objectives need to be to:
- improve mobility impacts with active transport;
- end car dependence in urban transport;
- create more livable public spaces;
- foster responsible lifestyles and economies;
- ensure the health and well-being of everyone;
- encourage community cohesion.
The proposed methodology overcomes and integrates the traditional four-stage planning model based on zoning and movements between areas. It is no longer a question of predicting increasing mobility. The new policy paradigm is based on the backcasting approach of identifying preferable and sustainable futures [71]. Backcasting, through the participation of all interested parties, formulates a vision of the future, outlines the desirable scenario, and then proceeds backwards in time by identifying the interventions (policies and projects) needed to achieve it, ensuring its realization step by step. The new approach is vision-led “participate, decide, and provide”, after a desirable future has been formulated it focuses on how to get there. At its heart is deciding on a preferred future and providing a development path best suited to achieving it. The transport plan is evaluated in terms of access, not mobility, and is considered in parallel with the land-use plan. The zones of the four-step model are no longer considered as a generator or attractor of trips, but as the first level of access to daily needed services and activities. The cities and technologies adapted to human nature and the planning method are holistic and human-centric.
Research is contributing to a new planning paradigm by collecting and systematising the many ideas, instruments, and projects on accessibility for sustainable urban transport. Accessibility planning is a way to create a common vision for sustainable, equitable, and socially inclusive transport services and locations chosen because they can be reached by more sustainable transport.
A desirable scenario is a city structured by neighbourhoods with a certain degree of self-sufficiency, where internal travel favors active transport, such as the 15-minute city of Paris or the superblocks of Barcelona, and polycentric, based on a network of urban hubs with superior functions, connected by means of motorized transport systems in which priority is given to collective transport.
The emerging vision of a polycentric and multi-timed city is represented in Table 3.
The new steps proposed for a new paradigm for urban and transport planning based on accessibility is represented in Figure 17.
The first activity is a subdivision of the area in zones, with socio-economic, origin-destination (OD) and land-use (LU) data. The next activity is the classification of urban attractors in three levels, beginning with neighbourhoods (the lowest level), then sectors of the city, and, third, the city and beyond. The plan should also consider the peripheral and rural areas hit by the sprawl, generally with few far attractors and strongly dependent on cars.
The clusters of amenities of different attraction are classified in three levels as main centre, centres and neighbourhood centres This tendency of amenities to cluster is conform to the agglomeration effect of cities.
Figure 18 provides an example of a spatial distribution of urban attractors with mobility hubs distributed in an urban and suburban area. Mobility hubs are places where public transport connections and mobility services intersect, where MaaS can be located, as well as places where residences, amenities, offices, and healthcare facilities can be built.
Mobility Hubs offer a range of transport modes that are safe and convenient to switch between, easily accessible and well distributed. They encourage use of these alternative modes of transport, reducing the dependency on private cars.
Mobility as a Service (MaaS) integrates transport services and mobility solutions into a platform, allowing users to choose and access the best solution for their needs and destinations. Modern multimodal networks often leverage technology to provide re-al-time information to commuters. This includes mobile apps, digital signage, and other tools to inform users about schedules, delays, and alternative routes, and unified payments platform that integrate all services and is accepted by all operators.
Main centre represent the main attraction, that people will travel an hour to reach, such as major museums, concert venues, specialist shopping areas, or historic attractions [70]. Metro and BRT are optimal for this distance, and the attractions tend to be concentrated near major stations and mobility hubs.
The centres across the urban and metropolitan area contain hospitals, town halls, shopping centres, headquarters, swimming pools, or larger parks that require a catchment area of half an hour by motorized transport and may be visited more frequently than those in the centre. This polycentric city consists of a network of urban centres, small cities in the suburbs, and a regional system of TODs all linked by quality public transit radial and circumferential. This system creates new peripheral mobility hubs, strengthens the position of the main centre, due to the concentration of radials but without making it an obligatory passage point, and improves the accessibility of the entire area.
The neighbourhood centres provide people with daily amenities near their home no more than 15-minute walk on routes that are safe and easy to use. The nearer the destinations the more frequently they are visited. The aim is to reorganize physical space around walkable and cyclable neighbourhoods. A significant portion of all city trips can be completed within a 15-minute range by either walking or cycling, while leaving the rest farther away, mostly on motorized transport and constrained by the 1-hour budget time.
Spatial proximity analysis is designed to connect the needs of the users with the resources (neighbourhood services), taking into account pedestrian travel. The attributes of pedestrian routes are identified and categorized for each route through direct surveys and are weighted based on the user’s willingness/capacity to walk. The characteristics are sidewalk width, state of the pavement, presence of traffic lights, pedestrian crossings, speed limit, low traffic, presence of benches, presence of shaded green paths, low noise pollution.
City amenities, which are the communal goods and services within a city, significantly impact the living standards of city dwellers. These amenities encompass a variety of aspects such as parks, museums, libraries, high-standard schools, public transit, and safety services. They not only cater to the fundamental needs of city inhabitants but also enhance the appeal of a city to prospective residents, businesses, and investors. This list of daily amenities has been included in a research on 15-minute city [72]:
- Outside activities: parks, walks, picnics;
- Learning: schools, universities;
- Supplies: supermarkets, grocery stores;
- Eating: restaurants, bistros, cafes;
- Moving: bus stations, train stations, taxis;
- Cultural activities: museums, theatres, cinemas;
- Physical exercise: gyms, sports centres;
- Services: offices, banks, post office, town halls;
- Healthcare: hospitals, doctors, pharmacies.
Figure 19 shows accessibility to daily amenities in 15 minutes on foot in Rome and Paris. The colour of zones symbolizes the mean time it takes for a person to access everyday amenities by walking. Zones where this time is less than 15 minutes are depicted in blue. As the travel time increases, the colour transitions from blue to white, then to red, and finally to brown. The difference between the two cities is striking. Rome has satisfactory accessibility only around the city centre, while the periphery completely lacks daily amenities. Paris has a very diffused good accessibility. Figure 12 can explain the effects of these differences in terms of modal split. Rome and Paris are at the extreme of the figure. Rome has very few walking trips and many car trips compared with Paris.
Each zone’s 15-minute accessibility on foot can be used to form neighbourhoods based on a procedure of partitioning to create compact and balanced areas, of zones that can access the daily amenities less than 15 minutes away.
The gap analysis in Figure 17 will identify and assess the gap between current and desired accessibility levels to the attractors. The gaps will drive the actions with new amenities and transport services. The actions should be based on greatest accessibility and least mobility, with new land use through urban attractors and transport services.
A plan transforms the neighbourhood roads into a walkable/cyclable network, a self-sufficient area for daily needs with reduced speed limits (30 km/h). It reduces space allocated to car traffic, one 3-m lane, and limits maximum parking amount and having parking in each basement. Instead of minimum parking requirements, there will be maximum parking requirements and several communal garages on the outskirts. The remaining on-street parking should have time limitations and payments to favour public spaces for pedestrians with green areas, sitting spaces, and good landscape.
The plan improves sidewalks with furniture and trees, allows guerrilla gardening and parklets, and disallows curb cuts for driveways. It creates mobility hubs, where people can easily find and use different public transport and shared vehicles. By reducing the need for private cars, it improves travel quality and makes the surroundings more enjoyable.
The 15-minute city should be paired with a multimodal transport network connecting neighbourhoods to avoid the risks of worsening the social isolation of marginalized communities [62].
The inclusion of the local streets in the planning process is an important difference with respect to the traditional models of traffic where each zone is only a centroid connector to the network. This allows modelling the improvement of access to local amenities and the transit network by active transport with attention to density, mixed use, walkability, bikeability, and safety. Walking and biking links can be included in the transit network. The focus on active transport reduces the demand for motorized transport, with benefits for public health, congestion, transport costs, and space occupancy.
The urban requalification at Vauban, a peripheral quarter of Freiburg, is a good example [55]. Car owners who live on the parking-free blocks must park in one of the peripheral garages. The main roads, with a speed limit of 50 km/h, are located on the edge of the neighbourhood and some are crossed by a bus service, which also serves two tram stops (the red circles in the figure). All the others have a limit of 30 km/h and are designed according to the principle of selective permeability and fused grid. The objective is to limit transit and vehicular crossing of the neighbourhood, reducing the connectivity of internal roads open to traffic and increasing the connectivity of the active and public transport networks. Parking within the neighbourhood is permitted only for commercial vehicles serving the shops. The natural sedentary habits of humans can be exploited to reduce car dependence. The parking lots located mainly on the periphery of the neighbourhood, except those for the vehicles for of people with disabilities or for other essential purposes, and the mobility hubs are centrally located. The few residents who own a car, 170 out of every 1,000 residents, have parking spaces on the edge of the neighbourhood so as to prevent internal traffic and make the car less attractive.
The multi-timed city has to satisfy the accessibility to the superior amenities located in the main centre and in centres. The gap in accessibility is more difficult to resolve with new developments. These should thus be limited to a few important interventions. Improvements at the neighbourhood level should reduce both dependence on cars and the distances. The main street should be transformed to give priority to mass transit, reduce pollution, and improve safety. The transformation could begin from the most impactful or congested ones, whose capacity is extremely limited, and from those with less traffic.
For decades, transport planning has been primarily concerned with increasing the capacity of roads to accommodate growing automotive mobility. Years passed before research demonstrated theoretically and experimentally that this practice breeds circles and feedbacks with induced traffic. But the effect also works in reverse: the new road increases traffic, but its removal decreases it. London Transport and the Department for the Environment, Transport and the Regions (DETR) founded a study in the late 1990s to explain “the empirical evidence of the effects of reducing road capacity on traffic levels [56].” After a careful examination of dozens of road removal interventions, the study concluded that “measures that reduce or reallocate road capacity, when well designed and supported by strong reasons, must not be automatically rejected for fear that they will inevitably cause unacceptable congestion”. People are much more adaptable to changing conditions than the models represent, and the feared increase in congestion does not occur [57]. Traffic is not an incompressible hydraulic system. Reducing roads for car traffic leads to changes in destinations, a redistribution on the network, and a different distribution between modes of transport. Therefore, it is possible to improve the usability of urban spaces.
Transformations of urban streets from arteries for car traffic to green, pedestrian, cycle and collective transport routes are now taking place all over the world. In Seoul, between 2003 and 2005, the central urban highway, Cheonggye, was removed, an elevated road of about 6 km with 4 lanes over a river, with another 6 lanes at grade. Today the river has been redeveloped and has become a route equipped with greenery and public transport services. Even in the U.S. and Europe, many cities have removed major urban roads. In the U.S., the Embarcadero Freeway, an elevated road on the San Francisco seafront damaged by the 1989 earthquake, was demolished and replaced by a pedestrian path. Examples in Europe are the Georges Pompidou in Paris and the M-30 in Madrid. In Italy part of the Naples seafront was pedestrianized as was partially Rome’s monumental Via dei Fori Imperiali. In Rome, the idea is to join the central archaeological area with the Circus Maximus and the Baths of Caracalla to reconstitute an enormous continuous archaeological park.
The 15-minute city, environmental islands, and 30 km/h speed limits can be important tools for transforming the urban road network. Reducing speed increases safety and reduces noise and the space needed for cars to the benefit of pavements, squares, cycle paths, and green spaces. In Europe hundreds of cities of all sizes have now adopted policies of this nature.
In the transformation of roads, an important role must be attributed to the development of BRT (Bus Rapid Transit). Started in Curitiba, Brazil, in 1974, it has spread throughout the world in competition with traditional metros thanks to costs, capacity, and popularity with users.
The degree of popularity of BRT compared to metro is much superior, because of the equivalent speed, bigger frequencies and easy access. The success of BRT around the world is confirmed by the number of new developments [58], rapidly equaling the number of metros in the world. The development of electric buses should give a further boost to BRT.
Sprawl areas can be reintegrated with urban centres and subcentres through the implementation of Transit-Oriented Development (TOD), which is characterized by high density, multiple uses into one space, high-quality mobility hubs with public transit services (such as BRT systems, underground trains, etc.), and streets designed to promote walking and cycling and to reduce dependence on cars [59]. These developments establish a network within less dense and more scattered urban areas, linking entire urban cores with both rural and urban regions, as illustrated in Figure 23. The network supports Transit-Oriented Development principles, promoting mixed-use developments around mobility hubs. This promotes a more compact and walkable urban environment, reducing the need for extensive car use. The functions of TOD’s can be mainly complementary and less competing, providing different specializations.
A circular diagram with feedbacks represents the new paradigm as a virtuous circle from the 15-minute access neighbourhood to the development of TOD, the reduction of the impacts, and the rebound of public transport.
However, the road to accepting and putting into practice this new paradigm is still long. A recent review of SUMP from eight European countries showed that only the concept of spatial proximity seems well understood [75]. The lack of collaboration between institutions and department often limits the integration with big financial uncertainties and SUMP document plan subject to norms and rules defined independently in the land-use plan.
The Italian SUMP’s have all these problems, but they emerge from the rest for their dominant reliance on transport planning based on 4 stage models, which have difficulties in dealing with spatial proximity, digital accessibility and uncertainty.
6. Conclusioni
Two consolidated visions for urban transport were presented: automobility and multimodality. The first dominates North American cities, the second European ones. the unsustainability of the automobile and its success was examined. The North American vision was successful due to the weakness of the urban fabric and the rapidly expanding built environment. The few resistances in some cities were immediately overthrown by strong coalitions of interests. In Europe the city has resisted much better precisely by virtue of the strength of the urban fabric, and despite a notable growth in individual transport, a multimodal vision has been maintained.
The sustainable vision is represented by the accessibility city in the Triple Access System (TAS) version which, however, still has a long way to go to be accepted and applied. Some positive signals are limited to spatial proximity and active transport, multimodality with mobility hubs and MaaS and sharing. Digital accessibility is still left to laisser faire with questionable results due to the presence of rebound effects. Little attention in the Plans is still paid to uncertainty about the future. On the other hand, decision makers do not look favorably on uncertainty in planning, since they prefer to give an image of certainty and decisiveness.
Automobile cities have enormous difficulties in moving towards the TAS vision, but they are also trying in cities like Los Angeles, where they have intervened with mass transit, metro and BRT, and have tried to create zones of spatial proximity with TOD's.
To implement the accessibility city, it is fundamental to attract many researchers, practitioners, and policymakers through knowledge improvements to increase acceptance of the new paradigm and to limit the field of existing planning practices, such as 4-stage transport models that cannot manage spatial proximity and uncertainty. There is still a need to improve the knowledge on digital accessibility measures and on the uncertainty in planning. The holistic vision needs institutional and policy integration to share policy objectives and to plan across departments and organisations.
Funding
This research received no external funding.
Conflicts of Interest
The authors declare no conflict of interest.
References
- United Nations, Department of Economic and Social Affairs, Population Division. World Urbanization Prospects 2018: Highlights (ST/ESA/SER.A/421).
- Leon, D. A. Cities, urbanization and health. Int. J. Epidemiol. 2008 Feb. Vol. 37(1) pp. 4-8.
- Patterson, R.; Panter, J.; Vamos, E. P.; Cummins, S.; Millett, C.; Laverty, A. A. Associations between commute mode and cardiovascular disease, cancer, and all-cause mortality, and cancer incidence, using linked census data over 25 years in England and Wales: A cohort study. Lancet Planet Health 2020, Vol. 4, pp.186 – 194. [CrossRef]
- Sverdlik, A. Ill-health and poverty: a literature review on health in informal settlements. Environ. Urbanization 2011, Vol. 23, pp. 123–155. [CrossRef]
- Hajat, S.; Kovats, R. S.; Lachowycz, K. Heat-related and cold-related deaths in England and Wales: who is at risk? Occup. Environ. Med. 2007, Vol. 64, pp. 93–100.
- Heaviside, C.; Macintyre, H.; Vardoulakis, S. The Urban Heat Island: implications for health in a changing environment. Curr. Environ. Health Rep. 2017, Vol. 4, pp. 296–305. [CrossRef]
- Vardoulakis, S.; Dear, K.; Hajat, S.; Heaviside, C.; Eggen, B.; McMichael, A. J. Comparative assessment of the effects of climate change on heat and cold related mortality in the UK and Australia. Environ. Health Perspect. 2014, Vol. 122, pp. 1285–1292.
- WHO Ambient Air Quality Database (update 2023). Version 6.0. Geneva, World Health Organization.
- Pope, C. A.; Ezzati, M.; Dockery, D. W. Fine-particulate air pollution and life expectancy in the United States. N. Engl. J. Med. 2009, Vol. 360, pp. 376–386. [CrossRef]
- Gauderman, W. J.; Urman, R.; Avol, E.; Berhane, K.; McConnell, R.; Rappaport, E.; Chang R.; Lurmann F.; Gilliland, F. Association of improved air quality with lung development in children. N. Engl. J. Med. 2015, Vol. 372, pp. 905–913. [CrossRef]
- Liu, C.; Chen, R.; Sera, F.; Vicedo-Cabrera, A. M.; Guo, Y.; Tong, S.; Coelho M. S.Z.S, Saldiva P. H.N., et al. (2019) Ambient particulate air pollution and daily mortality in 652 cities. N. Engl. J. Med. 381, 705–715. [CrossRef]
- Bouazza, N.; Foissac, F.; Urien, S.; Guedj R.; Carbajal R.; Tréluyer J.-M.; Chappuy H. (2018). Fine particulate pollution and asthma exacerbations. Arch. Dis. Childhood 2018, Vol. 103, pages 828–831. [CrossRef]
- Kuhn, Thomas S. (2012). The Structure of Scientific Revolutions, with an introductory essay by Ian Hacking. Fourth Edition. Chicago: The University of Chicago Press.
- Mitchell, R. B., Rapkin, C., 1954. Urban traffic: A function of land use. Columbia University Press, New York.
- Ben Bouanah, J., Stein, M. M. (1978). Urban transport models: A generalized process for international application. Traffic Quarterly 32, 449–470.
- Downs, A. (1992). Stuck in Traffic: Coping with Peak-Hour Traffic Congestion. Washington d.c.: Brookings Institution Press.
- Litman, T. (2023). Toward More Comprehensive and Multi-modal Transport Evaluation, Victoria Transport Policy Institute.
- Cervero, R. (1997). Paradigm shift: from automobility to accessibility planning. Urban Futures, 22(6), 9-20.
- Banister, D. (2008). The Sustainable Mobility Paradigm. Transport Policy, V. 15, Issue 2, Pages 73-80. [CrossRef]
- Filippi, F. (2022). A Paradigm Shift for a Transition to Sustainable Urban Transport Sustainability 14, no. 5: 2853. [CrossRef]
- Lyons G., Davidson C. (2016). Guidance for transport planning and policymaking in the face of an uncertain future. Transportation Research Part A. 88 (2016) 104–116. [CrossRef]
- Goodwin, P. (2020). "Trends in Car Use, Travel Demand and Policy Thinking," International Transport Forum Discussion Papers 2020/27, OECD Publishing.
- Nieuwenhuijsen M. J., Khreis H. (2016) Car free cities: Pathway to healthy urban living. Environment International 94, 251–262. [CrossRef]
- Urry, J. (2016). What is the future? Polity Press.
- Jones, P. (2014). The evolution of urban mobility: The interplay of academic and policy perspectives. International Association of Traffic and Safety Sciences Research 38, 7–13. [CrossRef]
- Dalkmann, H., & Sakamoto, K. (2011). Transport: investing in energy and resource efficiency. green economy report. UNEP. UITP, 2006.
- Andor, M. A.; Gerster, A.; Gillingham, K. T.; Horvath, M. Running a Car costs much more than people think—stalling the uptake of green travel. Nature 2020, Vol. 580, page 453–455. [CrossRef]
- Gössling, S.; Kees, J.; Litman, T. The lifetime cost of driving a car. Ecological Economics, 2022, Vol. 194. [CrossRef]
- Moody, J.; Farr, E.; Papagelis, M.; Keith, D. R. The value of car ownership and use in the United States D. R. Nat. Sustain. 2021.
- Kahneman, D. (2011). Thinking, fast and slow. Farrar, Straus and Giroux New York.
- Van Vugt, M.; De Vries, L. P.; Li, N. P. Nudging Evolutionary Mismatched Behaviors: Implications for Social Psychology and Public Policy. Forthcoming in: Forgas, J.P., Fiedler, K., Crano, W. D., Sydney Symposium of Social Psychology 2019.
- Giphart, R.; van Vugt, M. Mismatch: How Our Stone Age Brain Deceives Us Every Day and What We Can Do about It. London 2018, Little Brown Book Group.
- Kelly, R. L. The Fifth Beginning. What Six Million Years of Human History Can Tell us About Our Future. Berkeley: University of California Press 2016.
- Speakman, J. R. An Evolutionary Perspective on Sedentary Behavior. BioEssays 2019, Wiley Online Library: Hoboken, NJ. [CrossRef]
- Sbarra, D.; Briskin, J.; Slatcher, R. B. Smartphones and Close Relationships: The Case for an Evolutionary Mismatch. Perspectives in Psychological Science 2019, Vol. 14, Issue 4. [CrossRef]
- Shaw, J. Born to rest, Harvard Magazine 2016.
- Le Corbusier (1987) City of Tomorrow and Its Planning. New York: Dover Publications, p. 190.
- Norton, P. (2021) Autonorama: The Illusory Promise of High-Tech Driving. Island Press.
- Walker, I.; Tapp, A.; Davis, A. (2023). Motornormativity: How Social Norms Hide a Major Public Health Hazard. International Journal of Environment and Health, Vol.11, Issue: 1, Pages: 21 - 33.
- Leon, D. A. Cities, urbanization and health. Int. J. Epidemiol. 2008 Feb. Vol. 37(1) pp. 4-8.
- WHO Global Health Estimates: Deaths by cause, age, sex by country and by region, 2000–2016, World Health Organisation 2018.
- Mogridge, M. J. H. (1997) The self-defeating nature of urban road capacity policy. A review of theories, disputes and available evidence. Transport Policy, Vol. 4, No. I, pp. 5-23. [CrossRef]
- Cervero, R. (2006). Road Expansion, Urban Growth, and Induced Travel: A Path Analysis. In Dialogues in Urban and Regional Planning, edited by B. Bruce Stiftel, V. Watson, and H. Acselrad, 310–343. New York: Routledge.
- Forrester, J.W. (1971). Counterintuitive Behavior of Social Systems. Technol. Rev. 73, 52–68. Available online: http://www.virtualadjacency.com/wp-content/uploads/2008/01/42c-MIT-Prof-Forrester-Counterintuitive-Behavior-of-Social-Systems-TechRvw-Jan-1971.pdf (accessed on 11 January 2022).
- Plane, D.A. (1986). Urban transportation: Policy alternatives. In The Geography of Urban Transportation; Hanson, S., Ed.; Guilford Press: London, UK,; pp. 386–414.
- Newman, P., & Kenworthy, J. (1989b). Cities and Automobile Dependence: An International Sourcebook. Gower Technical.
- Newman, P., & Kenworthy J. (2015). The End of Automobile Dependence: How Cities Are Moving beyond Car-Based Planning. Island Press.
- Newman, P. and Kenworthy, J. (2021) Gasoline Consumption and Cities Revisited: What Have We Learnt? Current Urban Studies, 9, 532-553. [CrossRef]
- Levine, J., Grengs, J., Shen, Q., Shen, Q. (2012). Does accessibility require density or speed? A comparison of fast versus close in getting where you want to go in US metropolitan regions. J. Am. Plann. Assoc. 78 (2), 157–172.
- Filippi, F., Papola, N. (1995). Effectiveness of New Road Investments in Metropolitan Areas. WIT Transactions on The Built Environment.
- Schaeffer, K. H., tSclar E. (1975). Access for All: Transportation and Urban Growth.Penguin Books, - Political Science. [CrossRef]
- Fielbaum, A., Jara-Diaz, S., Gschwender, A. (2020) Beyond the Mohring effect: Scale economies induced by transit lines structures design, Economics of Transportation, Volume 22. [CrossRef]
- Anderson, M. L. (2014) Subways, Strikes, and Slowdowns: The Impacts of Public Transit on Traffic Congestion. The American Economic Review. Vol. 104, No. 9, pp. 2763-2796. [CrossRef]
- Nguyen-Phuoc, D. Q., Young W., Currie G., De Gruyte C. (2020) Traffic congestion relief associated with public transport: state-of-the-art. Public Transport. [CrossRef]
- Goodwin, P., Van Dender K. (2013). Peak Car’ — Themes and Issues. Transport Review. Vol. 33, 243-254.
- Goodwin, P. (2019) Main trends in car use, travel demand and policy thinking on how to deal with uncertainties. In Proceedings of the International Transport Forum: ITF Round Table on Zero Car Growth? Managing Urban Traffic, Paris, France, 16–17.
- Rérat, P. A (2018) decline in youth licensing: A simple delay or the decreasing popularity of automobility? Appl. Mobilities, 6, 71–91.
- Guidelines for Developing and Implementing a Sustainable Urban Mobility Plan, Rupprecht Consult (ed.) 2019, 2nd ed.
- EPOMM. (2018). Managing mobility for a better future. Retrieved October 12, 2018, from http://www.epomm.eu.
- European Commission (2023). Report on the Quality of Life in European Cities-.
- Bertolini L. (2023) The next 30 years: planning cities beyond mobility? European Planning Studies. [CrossRef]
- Coroamă, V. C., Mattern F. (2019). Digital Rebound - Why Digitalization Will not Redeem us our Environmental Sins. Environmental Science, Economics.
- Caldarola, B., Sorrell S. (2022). Do teleworkers travel less? Evidence from the English National Travel Survey. Transportation Research Part A 159 282–303. [CrossRef]
- Gossart, C. (2015). Rebound Effects and ICT: A Review of the Literature. In: Hilty, L., Aebischer, B. (eds) ICT Innovations for Sustainability. Advances in Intelligent Systems and Computing, vol 310. Springer, Cham. [CrossRef]
- Zhu, P. (2012). "Are Telecommuting and Personal Travel Complements or Substitutes?". Annals of Regional Science, 48(2), 619-639. [CrossRef]
- Laghaei, J., Faghri A., Li M. (2016). Impacts of home shopping on vehicle operations and greenhouse gas emissions: multi-year regional study, International Journal of Sustainable Development & World Ecology, 23:5, 381-391. [CrossRef]
- Chakrabarti, S. (2018). Does telecommuting promote sustainable travel and physical activity? Journal of Transport & Health. Vol. 9, 19-33.
- Lachapelle, U., Tanguay, G., Neumark-Gaudet, L. (2018). Telecommuting and sustainable travel: reduction of overall travel time, increases in non-motorised travel and con-gestion relief? Urban Stud. 55 (10), 2226–2244. [CrossRef]
- de Abreu e Silva, J., Melo, P. C. (2018). Does home-based telework reduce household total travel? A path analysis using single and two worker British households," Journal of Transport Geography, Elsevier, vol. 73 (C), 148-162. [CrossRef]
- Kurland, E. (2022). Thinking beyond 15 minutes: a new perspective on space, time and travel. TransportXtra.https://www.transportxtra.com/publications/evolution/news/72383/thinking-beyond-15-minutes-a-new-perspective-on-space-time-and-travel/.
- Bibri, S. E. (2018). Backcasting in futures studies: a synthesized scholarly and planning approach to strategic smart sustainable city development. European Journal of Futures Research, 6, 13. [CrossRef]
- Sony CLS. The 15 Minutes City. https://csl.sony.it/project/the-15-minutes-city/.
- Abbiasov, T.; Heine, C.; Glaeser, E. L.; Ratti, C.; Sabouri, S.; Salazar M. A.; Santi, P. The 15-Minute City Quantified Using Mobility Data (December 2022). NBER Working Paper No. w30752.
- Pojani, D.; Stead, D. Past, present and future of transit-oriented development in three European Capital City-Regions. Advances in Transport Policy and Planning 2018, 1, 93–118.
- Rye T., Lyons G., Svensson T., Lenferink S., Mladenovič L., Piras F., Witzell J. (2024). Uncertainty and Triple Access Planning in European Sustainable Urban Mobility Plans: a long way to go yet? Transportation Planning and Technology. [CrossRef]
Figure 1.
Visions and patterns of urban transport. Source: [26].
Figure 1.
Visions and patterns of urban transport. Source: [26].
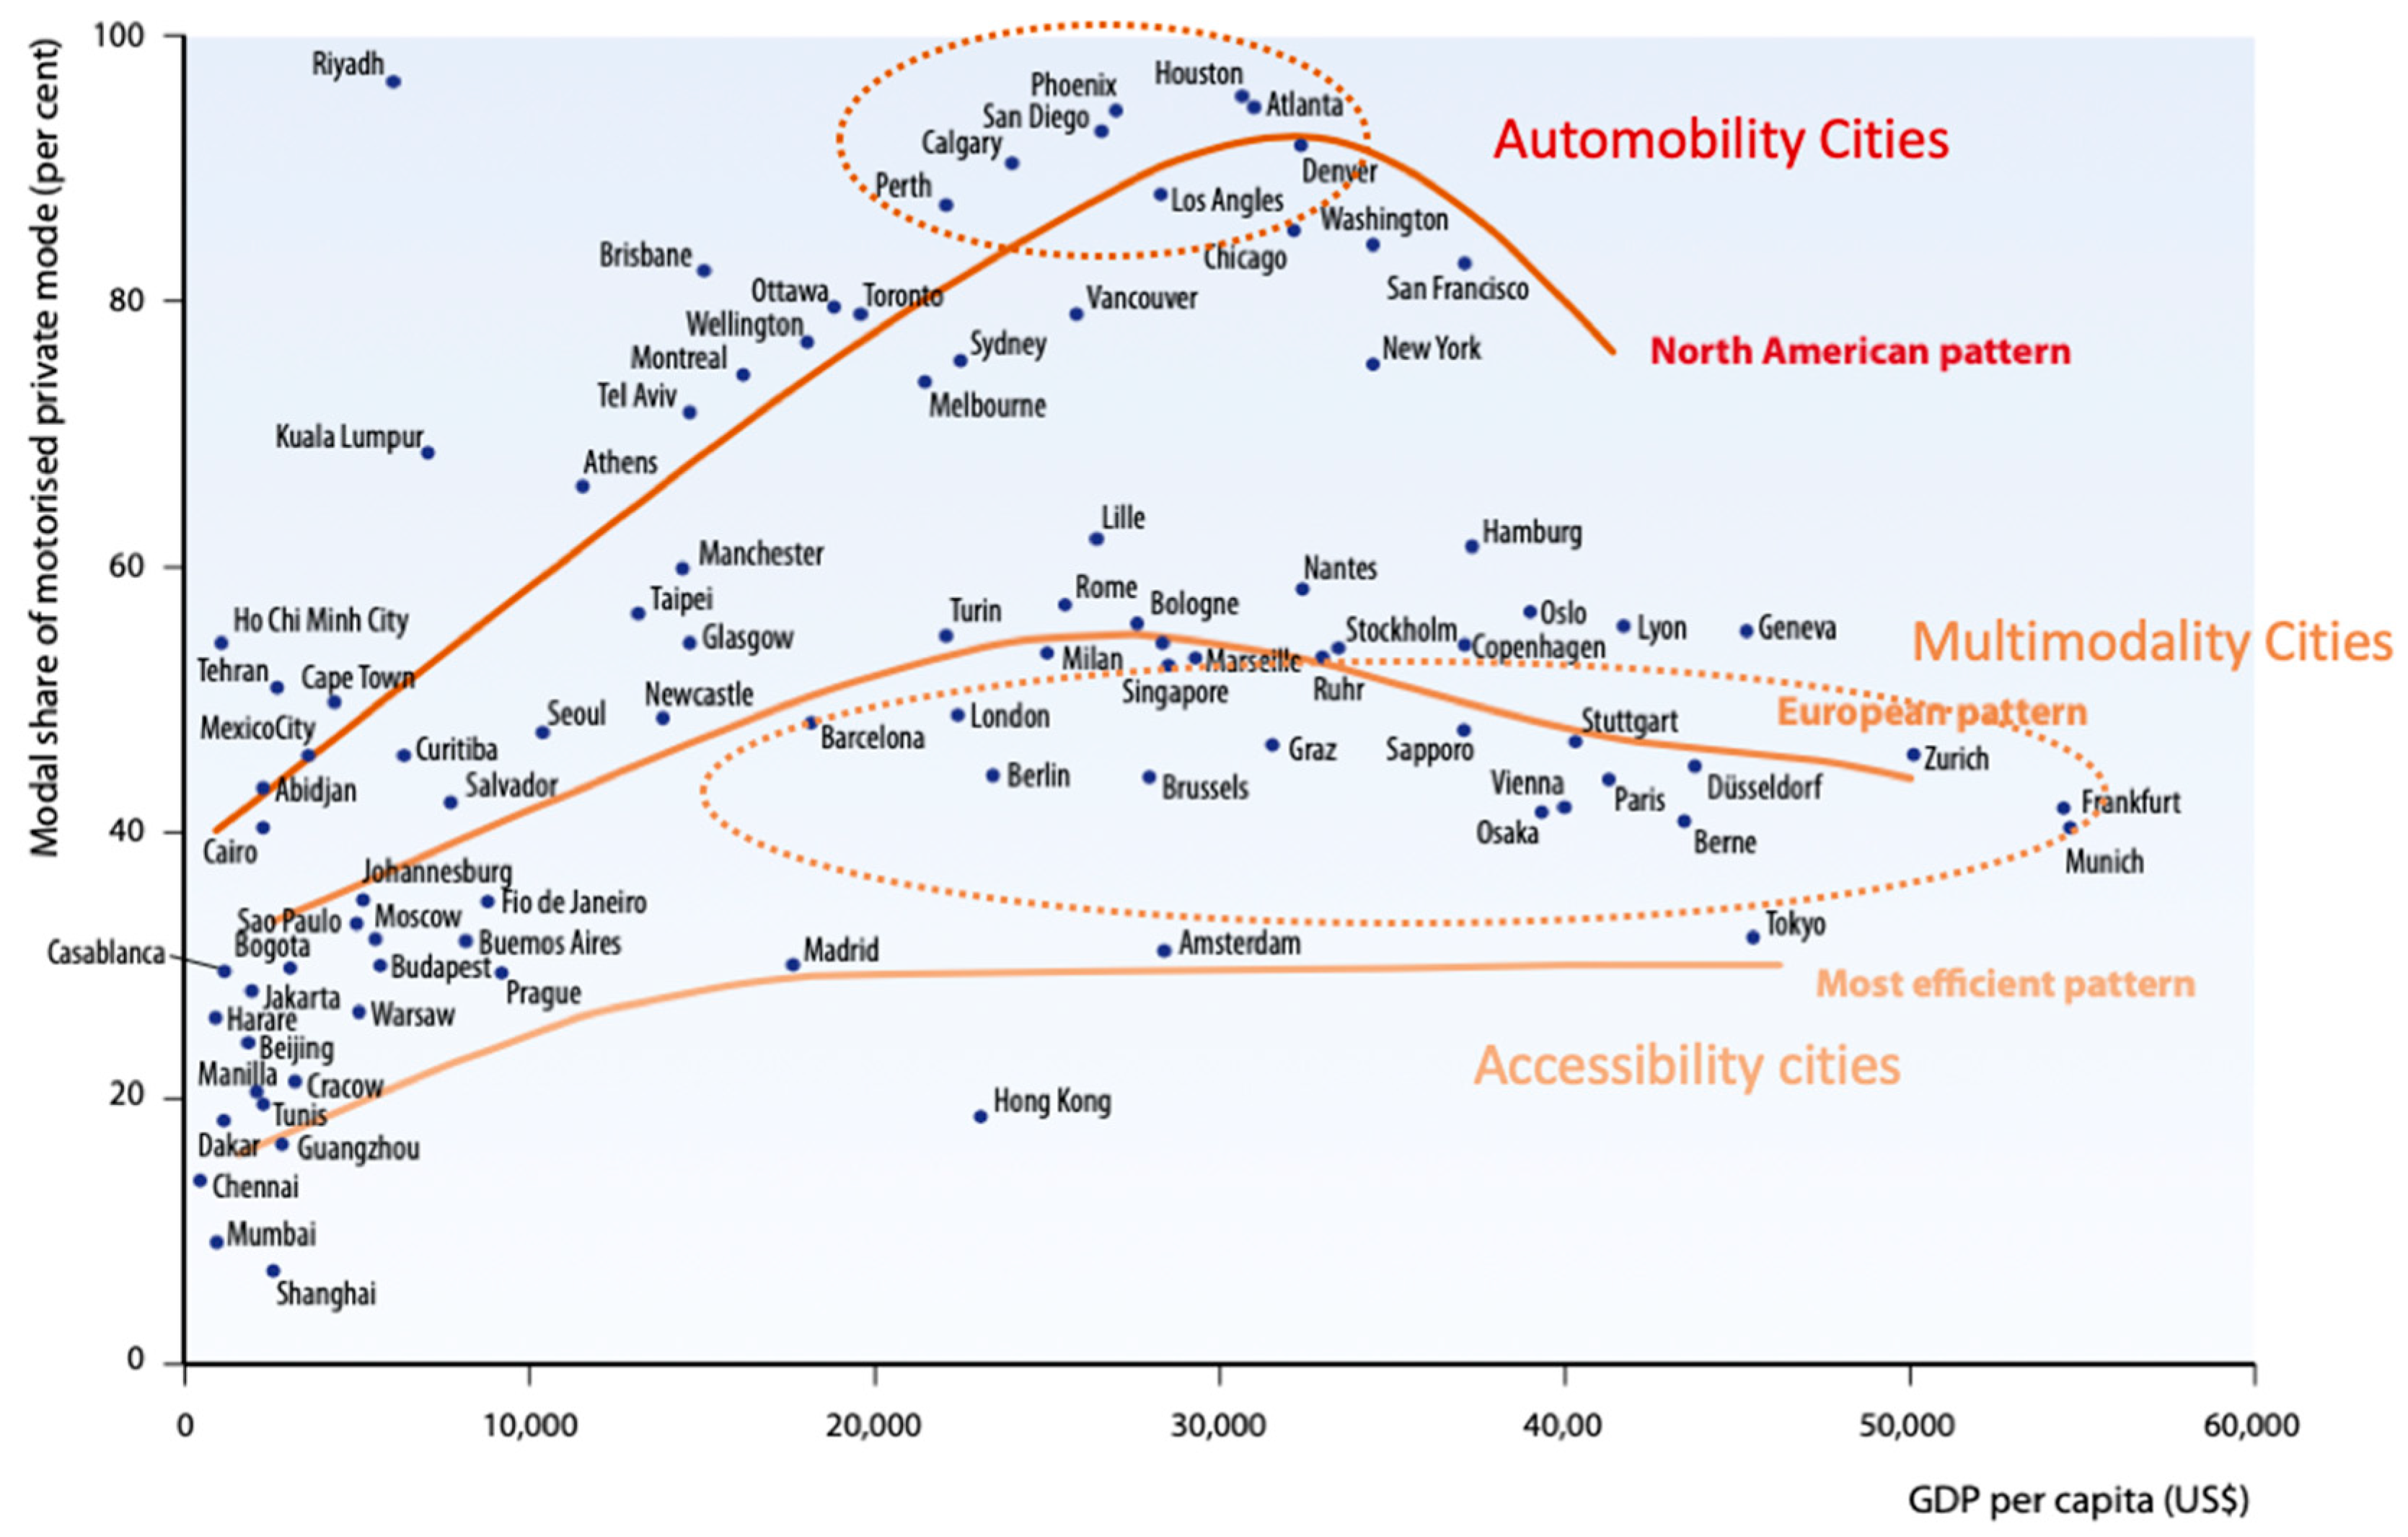
Figure 2.
The evolutionary mismatch of the automobile.
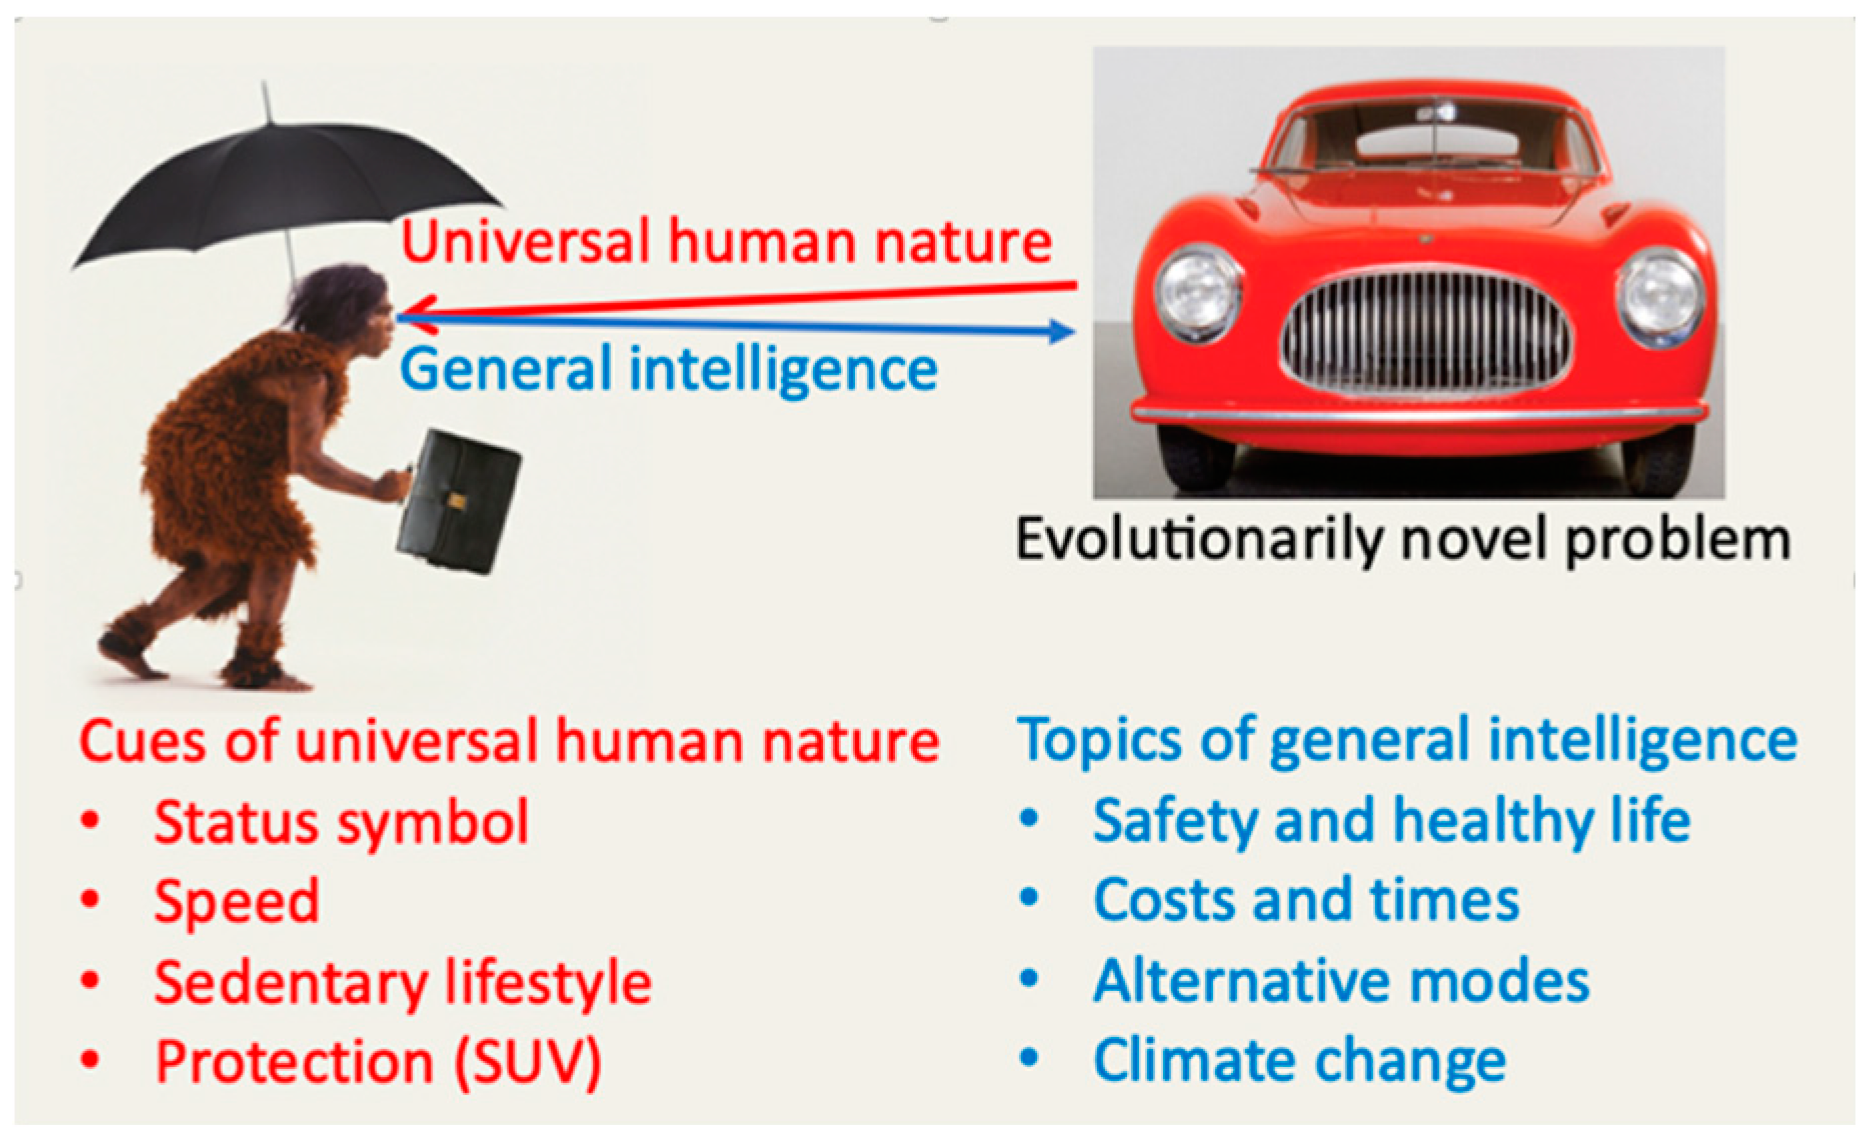
Figure 3.
Public health problems as a consequence of mismatch. Source: Inspired by [35].
Figure 3.
Public health problems as a consequence of mismatch. Source: Inspired by [35].
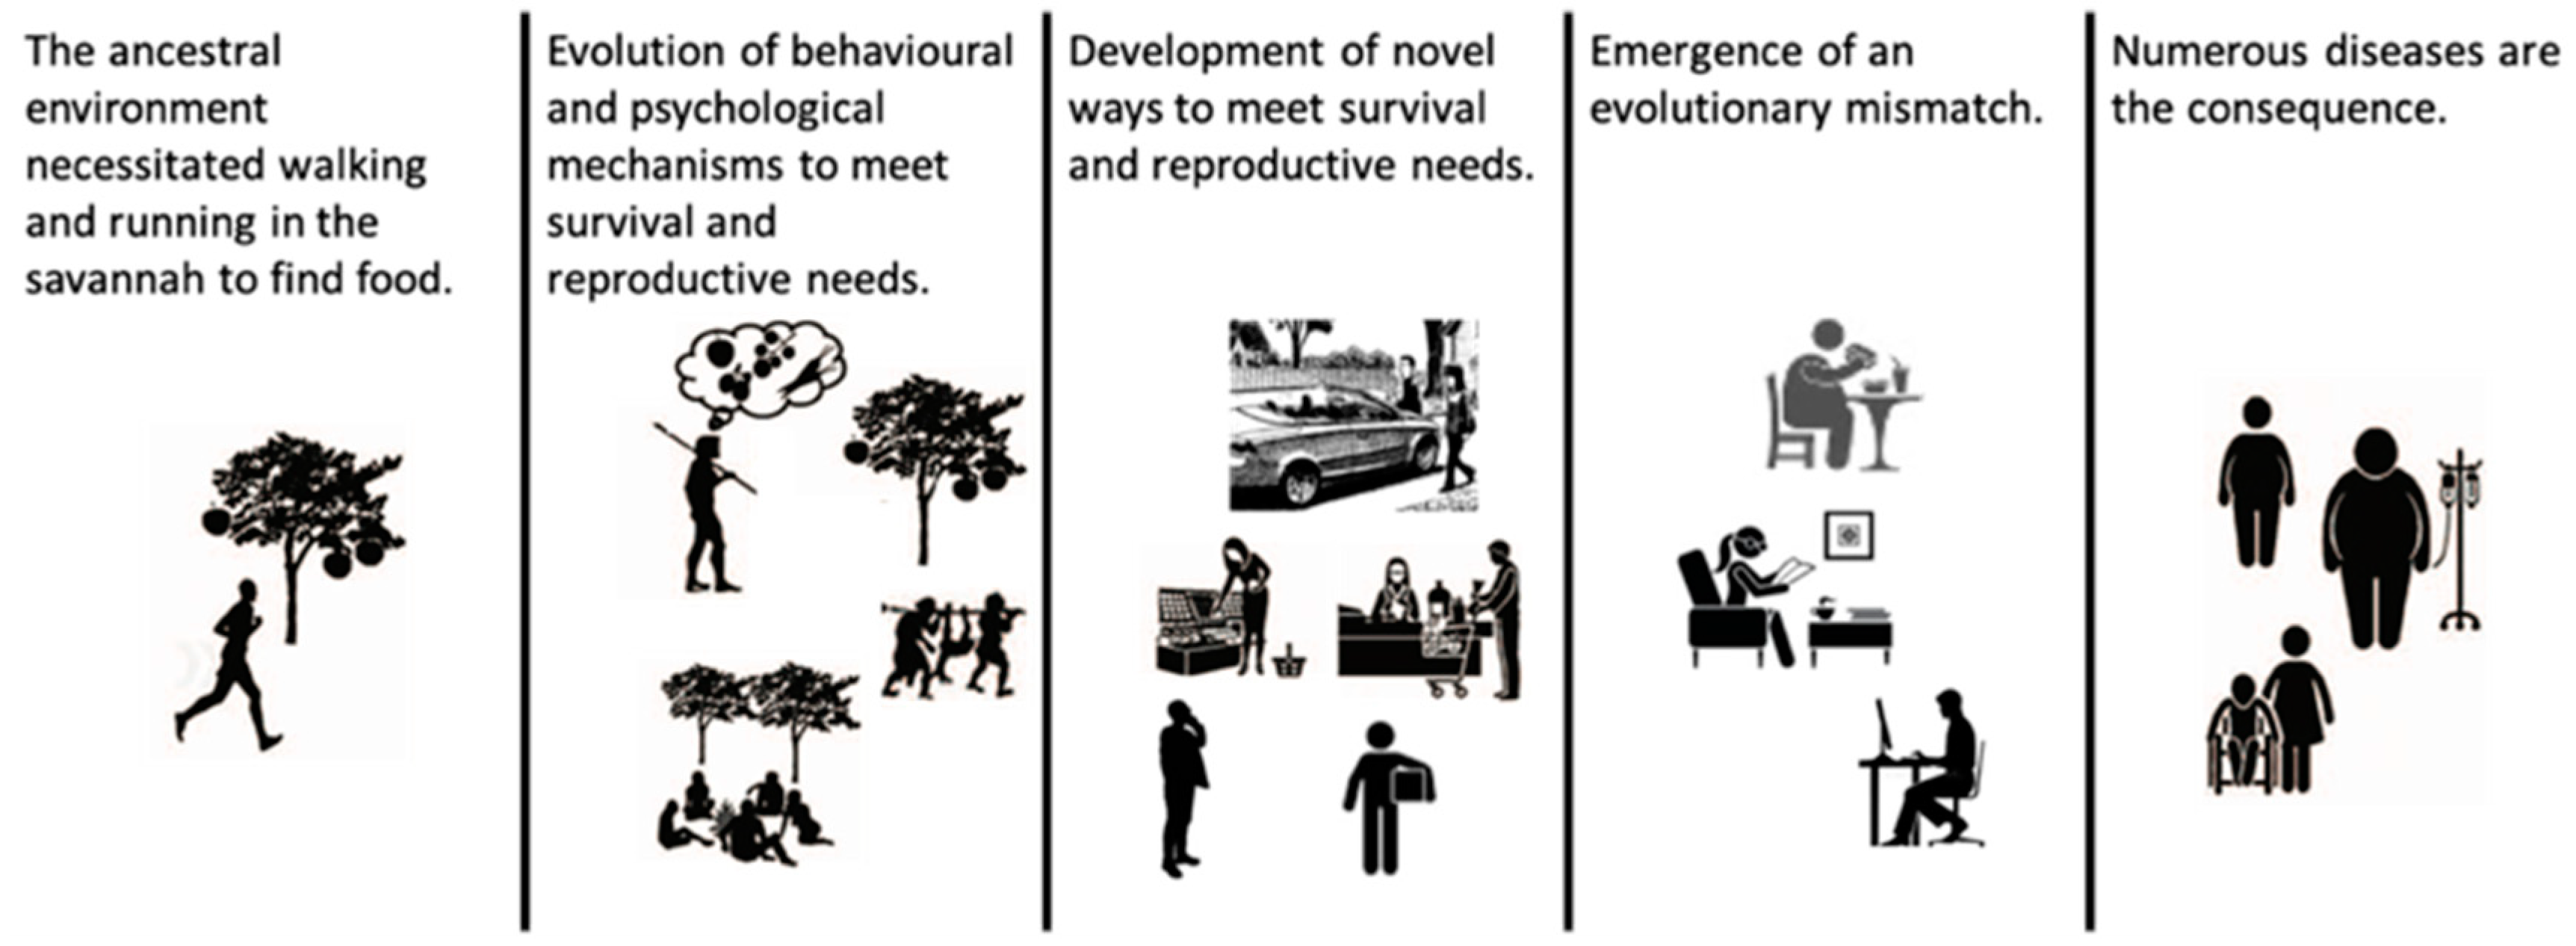
Figure 4.
Let’s be compassionate about people’s natural instinct. Source: [36].
Figure 4.
Let’s be compassionate about people’s natural instinct. Source: [36].
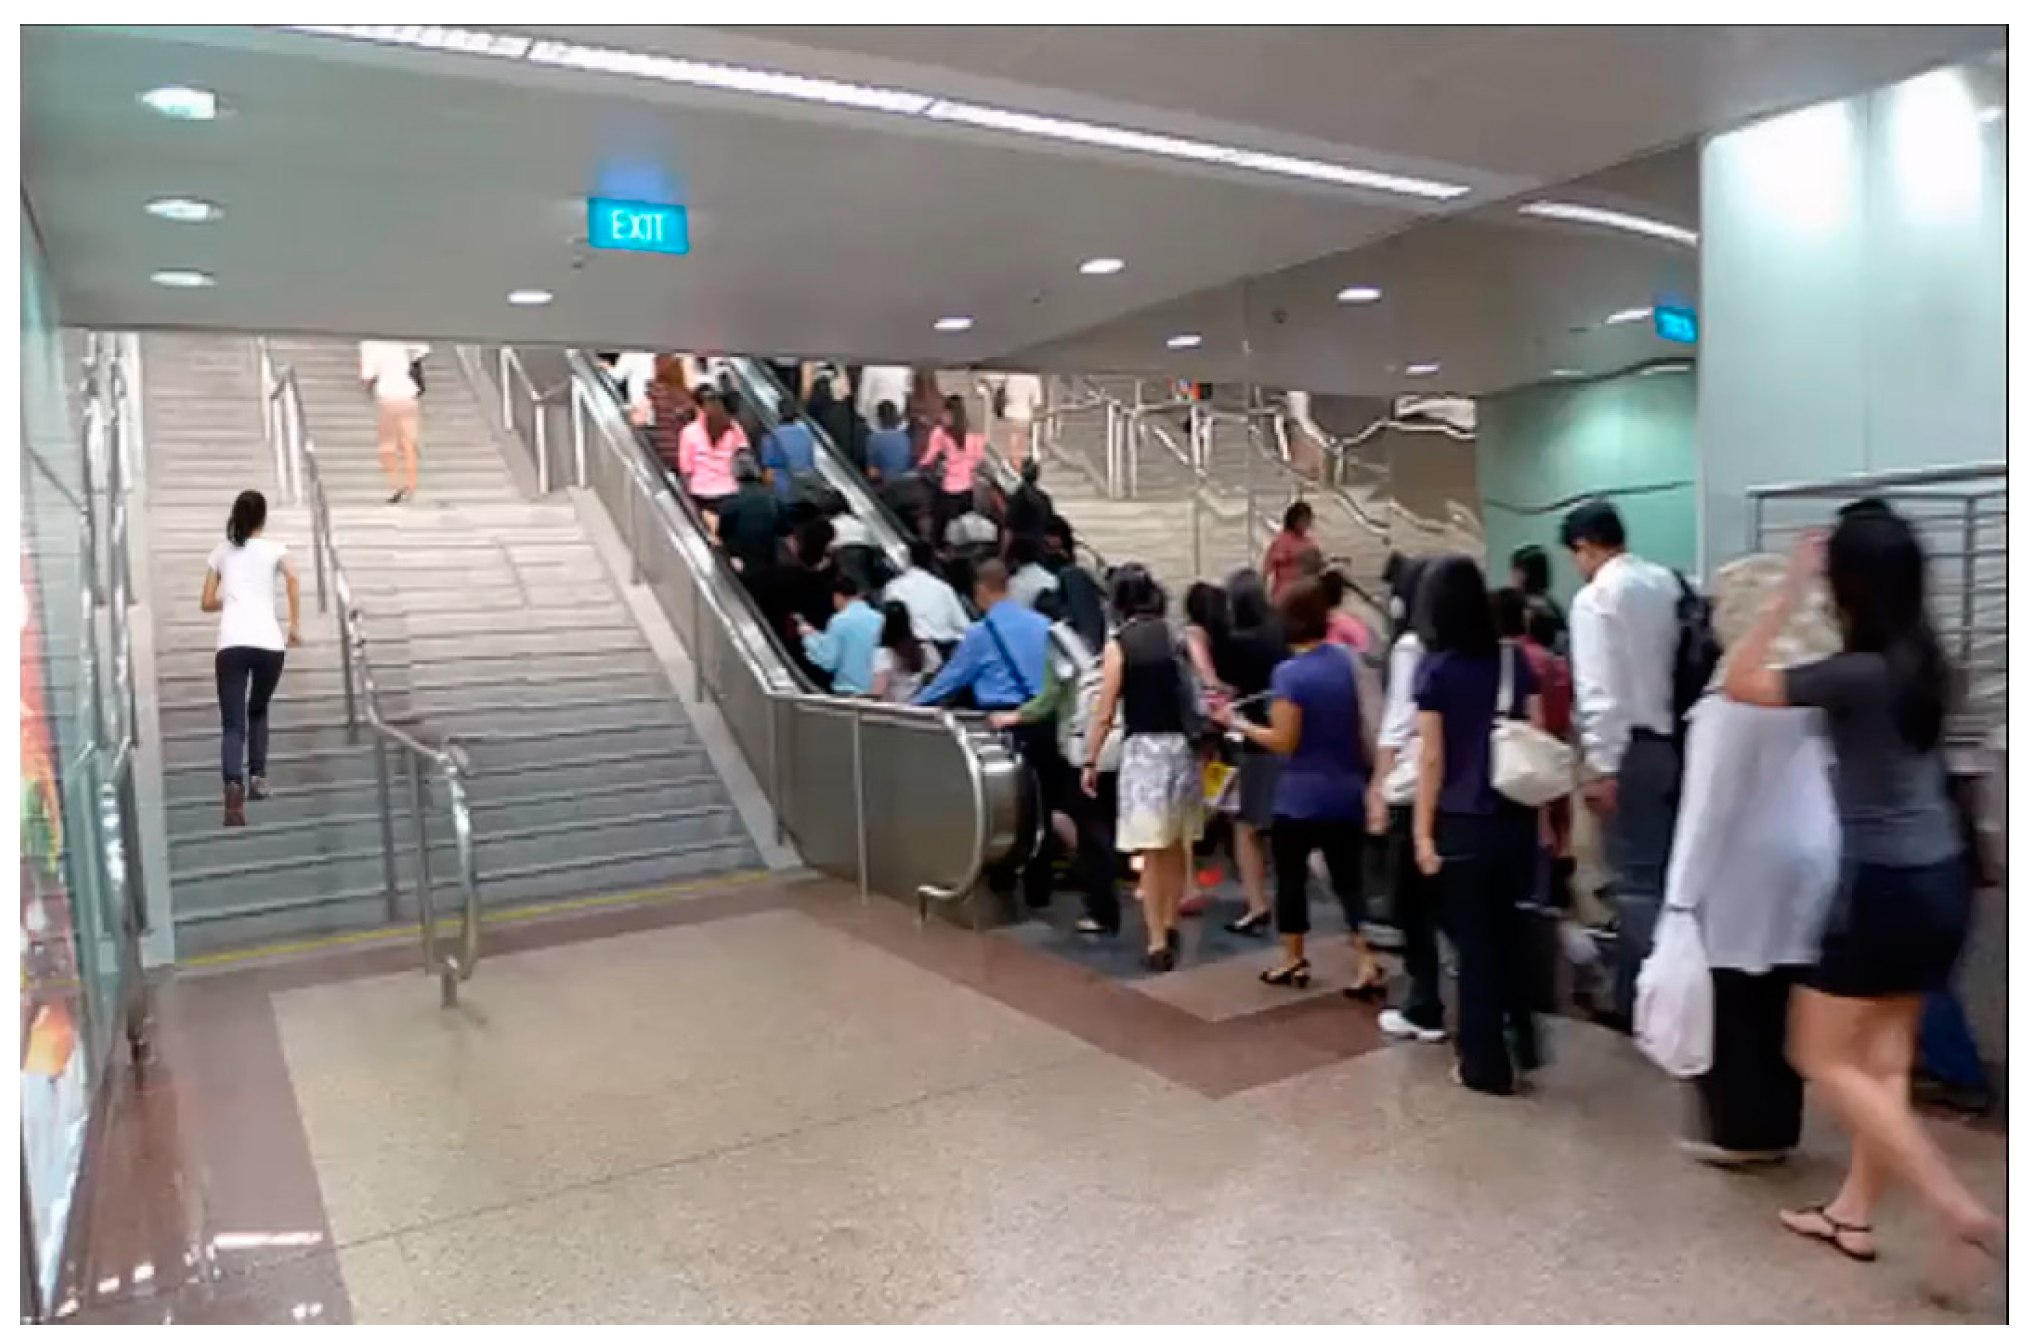
Figure 5.
An idealised edge city (Bing image creator).
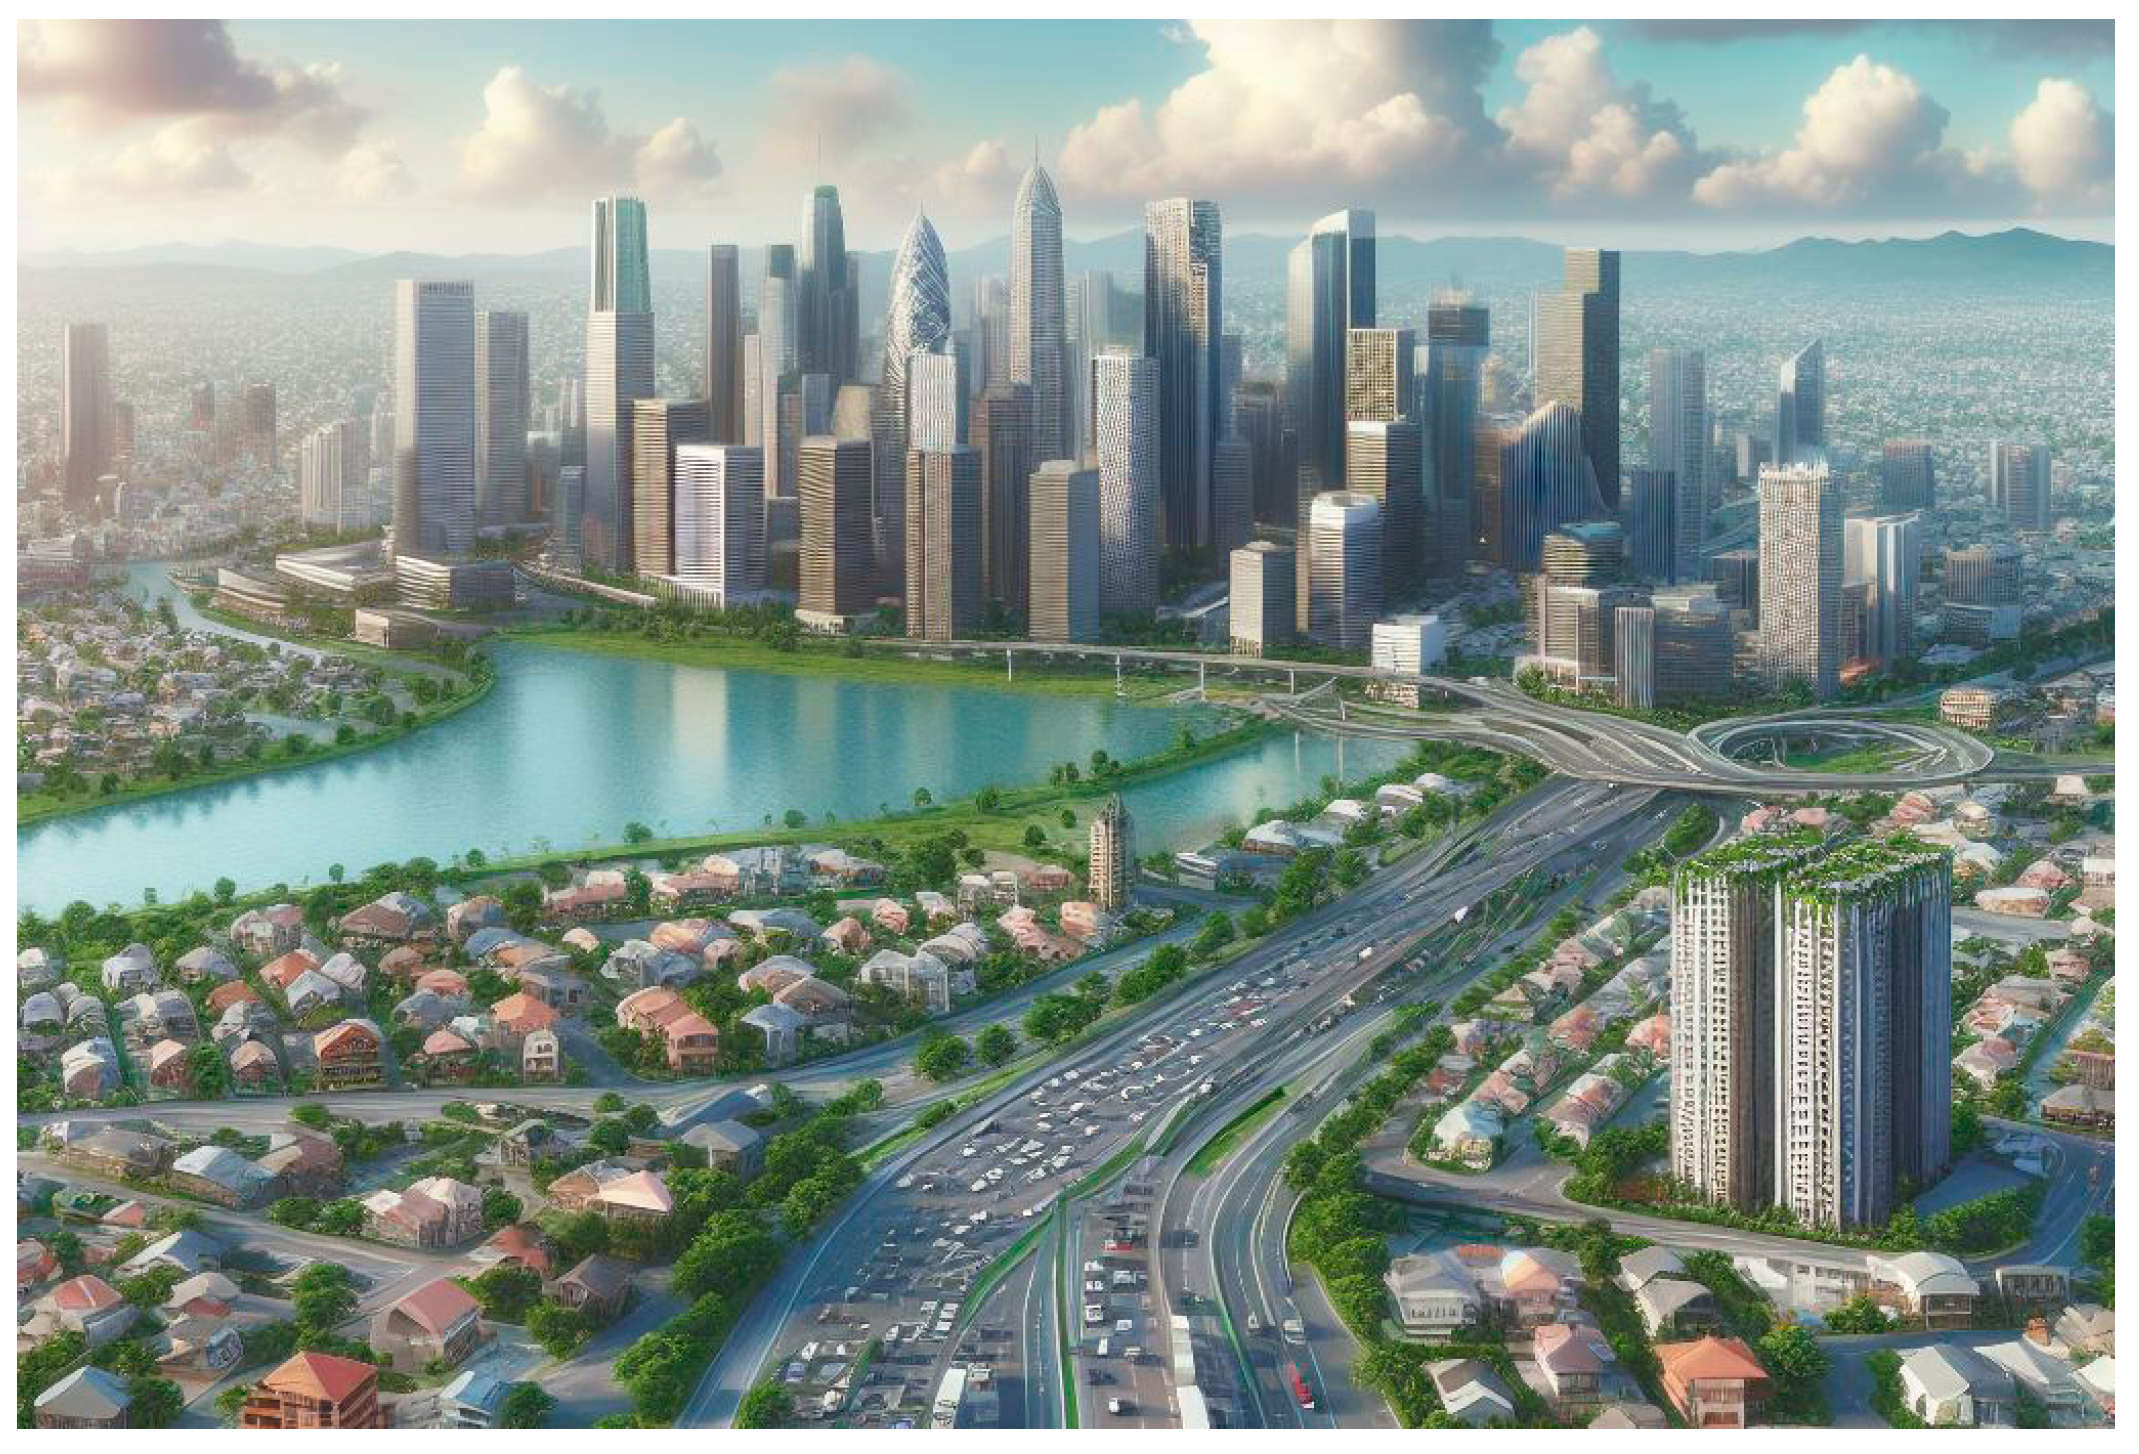
Figure 6.
The modern vision of an automotive city (Bing image creator).
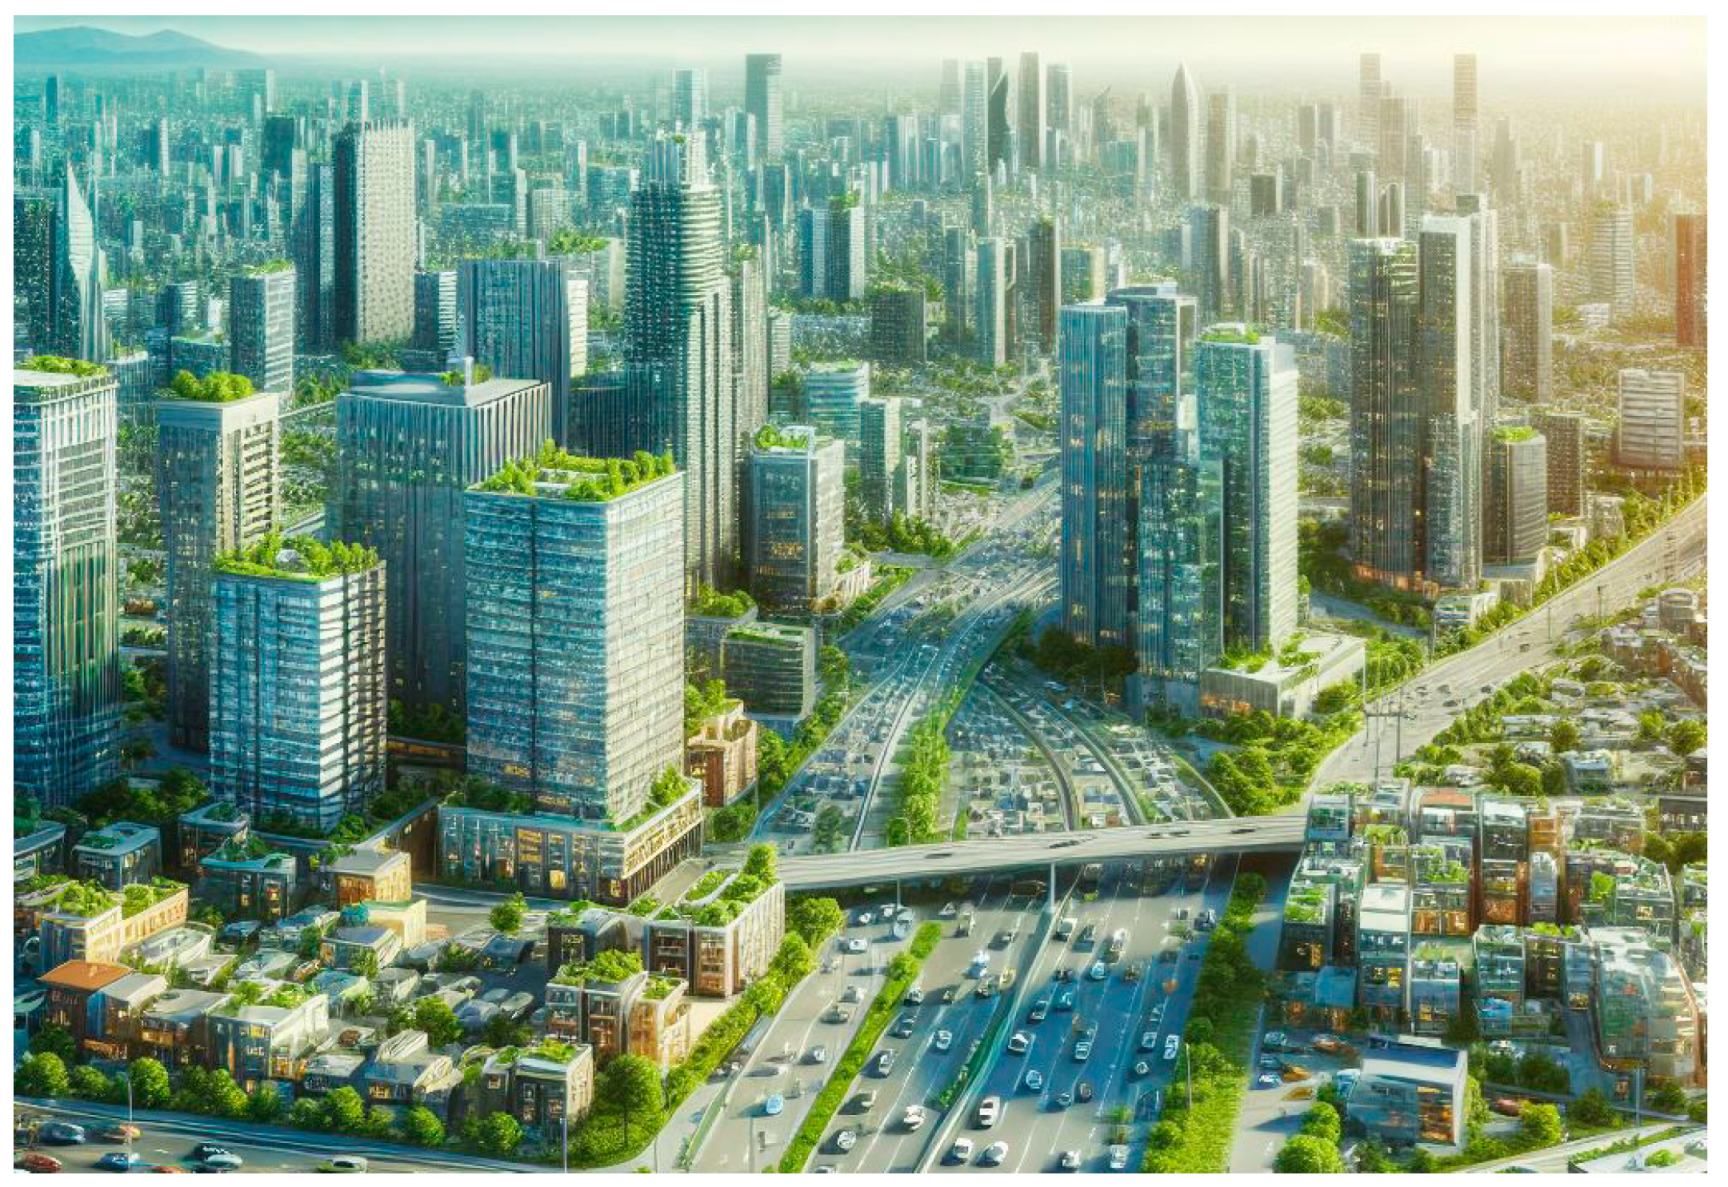
Figure 7.
Health impacts of fossil based automobility in percentage of global annual deaths. Source: based on [41].
Figure 7.
Health impacts of fossil based automobility in percentage of global annual deaths. Source: based on [41].
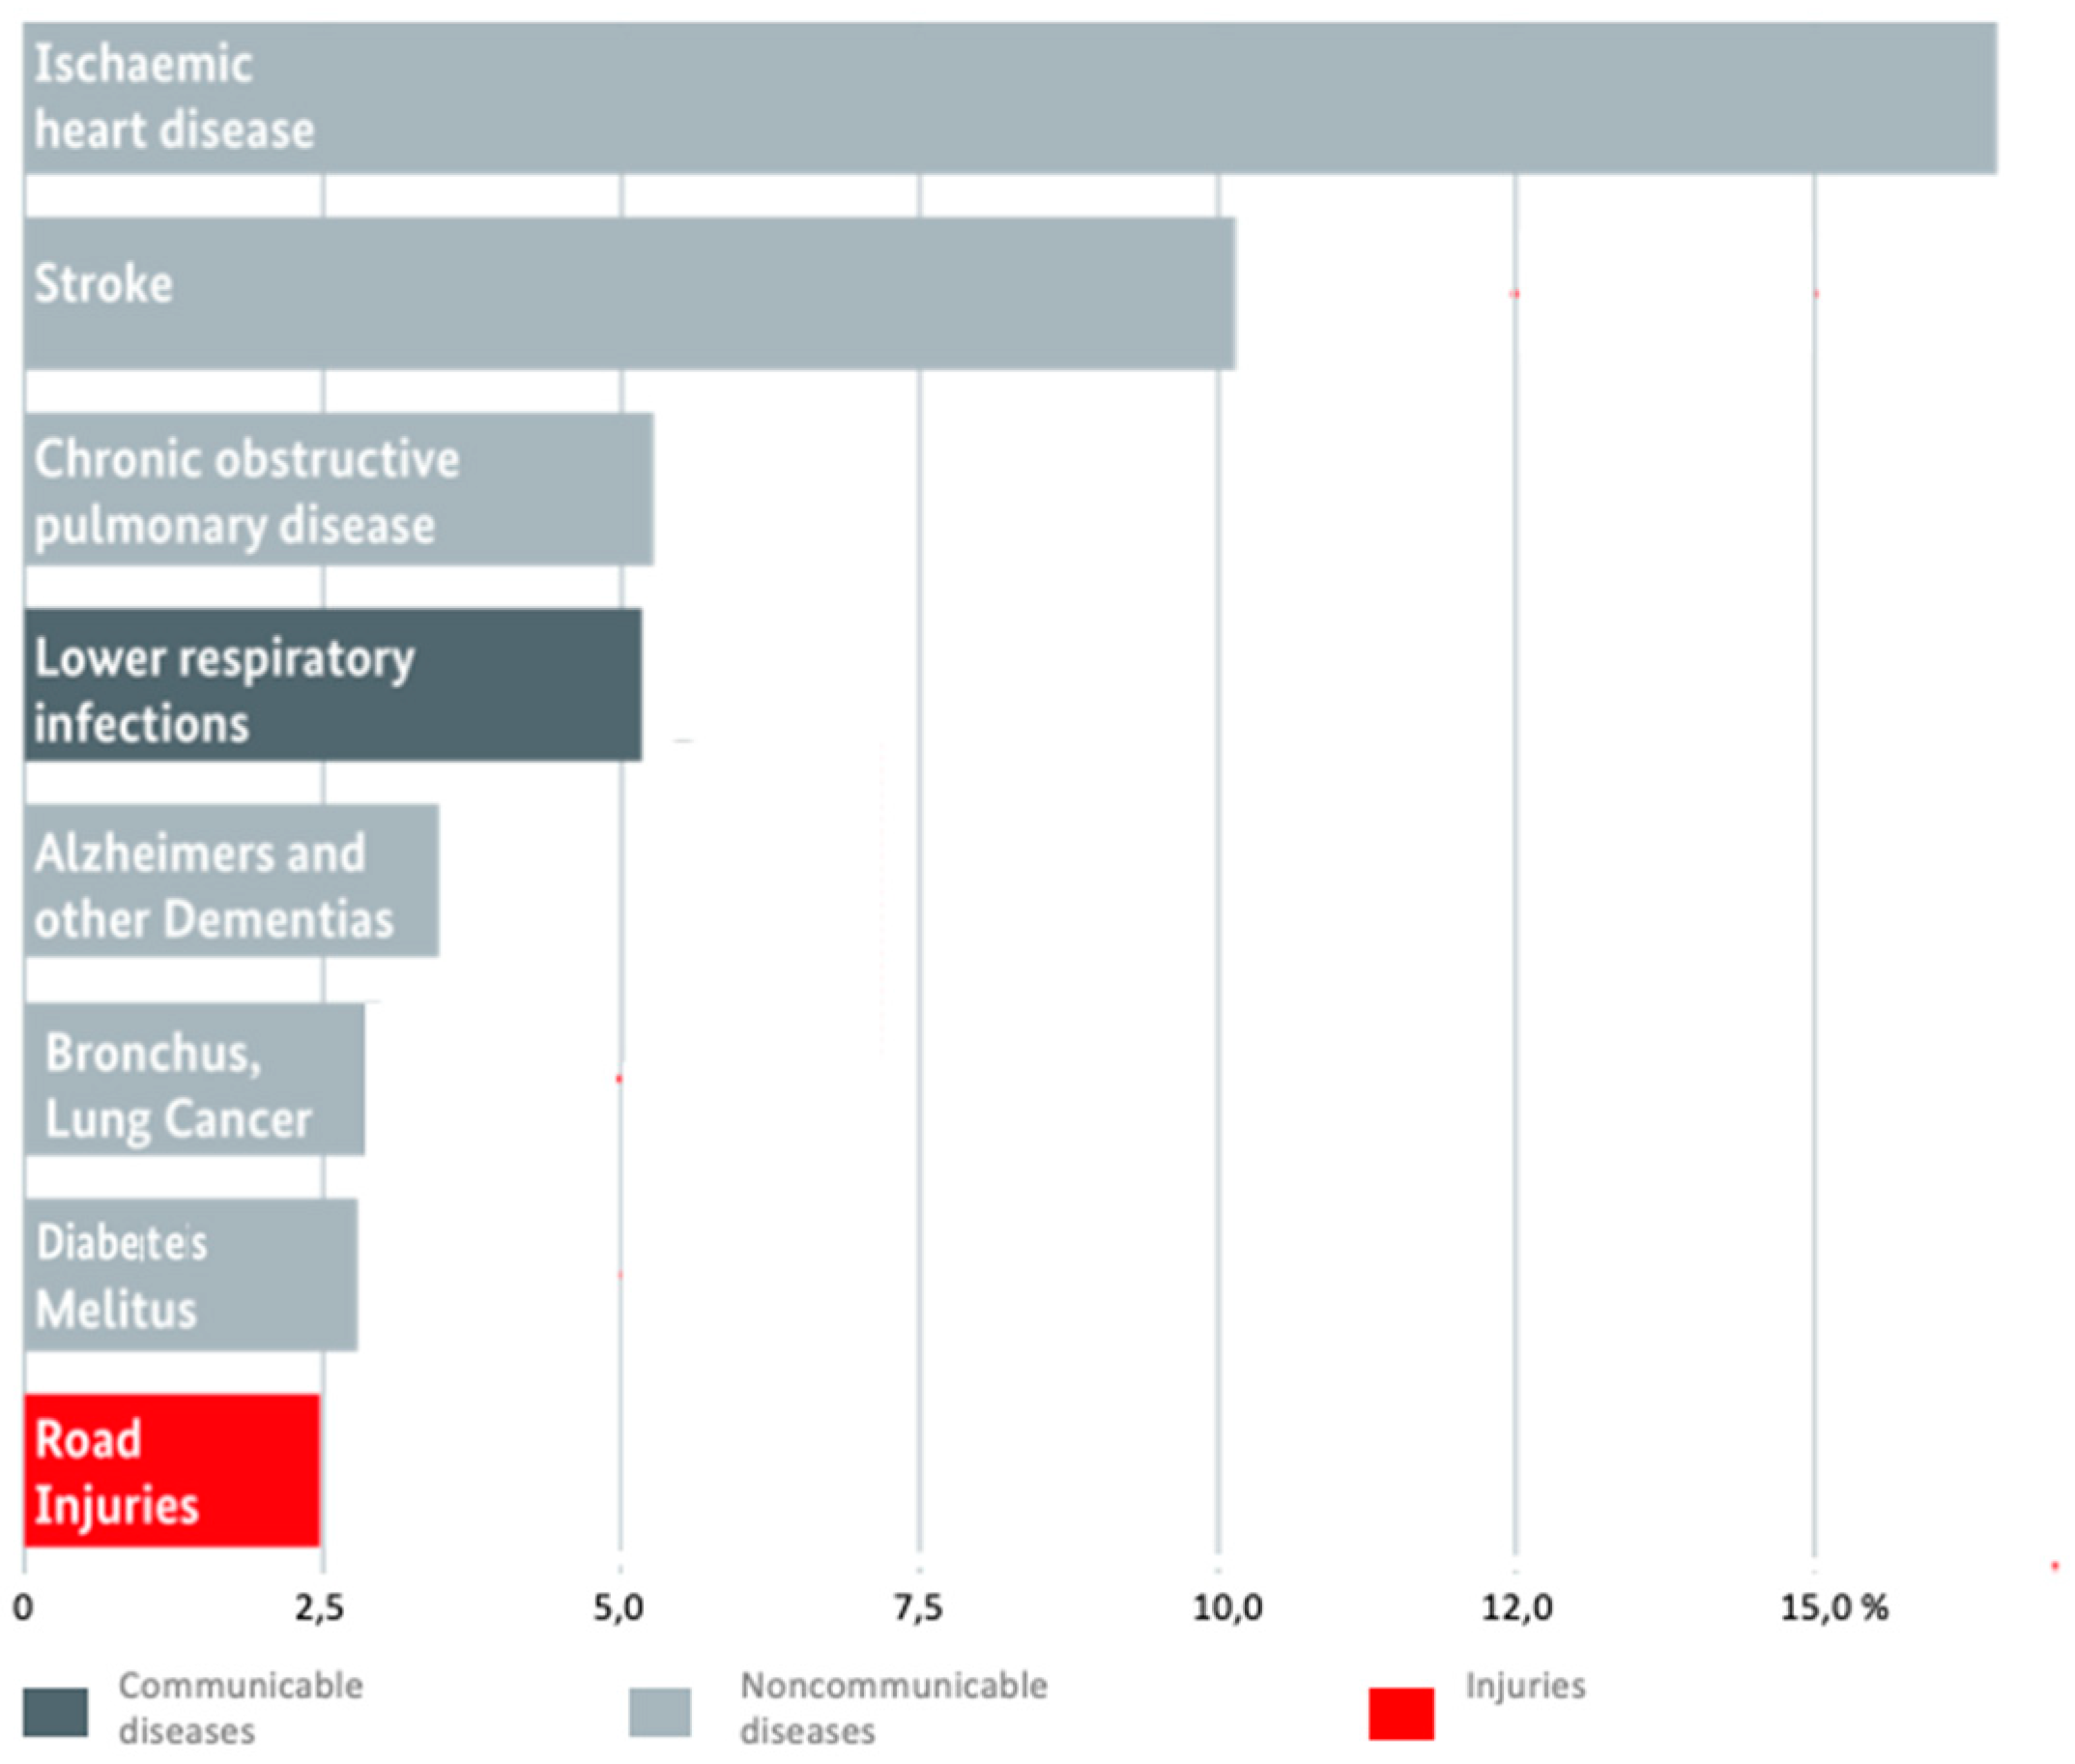
Figure 8.
The model structure for the automotive city.
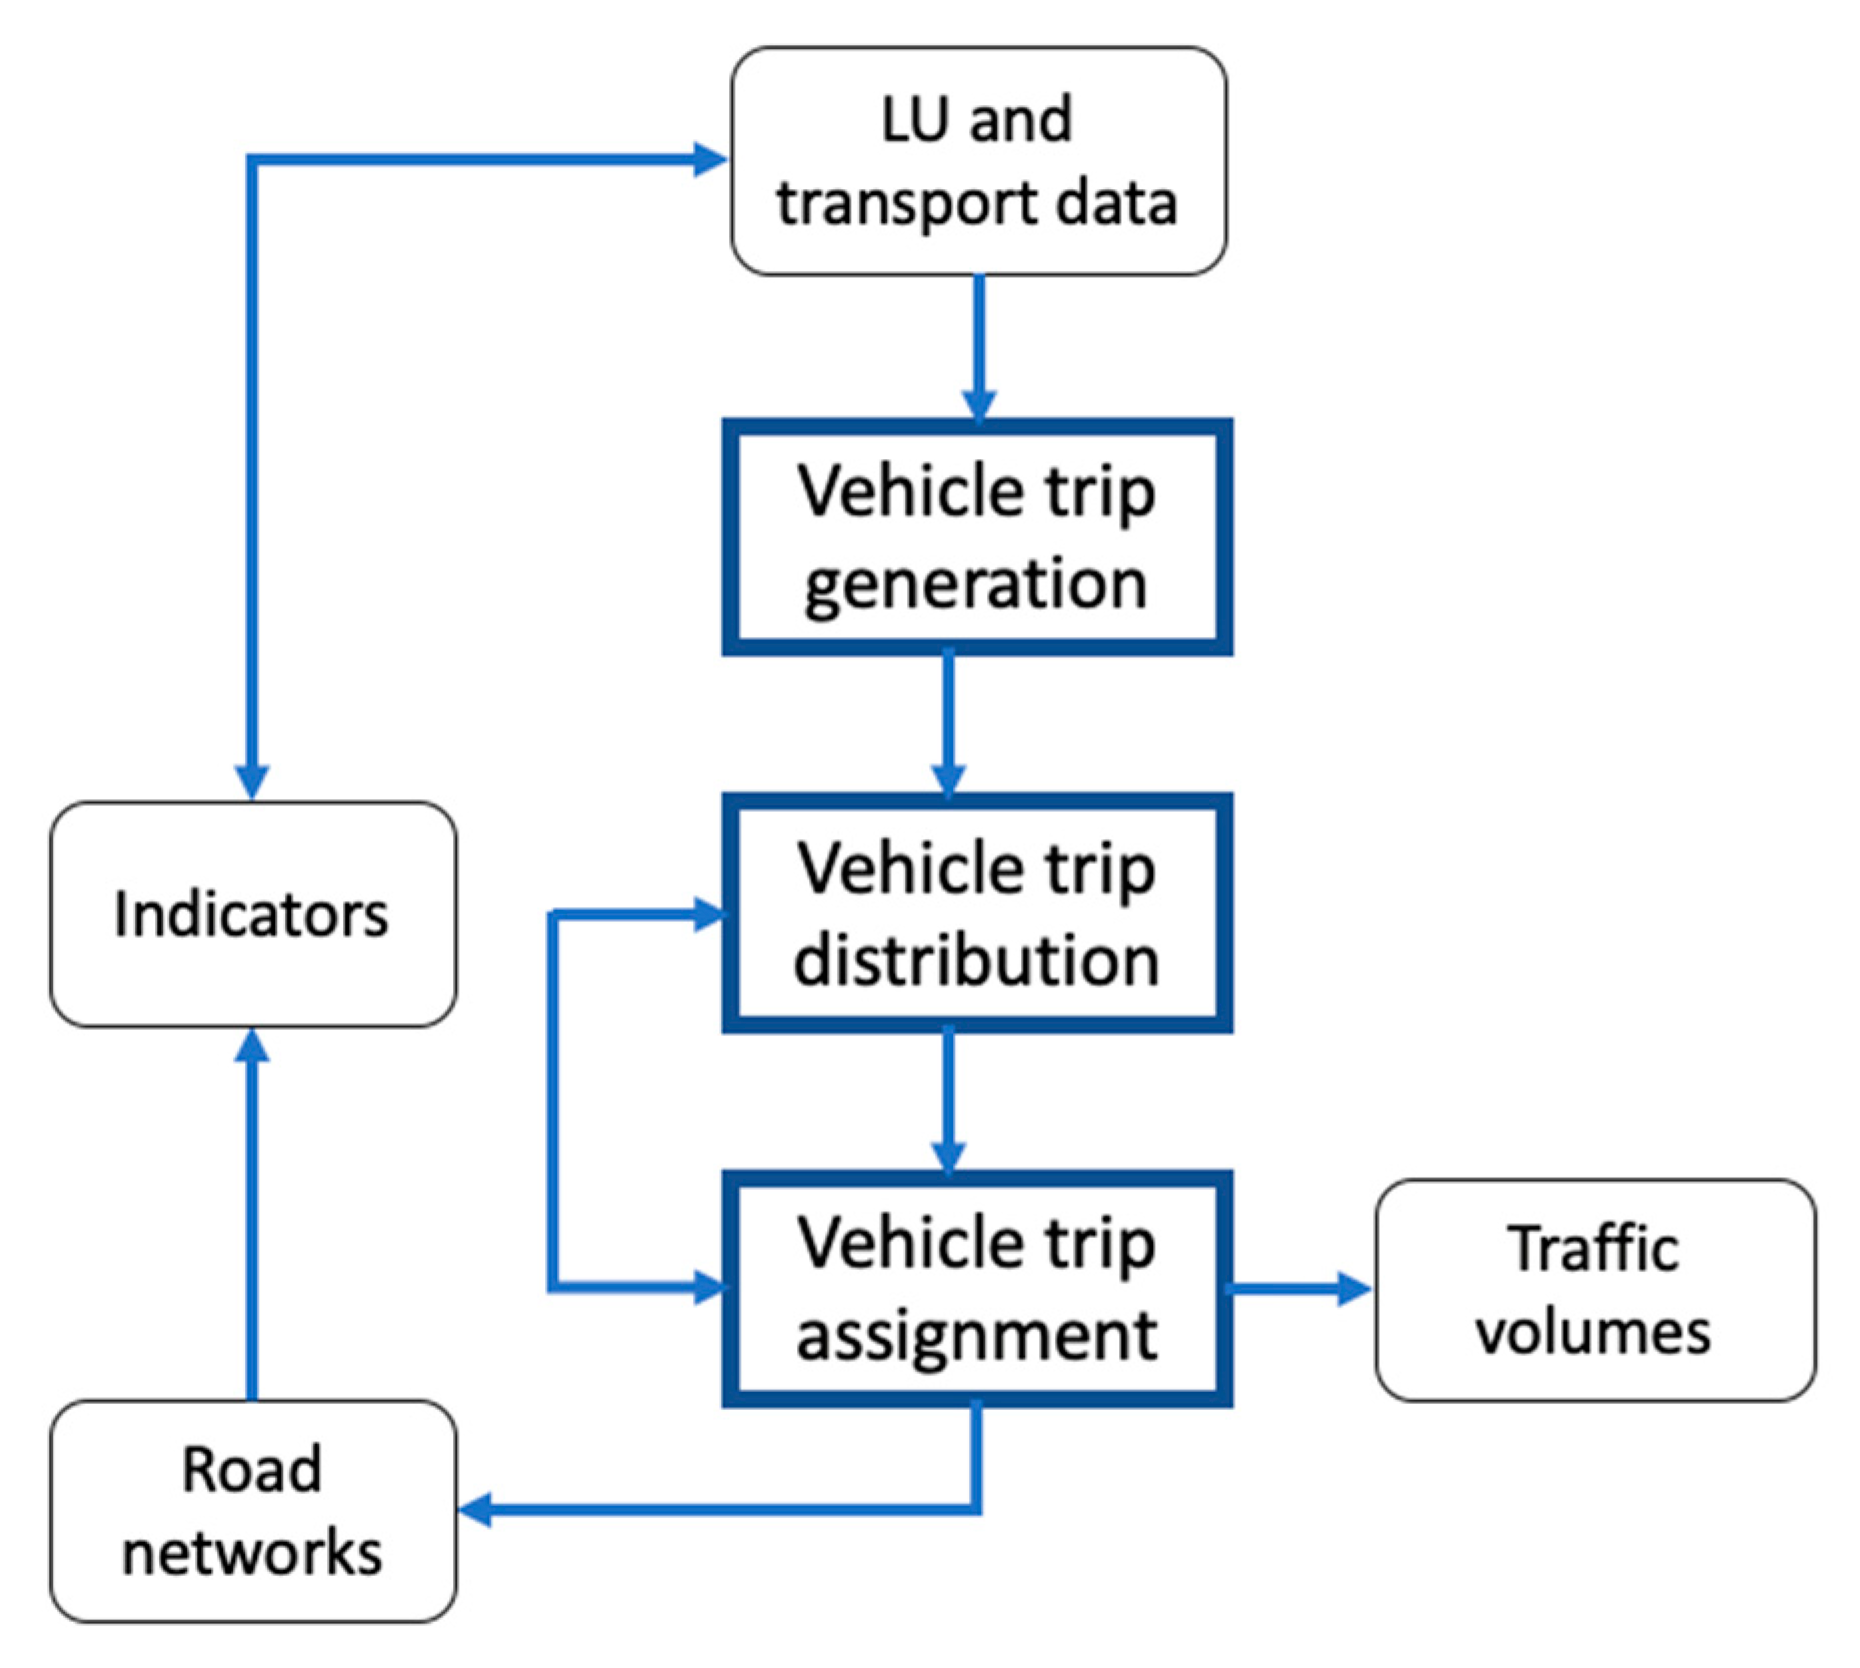
Figure 9.
Fuel use per person vs average speed by private car v1 and public transport v2. Source: [50].
Figure 9.
Fuel use per person vs average speed by private car v1 and public transport v2. Source: [50].
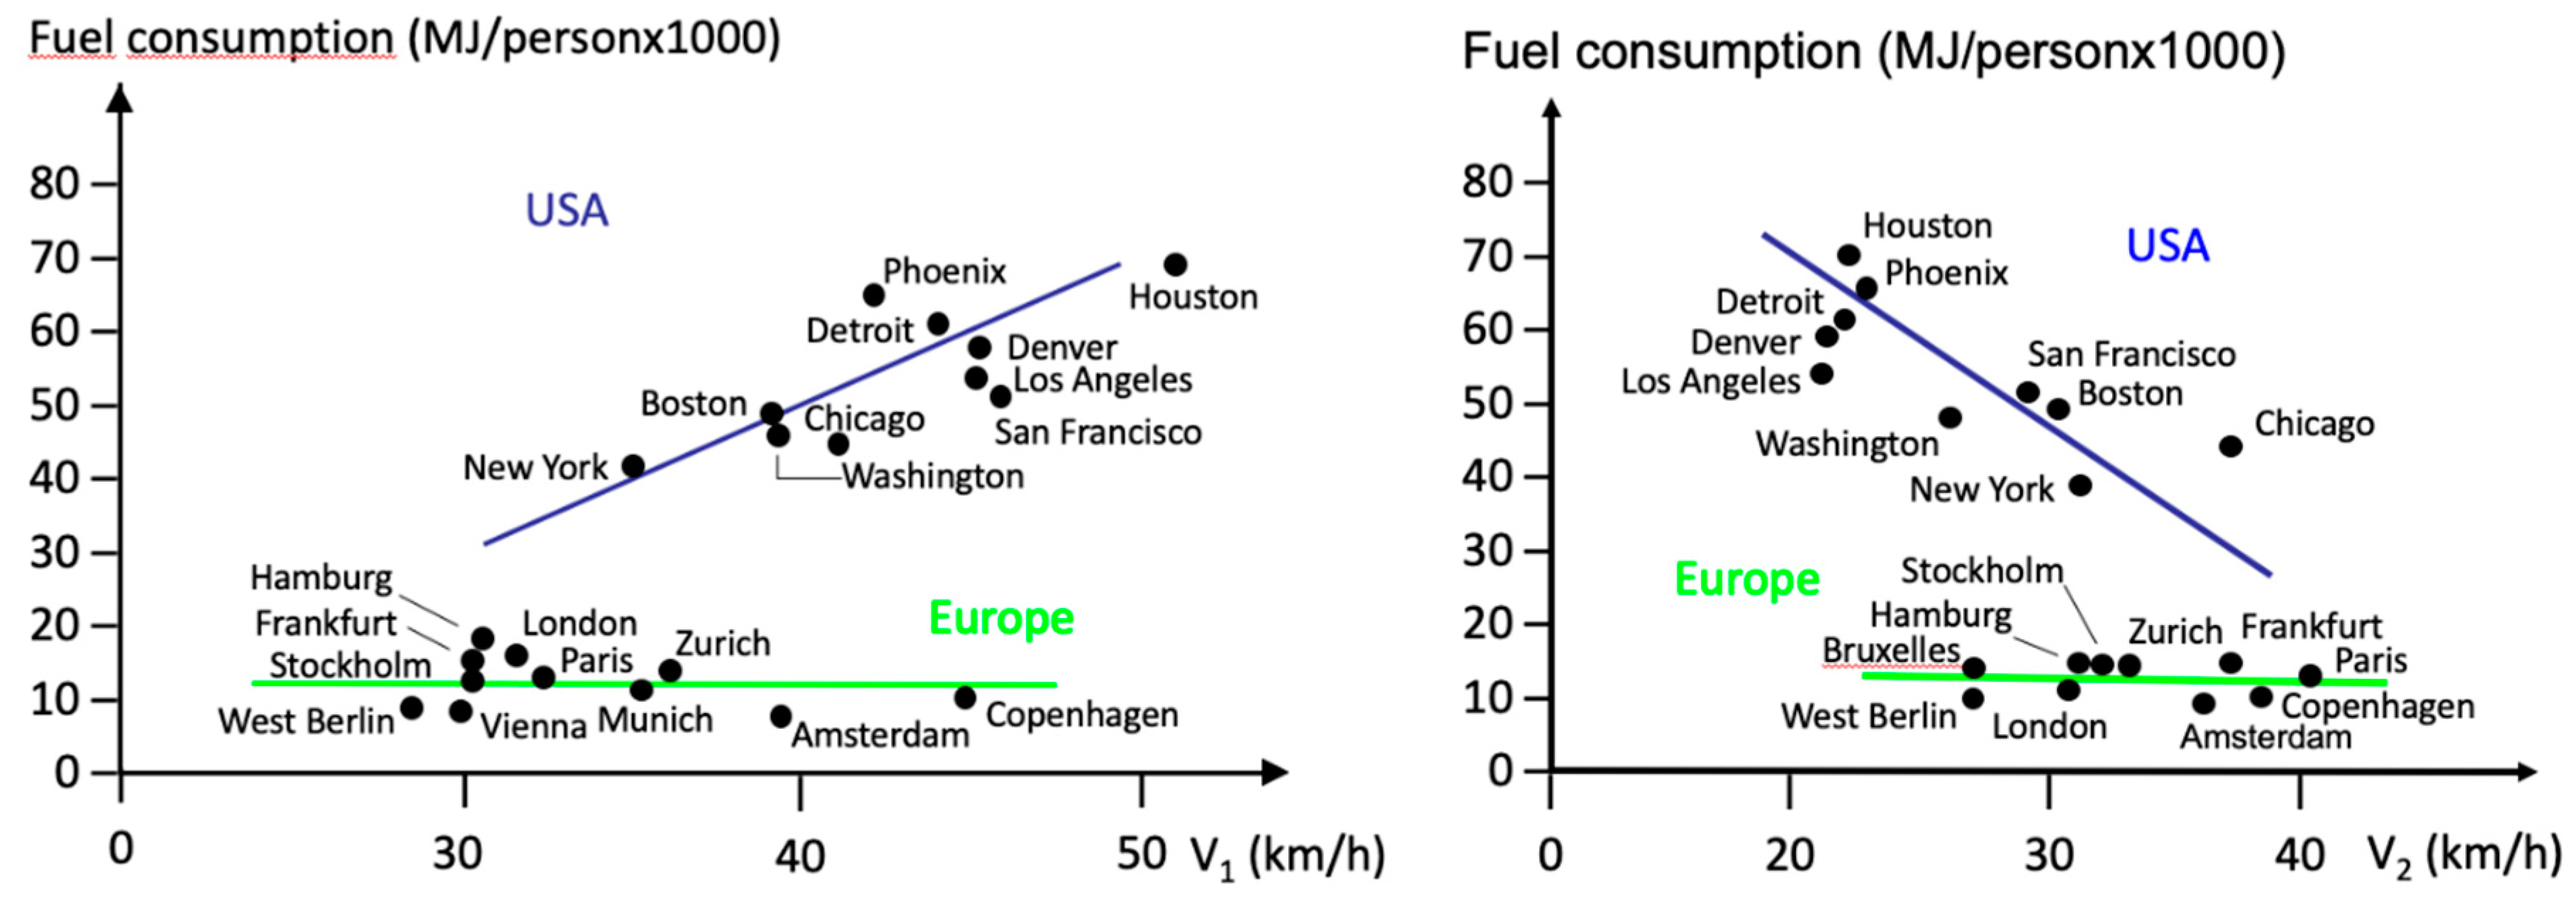
Figure 10.
The average speed by car v1 and collective transport v2 for metropolitan areas in US and EU. Source: Data from Newman and Kenworthy's source book [46].
Figure 10.
The average speed by car v1 and collective transport v2 for metropolitan areas in US and EU. Source: Data from Newman and Kenworthy's source book [46].
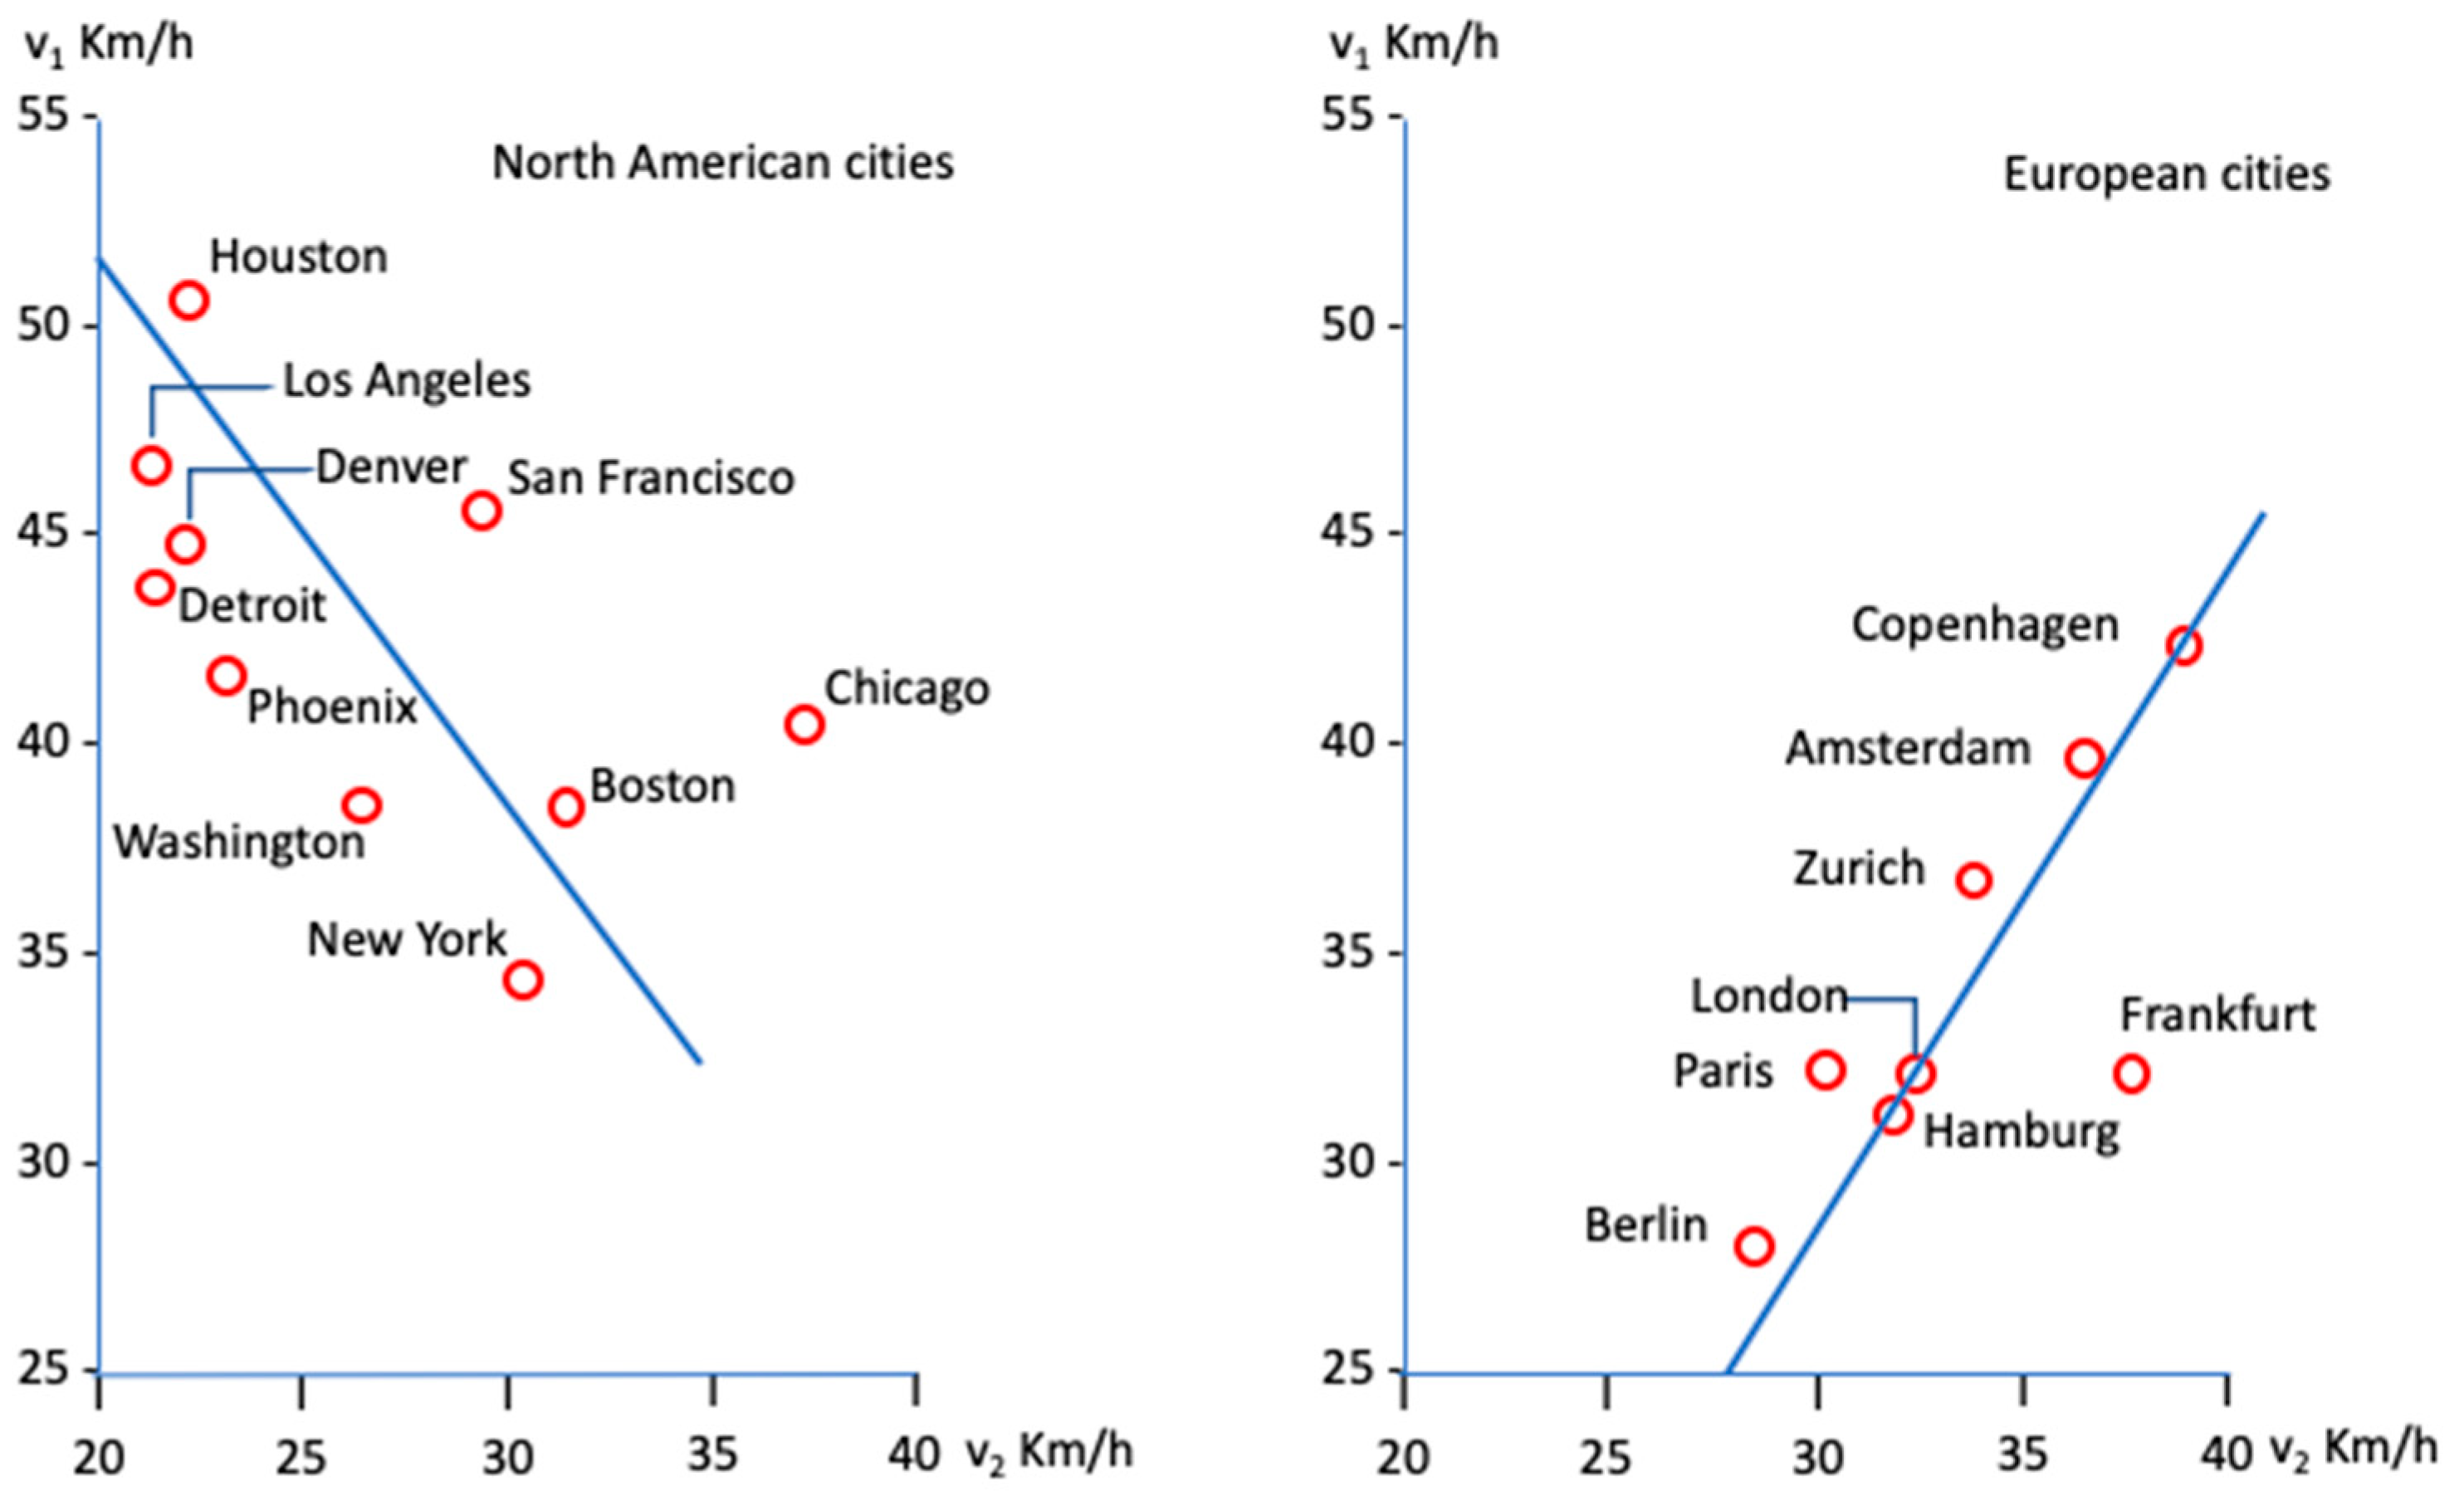
Figure 11.
The Downs/Thomson paradox. Source: [42].
Figure 11.
The Downs/Thomson paradox. Source: [42].

Figure 12.
Door-to-door speed variation towards the center of Rome in private and public transport in the sector served by metro line A and in the other sectors.
Figure 12.
Door-to-door speed variation towards the center of Rome in private and public transport in the sector served by metro line A and in the other sectors.
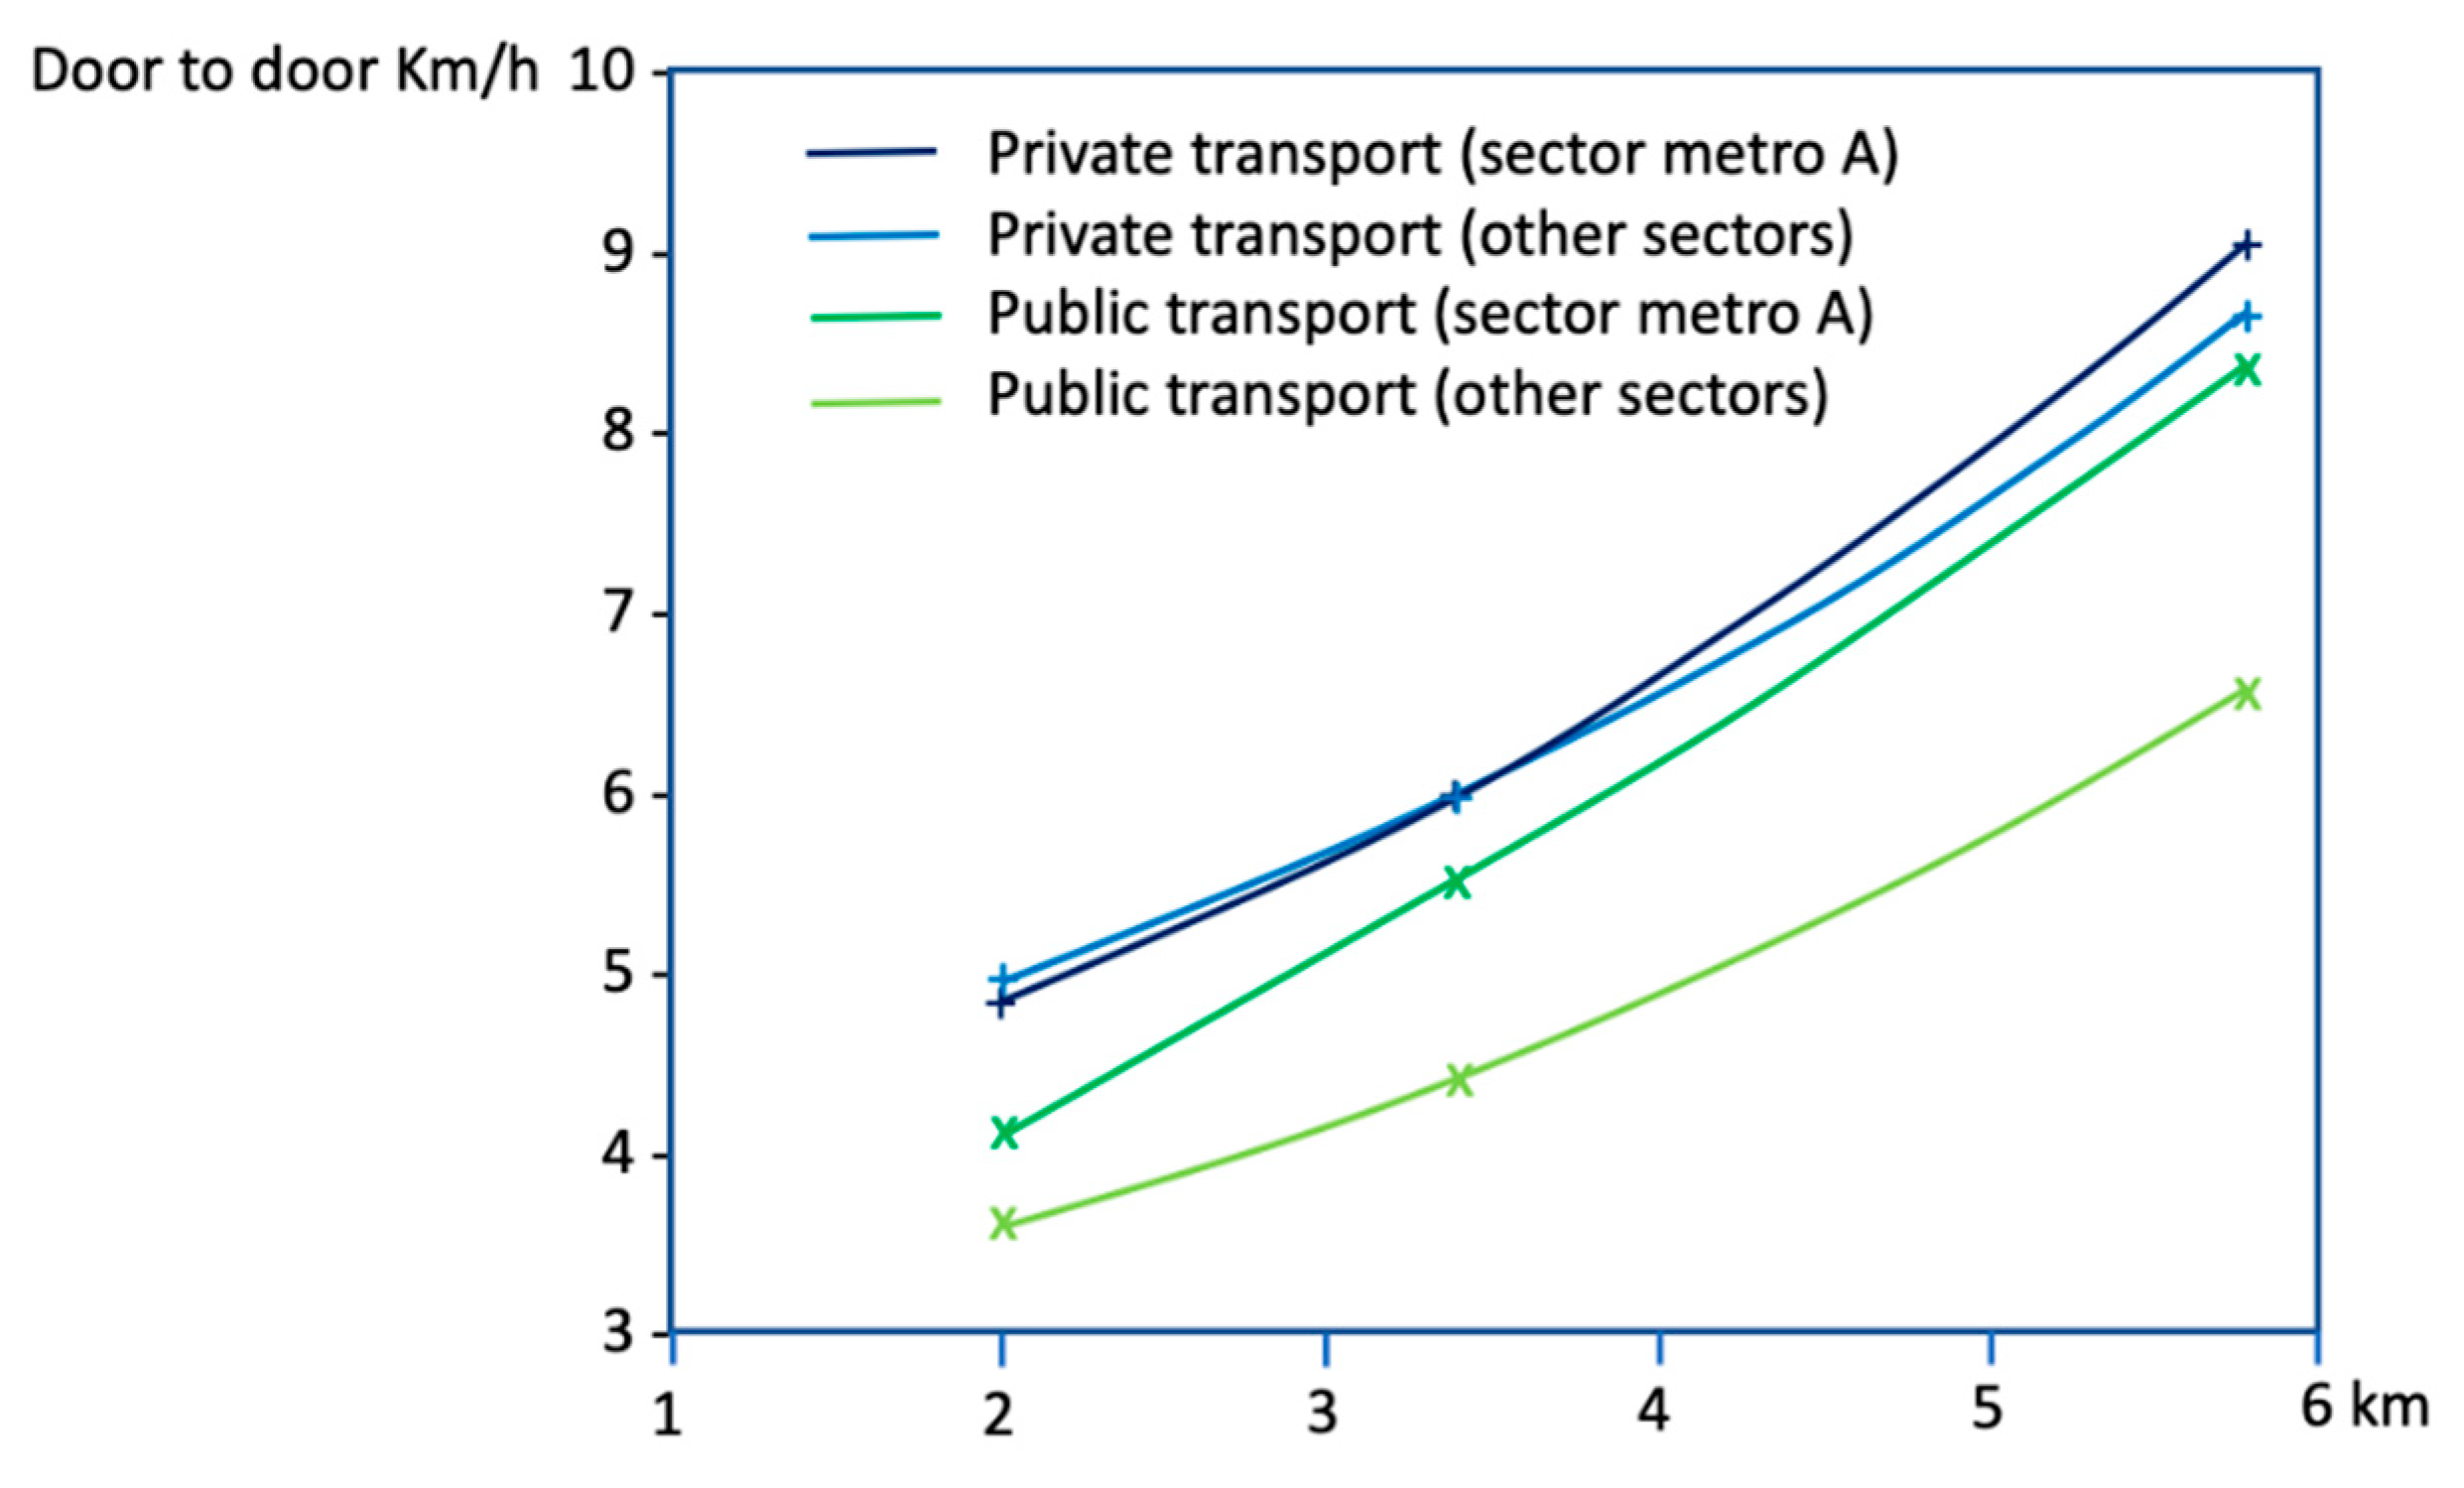
Figure 13.
The model structure for the multimodal city.
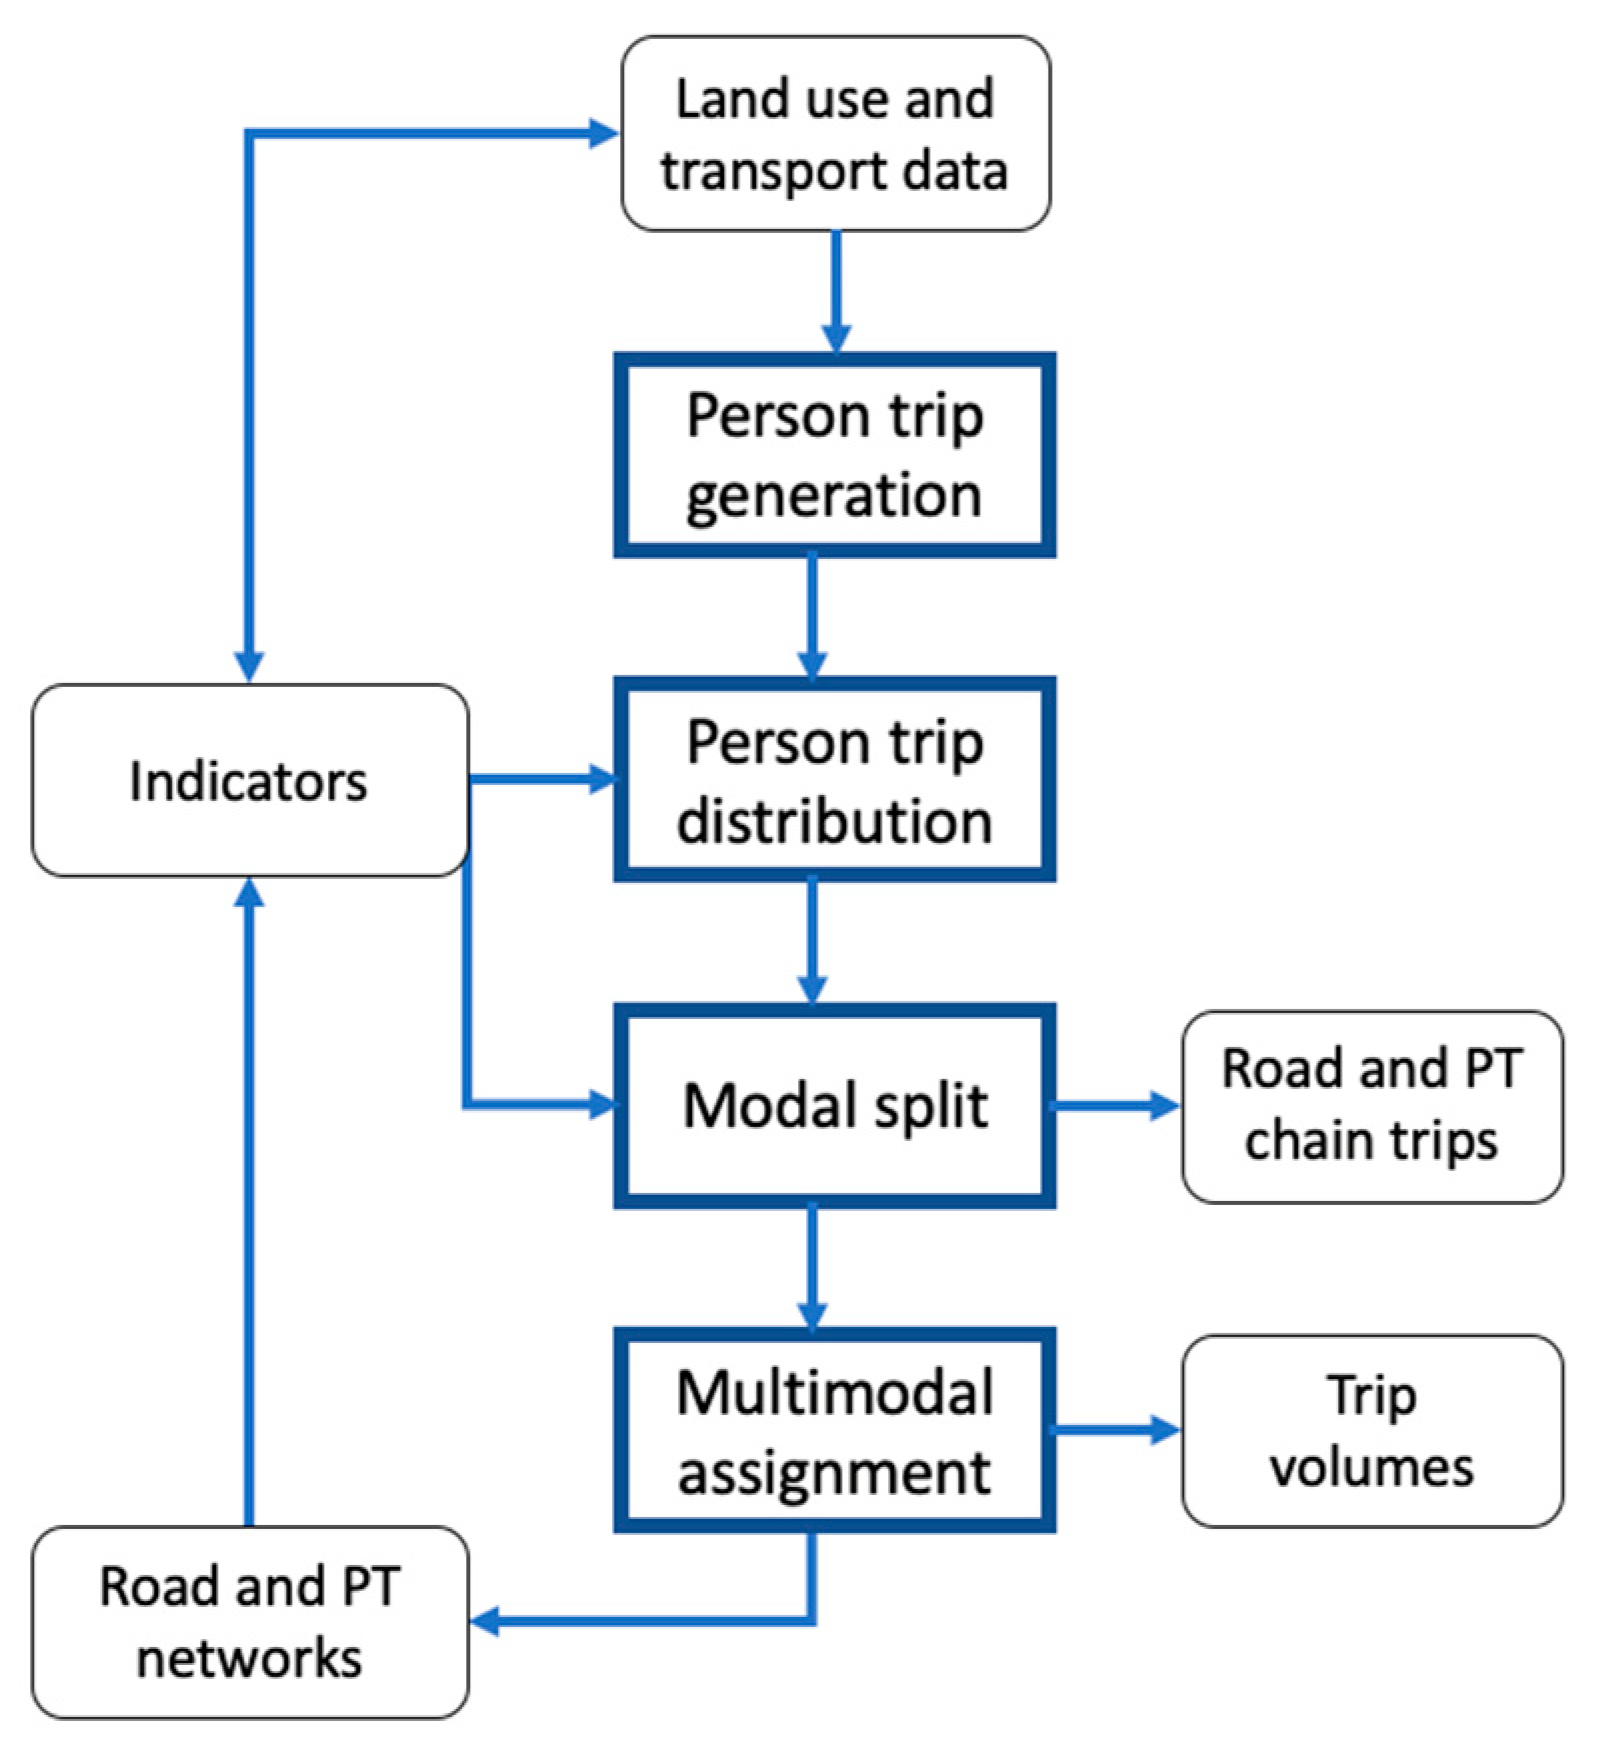
Figure 14.
Modal shares in selected European Capitals 2018. Source [59].
Figure 14.
Modal shares in selected European Capitals 2018. Source [59].
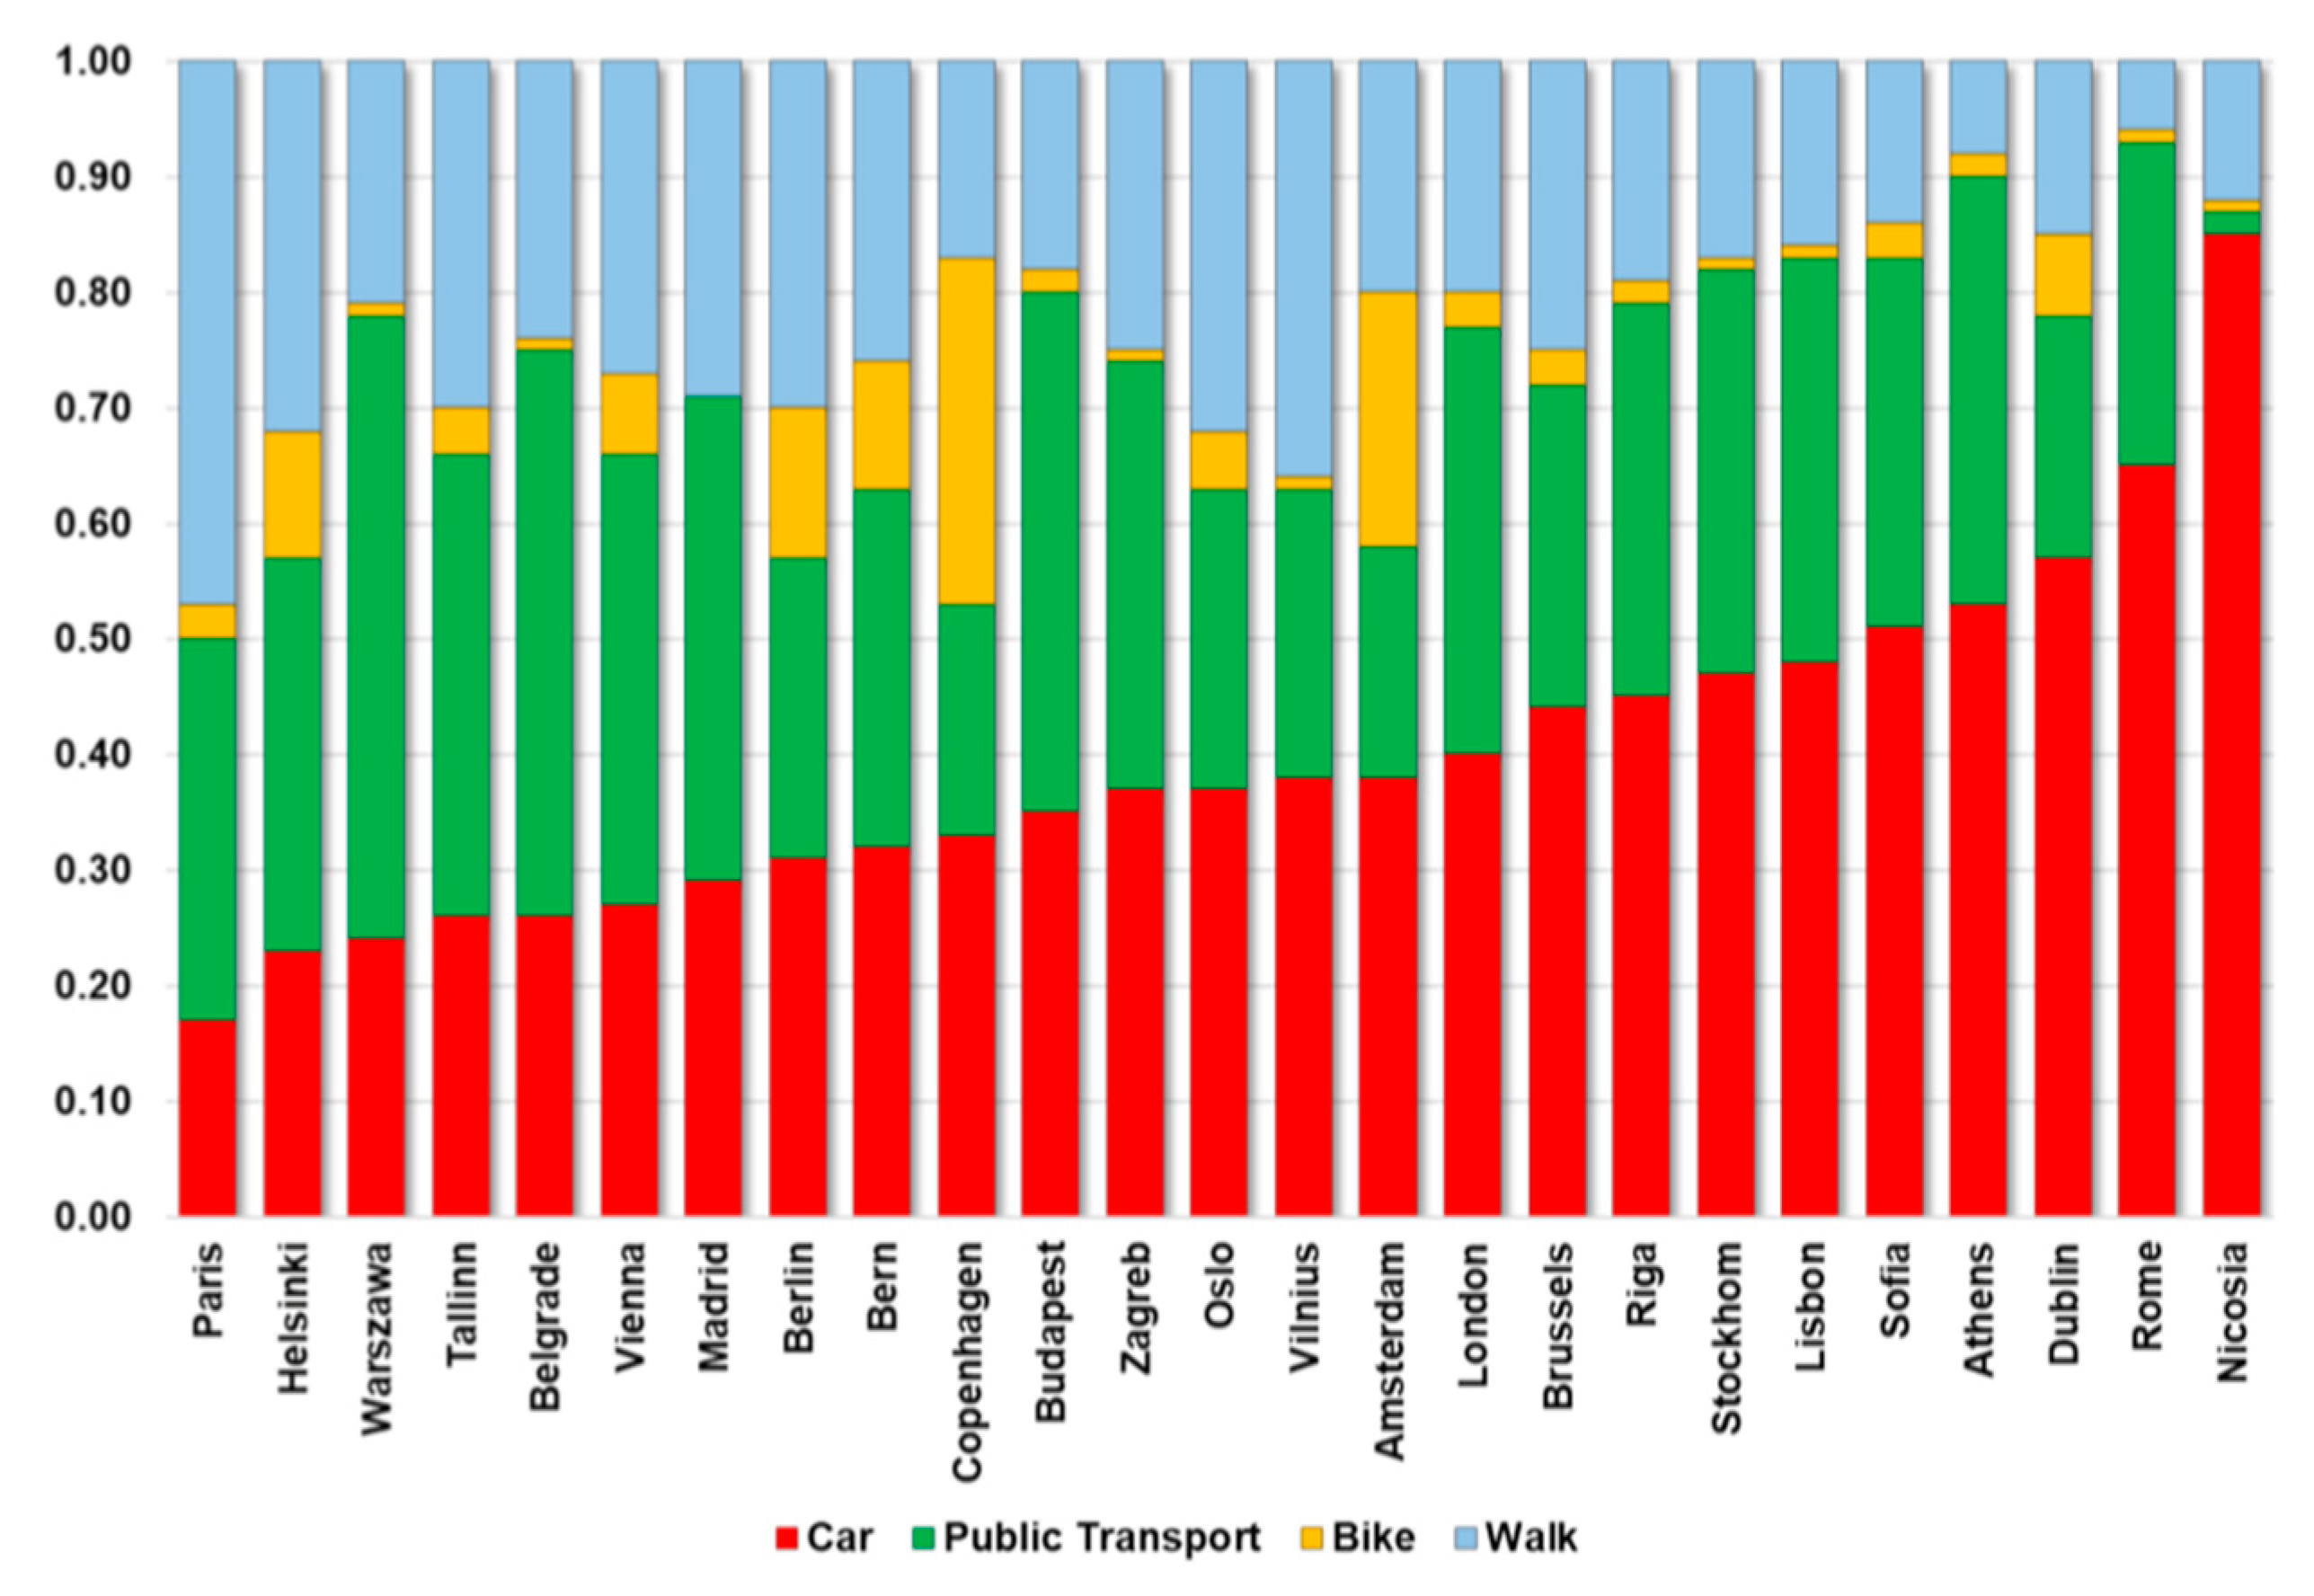
Figure 15.
People satisfied with public transport in the city vs. people using public transport in the city. Source: [60].
Figure 15.
People satisfied with public transport in the city vs. people using public transport in the city. Source: [60].
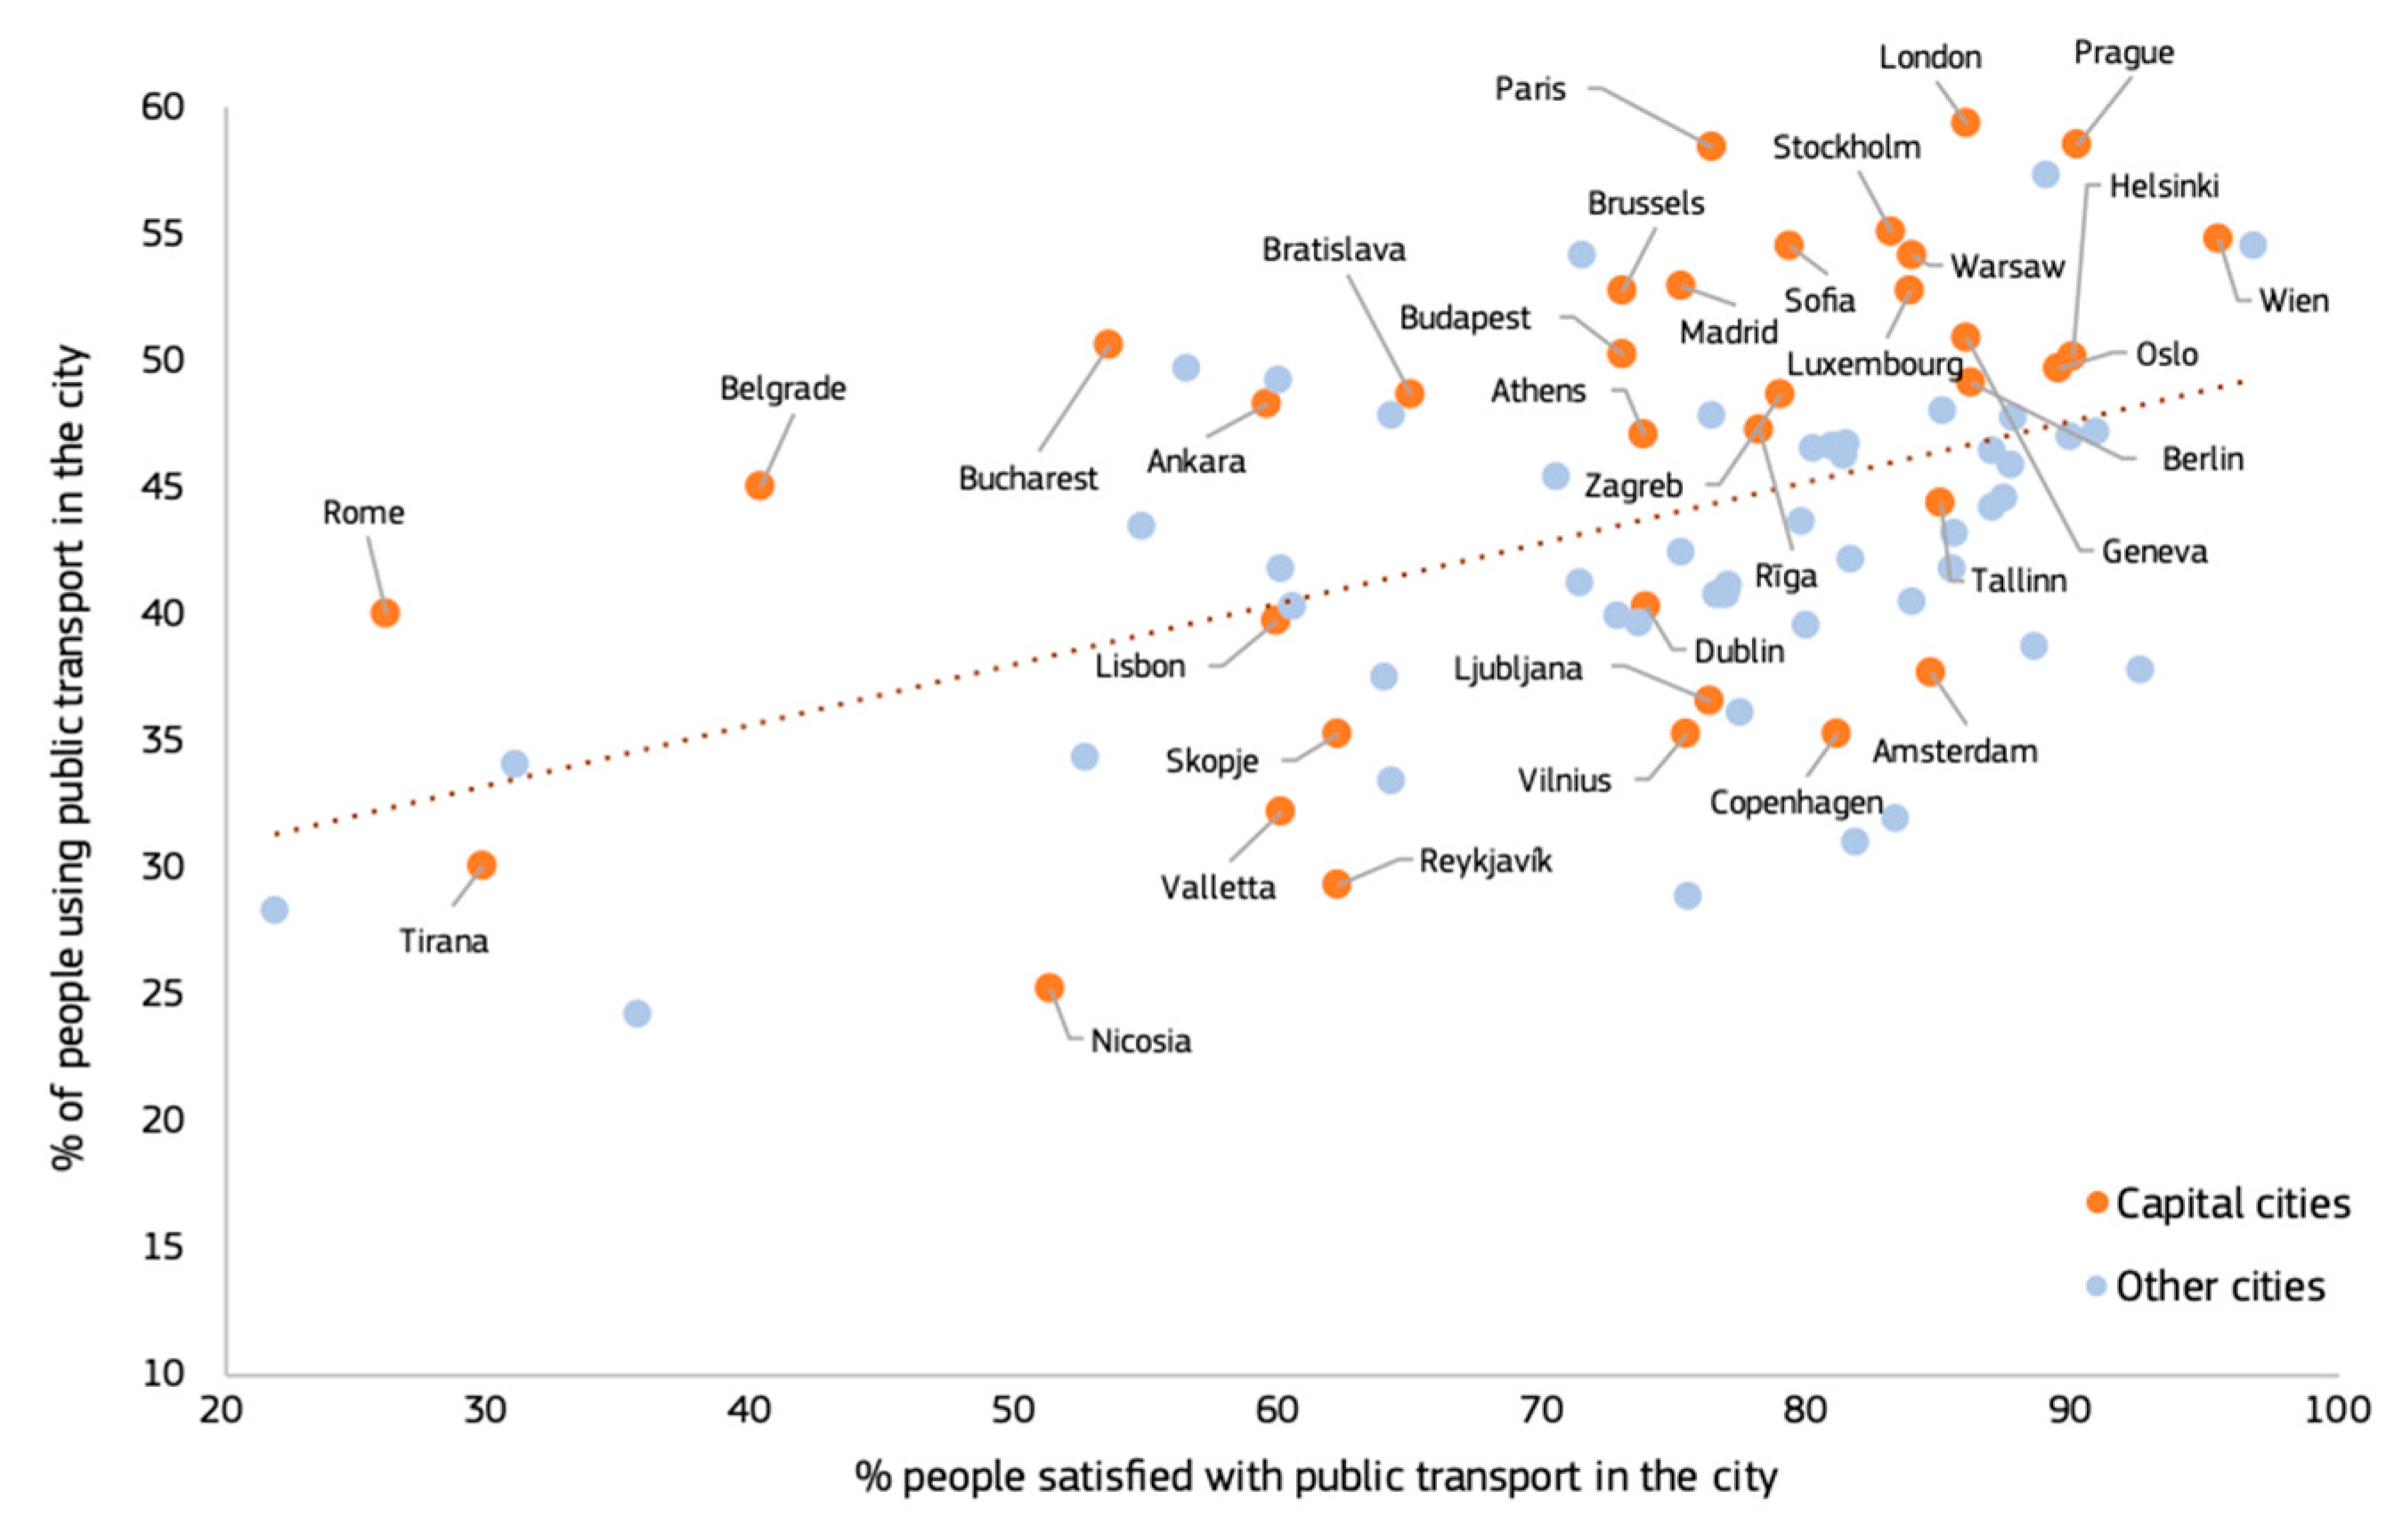
Figure 16.
Percentage of people satisfied with public transport in the city vs. people satisfied with living in the city. Source: [60].
Figure 16.
Percentage of people satisfied with public transport in the city vs. people satisfied with living in the city. Source: [60].
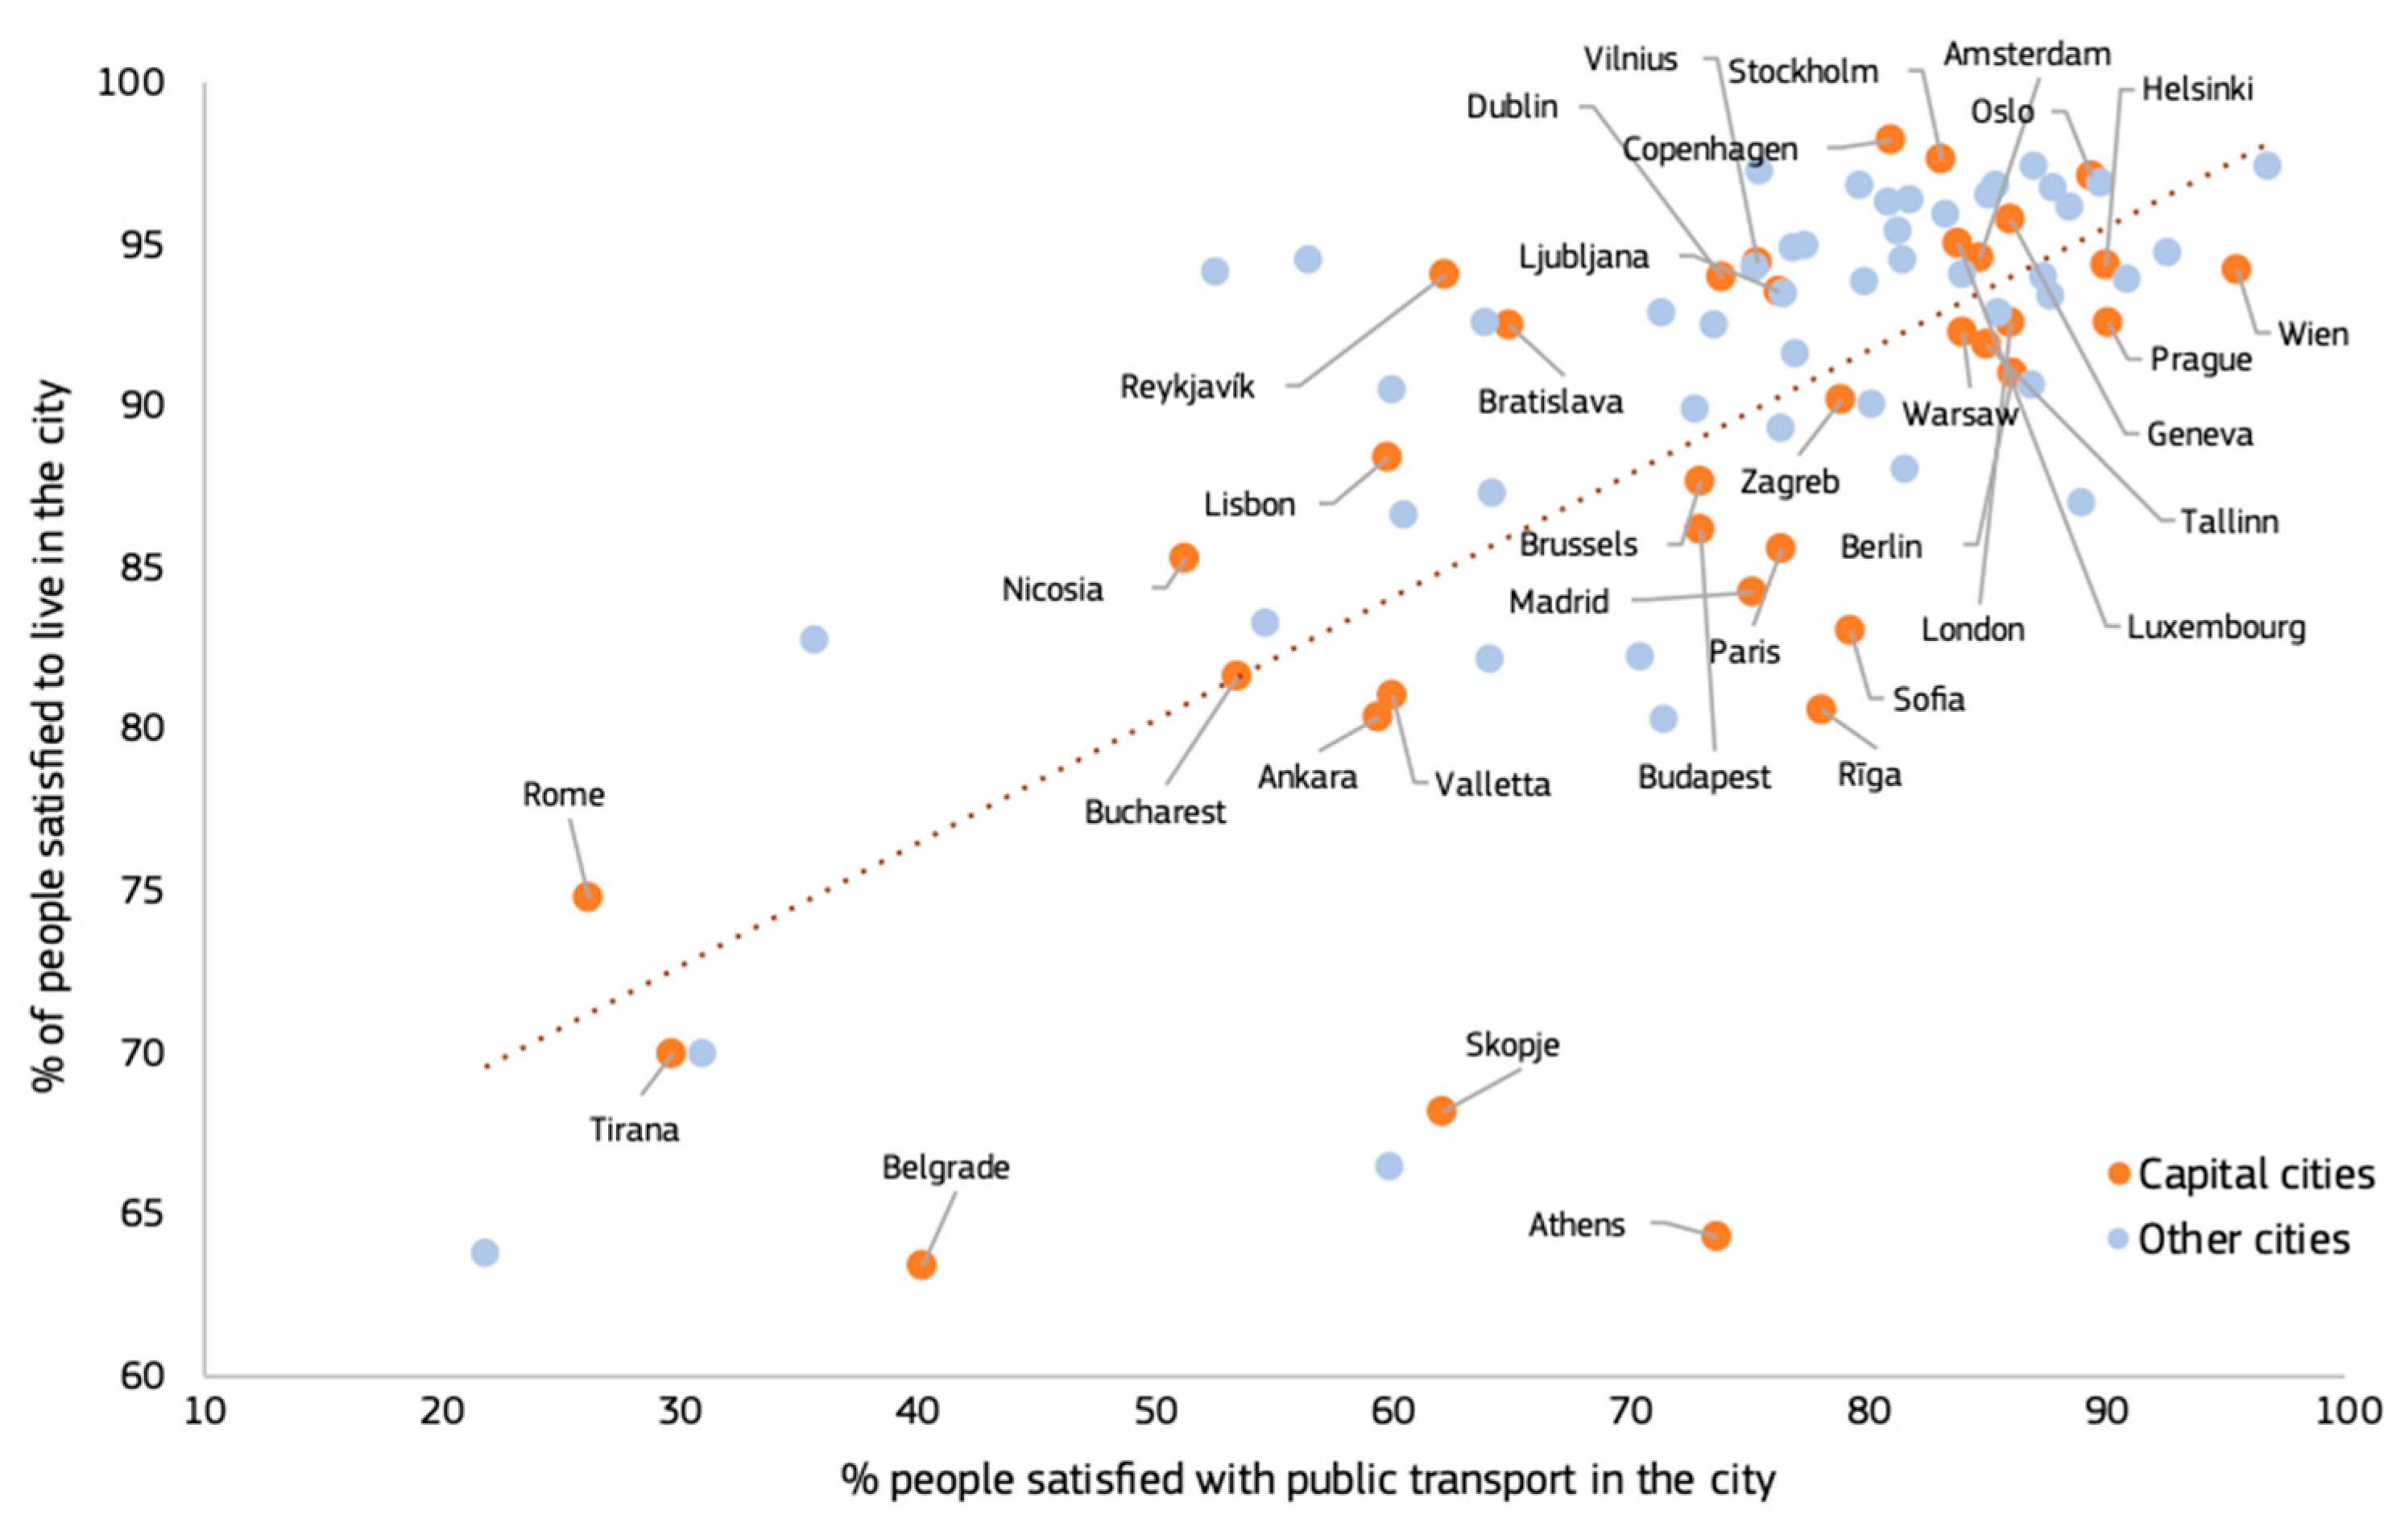
Figure 17.
The steps of the new urban and transport paradigm.
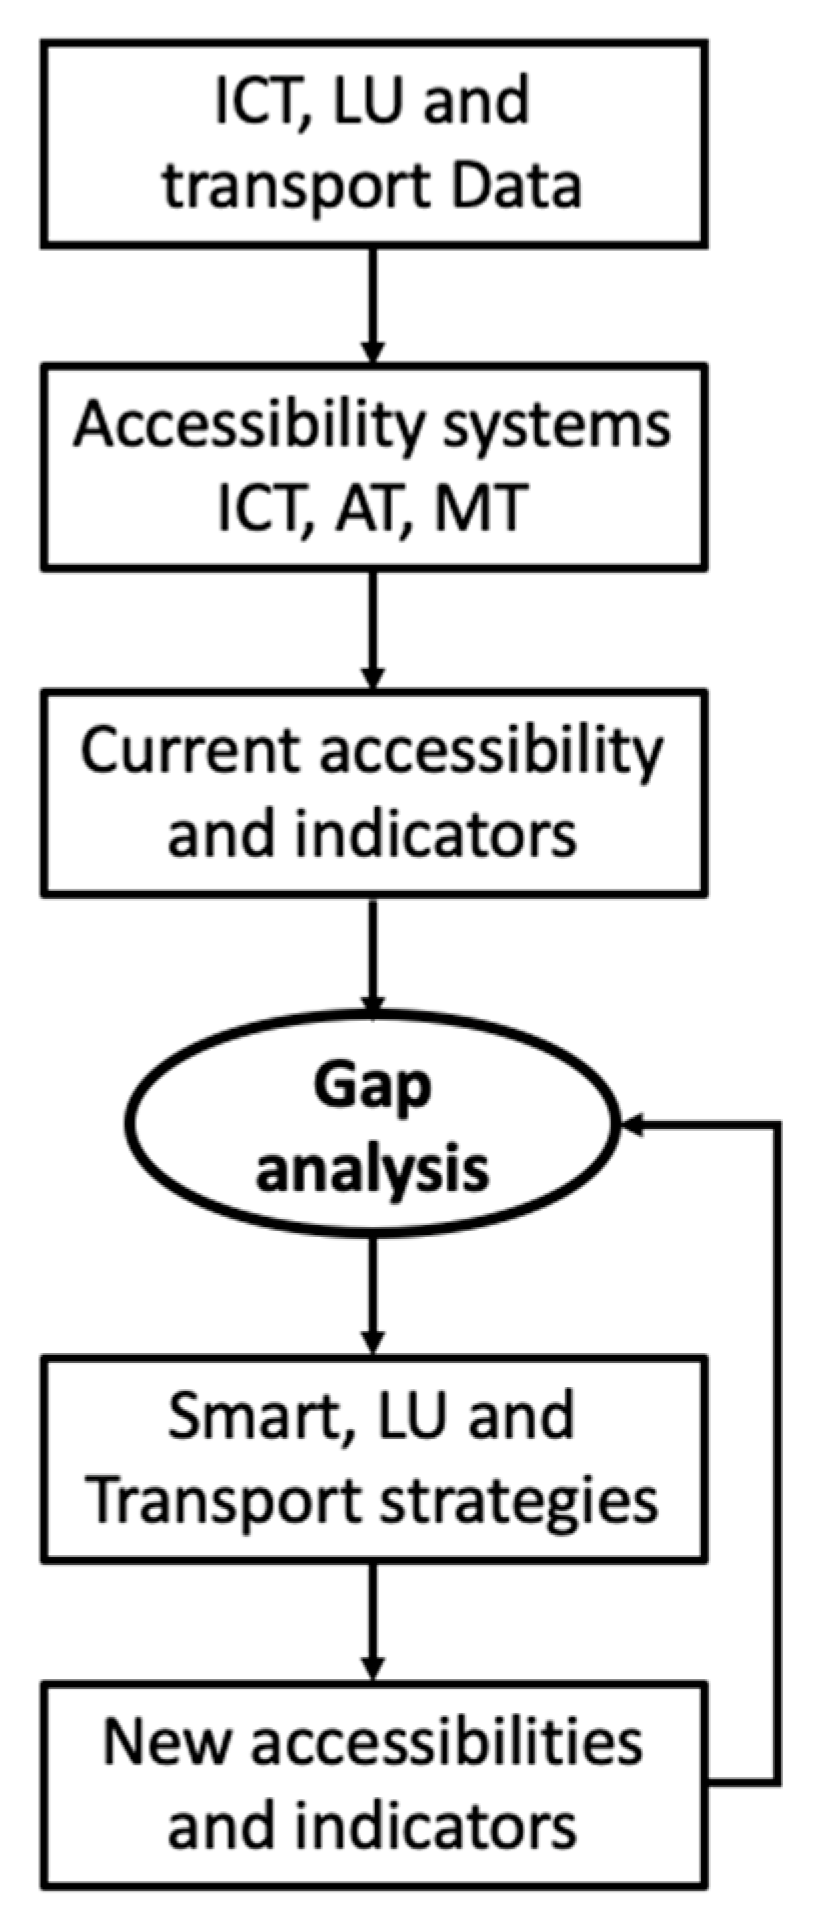
Figure 18.
The hierarchy of urban attractors and diffused TODs.
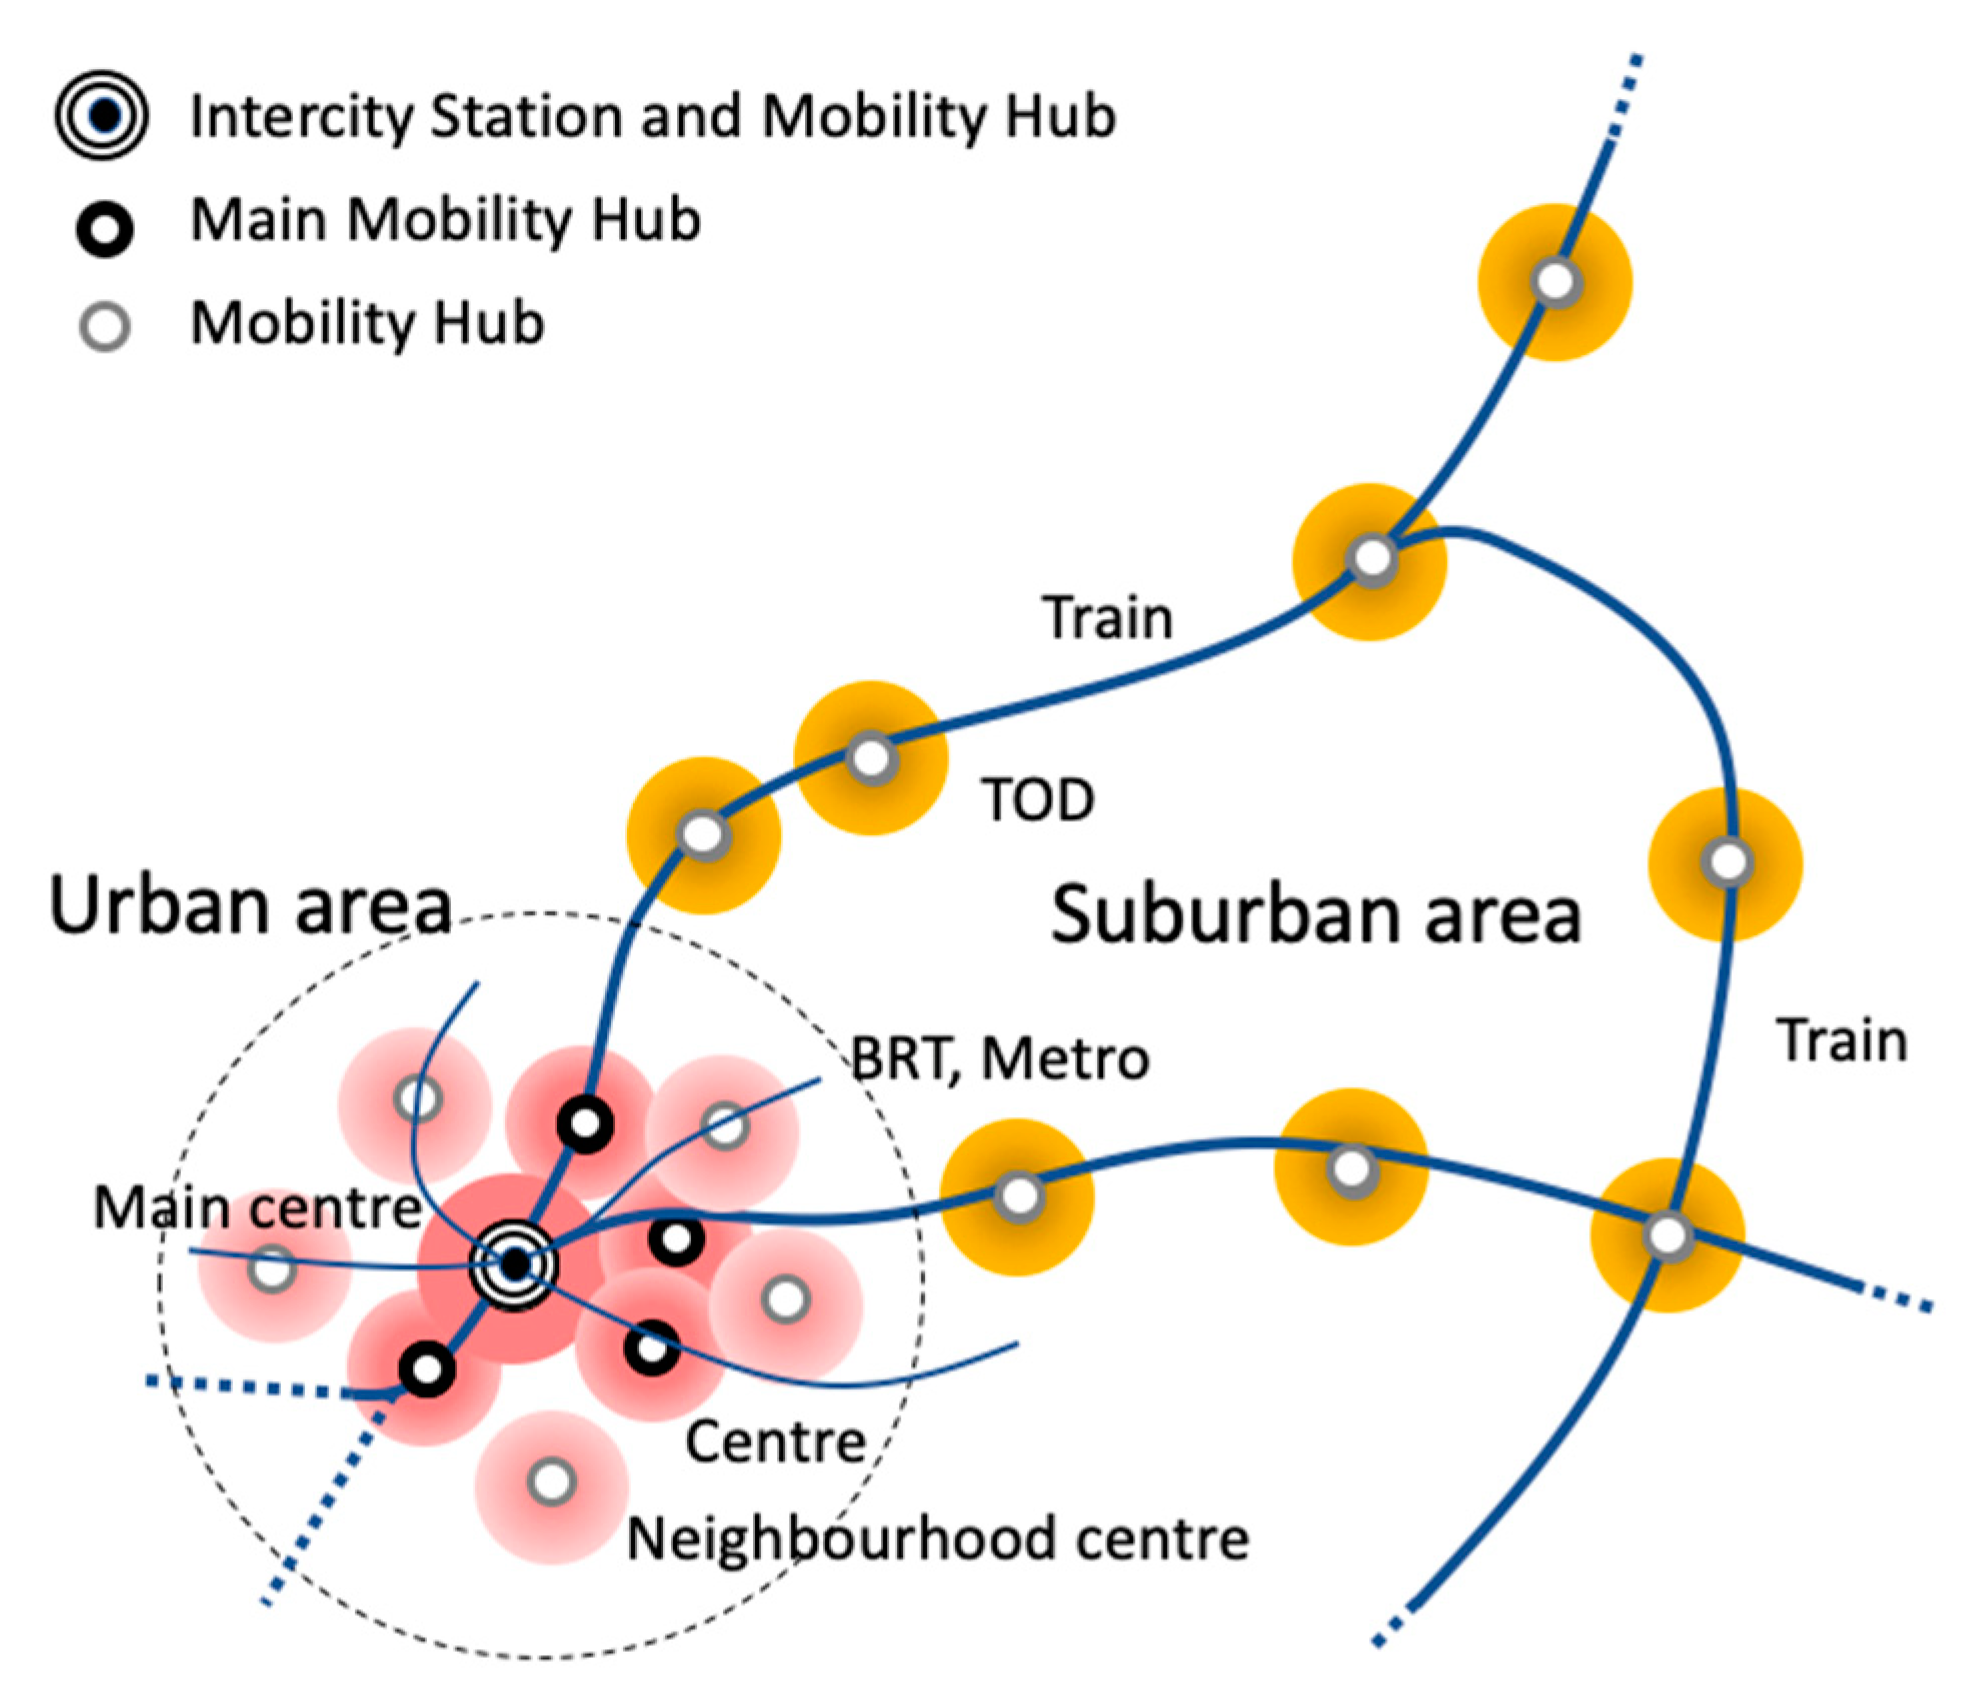
Figure 19.
Accessibility on foot to daily amenities in Rome and Paris. Source: Adapted with permission from ©2023 Sony Lab [72].
Figure 19.
Accessibility on foot to daily amenities in Rome and Paris. Source: Adapted with permission from ©2023 Sony Lab [72].
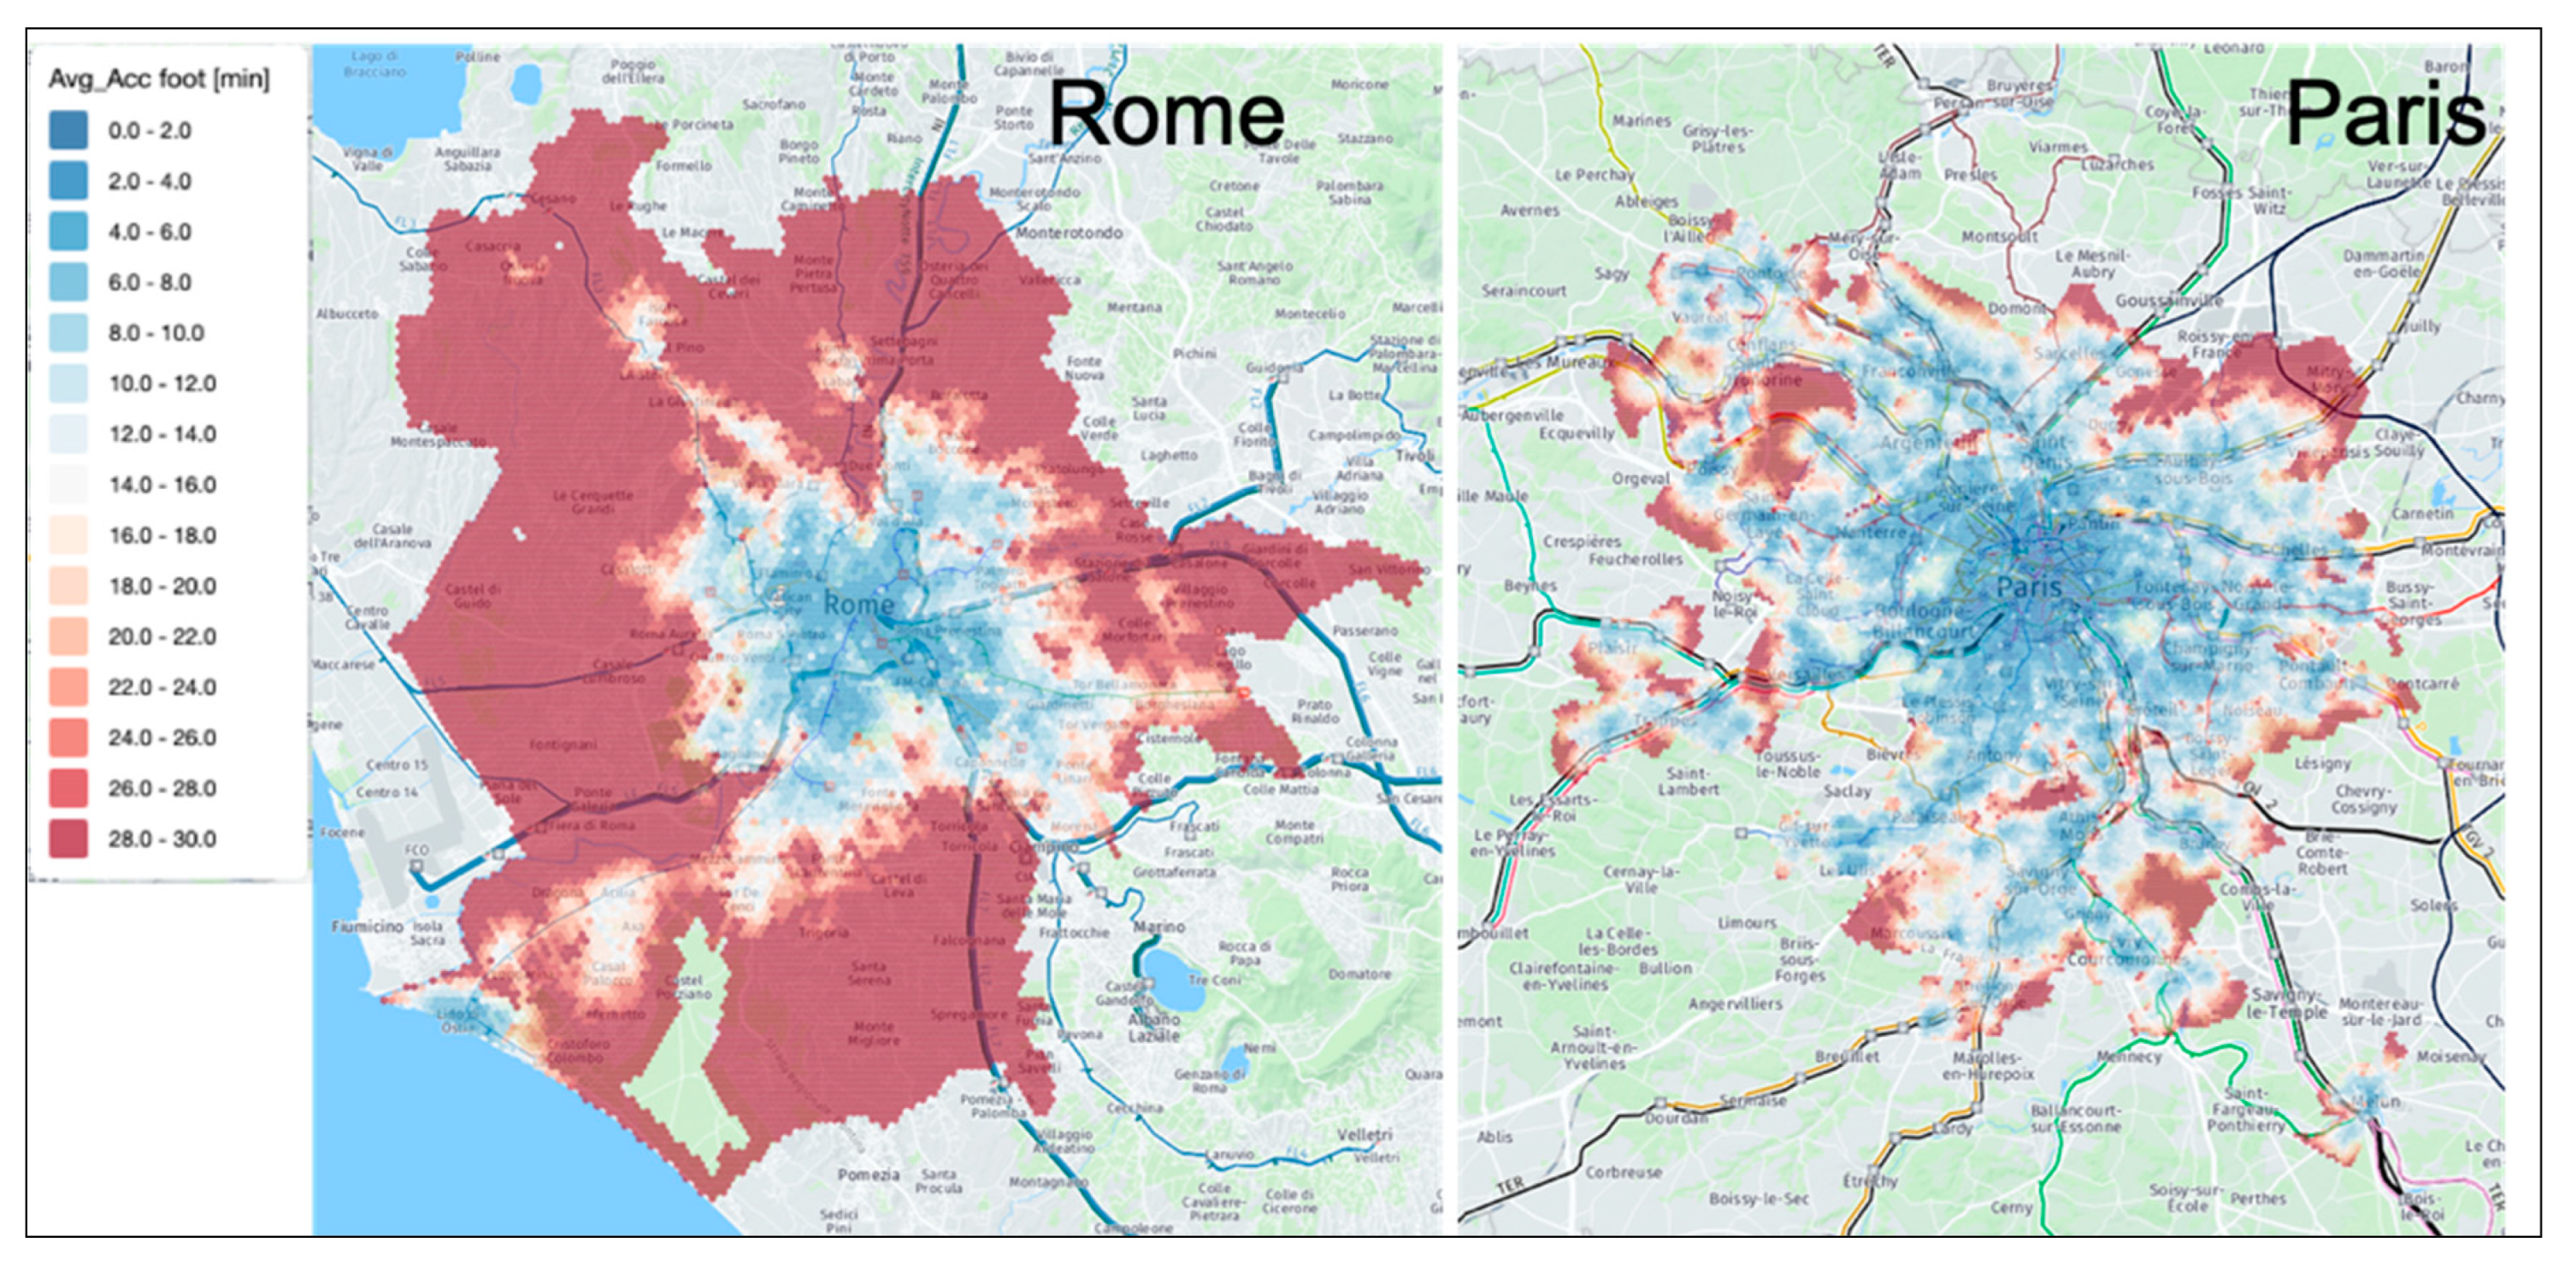
Figure 20.
A virtuous circle for sustainable land use and transport planning.
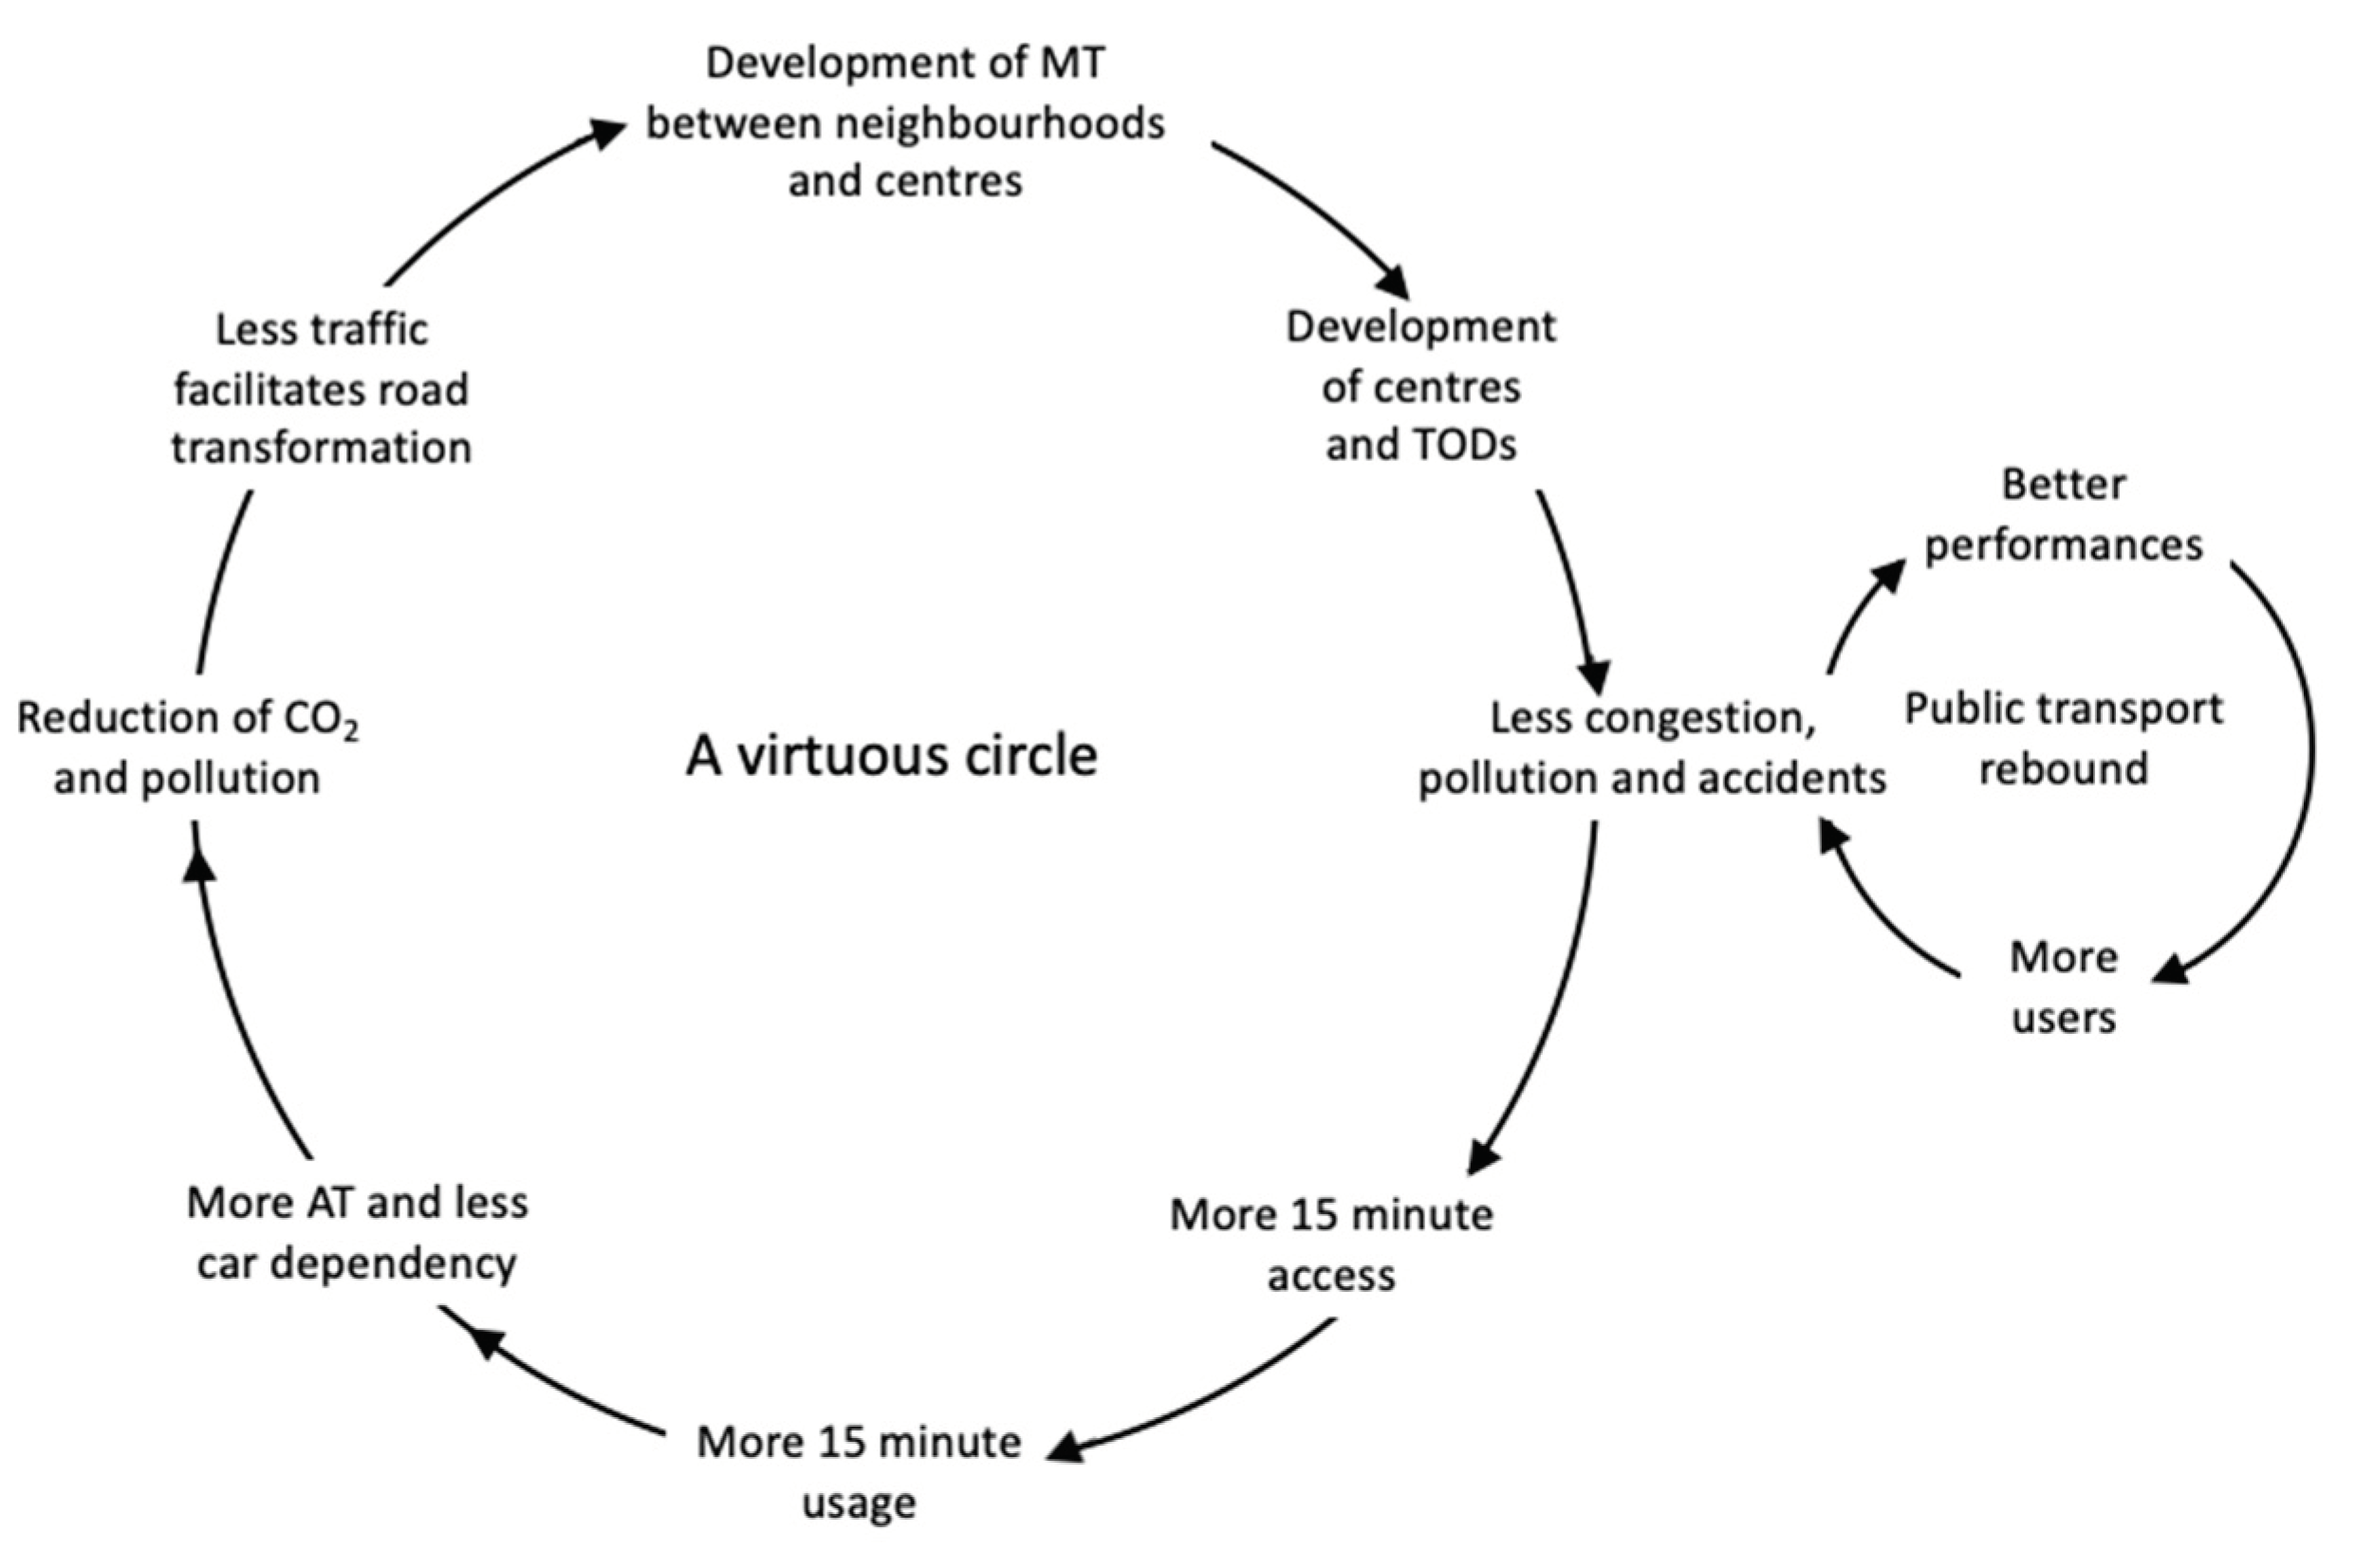
Table 2.
Main potential activities using digital connectivity.
| Smart Working | Instead of commuting to a physical office, many people can work remotely from their homes or other locations. Digital tools facilitate communication, collaboration, and productivity without a traditional office space. |
| Teleconferencing and Virtual Meetings | Replace in-person meetings with virtual ones using platforms like Zoom, Microsoft Teams, or Google Meet. These tools allow real-time communication, screen sharing, and collaboration across distances. |
| Online Learning and Education | Access educational content, courses, and certifications digitally. E-learning platforms offer a wide range of subjects and allow self-paced learning. |
| Digital Entertainment | Stream movies, TV shows, music, and games online. Platforms like Netflix, Spotify, and YouTube provide endless entertainment options. |
| Digital Banking and Financial Services | Manage finances, pay bills, and transfer funds online. Regular payments for services. Mobile banking apps and digital wallets for financial transactions. |
| Telehealth and Online Consultations | Consult healthcare professionals virtually. Telemedicine platforms allow remote diagnosis, prescriptions, and medical advice. |
| Online Shopping and E-Commerce | Purchase goods and services digitally. E-commerce platforms like Amazon, eBay, and local online stores offer a wide range of products. |
| Transport user experience enhancement | Access real-time transit information, plan routes, and purchase tickets via mobile apps. Digital platforms integrate various transport modes (buses, trains, bikes, scooters, vehicle sharing and riding) for seamless travel experiences as in MaaS. |
Table 3.
The accessibility system of a polycentric and multi-timed city.
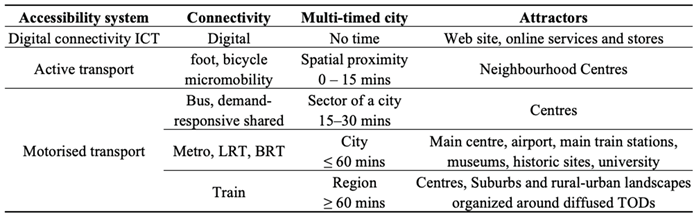
Disclaimer/Publisher’s Note: The statements, opinions and data contained in all publications are solely those of the individual author(s) and contributor(s) and not of MDPI and/or the editor(s). MDPI and/or the editor(s) disclaim responsibility for any injury to people or property resulting from any ideas, methods, instructions or products referred to in the content. |
© 2024 by the authors. Licensee MDPI, Basel, Switzerland. This article is an open access article distributed under the terms and conditions of the Creative Commons Attribution (CC BY) license (http://creativecommons.org/licenses/by/4.0/).
Copyright: This open access article is published under a Creative Commons CC BY 4.0 license, which permit the free download, distribution, and reuse, provided that the author and preprint are cited in any reuse.


