Submitted:
25 March 2024
Posted:
26 March 2024
Read the latest preprint version here
Abstract
In the context of artificial intelligence's pervasive integration across sectors, the rigorous examination of methodologies used in constructing mathematical models is imperative. This study delves into facial recognition models, particularly in their ability to extract features such as age. We address the prevalent practice of training models with unbalanced datasets and its implications for model performance and bias introduction. Utilizing 27,305 facial images, we investigate the influence of dataset imbalance on age prediction based on ethnicity. Employing preprocessing and oversampling techniques, we equalize sample sizes across ethnicities. A Convolutional Neural Network trained on the balanced dataset serves as our baseline, while three additional models undergo training with a 50% sample size reduction for each group to assess accuracy degradation. Our findings reveal a notable decline in accuracy for ethnic groups with reduced representation. The Asian group experiences a 67.94% accuracy deterioration, followed by a 51.60% drop for the Black group, and a 38.46% decline for the White group. These results underscore the sensitivity of certain ethnic groups to underrepresentation, highlighting the nuanced impact on age prediction accuracy. While a 50% reduction in representation does not uniformly result in a 50% accuracy decline, it unquestionably influences predictive accuracy for affected groups.
Keywords:
Facial recognition
; Age prediction
; Convolutional Neural Network (CNN)
; Ethnicity bias
1. Introduction
The integration of artificial intelligence (AI) into various sectors has revolutionized the landscape of modern technology, offering unprecedented capabilities and opportunities for innovation. Among its myriad applications, facial recognition technology stands out as a promising tool with diverse potential uses, ranging from security and surveillance to personalized user experiences. With the increasing reliance on AI-driven solutions in both public and private domains, there arises a pressing need to examine the underlying methodologies shaping the development and deployment of facial recognition models.
In recent years, concerns have emerged regarding the fairness, transparency, and accuracy of facial recognition systems, particularly in their treatment of diverse demographic groups. This problem is often referred to as bias. In the context of facial recognition models and AI, bias refers to systematic inaccuracies or unfairness in the model’s predictions or outcomes, often resulting from underlying biases present in the training data or model architecture.
Dataset bias occurs when the training data used to develop the facial recognition model is not representative of the population it aims to serve. For example, if the dataset contains predominantly images of individuals from certain ethnicities or age groups, the model may be less accurate when presented with images of individuals from underrepresented groups.
Algorithmic bias arises from the inherent assumptions, decision-making processes embedded within the model architecture, and is a phenomenon that occurs when an algorithm produces systematic errors that create unfair outcomes for an individual or groups of individuals [1].
This is also a problem from a legal perspective as there are several regulations made to prevent such discrimination such as the Universal Declaration of Human Rights, European Convention of Human Rights, and the General Data Protection Regulation (GDPR) [5,6].
Driven by this, several approaches have been proposed to try and mitigate this demographics bias in facial recognition such as score normalization [7], data augmentation [8,9], and adversarial learning [10,11]. Even though the use of these methods does alleviate the effects of bias to an extent, none of the proposed solutions have been able to completely solve this problem.
Of course, bias can occur in many forms. There are studies that analyzed the impact of age [12,13], which demonstrated worse performance on children’s faces. There are also studies comparing face recognition performance between males and females [14,15], which showed that face recognition systems performance is worse for females, one reason for that is that women's faces are slightly more covered generally than males due to their longer hair.
Public training datasets generally are also not making the resolution of these issues any easier. In terms of ethnicity, public datasets are heavily biased towards White/Caucasian faces, and other groups are largely underrepresented. This, of course, can and will lead to inconsistent model accuracy and limit the applicability of systems created with them to non-White groups.
As automatic age estimation is becoming increasingly used for a wide range of applications such as forensics [16] and surveillance. This sub-task of facial recognition is also being increasingly studied [17]. Age estimation is a complex task involving various factors such as lighting, hairstyle, glasses, makeup. In an attempt to increase the accuracy of this task, several studies have been made using apparent age and real age during the training of a Convolutional Neural Network (CNN), showing that indeed, using apparent age in combination with real age does improve the estimation of a person’s age [18]. Other studies show that by incorporating information such as race and gender helps in improving the age estimation performance [19]. With one study showing a 20% decrease in age estimation error if the model is trained separately on males and females [20]. Furthermore, recent state-of-the-art research [21] in real and apparent age estimation, utilizing the APPA-REAL dataset, sheds light on the significant impact of race on age estimation algorithms. The APPA-REAL dataset exhibits strong imbalances in the race attribute, influencing real age estimation results. Afro-Americans garnered the highest real age estimation error, followed by Caucasians and Asians. Intriguingly, despite Caucasians constituting 86% of the training data, Asians achieved the lowest real age error with only 11% representation. Regarding apparent age, Afro-Americans achieved the overall lowest error rates, even with a mere 3% representation in the training samples. In contrast, Caucasians, being the most represented group, exhibited the highest error rates.
These findings underscore that the perception of age among Asian and Afro-American individuals appears to be more accurate than that among Caucasians, potentially reflecting physiological phenomena. Past research [22] has noted the unique characteristics of ethnicity and skin color in the aging process, with individuals of Asian, Hispanic, and African American descent exhibiting distinct facial structures.
An in-depth comparison of these studies on age estimation can be seen in Table 1.
This study conducts a comprehensive exploration of the impact of dataset imbalance on the performance and fairness of facial recognition models, with a specific focus on predicting age for different ethnic groups and evaluating accuracy across each demographic. Through detailed analysis and experimentation, we delve into the interplay between dataset composition, model architecture, and predictive accuracy in AI-driven facial recognition systems.
Previous works, such as the survey on age estimation, touch upon dataset challenges but do not deeply explore imbalances related to ethnicity. In contrast, our research specifically targets the critical issue of dataset imbalance, especially concerning ethnicity. This focus is crucial for ensuring fairness and accuracy across diverse ethnic groups.
Moreover, while the deep learning model diagnosis paper explores model architectures, it does not extensively evaluate performance across diverse ethnic groups. Our research goes beyond by meticulously assessing accuracy degradation concerning ethnicity. This nuanced analysis provides valuable insights into the impact of underrepresentation on age prediction accuracy, enhancing the understanding of algorithmic biases in facial recognition systems.
Additionally, the end-to-end architecture paper incorporates face attributes but focuses on real and apparent age estimation without a specific emphasis on ethnicity-related biases. Our research sheds light on the intricate relationship between dataset imbalance, model performance, and predictive accuracy across diverse ethnic groups. By advocating for proactive measures to mitigate biases, it contributes to the development of more equitable and inclusive AI systems.
While the survey emphasizes general validation and the end-to-end architecture considers various attributes, neither specifically addresses the sensitivity of certain ethnic groups to underrepresentation. Our study underscores this sensitivity, emphasizing the nuanced impact on age prediction accuracy. This aspect highlights the need for tailored approaches in algorithmic fairness for different ethnicities.
In summary, our research makes significant strides by addressing specific challenges related to dataset imbalance, offering proactive solutions, and providing a nuanced understanding of algorithmic biases across diverse ethnic groups. This focused approach contributes substantially to the development of fairer and more inclusive facial recognition technologies. Our aim is to uncover insights that inform the development and adoption of fairer technologies within artificial intelligence, fostering broader discussions on algorithmic fairness, diversity, and inclusion. By gaining a deeper understanding of the opportunities and challenges in leveraging AI for facial recognition applications in today's dynamic digital environment, we strive to drive meaningful progress in the field.
2. Materials and Methods
We utilized a pre-processed publicly available dataset [23], derived from the UTK Dataset [24]. Like many other datasets, this dataset is heavily weighted towards the White group. To mitigate these imbalances, we employed preprocessing and oversampling techniques to equalize sample sizes across ethnicities. Subsequently, we trained a CNN using the balanced dataset as our baseline. In order to see just how much dataset imbalance affects the age estimation for each ethnic group, three additional models were trained with a 50% reduction in sample size for each group to evaluate accuracy degradation. Our experiment revealed a significant decline in accuracy for ethnic groups with reduced representation, with the decline varying among groups. These findings underscore the sensitivity of certain ethnic groups to underrepresentation, emphasizing the nuanced impact on age prediction accuracy.
The already completed pre-processing steps on [23] involved cropping images to isolate only the face. Additionally, the original dataset [24], organized into different folders, was consolidated into a CSV file for easier utilization. This CSV file contains labels such as age, gender, ethnicity, and pixel values of the images. The samples are divided into 5 ethnic groups labeled from 0 to 4, which stand for White, Black, Asian, Indian and others (Hispanic, Latino, Middle Eastern). Gender is comprised of two labels 0 for males, and 1 for females. The dataset comprises of 27,305 images. We can see a few example images along with their age, gender and ethnicity information in Figure 1. The dimensions of the images are 48x48.
Before determining if additional pre-processing is necessary, we first sought to gain initial insights into the data, particularly examining the distribution of samples across various groups. Initially, we assessed the overall sample distribution within the dataset. As depicted in Figure 2, the age distribution illustrates a predominant concentration of samples between 20 and 40 years of age.
Next, we can find out the overall distribution of samples by gender. And as we can see from Figure 3, the samples in the dataset are somewhat evenly distributed, with the count of male samples being 12,391 and female samples 11,314.
Now that we have an initial idea of the distribution of samples in regard to age and gender, we can have a look at the distribution of ethnicities in the dataset. The samples as mentioned are divided into 5 ethnic groups labeled from 0 to 4, which stand for White, Black, Asian, Indian and others (Hispanic, Latino, Middle Eastern). From Figure 4, we can see a very uneven distribution of these groups across the dataset. With the White group consisting of 10,078 samples, Black 4,526, Asian 3,434, Indian 3,975, and other consisting of only 1,692 samples.
Due to a significant disparity in the number of samples per group, simply oversampling the smaller groups would not be the most suitable approach. For instance, comparing the sample count between the White group and the Others group reveals an 83.21% difference. Oversampling the Others group excessively to match the White group could introduce issues such as loss of generalization, where the model memorizes minority class instances, leading to overfitting rather than capturing underlying data patterns. Similarly, undersampling the data to match smaller group sizes may result in the loss of valuable information, restricting the model from capturing the full complexity of underlying patterns and reducing overall performance, thus making the model less robust and worsening generalization performance. Therefore, we opted to combine certain groups. Specifically, we merged the Black and Indian groups into one (Group 1) and the Asian and Others groups into another (Group 2), creating a more balanced distribution. While the split remains somewhat uneven, the difference between classes is now less pronounced. Consequently, we oversampled the two minority classes to align with the sample count of the White group.
Now that we have a more formatted dataset, we can delve deeper into the age distribution, now segmented by group. This analysis will provide us with valuable insights into the performance of our model later on.
Figure 5 illustrates that in group 0, the largest number of samples falls within the age range of 20 to 40, followed by the range of 40 to 60. The number of samples decreases slightly in the 0 to 20 age range, with a gradual decline in samples beyond 60.
The distribution of Group 1, as depicted in Figure 6, is notably concentrated within the age range of 20 to 40, with the majority of samples clustered within this range. A significant portion of the samples is observed in their late 20s.
The age distribution for Group 2, illustrated in Figure 7, reveals a predominantly younger population, with the vast majority of samples falling within the age range of 20 to 40, as well as 0 to 10.
The final preprocessing step involves normalizing the pixel values of the images in the dataset, which range from 0 to 255. Since we utilized the VGG16 [25] model trained on the ImageNet [26] dataset as our base model, it's crucial to normalize the pixel values in alignment with VGG16's expectations. Given that our images are grayscale (having only one color channel), whereas VGG16 expects three color channels, we replicated the pixel values to create the missing channels. This adjustment ensures that the image maintains its appearance while conforming to VGG16's structure requirements.
Regarding the pixel values, we zero-centered each color channel concerning the ImageNet dataset, without applying scaling. This completes the preprocessing of the data and the initial data analysis.
We employed the following model architecture for our experiments: a VGG16 base with 15 frozen layers and 4 trainable layers, followed by a flatten layer, a dense layer with 256 units and ReLU activation, a batch normalization layer, another dense layer with 128 units and ReLU activation, and another batch normalization layer. The output layer consists of a single unit with linear activation. The input shape is (48, 48, 3). This architecture is shown in Figure 8.
We initialized the learning rate at 5e-5 and utilized the Adam optimizer with mean squared error as the loss function. Additionally, we implemented methods for reducing the learning rate on a plateau, monitoring validation loss with a patience of 20, and a minimum learning rate of 1e-11. The model underwent training with a batch size of 32 for 100 epochs.
Subsequently, we trained this model on the full dataset, with each category after oversampling consisting of 10,078 samples, which served as our base model. Following this, we trained three additional models, where the only difference lies in the reduction of the number of samples in one of the categories by 50%.
We then compared the results of our models to assess the degradation in each category relative to our base model. This comparison involved visualizing the predictions against the actual values and evaluating the models' performance based on their Mean Absolute Error (MAE).
3. Results
3.1. Base Model Performance Analysis
The study commenced with the training of a baseline facial recognition model on a balanced dataset. What we could expect based on previous studies, the performance across demographic categories was not uniform, indicating inherent algorithmic biases. Notably, slight oversampling of certain classes, particularly classes 1 and 2, may have influenced initial accuracy metrics. This uneven performance set the stage for a more in-depth investigation into the impact of reduced category representation on model accuracy.
Figure 9 illustrates notable discrepancies in performance among different groups, with group 0 exhibiting the largest errors. Upon examining the overall performance of the model, it demonstrates satisfactory behavior. To further evaluate its accuracy, we have plotted the predictions against actual values in a scatter plot. The data, sorted by age from lowest to highest, depicts real values as a dotted red line, while the corresponding model predictions are represented by blue dots. The test set comprises 6,047 samples. In Figure 10, the blue lines (representing predictions) generally align closely with the actual values, although some outliers are observed, either overestimating or underestimating.
3.2. Model Variations and Accuracy Degradation
Subsequent experiments involved training three additional models, each with a 50% reduction in representation for a specific category. The goal was to assess the extent of accuracy degradation under varying degrees of dataset imbalance. The findings revealed a significant decline in accuracy for each category, indicating the sensitivity of the facial recognition models to reduced representation.
We begin by generating a scatter plot similar to the one used for the base model to visually assess the overall performance of our models. The three additional models are named based on the underrepresented group during training: model 0, model 1, and model 2 correspond to groups 0, 1, and 2, respectively. We can see from Figure 11 that the blue dots representing our predictions are much further apart and further away from the red line representing true values in the subsequent models compared to the base model, showing a definite overall degradation in performance.
Additionally, we create scatter plots comparing predicted versus true values for each category between the base model and the underrepresented model variations. This analysis provides a clearer insight into the extent of performance changes. Figure 12, for instance, compares predictions for Group 0 between the base model and model 0. Despite the base model's poor performance on Group 0, the scatter plot highlights a noticeable decline in accuracy with model 0, evident in the increased dispersion of blue dots.
Figure 13 illustrates a similar accuracy degradation observed for group 1 when comparing the base model to model 1.
Figure 14 demonstrates a substantial decrease in accuracy for group 2 within model 2 compared to the base model. This decline underscores the impact of underrepresentation during training, revealing a consistent pattern of decreased accuracy across all groups.
Now that we have compared the differences in real and estimated values across different ethnicities and models, observing a clear decline in overall performance as well as group-level performance, our next objective is to quantify the extent of this degradation. We aim to determine precisely how much performance has worsened between groups when underrepresented and assess whether training models with a 50% reduction in a certain group affected the performance of unaltered groups. Our goal is to understand whether the overall performance degradation observed previously can be attributed solely to the specific underrepresented group. To achieve this, we utilize the MAE as our primary metric for analysis.
We have visualized the MAE across different models and groups to better understand the variations in accuracy, as depicted in Figure 15. Two immediate observations stand out: there is a significant increase in error for the underrepresented group, while underrepresenting a certain group generally does not affect the performance of other groups.
Analyzing the performance degradation for group 0, we find that the base model has an MAE of 3.7254, while model 0 exhibits an MAE of 5.1583, representing a 38.46% increase in error. The top-performing model for group 0 is model 1, boasting an MAE of 3.6091, indicating a 3.12% improvement over the base model.
Turning to group 1, a notable rise in error is evident, with the base model recording an MAE of 2.8483 compared to model 1's MAE of 4.3181, reflecting a 51.60% degradation in performance. Model 0 emerges as the best performer for group 1, achieving a 2.29% higher performance than the base model.
For group 2, the most significant performance change is observed, with a 67.94% increase in error between the base model and model 2. Interestingly, the analysis reveals the most substantial difference in performance for an unaltered group: when group 0 is underrepresented, it boosts the accuracy of group 2 by 16.49%.
Comparing the overall MAE across all models, we confirm that maintaining equal representation of groups, even with the use of oversampling techniques, yields the best performance. Figure 16 illustrates this, indicating that the base model performs 13.72% better than model 0, 15.38% better than model 1, and 13.29% better than model 2.
The observed accuracy degradation not only emphasizes the limitations of facial recognition models but also prompts a critical examination of strategies for equitable model training. The study's results underscore the importance of developing methodologies that account for algorithmic biases, dataset imbalances, and variations in demographic representation.
4. Discussion
The results of our study shed light on the nuanced interplay between dataset imbalance, model performance, and the predictive accuracy of facial recognition systems across different ethnic groups. By delving into the implications of these findings, we can better understand the broader landscape of algorithmic fairness and model deployment in artificial intelligence.
Our analysis revealed significant disparities in model performance when certain ethnic groups were underrepresented during training. This degradation in accuracy underscores the importance of addressing dataset imbalances in the development of facial recognition technologies. It also highlights the inherent biases that can emerge within these systems, emphasizing the need for proactive measures to mitigate such biases.
The observed decline in accuracy for underrepresented groups underscores the complexities involved in training facial recognition models. There seems however, to be no one way of resolving this issue, but perhaps a combination of techniques might be necessary. Perhaps oversampling very sensitive groups to underrepresentation and algorithmic bias, along with the use of data augmentation and other tools at our disposal. Moreover, our findings indicate that the impact of dataset imbalance extends beyond the underrepresented groups, influencing the performance of unaltered groups as well.
These results have significant implications for the design and deployment of facial recognition technologies in real-world settings. As facial recognition systems become increasingly integrated into various sectors, including law enforcement, surveillance, and commerce, it is imperative to ensure that these systems uphold principles of fairness, transparency, and inclusivity.
Moving forward, future research should explore alternative methodologies for addressing dataset imbalance and mitigating algorithmic bias in facial recognition models. Collaborative efforts between researchers, policymakers, and industry stakeholders are essential to develop standardized protocols for dataset collection, model training, and evaluation. Moreover, ongoing dialogue and engagement with affected communities are crucial to foster trust and accountability in the development and deployment of AI-driven technologies.
In conclusion, our study contributes to the growing body of research on algorithmic fairness and diversity in artificial intelligence. By uncovering the challenges and implications of dataset imbalance in facial recognition systems, we hope to catalyze meaningful advancements towards more equitable and inclusive technological landscapes.
Author Contributions
Conceptualization, Nenad Panić and Marina Marjanović; Data curation, Nenad Panić; Formal analysis, Nenad Panić; Investigation, Nenad Panić; Methodology, Nenad Panić and Marina Marjanović; Project administration, Marina Marjanović; Resources, Nenad Panić and Marina Marjanović; Software, Nenad Panić; Supervision, Marina Marjanović; Validation, Marina Marjanović and Timea Bezdan; Visualization, Nenad Panić; Writing – original draft, Nenad Panić; Writing – review & editing, Nenad Panić.
Funding
This research received no external funding.
Data Availability Statement
The data was derived from the following resource available in the public domain: https://www.kaggle.com/datasets/nipunarora8/age-gender-and-ethnicity-face-data-csv/data (Accessed on 19 March 2024).
Conflicts of Interest
The authors declare no conflicts of interest.
References
- Friedman, B.; Nissenbaum, H. Bias in computer systems. ACM Trans. Inf. Syst. 1996, 14, 330–347. [Google Scholar] [CrossRef]
- Acien, A.; Morales, A.; Vera-Rodriguez, R.; Bartolome, I.; Fierrez, J. Measuring the Gender and Ethnicity Bias in Deep Models for Face Recognition. In Progress in Pattern Recognition, Image Analysis, Computer Vision, and Applications, Proceedings of the 23rd CIARP: Iberoamerican Congress on Pattern Recognition, Madrid, Spain, November 19-22, 2018; Vera-Rodriguez, R., Fierrez, J., Morales, A.; 584-593.
- Hendricks, L. A.; Burns K.; Saenko K.; Darrell T.; Rohrbach, A. Women also snowboard: Overcoming bias in captioning models. Proceedings of the European Conference on Computer Vision, Munich, Germany, September 8-14, 2018; 771-787.
- Wang, M.; Deng, W.; Hu, J.; Peng, J.; Tao, X.; Huang, Y. Race faces in-the-wild: Reduce bias by deep unsupervised domain adaptation. Proceedings of the IEEE/CVF International Conference on Computer Vision (ICCV), Seoul, Korea, October 27-November 2, 2019; 692-702.
- Terhörst, P.; Kolf, J. N.; Huber, M.; Kirchbuchner, F.; Damer, N.; Moreno, A. M.; Fierrez, J.; Kuijper, A. A Comprehensive Study on Face Recognition Biases Beyond Demographics. IEEE Transactions on Technology and Society 2022, 3, 16–30. [Google Scholar] [CrossRef]
- Voigt, P.; Bussche, A. V. D. The EU General Data Protection Regulation (GDPR): A Practical Guide, 1st ed.; Springer Cham: Switzerland, 2017; pp. 141-187.
- Terhörst, P.; Kolf, J. N.; Damer, N.; Kirchbuchner, F.; Kuijper, A. Post-comparison mitigation of demographic bias in face recognition using fair score normalization. Pattern Recognition Letters 2020, 140, 332–338. [Google Scholar] [CrossRef]
- Kortylewski, A.; Egger, B.; Schneider, A.; Gerig, T.; Morel-Foster, A.; Vetter, T. Analyzing and reducing the damage of dataset bias to face recognition with synthetic data. Proceedings of the IEEE Conf. Comput. Vis. Pattern Recognit. (CVPR) Workshops, Long Beach, CA, USA, Jun 2019; 2261-2268.
- Wang, P.; Su, Z.; Zhao, Z.; Guo, Y.; Zhao, Y.; Zhuang, B. Deep class-skewed learning for face recognition. Neurocomputing 2019, 363, 35–45. [Google Scholar] [CrossRef]
- Gong, S.; Liu, X.; Jain, A. K. Jointly de-biasing face recognition and demographic attribute estimation. Proceedings of the European Conference on Computer Vision (ECCV), Glasgow, United Kingdom, August 23–28, 2020; 330-347.
- Morales, A.; Fierrez, J.; Vera-Rodriguez, R.; Tolosana, R. SensitiveNets: Learning agnostic representations with applications to face images. IEEE Trans. Pattern Anal. Mach. Intell. 2021, 43, 2158–2164. [Google Scholar] [CrossRef] [PubMed]
- Michalski, D; Yiu, S. Y.; Malec, C. The Impact of Age and Threshold Variation on Facial Recognition Algorithm Performance Using Images of Children. Proceedings of the International Conference on Biometrics (ICB), Gold Coast, QLD, Australia, 20-23 Feb. 2018; 217-224.
- Srinivas, N.; Ricanek, K.; Michalski, D.; Bolme, D. S.; King, M. Face recognition algorithm bias: Performance differences on images of children and adults. Proceedings of the EEE/CVF Conference on Computer Vision and Pattern Recognition (CVPR) Workshops, Long Beach, CA, USA, June 16-20, 2019.
- Albiero, V.; Bowyer, K. W. Is face recognition sexist? no, gendered hairstyles and biology are. arXiv 2020, arXiv:2008.06989. [Google Scholar]
- Albiero, V.; Zhang, K.; Bowyer, K. W. How does gender balance in training data affect face recognition accuracy. Proceedings of the IEEE International Joint Conference on Biometrics (IJCB), Houston, TX, USA, 2020; 1-10.
- Albert, A. M.; Ricanek, K.; Patterson, E. A review of the literature on the aging adult skull and face: Implications for forensic science research and applications. Forensic Science International 2007, 172, 1–9. [Google Scholar] [CrossRef] [PubMed]
- Angulu, R.; Tapamo, J. R.; Adewumi, A. O. Age estimation via face images: a survey. J. Image Video Proc. 2018, 2018, 42. [Google Scholar] [CrossRef]
- Clapes, A.; Bilici, O.; Temirova, D.; Avots, E.; Anbarjafari, G.; Escalera, S. From Apparent to Real Age: Gender, Age, Ethnic, Makeup, and Expression Bias Analysis in Real Age Estimation. Proceedings of the IEEE Conference on Computer Vision and Pattern Recognition (CVPR) Workshops, Salt Lake City, Utah, USA, June 18-22, 2018; 2373-2382.
- Xing, J.; Li, K.; Hu, W.; Yuan, C.; Ling, H. Diagnosing deep learning models for high accuracy age estimation from a single image. Pattern Recognition 2017, 66, 106–116. [Google Scholar] [CrossRef]
- Guo, G.; Mu, G.; Fu, Y.; Dyer, C.; Huang, T. A study on automatic age estimation using a large database. Proceedings of the IEEE 12th International Conference on Computer Vision, Kyoto, Japan, 2009; 1986-1991.
- Jacques, J. C. S.; Ozcinar, C.; Marjanovic, M.; Baró, X.; Anbarjafari, G.; Escalera, S. On the effect of age perception biases for real age regression. Proceedings of the 14th IEEE International Conference on Automatic Face & Gesture Recognition, Lille, France, 2019; 1-8.
- Vashi, N. A.; Maymone, M. B. D. C.; Kundu, R. V. Aging differences in ethnic skin. The Journal of Clinical and Aesthetic Dermatology 2016, 9, 31–38. [Google Scholar] [PubMed]
- Age, gender and ethnicity face data cv, Kaggle.com. Available online: https://www.kaggle.com/datasets/nipunarora8/age-gender-and-ethnicity-face-data-csv/data (Accessed on 19 March 2024).
- UTKFace, github.io. Available online: https://susanqq.github.io/UTKFace/ (Accessed on 19 March 2024).
- Simonyan, K.; Zisserman, A. Very deep convolutional networks for large-scale image recognition. arXiv 2014, arXiv:1409.1556. [Google Scholar]
- ImageNet. Available online: https://www.image-net.org (Accessed on 19 March 2024).
Figure 1.
Example images from the dataset.
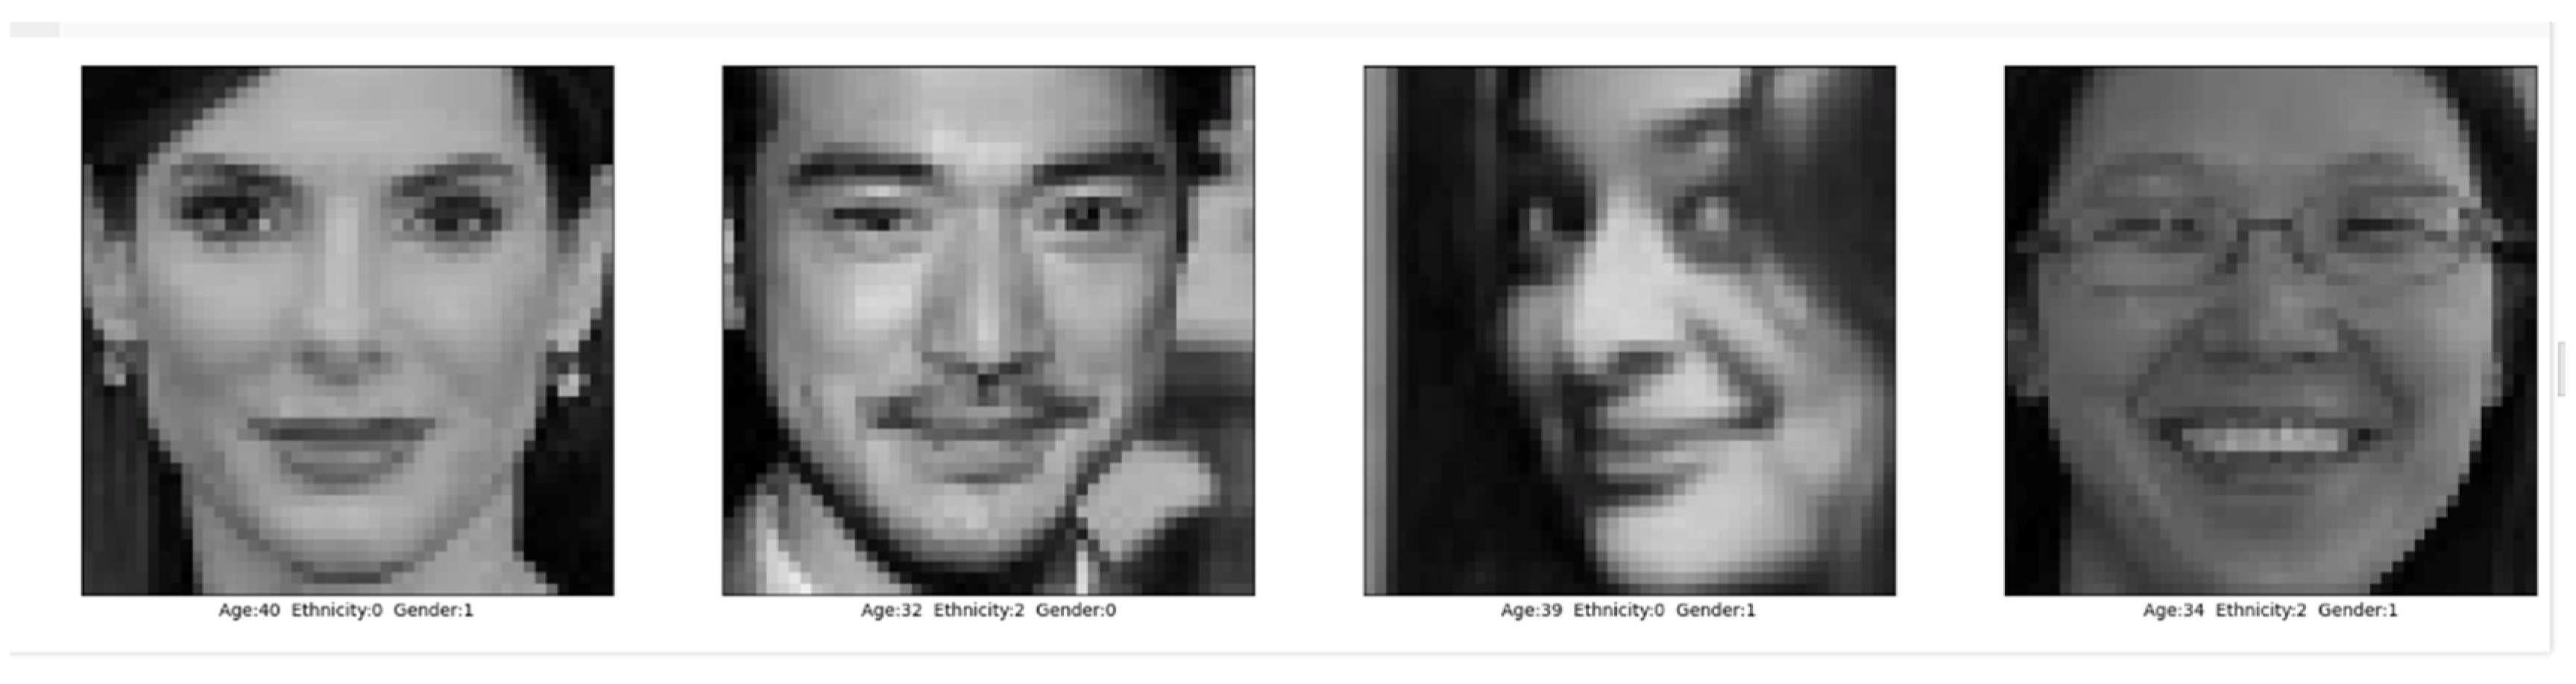
Figure 2.
Age distribution of samples within the whole dataset.
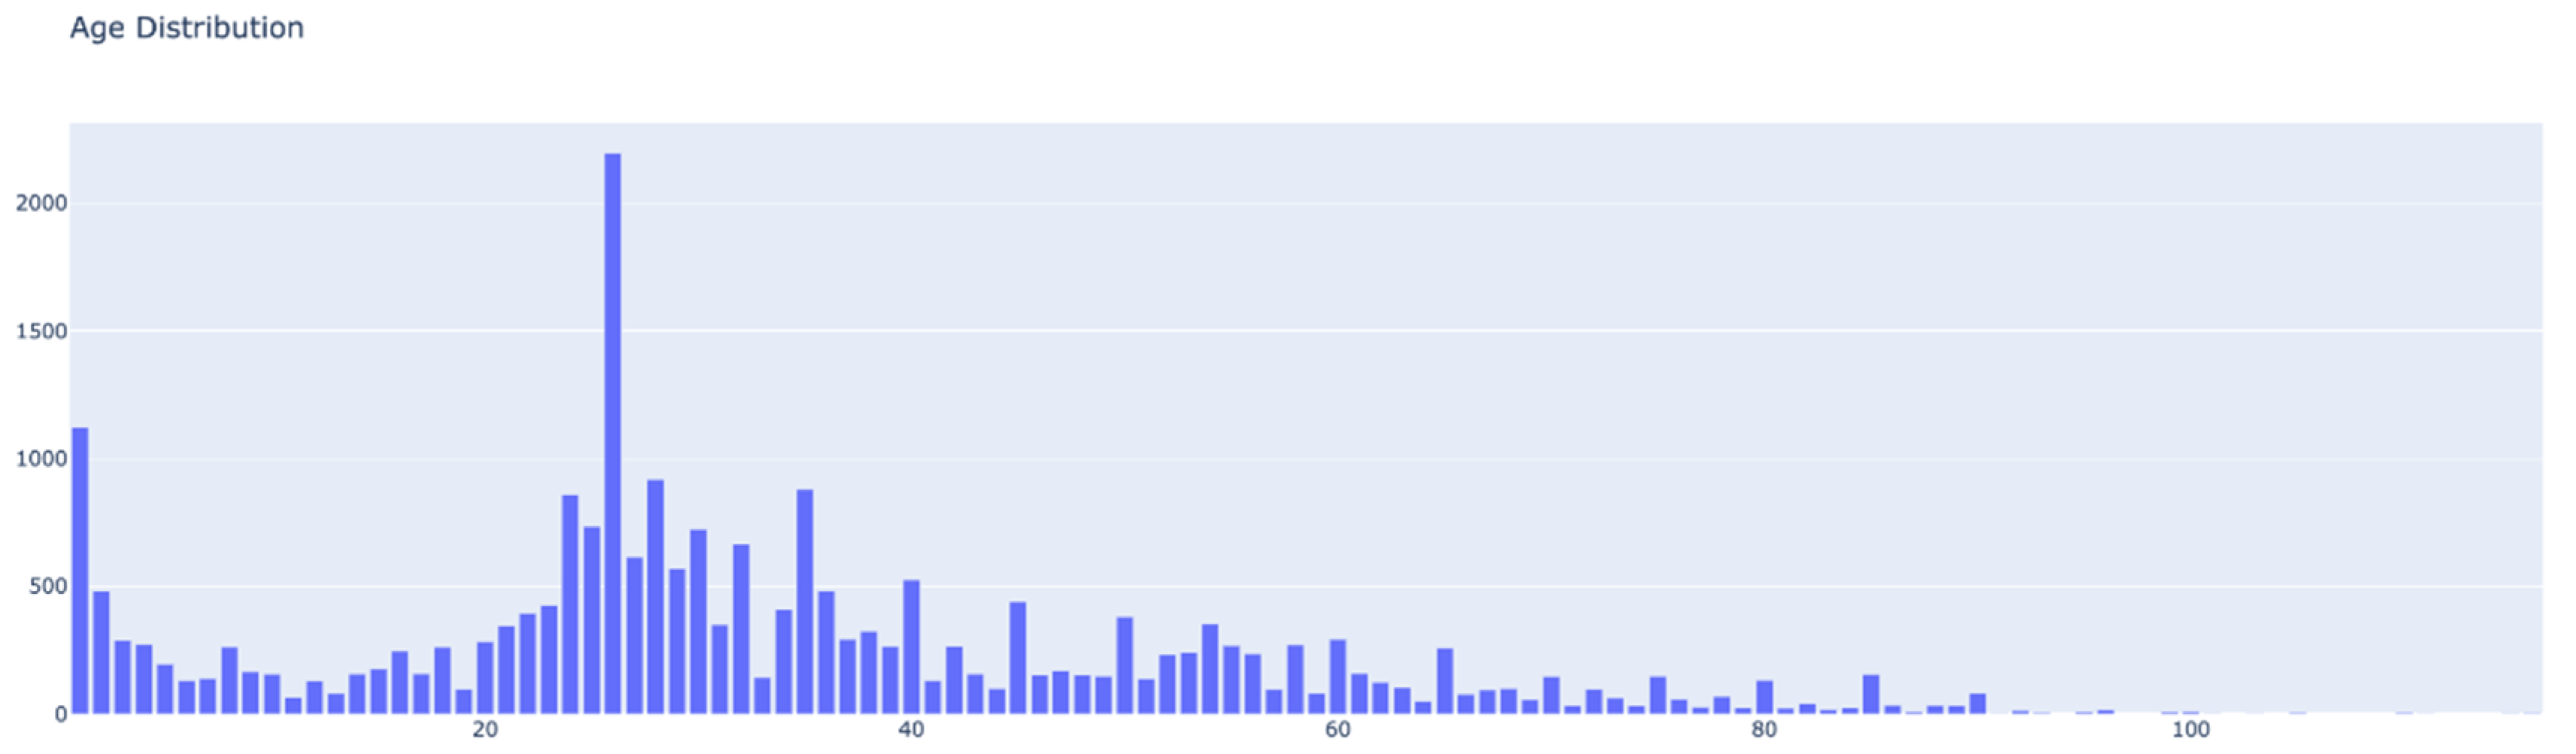
Figure 3.
Gender distribution of samples within the whole dataset.
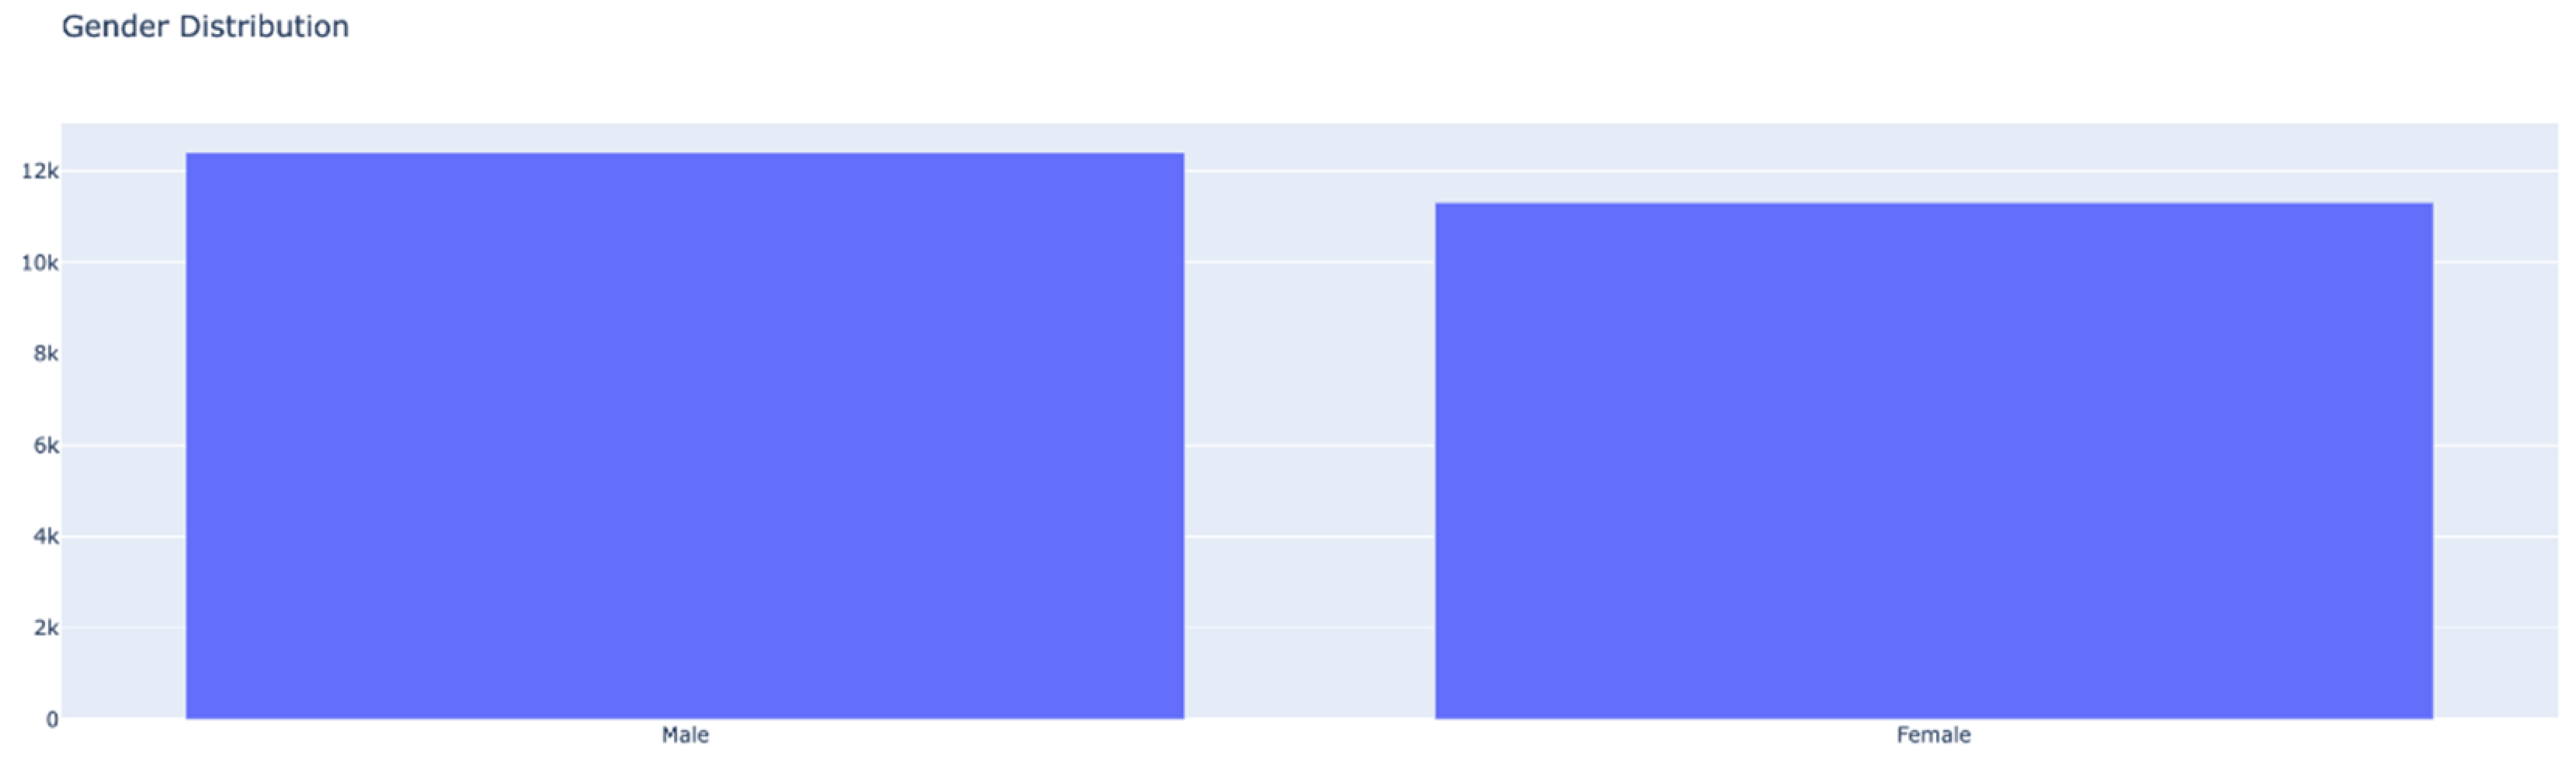
Figure 4.
Ethnicity distribution of samples within the whole dataset.
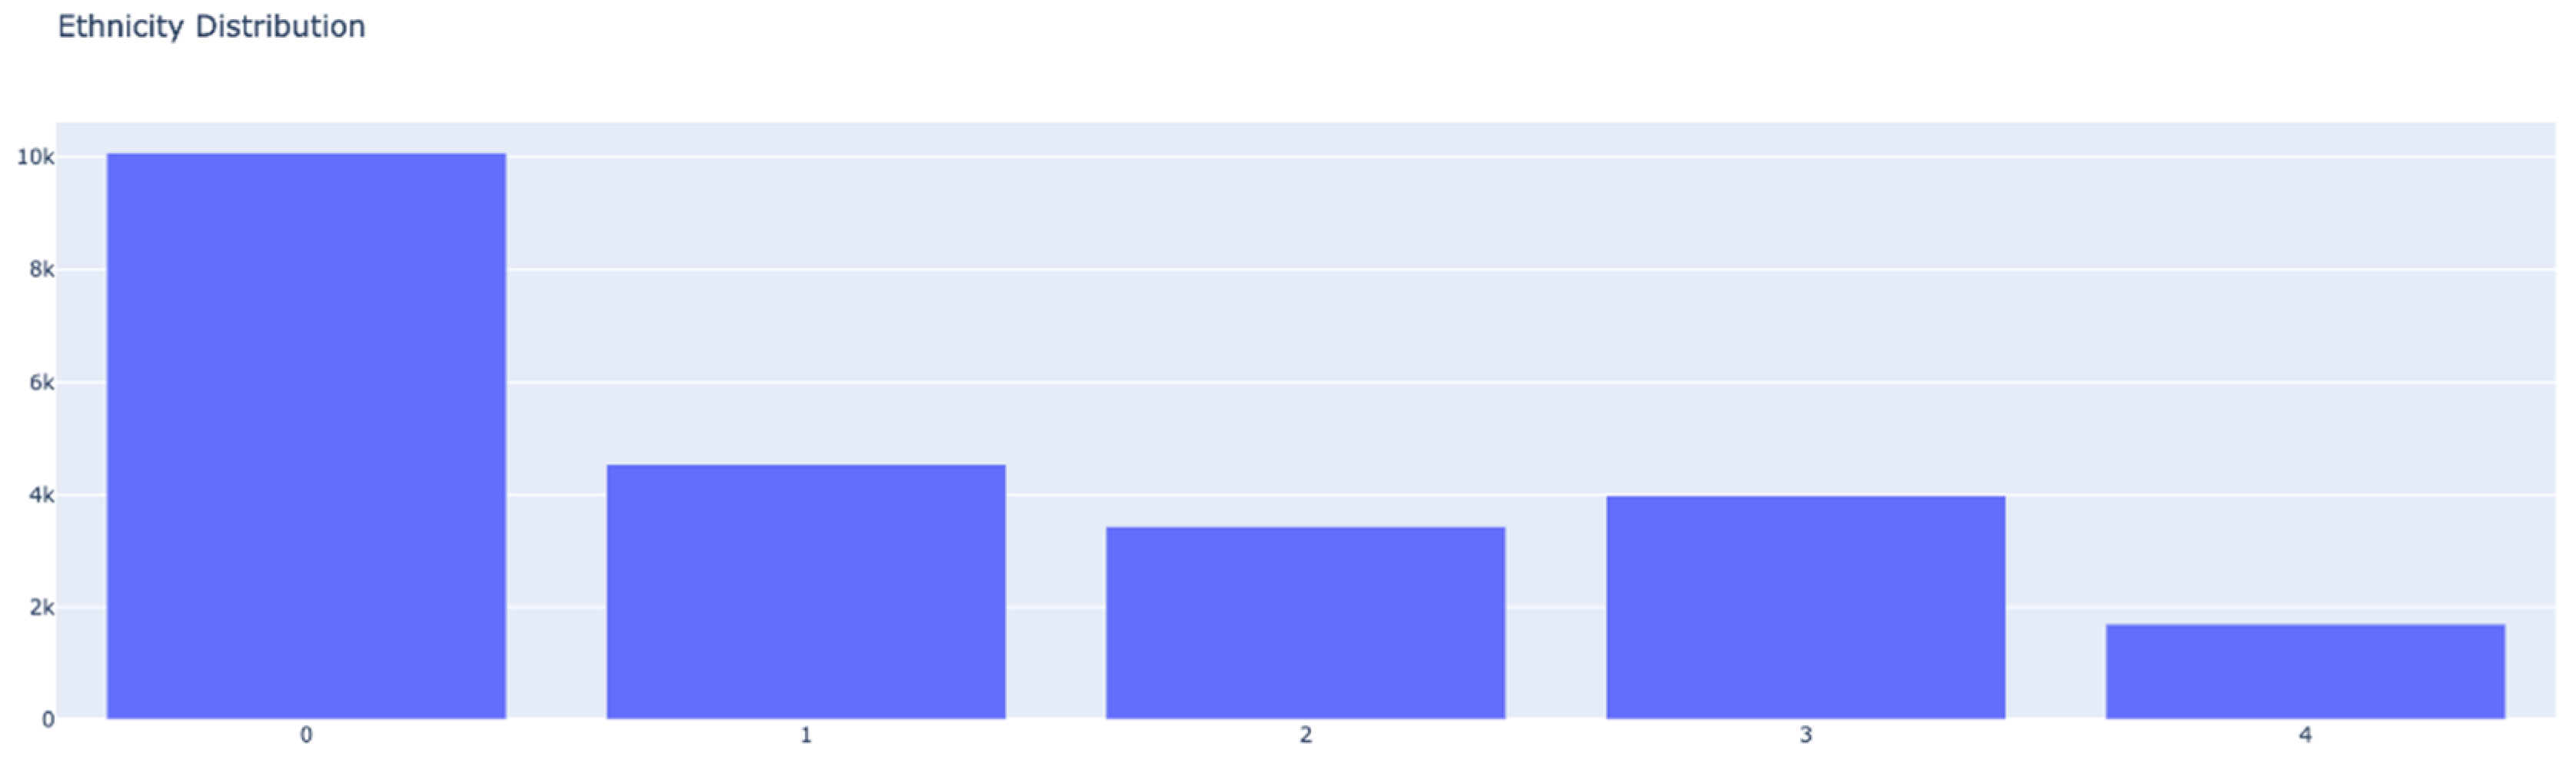
Figure 5.
Age distribution for group 0.
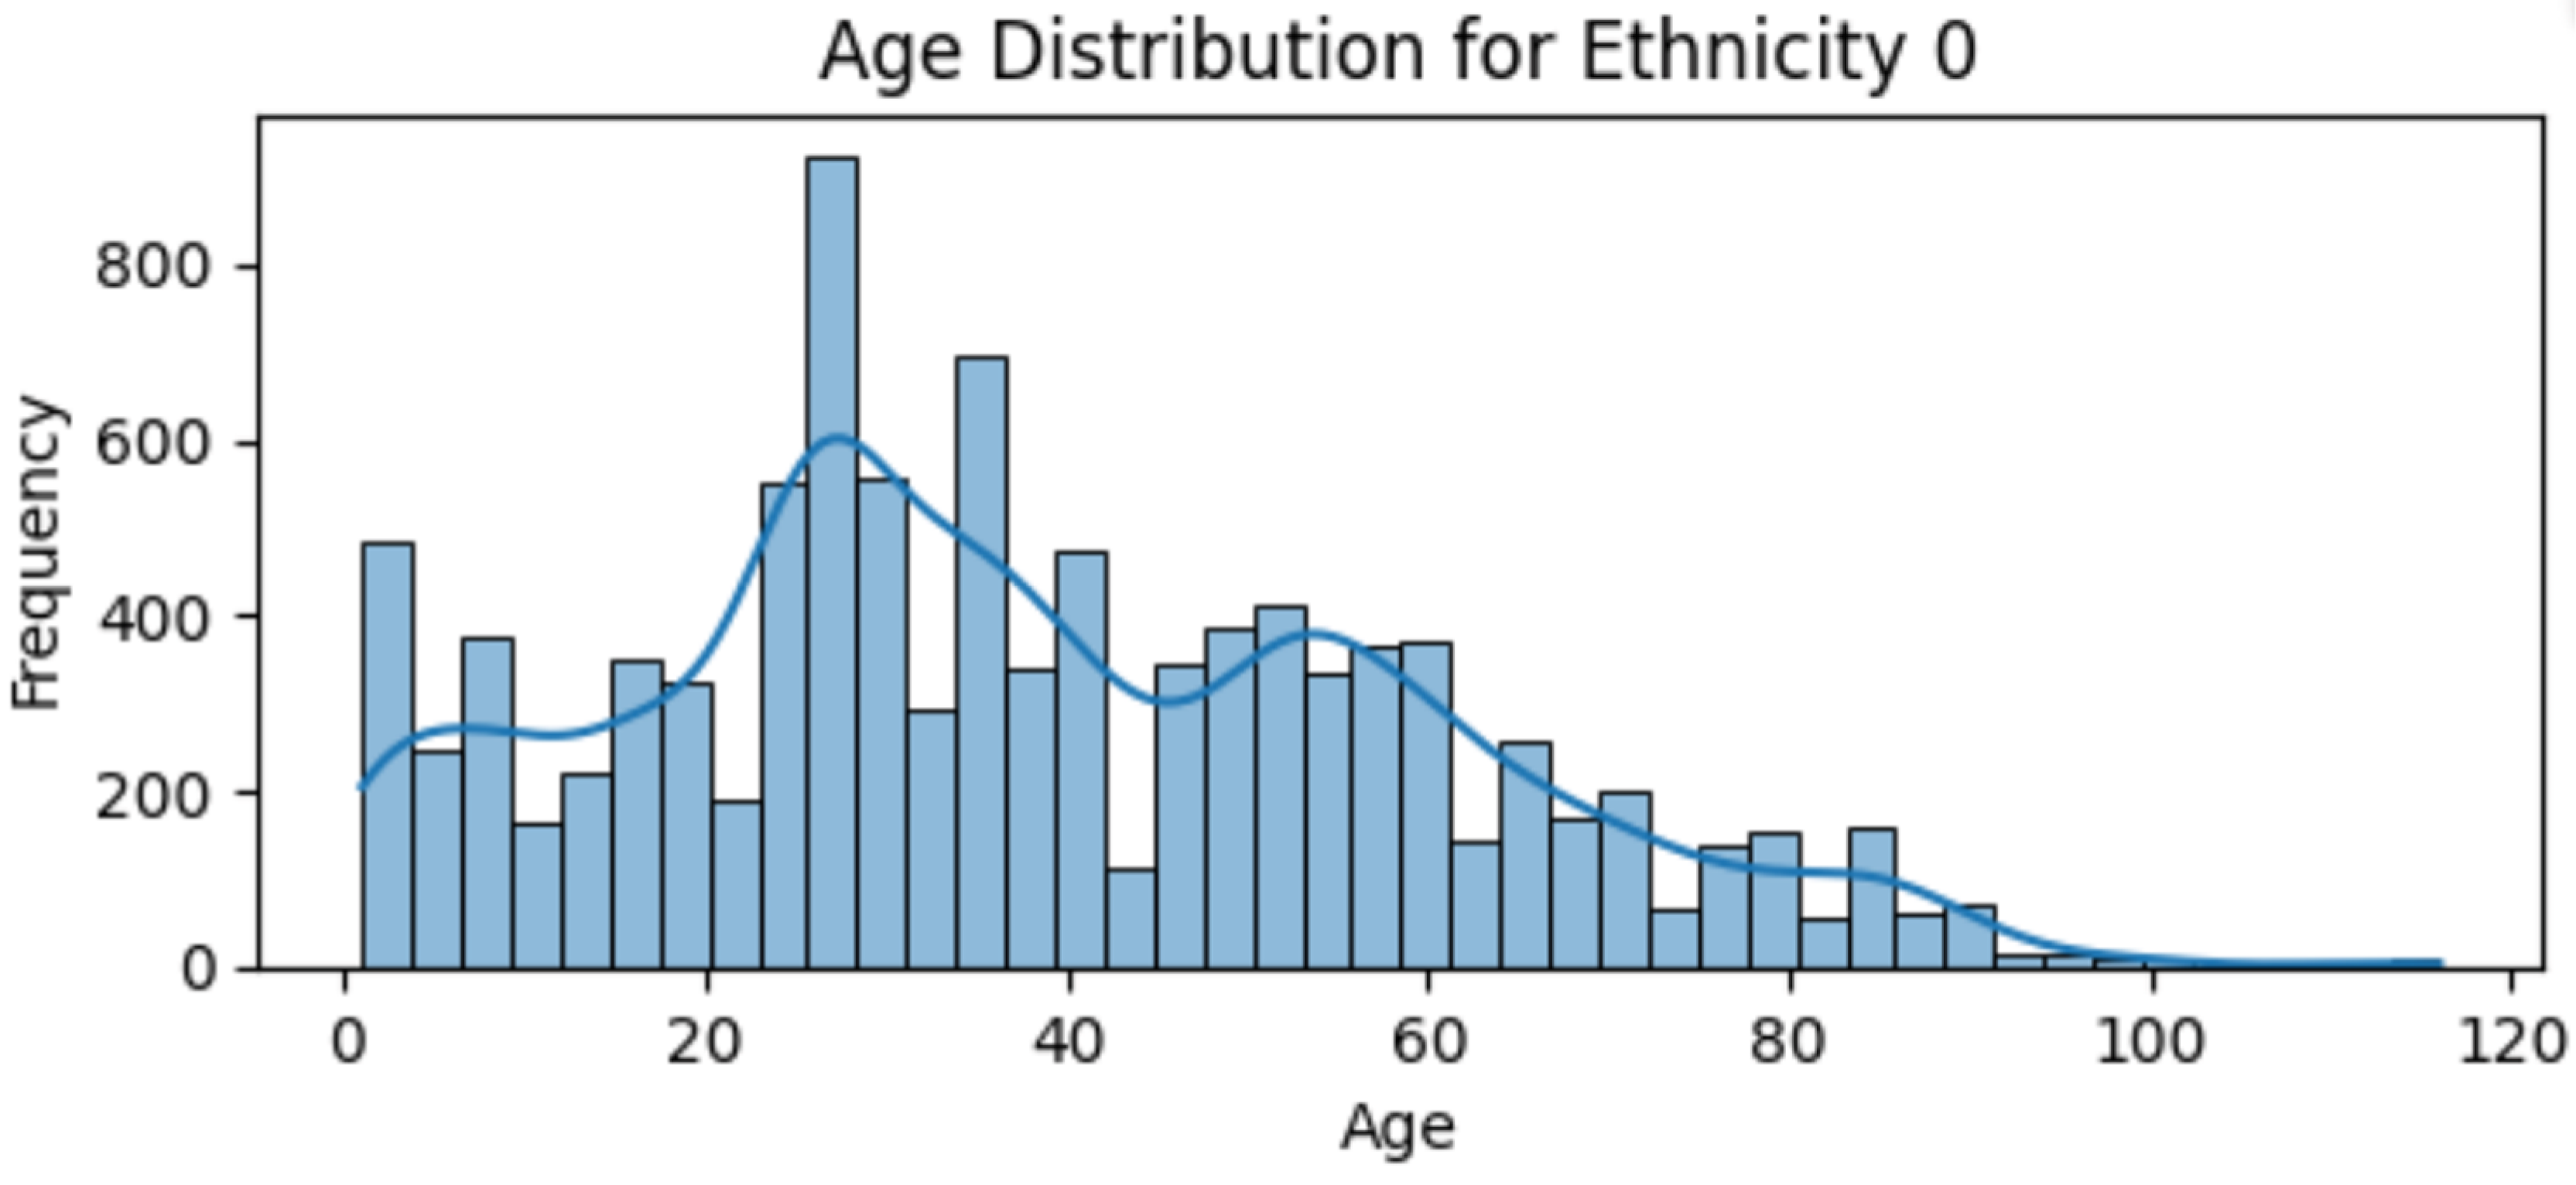
Figure 6.
Age distribution for group 1.
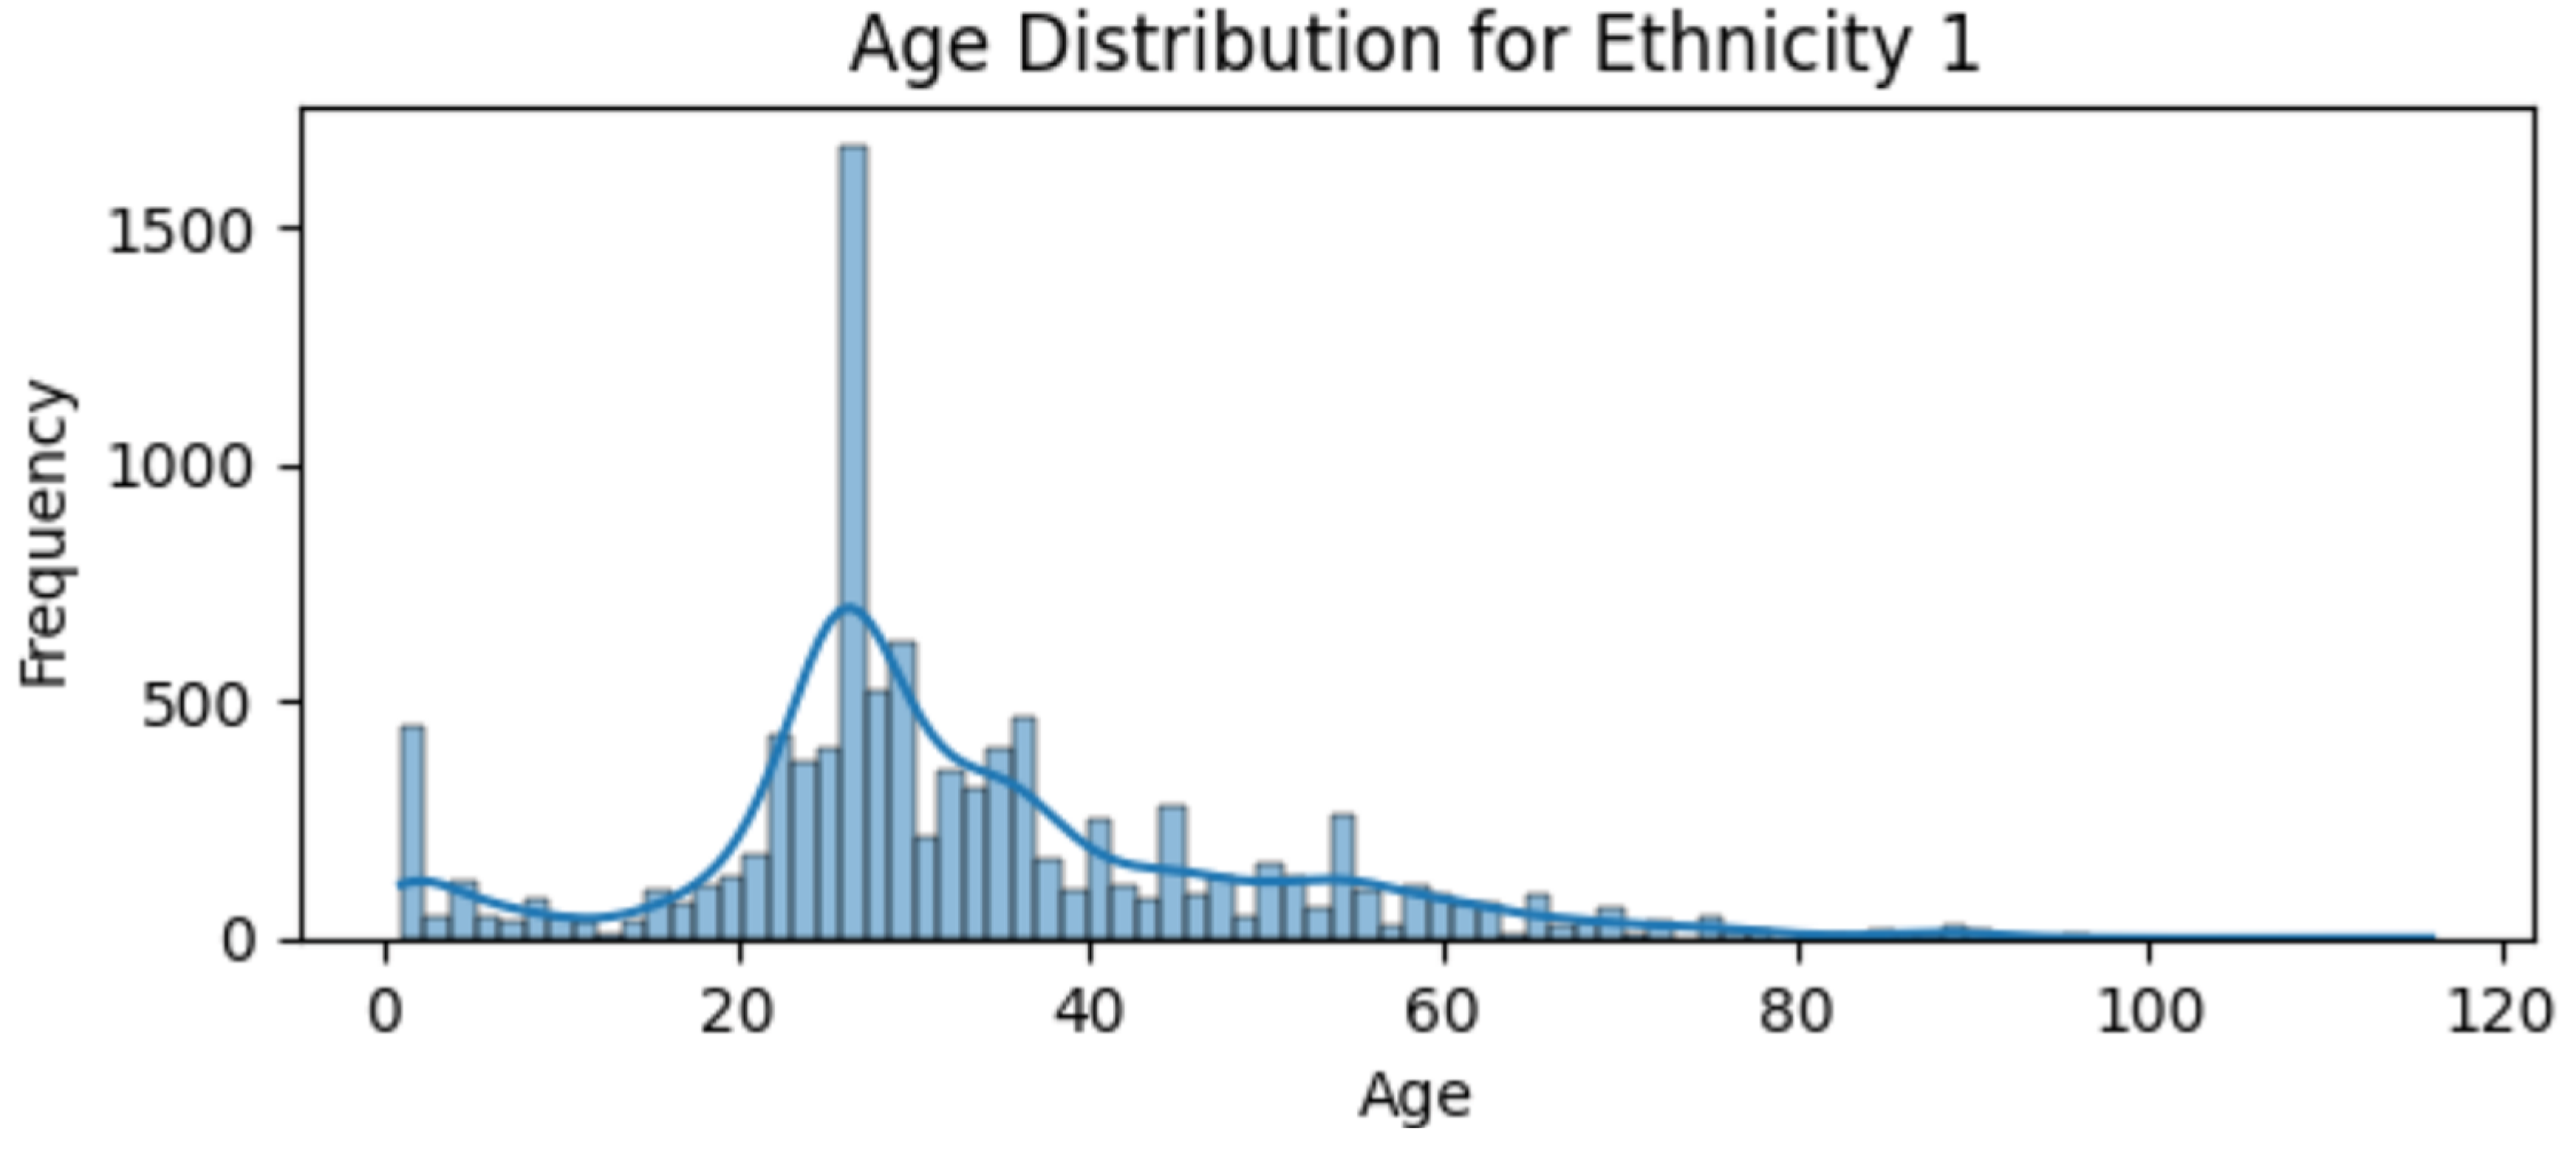
Figure 7.
Age distribution for group 2.

Figure 8.
Model architecture used in this paper.
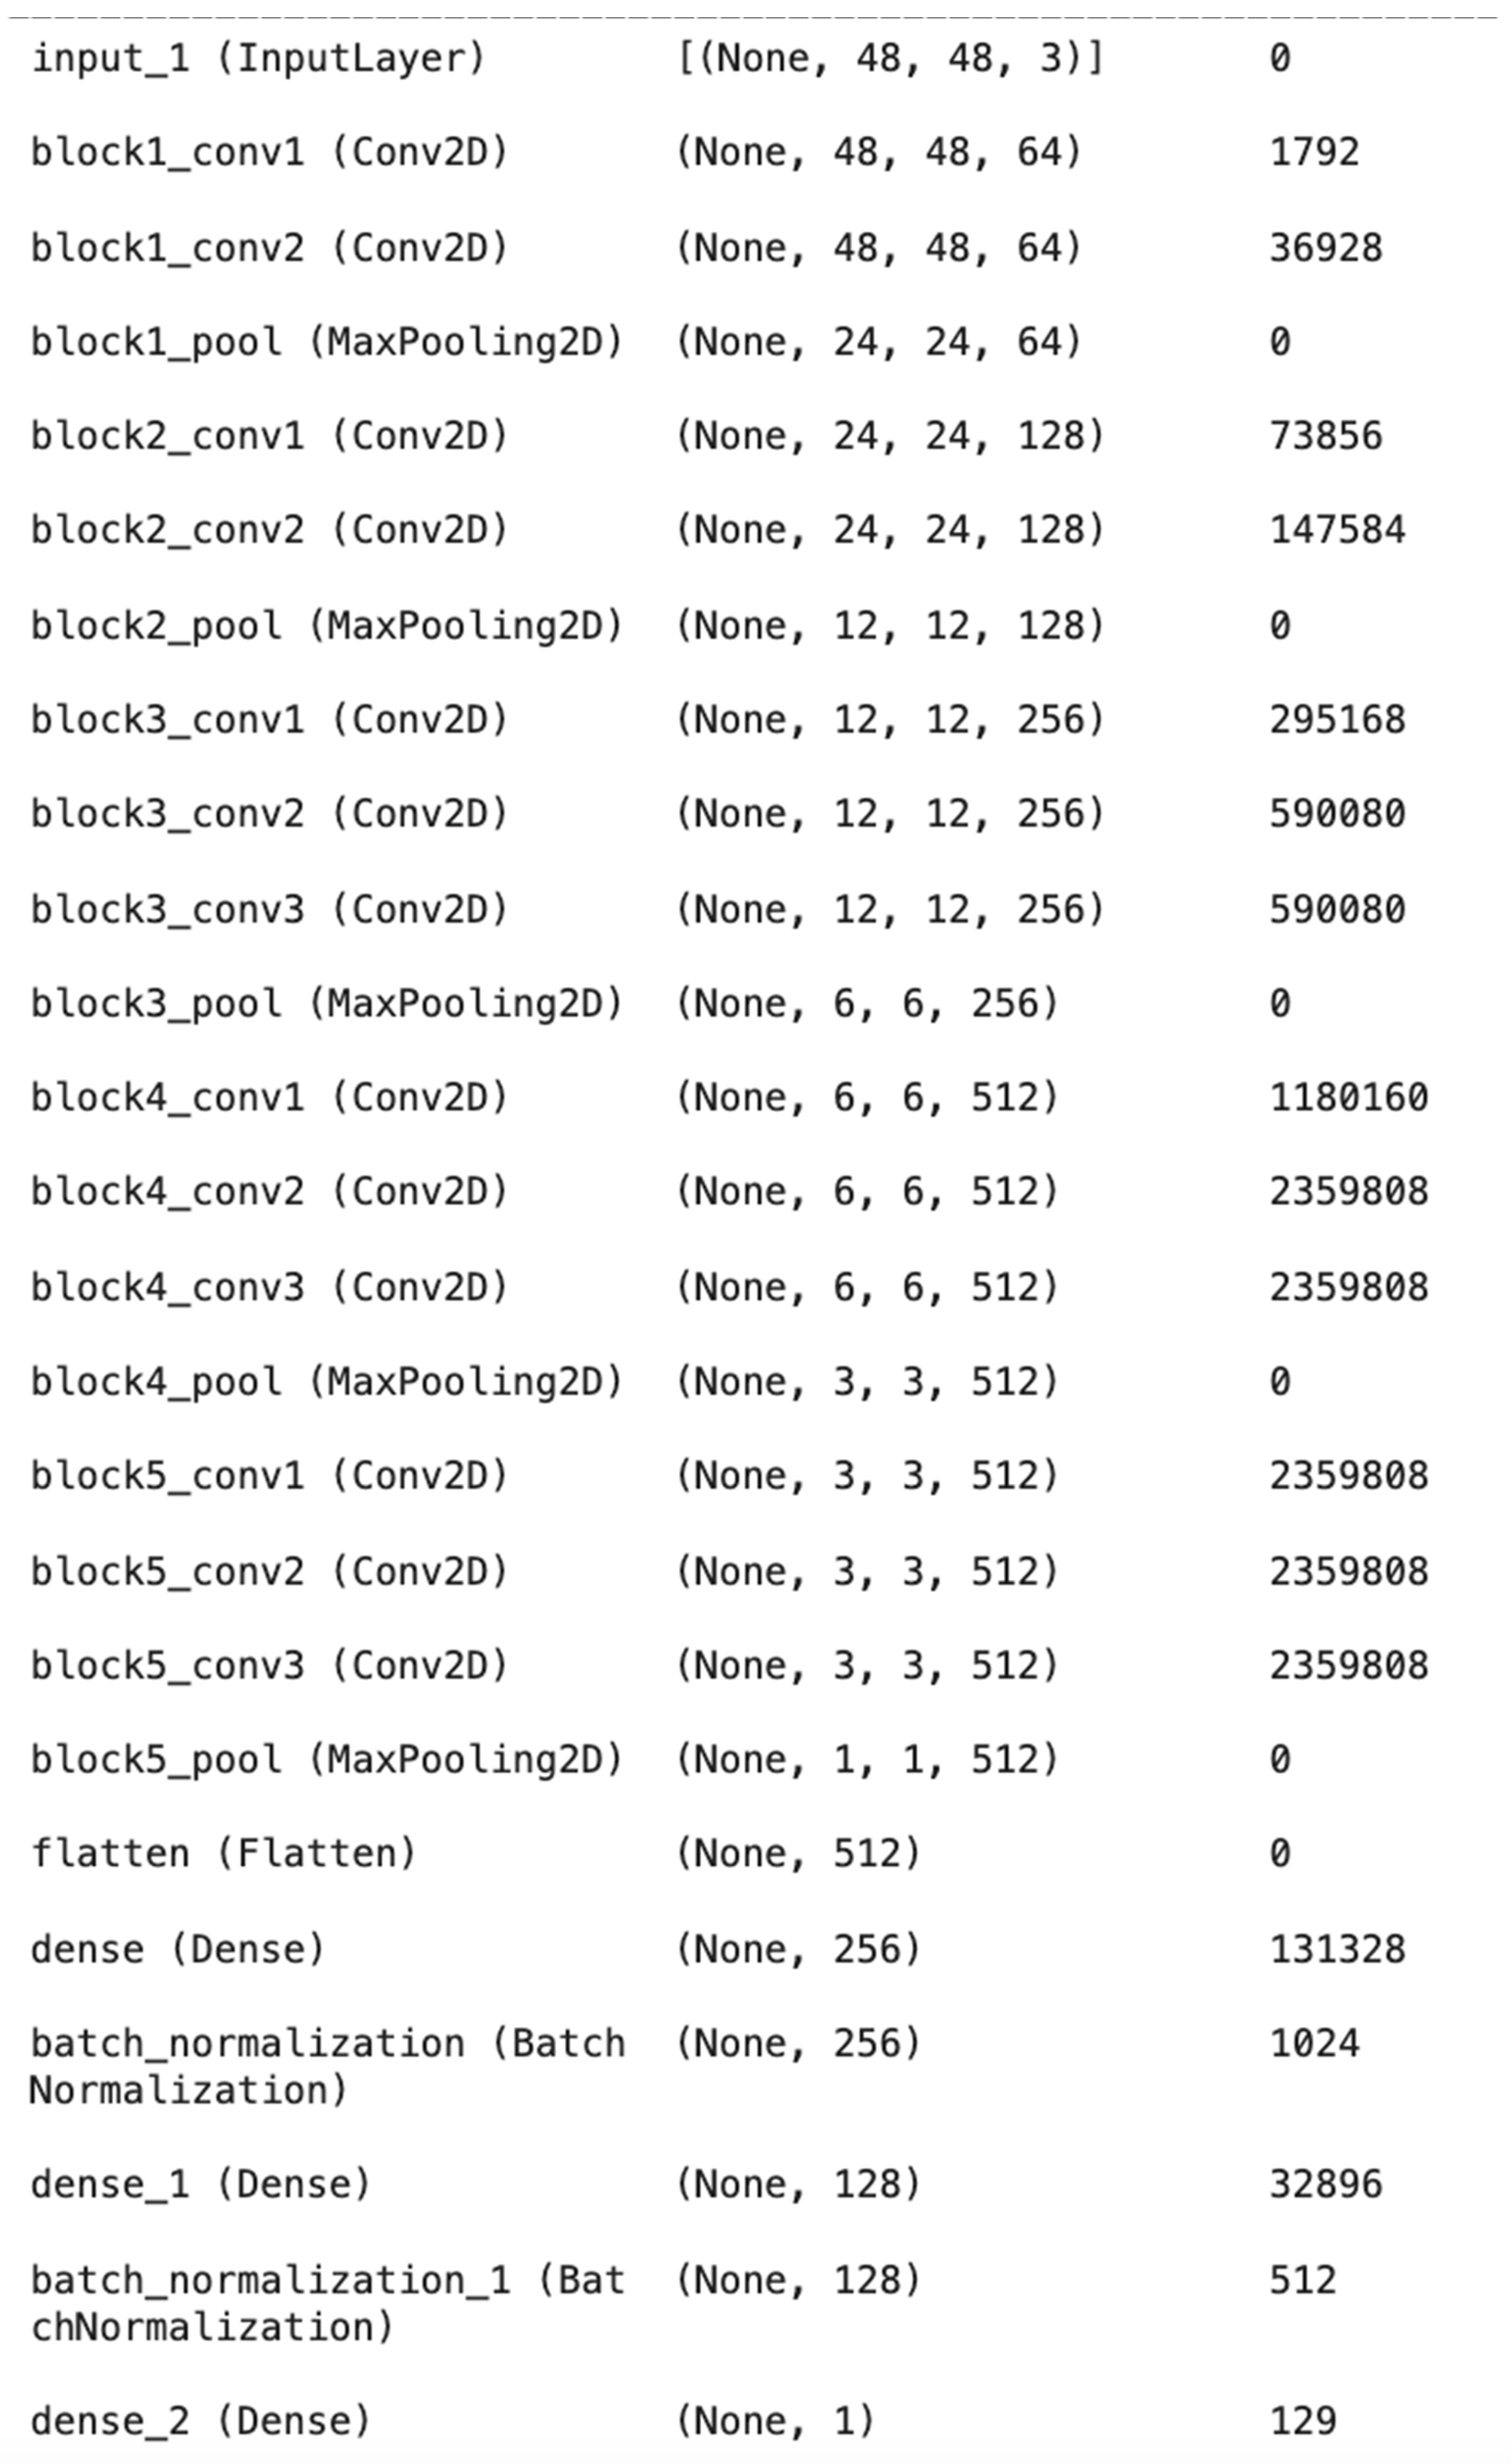
Figure 9.
Base model performance per ethnicity.
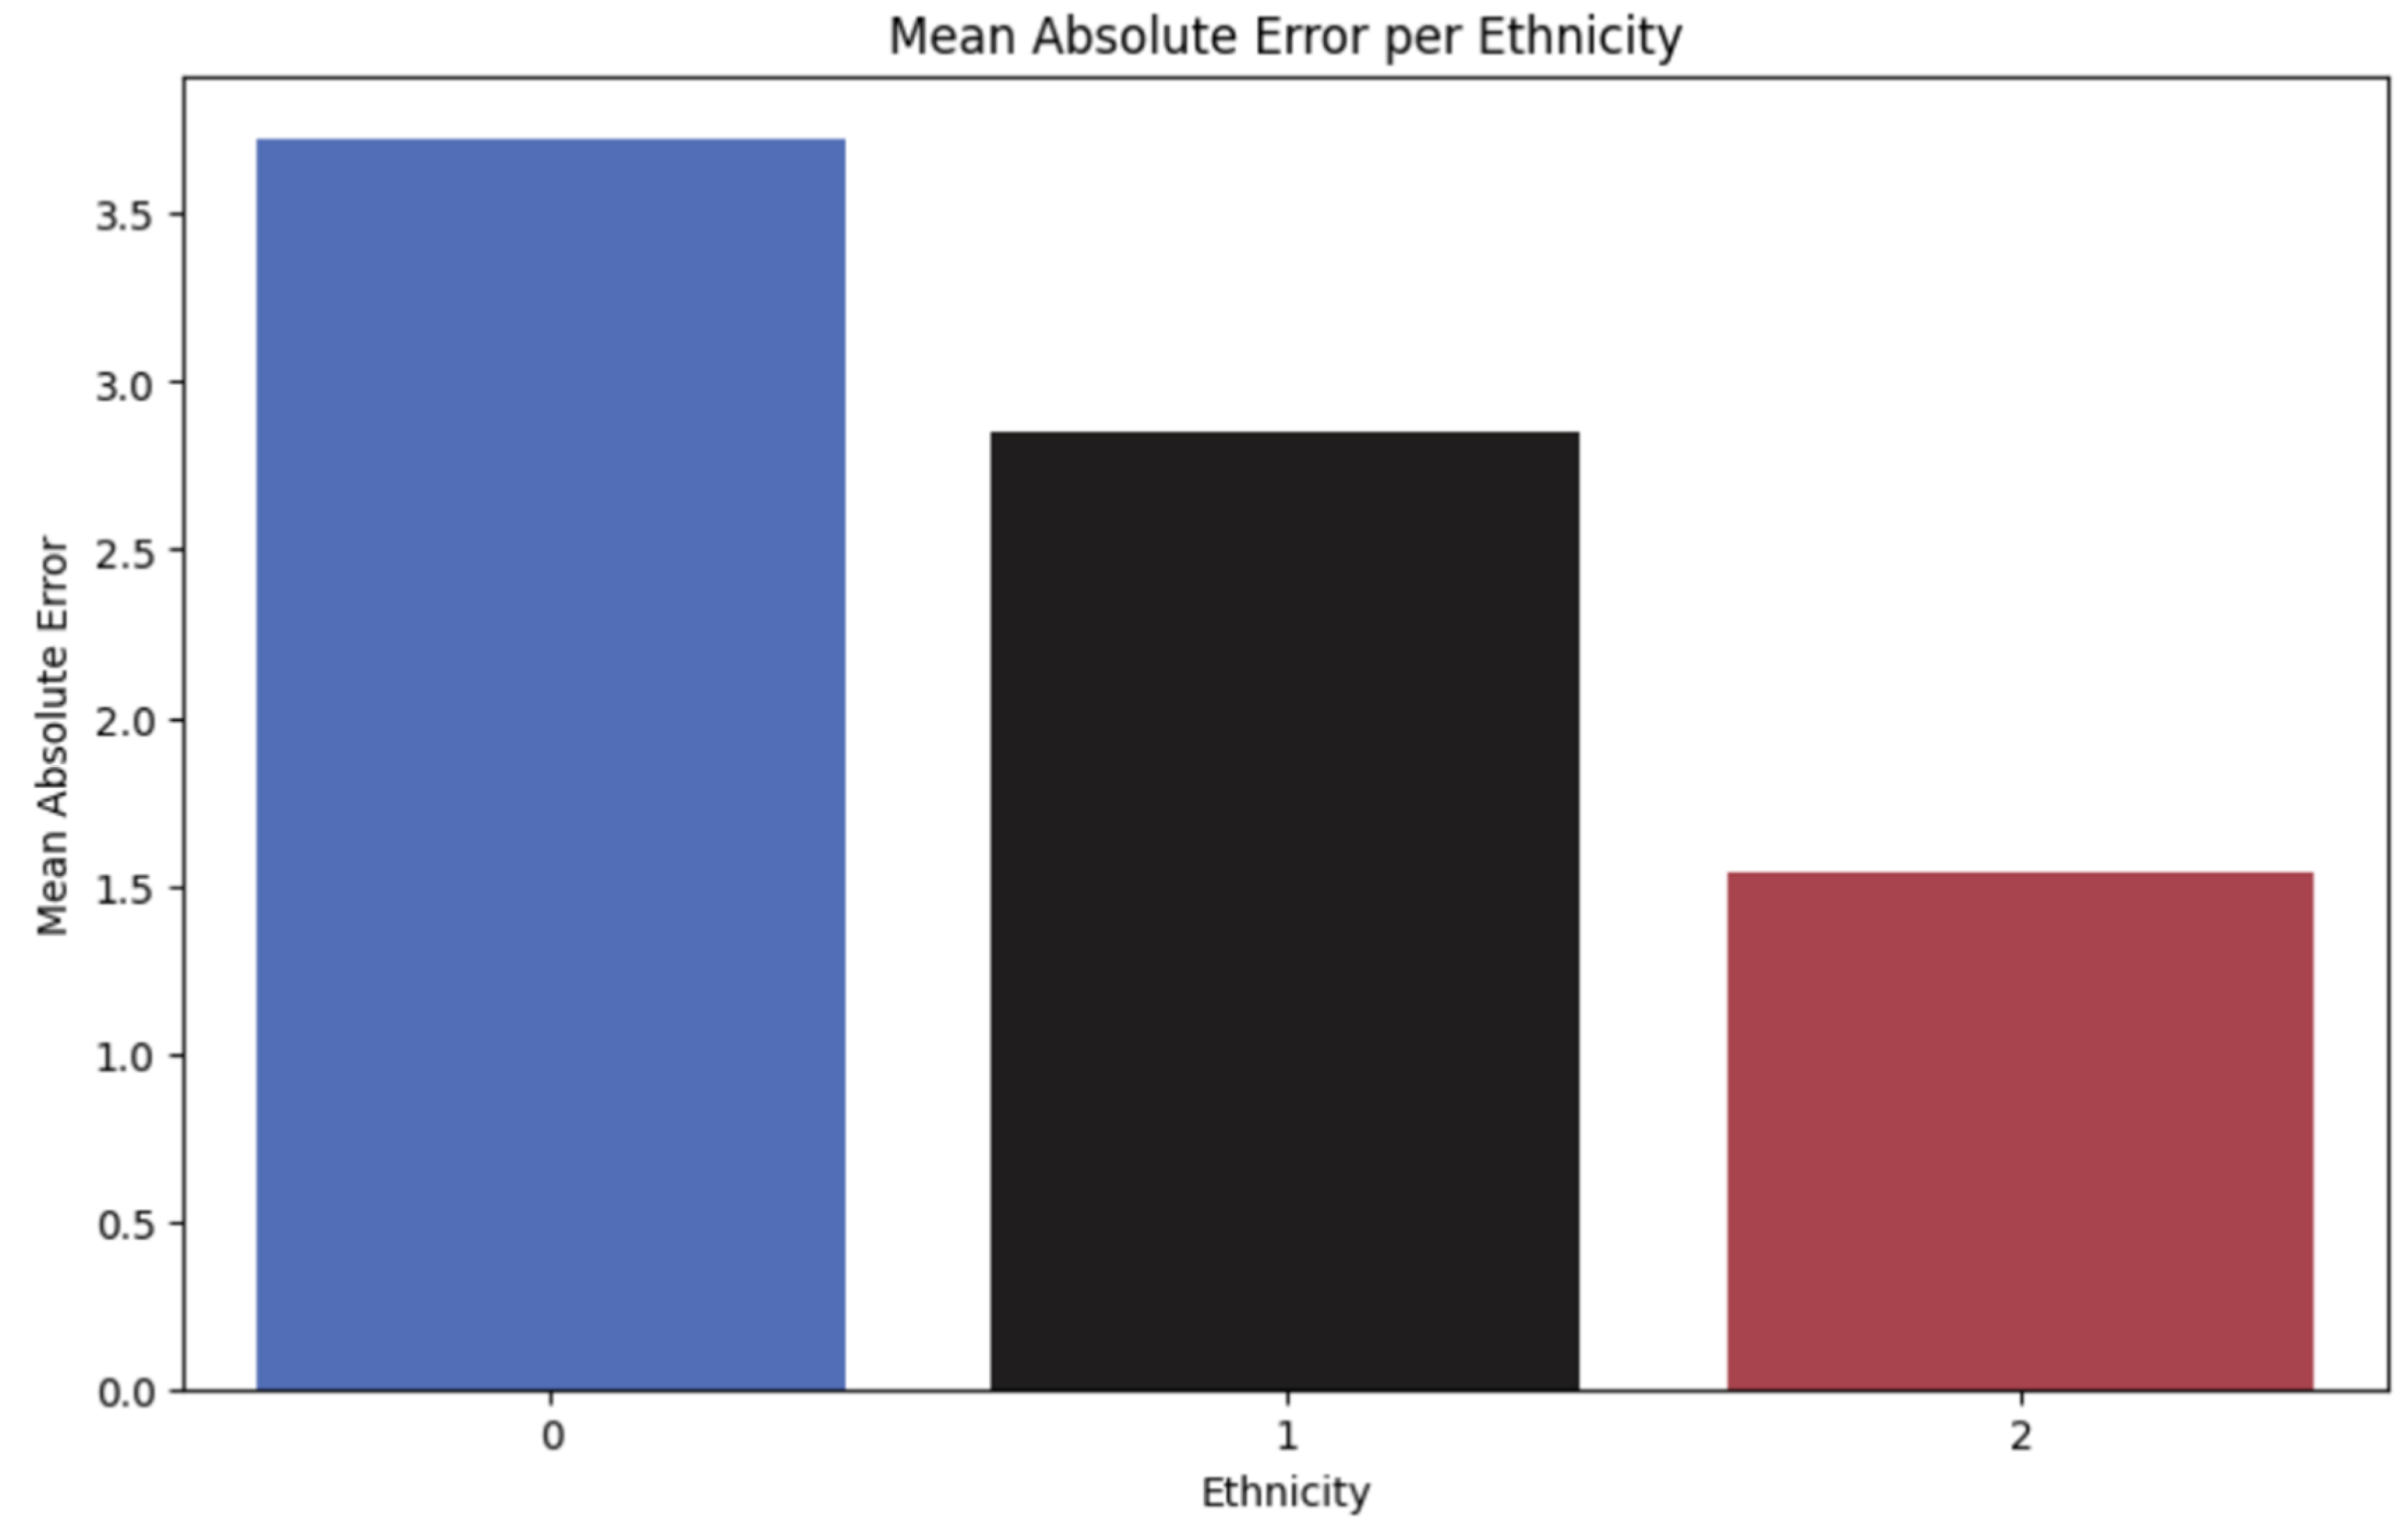
Figure 10.
Scatter plot of predicted values vs true values for the base model.
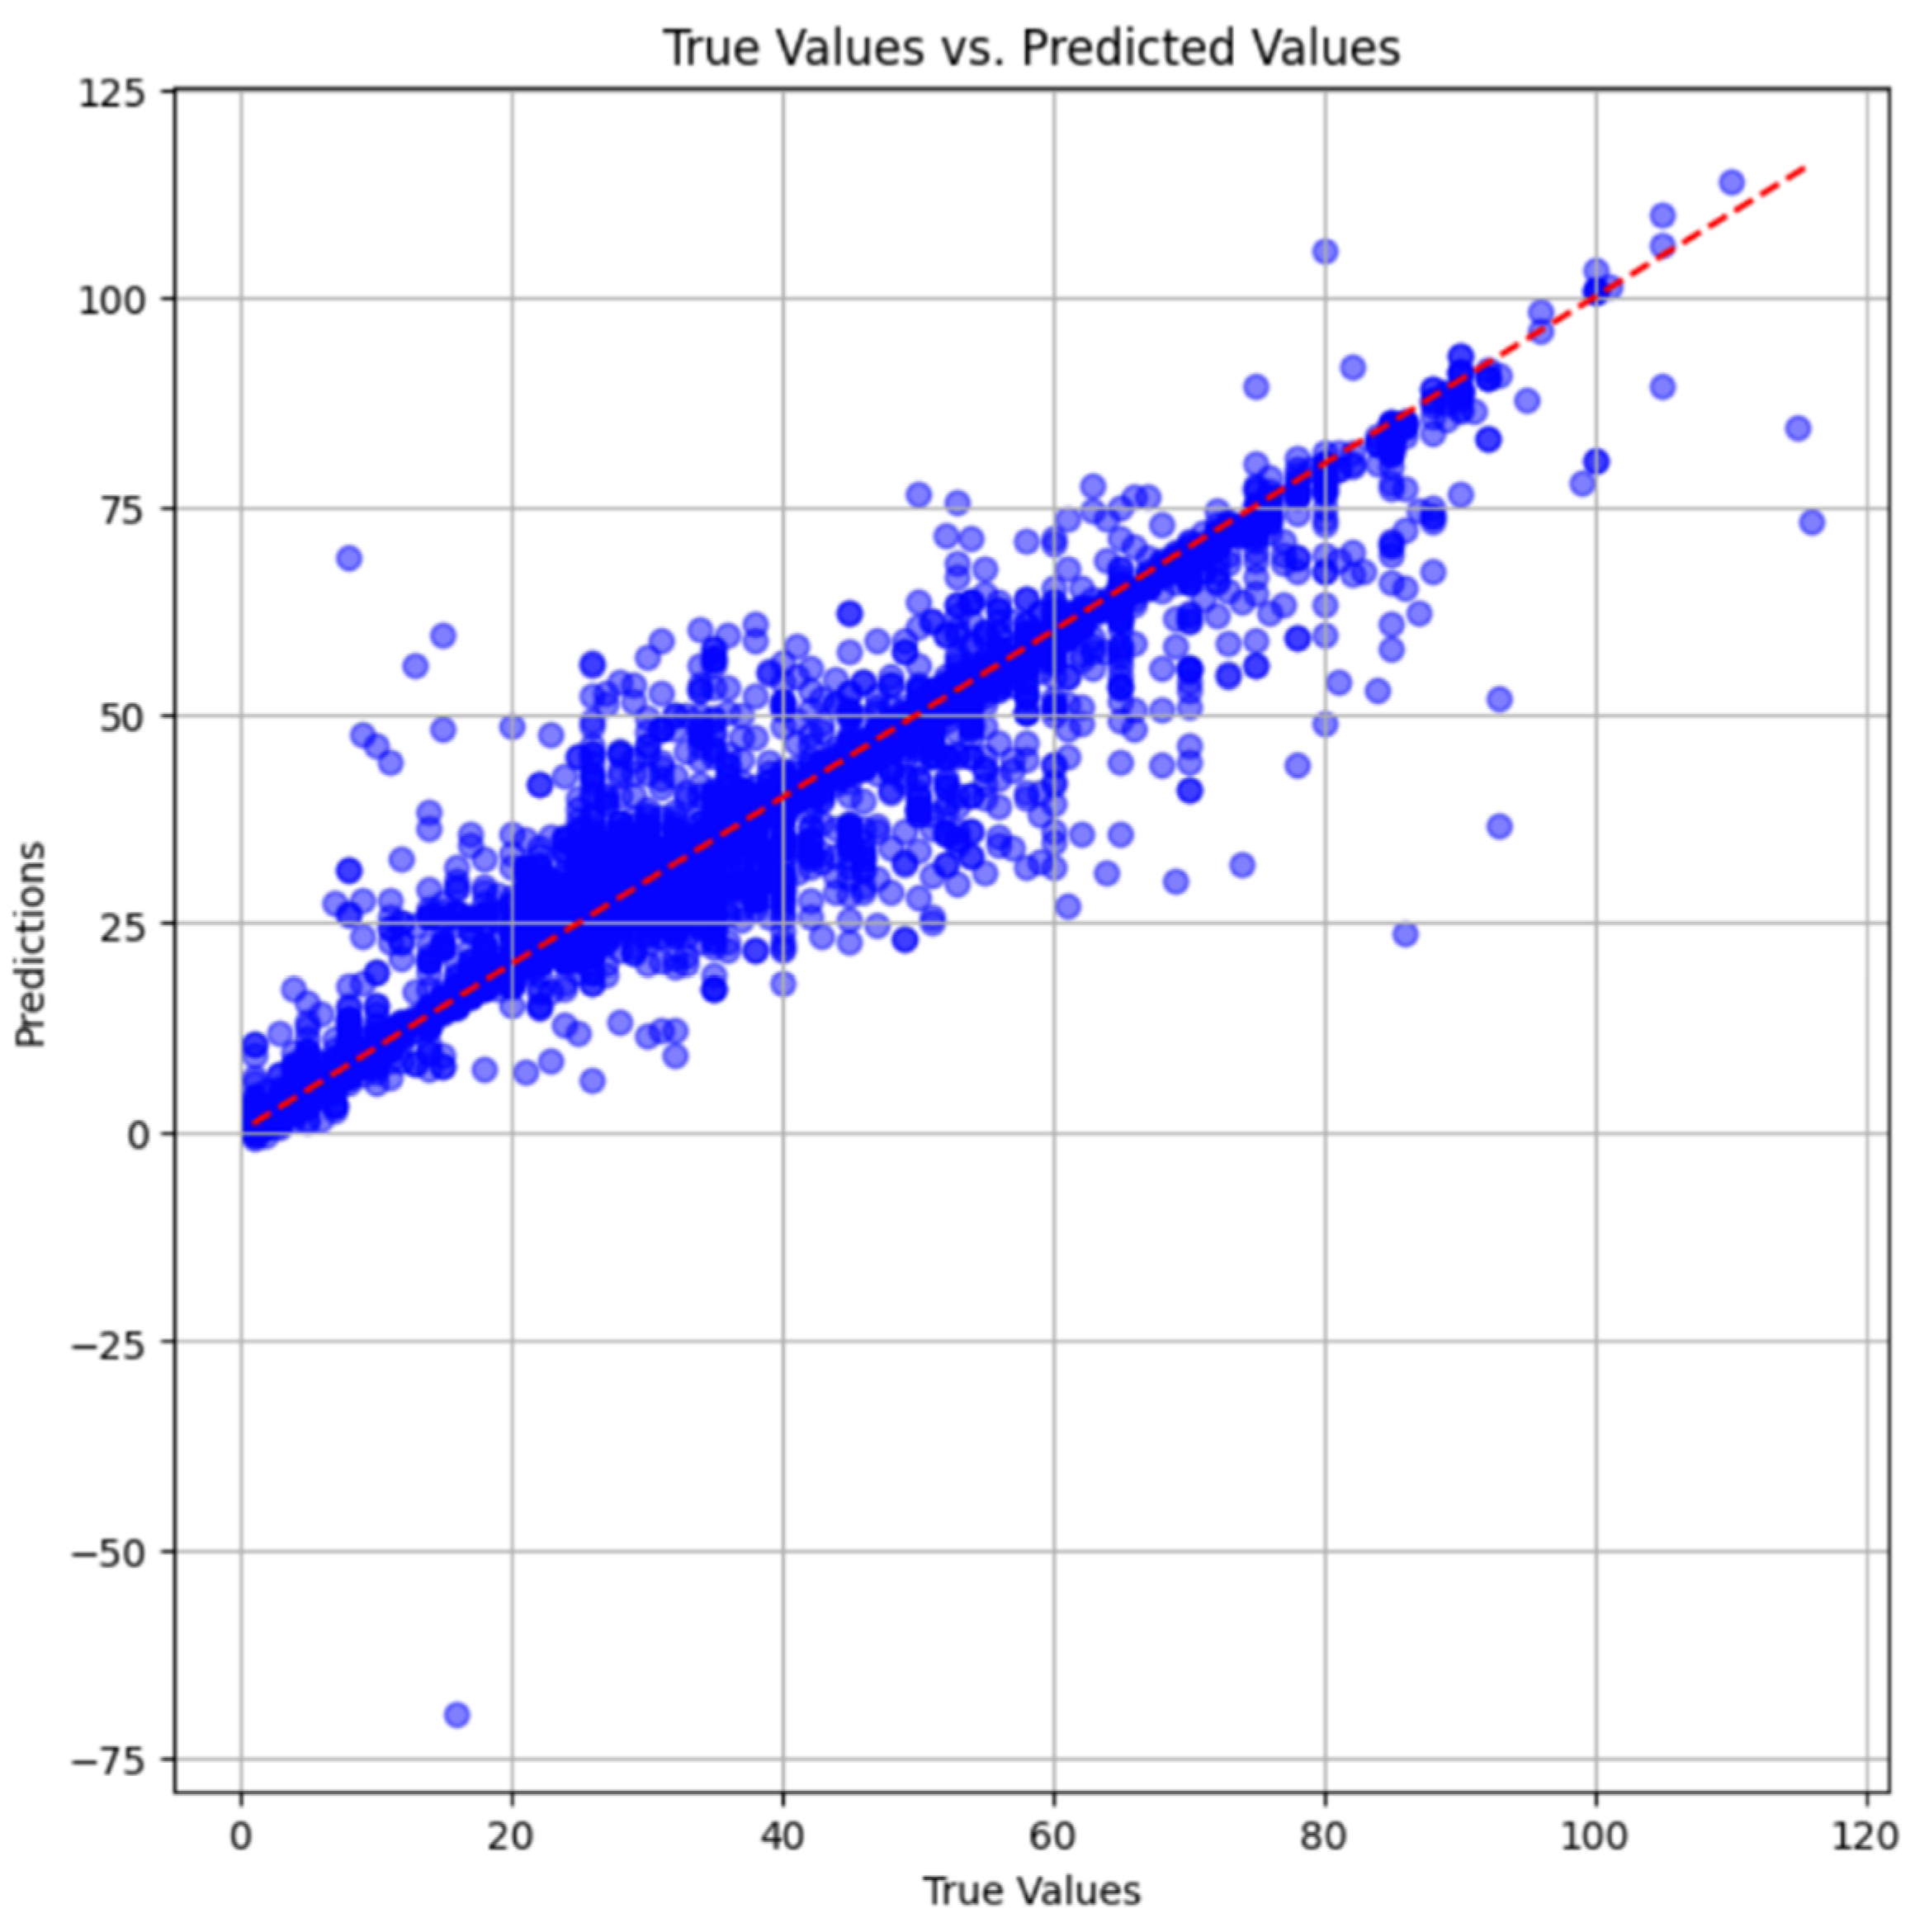
Figure 11.
Comparison of predicted vs true values for all models using a scatter plot.
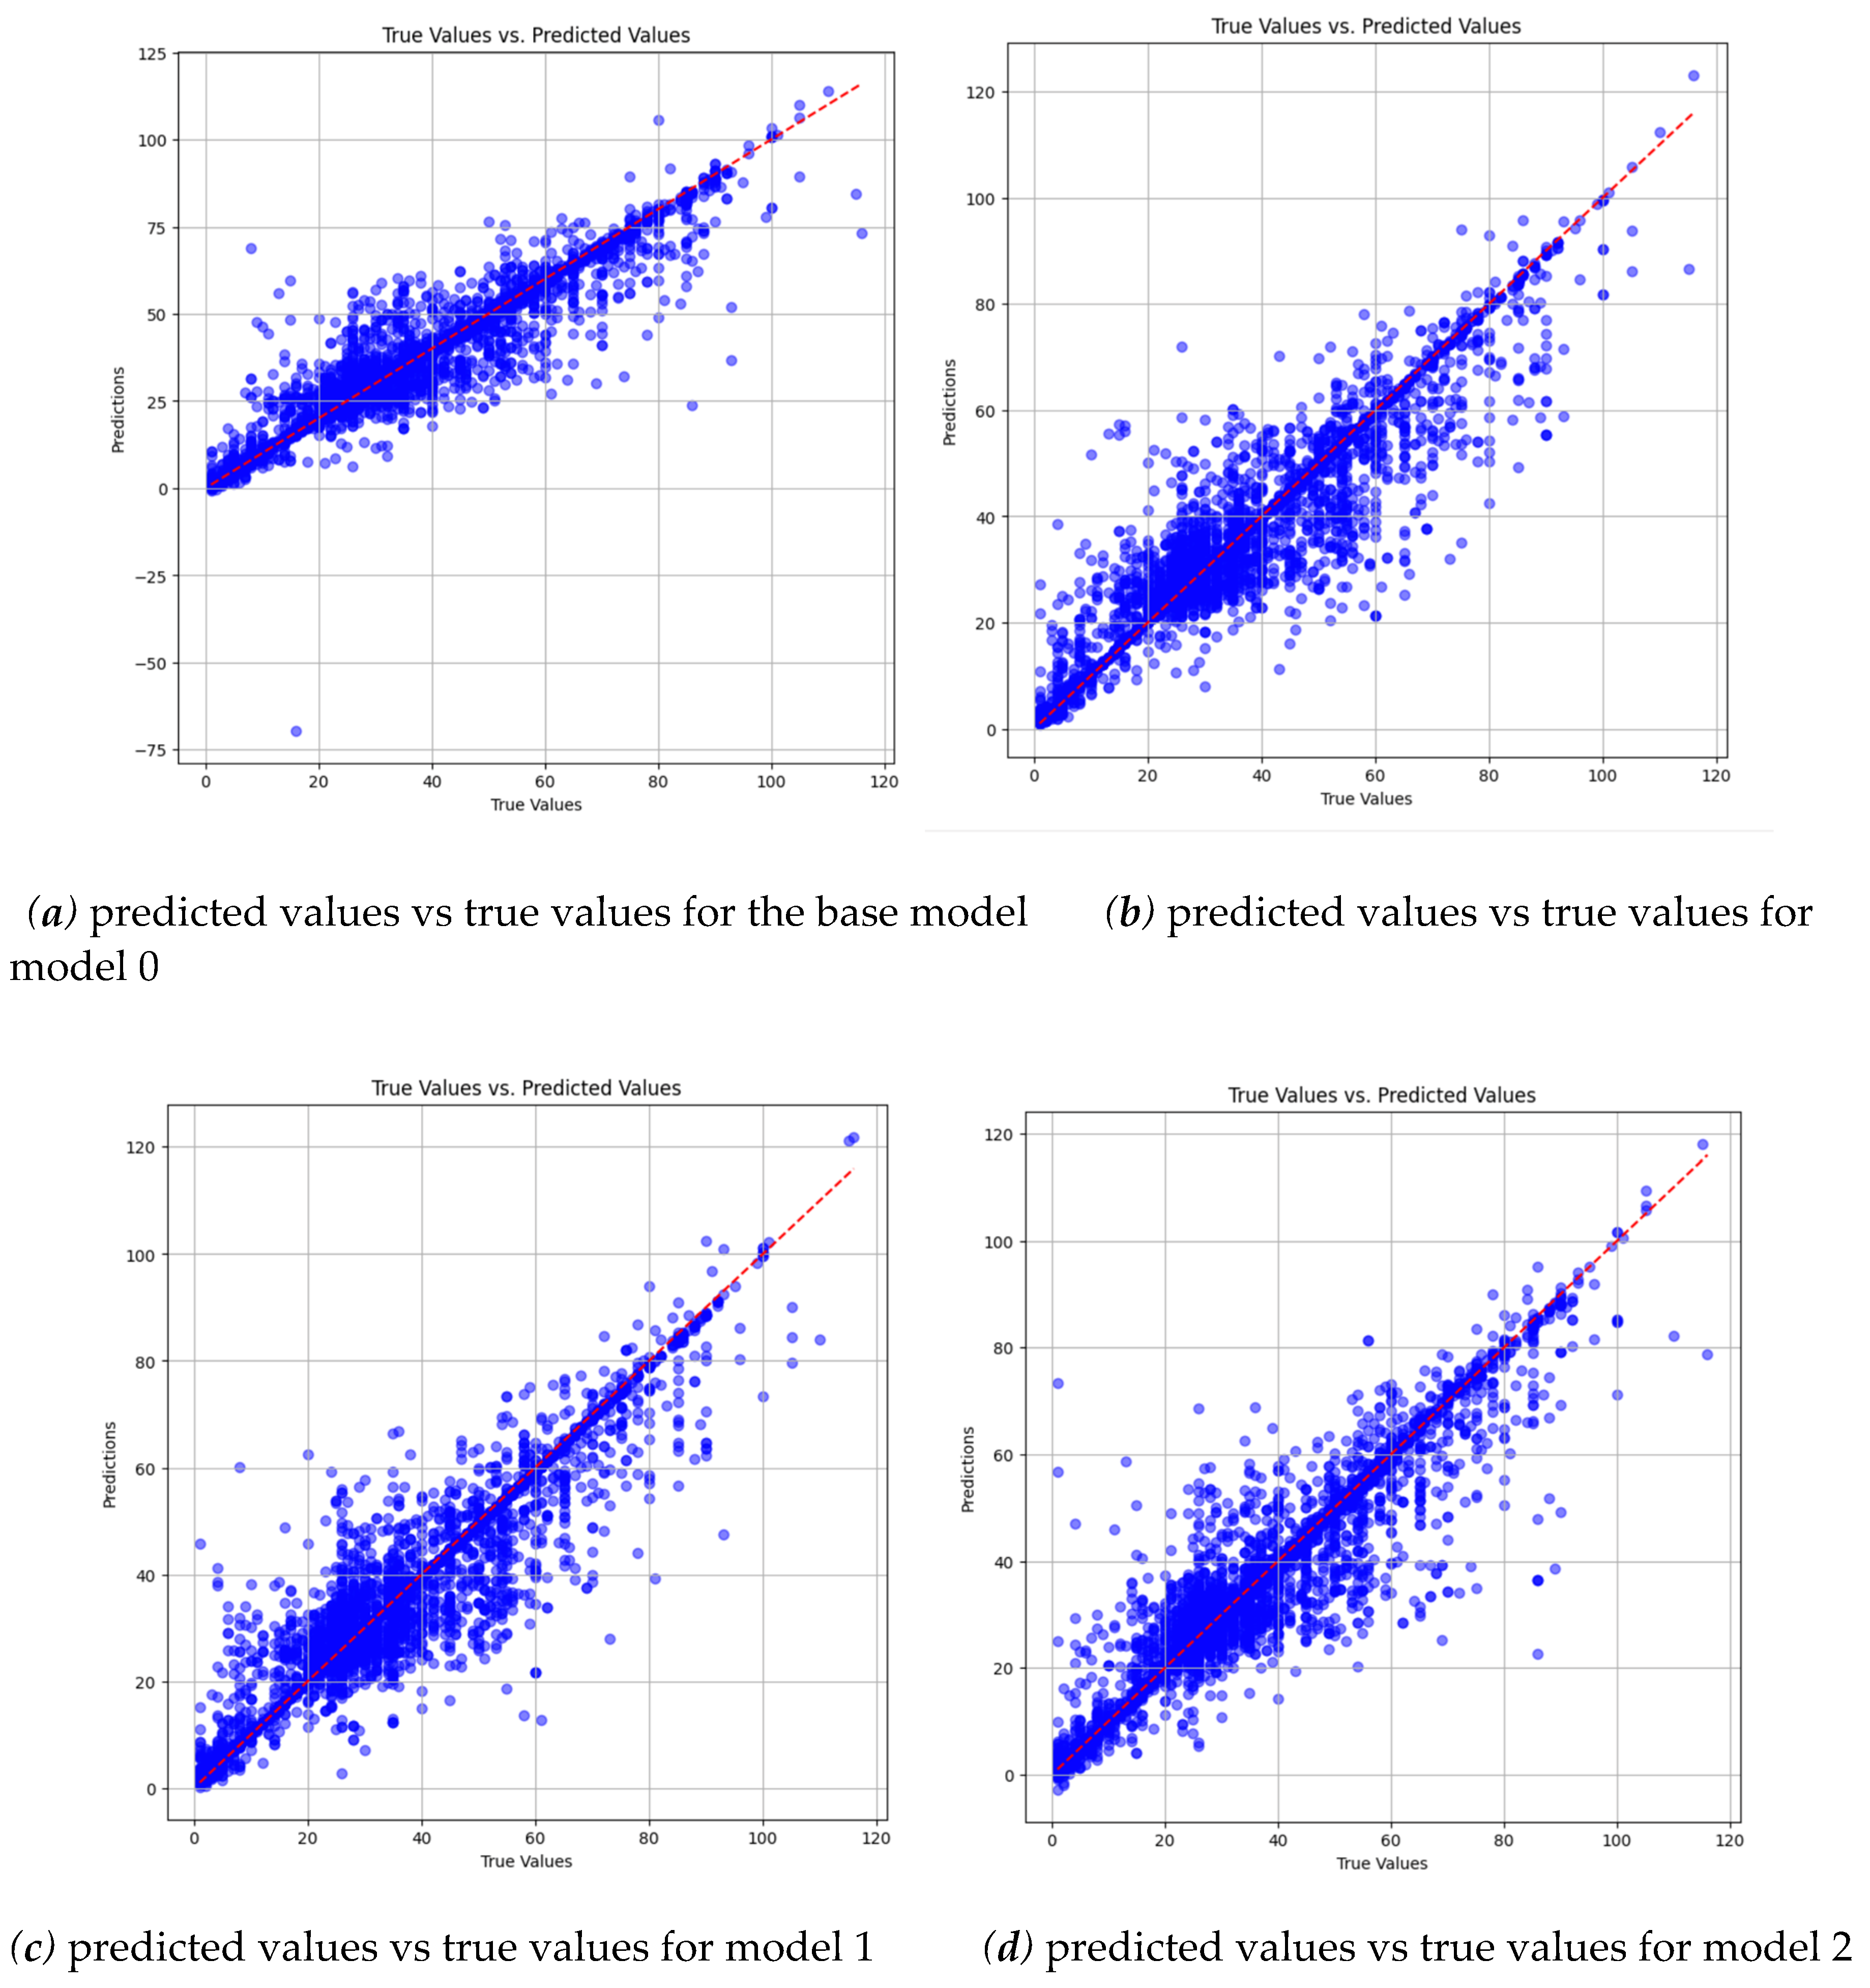
Figure 12.
Comparison of predicted vs true values between the base model and model 0 for group 0.
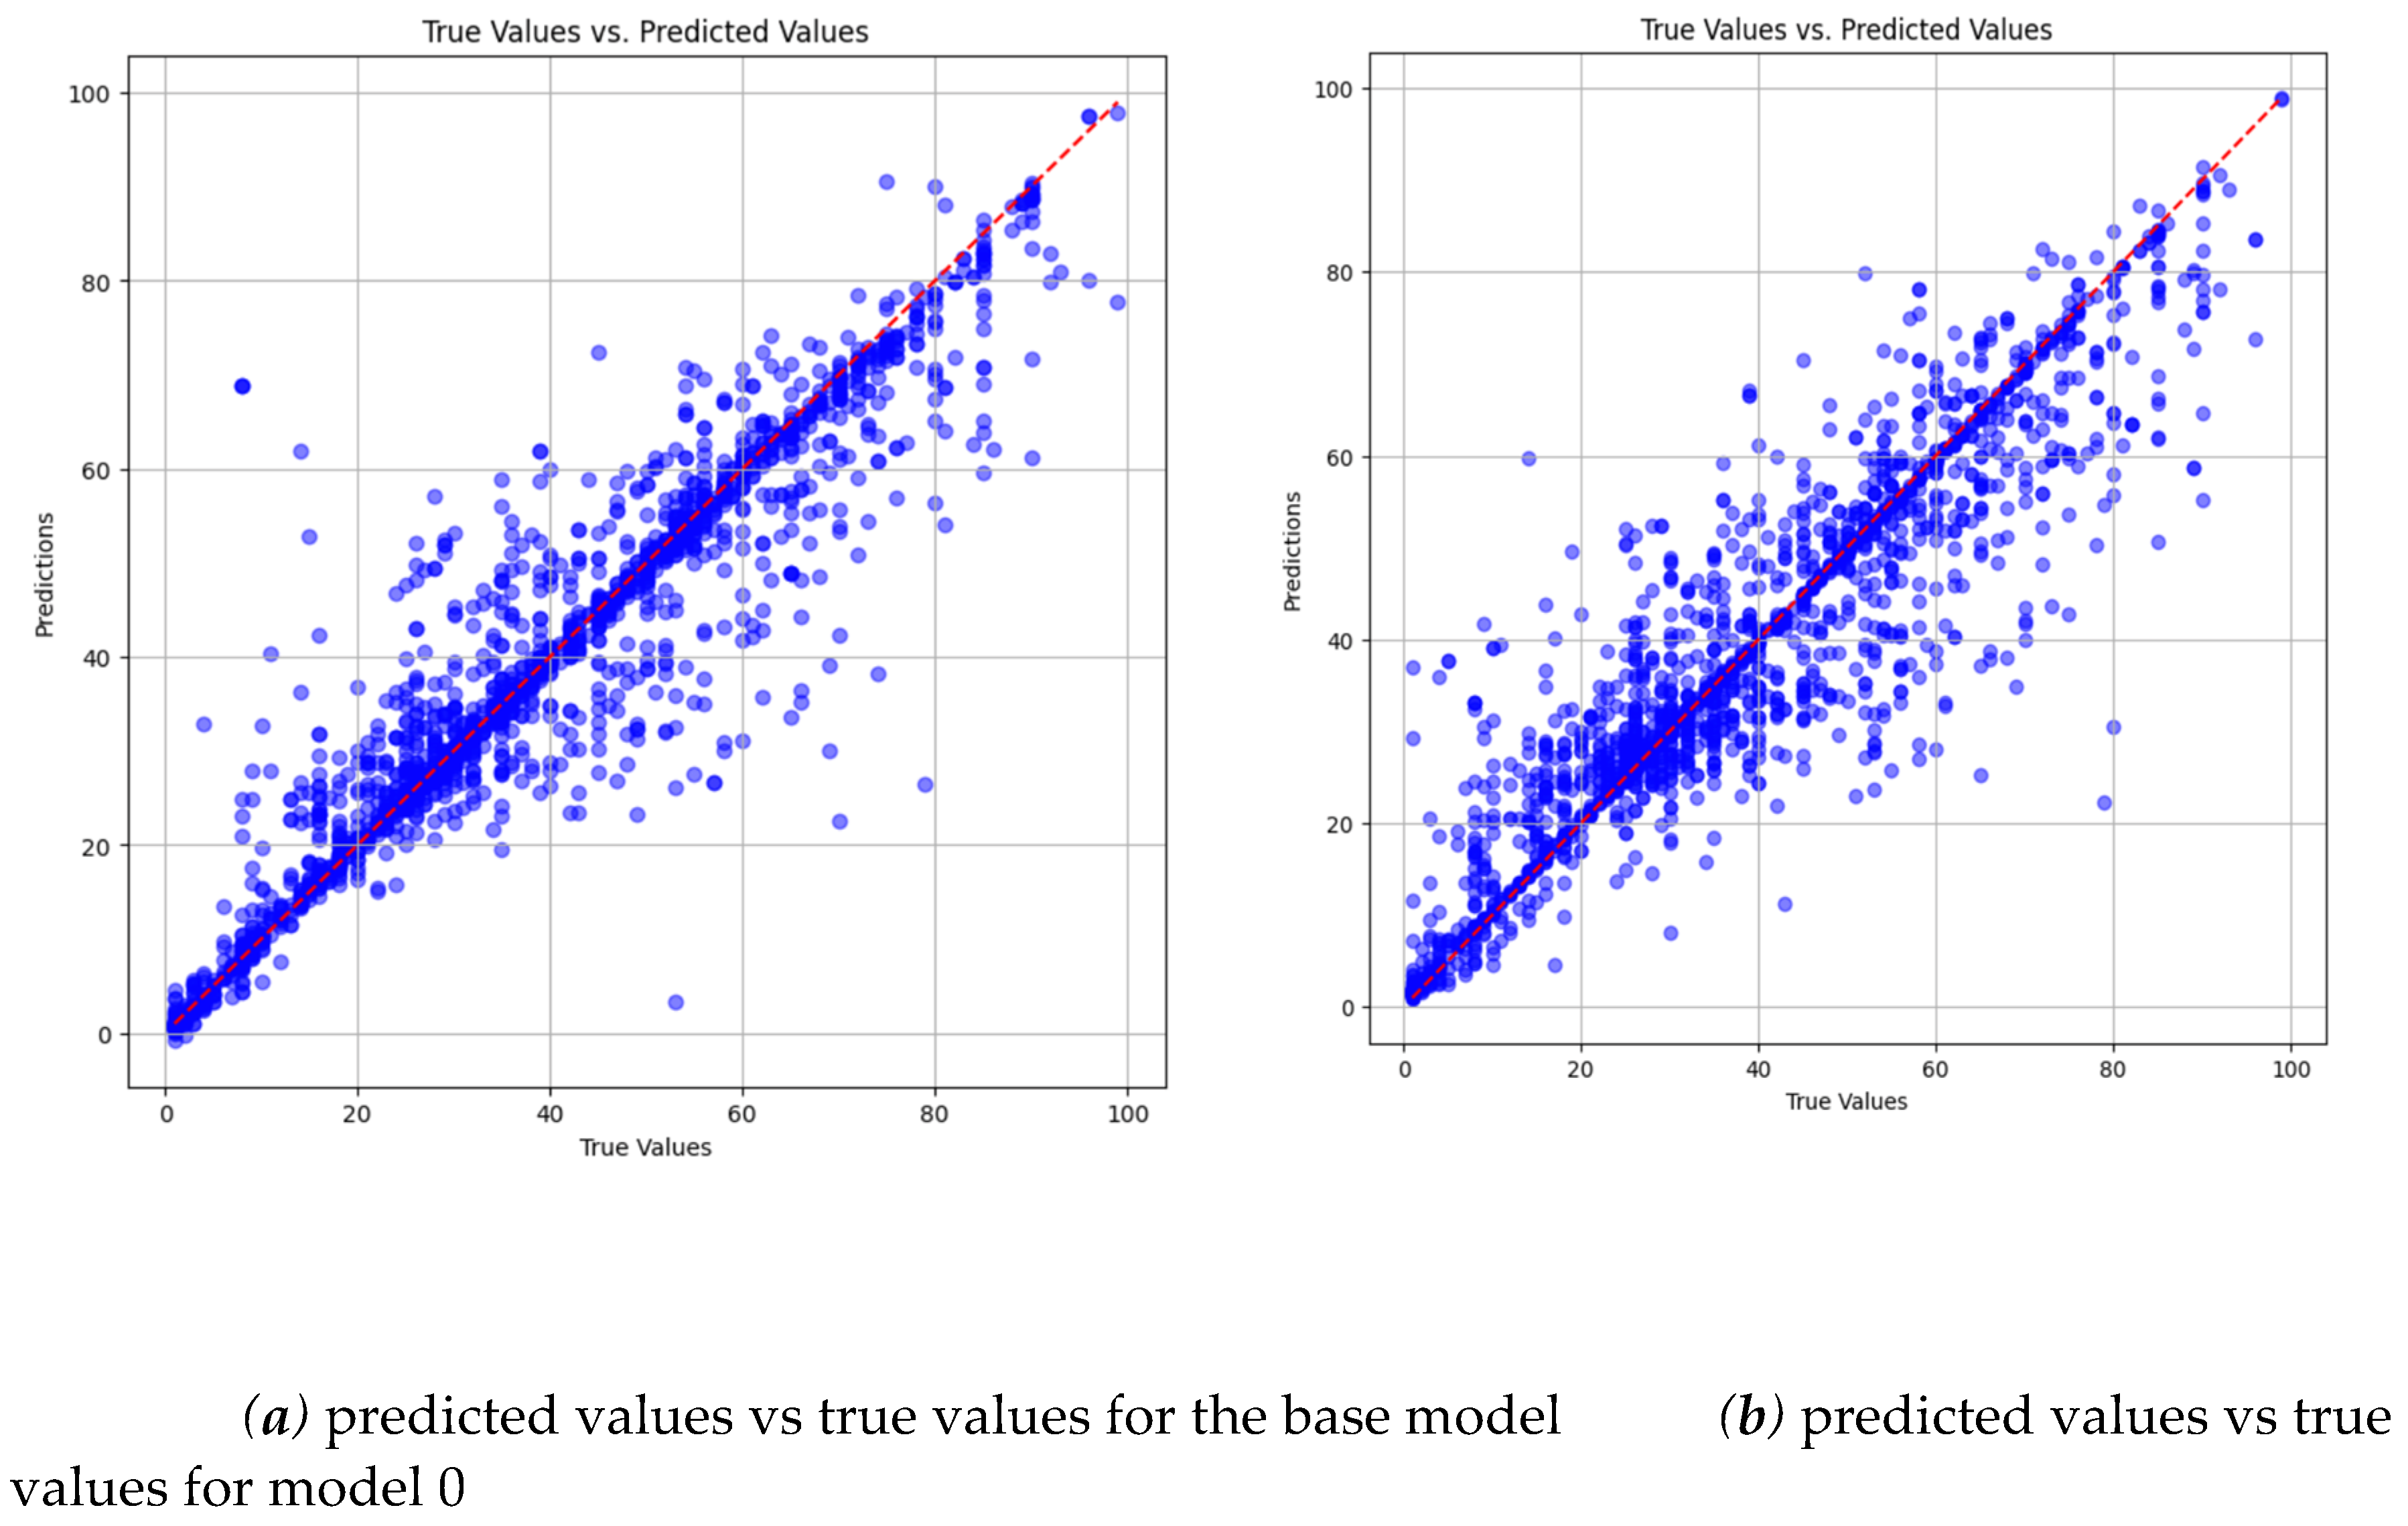
Figure 13.
Comparison of predicted vs true values between the base model and model 0 for group 1.
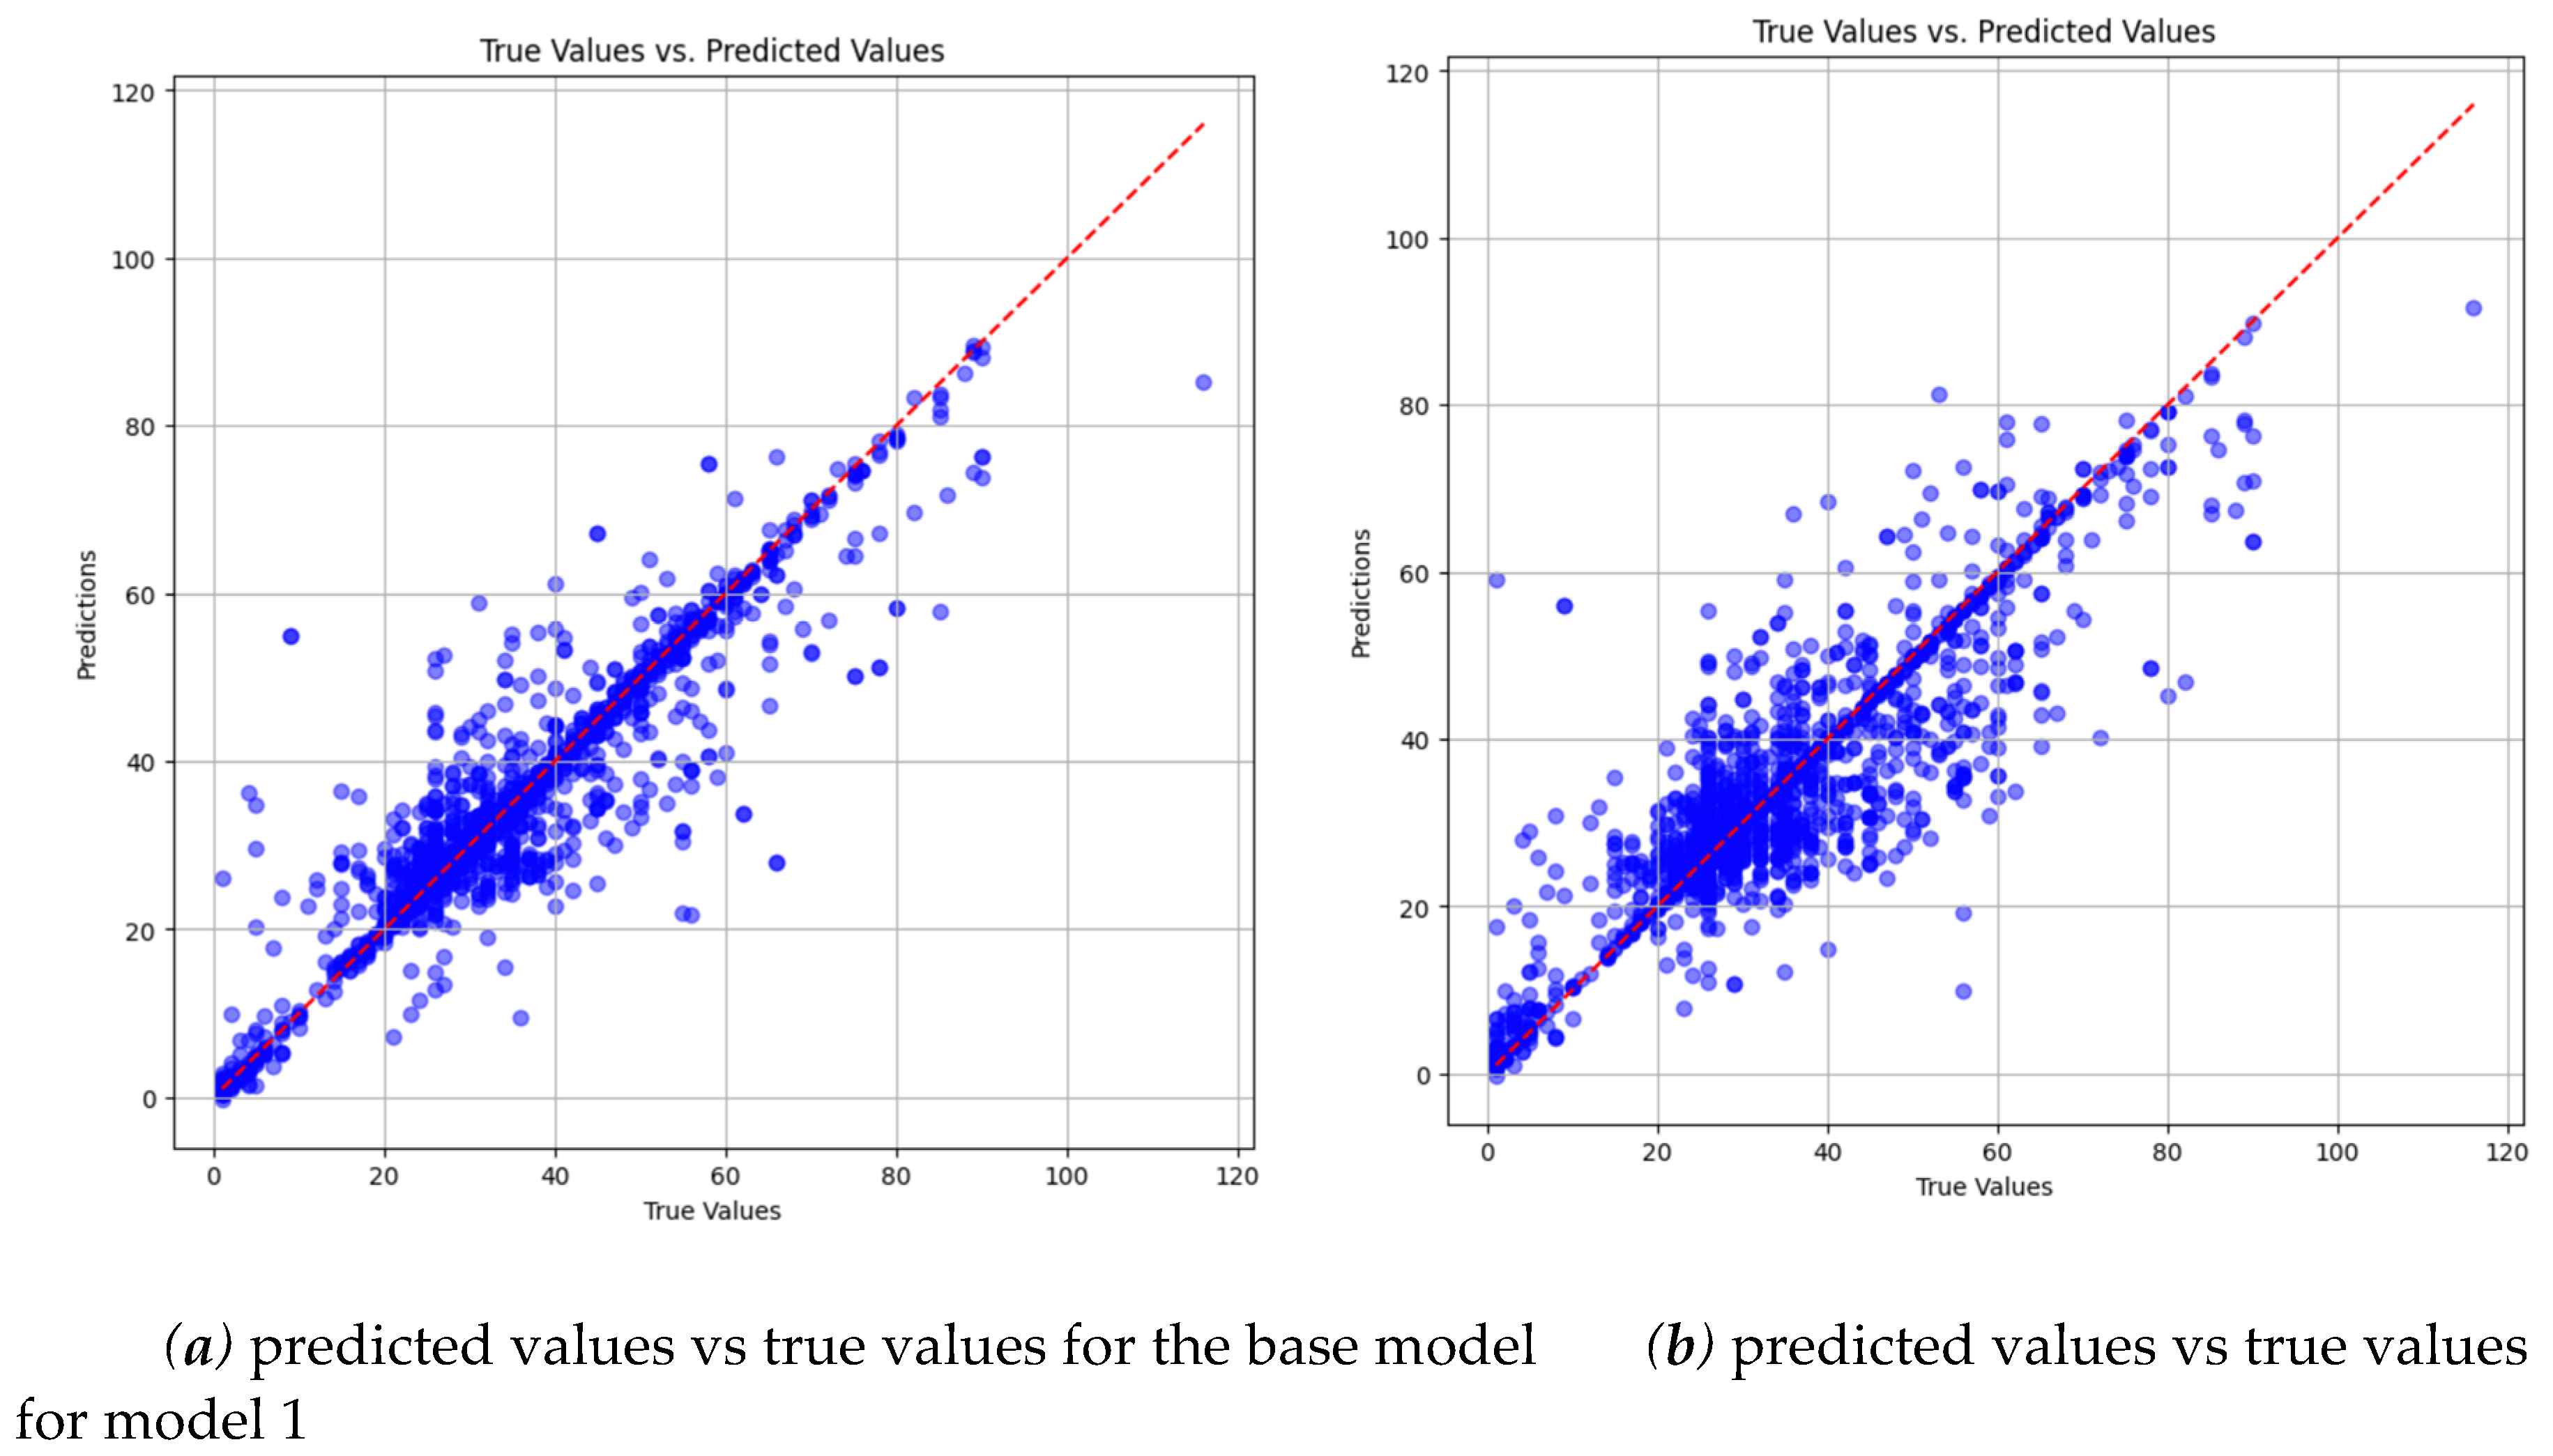
Figure 14.
Comparison of predicted vs true values between the base model and model 0 for group 2.
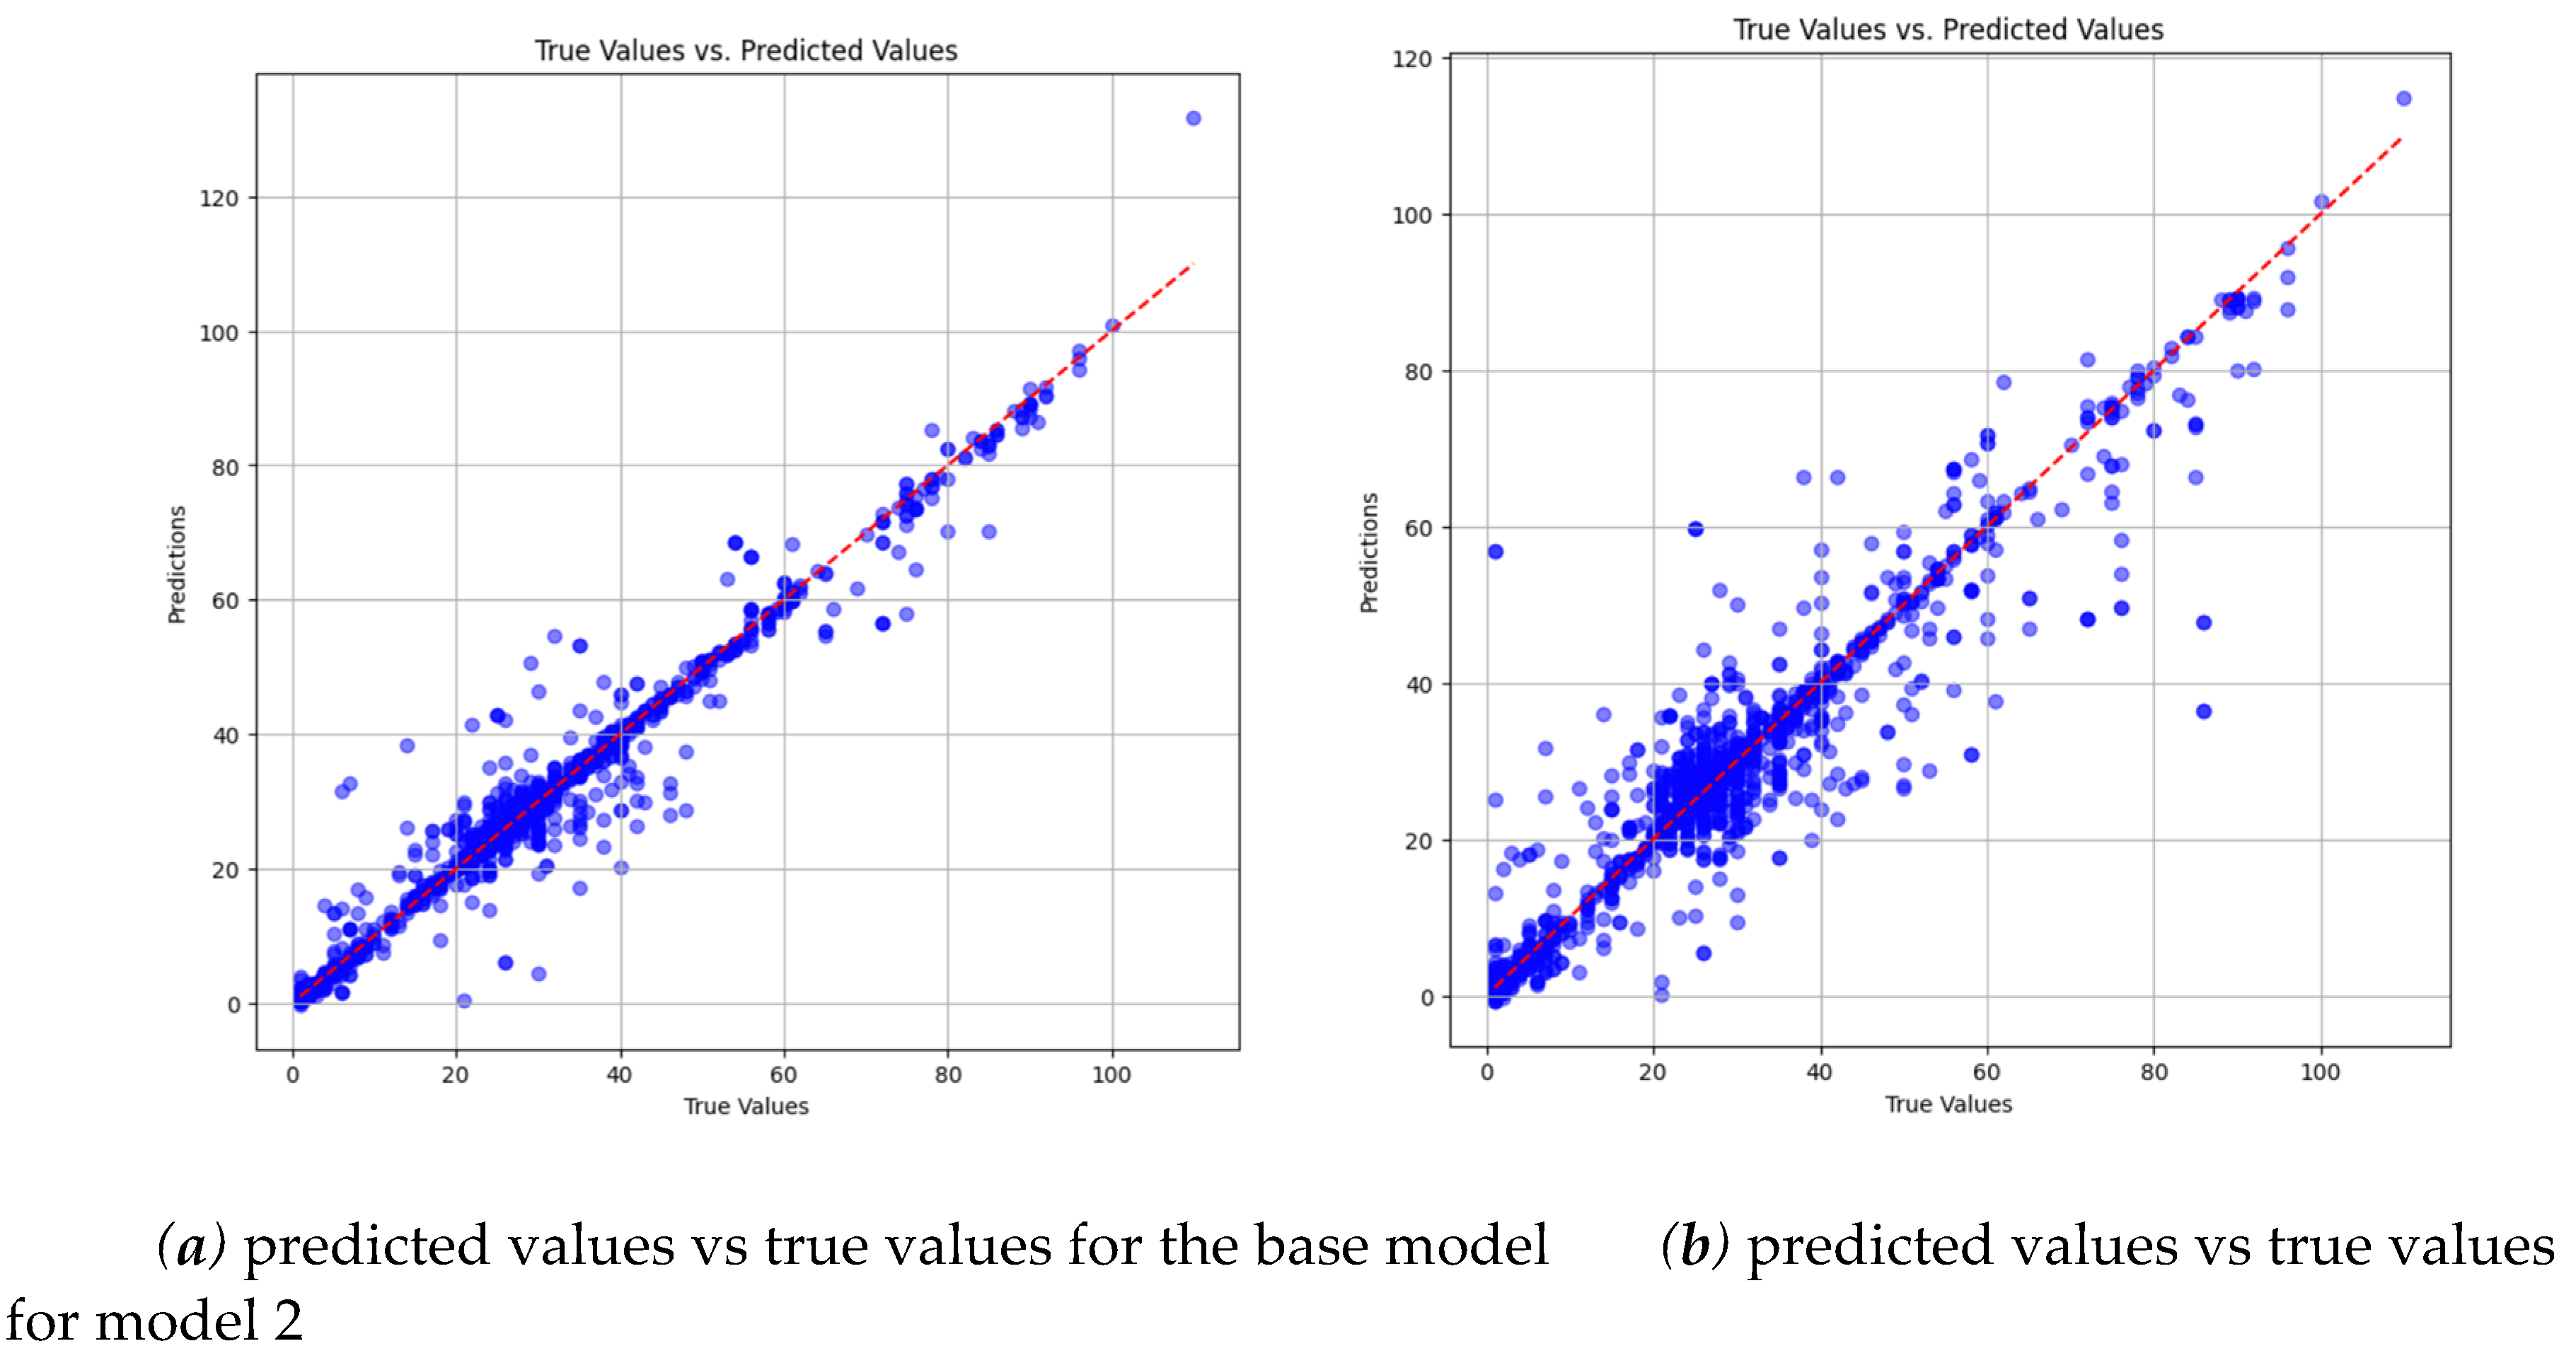
Figure 15.
Comparison of MAE for each group across all models.
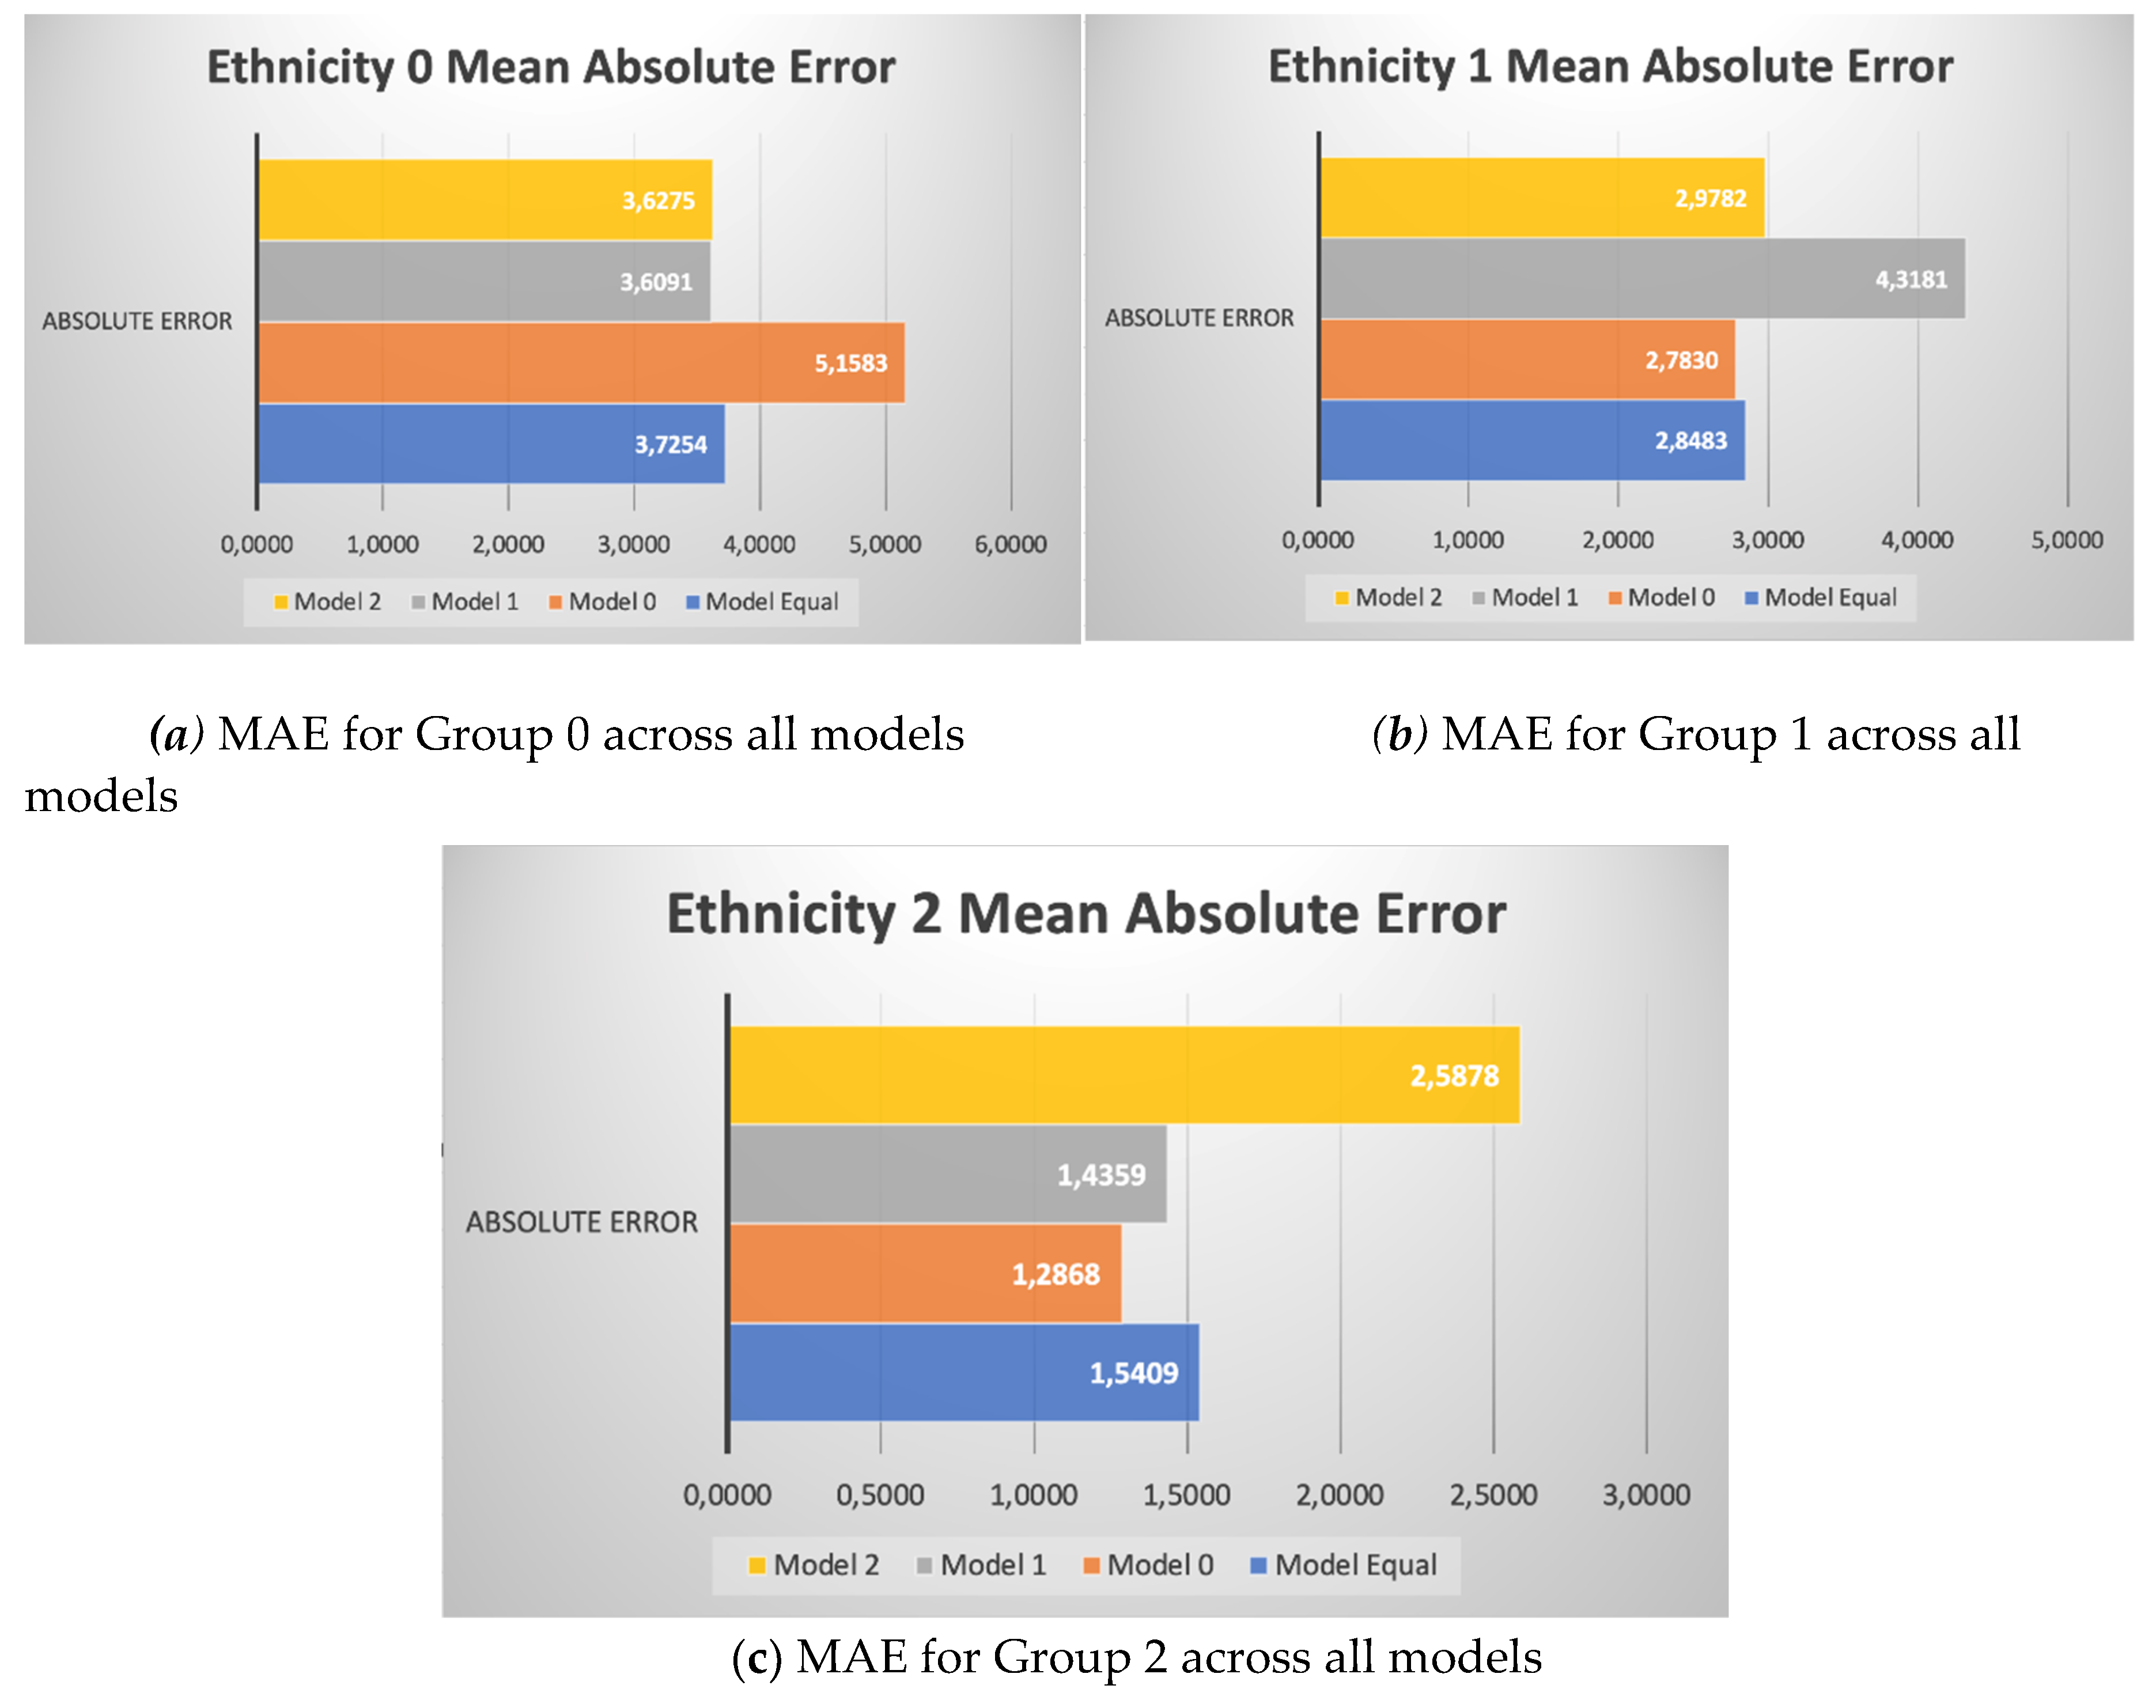
Figure 16.
Comparison of overall MAE across all models.
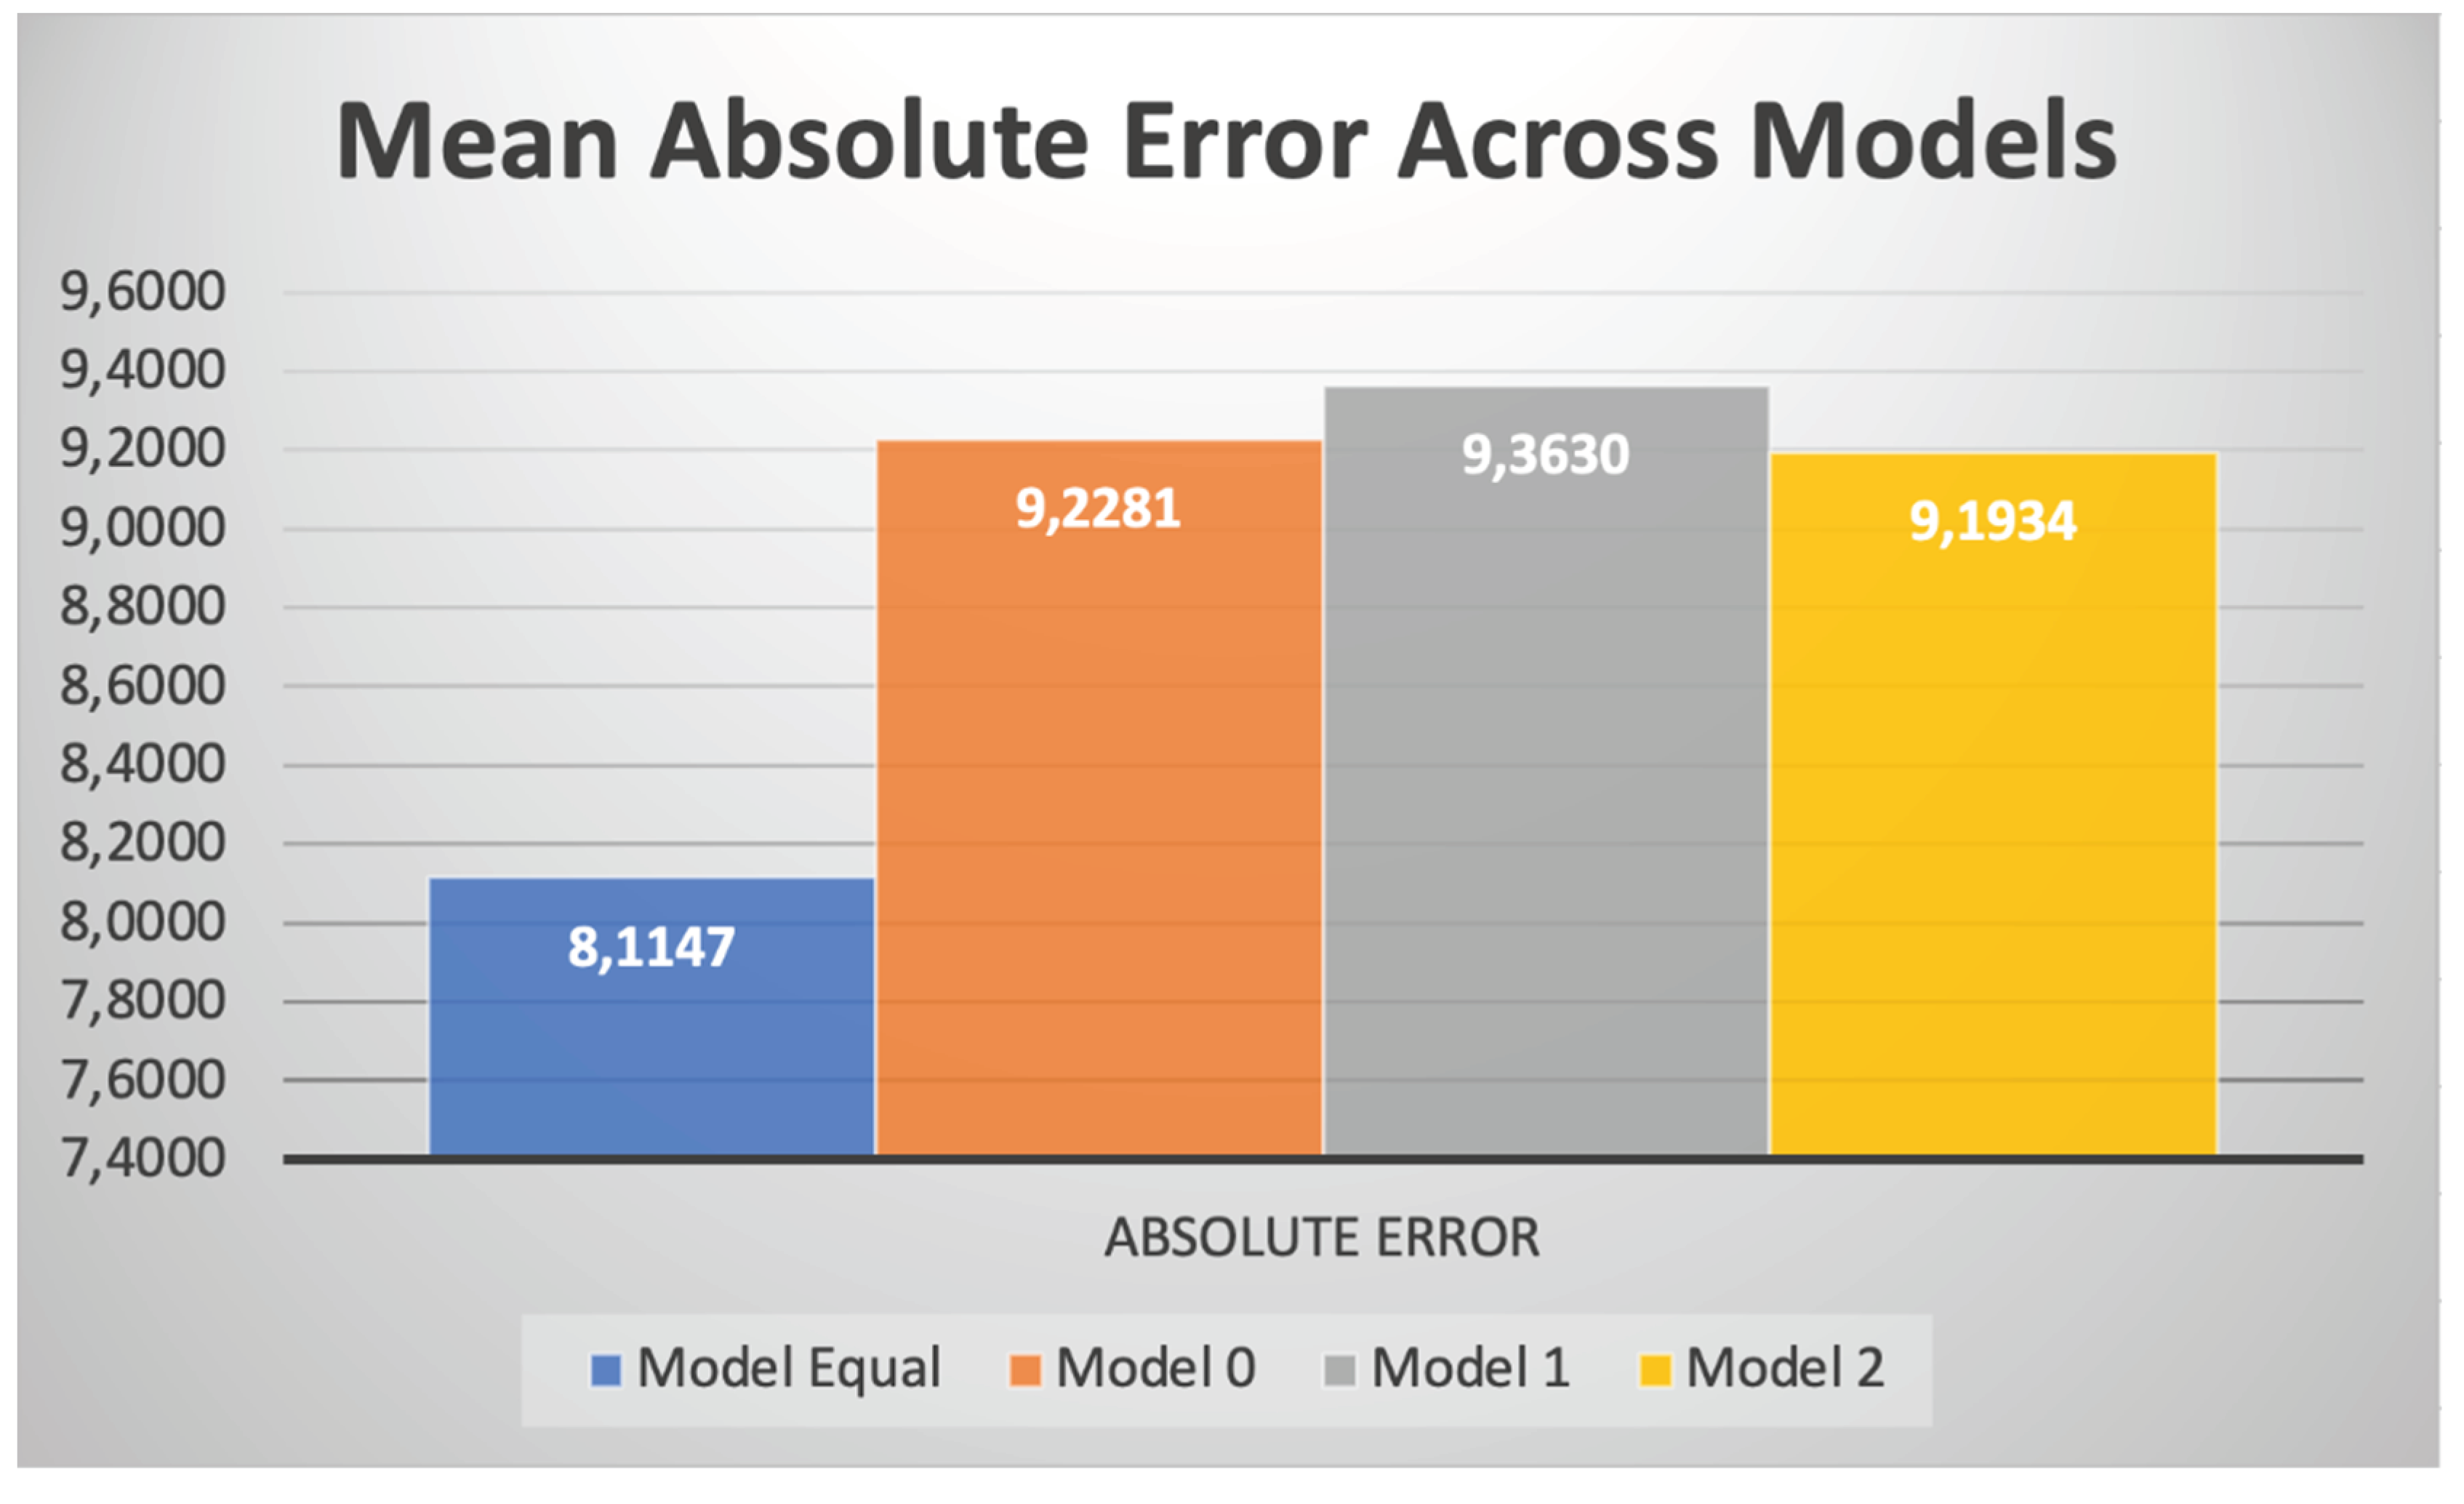

Table 1.
Comparison of previous work.
| Paper | Methodologies | Datasets | Conclusions |
|---|---|---|---|
| Age estimation via face images: a survey |
This study investigates methods for facial age estimation, discussing validation challenges and approaches. Techniques include dataset splitting with rotational exclusion, density-preserving sampling, cross-validation, and bootstrap strategies. It explores k-fold cross-validation and leave-one-out (LOO) strategies. Moreover, it examines multi-manifold metric learning and hierarchical models for age estimation. |
FG-NET MORPH Gallagher’s web collected database YGA LHI HOIP Iranian face database |
The study emphasizes comprehensive approaches and stresses the importance of validation strategies to avoid overfitting and enhance generalization. The paper summarizes recent studies, evaluation protocols, datasets, age estimation approaches, and feature extraction methods, offering a comprehensive overview of age estimation research. |
| From apparent to real age: gender, age, ethnic, makeup, and expression bias analysis in real age estimation | The study examines real age estimation in facial still images, focusing on the transition from apparent to real age. It enriches the APPA-REAL dataset with attributes like gender, ethnicity, makeup, and facial expression. Experiments with a basic Convolutional Neural Network (CNN) illustrate the influence of apparent labels on real age prediction. Bias correction on CNN predictions reveals consistent biases introduced by attributes, suggesting potential for enhanced age recognition performance. | APPA-REAL | The study suggests using apparent labels for training improves real age estimation compared to training with real ages alone. Bias correction on CNN predictions enhances age recognition performance. The analysis reviews state-of-the-art methods, emphasizing the importance of addressing biases. |
| Diagnosing deep learning models for high accuracy age estimation from a single im-age | In this study, researchers explored age estimation from face images using deep learning. They examined training and evaluation procedures with deep learning models on two large datasets. They investigated three age estimation formulations, five loss functions, and three multi-task architectures. | Morph II WebFace |
The study significantly advances age estimation from face images using deep learning. Through systematic diagnosis, researchers pinpointed key factors affecting deep age estimation models, favoring a regression-based approach with Mean Absolute Error (MAE) loss. Their proposed deep multi-task learning architecture, addressing age, gender, and race simultaneously, outperformed other models. The final deep age estimation model surpassed previous solutions on Morph II and WebFace datasets. |
| On the effect of age perception biases for real age regression | The paper proposes an end-to-end architecture for age estimation from still images using deep learning. It adapts the VGG16 model, pre-trained on ImageNet, to integrate face attributes like gender, race, happiness, and makeup levels during training. The architecture predicts both real and apparent age labels from facial images, considering human perception bias and attribute-based information. Training involves two stages: fine-tuning the last layers initially and then training the entire model end-to-end using the Adam optimization algorithm | APPA-REAL | The paper finds that incorporating face attributes into deep learning models notably enhances both real and apparent age estimation from facial images. Modifying the VGG16 model to include attributes like gender, race, happiness, and makeup levels during training yields superior performance over baseline models. The study shows that integrating specific attributes improves both real and apparent age estimation simultaneously. Additionally, attribute-based analysis sheds light on how gender, race, happiness, and makeup influence age perception. |
Disclaimer/Publisher’s Note: The statements, opinions and data contained in all publications are solely those of the individual author(s) and contributor(s) and not of MDPI and/or the editor(s). MDPI and/or the editor(s) disclaim responsibility for any injury to people or property resulting from any ideas, methods, instructions or products referred to in the content. |
© 2024 by the authors. Licensee MDPI, Basel, Switzerland. This article is an open access article distributed under the terms and conditions of the Creative Commons Attribution (CC BY) license (http://creativecommons.org/licenses/by/4.0/).
Copyright: This open access article is published under a Creative Commons CC BY 4.0 license, which permit the free download, distribution, and reuse, provided that the author and preprint are cited in any reuse.


