
Submitted:
21 March 2024
Posted:
25 March 2024
You are already at the latest version
Abstract
In this study, we investigate the growth of EV ownership among Swedish households. Through detailed socio-economic data and the Swedish vehicle register, we are able compare characteristics of households that bought an EV in 2016 with those that became EV owners in 2020. We are thus able to describe and analyse the transition from the early EV owners to the early majority. Unlike many prior studies in the field, which are based on surveys or interviews, this study relies on registry data, thereby encompassing all car owners in Sweden. In this study, we have also scrutinized the significance of ownership mode by distinguishing between households that have chosen to purchase a car and those that have chosen to lease one. The results show that the demand for EVs has reached new consumer groups, e.g. both younger and older car buyers, and that the option to lease a car privately has broadened the market for new cars in general, and for EV’s in particular.
Keywords:
EV
; market development
; passenger car
; households
; leasing
1. Introduction
In recent years, sales of EVs have increased rapidly in large parts of the world [1]. However, we know little about the distribution of electric car (EV) ownership among different household groups. In this study, utilizing data from Sweden to shed light on the burgeoning EV market, we investigate the demographics of early EV adopters1 in 2016 and the status of the market in 2020. Three research questions are answered:
- Are there any differences between households that choose an electric vehicle (EV) compared to those that choose an internal combustion engine vehicle (ICE), and is there any distinction between battery electric vehicles (BEV) and plug-in hybrids (PHEV)?
- How have such differences changed between 2016 and 2020?
- Are there any disparities between households that opt to lease a car versus those that purchase one?
The literature on the interest in buying EVs’ goes back to about 2010, coinciding with the broader market introduction of EVs. Most of the previous studies, especially the earlier ones at the time when the market for EVs was still small, have focused on attitudes and interests, of individuals or households, towards the possibility of buying an EV in the near future. The literature has since then evolved into a broader palette of research questions concerning EVs. The main method is still to this day studies of stated preference. Revealed preference studies are rare and registry data are very seldom used.
Although found important, socioeconomic factors have often merely been used as control factors. A common feat in the literature is to divide influential factors into a few larger categories, i.e., socio-economic, demographic, geographic, fuel type, offering and capacity, EV performance, interests, and influence. Almost all previous studies are limited to investigations of certain groups of individuals. The sample sizes ranges from several hundred to a few thousand respondents, which is why the results are usually reported for a single country, or for the specific area being studied.
In later years, the research has evolved into more data driven studies, although the literature continues to be dominated by surveys and interview studies on intended future purchases. We have found only a few studies that are based on more extensive data from Sweden and Norway [2,3,4,5].
A study that is closely aligned with the questions we address is Bjørge et al.'s[5] study on EV car buyers in Norway. Their study is based on survey data collected annually from Norwegian EV buyers between 2015 and 2020. The data includes information about the gender, age, and education level of electric car buyers, as well as questions about their previous cars before choosing an EV and what type of car they intend to choose next time.
The study is grounded in Rogers' Theory of Diffusion of Innovations[6], a model that explains how new ideas or technologies are adopted and spread over time within a society or culture. According to the theory, innovations are adopted by different groups in society at various stages, such as early adopters and the early majority, and they spread through communication and social interactions among these groups. Survey results indicate that the majority of EV buyers are men aged 30–49 with a higher education. However, there was a noticeable shift over time towards women and individuals under 30 increasingly purchasing EVs. However, the change was relatively small, only a few percentage points. The results were not entirely in line with the different groupings within the Theory of Diffusion since the age group 30-49 dominated regardless of adoption level.
This study provides a good understanding of socioeconomic groups that have chosen an EV in Norway. Since the study is based on surveys targeting only EV owners, it is not possible to compare the results with buyers of an ICE. With a comprehensive data material like ours, including all purchases, we have better possibilities to make such comparisons.
The ability to make comparisons using registry data is highlighted by Börjesson and Roberts' study[7] on the effect of company cars. By using registry micro-panel data covering all households in Sweden, they study the effect of company cars in the entire population while considering household-specific time-invariant unobserved preferences. They use the same data that we base our study on, but instead of studying households' choices of EVs, they are interested in the effects of company cars. Their study shows that a company car increases the probability of possessing at least one car, and this effect is stronger for single households than for couple households. Also, a company car increases car possession by an average of 0.26 cars for couple households possessing at least one car.
Börjesson and Roberts' study[7] yields interesting results and clearly demonstrates the potential of the data they have used and the type of detailed analyses that become possible with comprehensive registry data covering all households and car owners. In our study we focus on cars registered to the household to study similarities and differences between households that have chosen an EV and those that have chosen an ICE, as well as to examine whether leasing has an effect on type of car choices.
In our literature review we have also found a few studies [2,8] with a particular focus on identifying ‘early adopters’, i.e. individuals who are interested in new technologies and willing to opt for an electric vehicle early on. Plötz et al. [8] used revealed preference and found some interesting discrepancies between the common assumption that EVs attract especially younger, environmentally interested and technically savvy people [9]. Instead, Plötz [8] found that the group of early EV purchasers in Germany mainly consisted of men aged 40–50 who live in a house with multiple family members, enjoying a high financial standard of living.
Contradicting results are not limited to studies of ‘early adopters’. In our review of the previous research, we found several factors of differing signs and/or significance in different studies. This is a view shared by for instance Christidis and Focas [10] who state that there is still no proper consensus within the literature as to which factors are important. Explanations for this can be found in the study design, the study area, the sample size and so forth [11]. It is also clear that the market for EVs has evolved over time, attracting new categories of individuals and households, and this could also explain parts of the difference in results.
The most recent literature points towards some general findings. Westin et al [3], Bjørge et al. [5] and Cui et al [9] found a positive effect on the likelihood of an EV purchase for particularly older people (mid aged), but that this was insignificant for other age groups. Men are also significantly more interested in EVs than in ICEs. The results for women are on the contrary inconclusive. Individuals with a higher income, above the average, have a higher probability to purchase an EV compared to an ICE [3,5,7,8,10,11,12]. Households living in single family houses are more prone to purchase an EV, the opposite seems true for households living in flats [12]. This might be connected to the findings by Fevang et al. [12] that households in suburbs are more prone to purchasing an EV than other households. Also, the interest for EVs seems to be lower for single person households, and higher for households with children [3,9]. The levels of education seems to be important, but the research is inconclusive [2,3,9,12]. Cui et al [9] did not find any significant results for households previously owning a car on the interest in purchasing an EV. On the other hand, Caulfield et al. [13] found a positive effect on EV purchases for households that owns more cars, indicating that EVs might be purchased to be used as a second car.
In summary, it may be noted that most of the earlier research is based on different types of questionnaire or interview studies, with relatively few studies being based on any extensive data sets. It is also clear from the literature review that factors such as housing type, income, gender, education, and family size significantly influence the likelihood that one will procure an EV.
We have not been able to find any study that has analyzed whether there is any difference between households that buy a car versus those that lease the car. In Sweden, as in the rest of Europe, private leasing, where one rents the car, typically for three years, has become increasingly common in recent years [14]. Therefore, in this study, we will also include private leasing in our analysis.
Our study contributes to the literature in three ways. First, by making use of a much larger registry data set. By cross-referencing Statistics Sweden’s household data against the Swedish national vehicle register we can confirm or reject conclusions previously drawn using smaller samples of stated preferences. Second, we also expand the scope by separating results on purchases of EVs from private leasing. We also separate the results for BEV and PHEV. Third, the study period is set to 2016-2020. In this way we can distinguish between the characteristics of the early adopters and the early majority. Combined with the difficulties in finding consensus in the literature, this means that our results may deviate from those in earlier studies.
In 2016 EV sales account for 3 percent of all new car registrations in Sweden. By 2020 EV sales had climbed to 31 percent. In 2020, Sweden ranked fourth in Europe in terms of the proportion of EVs among new car registrations, with Norway at the top of the list[15]. This makes Sweden a suitable case to increase the understanding on how EV ownership spread over time through different socio-economic household groups. The study can, therefore, contribute to understanding of how EV ownership might spread throughout other parts of the world.
2. Data and Method
In this study we use two interconnected registry databases from Statistics Sweden. The first database covers all individuals registered in Sweden 2016 and 2020, featuring diverse socio-economic variables. The second database details all privately owned vehicles in Sweden, with provisions for linking vehicles to their owners in the individual-level database. The data also includes cars that are leased or are company cars but used by the household. The definition of a leased vehicle is that it needs to be leased for at least one year and be registered to an individual user.
By matching vehicle data (4.6 million vehicles) with data on Swedish households (4 million), we were able to link car ownership with several socio-economic factors. These observations were in turn linked to small geographical areas (DeSO)2 for 2016 and 2020 to match additional information to each household. We discard households owning more than five cars (<0.03%) from the analysis. We also discard households having more than 12 household members (<0.01%).
In 2016, sales of PHEVs had quite recently accelerated, although relatively few BEVs were sold. In 2016, a total of 193,000 new cars were registered to private individuals.
EVs accounted for 5% of sales in 2016, and collectively there were approximately 7,500 BEVs and almost 19,000 PHEVs in use by the end of 2016. Most of the EVs were at that time registered as company cars. Only 776 BEVs and 625 PHEVs were registered to a private owner in 2016. The households that chose to purchase an EV car in 2016 can therefore be viewed as early EV purchasers who opted to invest in a relatively new and unproven technology.
During 2020, the total car sales significantly decreased in Sweden due to the COVID-19 pandemic. Particularly, the sales declined in the first six months of the year, but then increased again during the latter half of 2020. The uncertainty surrounding the economy and global situation dampened the sales of new vehicles in general, but we have no reason to believe it affected the distribution of powertrains for the vehicles that were still purchased. Therefore, we assumed that the distribution of EVs among Swedish households was not impacted by the pandemic. In total, 127,000 new cars were registered to private individuals in 2020.
By 2020 the number of EV sales had risen to 28 000 BEVs and 66 000 PHEVs and accounted for 31% of total car sales in 2020. Of these, 10 600 BEVs and 14 600 PHEVs were registered by a household. Thus, in just four years the interest for EVs had increased significantly among the Swedish households. Another interesting observation is that out of these 25 000 EVs, 14 000 were leased, making leasing the most common ownership option for EVs among private car buyers.
In 2018, Sweden introduced the bonus-malus vehicle taxation system, which imposed a new vehicle tax based on the car's carbon dioxide emissions and fuel type. This system also replaced prior subsidies for BEVs and PHEVs, leading to an increased subsidy for EVs from 40,000 SEK to 60,000. For PHEVs, the subsidy shifted from a fixed amount of 20,000 SEK to a variable amount, calculated based on the vehicle's emissions. For most PHEV models, this adjustment resulted in a subsidy that exceeded 20,000 SEK.
By comparing 2016 to 2020, we can thus capture the shift from a situation where only a few people chose an EV to a point in time when doing so was about as common as choosing an ICE. During this time also the supply of EVs on the market increased. The range of available EV models broadened significantly between 2016 and 2020, and the difference in relative price between an EV and an ICE also changed. Vehicle characteristics and changes over time are probably important for the interest in purchasing EVs. However, this fall outside of the scope of this study focusing primarily on the buyers’ characteristics for two periods in time.
In addition to a descriptive analysis, we also estimate five regression models for the year 2020.3 The analysis was done in a sequence of steps. In the first step, Model 1 is estimated to sort out relevant factors explaining why households register a new vehicle, irrespective of the kind of fuel type. The following four models (Model 2-5) use the stock of households that has registered at least one vehicle in 2020 (taken from Model 1) to analyze factors of importance to households choosing EVs or PHEVs and the choice to buy or lease these cars. The specific model formulations are further explained in chapter 4.
Pairwise correlations between the variables were examined, followed by a multicollinearity test using the Variance Inflation Factor (VIF) [16]. Some of the variables, especially different age groups, exhibited high values (VIF > 10). Principal component analysis were performed [17,18] and linear combinations of highly correlated variables were then added to the models. In the continued analysis, some of these variables were excluded due to multicollinearity.
Step two involved a detailed analysis of each variable’s association with the dependent variable, both individually and in conjunction with other explanatory factors. This was done using scatter plots to investigate which variables had a positive or negative relationship with the dependent variable. Several model specifications were subsequently tested to select a subset of variables for inclusion in the model specification. In the third and final step, backward stepwise selection, stepwise selection, and Mallows’ Cp selection [19,20] were performed.
3. Descriptive Statistics
The results of the analysis are presented based on the five variables for which we have data at the household level, i.e. gender, age, income, housing type and household type. In addition to these variables, we have also linked the households’ cars to ownership type, i.e., whether they own the cars or lease them.
Regardless of whether a car is an EV or not, it is most common for a man to be registered as its owner (Figure 1).
The share of EVs registered to women increased somewhat from 2016 to 2020, primarily with respect to plug-in hybrids, where the difference between men and women approached the distribution pattern for the entire fleet, regardless of fuel type.
Car purchases correlate strongly with age (Figure 2 and 3). Younger people generally own a relatively small share of the Swedish vehicle fleet, and account for a low share of newly registered cars. Purchasing a car becomes increasingly common with increasing age, at least up until retirement age (65 years). Peak new car purchases are found in the 51–64 age group, followed by a decrease in car acquisition among those over 65.
The younger age categories, under the age of 31, accounted for an extremely low share of all new car purchases in 2016, regardless of fuel type (Figure 2). However, it is evident that among car buyers aged 31-50, they preferred BEVs and represented a significant share of purchases of these cars. PHEVs exhibited a somewhat similar pattern. In contrast, the two oldest age categories accounted for a lower share of newly registered BEVs, especially the 65 plus category, which preferred ICEs instead.
Comparing the distribution of new cars in 2016 with 2020, we can observe some interesting differences (Figure 3). For ICEs, there were no major differences between 2016 and 2020. Only a few percentage points changed between some age groups in the comparison years. For EVs, we see a change in that a larger share of cars has been registered by individuals in the age range of 21-30 compared to 2020. Even in the oldest age group, 65 plus, the proportion of BEVs increased significantly compared to 2016. BEVs remained most popular among buyers aged 41-50, but the difference compared to ICEs decreased. We can also see that PHEVs, to a greater extent than in 2016, had a similar distribution to ICEs in the two age groups of 41–50 and 51–64.
A car is often the households’ second-largest purchase after housing and given a low income it is probably difficult to finance the purchase of a new car. This is confirmed by the results as low-income households very seldom purchase a new car, and this pattern is even clearer for EVs (Figure 4).
For ICE, in 2016, the sales were relatively evenly distributed among the four higher income groups. However, for EVs, we observe that nearly half of all new cars were registered by households in the highest income bracket. These results are not particularly surprising. Since EVs had not achieved price parity with ICEs in 2016, they are even more difficult for a low-income household to finance. There was still not a price parity between ICEs and EVs in 2020, but the price difference was smaller.
Up until 2020, the distribution of newly registered cars has slightly changed across income groups. For ICE, the distribution remains largely the same as in 2016 (Figure 5). However, for EVs, there is a dispersion evident among households, with a larger proportion of cars being registered by households in the highest income bracket. This is particularly notable for PHEVs, which had a distribution pattern similar to ICE within the three higher income brackets. Consequently, PHEVs had a distribution among the different income groups that increasingly resembled that of ICEs.
Just over 40% of Swedish households live in a single-family dwelling, but they accounted for 65% of all newly registered passenger cars, in 2020, regardless of fuel type (Figure 6). A single-family dwelling is thus the most common housing type for households that registered a new car that year. Households living in special housing5 had the lowest share of newly registered cars in relation to how many that reside in this type of housing.
The pattern is even clearer when we separate the ICEs from the EVs (Figure 7 and 8). A clear majority of all newly registered EVs in both 2016 and 2020 were registered to a household living in a single-family dwelling, and to a much higher degree than ICEs. At the same time it was significantly more common for residents in condominiums to choose an EV compared to those living in a rented apartments.
Four years later the picture has changed, especially for PHEVs. The majority are still registered to residents in single-family dwelling, but sales have become more evenly spread among other residence types compared to 2016 (Figure 8). The proportion of PHEVs registered by condominium residents increased from 10 percent in 2016 to 15 percent in 2020, almost reaching parity with the proportion of ICEs. For BEVs, there was an increase from 7 to 12 percent during the same period.
Households comprising of cohabitants, with or without children, were the most common new car purchasers (Figure 9). Singles without children also acquired a significant share of the ICE registered in 2020. Nearly half of all EVs registered in 2020 were purchased by cohabitants with children under the age of 24. If we compare the change in the sales of EVs between 2016 and 2020, we see that the proportion of EVs owned by cohabitants with children decreased from 53 percent in 2016 to 46 percent in 2020. Meanwhile, the proportion of EVs among cohabitants without children increased from 26 to 32 percent. Among the other household types, there are only small differences in the distribution of EVs between 2016 and 2020.
Notably, the majority (65 percent) of the EVs registered to cohabitants with children under the age of 24 were privately leased. The highest share of private leasing, regardless of whether or not the car was an EV, was found among single people with children under the age of 24 (59 percent).
Private leasing of cars has become increasingly common in Sweden, as well as in the rest of Europe. Initially, it primarily involved leasing of ICEs, but in 2019, EVs began to be leased to a larger extent, quickly becoming the most common ownership form for individuals opting for an EV. In 2020, 44 percent of all newly registered cars were acquired by an individual through private leasing. However, there are significant differences between different fuel types and among households interested in private leasing.
For ICEs, the private leasing rate in 2020 was 44 percent, for PHEVs it was 57 percent, and for BEVs it was 53 percent. As such, leasing the car was the most common way for Swedish households to acquire an EV in 2020. However, it is clear that younger car buyers in particular tend to prefer private leasing (Figure 10). The two older age categories, 51–64 years and 65 plus, have a considerably lower share of privately leased cars compared to other age categories. Especially the category of 65 plus prefer purchasing the car instead of leasing it. It is also evident that PHEVs are most commonly privately leased. However, for age categories from 40 years and above, the leasing rates for PHEVs and BEVs are converging, but still remain significantly higher than for ICEs.
As seen previously, households with an annual income below 200,000 SEK rarely acquire a new car. In 2020, the two lowest income groups accounted for only 3 percent of all new cars registered by an individual. The rate of private leasing is also the lowest among households with an income below 200,000 SEK, regardless of fuel type (Figure 11).
Therefore, private leasing is not used as a method for low-income families to acquire a new car. Instead, the proportion of private leasing increases with income groups, except for the highest income group, over 800,000 SEK, for which the proportion of private leasing decreased slightly. PHEVs had the highest proportion of private leasing of EVs irrespective of income except for the lowest and highest income groups.
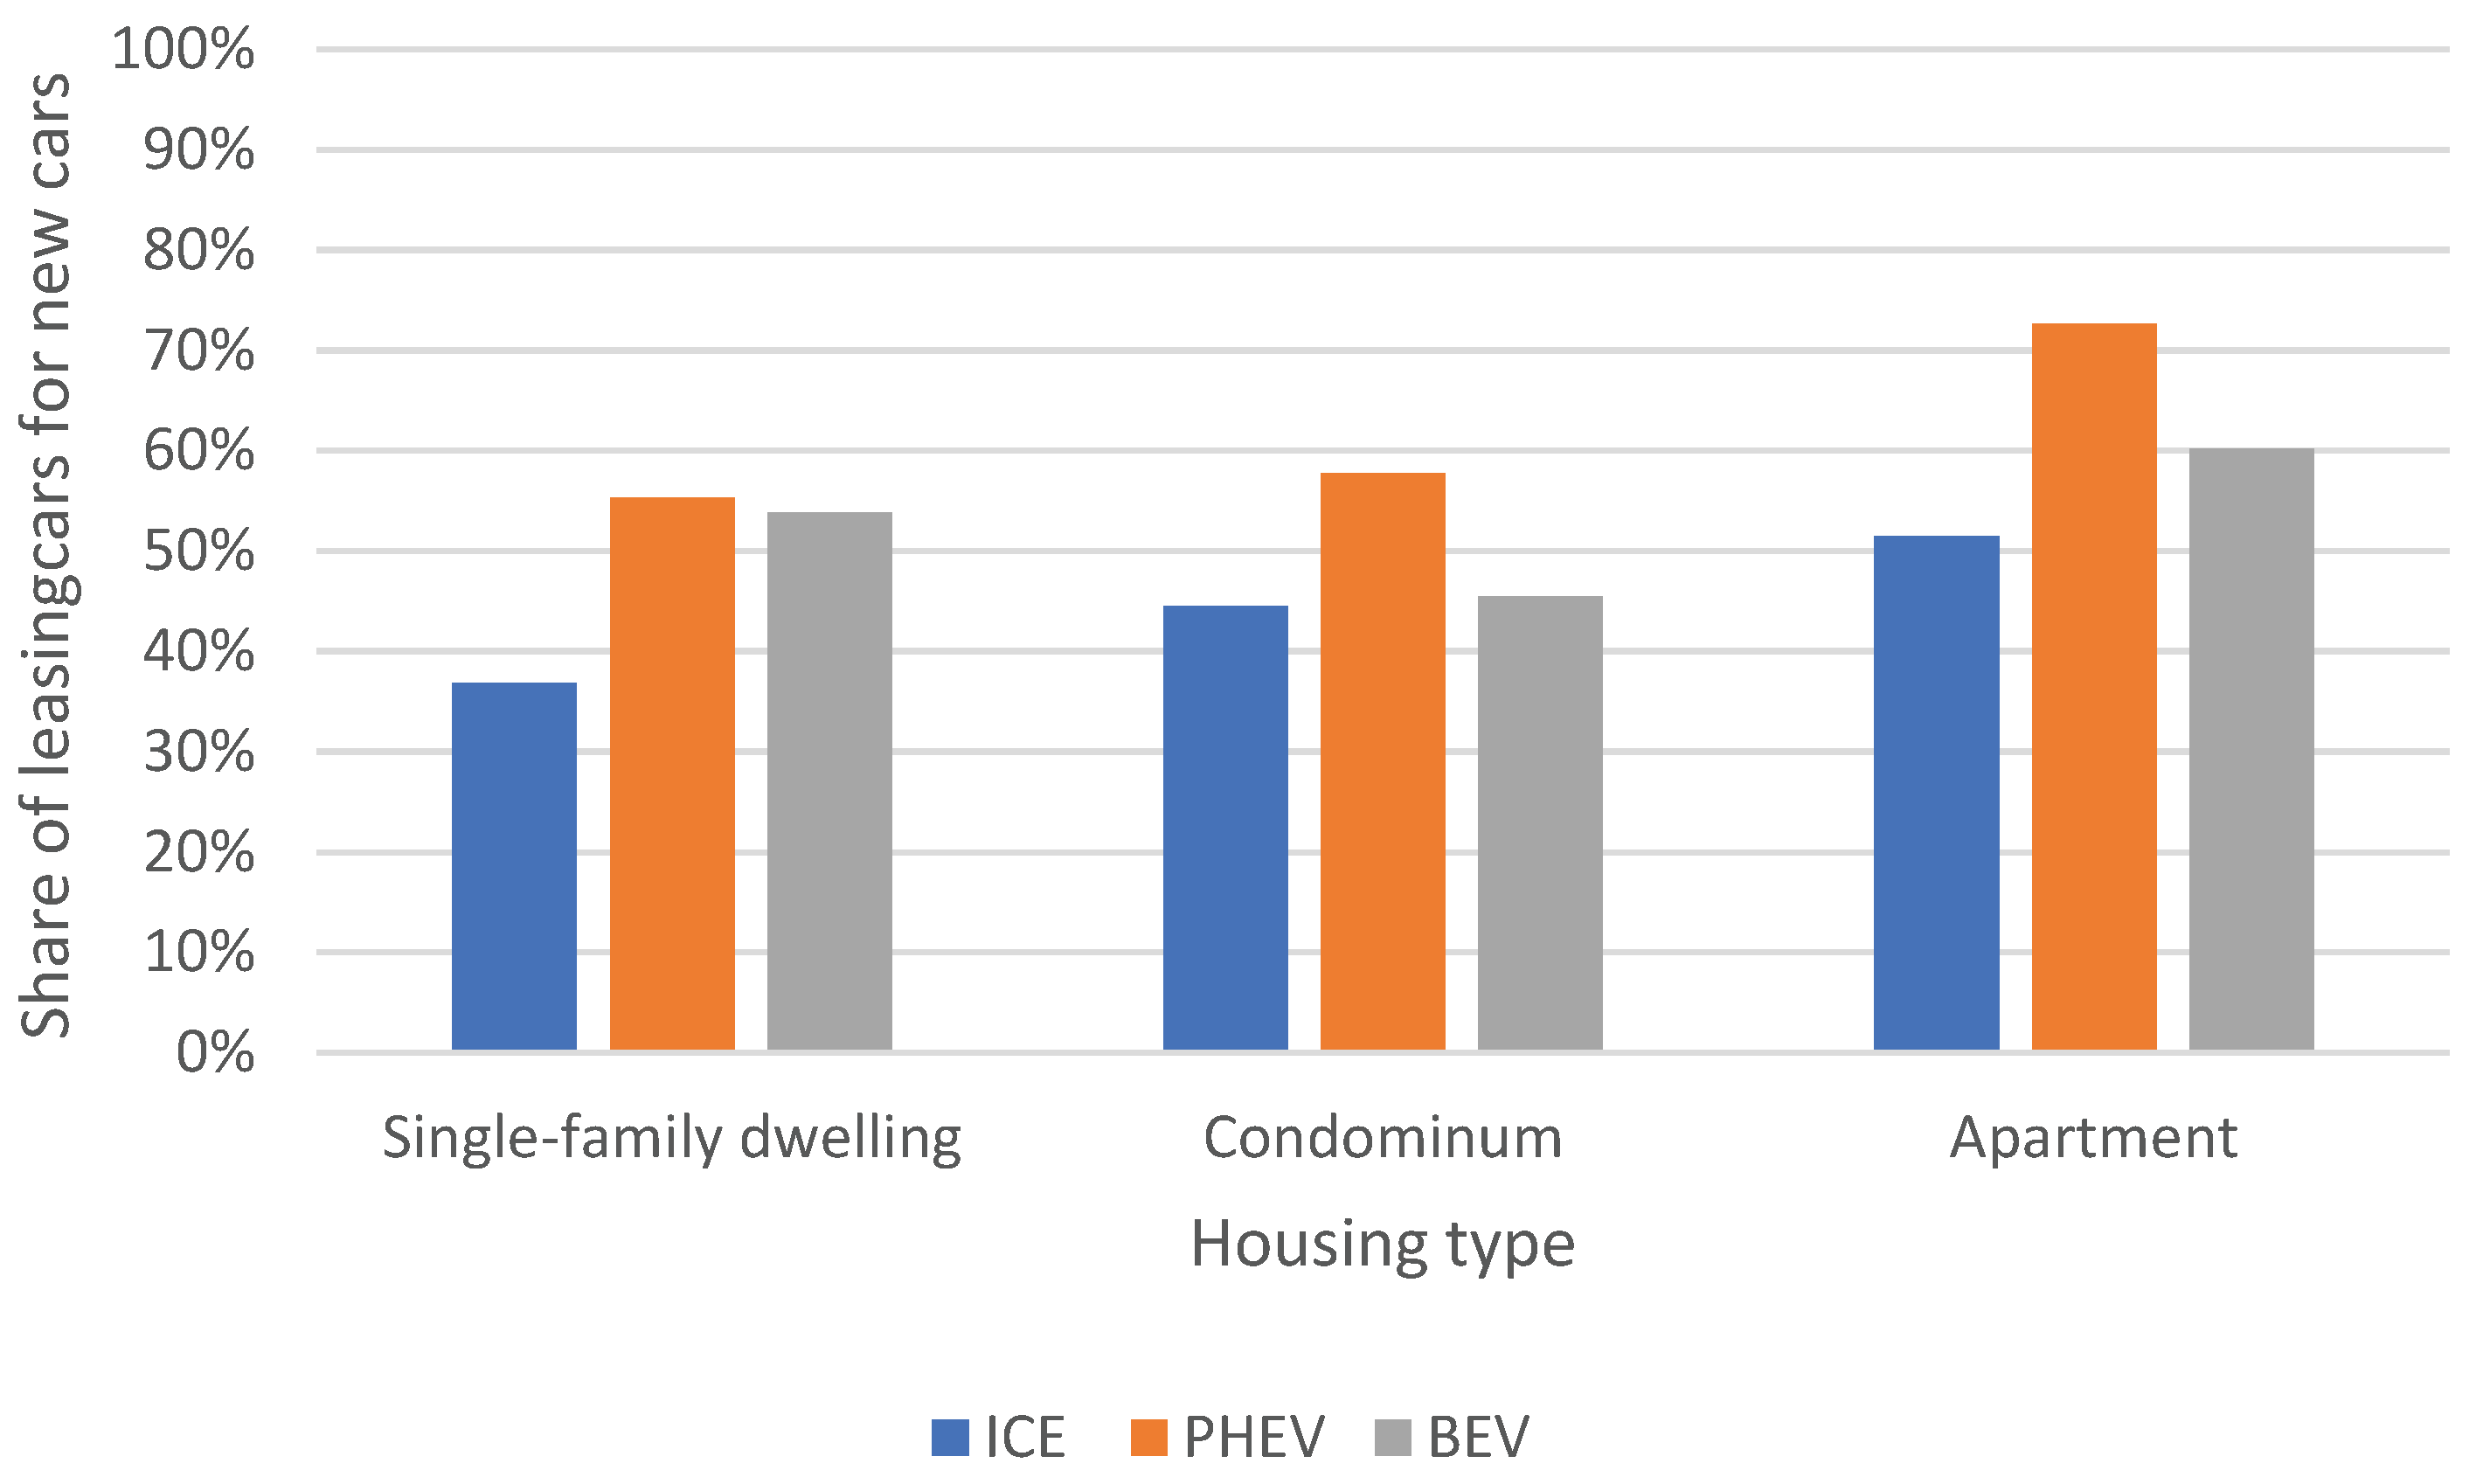
Households residing in single-family dwellings accounted for 50 percent of all new cars registered by an individual in 2020. Households living in single-family dwellings preferred to purchase their ICE car but had a higher inclination towards leasing their new EVs (Figure 11). For residents in condominiums and apartments, private leasing was a much more common ownership form, especially for those living in apartments, where a majority of the newly registered cars were privately leased. We also note that PHEVs were significantly overrepresented as privately leased cars among households living in apartments.
4. Regression Analysis
As seen in the previous chapter important aspects in determining households that tend to buy or lease EVs seems to be connected to demography, socioeconomics, and geography. Based on these findings and results from previous studies the following four hypothesis were formulated to guide the regression analysis.:
- 1.
- Explanatory factors for newly registered cars hypothesis
- Null Hypothesis (H0): The explanatory factors will have similar signs for newly registered cars in 2016 and 2020, i.e., the vehicle registration patterns in 2016 and 2020 follow the same trends with respect to the explanatory factors.
- Alternative Hypothesis (H1): The explanatory factors will not have similar signs for newly registered cars in 2016 and 2020, i.e., the vehicle registration patterns in 2016 and 2020 do not follow the same trends with respect to the explanatory factors.
- 2.
- Income level and new car registration hypothesis
- H0: Household income level does not significantly affect the likelihood of purchasing a new car, regardless of the car type.
- H1: Households with higher income are more likely to purchase new cars, especially EVs, compared to households with lower income.
- 3.
- Housing type and car registration hypothesis
- H0: The type of housing does not significantly affect the type of car (ICE, PHEV, BEV) registered by the household.
- H1: Households living in single-family dwellings are more likely to register new cars, particularly EVs, compared to households in other types of housing.
- 4.
- Car ownership and likelihood to register an EV hypothesis.
- H0: There is no difference in the likelihood of households that already own a car to register an EV compared to those without a car.
- H1: Households that already own a car are more likely to register an EV compared to those without a car.
The regression analysis is performed using five model setups for the two years. The first regression model (Model 1) was aimed at identifying factors that determine the registration of new vehicles, without taking into consideration the type of fuel used. The sample consisted of all Swedish households. The subsequent four models (Models 2-5) use only the subset of households that had registered a vehicle in the first model, to distinguish between factors that are important for the purchasing and leasing of electric cars and plug-in hybrids in comparison to other vehicles.
- Model 1: Which factors can explain that a household’s choice to register (purchase or lease) a car during the year, regardless of fuel type?
- Model 2: Given that a household has bought a vehicle during the year (i.e., a subset of the households in Model 1), what factors can explain the choice to buy a BEV?
- Model 3: Given that a household has bought a vehicle during the year (i.e., a subset of the households in Model 1), what factors can explain the choice to buy a PHEV?
- Model 4: Given that a household has leased a vehicle during the year (i.e., a subset of the households in Model 1), what factors can explain the choice to lease a BEV?
- Model 5: Given that a household has leased a vehicle during the year (i.e., a subset of the households in Model 1), what factors can explain the choice to lease a PHEV?
The parameters in all models were estimated by logit regression, using SAS. The descriptive analysis provided us with a bulk of variables to investigate. In the process to select which ones to include in the regression analyses various tests were performed to determine a final set of variables to include, see chapter 2. The following variables were included in the regression analysis:
- Income: Households’ disposable income broken down by quintiles.
- Education level per DeSO: Percentage (0–100) of the population with post-secondary education shorter than 3 years.6
- Housing type: Four categories, 1) Rental apartments in multi-family buildings (reference group), 2) Ownership or condominiums in multi-family buildings, 3) Single-family dwellings, 4) Special housing.
- Household type/Family formation: Single without children, Single with children (reference group), Cohabiting with and without children, and Others.
- Gender: Number of male car owners in the household minus the number of female car owners in the household.
- Swedish background per DeSO: Percentage (0–100) of residents with Swedish background per DeSO.
- Public transport services per DeSO: The logarithm7 of the number of departures per day from each DeSO.
- Age: The age of the household’s oldest car owner.
- Access to company cars: The number of company cars that the household has access to.
- Number of vehicles owned by the household at the beginning of the year.8
- Central part of a municipality: DeSO-C2 with DeSO-A and DeSO-B being the reference. This variable is intended to control for the degree of urbanization within a municipality.
- Municipality type: The Swedish Agency for Economic and Regional Growth has classified municipalities into six different types9 based on certain criteria to facilitate comparisons and analyses in various statistical contexts. This factor controls for varying degrees of urbanization and other differences at the municipal level. The reference type being rural municipalities near urban areas.
Model 1 includes all Swedish households. Model 2 and 3 consists of the households that during 2020 purchased at least one car and model 4 and 5 those households that leased at least one car.

Table 1.
Regression results for the year 2020.
| Variable | All cars 2020 (Model 1) |
BEV purchase 2020 (Model 2) |
PHEV purchase 2020 (Model 3) |
BEV lease 2020 (Model 4) |
PHEV leasing 2020 (Model 5) |
|---|---|---|---|---|---|
| Constant | -6,38*** | -6,33*** | -2,09*** | -5,28*** | -2,05*** |
| Income | 0,64*** | 0,33*** | 0,20*** | 0,27*** | 0,17*** |
| Education | 0,02*** | 0,03*** | 0,003 | 0,02*** | 0,001 |
| Housing – Condominium | 0,23*** | 0,59*** | 0,13*** | 0,33*** | 0,16*** |
| Housing – Single-family dwelling | 0,70*** | 0,94*** | 0,24*** | 0,98*** | 0,34*** |
| Housing – Special Housing | -0,05* | 0,83*** | 0,19*** | 0,95*** | 0,21*** |
| Swedish background | 0,002*** | 0,02*** | -0,001 | 0,01*** | -0,001 |
| Public transport services | 0,01*** | 0,02 | 0,004 | 0,02 | -0,01 |
| Vehicles in the household already | -1,26*** | 0,07** | -0,21*** | 0,29*** | -0,09*** |
| Central part of the municipality (DeSO – C) | 0,25*** | -0,23*** | 0,13*** | -0,14*** | -0,01 |
| Access to company cars | -0,60*** | 0,08 | -0,26*** | 0,31*** | -0,20*** |
| Municipality – Sparsely mixed | 0,01 | -0,39*** | 0,13** | -0,19* | 0,19*** |
| Municipality – Sparsely rural | -0,22*** | -0,26** | 0,06 | -0,26** | 0,17** |
| Municipality – Very sparsely rural | -1,23*** | -1,11* | -0,26 | -1,31 | -0,18 |
| Municipality – Metropolitan | -0,31*** | 0,34*** | 0,13*** | -0,07 | 0,20*** |
| Municipality – Densely mixed municipalities | 0,05*** | -0,03 | 0,12*** | -0,19*** | 0,17*** |
| Family – Single, no children | -0,05** | 0,36** | 0,13* | 0,35*** | 0,09 |
| Family – Co-habitant, with children | 0,36*** | 0,10 | 0,15** | 0,10 | 0,11* |
| Family – Co-habitant, no children | 0,48*** | 0,06 | 0,17*** | 0,11 | 0,13* |
| Family – Other household types | 0,07*** | -0,05 | -0,001 | -0,11 | 0,07 |
| Majority of men in the household | NA | 0,15*** | 0,04*** | 0,81*** | 0,12*** |
| Age – -25 | NA | -0,21 | -0,50*** | -1,01*** | 0,03 |
| Age – 26–35 | NA | -0,06 | -0,21*** | -0,39*** | 0,04 |
| Age – 46–55 | NA | -0,31*** | 0,08* | -0,36*** | -0,09** |
| Age – 56–65 | NA | -0,58*** | 0,18*** | -0,59*** | -0,10** |
| Age – 66 - | NA | -0,68*** | 0,37*** | -0,54*** | -0,17*** |
| Number of observations | 4 677 904 | 62 112 | 62 112 | 50 875 | 50 875 |
| Akaike Information Criteria (AIC) | 923 799 | 29 239 | 76 976 | 30 026 | 58 134 |
| Percent Concordant | 79,9 | 69.1 | 59.1 | 71.1 | 58.1 |
Note: Significance levels, *** <0,001; ** <0,01; * <0,05. Model 1 lack parameter values for age and sex. This is because we lack information on age and sex for those households that didn’t register a new vehicle in 2020. This information is added later by Statistics Sweden.
With increased income, living in a condominium or a sing-family dwelling, and residing in areas with a high proportion of residents of Swedish background, the likelihood of purchasing or leasing an EV increase. For the probability of buying or leasing a PHEV, income and housing type are also important. Living in an area with a high proportion of Swedish background does not impact the choice of a PHEV.
Households with access to a company car had a significantly higher likelihood of privately leasing an EV in 2020. For households that already own a car, the probability of both purchasing and leasing an EV increased in 2020. However, households that already own a car or have access to one or more company cars tend to have a significantly lower likelihood of acquiring an BEV or PHEV. These results may reflect the continued role of electric cars as second vehicles. Interestingly, the availability of public transportation does not significantly impact the decision to purchase or lease plug-in vehicles.
Education level (with a high proportion having post-secondary education shorter than 3 years) in the area appears to positively influence the likelihood of new registrations overall, as well as for purchasing and leasing BEVs in 2020.
Households residing in urban centers (DeSO C) appear to register more vehicles than other households, but they generally have a lower likelihood of purchasing or leasing a BEV. The probability of buying a PHEV remains positive and aligns with overall new car purchases by households.
The probability of purchasing a BEV is higher for households residing in metropolitan municipalities, although this association is not observed for BEV leasing. The likelihood of purchasing and leasing PHEVs is also greater in metropolitan municipalities and densely mixed municipalities. Additionally, in sparsely mixed municipalities and sparsely rural municipalities, the probability of leasing PHEVs also increases. This suggests that there may be some hesitation among residents in less densely populated areas to purchase PHEVs, especially if travel outside the local area is frequent. We observe only a modest positive effect of public transportation availability on the overall likelihood of vehicle registration, but no discernible impact on the choice of EVs.
The formation of families appears to have only limited impact on the purchase and leasing of EVs. Single people without children seem to have a slightly higher likelihood of purchasing or leasing a BEV compared to other groups, while cohabiting households tend to prefer purchasing or leasing a PHEV. Closely tied to family formation are the age and gender of family members. Households with more males increase the likelihood of choosing an EV. For younger age categories, the probability of purchasing a PHEV or leasing a BEV decreases. Among older individuals, the likelihood of PHEVs tends to be higher, and significantly lower for both purchasing and leasing a BEV.
The market for both BEVs and PHEVs has evolved between 2016 and 2020. The number of households interested in them has also increased over time. Differences in significant parameter values over time indicate this change and suggest that the market in 2016 had not yet identified clear customer segments. In 2020, there are signs that the market for EVs is beginning to resemble the overall passenger car market. The market for PHEVs is most similar, while the typical BEV buyer still has a more distinct and different profile. Factors such as higher income, residing in a single-family dwelling or condominium, and households with a male majority are positively associated with both BEV and PHEV purchases and leasing. Specifically for BEV households, they are located in areas with a relatively well-educated population, commonly with Swedish background. These households are predominantly situated in a metropolitan municipality, although not typically in the central part of the municipality. Both purchasing and leasing households often already own a car. There is also a tendency for the oldest car owner in a household to be slightly younger compared to car owners in households that purchase or lease PHEVs. Additionally, BEVs are more popular than PHEVs among single households, while the opposite holds for co-habitant households.
5. Conclusions
In the introduction three research questions were put forward.
- Are there any differences between households that choose an EV compared to those that choose an ICE, and is there any distinction between BEVs and PHEVs?
- Has this potential difference changed between 2016 and 2020?
- Are there any disparities between households that opt to lease a car versus those that purchase one?
In this study we have found that the market for EVs grew significantly between 2016 and 2020, with the distribution of PHEVs becoming more similar to the distribution of ICE cars over time. One notable change is the broader distribution of EV ownership among different socio-economic groups in 2020. In 2016, over 50% of all newly registered EVs were owned by households with an income over SEK 800,000/year, but this share had dropped to 44% by 2020. The share of EVs newly registered by households in the SEK 400,000 to 800,000/year income groups had increased. In terms of housing, the majority of all passenger cars, whether EVs or not, were registered by households living in single-family dwellings. However, this share had fallen from 86% in 2016 to 76% in 2020, with an increasing number of EVs being registered by residents of condominiums.
As we have seen, there are also some differences between households that choose private leasing and those that opt to purchase a car. Notably, households more frequently choose private leasing for PHEV vehicles than for BEVs. Private leasing is more common among younger individuals. The proportion of private leasing is highest in the 25–30 age group and lowest for the 65+ age group. Additionally, private leasing is more prevalent among residents of multi-family buildings and households with children.
The results in relation to the hypotheses formulated in chapter 4 are discussed below.
- Explanatory factors for newly registered cars hypothesis
In the various models of regression analysis, the resulting parameter values vary between the models and over time. However, for both of the studied years, they exhibit very similar signs. In other words, the explanatory factors were found to impact new registrations in a similar manner over time.
- Income level and new car registration hypothesis and
- Housing type and car registration hypothesis
New car buyers, in general, tend to live in single-family houses, and this applies even more so to those who choose a plug-in vehicle. This association may be related to higher income, but it is also connected to the possibility of having a charging point at home, which single-family homeowners can facilitate to a greater extent than residents of multi-family buildings. The majority of the plug-in vehicles included in this study have been PHEV’s, which have a significantly smaller battery than an BEV and therefore require more frequent charging. The fact that most owners of PHEV’s with a small battery live in their own houses, and thus have the opportunity to charge regularly at home, likely contributes to a behavior when having the ability to charge at home is essential. This is both because the opportunity exists and because it facilitates maintaining a sufficiently charged battery.
Geography and family composition have a mixed effect on new vehicle registrations. Urban residents tend to have slightly higher likelihood of purchasing and leasing BEV compared to rural residents, but this is not a universal pattern. For instance, the impact is negative for the purchase and leasing of BEVs among households residing in municipal centers (DeSO C). The same applies to family composition, where it appears that single individuals without children prefer BEVs, while cohabiting households are more inclined to buy or lease PHEVs. In relation to the age category 36–45, there is generally a lower likelihood for individuals in other age categories to purchase or lease a BEV, with the exception of older individuals who prefer PHEVs more frequently than the reference age group. The underlying explanations could be related to daily logistics and the availability of charging infrastructure, which may vary in different areas and types of housing.
- Car ownership and likelihood to register an EV hypothesis
However, if the household already owns a car, it has a positive impact on the likelihood of purchasing or leasing a BEV, but a negative impact on the purchase or leasing of a PHEV. Similarly, there is a negative impact on the purchase and leasing of PHEVs if the household has access to one or more company cars. It is conceivable that households with access to a company car already possess a PHEV, and when choosing an additional car, they opt for a less expensive ICE.
6. Discussion
Based on the results from this study, it is clear that both supply and demand for EVs have grown between the two years studied. Earlier research suggested that individuals and households who were among the first to choose an electric vehicle were often characterized as having considerable knowledge and interest, commonly referred to as 'early adopters’. These individuals and households typically but not always, possessed the financial capability to make such a purchase. In this study we were able to demonstrate that in 2016, households with high income, residing in single-family dwellings, and having children under 18 at home were the primary purchasers of EVs. As the offering of available EVs grew, together with an option of private leasing in 2020, EVs have become a real option to consider for many households. However, there still appears to be some degree of resistance to making the move from an ICE to a BEV. In such cases a PHEV may serve as an intermediate step since they offer similar driving characteristics to an ICE car. They should therefore attract similar buyers. This is confirmed in our study. PHEVs are in fact being newly registered in large numbers by households with similar characteristics compared to households that normally chooses to register an ICE car. In other words, the differences between households that choose a PHEV and those that opt for an ICE car are no longer as great.
This is not the case for BEVs, they are still viewed as significantly different from PHEVs and ICEs. They are still not compatible enough with the corresponding households needs. They might however be suited as the family’s second car, something that is confirmed in our data. As the characteristics, driving distance for instance, of the BEVs continues to develop and becomes more similar to a PHEV or an ICE, a fair prognosis is that we will see a convergence in BEV and PHEV shares in just a few years, and a change away from ICE. The big question in the coming years for the Swedish case is however if the vehicle stock has changed, but the owners are the same as before. Or will the EVs attract new types of byers that previously didn’t consider purchasing, or leasing, a new car? Some indication of the latter is provided by looking at the differences between those that lease and those who buy their car. Private leasing is more common for EVs than for ICE cars, and it is more prevalent among younger people and households with children. The share of private leasing is highest between the ages of 25 and 30 and lowest for those 65 and over. Residents of condominiums are also more likely to choose private leasing. This means that the number of potential car users has increased over time.
With respect to countries which currently have EV sales on a par with Sweden’s sales level in 2016, the results of our study may offer some guidance in terms of the spreading of such vehicles out into new customer groups. The initial purchasers of EVs are prosperous, high-income consumers who live in single-family dwellings. However, we have been able to show that, in just four years, the market for EVs came, by and large, to resemble the new car market in general. It is still the prosperous households that are opting for new cars, which means that also the customer group for new EVs will be limited, assuming that such vehicles do not become significantly less expensive than current ICE cars. This should also mean that private leasing will play an important role in the introduction of EVs to younger households with more modest incomes.
The patterns shown in this paper for Sweden will likely appear in all European countries within the next 10 to 15 years, supported by the adoption of the EU legislation Fit for 55. The transition will probably also be much quicker since the availability of various models are much higher today so that families will have a better chance of finding a car that fit their needs. A limiting factor for a broad introduction, especially in urban areas, is the charging infrastructure, both for charging at home as well as access to affordable public charging opportunities.
Furter research can be expanded in several ways. The results presented here should be expanded by further regression analyses. For instance, a regression analysis could also include the effect of social interaction with neighbors that may act as influencers to boost the interest in purchasing an EV. However, it can be hard to find data for this type of analysis. A solution to the data scarcity problem can be to use spatial econometric estimation techniques. A proxy indicator for attitude may also be tested, such as voting patterns for political parties. Such data will of course not be available at the household level, but it can be collected for election districts. The election results can be used to estimate the general sentiment for a green environment (and other issues) in a district. Another direction would be to include the actual characteristics of the cars (i.e. brand, battery capacity, engine size, charging options) that have been selected by consumers from households with different characteristics. Relying solely on registry data does however mean that we are not able to capture the motivations and driving forces behind households' choices of the cars they opt for. For further studies, the results could be complemented with a survey based on the findings obtained in this study. It would allow us to connect the observed trends to the driving forces and motivations behind why certain households have chosen an EV before others.
Author Contributions
Conceptualization, M.L. and K.S.; Data curation, B.T.; Formal analysis, M.L. and K.S.; Investigation, M.L. and K.S.; Methodology, M.L. and K.S.; Project administration, M.L.; Writing - original draft, M.L. and K.S.
Data Availability Statement
Parts of the data presented in this study are openly available at https://www.trafa.se/en/road-traffic/vehicle-statistics/. This includes all information about the Swedish vehicle fleet at an aggregated level. The availability of vehicle data at the household level is restricted and is only accessible upon request from the corresponding author. These data are not publicly available due to privacy reasons.
Conflicts of Interest
The authors declare no conflict of interest.
| 1 | The private individuals who have opted for an EV early on are often described as ‘early adopters’ in the literature; they are characterized as being interested in technology, climate/the environment, and as having the financial means to be able to be the first to try out new technologies. However, such people constitute a very limited customer group, and the question is which households will be next in line as the market for EVs broadens and a greater share of the new cars sold are EVs. Our knowledge in terms of which households in Sweden were early adopters of EVs and which will come onboard in the next few years has been limited. |
| 2 | DeSO (Demographic Statistical Areas) is a nationwide division that follows county and municipal boundaries, dividing Sweden into 5,984 areas with between 700 and 2,700 inhabitants each. Category A: DeSO in this category is primarily located outside major population concentrations or urban areas. Category B: DeSO in this category is mainly located within a population concentration or urban area but not in the municipality’s central city. Category C: DeSO in this category is primarily located in the municipality’s central city. In summary, 72 percent of DeSO falls within category C, while 18 percent belong to category A, and 10 percent fall within category B. |
| 3 | Regression results for 2016 is available upon request. |
| 4 | Tkr=thousands SEK, 1 Euro~11 SEK |
| 5 | Special housing consists of housing adapted for a specific group, such as student housing or a retirement home. |
| 6 | The focus on the group with post-secondary education shorter than 3 years is explained by a descriptive analysis that found areas with a high proportion of individuals lacking post-secondary education, as well as areas with education exceeding a 3-year post-secondary level, have significantly lower car ownership compared to areas with a high proportion of post-secondary education lasting less than 3 years. In other words, regions where a substantial number of people have shorter post-secondary education tend to have higher car ownership rates. |
| 7 | Logarithmization was performed to obtain data distribution closer to normal. |
| 8 | The Vehicle Register provides information about the number of vehicles registered for each household at the end of the year. To obtain the count of vehicles at the beginning of the year, we exclude any vehicles that may have been newly registered during the year for each household. |
| 9 |
Metropolitan municipalities where more than 80 percent of the population live in urban areas. These municipalities, along with adjacent ones, have a combined population of at least 500,000 inhabitants. |
| 10 |
Densely mixed municipalities. More than 50 percent of the population lives in urban areas. The majority of the municipality’s population has a travel time of less than 45 minutes by car to an urban area with at least 50,000 inhabitants. |
| 11 |
Sparsely mixed municipalities. More than 50 percent of the population lives in urban areas. However, the majority of the municipality’s population has a travel time of more than 45 minutes by car to an urban area with at least 50,000 inhabitants. |
| 12 |
Rural municipalities near urban areas. They have a significant proportion of their population living in rural areas but close to towns or urban centres. |
| 13 |
Sparsely populated rural municipalities located far from urban centres. |
| 14 |
Very sparsely populated rural municipalities with minimal urbanization. |
References
- New Registrations of Electric Vehicles in Europe. Available online: https://www.eea.europa.eu/en/analysis/indicators/new-registrations-of-electric-vehicles (accessed on 5 December 2023).
- Egnér, F.; Trosvik, L. Electric Vehicle Adoption in Sweden and the Impact of Local Policy Instruments. Energy Policy 2018, 121, 584–596. [Google Scholar] [CrossRef]
- Westin, K.; Jansson, J.; Nordlund, A. The Importance of Socio-Demographic Characteristics, Geographic Setting, and Attitudes for Adoption of Electric Vehicles in Sweden. Travel Behaviour and Society 2018, 13, 118–127. [Google Scholar] [CrossRef]
- Trafikanalys Eldrivna Vägfordon - Ägande, Regional Analys Och En Möjlig Utveckling till 2030; 2022.
- Bjørge, N.M.; Hjelkrem, O.A.; Babri, S. Characterisation of Norwegian Battery Electric Vehicle Owners by Level of Adoption. WEVJ 2022, 13, 150. [Google Scholar] [CrossRef]
- Quinlan, E.M.R. , Arvid Singhal, Margaret M Diffusion of Innovations. In An Integrated Approach to Communication Theory and Research; Routledge, 2008 ISBN 978-0-203-88701-1.
- Börjesson, M.; Roberts, C. The Impact of Company Cars on Car Ownership. Transportation Research Part A: Policy and Practice 2023, 176, 103803. [Google Scholar] [CrossRef]
- Plötz, P.; Schneider, U.; Globisch, J.; Dütschke, E. Who Will Buy Electric Vehicles? Identifying Early Adopters in Germany. Transportation Research Part A: Policy and Practice 2014, 67, 96–109. [Google Scholar] [CrossRef]
- Cui, L.; Wang, Y.; Chen, W.; Wen, W.; Han, M.S. Predicting Determinants of Consumers’ Purchase Motivation for Electric Vehicles: An Application of Maslow’s Hierarchy of Needs Model. Energy Policy 2021, 151, 112167. [Google Scholar] [CrossRef]
- Christidis, P.; Focas, C. Factors Affecting the Uptake of Hybrid and Electric Vehicles in the European Union. Energies 2019, 12, 3414. [Google Scholar] [CrossRef]
- Secinaro, S.; Calandra, D.; Lanzalonga, F.; Ferraris, A. Electric Vehicles’ Consumer Behaviours: Mapping the Field and Providing a Research Agenda. Journal of Business Research 2022, 150, 399–416. [Google Scholar] [CrossRef]
- Fevang, E.; Figenbaum, E.; Fridstrøm, L.; Halse, A.H.; Hauge, K.E.; Johansen, B.G.; Raaum, O. Who Goes Electric? The Anatomy of Electric Car Ownership in Norway. Transportation Research Part D: Transport and Environment 2021, 92, 102727. [Google Scholar] [CrossRef]
- Caulfield, B.; Furszyfer, D.; Stefaniec, A.; Foley, A. Measuring the Equity Impacts of Government Subsidies for Electric Vehicles. Energy 2022, 248, 123588. [Google Scholar] [CrossRef]
- Maguire, J. Private Vehicle Ownership Falls by 42% in Europe as Leasing Grows. Available online: https://www.fleetnews.co.uk/news/leasing-news/2021/11/29/private-vehicle-ownership-falls-by-42-in-europe (accessed on 5 December 2023).
- Statistics | Eurostat Available online:. Available online: https://ec.europa.eu/eurostat/databrowser/product/page/ROAD_EQR_CARPDA__custom_6413896 (accessed on 6 March 2024).
- Daoud, J.I. Multicollinearity and Regression Analysis. J. Phys.: Conf. Ser. 2017, 949, 012009. [Google Scholar] [CrossRef]
- Sharma, S. Applied Multivariate Techniques; Wiley: New York, 1996; ISBN 978-0-471-31064-8. [Google Scholar]
- Howard E.A., Tinsley; Steven D., Brown; Howard, E.A. Tinsley Handbook of Applied Multivariate Statistics and Mathematical Modeling [Elektronisk Resurs]; Academic Press, 2000. [Google Scholar]
- Heinze, G.; Wallisch, C.; Dunkler, D. Variable Selection – A Review and Recommendations for the Practicing Statistician. Biometrical Journal 2018, 60, 431–449. [Google Scholar] [CrossRef] [PubMed]
- Claeskens, G. Statistical Model Choice. Annual Review of Statistics and Its Application 2016, 3, 233–256. [Google Scholar] [CrossRef]
Figure 1.
Privately owned passenger cars in use by owner's gender, the entire fleet and EVs, 2016 and 2020.
Figure 1.
Privately owned passenger cars in use by owner's gender, the entire fleet and EVs, 2016 and 2020.
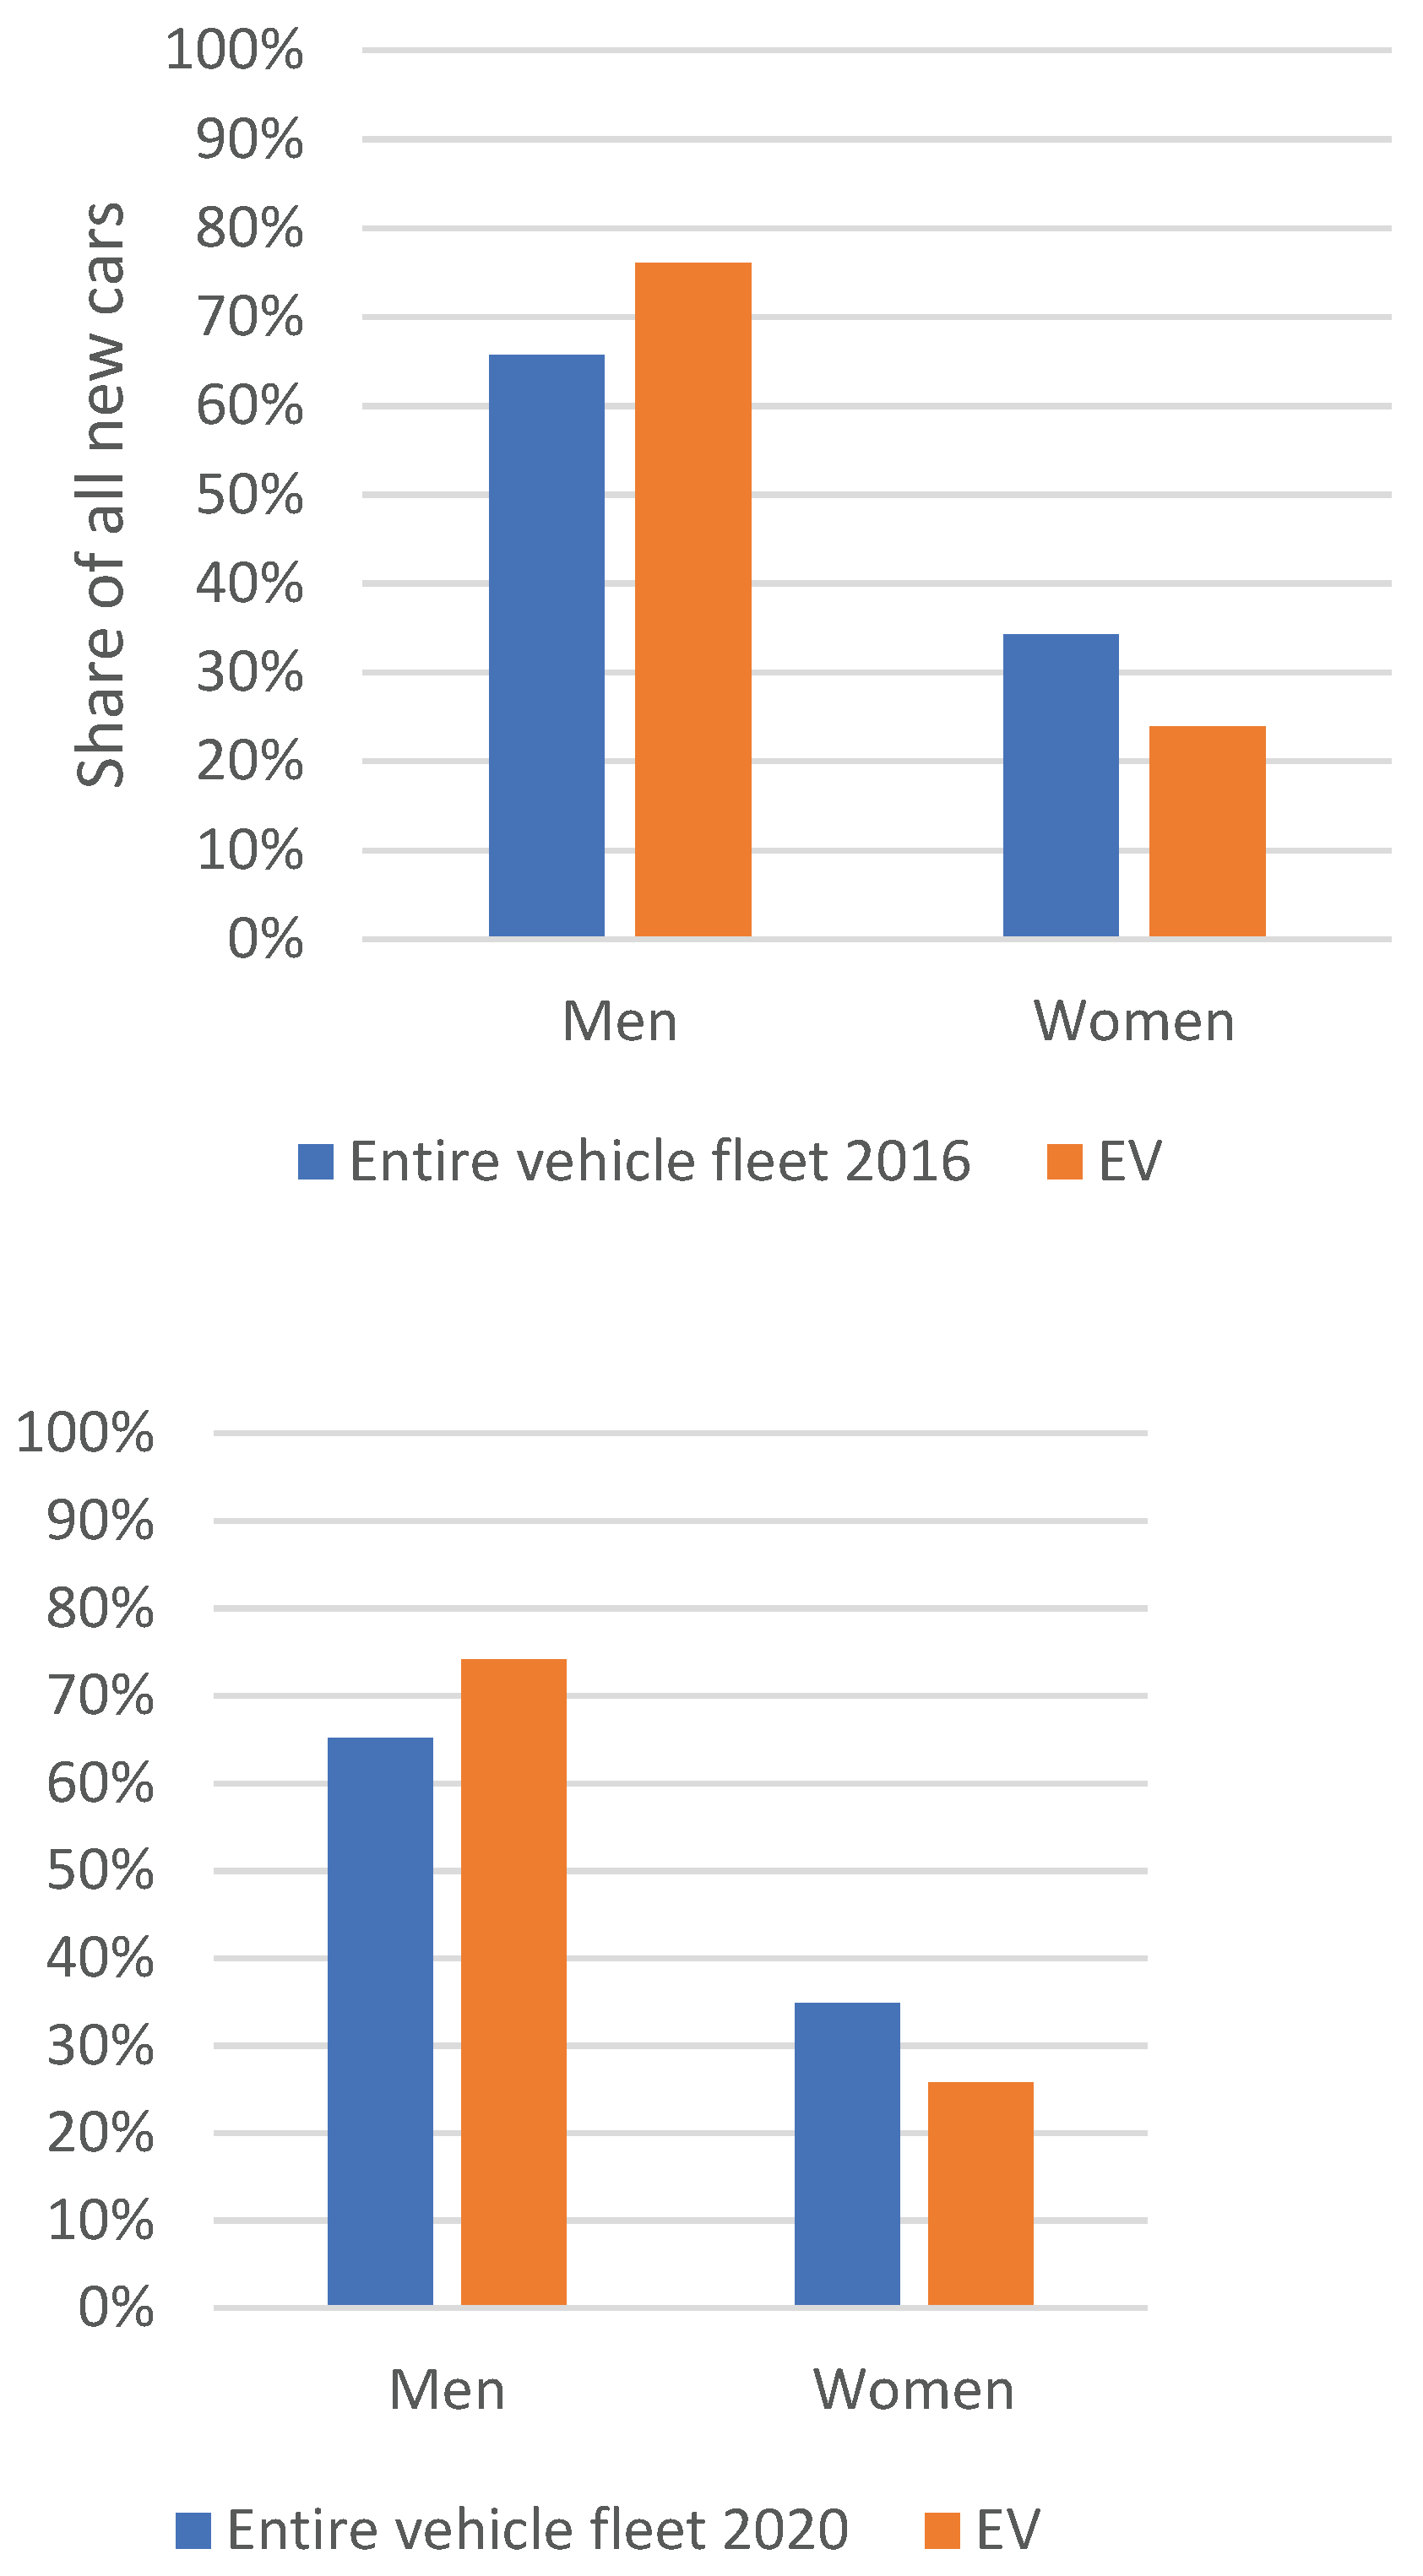
Figure 2.
Share of newly registered cars broken down by purchaser's age, ICE, PHEV and BEV, 2016.
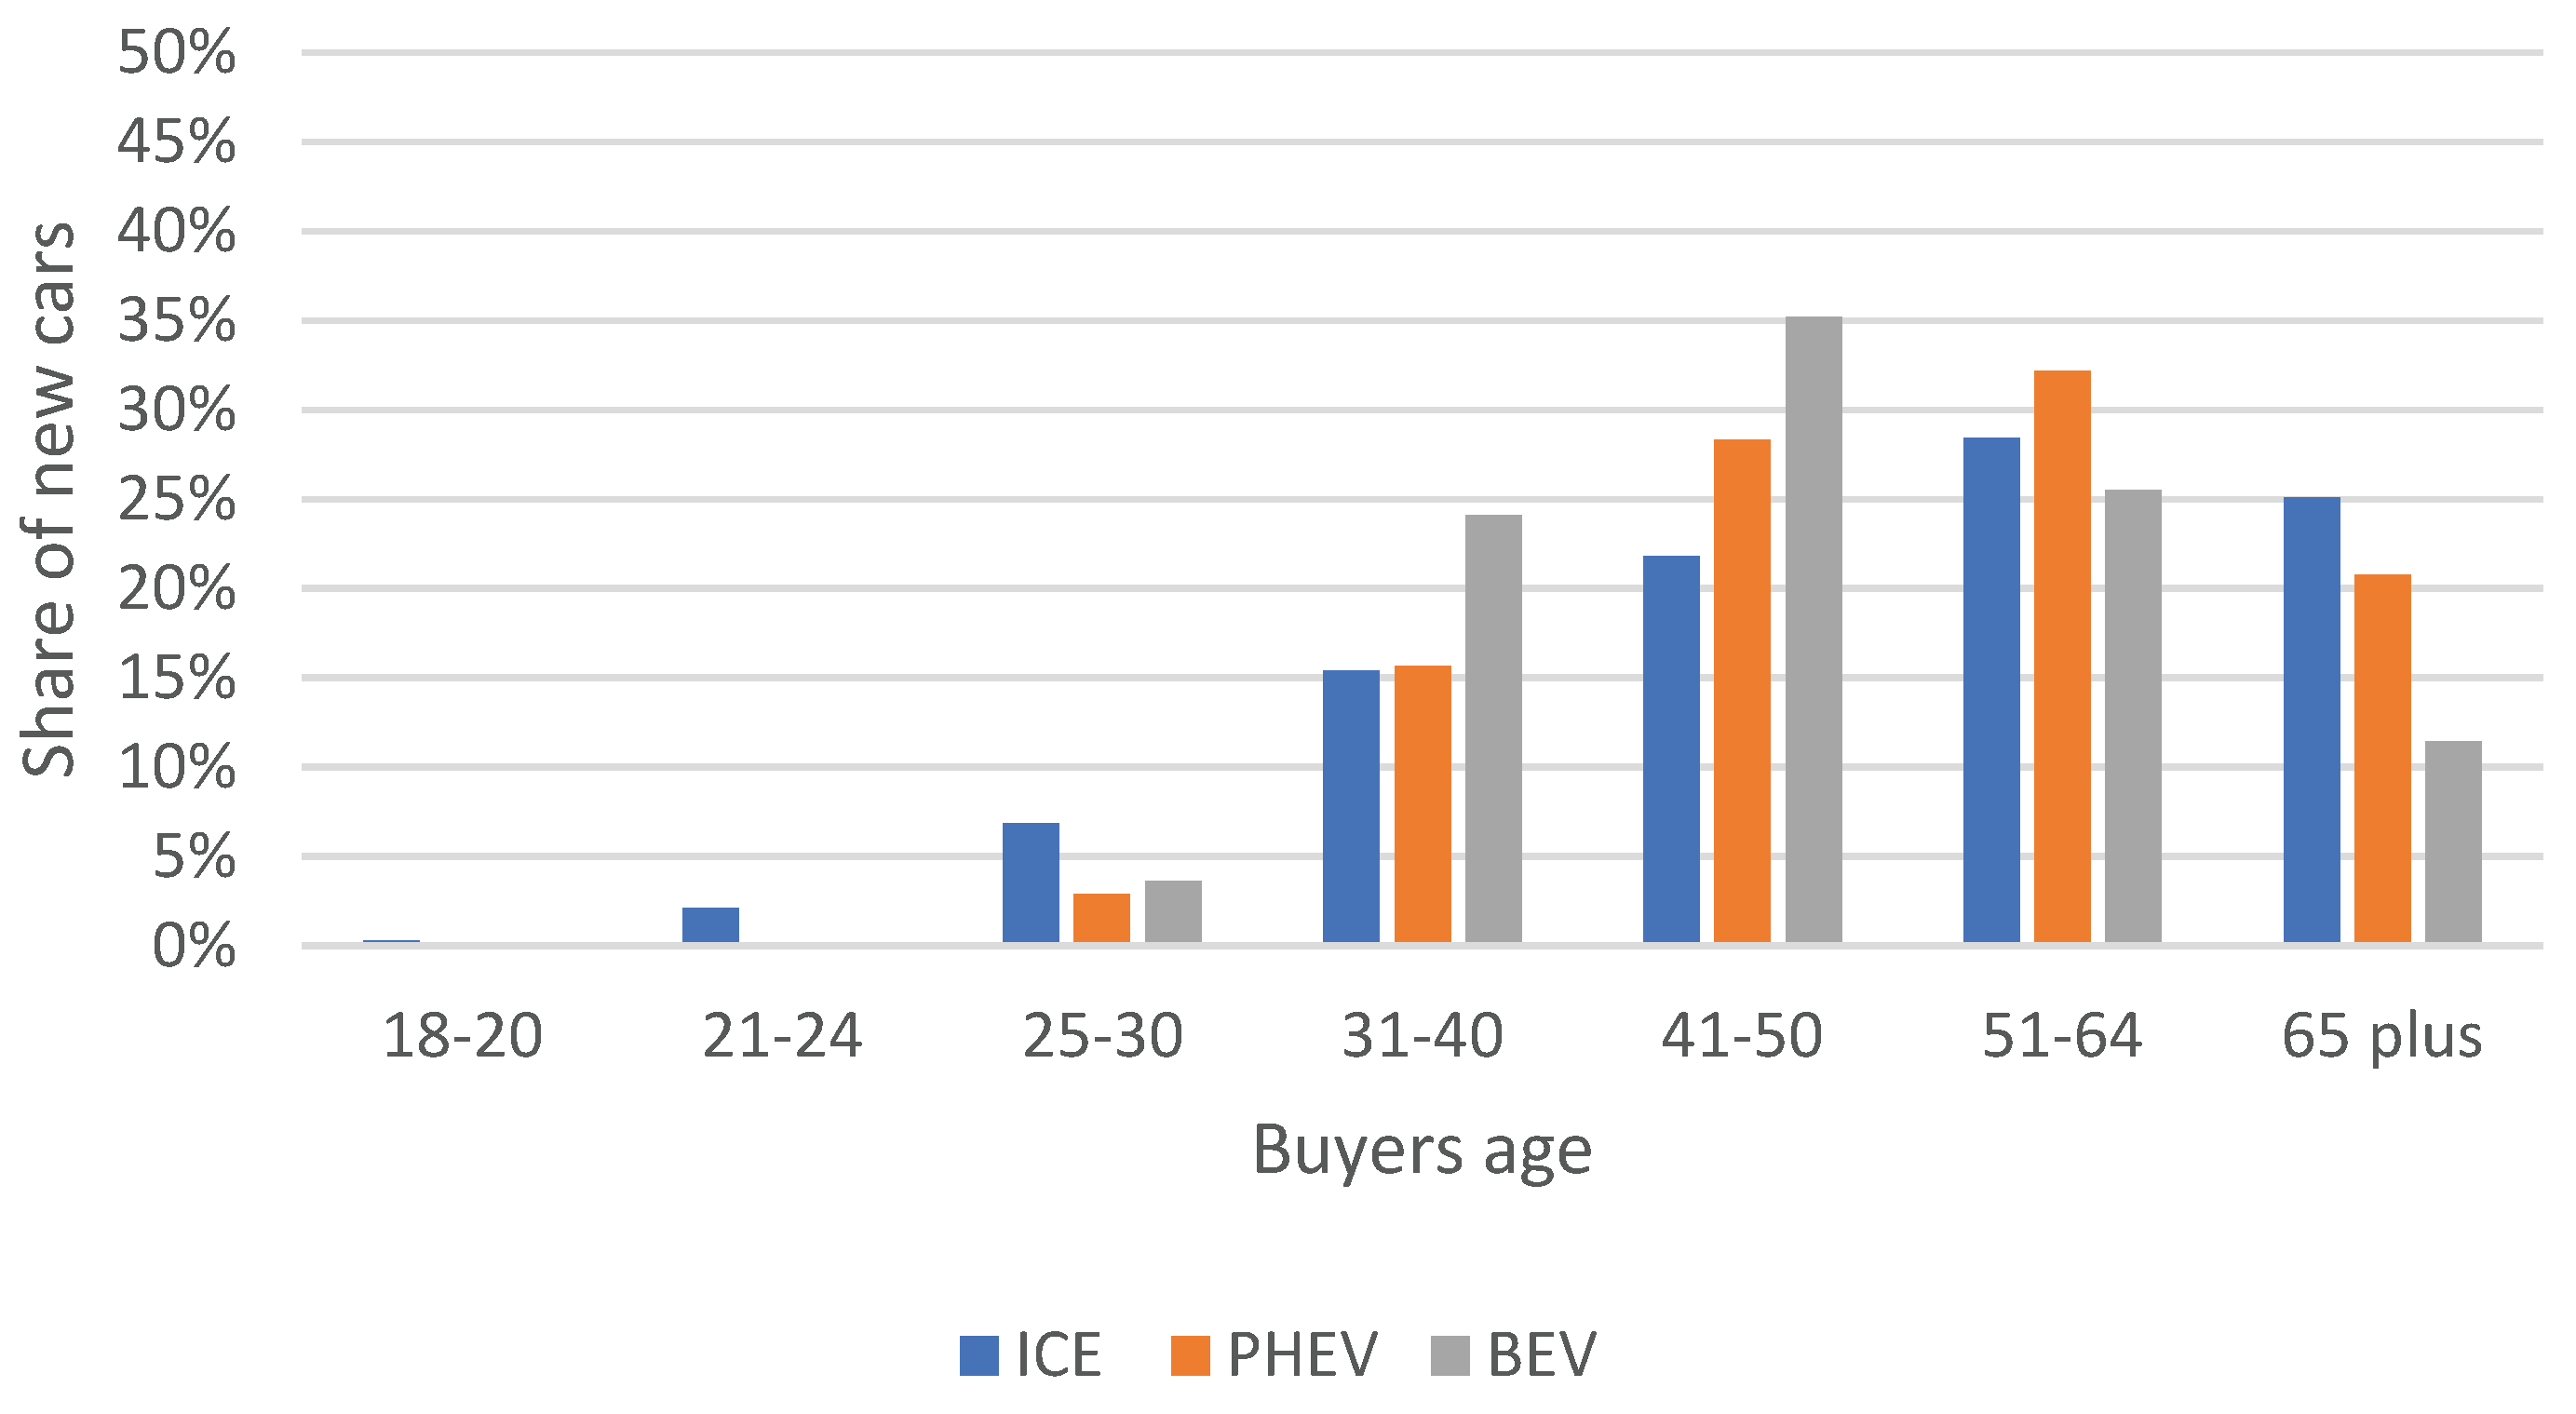
Figure 3.
Share of newly registered cars broken down by purchaser's age, ICE, PHEV and BEV, 2020.
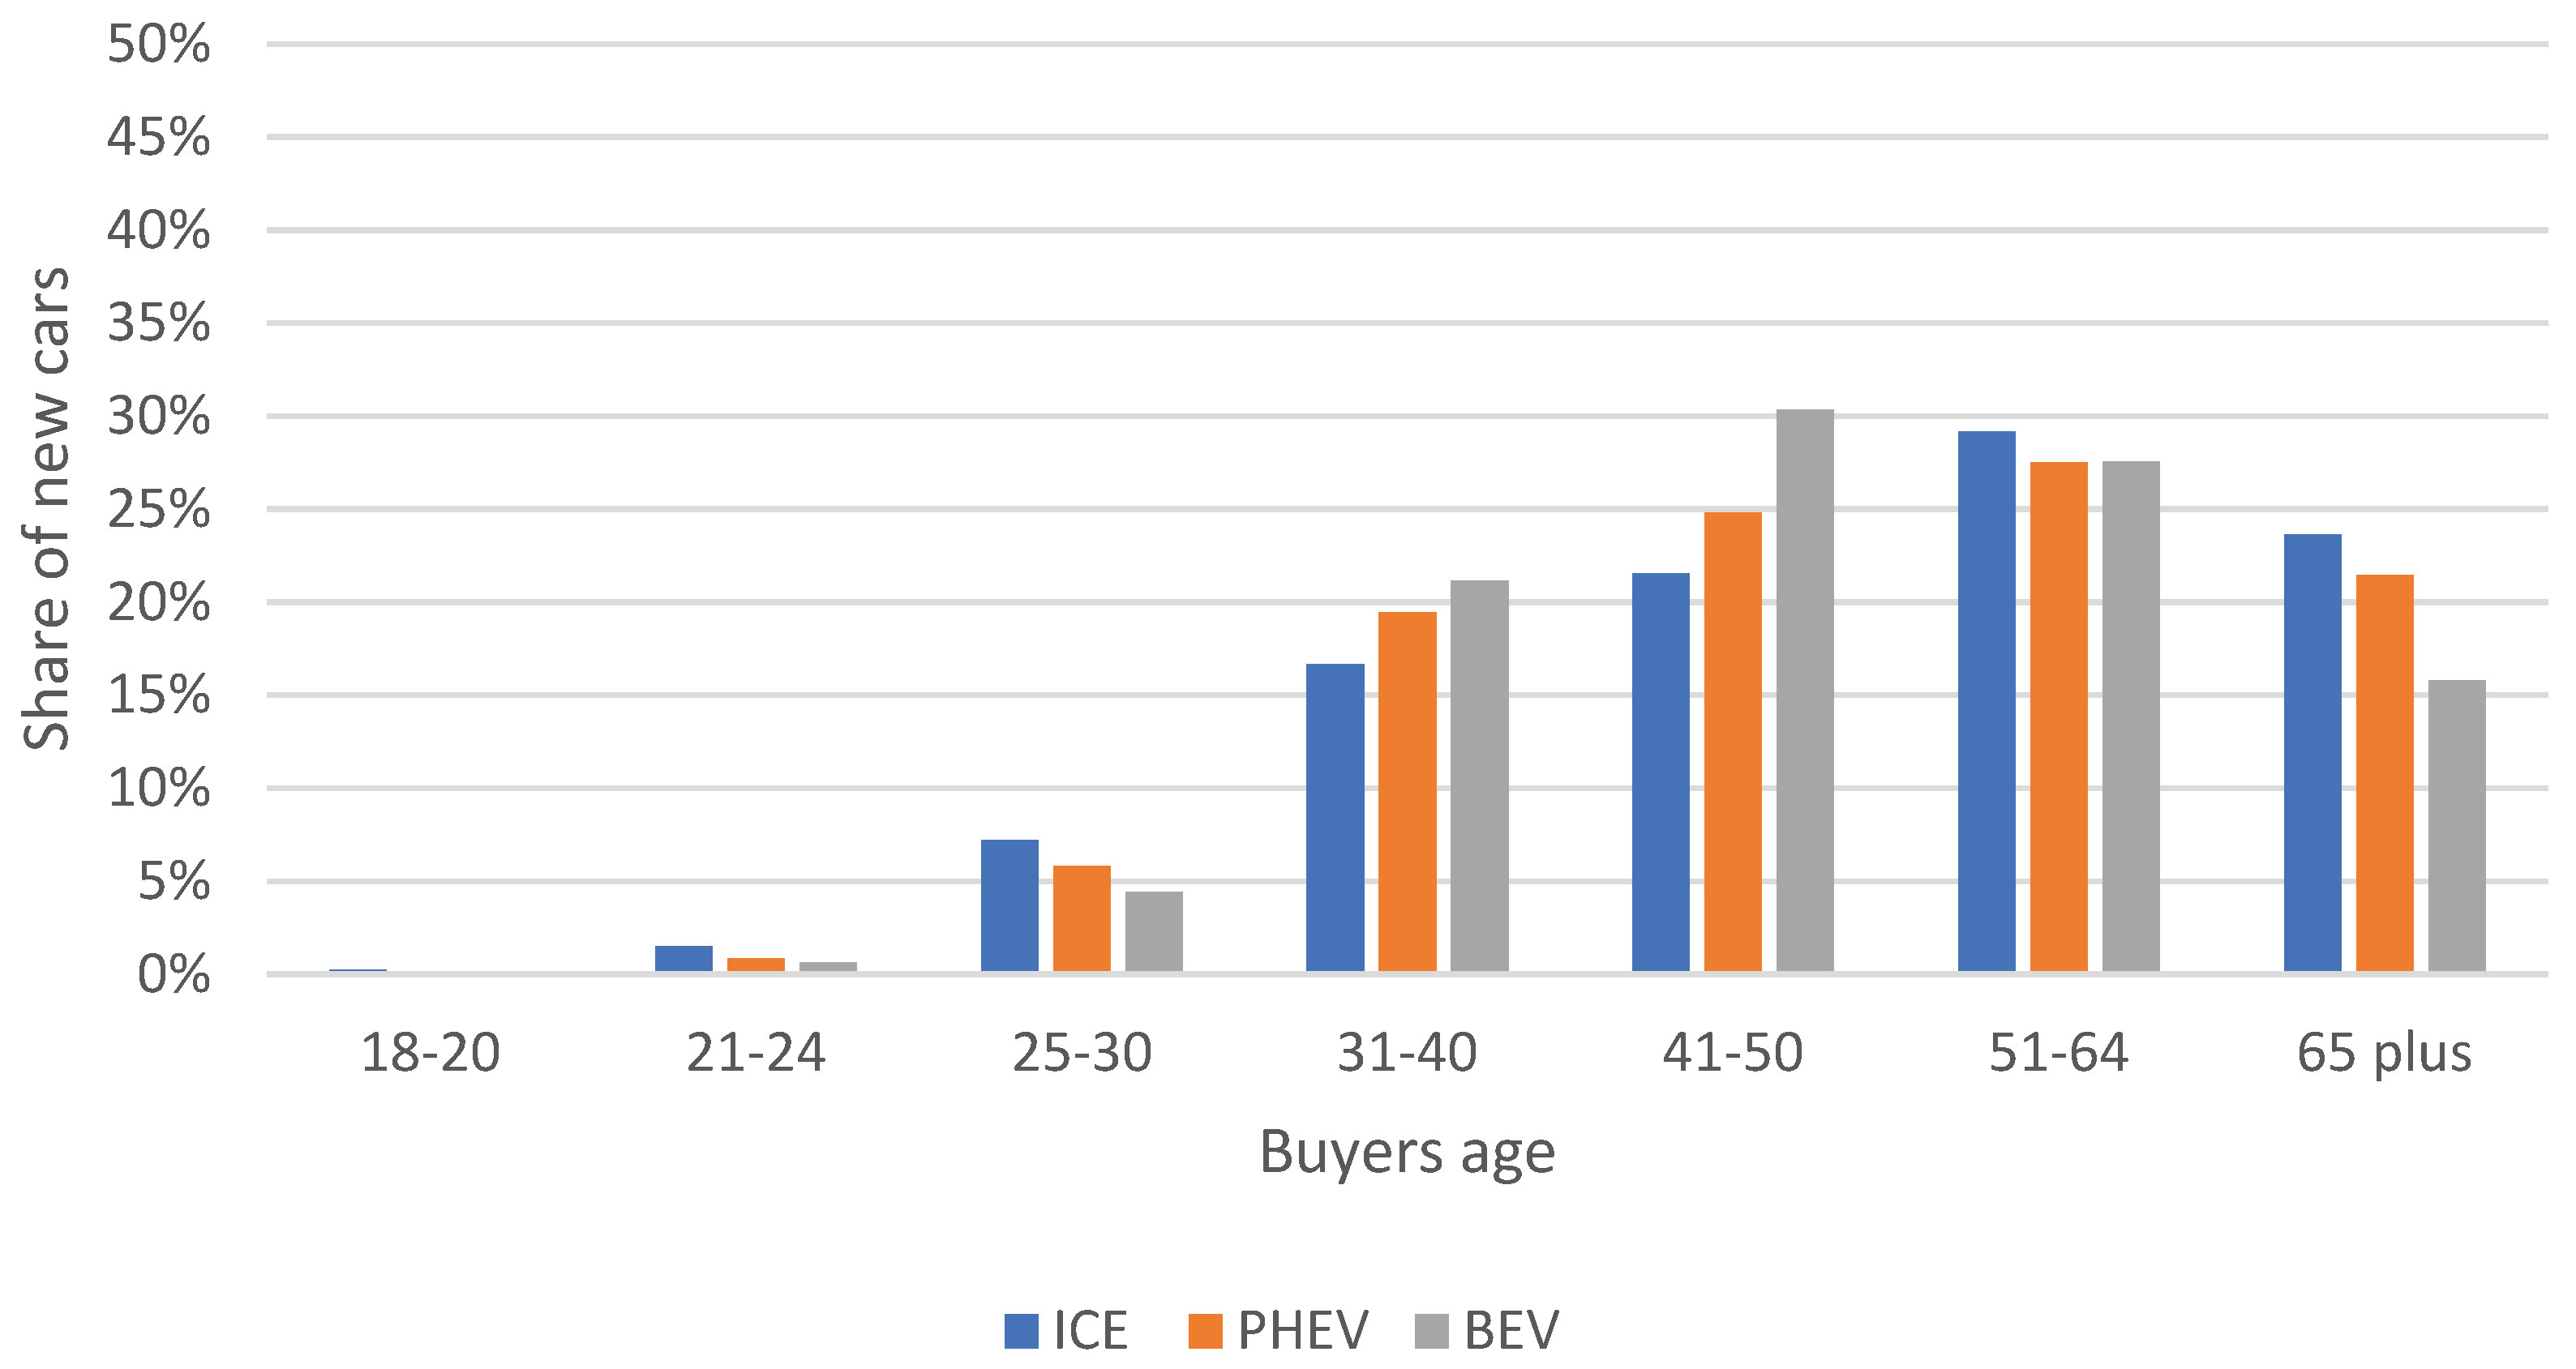
Figure 4.
Breakdown of newly registered ICE, PHEV, and ICE, 2016.4.
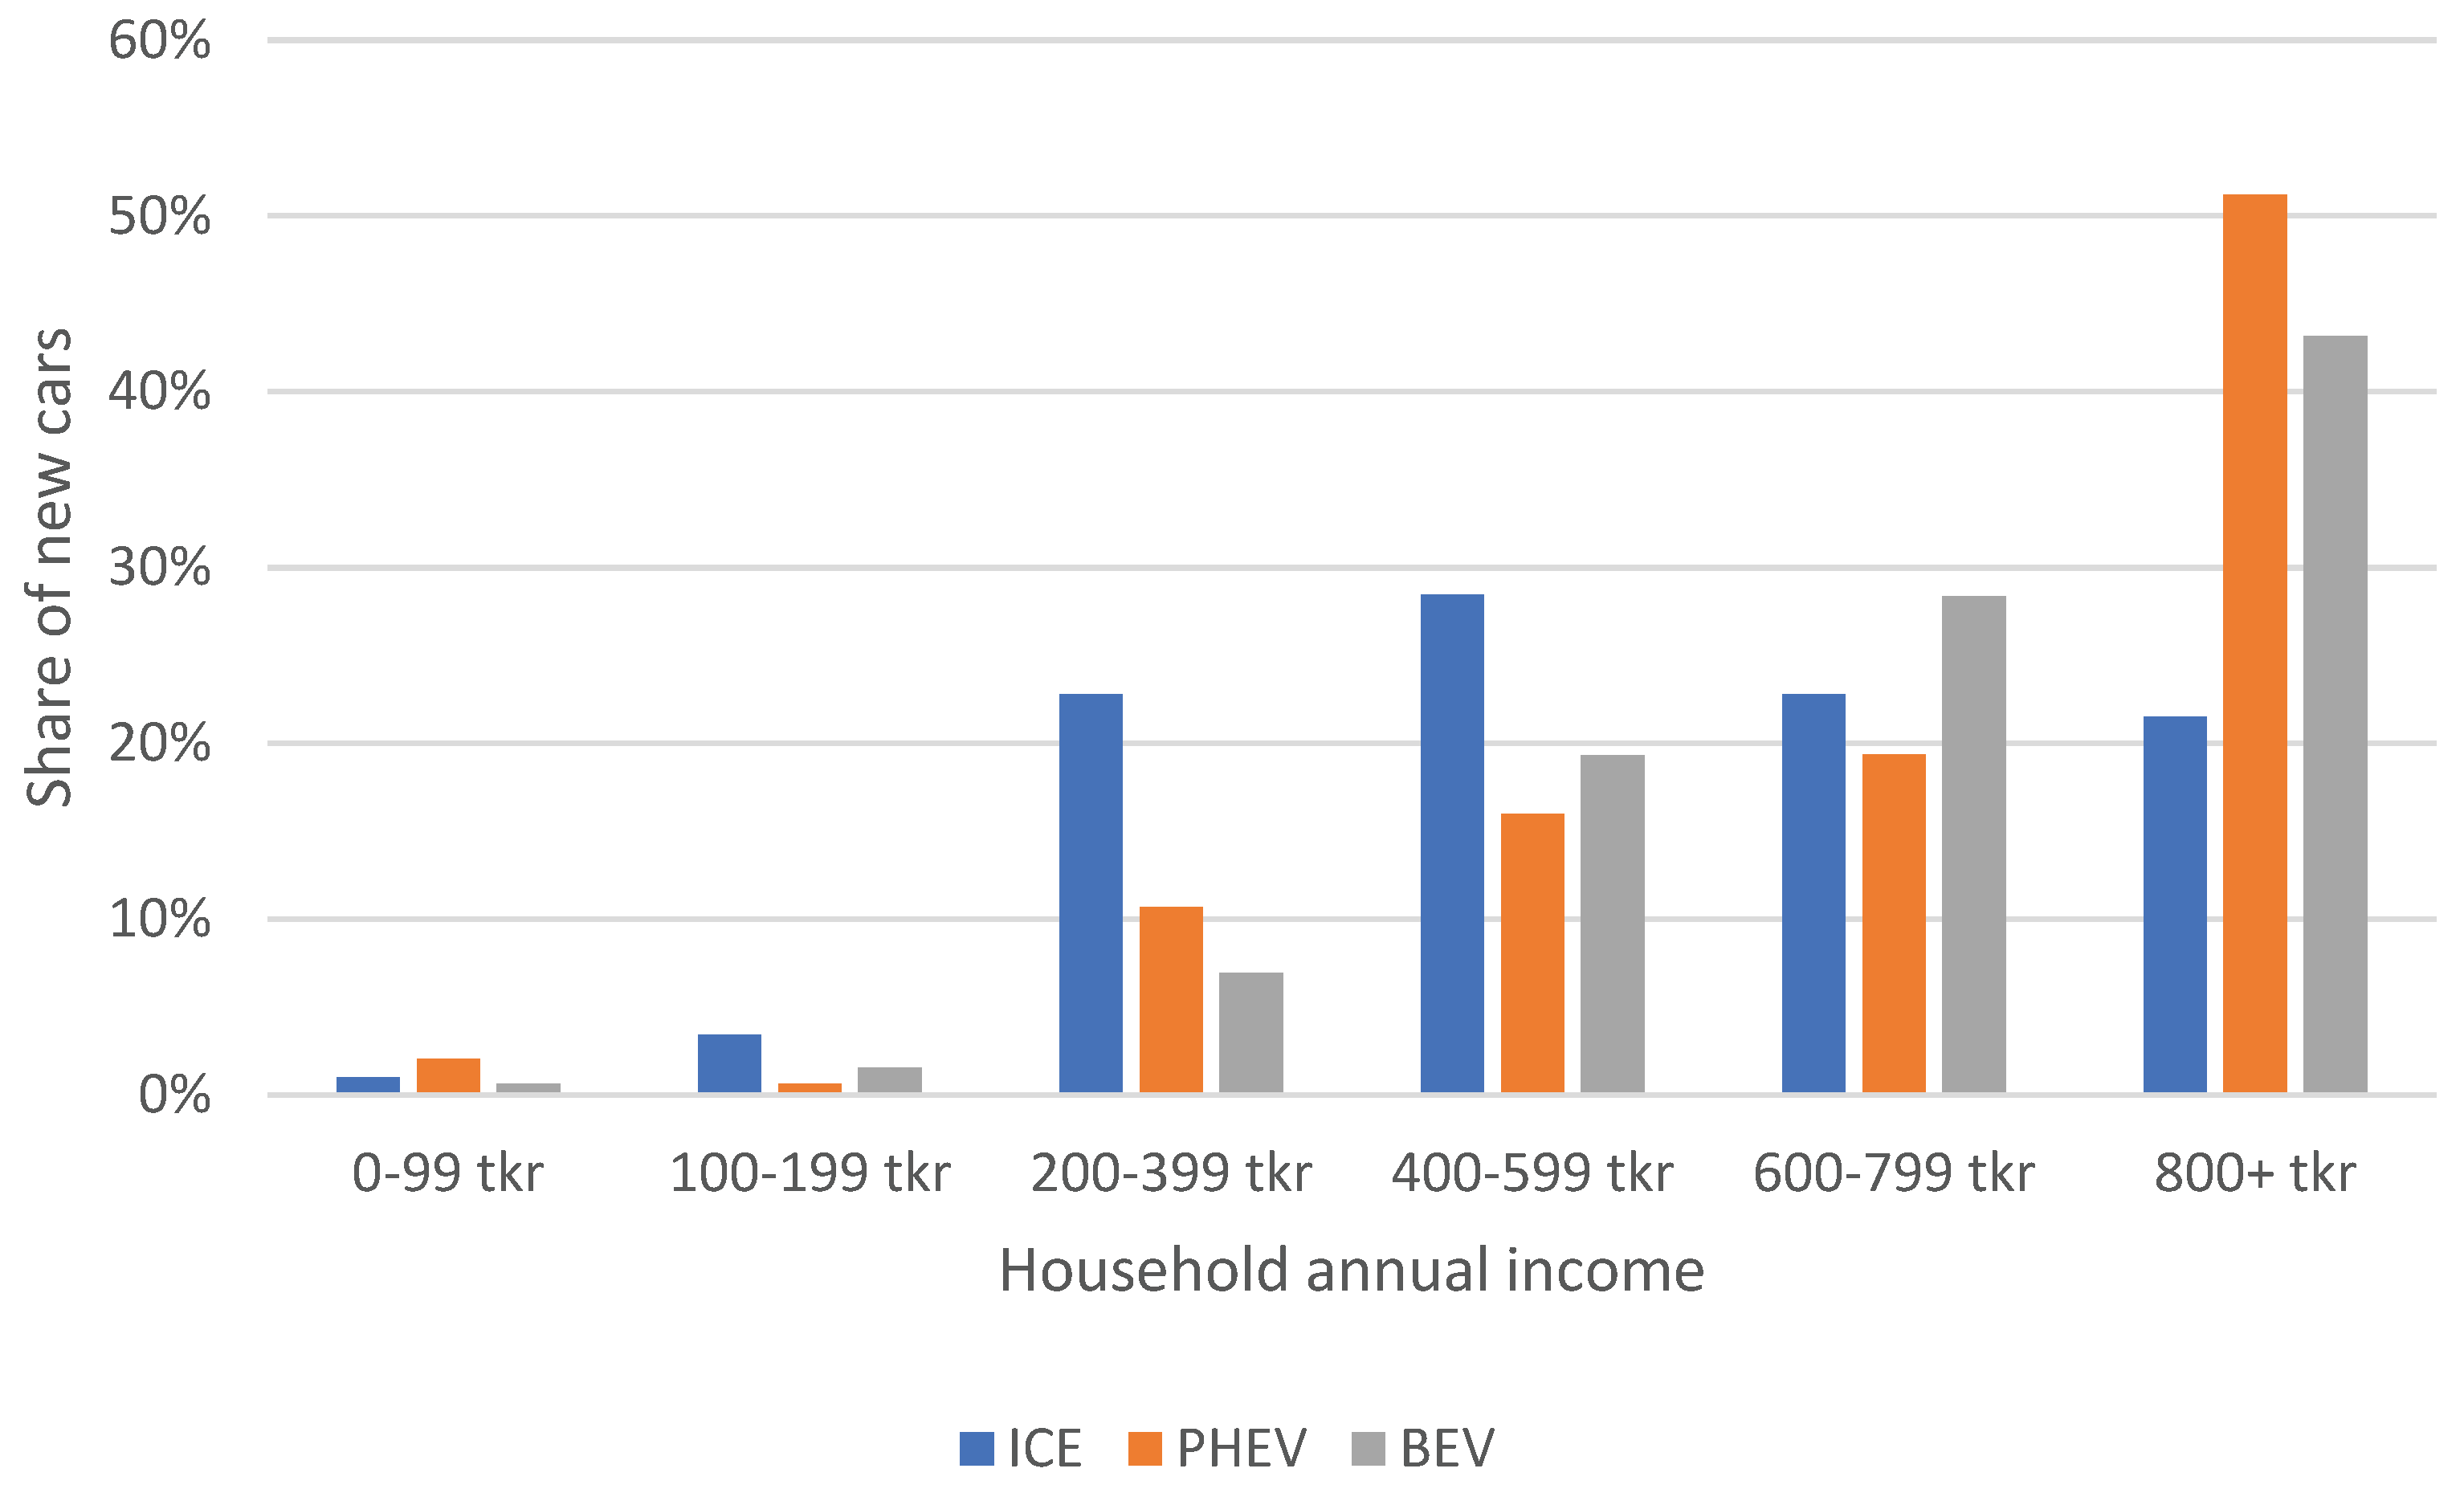
Figure 5.
Breakdown of newly registered ICE, PHEV and BEV, 2020.
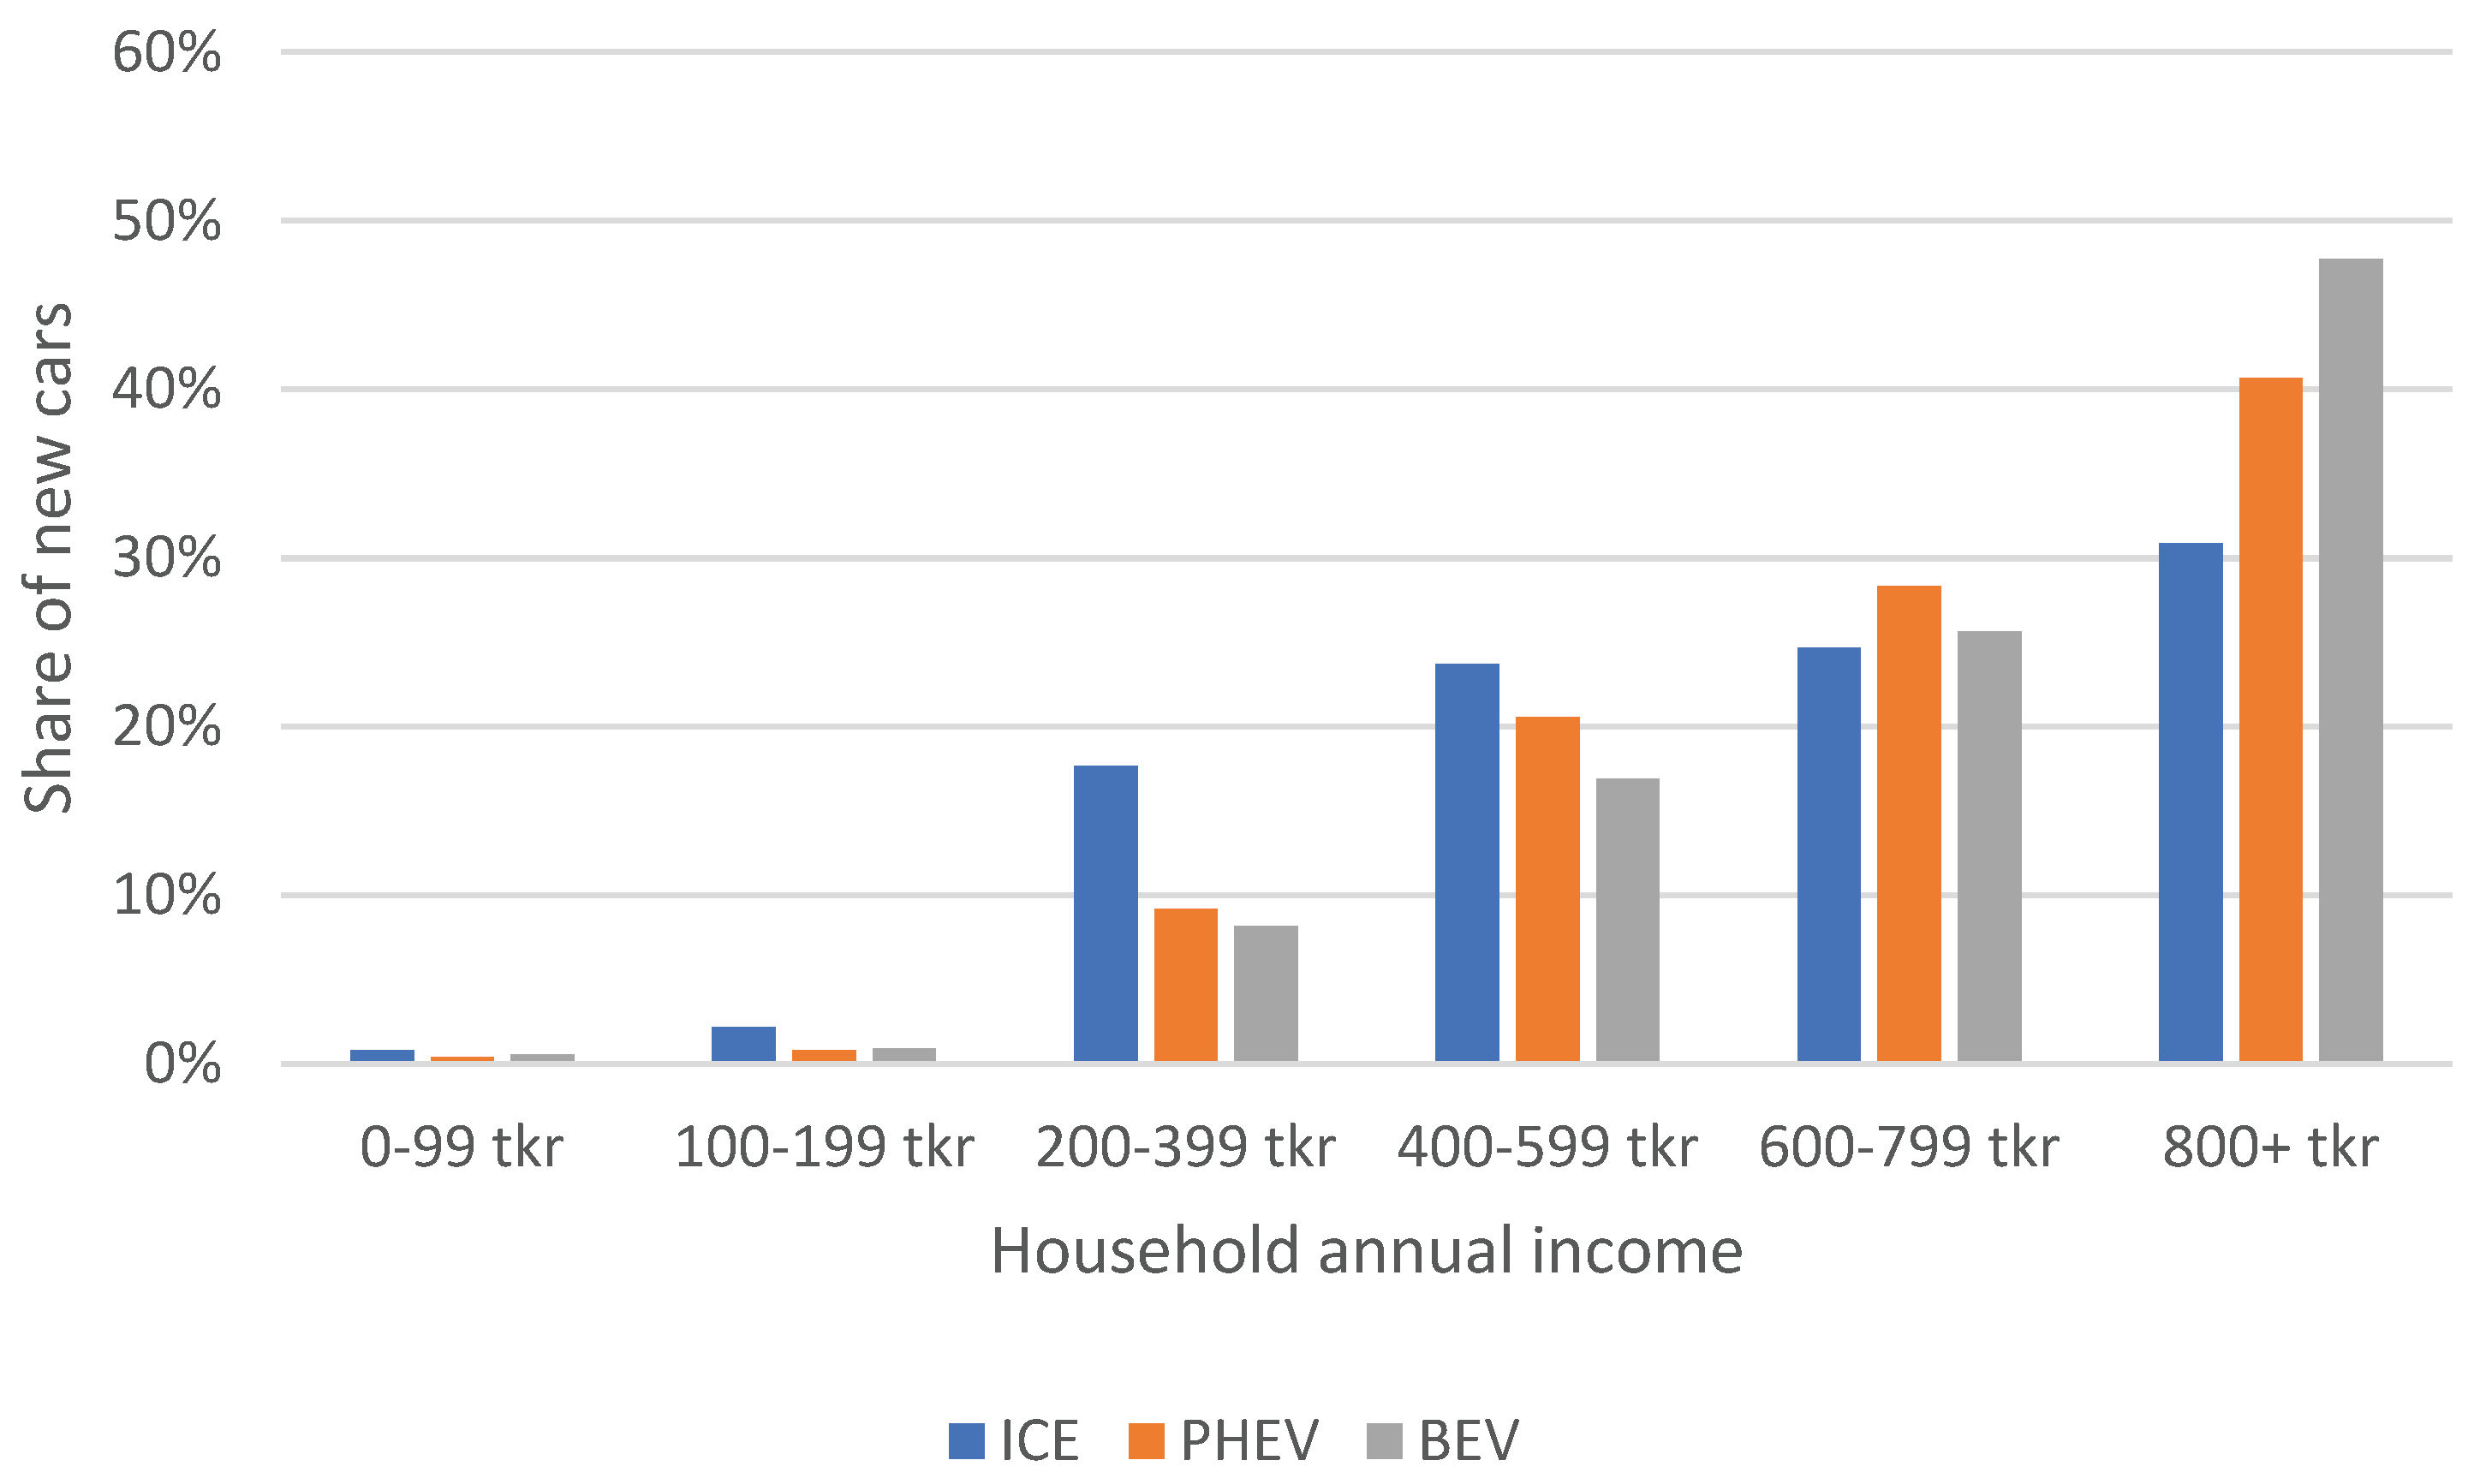
Figure 6.
Breakdown of Swedish households by housing type and shares of newly registered cars and cars in use, 2020.
Figure 6.
Breakdown of Swedish households by housing type and shares of newly registered cars and cars in use, 2020.
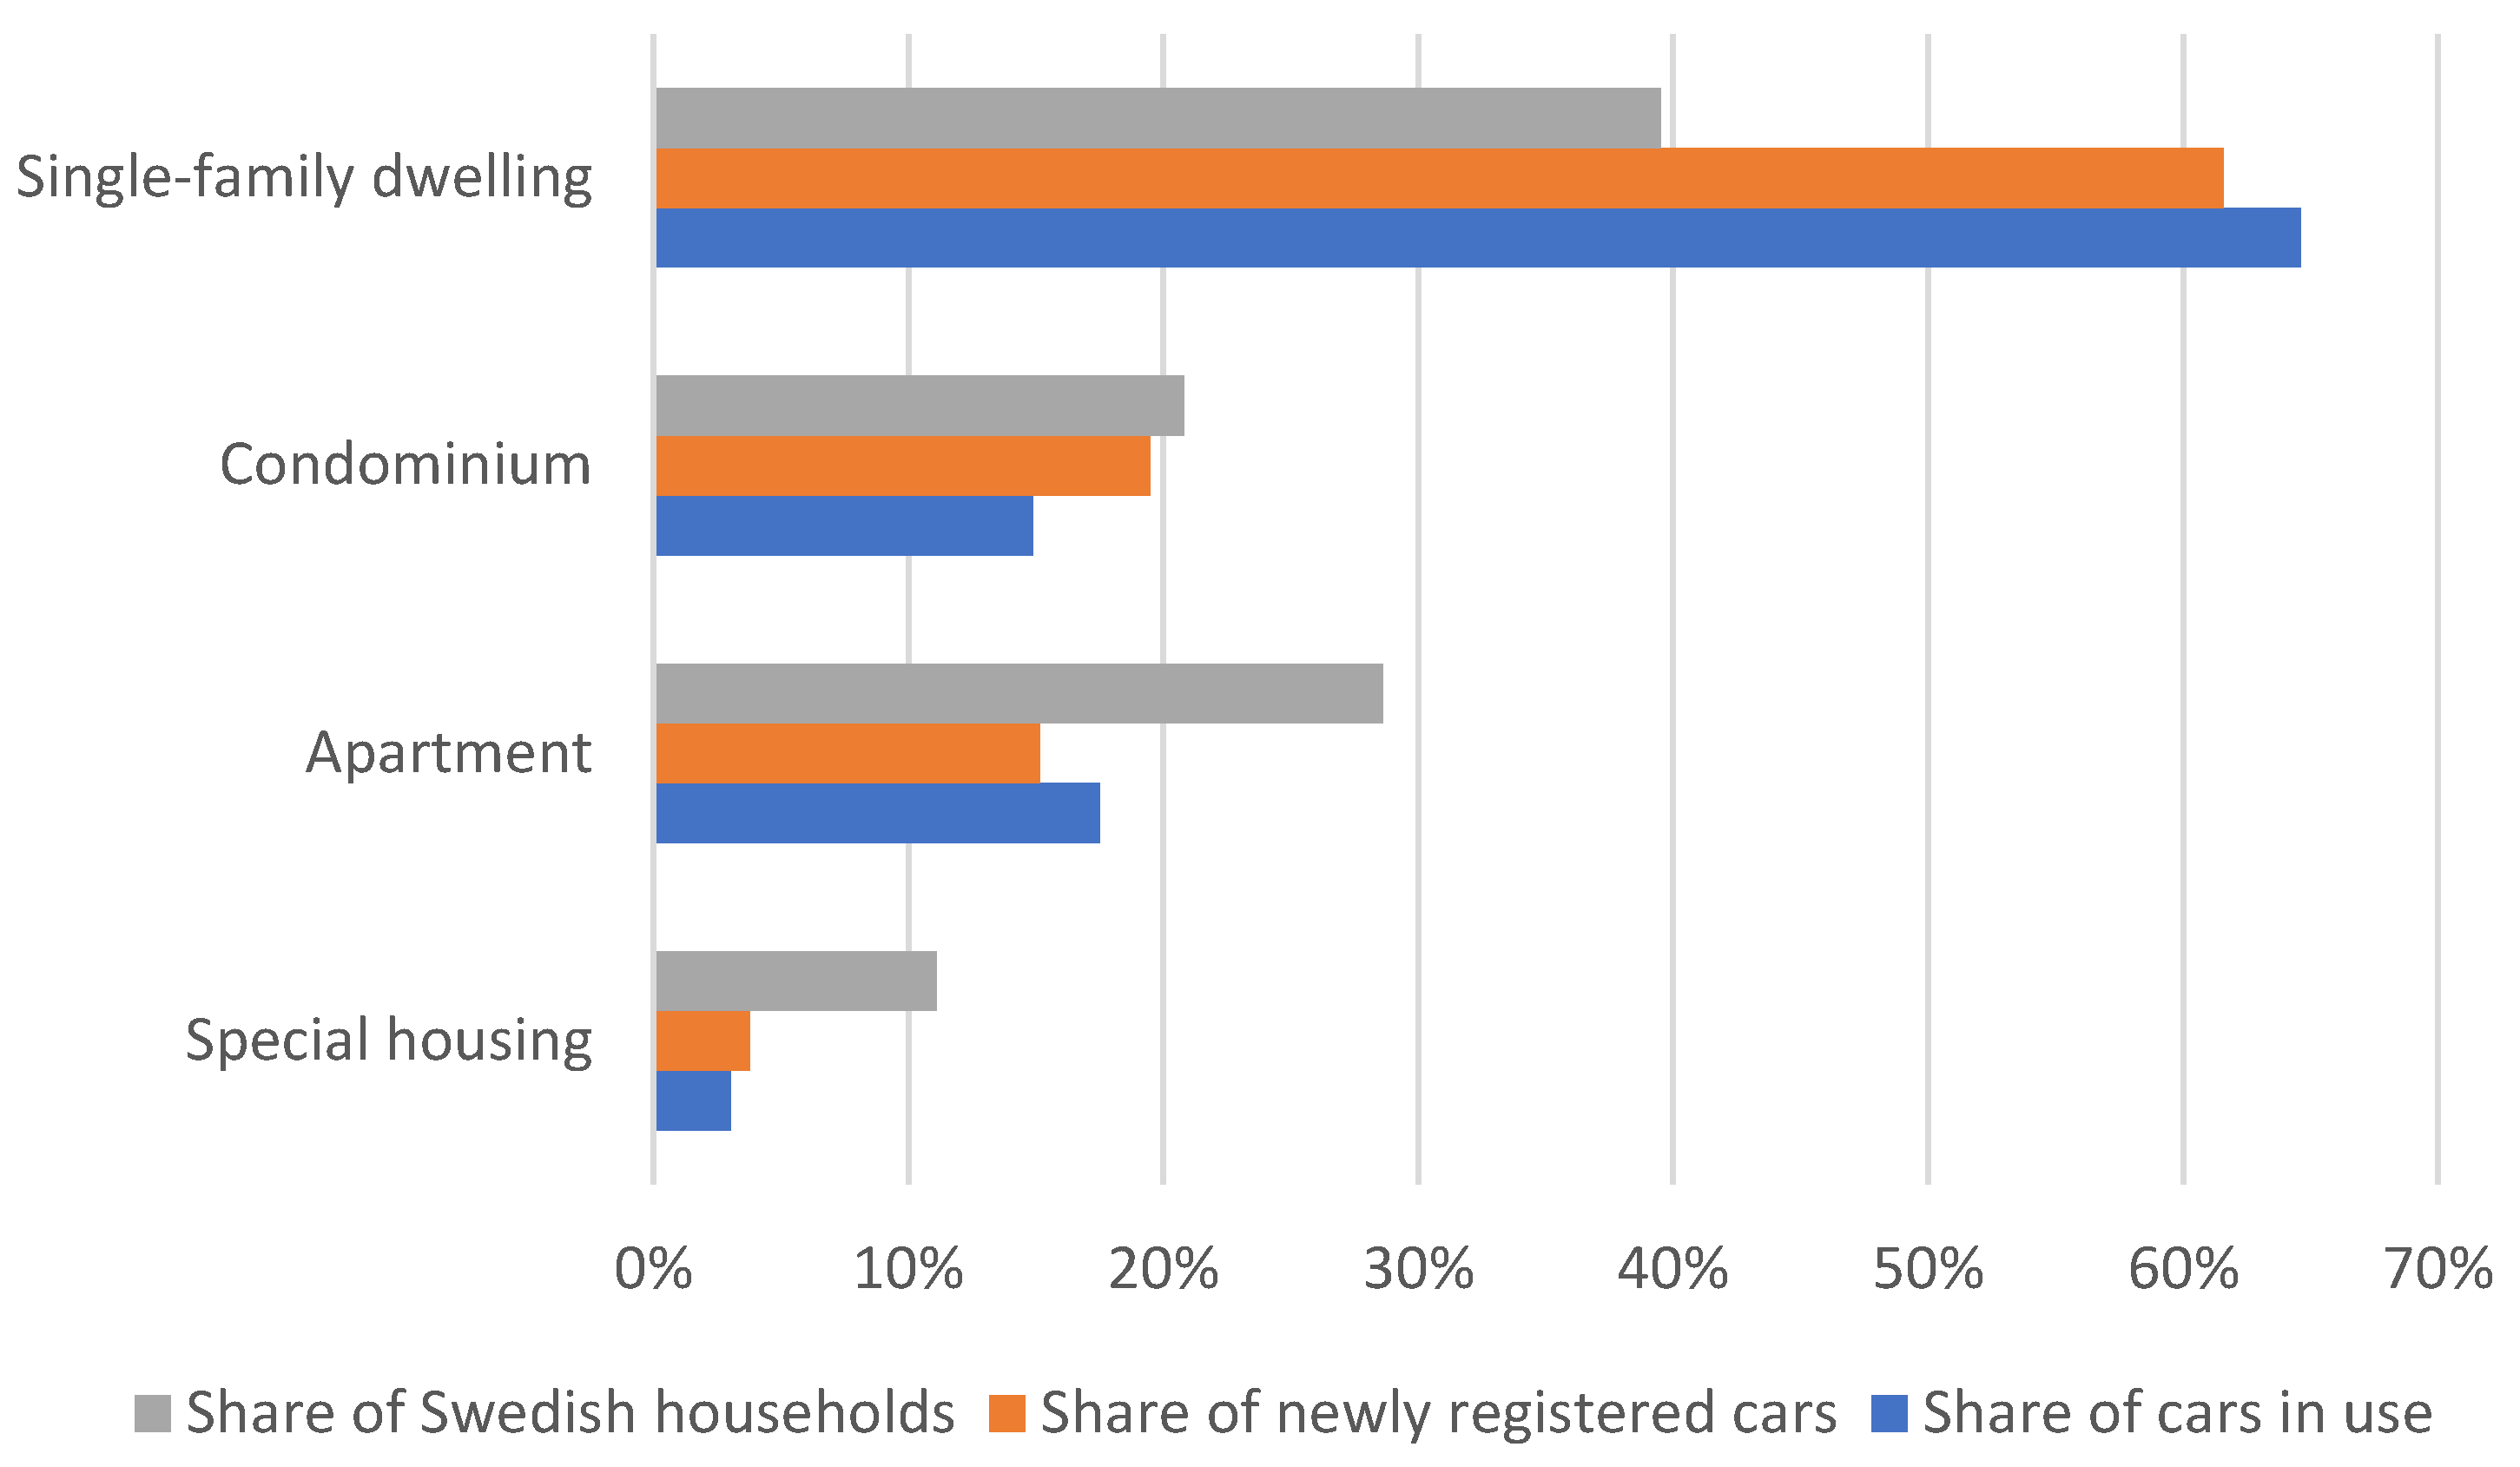
Figure 7.
Share of newly registered ICE, PHEVs and BEVs broken down by housing type, 2016.
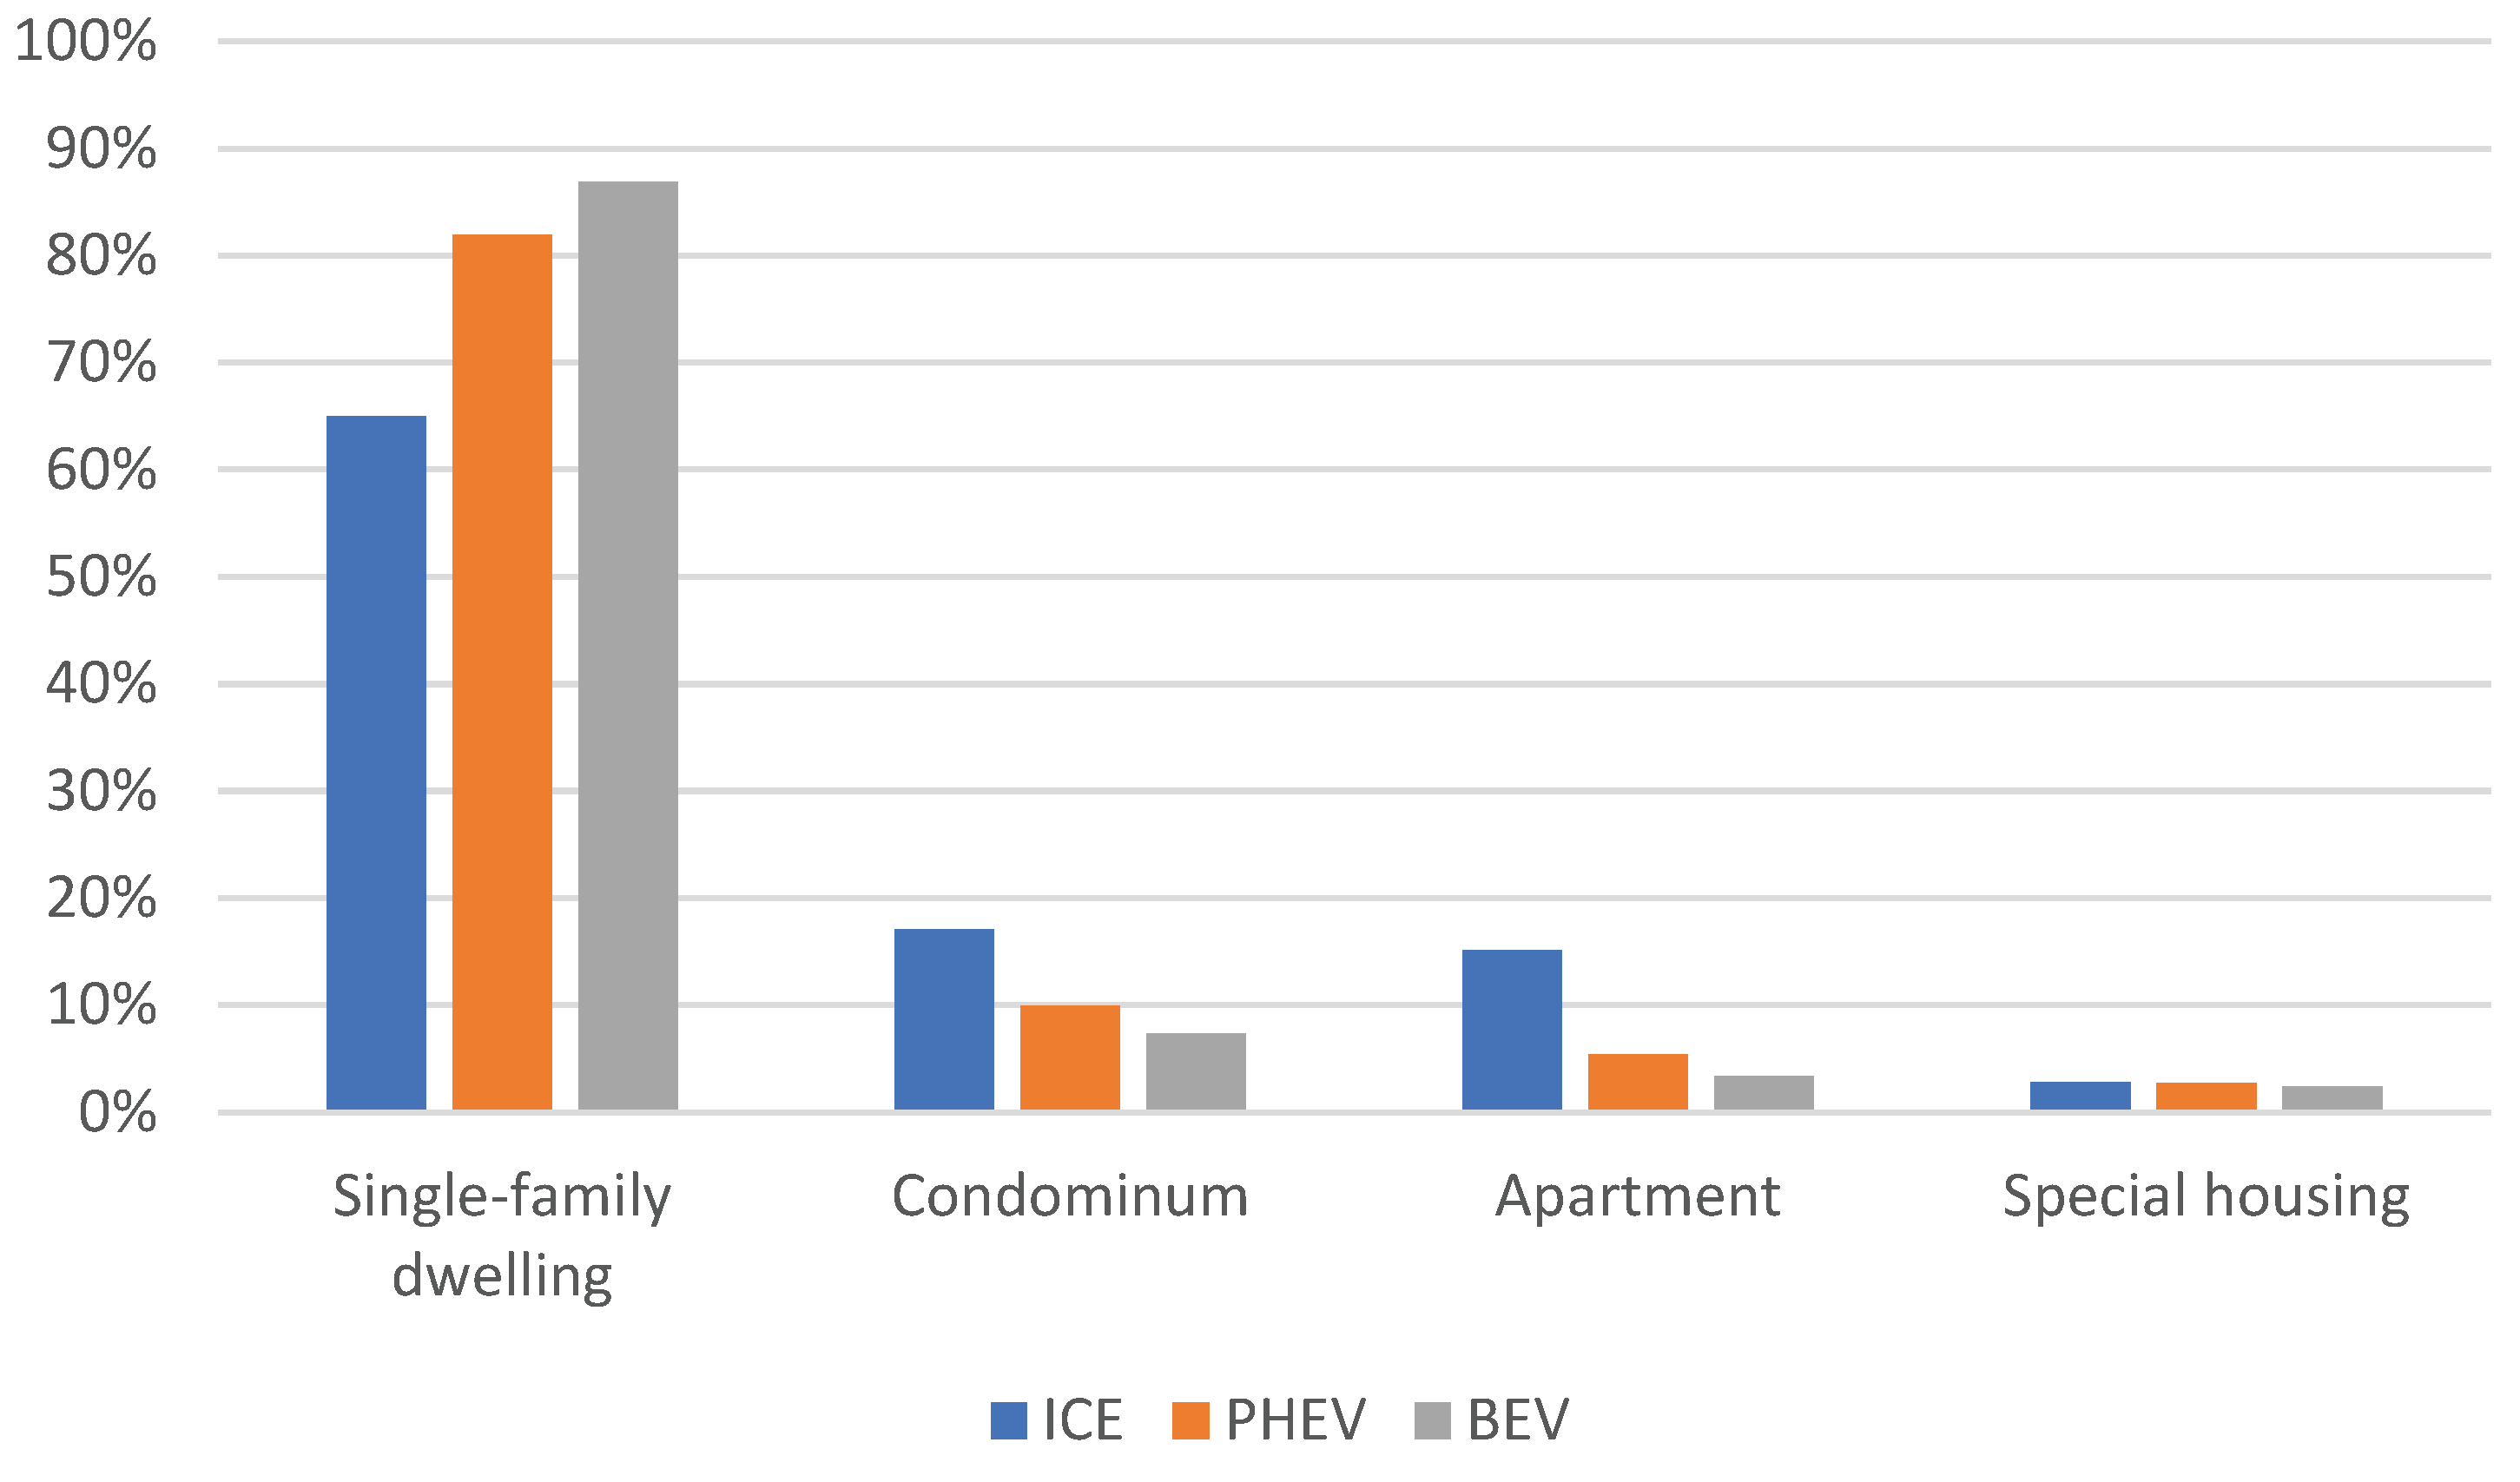
Figure 8.
Share of newly registered ICE, PHEVs and BEVs broken down by housing type, 2020.
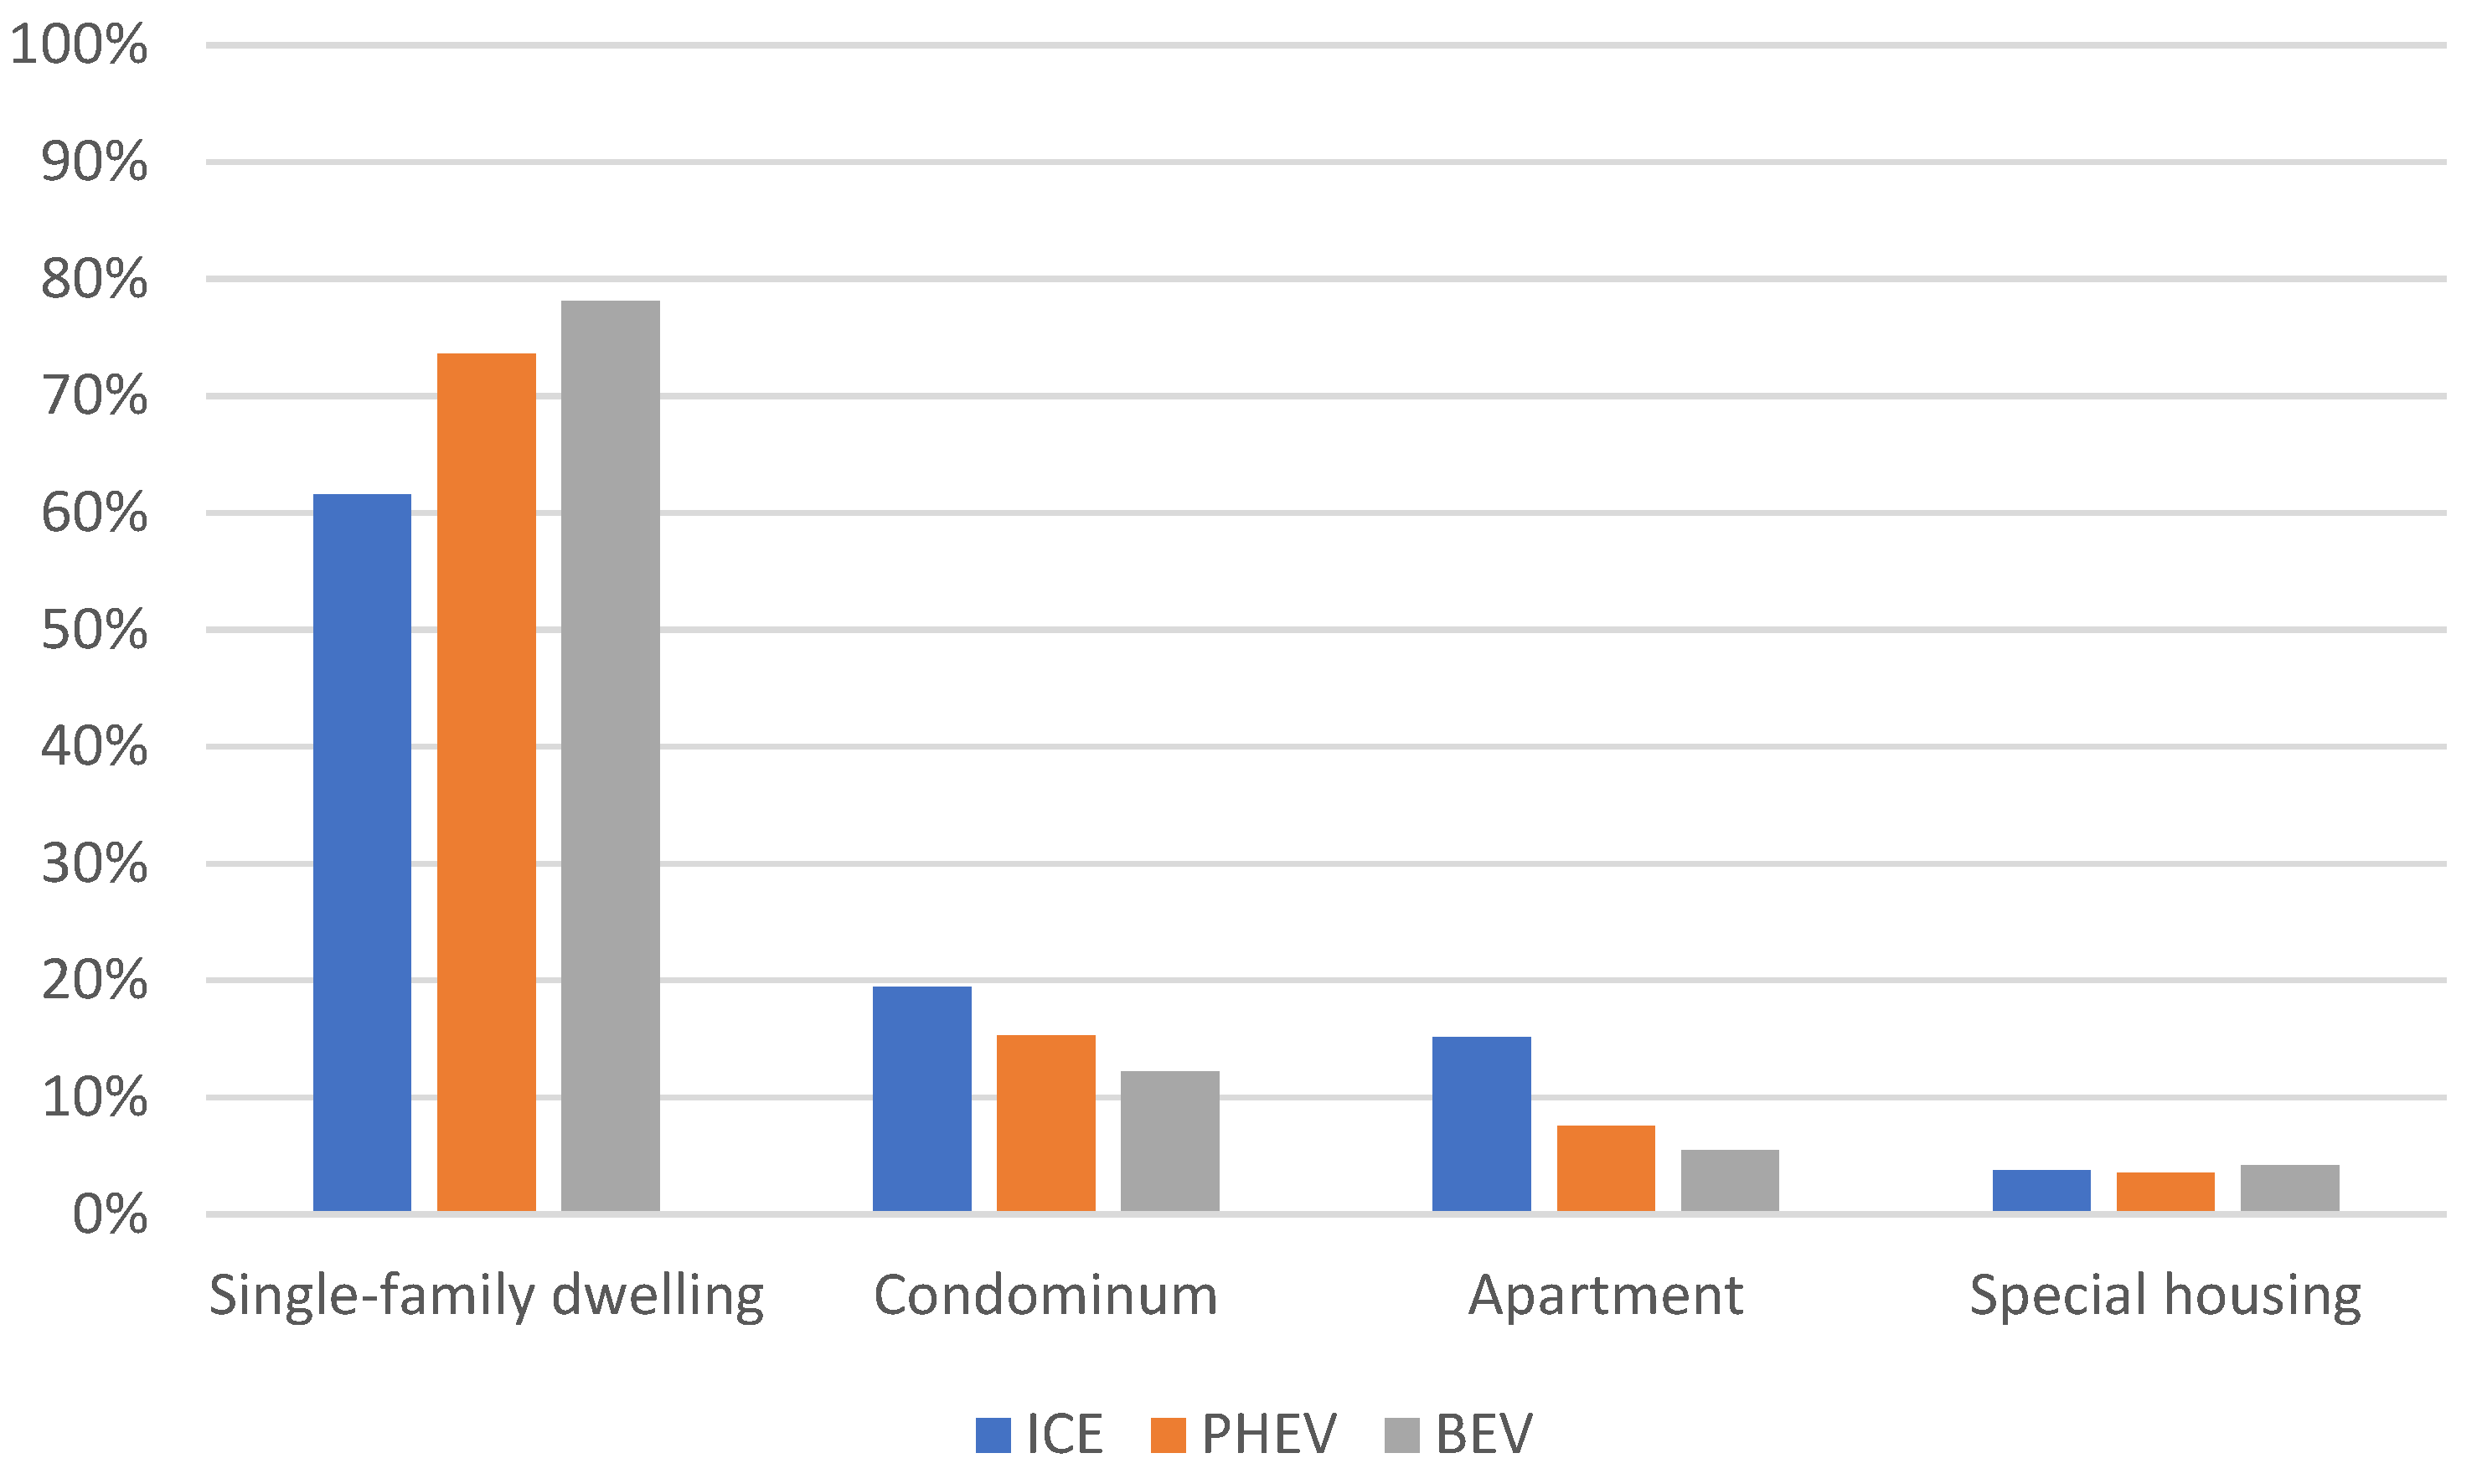
Figure 9.
Shares of the total number of newly registered cars, broken down by EV and ICE and household type, 2016 and 2020.
Figure 9.
Shares of the total number of newly registered cars, broken down by EV and ICE and household type, 2016 and 2020.
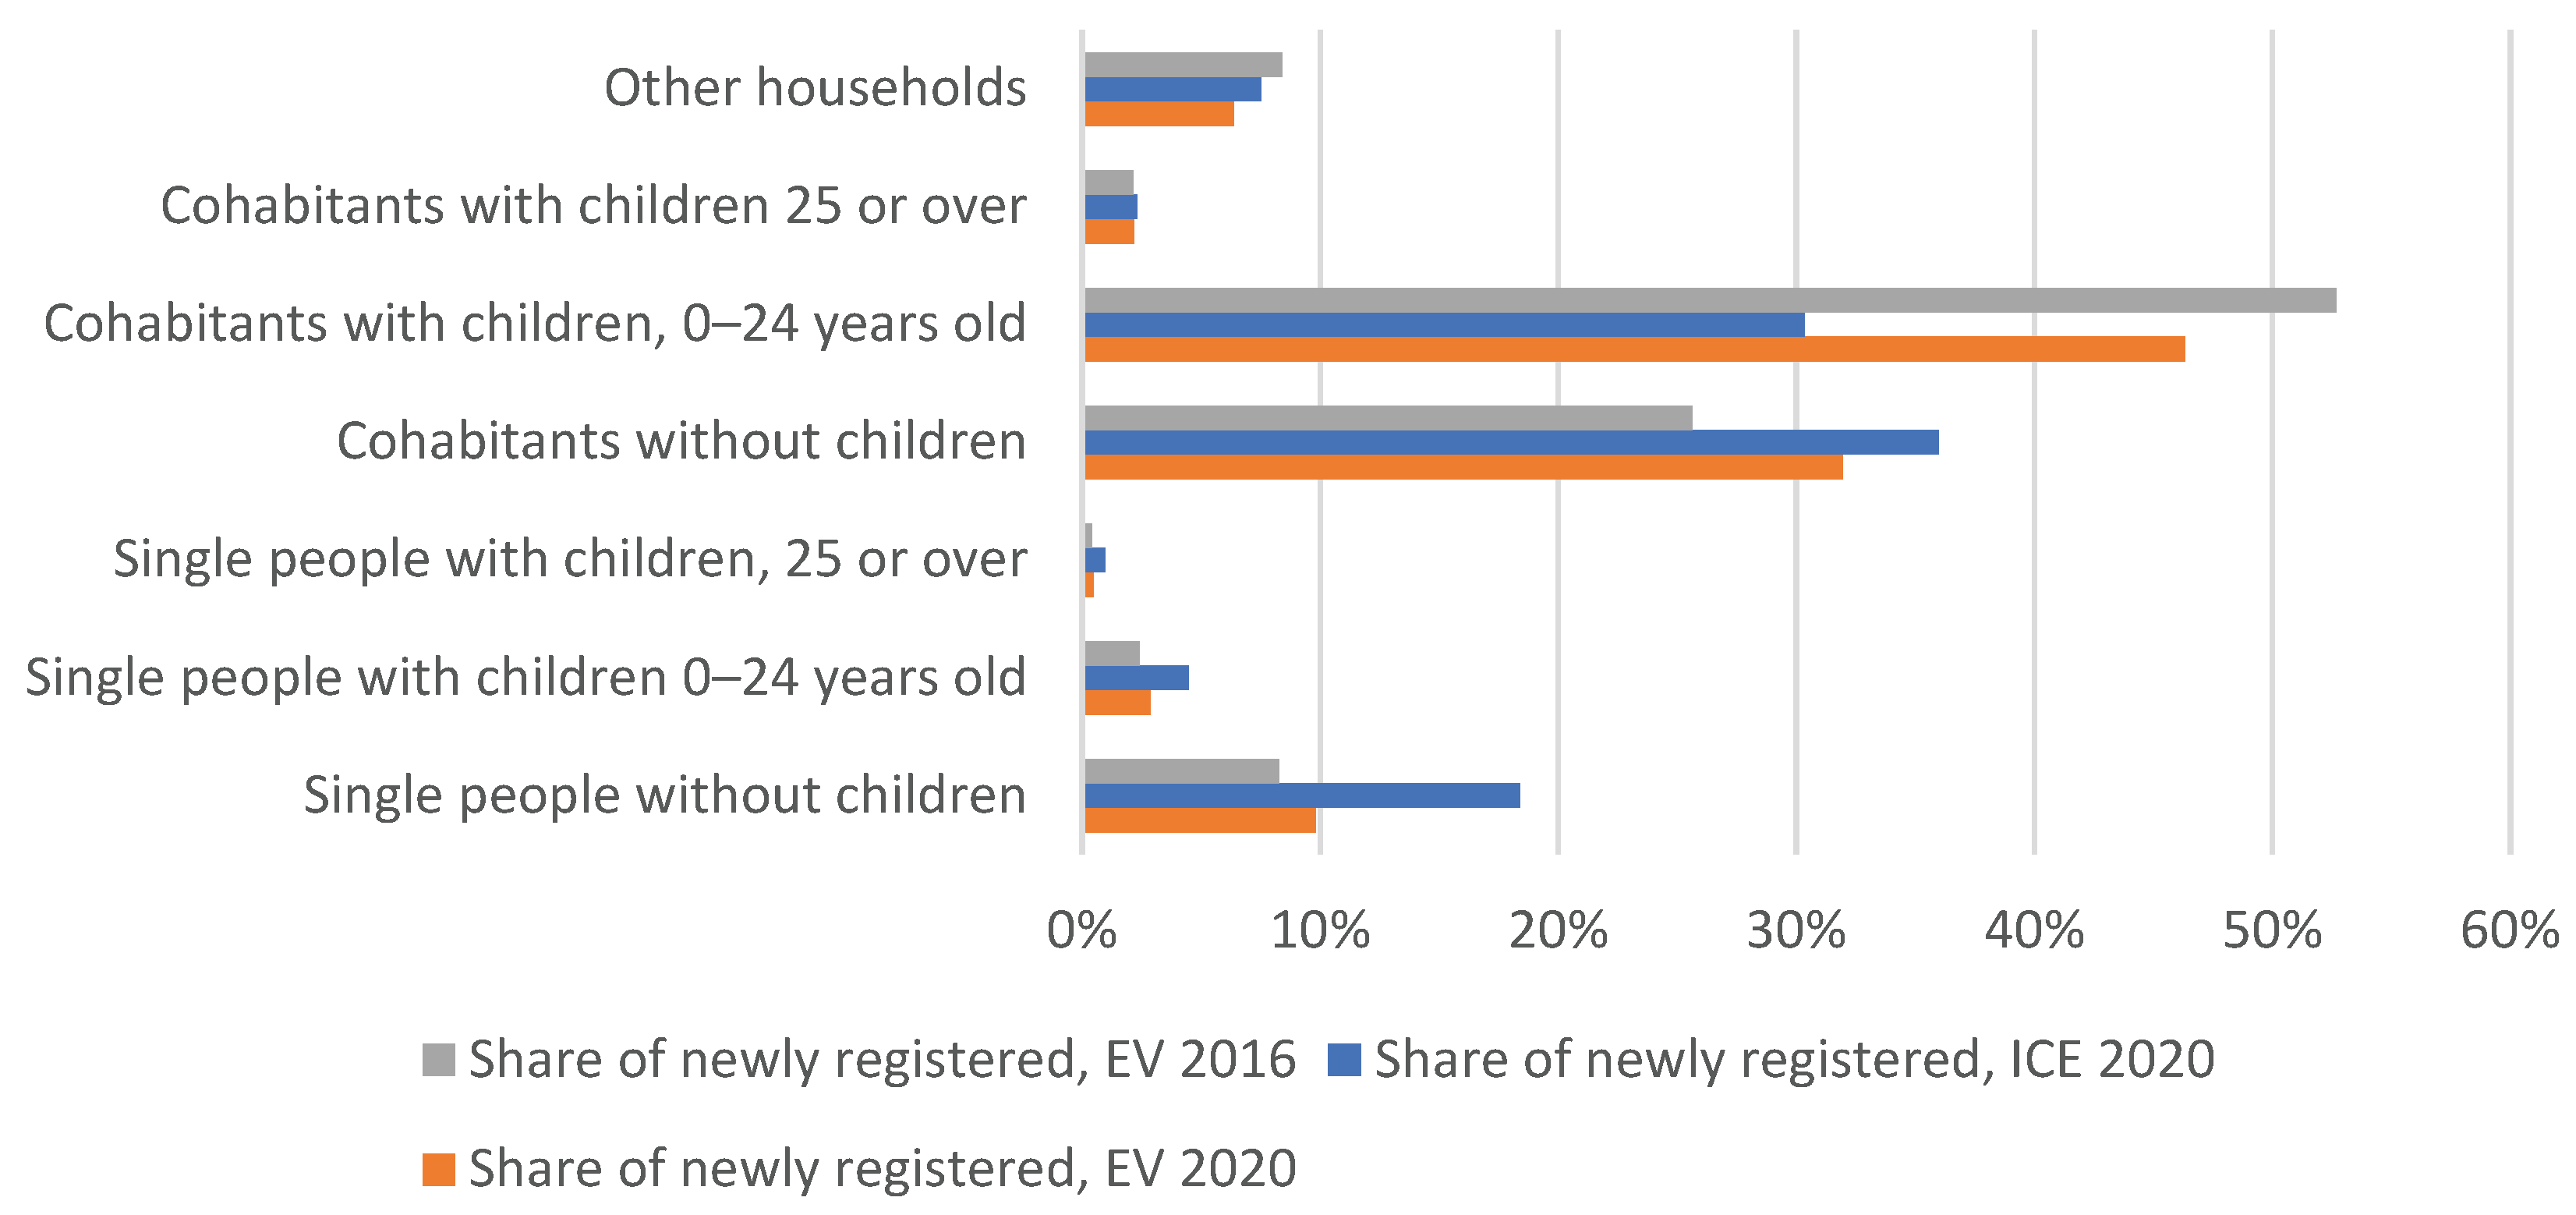
Figure 10.
Share of leasing of new cars divided by buyers age, ICE, BEV and PHEV, 2020.
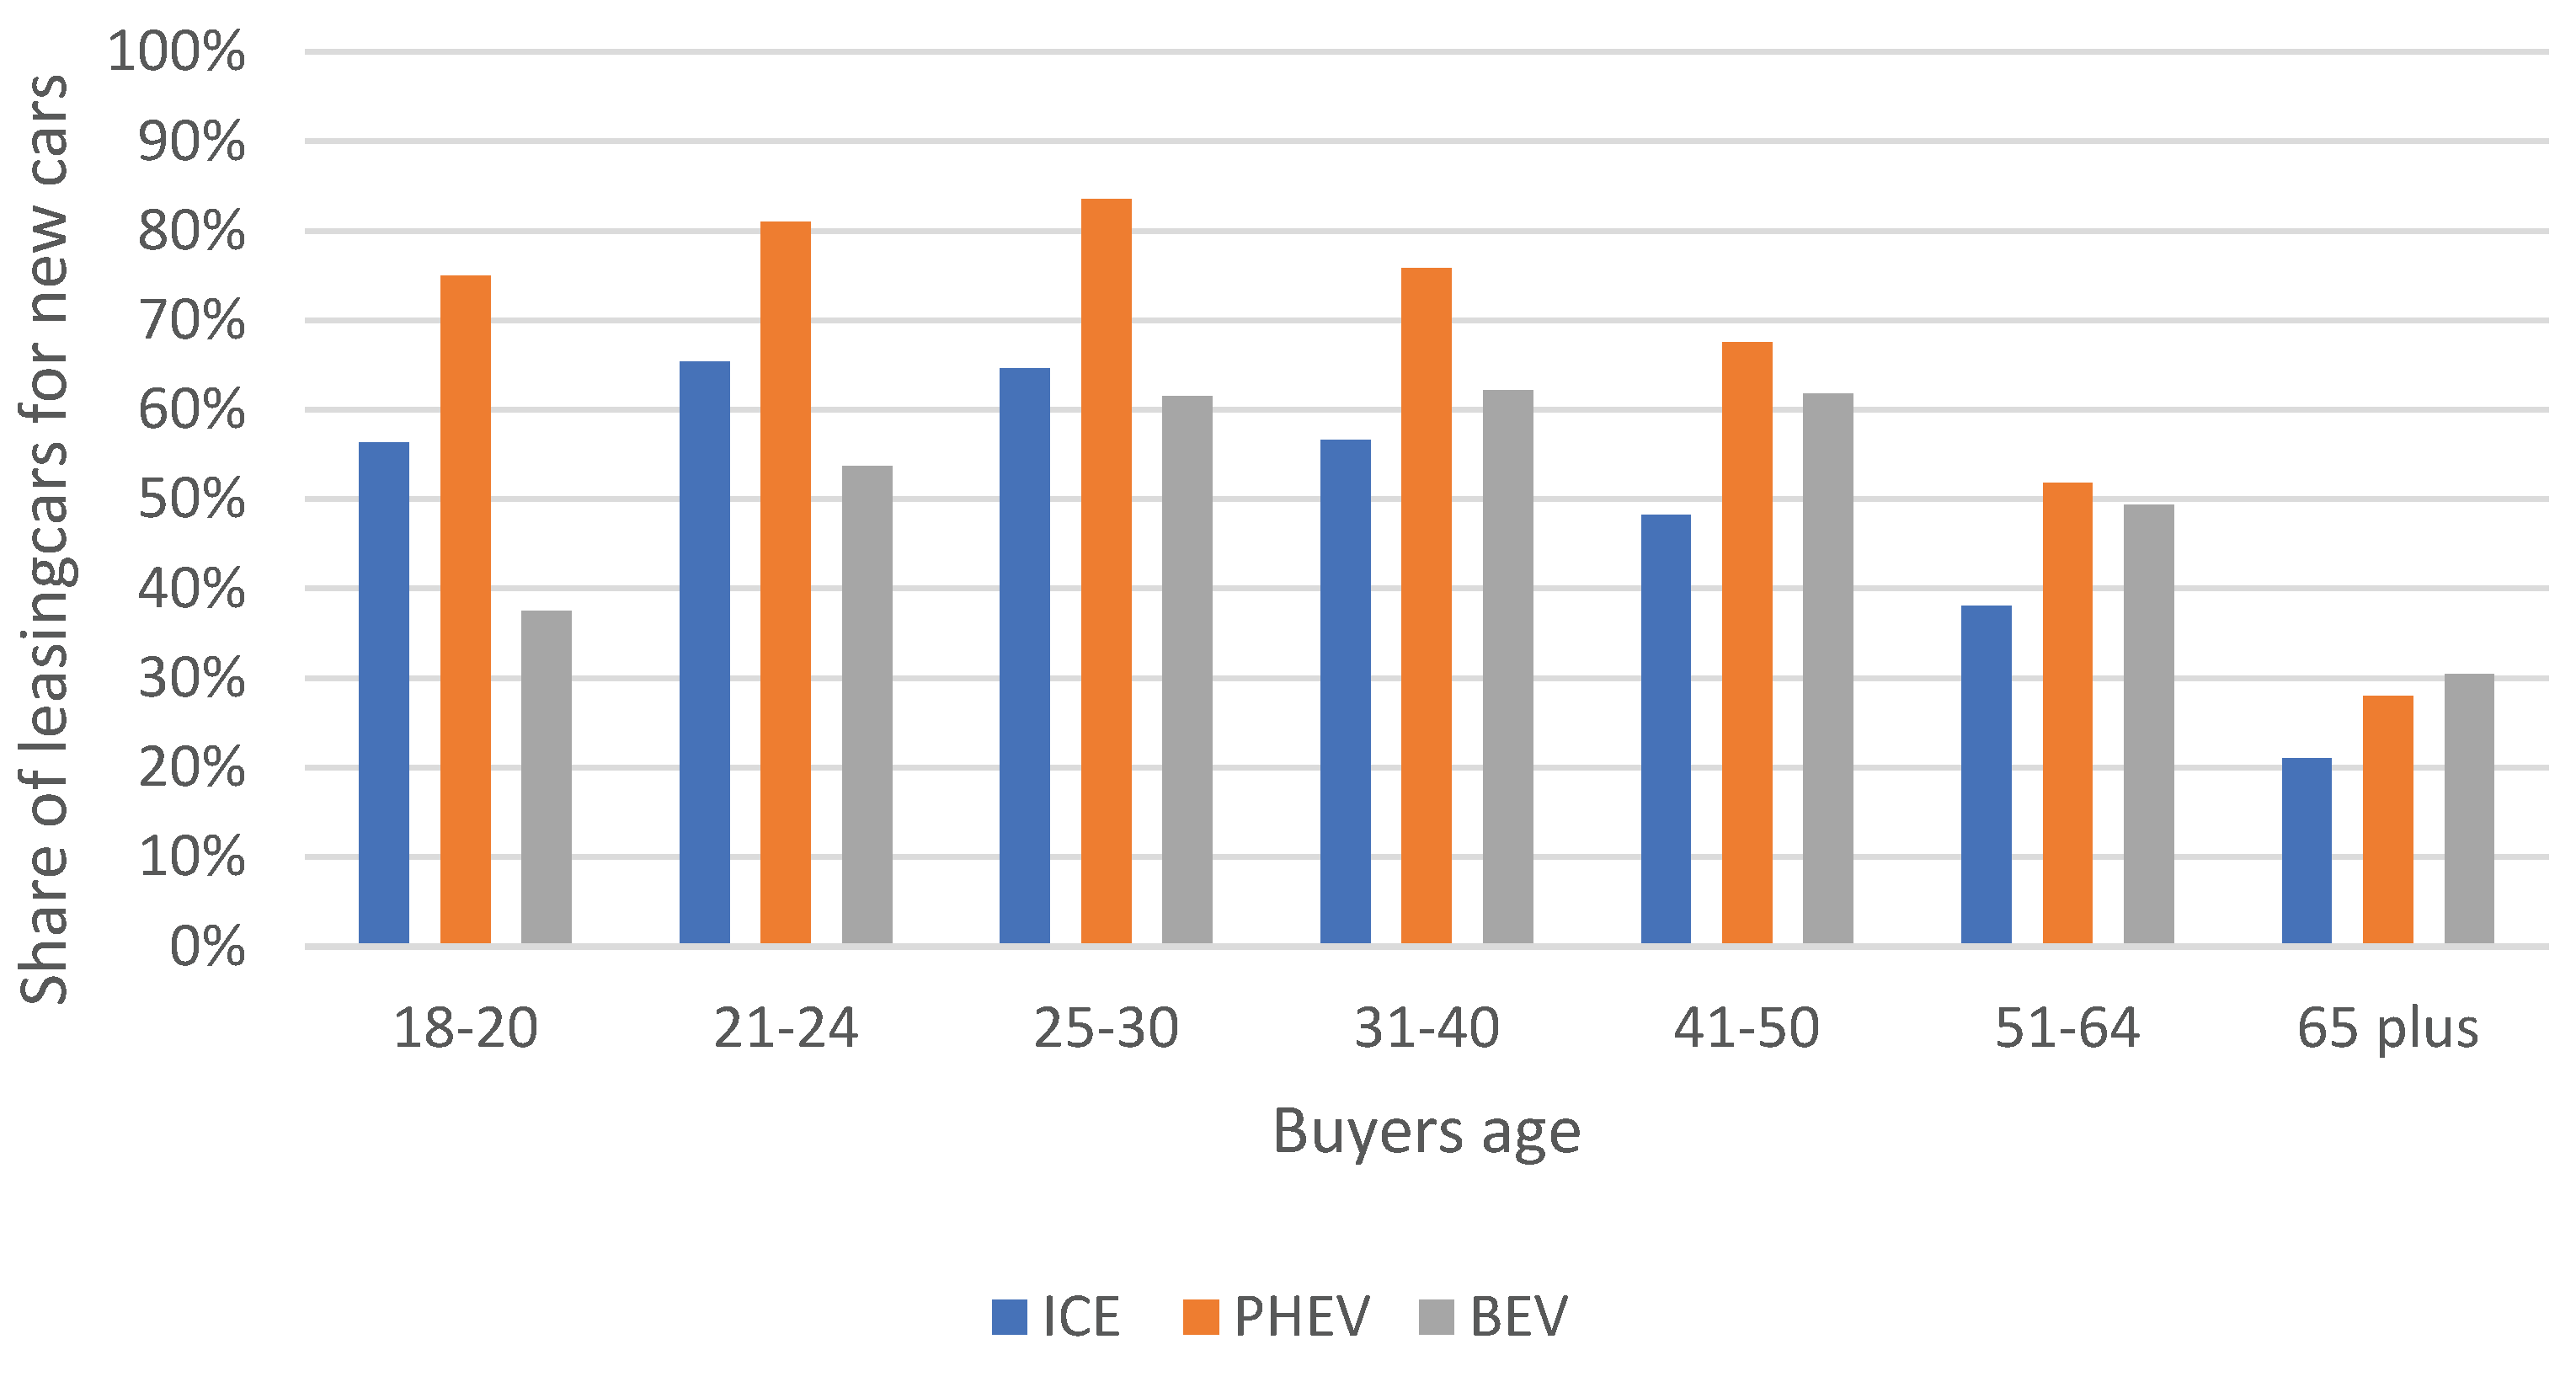
Figure 11.
Share of leasing of new cars divided by buyers’ annual income, ICE, BEV and PHEV, 2020.

Figure 11.
Share of leasing of new cars divided by buyers housing, ICE, BEV and PHEV, 2020.
Disclaimer/Publisher’s Note: The statements, opinions and data contained in all publications are solely those of the individual author(s) and contributor(s) and not of MDPI and/or the editor(s). MDPI and/or the editor(s) disclaim responsibility for any injury to people or property resulting from any ideas, methods, instructions or products referred to in the content. |
© 2024 by the authors. Licensee MDPI, Basel, Switzerland. This article is an open access article distributed under the terms and conditions of the Creative Commons Attribution (CC BY) license (http://creativecommons.org/licenses/by/4.0/).
Copyright: This open access article is published under a Creative Commons CC BY 4.0 license, which permit the free download, distribution, and reuse, provided that the author and preprint are cited in any reuse.


