
Submitted:
18 March 2024
Posted:
18 March 2024
You are already at the latest version
Abstract
The aging mechanism of 10% and 30% nickel substituted manganese hexacyanoferrate cathode material in aqueous zinc-ion batteries has been explored through the advanced synchrotron-based two-dimensional x-ray fluorescence technique. Thanks to the two-dimension modality, not only the metal concentration dynamics throughout the entire electrodes was followed during the aging process, but their spatial distribution was also revealed, suggesting the route of the material transformation. The dissolution of Mn and Ni, and the penetration of Zn inside the framework, alongside the Mn aggregations outside the hexacyanoferrate framework were detected. Additionally, the possibility of conducting x-ray absorption spectroscopy measurements on the regions of interest made it possible to explore the chemical state of each metal, and furthermore, synchrotron-based powder x-ray diffraction demonstrated the gradual structural modification in 30% Ni-containing sample series, in terms of the different phase formation.
Keywords:
zinc-ion batteries
; aqueous batteries
; double-metal hexacyanoferrate.
; Prussian Blue
; x-ray fluorescence
; x-ray techniques
; XAS
; XRD
1. Introduction
Battery material research is a flourishing, yet challenging field in the modern-day science. On one hand, the energy consumption is constantly increasing, which creates better performance requirement for the future developments, but on the other hand, the environmental impact cannot be ignored. Indeed, the European climate law is set for EU to become climate neutral by 2050, including reducing the net greenhouse gas emissions by at least 55% by 2030, compared to 1990 levels [1]. This sets the necessity of making improvements and innovations in both, the alternative energy sources and their storage fields. Therefore undoubtfully, the secondary, or rechargeable batteries have a great importance, and are widely researched. Even though, the Li-ion batteries (LIBs) are still dominating in the rechargeable battery market, both environmental and political issues created the necessity to shift the attention mainly towards two different directions: the recovery and even reuse of various components in LIBs, and the development of new post-LIB systems.
Development of the new system always needs the extensive research. In the battery field every component of the cell has to be designed, tested, possible problems identified, optimized and tested again in a cycle until either the satisfactory results are reached, or the reason behind the failure is identified. For this purpose, advanced structural characterization of the materials is necessary, and x-ray techniques can be considered as one of the best options. For example, the x-ray fluorescence spectroscopy (XRF) is a powerful analytical tool for the spectrochemical determination of almost all elements (Z>8). It is based on the measurement of wavelength or energy, and intensity of the characteristic photons that had been emitted from the sample, in order to identify the elements inside the analyte, and to determine their mass or concentration [2]. Therefore, it can quantifiably provide the data about the elemental composition of the material, and consequently, the dynamics of each metal inside the cathode can be tracked. Additionally, with two-dimensional setup, especially in synchrotron facilities, where high spatial resolution is available, elemental distribution throughout the sample can be investigated. This feature is particularly beneficial in the aging studies of the battery materials. Moreover, in synchrotron facilities, at the beamlines dedicated to the XRF analysis, there is a possibility to record the x-ray absorption spectra (XAS), especially the near-edge portion (XANES) on the regions of interest (micro-XANES experiment), which leads to the development of the tandem characterization technique, which covers the determination of the oxidation state of the elements with XAS, while XRF is providing the structural information, distribution [3,4], or morphological changes inside the material [5].
The powder x-ray diffraction (PXRD) is another essential tool for probing the long-range structure of the material, describing the crystallinity, symmetry, unit cell parameters and phase modification, that can be extremely helpful for the characterization of the battery materials, and for following the alterations inside the structure during the aging process [6].
Even though, the research of new battery systems is proceeding with ongoing challenges, progress is still achieved. Indeed, the commercialization of the first Na-ion batteries (SIBs) by Contemporary Amperex Technology Co., Ltd., in 2021, could be counted as a big step. Their cathode material is based on the Prussian White, from the family of the Prussian Blue Analogues (PBAs) [7]. Interestingly, the other prototypes of SIBS, also based on PBAs are being developed in Sweden [8] and USA [9]. Alongside SIBs, other post-LIBs are also in extensively researched, including potassium, calcium, magnesium, zinc etc. The latter is attractive not only as a low cost, nontoxic material, but also, in case of using Zn metal as an anode [10,11,12], its high theoretical gravimetric (820 mAh g-1) and volumetric capacity (5855 mAh cm-3), and low standard reduction potential (-0.76 V vs. SHE) [11] can be certainly counted as advantages.
Indeed, the family of PBAs has a great perspective in the battery field, as their open ionic channels, lead to the higher diffusion coefficient of 10-9 to 10-8 cm2 s-1 [13,14], and therefore, to the higher ionic conductivity. Also, the structural and dimensional stability of PBA lattice, originating from its robust and large 3D channel frameworks, leads to almost zero lattice strain towards the insertion and extraction processes [15,16]. The general formula of PBA can be written as: AxM[Fe(CN)6]γ□1-γ∙zH2O, where A is an alkali metal such as Li+, Na+, K+, etc.; M is transition metal ions: Fe, Co, Mn, Ni, Cu etc.; □ is a vacancy; 0 < x < 2; 0 < y < 1 [16]. Generally, both metals (M and Fe) can be partially or fully substituted with various other transition metals, which make this family of materials extremely tunable. Also, both metal centers can be (but not necessarily) electroactive [17], which implies to two electron redox capacity, and therefore, two alkali ion storage. Various PBAs have been reported as electrode materials for both Li-ion and post-Li-ion battery systems [18,19,20,21,22,23,24,25,26].
Manganese hexacyanoferrate (MnHCF) is one of the simple PBAs, with attractive qualities such as safety and non-toxicity, but also, due to containing only the elements, which are widely abundant, it is relatively inexpensive and overall sustainable [6]. In the battery field MnHCF has a perspective to be a cathode material, as it possesses relatively high discharge voltage and two active redox couples (Fe3+/Fe2+ and Mn3+/Mn2+), leading to the large specific capacity. However, Mn in oxidized +3 state is subjected to the severe crystal Jahn-Teller (JT) distortion effect [27,28], which is believed to be one of the reasons for the serious dissolution of MnHCF in aqueous zinc-ion batteries (AZIBs), forming a new Zn-containing phase [29,30,31]. Heteroatom doping or partial substitution approaches are sometimes successfully adopted for the adjustment of the electrochemical properties. It is reported that Ni doping can help to relax the JT distortion in MnHCF [32], as Ni and Mn have similar atomic radius, and therefore, during the substitution the framework remains in a good order. Notably, Ni sites are believed to be unreactive during the insertion/extraction process, and just balance the tiny structural disturbances originating from the redox reactions on the Mn sites [33].
In this work, we followed the structural and morphological modification during the aging process of the 10% and 30% Ni-substituted MnHCF (10%NiMnHCF and 30%NiMnHCF, respectively) cathode materials from AZIBs with synchrotron based 2D-XRF, with additional XANES measurements on the regions of interest and PXRD. The application of these characterization techniques can be generalized for the various different compounds in a number of fields, of course including other battery system researches.
2. Materials and Methods
2.1. Synthesis
The synthesis of NiMnHCF was performed through simple and scalable co-precipitation method [28,34]. Manganese sulphate monohydrate (MnSO4⋅H2O), nickel sulphate (NiSO4), sodium ferrocyanide decahydrate (Na4[Fe(CN)6]⋅10H2O) and sodium sulphate (Na2SO4) were utilized without further purification (Sigma Aldrich). For obtaining the 10% and 30% concentration of nickel the aqueous solutions of MnSO4⋅H2O and NiSO4 were preliminary mixed in 90/10 and 70/30 ratios, respectively. Afterwards, these mixtures, together with the aqueous solution of Na4[Fe(CN)6]⋅10H2O, were added dropwise, to an aqueous solution of Na2SO4 (0.1 L, of each 0.1000 м solution). A peristaltic pump was set at a rate of 3.3 mL min−1, upon continuous magnetic stirring and constant temperature (with a thermostatic bath, temperature: 40 ± 2 °C). The obtained products were aged for 5 days, centrifugated, and the solid fraction washed three times with the distilled water. Powders were dried at 60 °C for 48 h, and grinded in an agate mortar. The microwave-plasma atomic emission spectroscopy (MP-AES), which was performed on MP-AES 4210 high sensitivity optical emission spectrometer, and thermogravimetric analysis (TGA), which was carried out in TA Discovery TGA instrument, were applied on the synthesized materials. The obtained formulas were: Na1.4Mn0.90Ni0.10[Fe(CN)6]0.76∙3.4H2O and Na1.52Mn0.68Ni0.32[Fe(CN)6]0.76∙3.53H2O.
2.2. Electrode Preparation
Dried samples were mixed with a conductive agent: carbon black and a binder: polytetrafluoroethylene (PTFE), in a mortar, with the ratio of 70:25:5. Electrodes were cut, with the size of 8 mm and 12 mm in diameter, with the mass loading of approximately 8±1 mgNiMnHCF cm-2. Two-hour long soaking of the pellets in the electrolyte solution under the vacuum was applied before the electrochemical tests. Coin cells were ensembled with NiMnHCF as the cathode, Zn metal plate as the anode, 3M ZnSO4 aqueous solution as an electrolyte and Whatman paper as a separator. The tests of the galvanostatic cycling with potential limitation (GCPL) were performed with the conditions of 1 < E < 1.85 V versus Zn2+/Zn, with scan rate of 20 mA g-1 on Neware BTS4000-5V100mA Battery testing system.
2.3. D-XRF and XANES Setup
The data was collected at the XRF beamline in Sincrotrone Elettra, Basovizza, Italy. This beamline hosts and end station dedicated to spectrometry, spectroscopy, microscopy, and reflectometry [35]. A double crystal Si(111) monochromator with ΔE/E ≈ 10-4 enables the access to the energy range of 4 – 14 keV [36]. The beam size was set through two pairs of exit slits: the horizontal and vertical apertures were 100 µm and 200 µm, respectively. Considering the 45̊/45̊ geometry used in our experiment, the beam footprint on the sample surface was 140 x 200 µm2 (H x V).
In the experiments dedicated to ex situ electrodes from AZIBs, because of the composition of the materials, an initial energy of 10 KeV was chosen (above Mn, Fe, Ni and Zn K-edges). For the data analysis of XRF maps and spectra, the PyMca software was used [37]. XRF spectra can be extracted from every single pixel of the recorded maps. The spectra were calibrated and normalized to the beam intensity and, when areas including multiple pixels were selected and considered, the resulting spectra were normalized also to the number of pixels in the selection. For the semi-quantitative analysis representative of the entire electrodes, sample areas were selected from the corresponding maps avoiding the visible morphological defects or heterogeneities. The spectra were subsequently fitted using the same software. The elemental composition at the heterogeneities was quantified in the same manner, obtaining the elemental concentrations as mass fractions.
XAS measurement was performed on several samples, in selected areas, in fluorescence mode. The data analysis of XANES spectra has been performed with Athena software [38].
The list of the ex situ electrodes is reported in Table 1.
2.4. PXRD Setup
PXRD analysis of 30%NiMnHCF was performed on the MCX beamline at Sincrotrone Elettra, Basovizza, Italy [39,40]. The monochromatic x-ray beams of 1.03318 Å and 0.62000 Å (for aged samples) were used, in the transition mode with a marCCD detector, the step size 0.01°, acquisition time of 1 s/step. Samples were attached with paper-tape on sides, or were embodied in double Kapton tape (in case of aged electrodes). Background, Kapton tape and standard LaB6 were analyzed. The crystal structure was refined by GSAS II [41], in the following work Q (Å-1) will be used for the x-axis of the diffractograms, instead 2θ (°), because of the different wavelength of x-ray beam in-between the analysis. The list of samples is presented in the Table S1.
3. Results and Discussion
3.1. D-XRF and micro-XANES Analysis
XRF images recorded on the pristine electrodes of both 10% and 30%NiMnHCF shows (Figure 1, Figure S1, (pristine shortened to “Pr”)) that the distribution of all framework metals inside entire sample is quite homogeneous. The lower intensities near the borderline can be explained by thinner edges of the handmade pellets.
The 30%NiMnHCF C1 sample on Figure 2 a demonstrates the dissolution of Mn, which has already been described in case of pure MnHCF [43]. Evidently, the process starts from the borders. Similarly, Ni (Figure 2 b) suffered the partial dissolution, initially also from the edges of the electrode. Therefore, nickel not only failed to stabilize the MnHCF structure in the aqueous zinc media, but by itself was subjected to the dissolution. Zn, on the other hand, is detected inside the framework already in C1 (Figure 2 c), even though during the first charge only Na from the synthesis process was expected to leave the structure. Zn was detected throughout the whole sample, but with the higher intensity on the borderline, which possibly indicates the insertion of Zn inside the framework from the borders, occupying the positions of Mn and Ni, as their dissolution exactly started from the edges (Figure 2 d). This phenomenon is observed for both 10% and 30% NiMnHCF (Figure 4 a; Figure S2 b).
The process deepened in the following cycles, however, by the 10th cycle the metal distribution in electrodes became homogeneous again. This is well-visible on Figure S2, which depicts how the uniform distribution of Ni in 10%NiMnHCF changed to the relatively high residual concentration of Ni only in the center of the samples, and then again became homogeneous. Indeed, the semi-quantitative analysis relative to Fe shows the rapid drop of the concentration of Mn from the pristine electrodes to the C1s, and then a slower decrease until the equilibrium is reached (Figure 3 a, b). Interestingly, the content of Mn (and Ni) is higher in charged samples, compared to the discharged ones of the same cycle. This phenomenon indicates that while the big portion of Mn left the structure entirely, there is a small fraction of manganese which is reversibly forced out of the framework when Zn-ions from the electrolyte enter it during the discharge process. This argument is further strengthened by the fact that Zn demonstrates the opposite behavior to Mn and Ni (higher concentrations in discharged electrodes).
The 10% and 30%NiMnHCF not only have a similar behavior, but more importantly, as Figure 3 c - e indicate, during the aging process, already after 10 cycles, the ratios of Mn/Fe, Ni/Fe and Zn/Fe become closely similar, indicating that there are not significant differences between 10% and 30%NiMnHCF anymore, and essentially, they transform into the same compound.
At the XRF beamline, samples can be investigated using complementary XAS measurements can be carried out under the same experimental conditions and with the same beam size used for XRF mapping. In this case, it was interesting to explore the extra information about the possible differences in the oxidation state or any modifications in the coordination of the metals in-between the different portions of the sample. On the XRF images it is easy to assess the elemental distribution within the pellet, therefore several points were chosen to investigate the metals behaviour in areas where their concentration largely differs from the average.
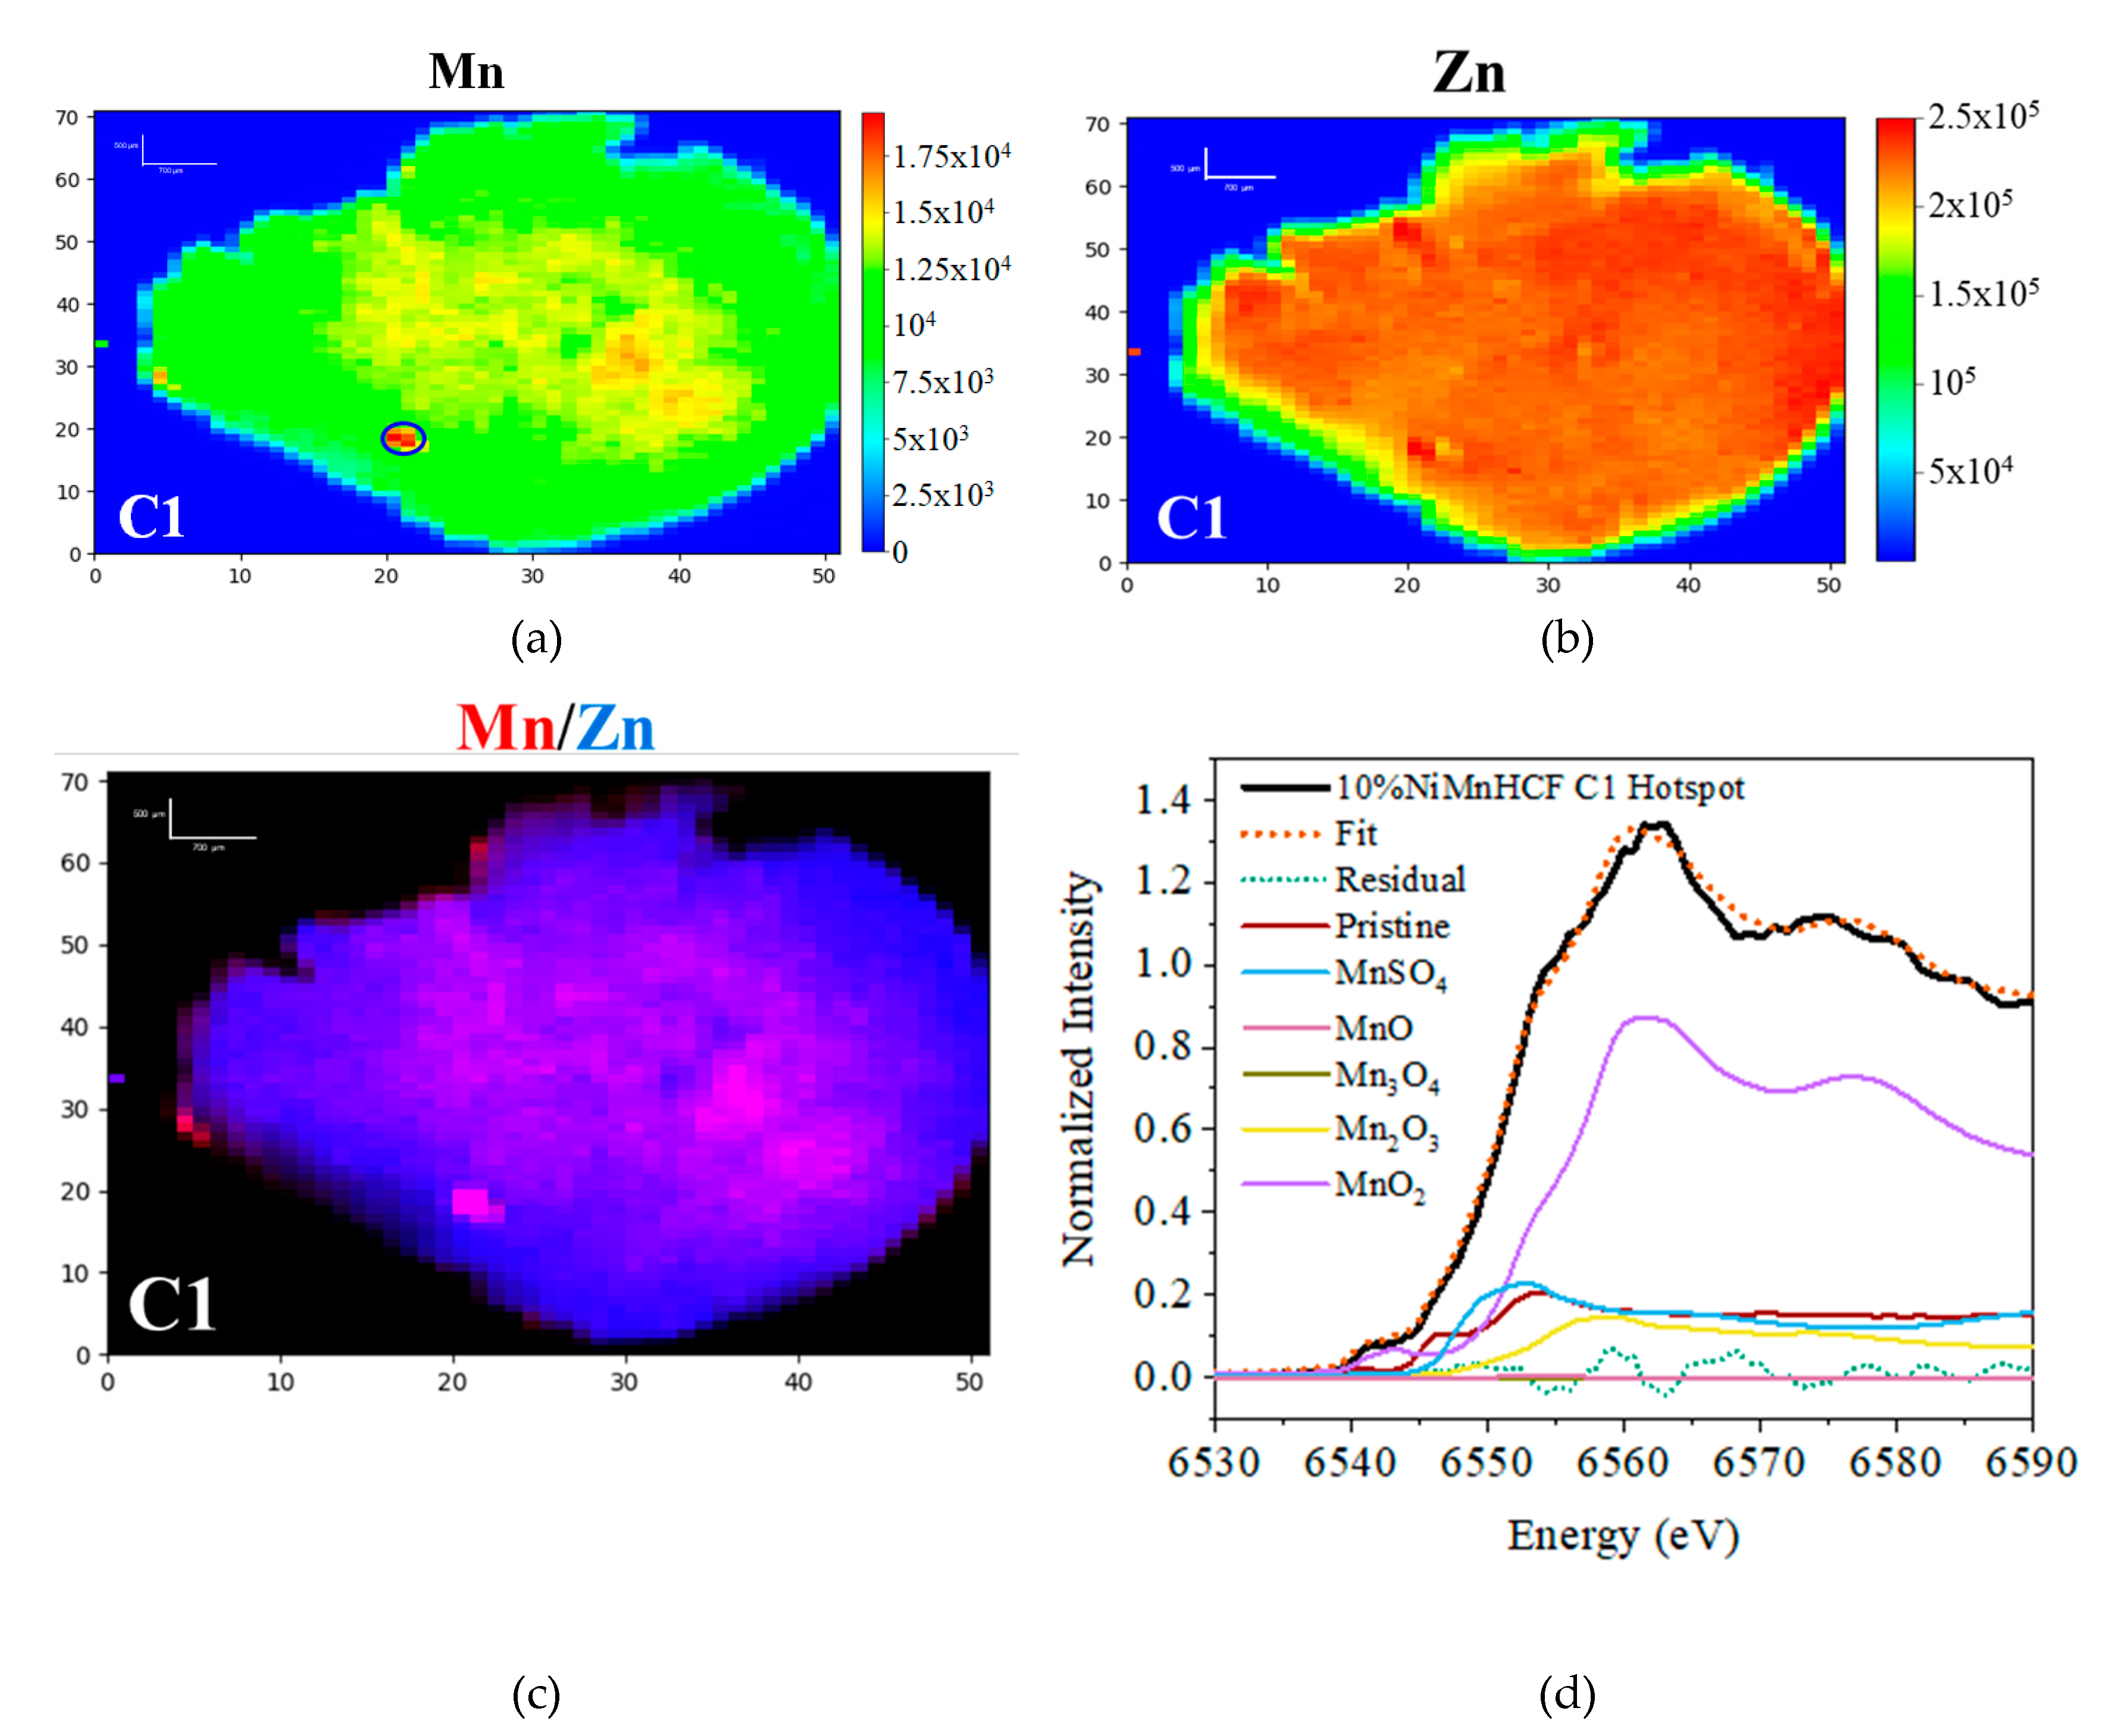
The Figure S3 shows the Fe, Mn and Ni K-edge spectra of the pristine electrode and Zn K-edge spectrum of C1 of 10%NiMnHCF, recorded on small sections of the pellets. XAS spectra of the initial framework metals share the features, which have been already recorded on powder samples [34], while Zn spectrum possesses the characteristics of ZnHCF, being in a good agreement with the previous reports [42]. Much more meaningful is the XANES recorded on the portions where the sample looks inhomogeneous,. Indeed, the measurement was performed on a small aggregate of Mn (marked with a blue circle), which was formed in C1 sample of 10%NiMnHCF (Figure 4 a, b), where the concentration of Mn was exceeding the average value approximately 1.5 times. The spectral decline from the hexacyanoferrate pattern was evident (Figure 4 c). Linear combination fitting (LCF) was adopted to shed some light about this modification. As Figure 4 d shows, the main component of the fit is MnO2, which consists of more than 60% of the total contribution (Table 2). Therefore, the formation of the Mn(IV) oxide starts non-uniformly throughout the electrode.
Figure 4.
Normalized 2D-XRF maps of 10%NiMnHCF C1 ex situ electrode (a) Mn, the inhomogeneity is marked with a blue circle; (b) Zn; intensity scale is color-based (red = high intensity; blue = low intensity), (c) Mn and Zn overlay, Mn in red, Zn in blue. Length scale – vertical bar 1000 μm (200 μm x 5 px), horizontal bar 700 μm (140 μm x 5 px); (d) LCF analysis of the XANES spectrum of C1 hotspot, components: pristine, MnSO4, MnO, Mn3O4. Mn2O3, MnO2.
Predictably, the Mn aggregates are more frequent in the aged electrodes. As mentioned above, the C10 samples look quite homogeneous, so the dissolution/substitution of Mn (Ni) /with Zn seems to have reached the equilibrium (or a near equilibrium state). However, in C10 and C100 samples, close to the edges and near the defects of the electrodes, there appears to be a few Mn aggregations, and interestingly, these regions lack other framework atoms (Figure 5, Figure S4). According to the semi-quantitative analysis, the concentration of manganese in these aggregates, for example, inside the 30%NiMnHCF C100, is more than 4 times higher to the average content of Mn. Possibly, the portion of dissolved Mn formed small aggregates of oxide species outside the hexacyanoferrate structure (similarly to what was singularly visible in C1 of 10%NiMnHCF).
To further confirm the existence of the two compounds: ZnHCF and MnO2 inside the NiMnHCF material, electrochemical and other material characterization methods have been deployed.
3.2. IR Analysis
The IR spectra of both NiMnHCF compounds have already been reported previously [34]. The signal of C≡N stretching was centered at 2074 and 2077 cm-1, for 10%NiMnHCF and 30%NiMnHCF, respectively, which also was in agreement with the results of pure MnHCF, reported in the literature [42]. As Figure 6 a and b show, for the pristine electrodes, only a slight shift of C≡N stretching is visible to 2067 – 2069 cm-1. But in the cycled electrodes the obvious blue shift of 32 – 33 cm-1 was observed. These values are much closer to C≡N stretching for ZnHCF material [44], for which the value of approximately 2100 cm-1 has been reported [43]. This observation strengthens the argument of tandem 2D-XRF – microXANES analysis, which indicated Zn penetration inside the sample through the obtained maps, and suggested ZnHCF formation through the recorded XANES spectra (Figure 3, Figure S3).
3.3. GCPL Analysis
To cross-examine the formation of MnO2 in electrodes during the cycling, the electrochemical characterization results can be addressed. Generally, in the first cycle, Na+ is expected to be leaving the structure while charging, and Zn2+ to intercalate during the discharge process. In the later cycles, Zn2+ should reversibly enter the NiMnHCF framework, however as Figure 6 c shows, the capacity of 30%NiMnHCF keeps steadily declining up to 15 cycles before the stabilization, more prominently during the initial several cycles, which can suggest the presence of activation phase and/or gradual structural transformation (same trend is observed for 10%NiMnHCF, Figure S5). This can be due to the observed formation of the manganese oxide, as reported in the 2D-XRF and micro-XANES analysis section (Figure 4, 5). In the first couple of cycles, the discharge plateaus are slowly forming and stabilizing for both 10% and 30%NiMnHCF, at approximately 1.28 V and 1.46 V (V vs Zn2+/Zn) (Figure 6 d). The plateaus at these potentials are indeed characteristic to the MnO2 cathode material [45], which indicates, that after the formation of the oxide species, it becomes the major contributor of the electrochemical activity of the system. Notably, after the stabilization (10-15 cycles), the discharge capacity is quite stable, and has only slight periodicity (Figure 6 c, Figure S5).
3.4. PXRD Analysis
Additionally, the pristine sample of 30%NiMnHCF was refined to the face centered cubic F m-3m space group (Figure 7 a, Figure S6), similarly to the as-synthesized powdered sample, which had been already analyzed before [34]. According to the Rietveld refinement results, the unit cell experienced slight decrease of the cell volume, a parameter reduced from a = 10.4317 Å to a = 10.33 Å.
The structural modifications started from the first charging process, consisting of not only the modification of the cell parameters or strain inside the system, but the emergence of a new phase. Figure 7 b demonstrates that the C1 sample can be characterized as a sum of two phases, the original F m-3m, and a new primitive cubic phase P m-3m with a larger unit cell (a = 11.82 Å).
The structural reversibility is a very important aspect for the longer lifetime of the battery systems; in this material the modifications seem to be not-reversible, as the XRD pattern of D1 structure did not resemble pristine electrode (Figure S7), and was still a mixture of two phases. With further cycling the transformation continues and the original phase is slowly disappearing, the C2 and D2 electrodes prove the same observation as well (Figure S8).
The initial F m-3m phase is not visible in the tenth cycle of 30%NiMnHCF samples. As Figure 7 c shows, the diffractgrams of C10 and D10 are highly crystalline and very similar, indicating the stabilization of the structure. The samples were refined to P m-3m phase, but the presence of two unindexed low intensity reflections (depicted with blue rhombus) in D10 sample suggested existence of an additional phase. As the formation of ZnHCF was already indicated by several techniques, during the refinement as a second phase hexagonal R -3c was added, characteristic to the ZnHCF material [43]. Indeed, the low intensity peaks were fitted perfectly (Figure S9).
Two pellets from the 50th cycle also displayed multiple phases inside the structure, the initial F m-3m was not recovered, instead the mix of primitive cubic and hexagonal phases were detected, and the compound was still quite crystalline (Figure S10). But when the C100 and D100 were analyzed (Figure 7 c, Figure S11), the main phase became the hexagonal R -3c, characteristic to ZnHCF, while P m-3m cell still being visible inside the 100th cycle samples. Consequently, the part of the primitive cubic cell partially transformed to the hexagonal symmetry. The initial refinement of the 100th cycle samples was performed considering those two phases, however, the fit improved after adding the third phase, coming from the electrolyte, the monoclinic P 21/c unit cell, characteristic of hydrated zinc sulphate (ZnSO4·4H2O). Unfortunately, the data quality is not high enough to retrieve the reliable information about the phase ratio. The crystallinity inside the structure has also seemingly decreased.
For the better visualization of overall structure evolution of the cathode material during the aging process, diffractograms were stacked on top of each other (Figure S12). The detailed information about the unit cell parameters of each phase for 30%NiMnHCF can be found in the Table 3. The numbers are obtained from the Pawley refinement results (except pristine electrode, where Rietveld refinement was performed, Figures S13–S22).
Overall, PXRD and 2D-XRF results are aligned, as the dissolution of Mn and Ni and the penetration of Zn inside the framework might have caused the formation of the new phase. The fact that the reflections of MnO2 were not visible in diffractograms can be explained by the possible amorphization and/or not being able to form the long-range ordered structure, as this compound is known to exist in several different forms, including the amorphous one [46].
5. Conclusions
The 2D-XRF measurement showed the spatial distribution of the elements inside the electrode, and the modification of this distribution. XRF maps provided the visual pattern of the dissolution of Mn and Ni, starting from the borders, and Zn entering the structure exactly from the edges. Therefore, Ni was not able to provide the stability of the MnHCF structure, as it was hoped. The semi-quantitative measurement showed the dynamics of the elements inside the pellets: Ni and Mn being lower concentration in the discharged electrodes (compared to the charged ones of the same cycle), while Zn showing the opposite behavior, the equilibrium already being reached by 10th cycle. Most importantly, compositionally this equilibrium was same for the 10%NiMnHCF and 30%NiMnHCF, as they proved to contain almost identical metal ratios, effectively becoming the same material.
The XANES measurements suggested Zn to be integrated in the hexacyanoferrate framework from the first cycle. This observation was further strengthened by the PXRD measurements, demonstrating the modification of the material through the phase transformation from the face centered cubic unit cell to primitive cubic, and then partially to the hexagonal symmetry, generally characteristic to ZnHCF, with the additional monoclinic phase from the electrolyte contribution. The same compound (ZnHCF) formation was suggested by the FT-IR/ATR analysis.
On the other hand, the 2D-XRF maps showed the systematical Mn aggregations on the edges of the aged samples (already in the 10th cycle). With the overlay maps, it was evident that these regions lacked other metals, suggesting Mn to be in a different (not in hexacyanoferrate) form. XANES spectrum of Mn hotspot suggested these aggregations to mainly consist of MnO2, which was also verified by the electrochemical profile of the material after the stabilization.
Together, these x-ray techniques can provide a thorough understanding of the processes appearing during cycling of the battery system, as the tandem XRF – micro-XANES experiments are able to follow the gradual modification of the materials, understand the inhomogenization, alteration or the degradation of the electrodes: spatially with XRF images, and chemically with XANES spectra; while the multiphase changes in the long-range order domain is possible to explore by the PXRD measurements. The approach, presented in this work, can be extended to similar studies on anode or other cathode materials to be used in the next generation of the battery electrodes.
Supplementary Materials
The following supporting information can be downloaded at the website of this paper posted on Preprints.org. Figure S1. 2D-XRF maps of Pristine sample of 10%NiMnHCF: (a) Mn, (b) Ni and (c) Fe.; Figure S2. 2D-XRF maps of Ni contribution of 10%NiMnHCF samples: (a) Pristine, (b), C1, (c) C2 and (d) C10.; Figure S3. XANES of 10%NiMnHCF samples: (a) Mn K-edge of Pristine, (b), Fe K-edge of Pristine, (c) Ni K-edge of Pristine and (d) Zn K-edge of C1.; Figure S4. 2D-XRF maps of 10%NiMnHCF samples: (a) C10 Mn, (b), C100 Mn, (c) C10 Zn, (d) C100 Zn, (e) C10 Mn/Zn overlay and (f) C100 Mn/Zn overlay.; Figure S5: Figure S5. GCPL data of C100 of 10%NiMnHCF: stability and efficiency test.; Figure S6: F m-3m structure of 30%NiMnHCF.; Figure S7: PXRD measurement result of D1 of 30%NiMnHCF.; Figure S8: PXRD measurement results of C2 and D2 of 30%NiMnHCF.; Figure S9. Pawley refinement of D10 of 30%NiMnHCF.; Figure S10: PXRD measurement results of C50 and D50 of 30%NiMnHCF.; Figure S11: PXRD measurement result of D100 of 30%NiMnHCF.; Figure S12: PXRD measurement result of D100 of 30%NiMnHCF.; Figure S13. Rietveld refinement of Pristine of 30%NiMnHCF.; Figure S14. Pawley refinement of C1 of 30%NiMnHCF.; Figure S15. Pawley refinement of D1 of 30%NiMnHCF.; Figure S16. Pawley refinement of C2 of 30%NiMnHCF.; Figure S17. Pawley refinement of D2 of 30%NiMnHCF.; Figure S18. Pawley refinement of C10 of 30%NiMnHCF.; Figure S19. Pawley refinement of C50 of 30%NiMnHCF.; Figure S20. Pawley refinement of D50 of 30%NiMnHCF. Figure S21. Pawley refinement of C100 of 30%NiMnHCF.; Figure S22. Pawley refinement of D100 of 30%NiMnHCF.; Table S1: The list of samples analyzed with PXRD technique.
Author Contributions
Conceptualization, M.G.; methodology, M.G., M.M. G.A.; formal analysis, M.M.; investigation, M.M., M.L.; resources, M.G.; data curation, M.M., M.L., I.C., M.G., G.A., J.R.P., R.D., M.G.; writing—original draft preparation, M.M.; writing—review and editing, M.M., M.L., M.G.; visualization, M.M.; supervision, M.G.; project administration, M.G.; funding acquisition, M.G. All authors have read and agreed to the published version of the manuscript.
Funding
This research was funded by Elettra synchrotron facility (2D-XRF, XANES measurements), #20220188; CERIC-ERIC, #20212162, #20222183 (PXRD measurement) (M.G. as PI); the RFO funds of the University of Bologna; MUR through the Sustainable Mobility Center, Centro Nazionale per la Mobilita′ Sostenibile – CNMS, Spoke 13 of the National Recovery and Resilience Plan (NRRP); . the PhD of M.M. was funded by the CERIC-ERIC.
Conflicts of Interest
The authors declare no conflict of interest
References
- EUR-Lex. Available online: https://eur-lex.europa.eu/summary/chapter/20.html#:~:text=The%20European%20climate%20law%20writes,2030%2C%20compared%20to%201990%20levels (accessed 23 02 2024).
- Janssens, K. G. X-Ray Fluorescence Analysis. In Handbook of Spectroscopy; Gauglitz G., Vo-Dinh T. Wiley-VCH Verlag GmbH & Co. KGaA: Weinheim, Germany, 2003; Volume 11, pp. 363–419. [Google Scholar]
- Maisuradze M., Carlomagno, I.; Mullaliu, A.; Li, M.; Aquilanti, G.; Giorgetti, M. 2D X-ray fluorescence imaging as a probe for charge state distribution of manganese in aged MnHCF-based electrodes, J. Phys. Chem. C, 2023, 127 (44), 21498. [CrossRef]
- Booth, S. G.; Uehara, A.; Chang, S. Y.; Mosselmans, J. F. W.; Schroeder, S. L. M; Dryfe, R. A. W. Gold Deposition at a Free-Standing Liquid/Liquid Interface: Evidence for the Formation of Au(I) by Microfocus X-ray Spectroscopy (μXRF and μXAFS) and Cyclic Voltammetry, J. Phys. Chem. C, 2015, 119, 16785–16792. [Google Scholar] [CrossRef]
- Yu, X.; Pan, H.; Zhou, Y.; Northrup, P.; Xiao, J.; Bak, S.; Liu, M.; Nam, K- W.; Qu, D.; Liu, J. et al. Direct Observation of the Redistribution of Sulfur and Polysufides in Li–S Batteries During the First Cycle by In Situ X-Ray Fluorescence Microscopy, Adv. Energy Mater. 2015, 5 (16), 1500072. [CrossRef]
- Li, M.; Gaboardi, M.; Mullaliu, A.; Maisuradze, M.; Xue, X.; Aquilanti, G.; Plaisier, J. R.; Passerini, S.; Giorgetti, M. Influence of Vacancies in Manganese Hexacyanoferrate Cathode for Organic Na-ion Batteries: A Structural Perspective. ChemSusChem 2023. [Google Scholar] [CrossRef] [PubMed]
- CATL. Available online: https://www.catl.com/en/news/665.html (accessed 23 02 2024).
- Altris. Available online: https://www.altris.se/technology/ (accessed 23 02 2024).
- Natron Energy. Available online: https://natron.energy/technology/ (accessed 23 02 2024).
- Fang, G.; Zhou, J.; Pan, A.; Liang, S. Recent Advances in Aqueous Zinc-Ion Batteries. ACS Energy Lett 2018, 3 (10), 2480–2501. [Google Scholar] [CrossRef]
- Konarov, A.; Voronina, N.; Jo, J. H.; Bakenov, Z.; Sun, Y.-K.; Myung, S.-T. Present and Future Perspective on Electrode Materials for Rechargeable Zinc-Ion Batteries. ACS Energy Lett 2018, 3 (10), 2620–2640. [Google Scholar] [CrossRef]
- Grignon, E.; Battaglia, A. M.; Schon, T. B.; Seferos, D. S. Aqueous Zinc Batteries: Design Principles toward Organic Cathodes for Grid Applications. iScience 2022, 25 (5), 104204. [Google Scholar] [CrossRef]
- Shibata, T.; Moritomo, Y. Ultrafast Cation Intercalation in Nanoporous Nickel Hexacyanoferrate. Chem. Commun. 2014, 50 (85), 12941–12943. [Google Scholar] [CrossRef] [PubMed]
- Takachi, M.; Fukuzumi, Y.; Moritomo, Y. Na+ Diffusion Kinetics in Nanoporous Metal-Hexacyanoferrates. Dalton Transactions 2016, 45 (2), 458–461. [Google Scholar] [CrossRef]
- You, Y.; Wu, X.-L.; Yin, Y.-X.; Guo, Y.-G. A Zero-Strain Insertion Cathode Material of Nickel Ferricyanide for Sodium-Ion Batteries. J Mater Chem A Mater 2013, 1 (45), 14061. [Google Scholar] [CrossRef]
- Qian, J.; Wu, C.; Cao, Y.; Ma, Z.; Huang, Y.; Ai, X.; Yang, H. Prussian Blue Cathode Materials for Sodium-Ion Batteries and Other Ion Batteries. Adv Energy Mater 2018, 8 (17), 1702619. [Google Scholar] [CrossRef]
- Mullaliu, A.; Aquilanti, G.; Conti, P.; Plaisier, J. R.; Fehse, M.; Stievano L.; Giorgetti M. Copper electroactivity in Prussian blue-based cathode disclosed by operando XAS, J Phys Chem C 2018, 122 (28), 15868-15877. [CrossRef]
- Wessells, C. D.; Peddada, S. V.; Huggins, R. A.; Cui, Y. Nickel Hexacyanoferrate Nanoparticle Electrodes For Aqueous Sodium and Potassium Ion Batteries. Nano Lett 2011, 11 (12), 5421–5425. [Google Scholar] [CrossRef] [PubMed]
- Imanishi, N.; Morikawa, T.; Kondo, J.; Takeda, Y.; Yamamoto, O.; Kinugasa, N.; Yamagishi, T. Lithium Intercalation Behavior into Iron Cyanide Complex as Positive Electrode of Lithium Secondary Battery. J Power Sources 1999, 79 (2), 215–219. [Google Scholar] [CrossRef]
- Eftekhari, A. Potassium Secondary Cell Based on Prussian Blue Cathode. J Power Sources 2004, 126 (1–2), 221–228. [Google Scholar] [CrossRef]
- Wessells, C. D.; Huggins, R. A.; Cui, Y. Copper Hexacyanoferrate Battery Electrodes with Long Cycle Life and High Power. Nat Commun 2011, 2 (1), 550. [Google Scholar] [CrossRef] [PubMed]
- Wang, R. Y.; Shyam, B.; Stone, K. H.; Weker, J. N.; Pasta, M.; Lee, H.; Toney, M. F.; Cui, Y. Reversible Multivalent (Monovalent, Divalent, Trivalent) Ion Insertion in Open Framework Materials. Adv Energy Mater 2015, 5 (12). [Google Scholar] [CrossRef]
- Mizuno, Y.; Okubo, M.; Hosono, E.; Kudo, T.; Ohishi, K.; Okazawa, A.; Kojima, N.; Kurono, R.; Nishimura, S.; Yamada, A. Electrochemical Mg2+ Intercalation into a Bimetallic CuFe Prussian Blue Analog in Aqueous Electrolytes. J Mater Chem A Mater 2013, 1 (42), 13055. [Google Scholar] [CrossRef]
- Park, H.; Lee, Y.; Ko, W.; Choi, M.; Ku, B.; Ahn, H.; Kim, J.; Kang, J.; Yoo, J.; Kim, J. Review on Cathode Materials for Sodium- and Potassium-Ion Batteries: Structural Design with Electrochemical Properties. Batter Supercaps 2023, 6 (3). [Google Scholar] [CrossRef]
- Li, M.; Bina, A.; Maisuradze, M.; Giorgetti, M. Symmetric Aqueous Batteries of Titanium Hexacyanoferrate in Na+, K+, and Mg2+ Media. Batteries 2021, 8 (1), 1. [Google Scholar] [CrossRef]
- Li, M.; Maisuradze, M.; Sciacca, R.; Hasa, I.; Giorgetti, M. A Structural Perspective on Prussian Blue Analogues for Aqueous Zinc-Ion Batteries. Batter Supercaps 2023. [Google Scholar] [CrossRef]
- Lu, Y.; Wang, L.; Cheng, J.; Goodenough, J. B. Prussian Blue: A New Framework of Electrode Materials for Sodium Batteries. Chemical Communications 2012, 48 (52), 6544. [Google Scholar] [CrossRef]
- Mullaliu, A.; Asenbauer, J.; Aquilanti, G.; Passerini, S.; Giorgetti, M. Highlighting the Reversible Manganese Electroactivity in Na-Rich Manganese Hexacyanoferrate Material for Li- and Na-Ion Storage. Small Methods 2020, 4 (1), 1900529. [Google Scholar] [CrossRef]
- Cao, T.; Zhang, F.; Chen, M.; Shao, T.; Li, Z.; Xu, Q.; Cheng, D.; Liu, H.; Xia, Y. Cubic Manganese Potassium Hexacyanoferrate Regulated by Controlling of the Water and Defects as a High-Capacity and Stable Cathode Material for Rechargeable Aqueous Zinc-Ion Batteries. ACS Appl Mater Interfaces 2021, 13 (23), 26924–26935. [Google Scholar] [CrossRef] [PubMed]
- Deng, W.; Li, Z.; Ye, Y.; Zhou, Z.; Li, Y.; Zhang, M.; Yuan, X.; Hu, J.; Zhao, W.; Huang, Z.; Li, C.; Chen, H.; Zheng, J.; Li, R. Zn 2+ Induced Phase Transformation of K 2 MnFe(CN) 6 Boosts Highly Stable Zinc-Ion Storage. Adv Energy Mater 2021, 11 (31). [Google Scholar] [CrossRef]
- Ni, G.; Hao, Z.; Zou, G.; Xu, X.; Hu, B.; Cao, F.; Zhou, C. Potassium Manganese Hexacyanoferrate with Improved Lifespan in Zn(CF 3 SO 3 ) 2 Electrolyte for Aqueous Zinc-Ion Batteries. Sustain Energy Fuels 2022, 6 (5), 1353–1361. [Google Scholar] [CrossRef]
- Fu, H.; Liu, C.; Zhang, C.; Ma, W.; Wang, K.; Li, Z.; Lu, X.; Cao, G. Enhanced Storage of Sodium Ions in Prussian Blue Cathode Material through Nickel Doping. J Mater Chem A Mater 2017, 5 (20), 9604–9610. [Google Scholar] [CrossRef]
- Yang, D.; Xu, J.; Liao, X.-Z.; He, Y.-S.; Liu, H.; Ma, Z.-F. Structure Optimization of Prussian Blue Analogue Cathode Materials for Advanced Sodium Ion Batteries. Chem. Commun. 2014, 50 (87), 13377–13380. [Google Scholar] [CrossRef] [PubMed]
- Maisuradze, M.; Li, M.; Aquilanti, G.; Plaisier, J.; Giorgetti, M. Characterization of Partially Ni Substituted Manganese Hexacyanoferrate Cathode Material. Mater Lett 2023, 330, 133259. [Google Scholar] [CrossRef]
- Karydas, A. G.; Czyzycki, M.; Leani, J. J.; Migliori, A.; Osan, J.; Bogovac, M.; Wrobel, P.; Vakula, N.; Padilla-Alvarez, R.; Menk, R. H.; Gol, M. G.; Antonelli, M.; Tiwari, M. K.; Caliri, C.; Vogel-Mikuš, K.; Darby, I.; Kaiser, R. B. An IAEA Multi-Technique X-Ray Spectrometry Endstation at Elettra Sincrotrone Trieste: Benchmarking Results and Interdisciplinary Applications. J Synchrotron Radiat 2018, 25 (1), 189–203. [Google Scholar] [CrossRef]
- Jark W; Grenci G. Focusing X-Rays in Two Dimensions upon Refraction in an Inclined Prism. In Proc. SPIE – Advances in X-Ray/EUV Optics and Components IX 2014; 9207, p 92070A. [CrossRef]
- Solé, V. A.; Papillon, E.; Cotte, M.; Walter, Ph.; Susini, J. A Multiplatform Code for the Analysis of Energy-Dispersive X-Ray Fluorescence Spectra. Spectrochim Acta Part B At Spectrosc 2007, 62 (1), 63–68. [Google Scholar] [CrossRef]
- Ravel B.; Newville, M. ATHENA , ARTEMIS , HEPHAESTUS : data analysis for X-ray absorption spectroscopy using IFEFFIT, J Synchrotron Radiat 2005, 12 (4), 537–541. [CrossRef]
- Rebuffi, L.; Plaisier, J. R.; Abdellatief, M.; Lausi, A.; Scardi, P. MCX: A Synchrotron Radiation Beamline for X-ray Diffraction Line Profile Analysis. Z Anorg Allg Chem 2014, 640 (15), 3100–3106. [Google Scholar] [CrossRef]
- Plaisier, J. R.; Nodari, L.; Gigli, L.; Rebollo San Miguel, E. P.; Bertoncello, R.; Lausi, A. The X-Ray Diffraction Beamline MCX at Elettra: A Case Study of Non-Destructive Analysis on Stained Glass. ACTA IMEKO 2017, 6 (3), 71. [Google Scholar] [CrossRef]
- Toby, B. H.; Von Dreele, R. B. GSAS-II : The Genesis of a Modern Open-Source All Purpose Crystallography Software Package. J Appl Crystallogr 2013, 46 (2), 544–549. [Google Scholar] [CrossRef]
- Li, M.; Sciacca, R.; Maisuradze, M.; Aquilanti, G.; Plaisier, J.; Berrettoni, M.; Giorgetti, M. Electrochemical Performance of Manganese Hexacyanoferrate Cathode Material in Aqueous Zn-Ion Battery. Electrochim Acta 2021, 400, 139414. [Google Scholar] [CrossRef]
- Rodríguez-Hernández, J.; Reguera, E.; Lima, E.; Balmaseda, J.; Martínez-García, R.; Yee-Madeira, H. An Atypical Coordination in Hexacyanometallates: Structure and Properties of Hexagonal Zinc Phases. J. Phys. Chem. Solids 2007, 68 (9), 1630–1642. [Google Scholar] [CrossRef]
- Sciacca, R.; Zamponi, S.; Berrettoni, M.; Giorgetti, M. Stable Films of Zinc-Hexacyanoferrate: Electrochemistry and Ion Insertion Capabilities. J. Solid State Electrochem. 2022, 26 (1), 63–72. [Google Scholar] [CrossRef]
- Alfaruqi, M. H.; Mathew, V.; Gim, J.; Kim, S.; Song, J.; Baboo, J. P.; Choi, S. H.; Kim, J. Electrochemically Induced Structural Transformation in a γ-MnO 2 Cathode of a High Capacity Zinc-Ion Battery System. Chem. Mater. 2015, 27 (10), 3609–3620. [Google Scholar] [CrossRef]
- Huang, C.; Wu, C.; Zhang, Z.; Xie, Y.; Li, Y.; Yang, C.; Wang, H. Crystalline and Amorphous MnO2 Cathodes with Open Framework Enable High-Performance Aqueous Zinc-Ion Batteries. Front Mater Sci 2021, 15 (2), 202–215. [Google Scholar] [CrossRef]
Figure 1.
Normalized 2D-XRF maps of 30%NiMnHCF Pristine ex situ electrode: (a) Mn, (b) Ni, (c) Fe. Intensity scale is color-based (red = high intensity; blue = low intensity), length scale – vertical bar 1000 μm (200 μm x 5 px), horizontal bar 700 μm (140 μm x 5 px).
Figure 1.
Normalized 2D-XRF maps of 30%NiMnHCF Pristine ex situ electrode: (a) Mn, (b) Ni, (c) Fe. Intensity scale is color-based (red = high intensity; blue = low intensity), length scale – vertical bar 1000 μm (200 μm x 5 px), horizontal bar 700 μm (140 μm x 5 px).
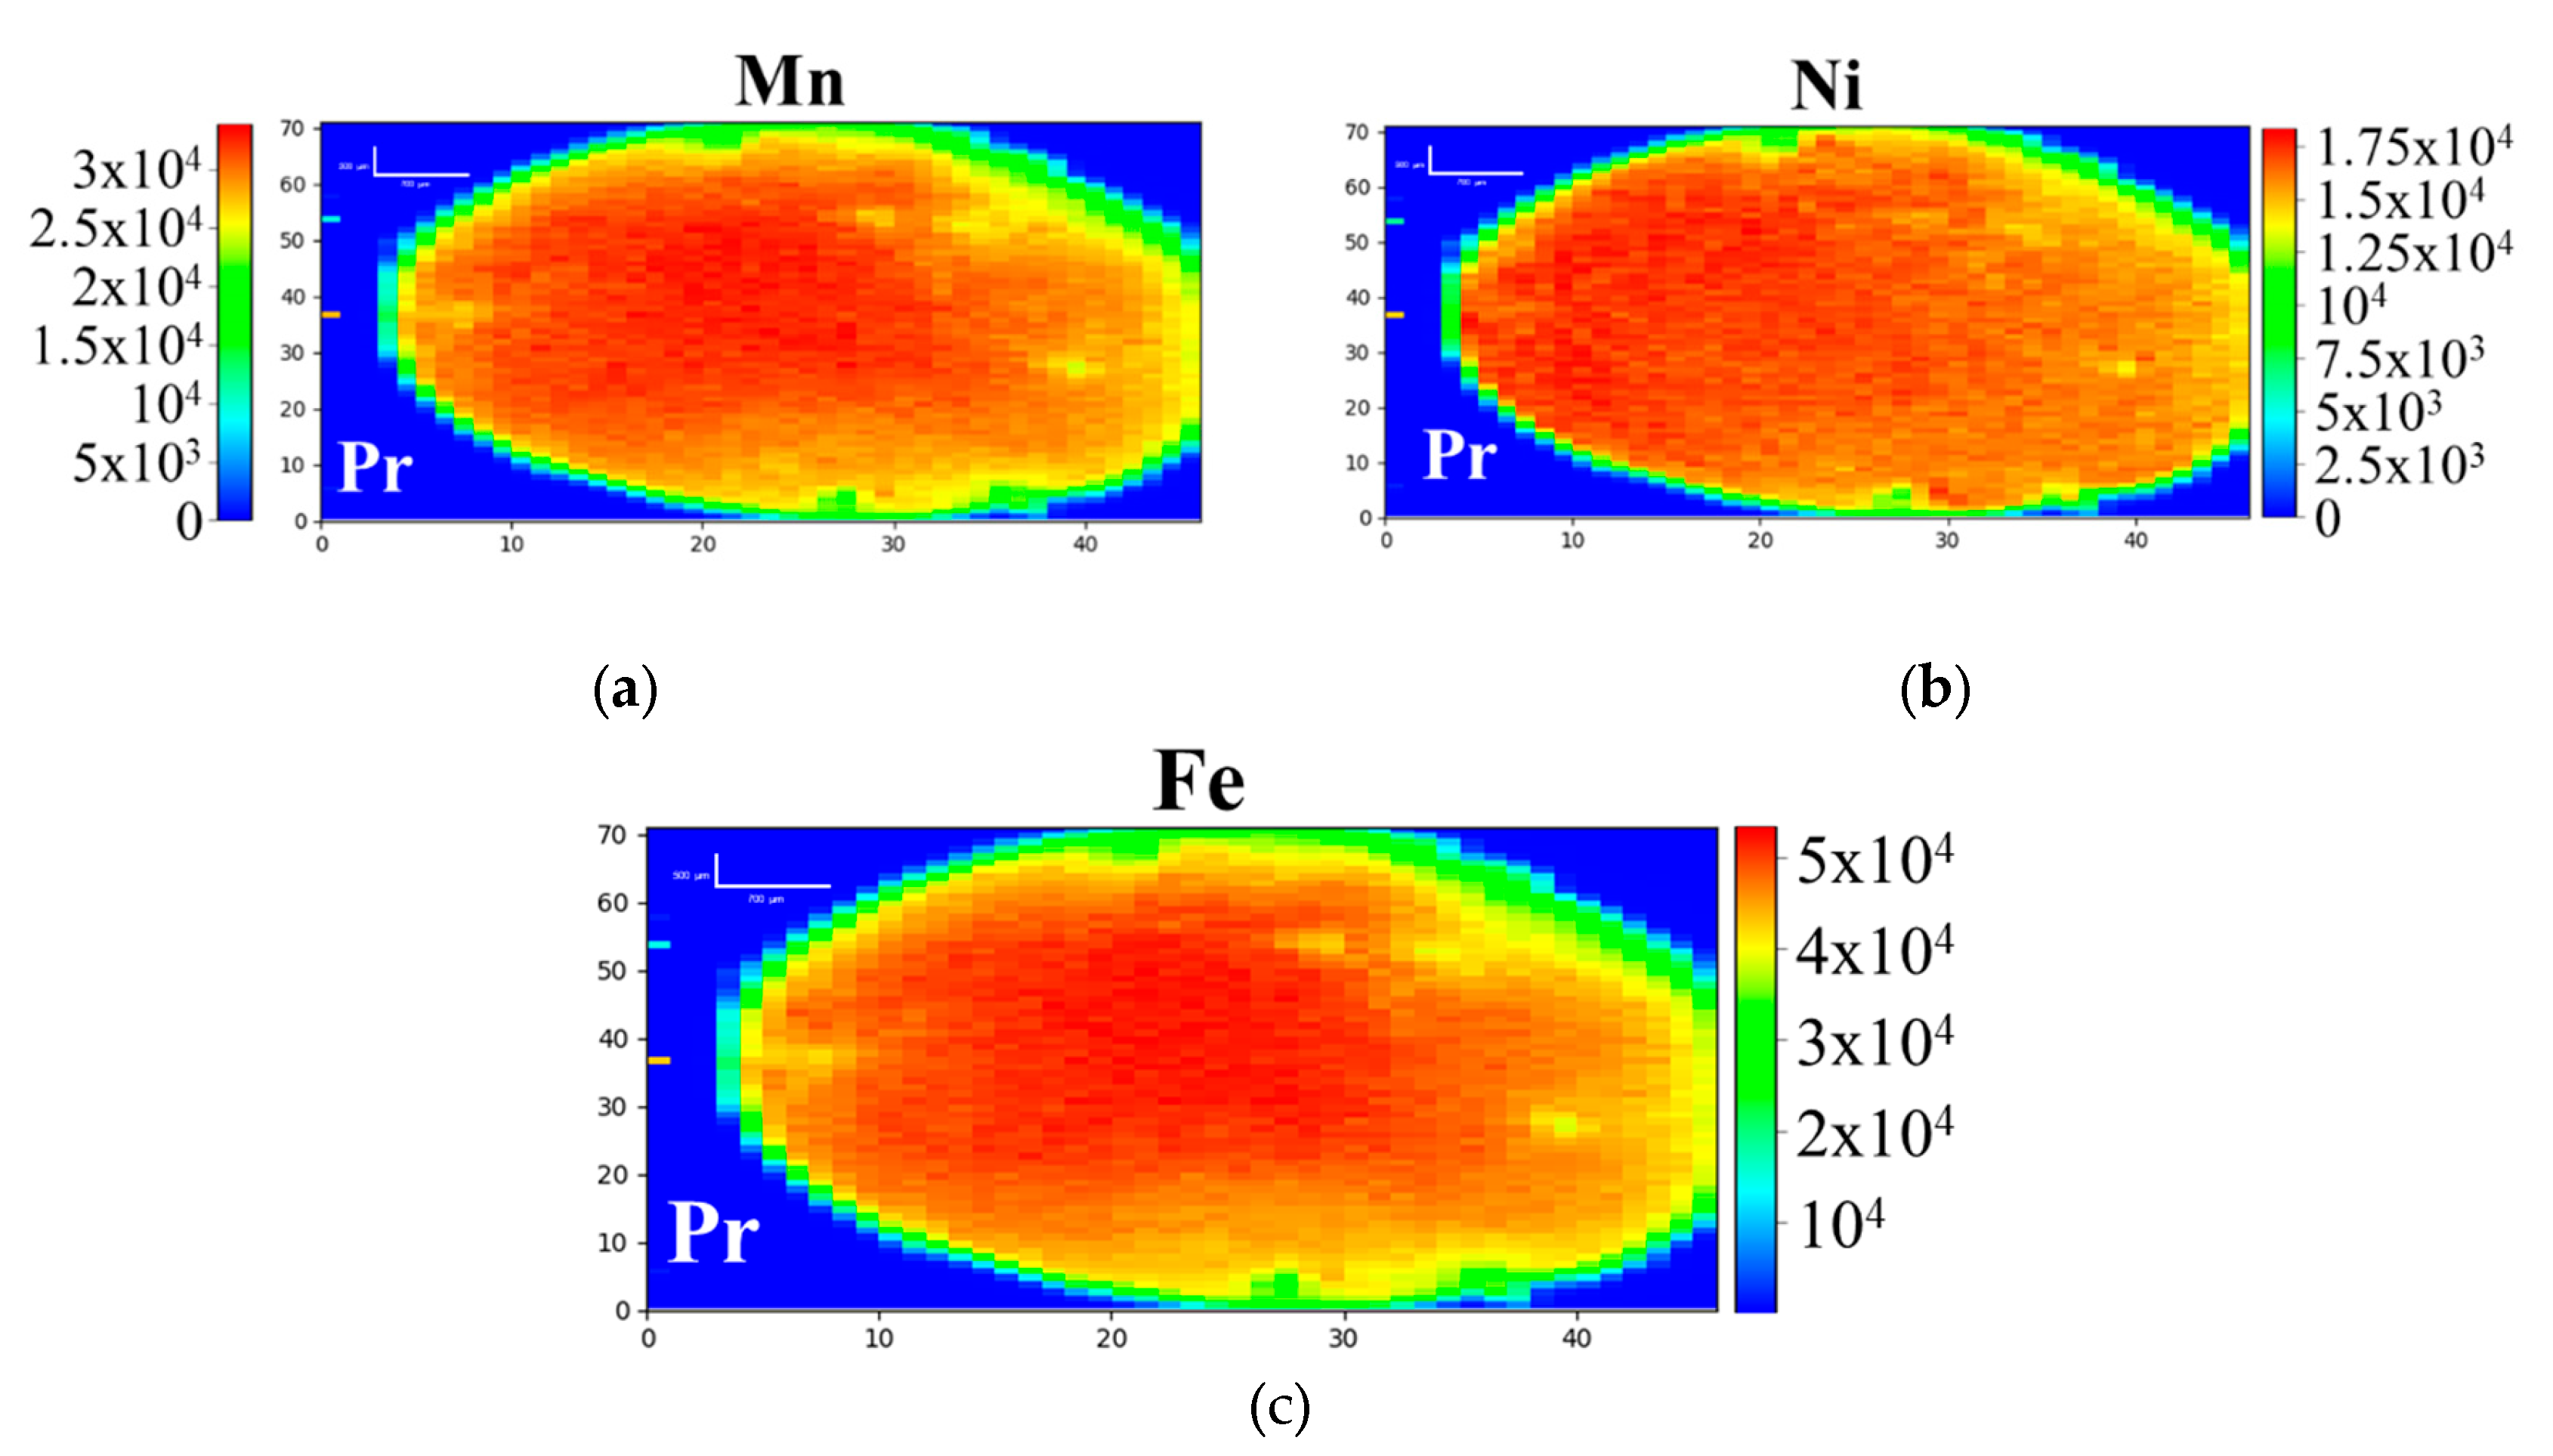
Figure 2.
Normalized 2D-XRF maps of 30%NiMnHCF C1 ex situ electrode: (a) Mn, (b) Zn, (c) Ni, (d) Mn and Zn overlay, Mn in red, Zn in blue. For (a), (b), and (c), intensity scale is color-based (red = high intensity; blue = low intensity), length scale – vertical bar 1000 μm (200 μm x 5 px), horizontal bar 700 μm (140 μm x 5 px).
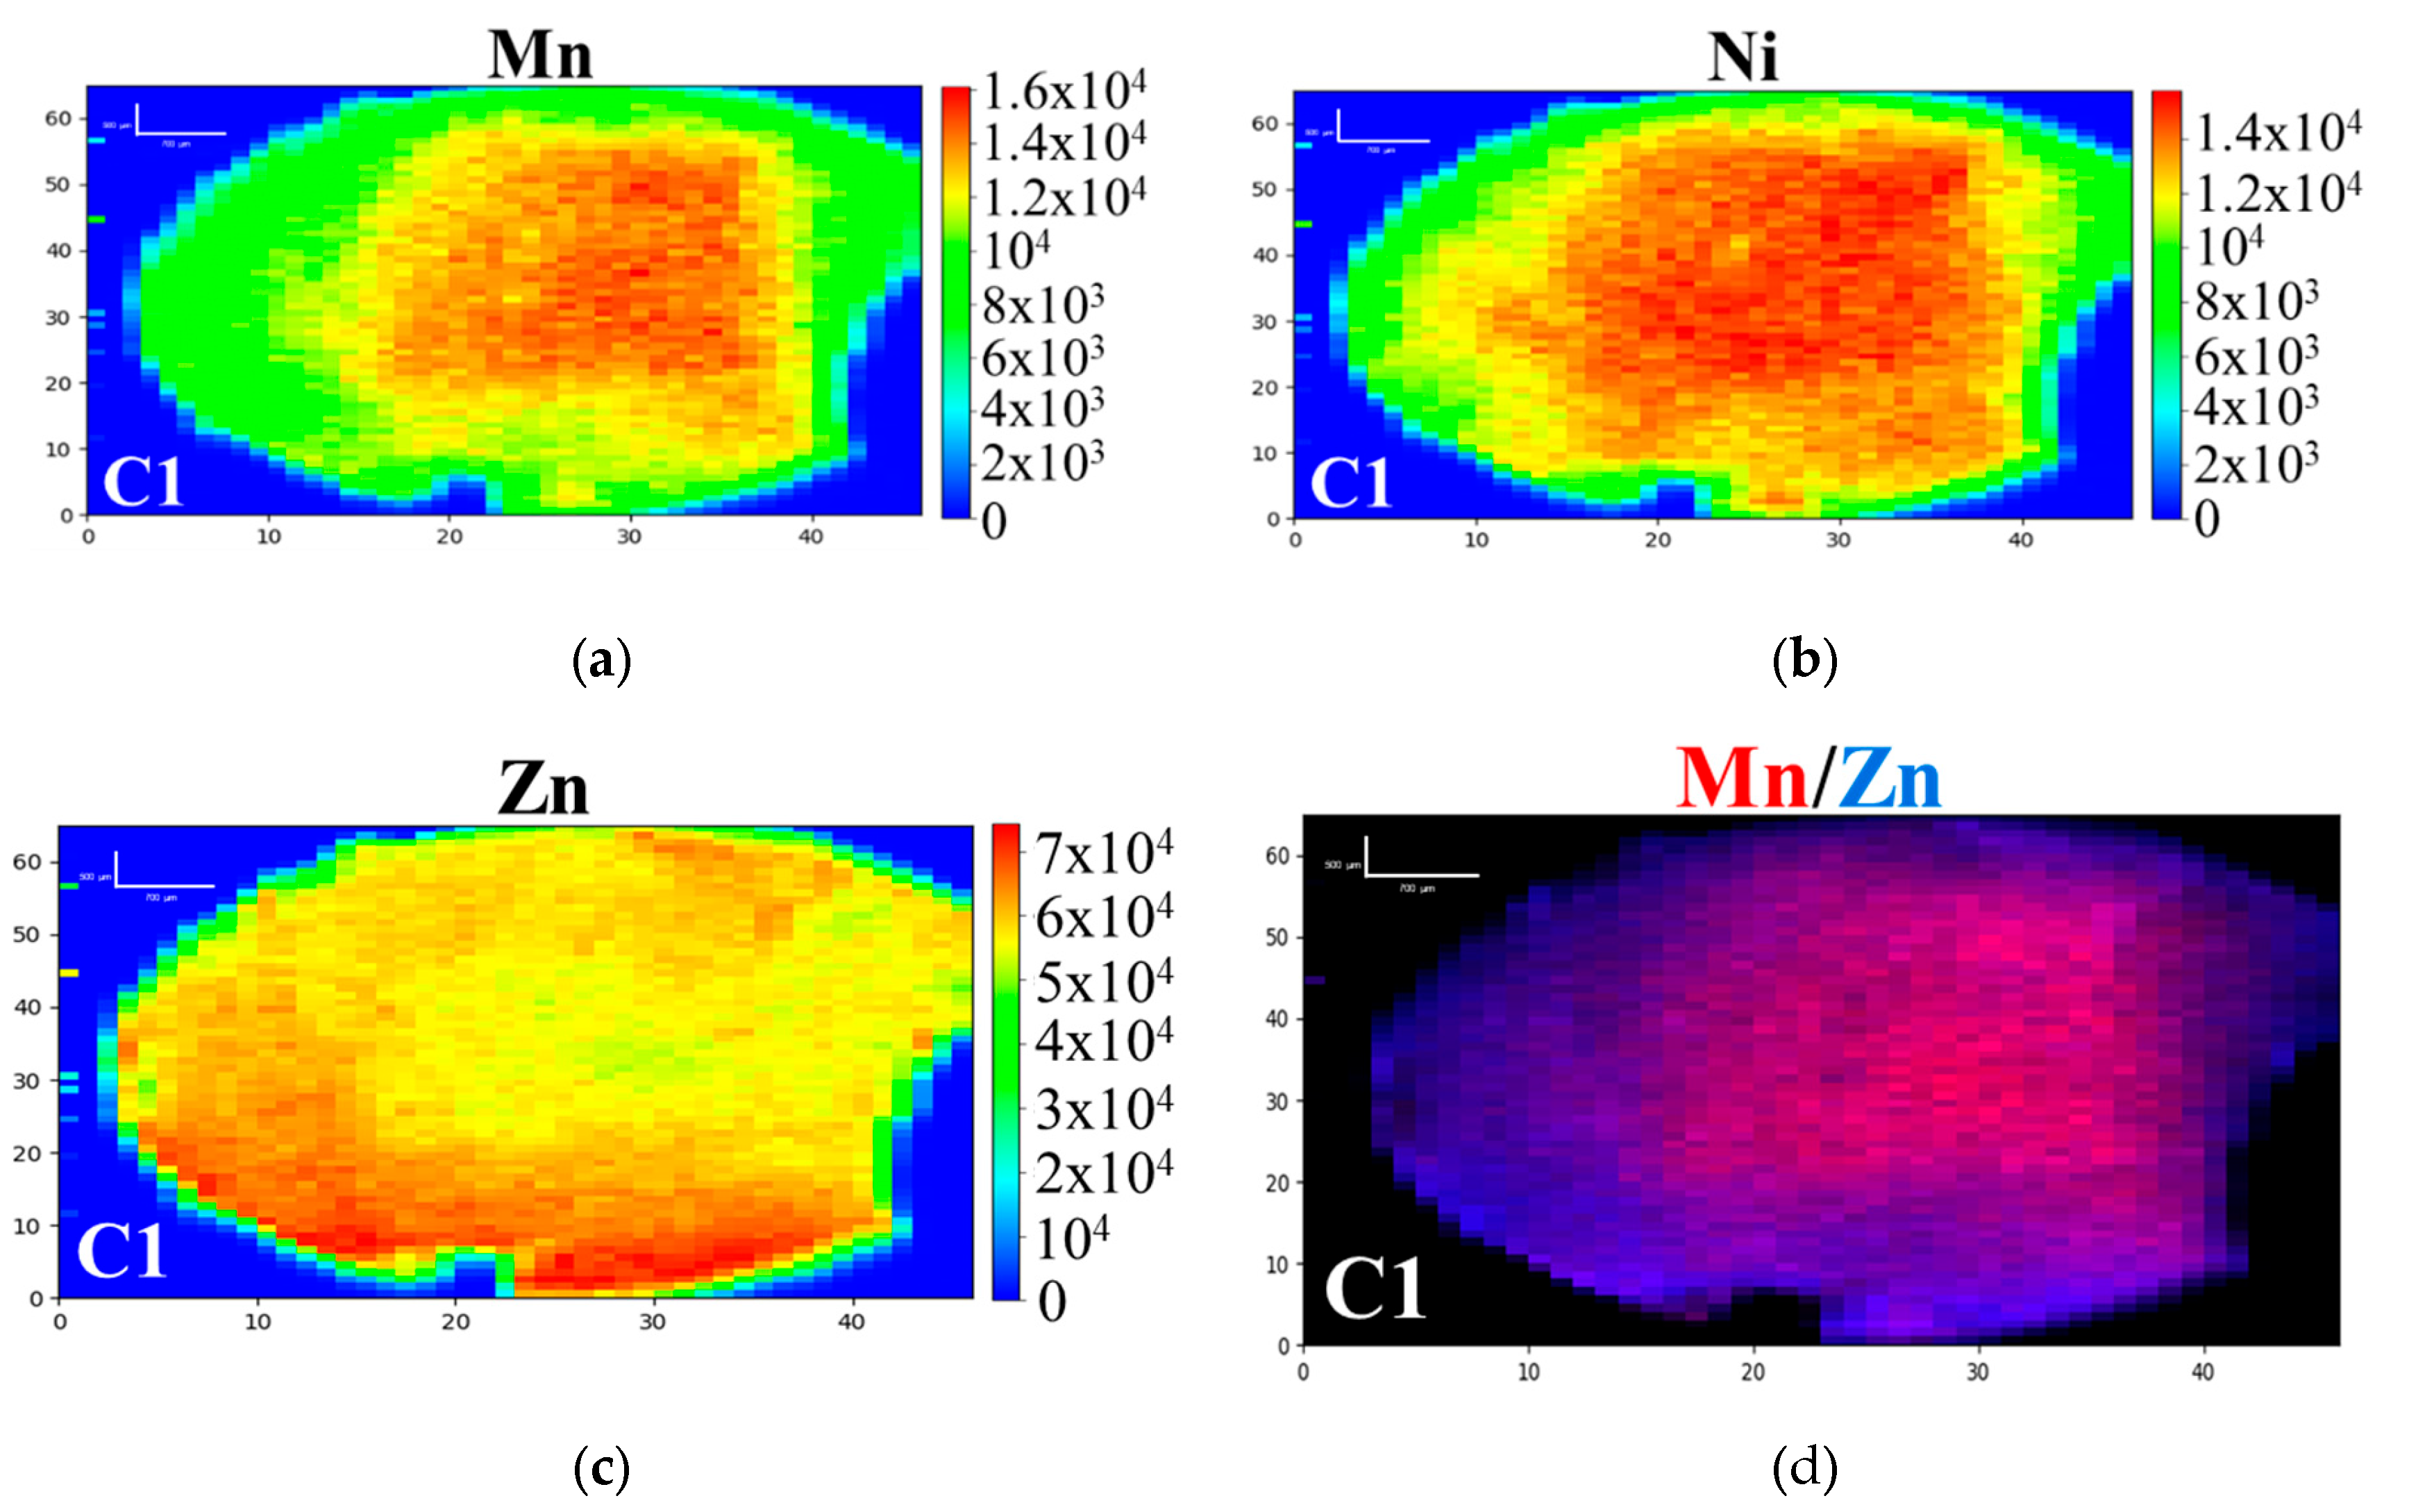
Figure 3.
2D-XRF semi-quantitative analysis results showing the dynamics of Mn, Ni and Zn vs Fe in ex-situ electrodes: (a) for the 10%NiMnHCF series, (b) for the 30%NiMnHCF series; the dynamics of (c) Mn vs Fe, (d) Ni vs. Fe, and (e) Zn vs Fe in the NiMnHCF electrodes.
Figure 3.
2D-XRF semi-quantitative analysis results showing the dynamics of Mn, Ni and Zn vs Fe in ex-situ electrodes: (a) for the 10%NiMnHCF series, (b) for the 30%NiMnHCF series; the dynamics of (c) Mn vs Fe, (d) Ni vs. Fe, and (e) Zn vs Fe in the NiMnHCF electrodes.
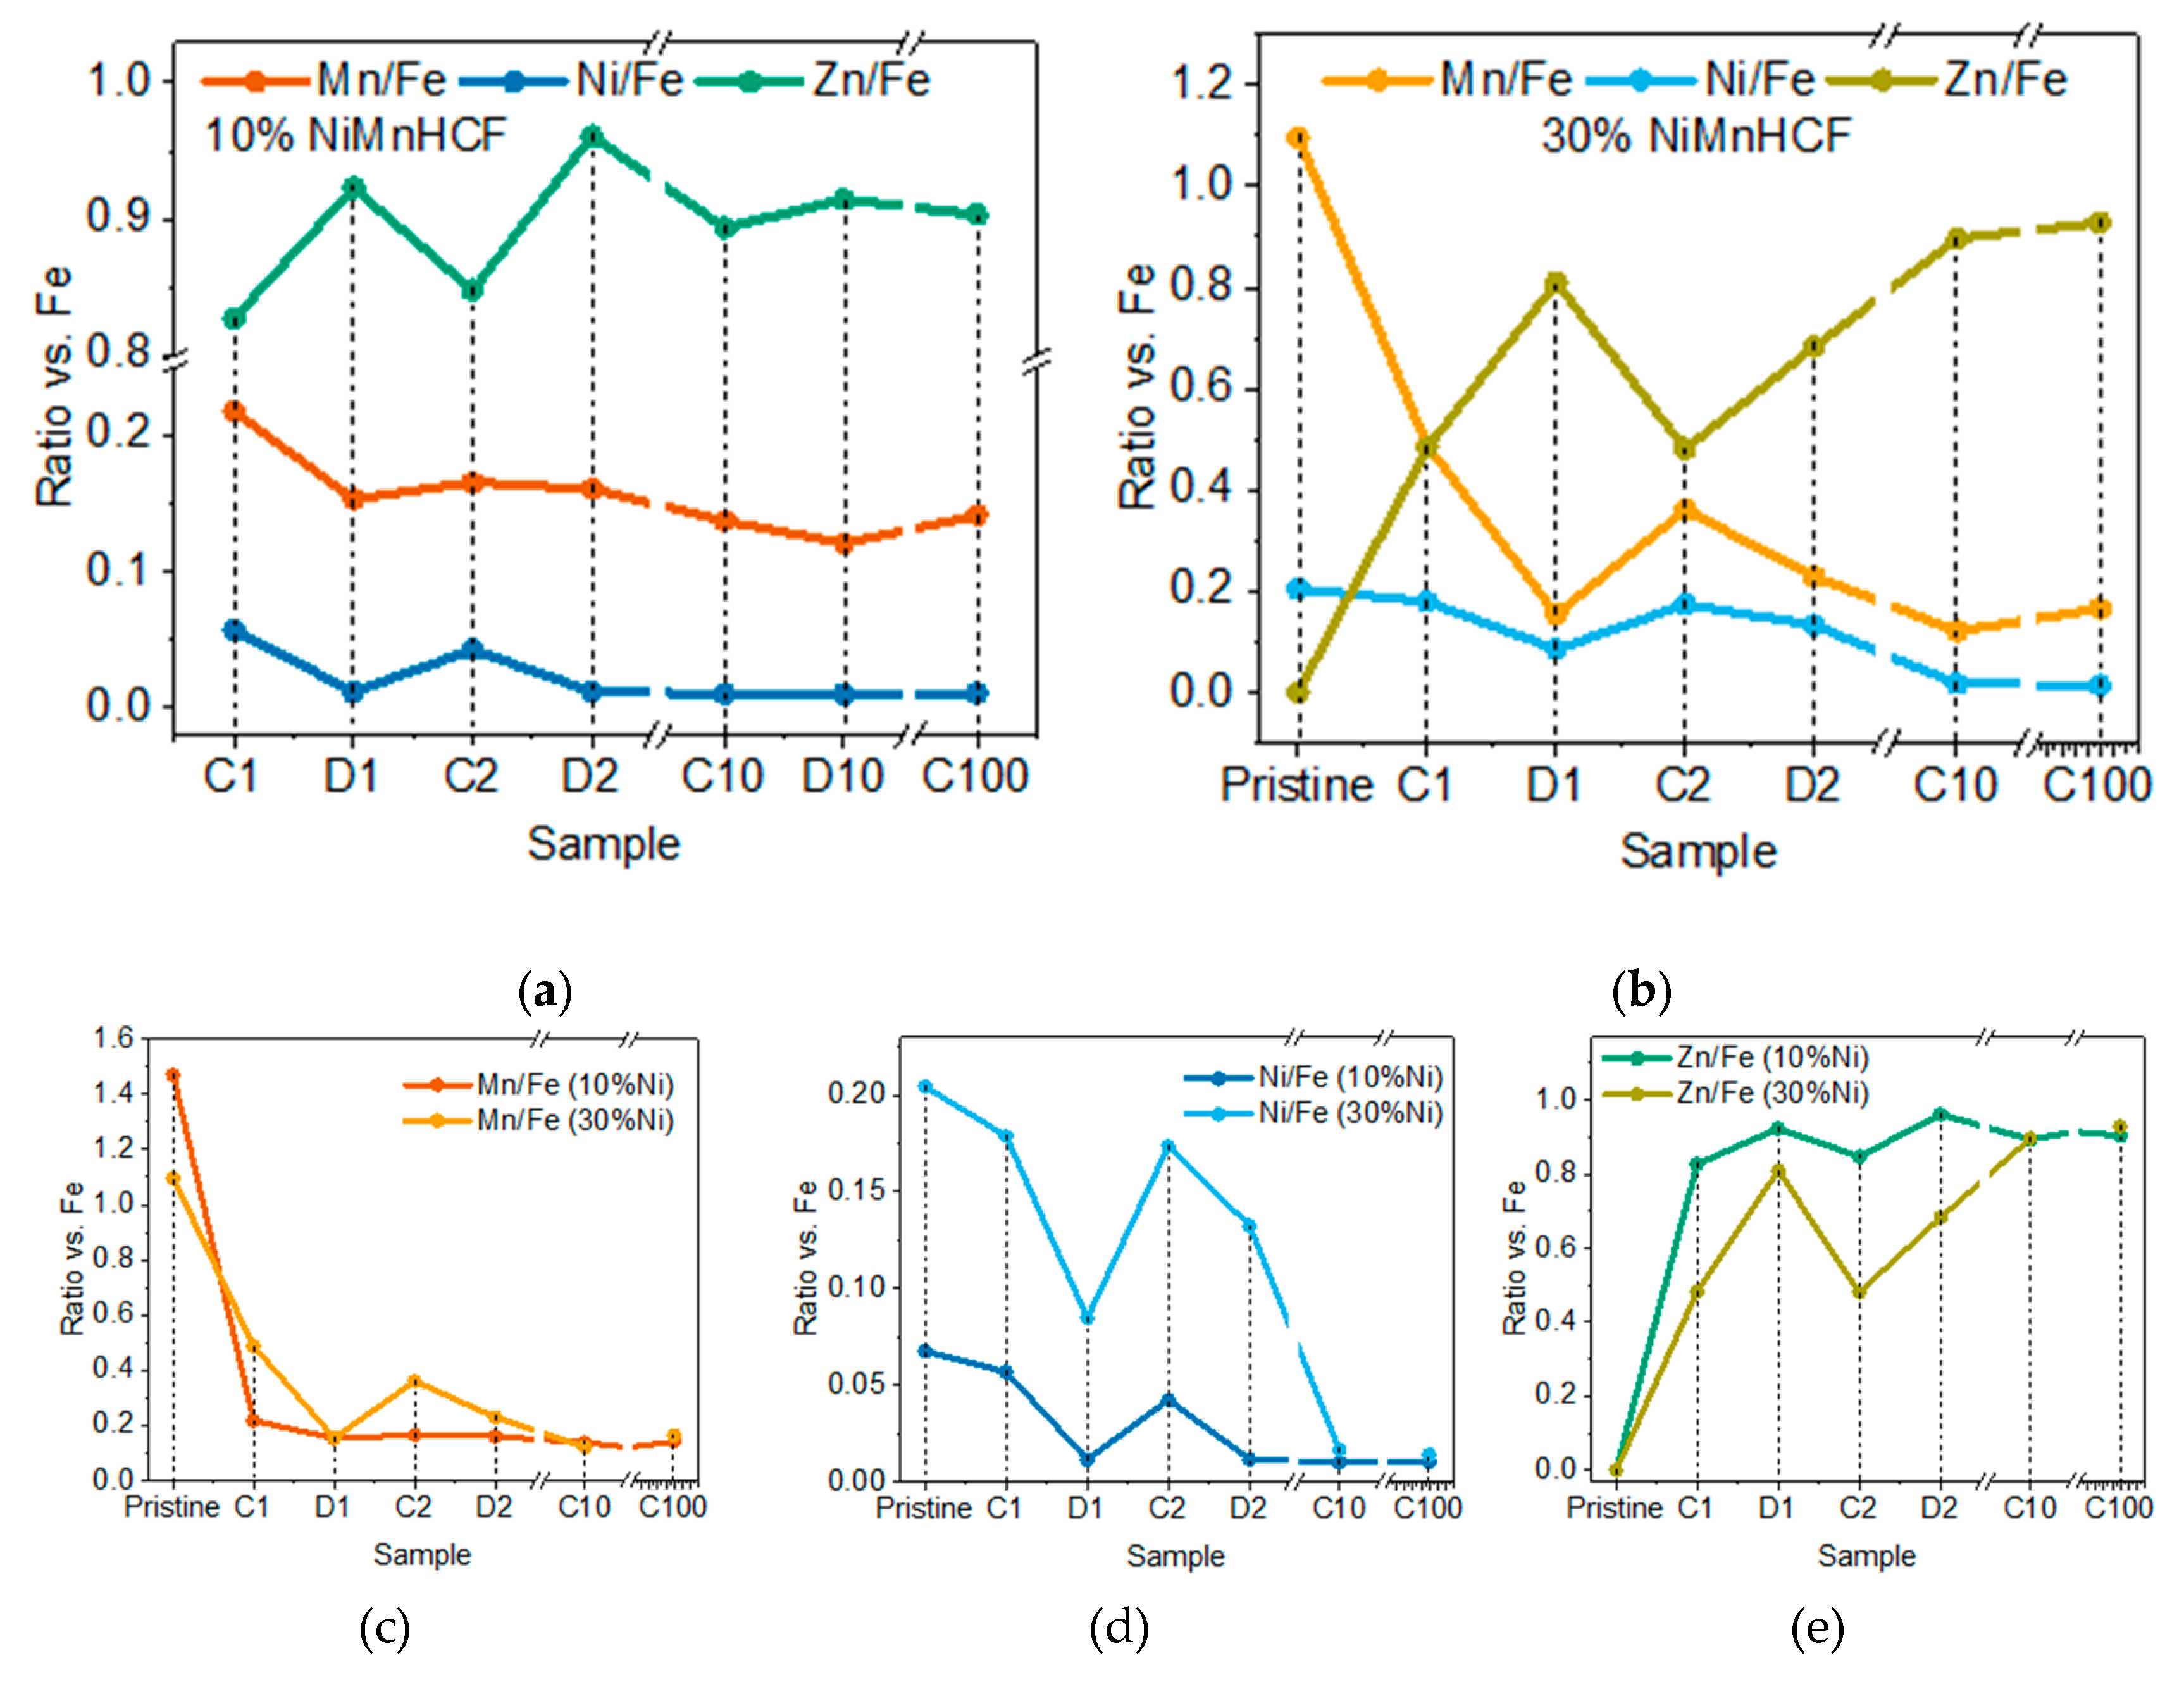
Figure 5.
Normalized 2D-XRF maps of 30%NiMnHCF ex situ electrode: (a) Mn C10, (b) Mn C100, (c) Zn C10, (d) Zn C100; intensity scale is color-based (red = high intensity; blue = low intensity); (e) Mn and Zn overlay of C10, (f) Mn and Zn overlay of C100; Mn in red, Zn in blue. Length scale – vertical bar 1000 μm (200 μm x 5 px), horizontal bar 700 μm (140 μm x 5 px).
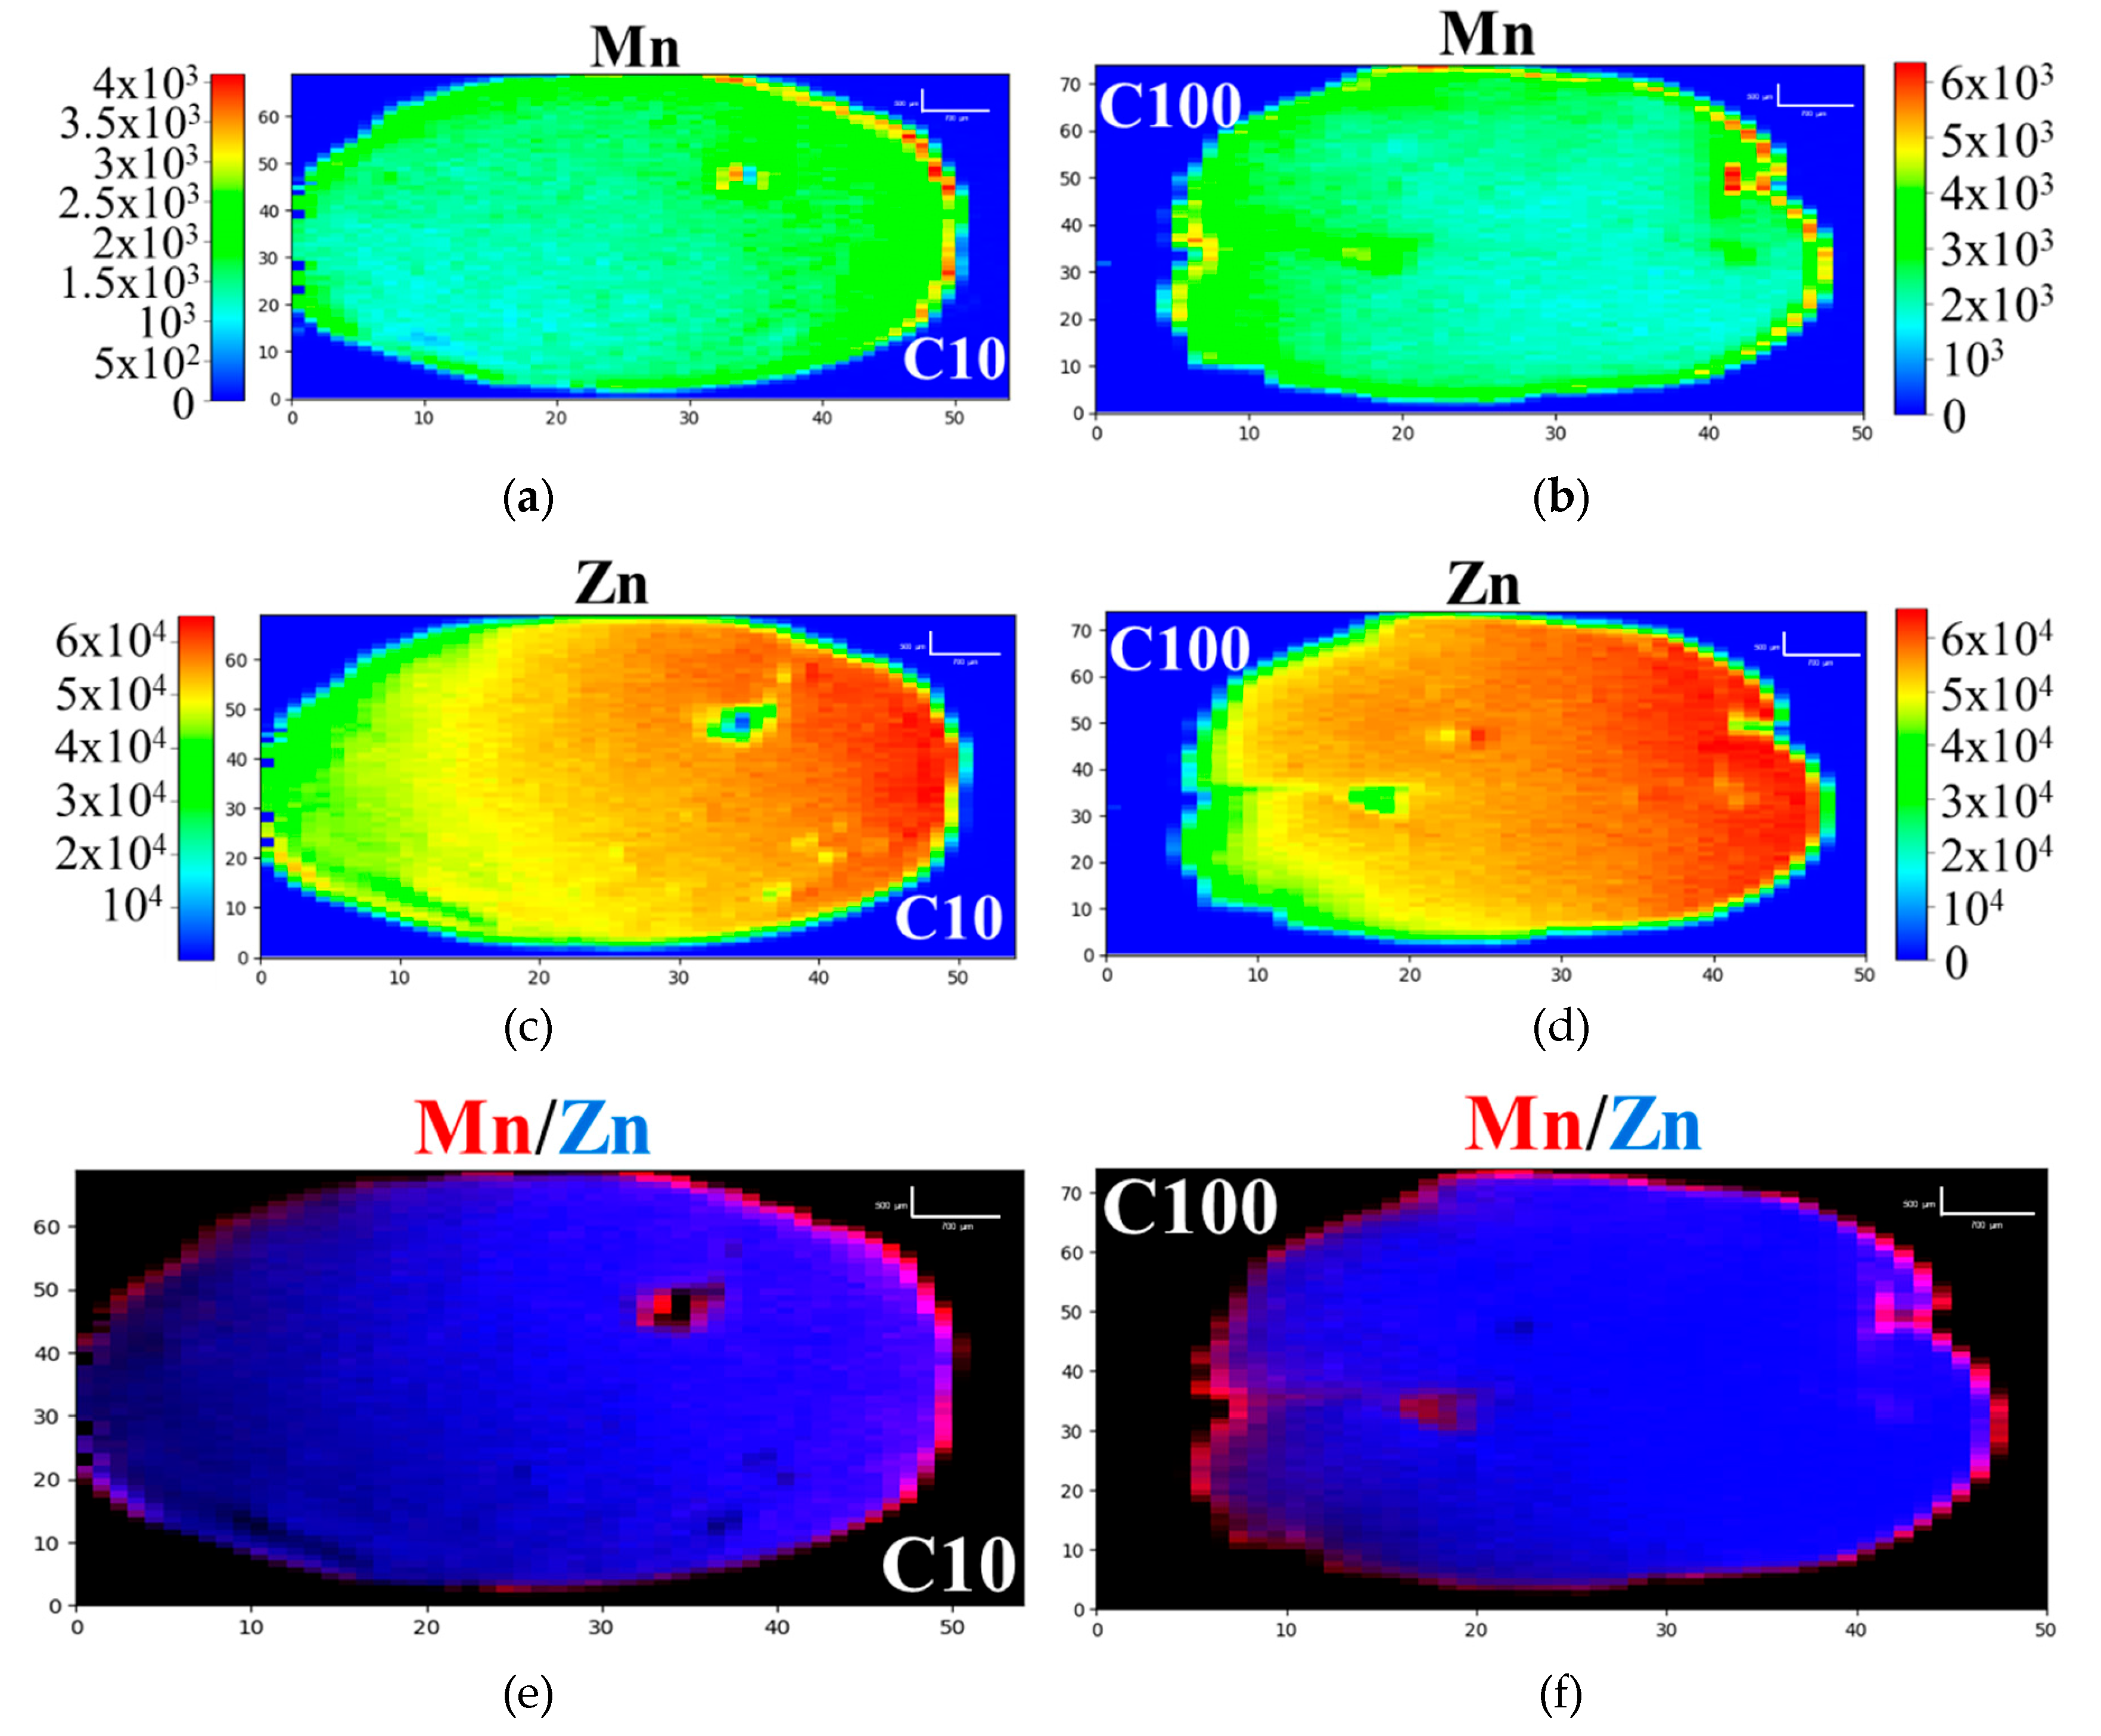
Figure 6.
ATR-FT-IR analysis results of pristine and cycled electrodes of (a) 10%NiMnHC, (b) 30%NiMnHCF; GCPL data of: (c) stability and efficiency of the C100 of 30%NiMnHCF, (b) discharge curve after the stabilization of 10% and 30%NiMnHCF (extracted from same cycle).
Figure 6.
ATR-FT-IR analysis results of pristine and cycled electrodes of (a) 10%NiMnHC, (b) 30%NiMnHCF; GCPL data of: (c) stability and efficiency of the C100 of 30%NiMnHCF, (b) discharge curve after the stabilization of 10% and 30%NiMnHCF (extracted from same cycle).
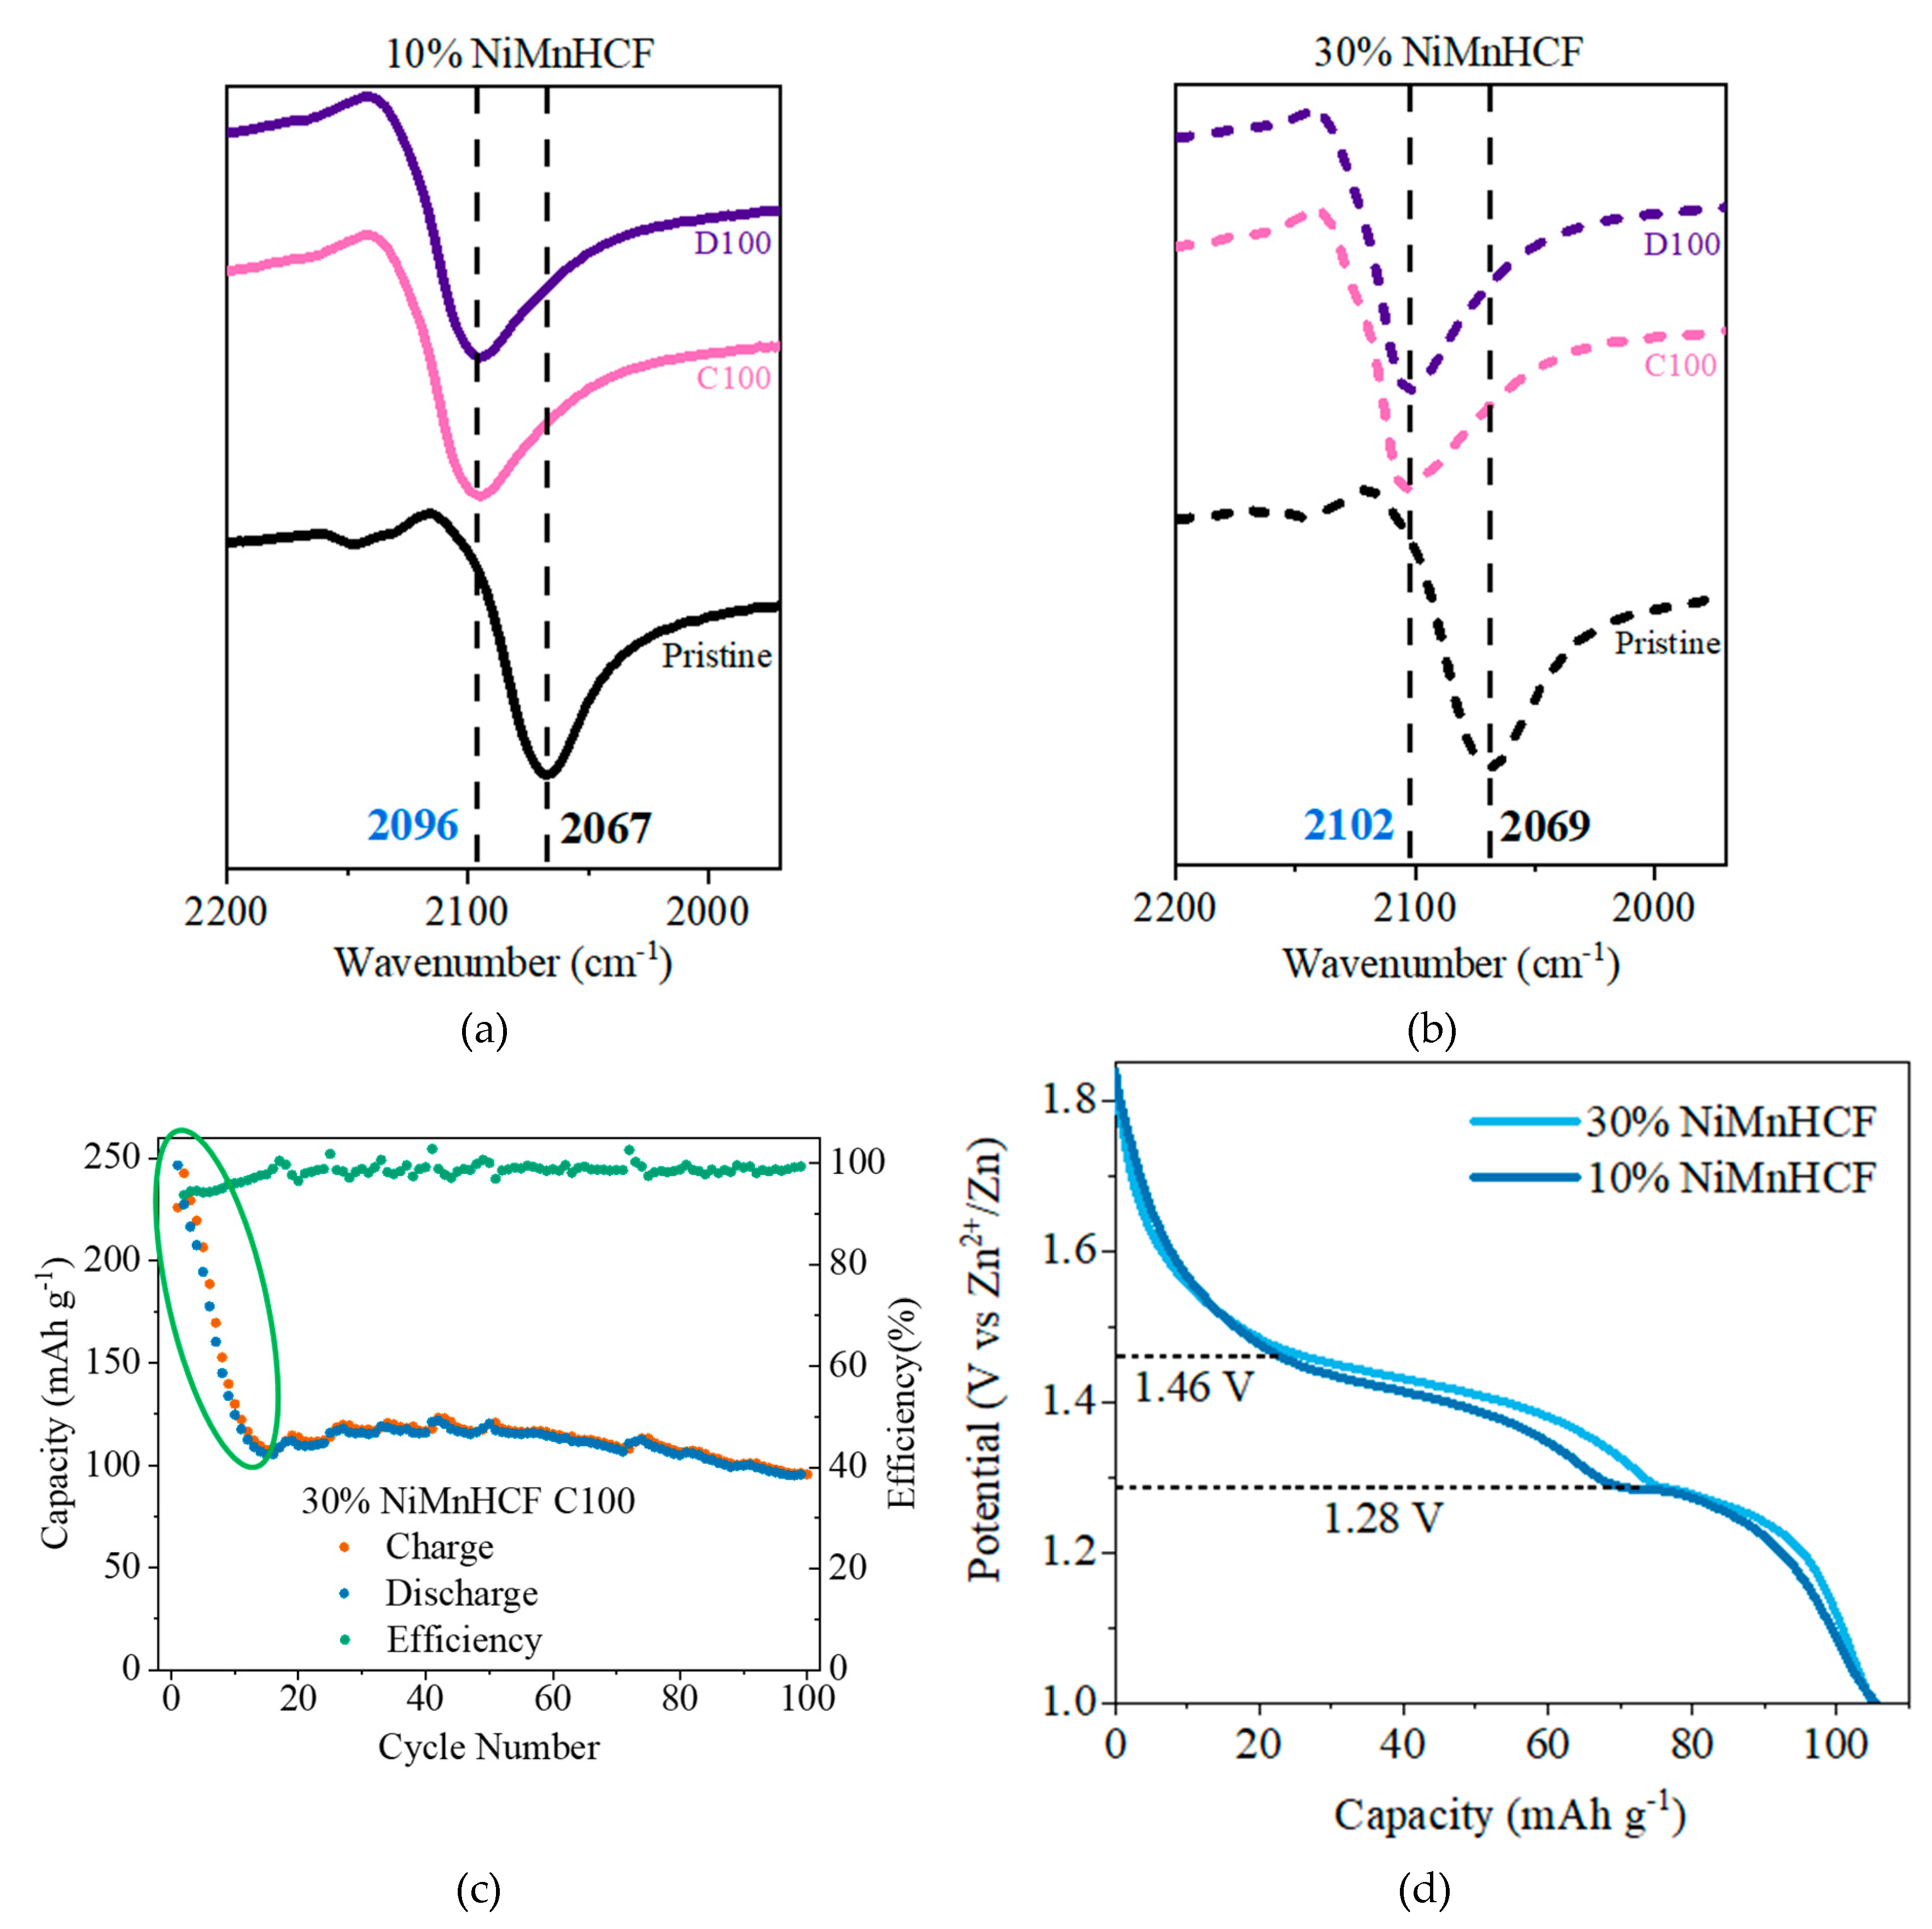
Figure 7.
PXRD measurement results of 30%NiMnHCF ex situ electrodes: (a) Pristine, (b) C1, (c) C10, D10 and C100.
Figure 7.
PXRD measurement results of 30%NiMnHCF ex situ electrodes: (a) Pristine, (b) C1, (c) C10, D10 and C100.


Table 1.
The list of samples analyzed with 2D-XRF and micro-XANES experiments.
| Samples | Description | 2D-XRF | XANES | ||
|---|---|---|---|---|---|
| 10%NiMnHCF | 30%NiMnHCF | 10%NiMnHCF | 30%NiMnHCF | ||
| Pristine | Fresh electrode | ✓ | ✓ | ✓ | ✓ |
| C1 | Charged after 1st cycle | ✓ | ✓ | ✓ | ✓ |
| D1 | Discharged after 1st cycle | ✓ | ✓ | ✓ | - |
| C2 | Charged after 2nd cycle | ✓ | ✓ | ✓ | - |
| D2 | Discharged after 2nd cycle | ✓ | ✓ | ✓ | - |
| C10 | Charged after 10th cycle | ✓ | ✓ | - | - |
| D10 | Discharged after 10th cycle | ✓ | - | - | - |
| C100 | Charged after 100th cycle | ✓ | ✓ | - | - |
Table 2.
The LCF results of Mn K-edge of 10%NiMnHCF C1 cathode hotspot with components: pristine, MnSO4, MnO, Mn3O4, Mn2O3 and MnO2.
Table 2.
The LCF results of Mn K-edge of 10%NiMnHCF C1 cathode hotspot with components: pristine, MnSO4, MnO, Mn3O4, Mn2O3 and MnO2.
| Pristine | MnSO4 | MnO | Mn3O4 | Mn2O3 | MnO2 | R-factor | Reduced χ2 | |
| Ratio | 0.159 | 0.148 | 0.001 | 0 | 0.089 | 0.604 | 0.00255 | 0.00059 |
| Error | 0.028 | 0.017 | 0.024 | 0.032 | 0.068 | 0.028 |
Table 3.
The cell parameters of different phases, presented in the series of 30%NiMnHCF cathodes.
| 30%NiMnHCF Samples | Cell parameters | ||||||||||
| F m-3m | P m-3m | R -3c | P 21/c | ||||||||
| a (Å) | a (Å) | a (Å) | c (Å) | a (Å) | b (Å) | c (Å) | β (º) | ||||
| Pristine | 10.33 | - | - | - | - | - | - | - | |||
| C1 | 10.29 | 11.82 | - | - | - | - | - | - | |||
| D1 | 10.22 | 11.79 | - | - | - | - | - | - | |||
| C2 | 10.33 | 11.88 | - | - | - | - | - | - | |||
| D2 | 10.16 | 11.76 | - | - | - | - | - | - | |||
| C10 | - | 11.91 | - | - | - | - | - | - | |||
| D10 | - | 11.88 | 12.42 | 32.85 | - | - | - | - | |||
| C50 | - | 11.99 | 12.48 | 32.94 | - | - | - | - | |||
| D50 | - | 12.05 | 12.46 | 32.74 | - | - | - | - | |||
| C100 | - | 11.94 | 12.37 | 33.08 | 6.23 | 13.77 | 9.91 | 125.45 | |||
| D100 | - | 11.99 | 12.48 | 32.94 | 6.16 | 13.69 | 9.77 | 126.84 | |||
Disclaimer/Publisher’s Note: The statements, opinions and data contained in all publications are solely those of the individual author(s) and contributor(s) and not of MDPI and/or the editor(s). MDPI and/or the editor(s) disclaim responsibility for any injury to people or property resulting from any ideas, methods, instructions or products referred to in the content. |
© 2024 by the authors. Licensee MDPI, Basel, Switzerland. This article is an open access article distributed under the terms and conditions of the Creative Commons Attribution (CC BY) license (http://creativecommons.org/licenses/by/4.0/).
Copyright: This open access article is published under a Creative Commons CC BY 4.0 license, which permit the free download, distribution, and reuse, provided that the author and preprint are cited in any reuse.


