Submitted:
16 March 2024
Posted:
18 March 2024
You are already at the latest version
Abstract
Energy distance is used to eigenvalue distributions in this new Wishart distribution study, providing a new perspective on high-dimensional data. Multivariate statistics relies on Wishart distribution to explain covariance matrices. This analysis shows how degrees of freedom and covariance matrix configurations affect eigenvalue dispersion. We use energy distance based on eigenvalue distributions to assess Wishart distribution differences without the "curse of dimensionality" via extensive simulation simulations. This approach improves measurement accuracy and processing efficiency in distribution comparisons and enables new analytical pathways in scientific fields that need data covariance comprehension. Our results show that degrees of freedom and matrix structure considerably affect energy distances, expanding the theoretical framework and practical applications of statistical models.
Keywords:
Energy Distance
; Energy Statistic
; Wishart distributions
; Goodness of Fit
; high-dimensional data.
1. Introduction
The Wishart distribution is a standard tool in multivariate statistics due to its importance as a multivariate probability distribution. John Wishart first presented this distribution in 1928[1]; it generalizes the matrix-variate gamma distribution straightforwardly, if the data follow a multivariate normal distribution, then the sample covariance matrices will have this distribution.
The Wishart distribution has been the subject of thorough investigation within the literature of multivariate analysis concerning its properties and theoretical foundations[2,3,4].
Let denote a random positive definite matrix with dimensions . If satisfies the probability density function (PDF), it is considered to adhere to a Wishart distribution with parameters and n. The PDF of in the Wishart distribution is given by:
where is an positive definite matrix, is the degrees of freedom, is the multivariate gamma function, and denotes the matrix trace. The sample covariance matrix’s probability distribution follows a Wishart distribution , where the columns of are i.i.d multivariate normal . In this context, represents the population covariance matrix.
The expected value and variance of are given by:
where ⊗ denotes the Kronecker product.
Multivariate statistics use the Wishart distribution for covariance matrix estimation, uncertainty analysis, and inference[5,6,7].The Wishart distributed data is a prior that pairs well with the inverse covariance matrix of a multivariate-normal random vector in Bayesian statistics. [6]. It is commonly used in random matrix spectral theory [8]. Furthermore, The Wishart distribution helps statisticians and machine learners identify covariance matrices and uncertainty.
Various machine learning methods employ Wishart distributions to represent covariance patterns in multivariate data and evaluate Rayleigh fading MIMO wireless channel performance in wireless communications[9][10]In finance, Wishart-based covariance forecasts improve portfolio risk assessment[11]. Wishart-based stochastic volatility models are used to analyze changes in financial time series covariance matrices[12].
Székely developed energy statistics to assess distribution differences using "potential energy"[13]. The energy distance E between Wishart-distributed matrix eigenvalue distributions is:
The empirical cumulative distribution functions (ECDFs) of eigenvalues from two Wishart-distributed matrices are and , with representing the i-th eigenvalue This energy distance measure quantifies structural differences in eigenvalue distributions, making Wishart-distributed data comparisons robust.
In this sense, the points of data that are statistically closer together have less "potential energy," while those that are farther away have more[14]. The metric of energy distance is applied to distinguish distributions and underlying statistical analysis and inference [15]. Energy statistics can evaluate differences between samples or proposed distributions based on observation distances [14]. These techniques are used for feature selection, nonparametric distribution equality tests, and independence testing [16].
Energy distance based on Wishart distribution eigenvalue distribution may be beneficial for distribution comparisons. Instead of comparing individual components in the covariance matrices, this method measures the disparity between the underlying structures of the distributions, as expressed by their eigenvalue distributions. High-dimensional Wishart distributions may make conventional methods computationally costly or unintelligible because of to the "curse of dimensionality." The energy distance technique leverages the unique properties of eigenvalue distributions to provide a precise and useful measure of dissimilarity across Wishart distributions, facilitating for comparisons and analysis in a variety of application fields.
There are some problems with using Szekely’s energy statistics directly with pairwise distances for Wishart distributions, even though they provide a strong foundation. First, Euclidean distance is unsuitable because covariance matrices, which express linear interactions between features, fall into non-Euclidean space. Additionally, by ignoring the underlying structure and connections of the covariance matrices and instead computing element-wise differences many valuable information would be lost. These distances also struggle to capture substantial differences across Wishart distributions due to scaling sensitivity and transformation invariance. These difficulties need alternate ways like the suggested energy distance based on eigenvalue distribution, which overcomes these constraints and uses distinctive properties of eigenvalue distributions for discrepancy measurement.
The eigenvalue distribution-based energy distance eliminates pairwise distance drawbacks. To address issues with non-Euclidean space, such as information loss and scale sensitivity, we focus on Wishart distribution eigenvalue distributions. By comparing empirical cumulative distribution functions (ECDFs) of eigenvalues, the energy distance measures Wishart sample structural dissimilarity. Dissimilarities may be difficult to discover with pairwise distance.
2. Eigenvalue Decomposition for Wishart-Distributed Matrices
Understanding eigenvalue decomposition is crucial for understanding linear transformations in Wishart-distributed matrices with dimensions , where n indicates data dimensionality. The eigenvalues of , , are linked to their corresponding eigenvectors in non-increasing order, forming the eigenvector matrix with a dimension of . The decomposition procedure starts with the determination of the characteristic equation, , which results in the n eigenvalues, where represents an eigenvalue and is the identity matrix matching the dimensions of .
Subsequently, for each derived eigenvalue , its corresponding eigenvector is determined by solving , a system ensuring non-trivial solutions due to the determinant condition of being zero. Given the real and symmetric nature of in Wishart distributions, all are real and non-negative, and eigenvectors associated with distinct eigenvalues are orthogonal, i.e., for . Ultimately, the eigenvalue decomposition of is formulated as , where and consists of columns of eigenvectors. Decomposing the data represented by reveals its structure, including the variance (eigenvalues) and orientation (eigenvectors) of its major components.
2.1. Eigenvalues and Eigenvectors in Covariance Matrix
Eigenvalue decomposition is essential for understanding matrix behaviors, especially in covariance matrices, where eigenvalues and eigenvectors reveal data structure and variability. A covariance matrix, , outlines linear relationships between dataset features, forming a square matrix for p features, where each element denotes the covariance between the i-th and j-th features. Eigenvalues () of , derived from solving the characteristic equation where I is the identity matrix of corresponding dimensions, represent the variance amounts captured by linear data transformations, highlighting the spread or dispersion. Each eigenvalue is associated with a non-zero eigenvector (), defining the direction of maximum variance, obtained by solving , indicative of a homogeneous system. Eigenvectors corresponding to distinct eigenvalues are orthogonal, satisfying for , thereby ensuring independent variance directions in data space. The eigenvalue decomposition of is , where V is the matrix of eigenvectors and is the diagonal matrix containing eigenvalues, which reveals the structure of the covariance matrix. Further, Principal Component Analysis (PCA) uses eigenvalues and eigenvectors to emphasize the most significant variance directions of the data, reducing dimensionality while preserving important information.
2.2. Energy Distance for Discrepancy between Eigenvalue Distributions
Energy distance, conceptualized by Szekely, provides a quantitative measure for assessing the discrepancy between probability distributions, adapted in this context to evaluate the differences between eigenvalue distributions from Wishart-distributed matrices. Denote and as the i-th eigenvalues from two distinct Wishart-distributed matrices and , respectively, ordered non-increasingly. Let and represent the empirical cumulative distribution functions (ECDFs) for the eigenvalues of and , respectively. The ECDF at a specific value signifies the probability of an eigenvalue being less than or equal to , with n indicating the dimensionality of the matrices. The energy distance E between the two eigenvalue distributions is mathematically defined as in equation 4
where the discrepancy at each eigenvalue level is accentuated by the differences in ECDFs at each , with larger discrepancies indicating greater differences. The squared differences emphasize significant gaps, while summing across all n eigenvalues furnishes a comprehensive assessment.
The normalization factor ensures that the energy distance E remains non-negative and proportional to the count of eigenvalues. A higher value of E suggests significant differences between the eigenvalue distributions of the two matrices, indicative of a substantial discrepancy in their Wishart distributions. Conversely, a lower E reflects closer similarity between distributions. This metric, distinct from the Frobenius norm, specifically addresses structures inherent to eigenvalues, circumventing limitations associated with non-Euclidean space or loss of information, and thus provides a robust measure for matrix dissimilarity by leveraging the unique properties of eigenvalue distributions.
3. Simulation Study
This simulation study examines Wishart distribution eigenvalue distribution energy distance under many circumstances. Different degrees of freedom (v) will be studied to understand how Wishart distribution and eigenvalue dispersion affect energy distance. An analysis will be conducted to assess the influence of various configurations of the theoretical covariance matrix (), including the identity matrix () for uncorrelated features with identical eigenvalues, a diagonal matrix ( for distinct variances per feature, and structured matrices with specific correlation patterns. We will create Wishart-distributed matrices for each configuration and parameter combination for statistical simulation.
3.1. Exploration of Scenarios Impacting Energy Distance
Here, we focus on the impact of degrees of freedom (v) and theoretical covariance matrix structures () on energy distance.
3.1.1. Degrees of Freedom ()
We investigate how three degrees of freedom impact Wishart distribution and eigenvalue dispersion as follow:
- : Less degree of freedom leads to a more skewed distribution with a higher eigenvalue dispersion, which means a less stable eigenvalue spectrum.
- : At this moderate degree of freedom, a predicted equilibrium between the eigenvalue spread and distribution stability balances distribution features.
- : Higher degree of freedom denotes a distribution that approximates normality with a smaller eigenvalue variance, indicating a more stable and less variable distribution.
3.1.2. Theoretical Covariance Matrix ()
We investigate three covariance matrix configurations to determine their effect on energy distance in different data interrelationships:
- Identity Matrix (): Symbolizes uncorrelated features with equal variance (diagonal elements equal to 1, and off-diagonal elements being 0), leading to identical eigenvalues due to absent feature correlations.
- Diagonal Matrix with Varied Elements (): This configuration, varying diagonal elements (), introduces distinct variances per feature, from down to , aiming to scrutinize the effect of a gradient in variance on the eigenvalue distribution dynamics.
3.1.3. Structured Matrix with Correlation Patterns ()
Instills specific feature dependencies via a predefined structured covariance matrix, exemplified by:
introducing discernible positive correlations between select features, thereby influencing the resultant eigenvalue distributions compared to the initial scenarios.
Through these scenarios, we aim to unravel the nuanced responses of energy distance to alterations in the Wishart distributions’ structure and parameterization.
Figure 1 shows the integrated visual analysis of energy distance distributions across Identity, Diagonal, and Structured scenarios and degrees of freedom (DoF: 5, 10, 20). The degree of freedom (DoF) has a substantial impact on the dispersion and central tendency of distribution since bigger DoFs lead to more reduced distributions. The diversity of energy distance is significantly impacted by the structures of covariance matrices, as the Diagonal and Structured scenarios reveal larger distributions at lower DoFs. Visualizing Wishart-distributed matrices helps statistical modeling and analysis of high-dimensional data.
The covariance matrix structure and degrees of freedom in dealing with energy distances in Wishart-distributed matrices are shown to be strongly related. Specifically, matrices with fewer degrees of freedom have more energy distance variability, which predicts more eigenvalue distribution deviations. Energy distance distributions decrease with increasing degrees of freedom, thereby maintaining eigenvalue dispersion.In degrees of freedom, identity matrices vary little, whereas diagonal and structured matrices are more sensitive. This work shows a detailed relationship between matrix structure and statistical properties, shedding light on Wishart distributions in multivariate statistical research.
4. Discussion
Energy distance evolution in Wishart-distributed matrices with variable degrees of freedom and covariance structures is naturally conveyed through simulations. Parametric enhancements transform energy distances, conveniently appreciated through spatial renditions. Energy distance distributions are larger for reduced degrees of freedom matrices, signifying corresponding larger eigenvalue dispersions. As degrees of freedom increase, this behavior becomes progressively ameliorated, leveling off for higher-degree matrices. The Structure of the matrix identity diagonal is disclosed as mediating these distributions. Higher energy distances for both diagonal- and structured matrices identity matrices implies data correlations and variances affect eigenvalue distributions. These phenomena deliver a comprehensive understanding of differential eigenvalue distribution spread and similarity given influential factors, germane to Wishart distributions and data covariance estimates. Cognizant patterns and narratives conform to theoretical presuppositions and portend distinct multivariate statistical methodologies and data models.
5. Conclusion
In this study, we consider the effects of degrees of freedom and covariance matrix structures on energy distances in wishart distributed matrices in a large simulation setting. The results we obtained show that degrees of freedom and covariance matrix structure have strong influence on eigenvalue dispersion and energy distance distribution. It was observed that energy distance distributions tend to become narrower with larger degrees of freedom, thus suggesting that higher parameter values stabilize them. More crucially, the Identity, Diagonal, and Structured matrix settings indicate that eigenvalue dispersion is also conditioned on the underlying relationships of the data.
These results could offer practical utility to fitting statistical models and making data analysis in diverse fields such as finance, genetics, and environmental research where the structure of data covariance plays a critical role. Further, the results could serve to provide a body of empirical evidence accompanying theoretical predictions to further understand Wishart distributions and applications, adding to the existing pool of knowledge.
To confirm the practical application of these results, future research should expand this study to higher-dimensional settings, investigate distributional assumptions, and apply these insights to real-world datasets. Researchers may strengthen multivariate statistical analysis and deepen our knowledge of Wishart distributions by expanding on the work of this research. This study improves theoretical understanding and strengthens the relationship between simulation studies and modern statistics research.
Author Contributions
Conceptualization, R.M.; formal analysis, R.M.; software, R.M.; writing—original draft preparation, C.W., R.M.; writing—review and editing, C.W., R.M. All authors have read and agreed to the published version of the manuscript.
Funding
1. Funding agency details: The Beijing Natural Science Foundation (Grant No. Z190021). 2. School of Mathematics, Statistics, and Mechanics, Beijing University of Technology, Beijing 100124, China.
Institutional Review Board Statement
Not applicable.
Informed Consent Statement
Not applicable.
Data Availability Statement
Not applicable.
Acknowledgments
Randa A. Makled received Ph.D. fellowships from the Missions Sector, Higher Education Ministry, Egypt in association with the Chinese Scholarship Council (CSC).
Conflicts of Interest
No authors disclose conflicts of interest.
Abbreviations
The following abbreviations are used in this manuscript:
| DoF | Degrees of Freedom |
| ECDF | Empirical Cumulative Distribution Function |
| ED | Energy Distance |
| PCA | Principal Component Analysis |
| Probability Density Function | |
| WDM | Wishart Distribution Matrices |
References
- Wishart, J. The generalised product moment distribution in samples from a normal multivariate population. Biometrika 1928, 32–52. [Google Scholar] [CrossRef]
- Anderson, T.W.; Anderson, T.W.; Anderson, T.W.; Anderson, T.W. An introduction to multivariate statistical analysis; Vol. 2, Wiley New York, 1958.
- Muirhead, R.J. Aspects of multivariate statistical theory; John Wiley & Sons, 2009.
- Gupta, A.K.; Nagar, D.K. Matrix variate distributions; Chapman and Hall/CRC, 2018.
- Ouimet, F. A symmetric matrix-variate normal local approximation for the Wishart distribution and some applications. Journal of Multivariate Analysis 2022, 189, 104923. [Google Scholar] [CrossRef]
- Guhr, T.; Schell, A. Matrix moments in a real, doubly correlated algebraic generalization of the Wishart model. Journal of Physics A: Mathematical and Theoretical 2021, 54, 125203. [Google Scholar] [CrossRef]
- Nikolova, A.; Prodanova, K. Inference for the covariance and correlation matrices of multivariate sample using Wishart distribution. AIP Conference Proceedings. AIP Publishing, 2021, Vol. 2333.
- Vitali, E.; Motta, M.; Galli, D.E.; Vitali, E.; Motta, M.; Galli, D.E. Applications to Mathematical Statistics. Theory and Simulation of Random Phenomena: Mathematical Foundations and Physical Applications 2018, 41–74. [Google Scholar]
- Letac, G.G. The randomization by Wishart laws and the Fisher information. arXiv 2022, arXiv:2211.14137. [Google Scholar]
- Naryongo, R.; Ngare, P.; Waititu, A. The log-asset dynamic with Euler–maruyama scheme under wishart processes. International Journal of Mathematics and Mathematical Sciences 2021, 2021, 1–15. [Google Scholar] [CrossRef]
- Alfelt, G.; Bodnar, T.; Javed, F.; Tyrcha, J. Singular conditional autoregressive Wishart model for realized covariance matrices. Journal of business & economic statistics 2023, 41, 833–845. [Google Scholar]
- Pielaszkiewicz, J.; Holgersson, T. Mixtures of traces of Wishart and inverse Wishart matrices. Communications in Statistics-Theory and Methods 2020, 50, 5084–5100. [Google Scholar] [CrossRef]
- Székely, G.J. E-statistics: The energy of statistical samples. Bowling Green State University, Department of Mathematics and Statistics Technical Report 2003, 3, 1–18. [Google Scholar]
- Székely, G.J.; Rizzo, M.L. Energy statistics: A class of statistics based on distances. Journal of statistical planning and inference 2013, 143, 1249–1272. [Google Scholar] [CrossRef]
- Rizzo, M.L.; Székely, G.J. Energy distance. wiley interdisciplinary reviews: Computational statistics 2016, 8, 27–38. [Google Scholar] [CrossRef]
- Székely, G.J.; Rizzo, M.L. The energy of data and distance correlation; CRC Press, 2023.
Figure 1.
Energy Distance Distributions across Scenarios and Degrees of Freedom
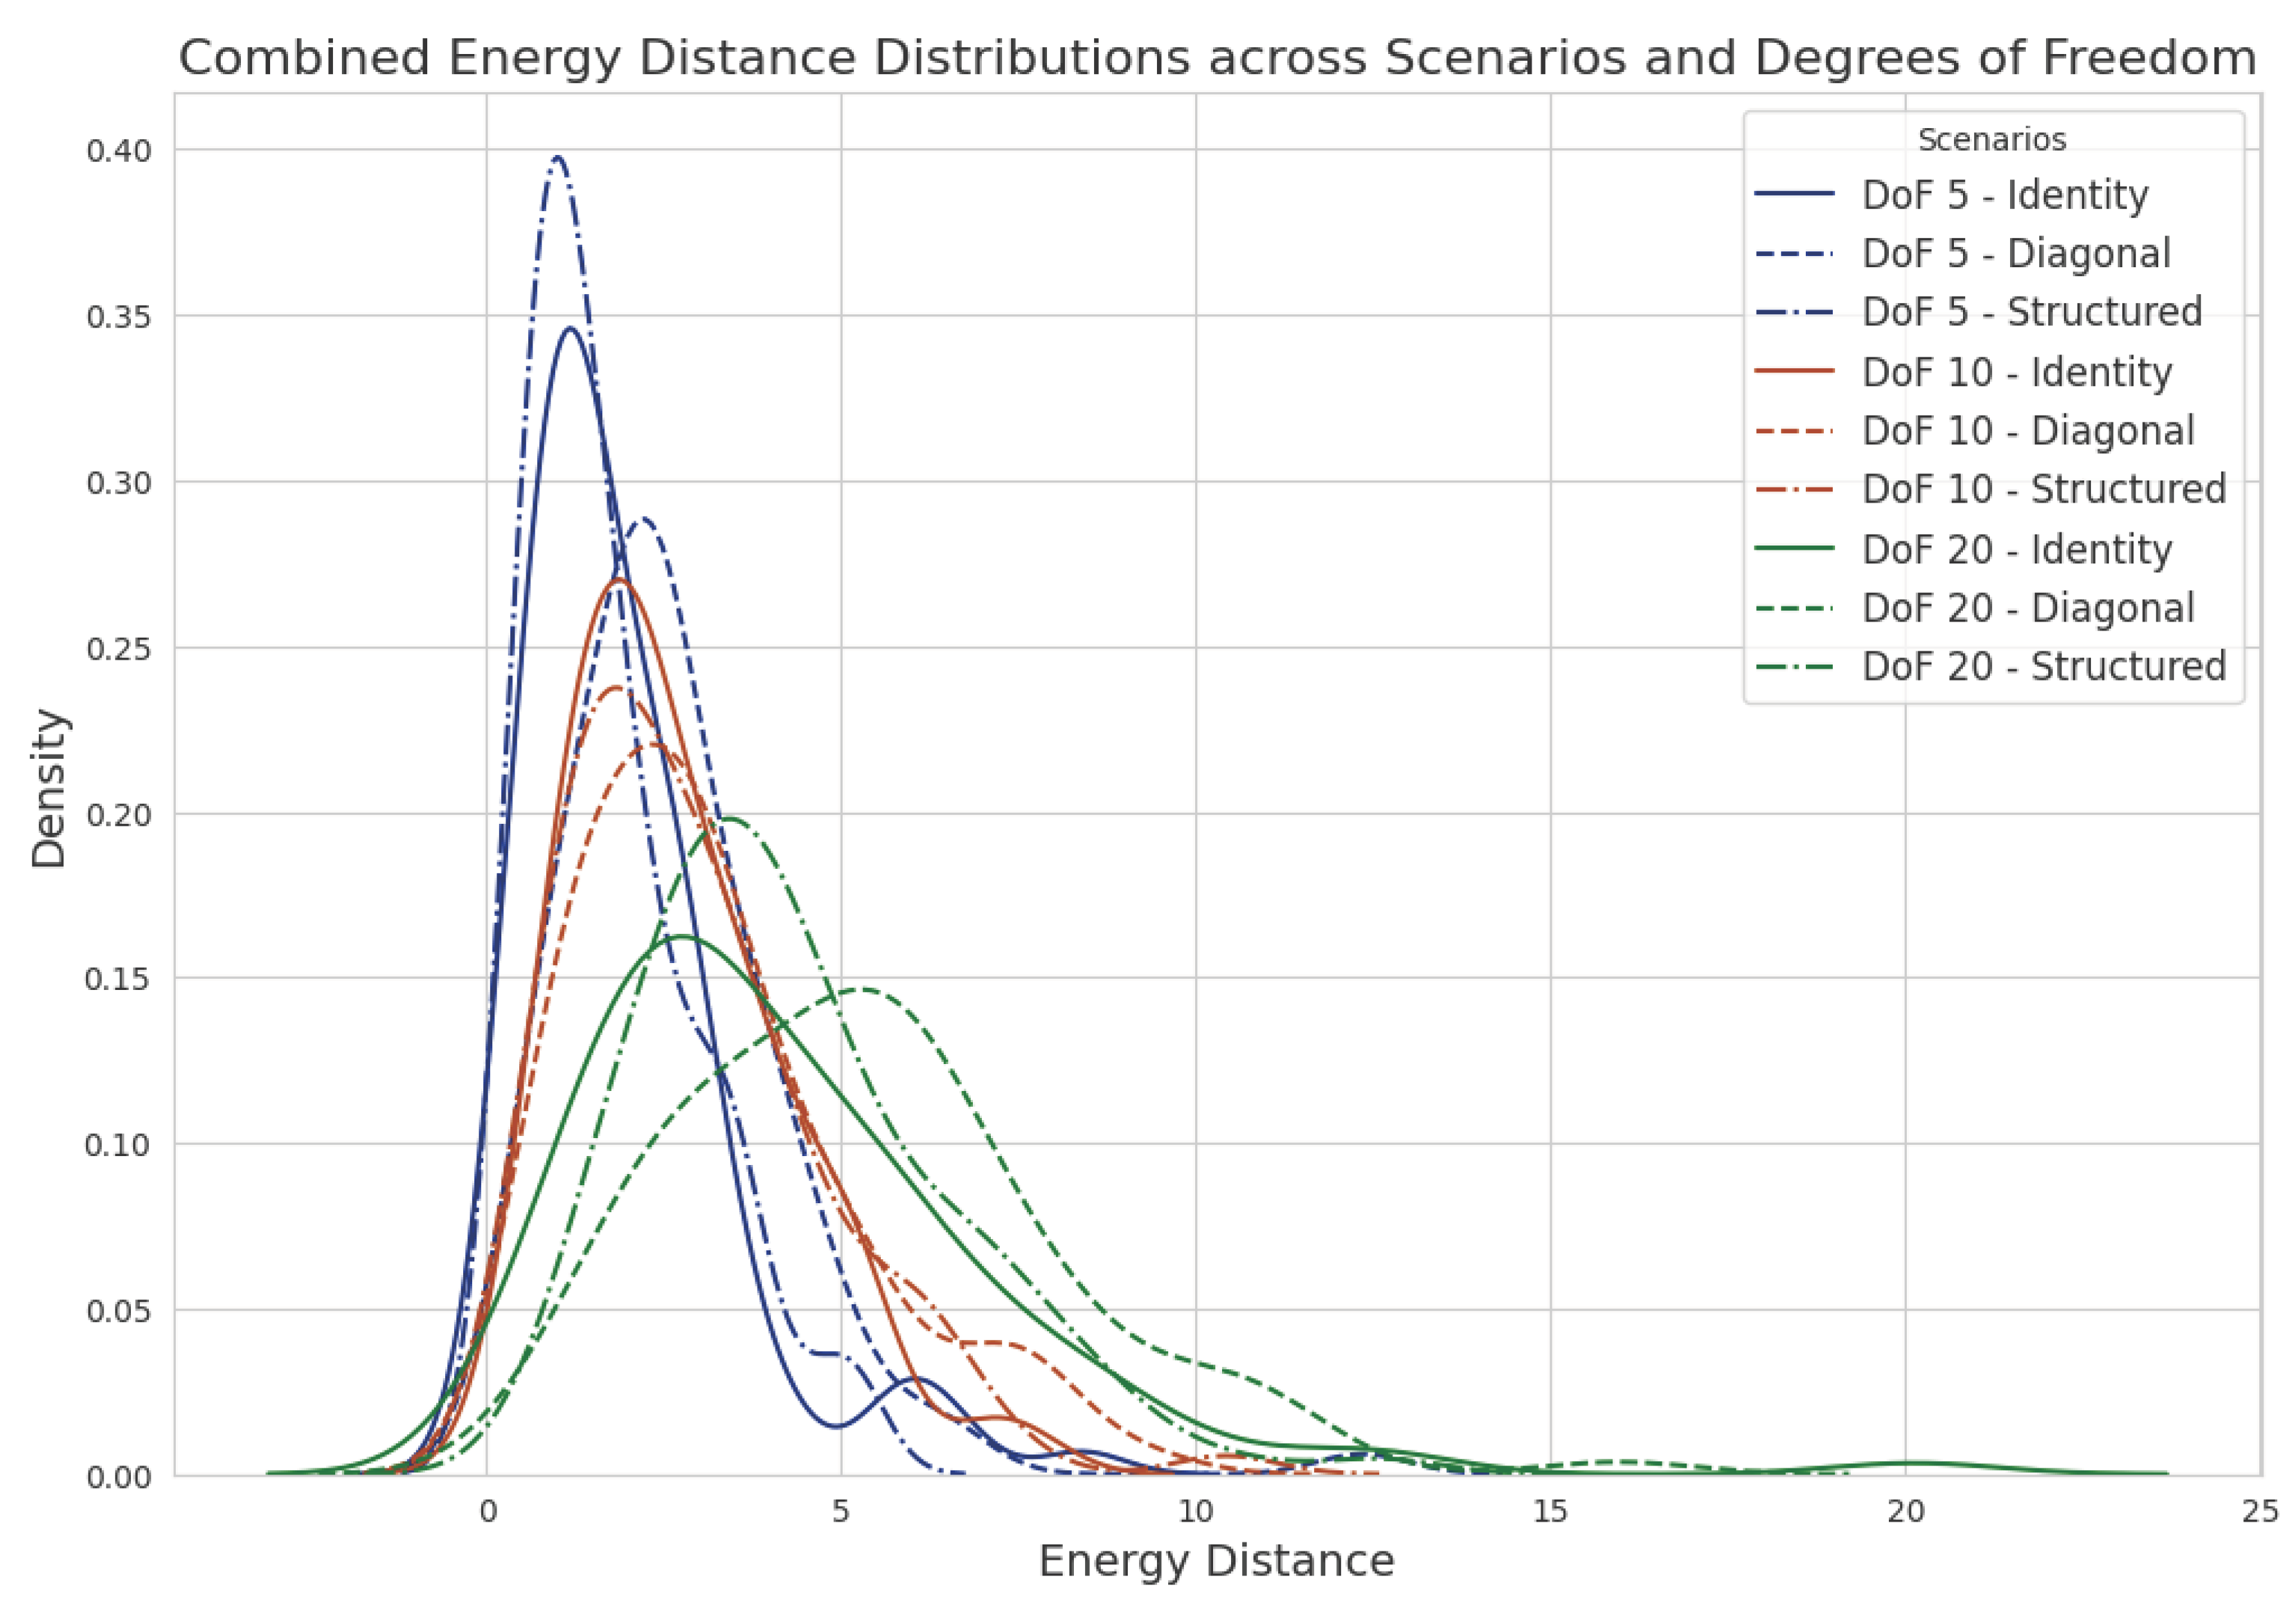

Table 1.
simulation results for energy distances across different scenarios and degrees of freedom
| Simulation | Degrees of Freedom 5 | Degrees of Freedom 10 | Degrees of Freedom 20 | ||||||
| Number | Identity | Diagonal | Structured | Identity | Diagonal | Structured | Identity | Diagonal | Structured |
| 1 | 0.123 | 0.234 | 0.345 | 0.456 | 0.567 | 0.678 | 0.789 | 0.890 | 0.901 |
| 2 | 2.363 | 1.982 | 2.042 | 1.921 | 2.034 | 1.877 | 2.121 | 1.899 | 2.056 |
| 3 | 2.513 | 2.113 | 1.984 | 1.843 | 1.932 | 2.043 | 2.145 | 1.978 | 2.004 |
| 4 | 1.163 | 2.254 | 2.056 | 2.056 | 1.975 | 2.134 | 1.984 | 2.067 | 1.943 |
| 5 | 4.257 | 2.367 | 1.897 | 2.047 | 1.984 | 2.123 | 2.003 | 2.154 | 2.001 |
| 6 | 1.827 | 1.777 | 1.742 | 0.590 | 5.433 | 2.775 | 6.611 | 4.421 | 4.693 |
| 7 | 0.247 | 2.585 | 1.037 | 3.933 | 3.075 | 6.091 | 3.280 | 4.603 | 6.017 |
| 8 | 1.020 | 1.150 | 2.812 | 3.022 | 5.289 | 3.342 | 2.262 | 4.073 | 3.025 |
| 9 | 1.036 | 2.184 | 0.750 | 2.613 | 2.363 | 3.685 | 3.866 | 6.042 | 3.488 |
| 10 | 0.802 | 3.996 | 0.807 | 2.596 | 2.846 | 7.344 | 10.342 | 3.883 | 1.680 |
| 10 | 0.802 | 3.996 | 0.807 | 2.596 | 2.846 | 7.344 | 10.342 | 3.883 | 1.680 |
| 11 | 0.472 | 4.359 | 1.162 | 1.682 | 4.253 | 3.371 | 5.709 | 7.417 | 4.780 |
| 12 | 2.642 | 4.715 | 4.915 | 2.598 | 3.327 | 2.007 | 2.725 | 2.802 | 4.833 |
| 13 | 1.913 | 2.068 | 2.021 | 3.762 | 2.501 | 0.847 | 1.063 | 7.078 | 4.151 |
| 14 | 0.654 | 3.731 | 0.593 | 3.393 | 0.796 | 1.548 | 2.704 | 4.698 | 2.534 |
| 15 | 0.295 | 0.971 | 5.327 | 1.628 | 1.954 | 6.365 | 2.321 | 2.981 | 2.830 |
| 16 | 1.954 | 0.162 | 2.518 | 2.089 | 2.032 | 2.166 | 5.127 | 4.888 | 7.579 |
| 17 | 1.318 | 2.692 | 1.689 | 2.695 | 2.271 | 2.917 | 1.915 | 3.754 | 6.374 |
| 18 | 1.243 | 1.455 | 5.020 | 2.402 | 0.962 | 6.897 | 2.796 | 2.289 | 6.680 |
| 19 | 2.764 | 3.521 | 1.867 | 3.998 | 7.458 | 3.724 | 7.541 | 4.851 | 5.133 |
| 20 | 1.091 | 2.873 | 0.681 | 3.561 | 1.462 | 5.944 | 7.046 | 6.110 | 4.891 |
| 30 | 1.595 | 3.361 | 1.669 | 1.744 | 1.751 | 2.903 | 1.934 | 4.380 | 5.564 |
| 40 | 2.897 | 0.755 | 0.517 | 0.933 | 2.443 | 0.737 | 2.882 | 3.530 | 4.637 |
| 50 | 3.548 | 2.707 | 0.855 | 0.352 | 5.663 | 0.657 | 5.528 | 9.719 | 3.769 |
| 60 | 2.312 | 0.775 | 1.212 | 1.695 | 3.013 | 1.407 | 6.135 | 4.371 | 3.009 |
| 70 | 1.023 | 0.971 | 2.717 | 2.045 | 2.635 | 6.224 | 4.339 | 0.897 | 3.433 |
| 80 | 1.183 | 0.791 | 3.345 | 2.553 | 1.876 | 2.901 | 5.871 | 7.922 | 1.548 |
| 90 | 1.631 | 4.940 | 2.637 | 1.977 | 1.862 | 0.429 | 3.127 | 5.443 | 3.418 |
| 100 | 6.448 | 3.095 | 1.576 | 3.008 | 0.898 | 10.435 | 5.915 | 2.798 | 1.489 |
Disclaimer/Publisher’s Note: The statements, opinions and data contained in all publications are solely those of the individual author(s) and contributor(s) and not of MDPI and/or the editor(s). MDPI and/or the editor(s) disclaim responsibility for any injury to people or property resulting from any ideas, methods, instructions or products referred to in the content. |
© 2024 by the authors. Licensee MDPI, Basel, Switzerland. This article is an open access article distributed under the terms and conditions of the Creative Commons Attribution (CC BY) license (http://creativecommons.org/licenses/by/4.0/).
Copyright: This open access article is published under a Creative Commons CC BY 4.0 license, which permit the free download, distribution, and reuse, provided that the author and preprint are cited in any reuse.


