Submitted:
15 March 2024
Posted:
15 March 2024
You are already at the latest version
Abstract
Abstract: Breast cancer is one of the leading causes of death in the female population due to the re-sistance of cancer cells to many anticancer drugs used. Curcumin has cytotoxic activities against breast cancer cells, although it has limited use due to its poor bioavailability and rapid metabolic elimination. The synthesis of metal complexes of curcumin and curcuminoids is a relevant topic in the search for more active and selective derivatives of these molecular scaffolds. However, solubil-ity and bioavailability are concomitant disadvantages of these types of molecules. To overcome such drawbacks, the preparation of inclusion complexes offers a chemical and pharmacologically safe option for improving the aqueous solubility of organic molecules. Herein, we describe the preparation of the inclusion complex of dimethoxy curcumin magnesium complex with cyclodex-trin (DiMeOC-Mg-BCD, 5) in the stoichiometric relationship 1:1. This new inclusion complex's solubility in aqueous media (PBS) was improved by a factor of 6x over the free metal complex (DiMeOC-Mg). Furthermore, 5 affects cell metabolic rate, cell morphology, cell migration, induced apoptosis, and downregulation of the MMP-2 and MMP-9, IL-6, and STAT3 expression levels on MDA MB 231 cell lines. Results of an antitumor assay in an in-ovo model showed up to 30% inhi-bition of tumour growth for breast cancer (MDA-MB-231) when using 5 (0.650 mg/Kg dose), and 17.29 % inhibition with the free homoleptic metal complex (1.5 mg/Kg dose, DiMeOC-Mg). While the formulation of inclusion complexes from metal complexes of curcuminoids demonstrates its usefulness in improving the solubility and bioavailability of these metallodrugs, the new DiMeOC-Mg-BCD exhibits excellent potential for use as a therapeutic agent in the battle against breast cancer.
Keywords:
Curcuminoids
; 3
; 4-Dimethoxycurcumin
; Homoleptic complexes
; Inclusion complexes
; Beta-cyclodextrin complexes
; Antitumoral activity
; Breast cancer.
1. Introduction
Breast cancer is a neoplastic disease with high global mortality for the female population. It is characterized by the accumulation of mutations in the DNA structure that leads to uncontrolled development and multiplication of cells within the breast tissue[1,2]. This disease will continue to be the cause of many deaths due to tumour recurrence and drug resistance[3]. Therefore, there is a need for the development and formulation of new therapeutic agents to address this type of human ailment.
Curcumin (diferuloylmethane) is one of the significant metabolites present in the rhizome of the Asian spice Curcuma longa[4,5]. It has extensive therapeutic properties well documented in the scientific area because of its anti-inflammatory[6,7], antioxidant[8] and cytotoxic potential[9]. Therefore, extensive biological studies continue to be a significant task for scientists.
Recent studies have found that the curcumin molecule is considerably active against breast cancer cell lines (e.g., MCF-7 or MDA)[10,11] and shows antitumoral activity in the Ovo model in nanoformulations without altering embryo development [12]. However, disadvantages such as poor solubility[13], low bioavailability[14,15], and rapid metabolism limit its use in the clinic as a successful therapeutic molecule. Consequently, research has focused on synthetic derivatives, producing a considerable increase in new molecules called curcuminoids[8,16,17] or analogues.
The synthetic curcuminoid obtained from the replacement of two phenolic groups (Ph-OH) with two methoxyl groups (Ph-OCH3) is called dimethoxycurcumin (DiMeOC) and has exhibited good cytotoxic activity against cancer cells[18]. In addition, DiMeOC has better metabolic stability [19](compared to curcumin). Dimethoxycurcumin also presents the well-known keto-enol equilibrium at molecular half moiety, which allows it to form chelates or complexes with different metal ions. So, this chemical property has been advantageous in improving its solubility and bioavailability. Different metals of biological interest, such as copper (Cu), iron (Fe), manganese (Mn), zinc (Zn), gallium (Ga), and indium (In), have previously been bonded to curcuminoid-type molecules forming active metal complexes with antioxidant or cytotoxic activities[20,21,22,23]. A metal ion related to breast cancer is magnesium (Mg)[24], the second most relevant ion in the human body[25] because it acts as a cofactor for about 300 enzymatic processes involved in maintaining energy metabolism[26], protein synthesis, and DNA replication[27], besides exerting essential antioxidant functions[28].
The ailment hypomagnesemia[29] is related to high oxidative stress and low serum concentrations of magnesium in women with breast cancer that compromises the expression and function of antioxidant enzymes, concomitantly manifesting the progression and proliferation of the breast tumour [26,27]. So, considering the importance and participation of magnesium in breast cancer, the synthesis of metallodrugs that contain this metal ion is essential.
On the other hand, an additional approach to solving the problem of poor solubility of curcuminoid-type molecules has been the discovery of new formulations, including liposomes[30,31], nanoparticles[32,33,34,35,36], or the preparation of inclusion complexes with cyclodextrins[37,38]. Beta-cyclodextrin (BCD) is the first choice [39] for the administration of drugs toward their sites of action because of its low toxicity[40], certain hydrophilicity[41], and adequate cavity. Beta-cyclodextrins can also help to increase the solubility[42] and bioavailability and confer stability[43]of different insoluble guests in aqueous media.
In this work, we designed a formulation following three concepts of molecular architecture: 1. The use of a metabolically stable curcuminoid compound (dimethoxy curcumin, DiMeOC, 3) and cytotoxic against cancer cell lines; 2. Using homoleptic metal complex with a metal (magnesium, DiMeOC-Mg, 4 ) of physiological importance related to cancer; 3. The preparation of an inclusion complex (DiMeOC-Mg-BCD, 5) with beta-cyclodextrin that has adequate cavity size for the encapsulation of a wide variety of drugs. Although the homoleptic metal complexes of curcuminoids have demonstrated high antioxidant and cytotoxic activity in vitro [44], there are few studies of new formulations with cyclodextrins and their biological activity in vivo.
The overall biological screening suggested focussing on the new inclusion metal complex (5) and the free homoleptic metal complex (4) using the antitumoral model in Ovo. Such a model is a good choice as an alternative for mammalian tumour induction to investigate the characteristics of tumour growth, metastasis, and angiogenesis[45]. The antitumor in-Ovo assay was carried out by INOVOTION SAS (France).
2. Results
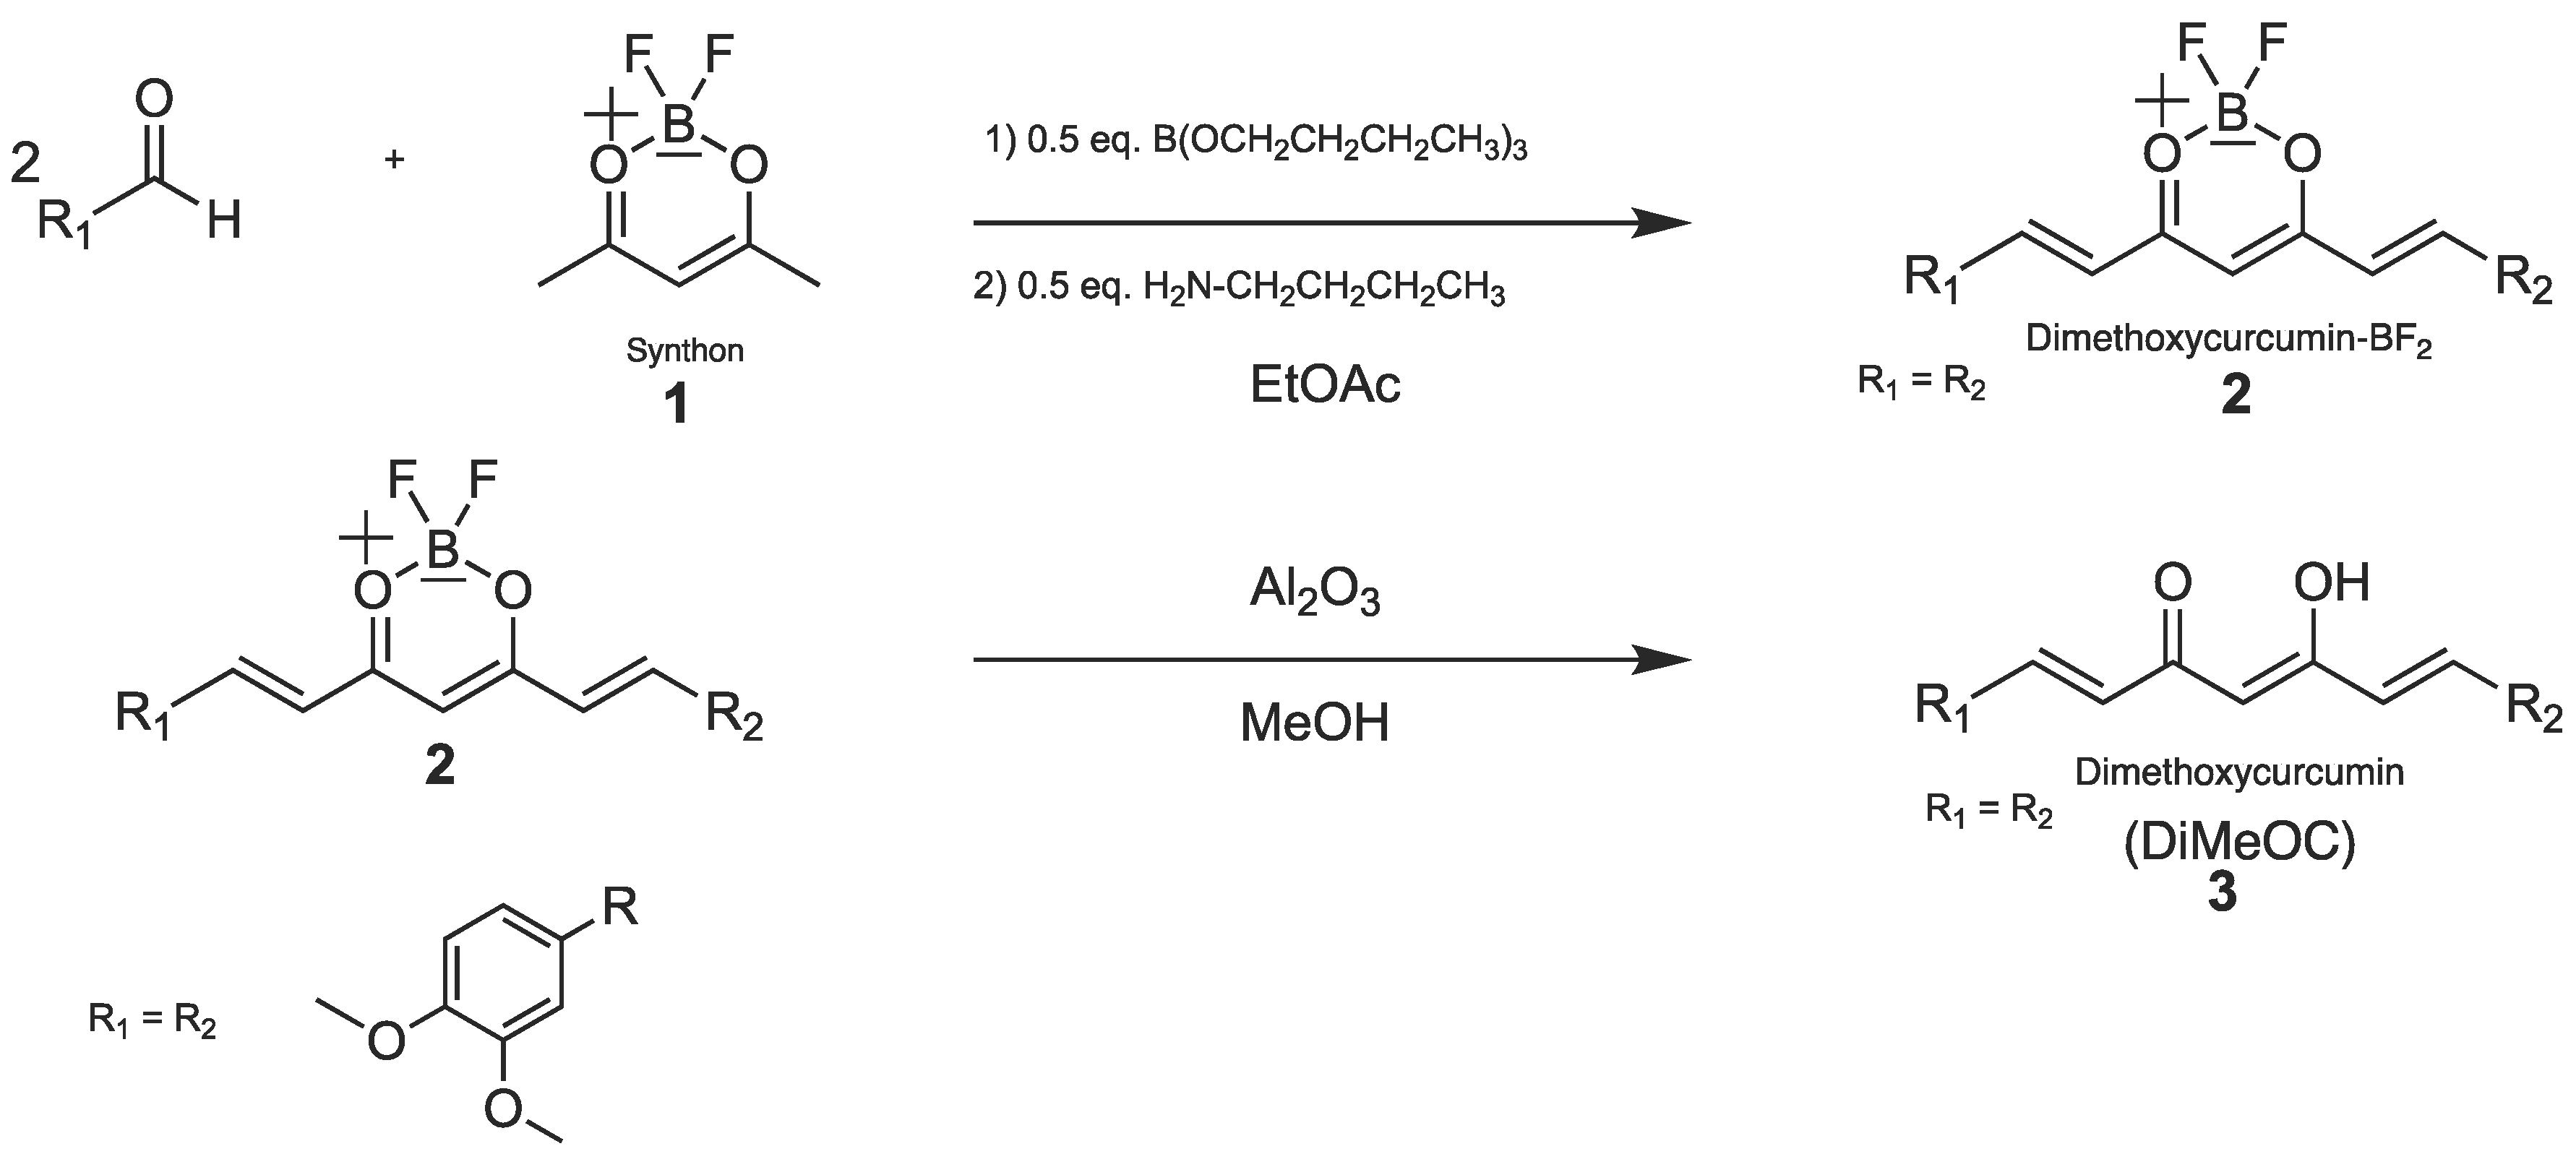
Dimethoxycurcumin (3) it was synthesized according to the "click and unclick chemistry " approach for the synthesis of curcuminoids[46], where a simple three-step method was used: 1. Synthesis of the 2,4-pentanedione and BF3·THF synthon; 2. Condensation of 2 moles of 3,4-dimethoxybenzaldehyde (see Scheme 1); 3. Removal of BF2 with alumina to recover the β−keto-enol function of the curcuminoid (3). The synthetic method was adequate for the synthesis of ligands in good (Dimethoxycurcumin-BF2, 85%) to excellent (DiMeOC, 90%) yields as reported previously[23,46]. The spectral information of the precursor (2) and ligands (3) were confirmed by IR, EM, and NMR.
The metal complex of dimethoxy curcumin with magnesium (DiMeOC-Mg) was synthesized by previously reported standard methods[21], using magnesium acetate as a source of the metal centre and a mixture of ethyl acetate/methanol (7:3) as solvent (see Scheme 2). The stoichiometric relationship of the complex of dimethoxy curcumin with magnesium (4) was established by spectroscopic analysis (see Supplementary material). NMR contains the signal for two hydrogens of the central methine and four hydrogens of the α,β-unsaturated system; the mass spectra (MS) with a peak of 815 m/z that corresponds appropriately to the 1:2 (Mg: (DiMeOC)2) homoleptic metal complex. This synthetic approach was suitable for the obtention of the metal complex since a yield of ca. 80% was obtained with purity greater than 98% (HPLC).The resulting product from the treatment with beta-cyclodextrin of the metal complex (see Scheme 2) was obtained by coprecipitation methodology using acetone and water as solvents. The inclusion complex obtained (DiMeOC-Mg-BCD), stoichiometric ratio, solubility, and purity were established by spectroscopic methods (IR, EM, NMR, DOSY, UV-Vis, HPLC) and physicochemical analysis in solid state (13C CPMAS-NMR, SEM, TGA, DSC).
MDA-MB-231 breast cancer cells were treated with DiMeOC-Mg-BCD. Our findings revealed that this compound showed significant effects in reducing cell survival, affecting cell morphology, and inducing apoptosis. In addition, examined its effect on cell migration of these cancer cells, showing that this compound suppressed in vitro the cell migration ability in a significant manner, which could confirm the anti-metastatic activity of DiMeOC-Mg-BCD this against breast cancer cells [47].
The evaluation of the antitumoral effects of DiMeOC-Mg and DiMeOC-Mg-BCD with cytotoxic activity against the MDA-MB-231 cell lines was done using the in-ovo model. DiMeOC-Mg (1.5 mg/Kg) and DiMeOC-Mg-BCD (0.650 mg/Kg) reduced the relative tumour weight by 17.29% and 30%, respectively, compared to the control group.
3. Discussion
3.1. Infrarred
Characteristic bands for the ligand (DiMeOC, see Supplementary material), one band is observed at 1620 cm-1 corresponding to aromatic ring and another with high intensity at 1506 cm-1 due to the free carbonyl group of the β-diketone, reveal that the compound exists in enol form, while the band -CH=C- (trans double bond) appears at 967 cm-1. The IR spectrum of the magnesium metal complex (DiMeOC-Mg) shows one band at 1627 cm-1 assigned to aromatic rings, one intense band at 1507 cm-1 due to the interaction of the metal with the di-carbonyl groups, and an additional band at 470 cm-1 assigned to the interaction metal-oxygen bond (M-O)[21]. Beta-cyclodextrin (BCD) showed characteristic bands for the hydroxyl group (-OH) at 3300 cm-1, a band for the C-H bond at 2924 cm-1, and the bands at 1152 cm-1 and 1021 cm-1 correspond to C-O bonds of the glucose units[39]. The inclusion complex between DiMeOC-Mg and BCD shows shifts in the wave numbers of the bands related to BCD, i.e., from 3300 cm-1 to 3386 cm-1, from 2924 cm-1 to 2930 cm-1, from 1152 cm-1 to 1157 cm-1, and from 1021 cm-1 to 1024 cm-1. The band related to the magnesium metal complex is at 1510 cm-1. These spectroscopic changes[48] confirm the formation of the new complex (DiMeOC-Mg-BCD) involving the interaction between the homoleptic magnesium metal complex (guest) and the BCD (host).
3.2. Mass Spectrometry
The mass spectrometry confirmed the molecular weight of all compounds (see Supplementary material), revealing the m/z = 444 ratio for DiMeOC-BF2, corresponding to the difluoro-borated precursor C23H23BF2O6. The ligand DiMeOC shows a m/z = 397 ratio corresponding to a molecular formula C23H24O6. The magnesium metal complex (DiMeOC-Mg) has a m/z = 817 ratio corresponding to the molecular formula C46H46MgO12, while the inclusion complex exhibits a m/z = 1949 ratio corresponding to an inclusion complex with the molecular formula of C88H116MgO47 and a stoichiometric ratio of DiMeOC-Mg: BCD 1:1.
3.3. 1H NMR Liquid State
The synthetic difluoroborated precursor (DiMeOC-BF2) obtained by condensation of two moles of 3,4-dimethoxybenzaldehyde was verified by the formation of the heptanoid chain. The chemical shifts reveal two double bonds with δ = 7.12 ppm (α) and δ = 7.97 ppm (β), J = 16 Hz, corresponding to trans vinyl protons. The central methine proton (singlet) is found at δ 6.50 ppm (see Supplementary material) and the methoxy groups appear at δ 3.84 ppm.
The curcuminoid ligand (DiMeOC) presented the characteristic signals of a 1,3-dicarbonyl α,β-unsaturated system, and the protons δ = 6.84 ppm (α) and δ = 7.59 ppm (β) were observed at lower frequencies respect to the precursor due to the elimination of the BF2 group. In addition, the methine proton was observed at δ 6.11 ppm and the enolized proton (-OH) at δ 16.33 ppm (characteristic for most curcuminoids) revealing the strong hydrogen bond between the β carbonyls.
The homoleptic metal complex was confirmed by 1H-NMR in liquid state. In general, protons of metal complexes (curcuminoid type) have a chemical shift at lower frequencies respect to the ligand, attributed to an increase in electron density from the metal (magnesium) in the complex. Vinylic hydrogens (δ = 6.71 ppm and δ = 7.34 ppm) appear at 50 and 100 Hz lower frequencies respectively, and the central methine proton (δ 5.63 ppm) appears significantly shifted to lower frequencies (ca. 200 Hz) respect to the ligand.
The changes in chemical shifts of the BCD free and in its complex form, were determined by 1H-NMR. The liquid NMR spectra were obtained in dimethylsufoxide-d6 (DMSO-d6, see supplementary material) and deuterium oxide (D2O). 1H-NMR spectra in DMSO- d6 for BCD free and BCD in the inclusion complex, showed signals in agreement with the expected compounds[49]. However, substantial differences in chemical shifts for hydrogens related to the BCD´s cavity were not observed, which is consistent with previous reports[50].
The work of Kida (2011) et al.[51] describes that a guest (pyrene) may have different inclusion modes with cyclodextrins using different deuterated solvents (benzene or cyclohexane). It is essential to highlight that when using benzene-d6, the guest associates in the secondary region of cyclodextrin through π−π interactions may form a “sandwich” type complex. Still, with cyclohexane-d12, the guest resides in the cavity of cyclodextrin, thus forming a different type of inclusion complex. From these observations, it is clear that the solvent significantly affects the mode of inclusion between guest and host molecules. Therefore, differences in chemical shifts for protons in the host cavity, using one solvent or another, are expected.
Due to the above, we made comparisons of the chemical shifts of the inclusion complex in deuterium oxide (D2O), obtaining the 1H-NMR spectra shown in Figure 1.
The chemical shifts of BCD in the complex form are affected and shifted to lower frequencies due to the protection conferred by the aromatic rings of the guest. Furthermore, when there is an interaction between guest and host, the chemical shifts of H3 (-0.06 ppm) and H5 (-0.08 ppm) are expected to change, as shown in Table 1 and correlate with a total inclusion complex. These results support the successful formation of the inclusion complex (DiMeOC-Mg-BCD) and are confirmed by other spectroscopic techniques, as shown below.
3.4. DOSY Spectra
The different diffusion values of the molecular species in the DMSO-d6 spectrum follow the formation of the inclusion complex. In the DOSY experiment, the diffusion becomes smaller when the species possesses a greater hydrodynamic radius (see Table 2). The diffusion coefficient for the BCD-inclusion complex has the lowest value (8.34 x10⁻¹¹ cm2/s), while the free form has 1.26 x10⁻¹¹ cm2/s, and it agrees well with reported values[49].
The DOSY spectrum of DiMeOC-Mg-BCD (Figure 2 b)) reveals the association-dissociation effects with differentiated signals (see diffusion line). Because interactions in an inclusion complex are of non-covalent type (e.g. hydrogen bonds, VdW forces)[52], this reflects the equilibrium in solution between the host (BCD) and guest (DiMeOC-Mg).
3.5. Solubility, Ratio of Guest-Host and HPLC
The increase in solubility in aqueous media is one of the most relevant points of inclusion complexes due to their multiple applications in the medical area. The solubility of DiMeOC-Mg-BCD (expressed in µg/mL) was determined using a standard curve (see Supplementary material) in the aqueous cell culture medium (PBS) and compared with DiMeOC-Mg. A 6-fold increase in solubility of the metal complex was found in the inclusion complex (see Table 3). Solubility studies have shown that curcumin-based inclusion complexes form a uniform dispersion in aqueous media due to good compatibility between cyclodextrin and curcuminoids[53].
The inclusion complex corresponds appropriately to ratio 1:1 (guest:host) of the magnesium metal complex (4) with beta-cyclodextrin and can be verified when a maximum molar concentration (415 nm, UV-Vis) of the compound is obtained with the mole fraction correspond to 0.5 of BCD (see Supplementary material)[54].
The HPLC chromatograms (see Supplementary Material) show that DiMeOC-Mg-BCD's retention times in the acetonitrile/water elution medium have decreased (19 min) compared to DiMeOC-Mg's (20 min), demonstrating that the new inclusion complex's solubility in aqueous media has improved. Furthermore, the association between the guest and BCD is strong since only one single component of high purity is present in the chromatogram.
3.6. 13C CPMAS Solid State NMR
The structural differences between the synthesized complexes were studied using 13C CPMAS ssNMR analysis, showing differences in shape and signal intensity[55]. The most significant change between the ligand (DiMeOC) and its magnesium metal complex (DiMeOC-Mg) resides in the region of the carbonyl groups; for DiMeOC (ligand), two different carbonyl groups are observed at 185 ppm and 189 ppm ( see Figure 3). However, DiMeOC-Mg shows the carbonyl signals as a singlet at 187 ppm due to the coordination with magnesium. Furthermore, this can be associated with increased symmetry at the coordination plane around the metal atom[23].
Furthermore, to observe the significant differences in the inclusion complex we have performed a comparison of three 13C CPMAS ssNMR spectra (DiMeOC-Mg, BCD and DiMeOC-Mg-BCD). The inclusion complex (Figure 3, number 4)) presents a very low signals intensity in the zones that correspond to the guest and the signals that correspond to the host (BCD) are observed with a clearer intensity and multiplicity. A broadening of the signals corresponding to the guest can be distinguished, especially for the carbonyl’s groups (186 ppm) as well as the region corresponding to the aromatic and vinyl groups (110 ppm-160 ppm). The signals between 140 ppm-150 ppm correspond to guest almost dissapear.
The above analysis of spectra 13C CPMAS NMR may lead to three important conclusions:
- The guest (DiMeOC-Mg) was adequately complexed with BCD using the selected coprecipitation method.
- The relaxation phenomena for the guest molecule becomes very fast (low intensity of signals) when located at the cavity of BCD.
- The inclusion complex reveals an amorphization (broadening of signals) in agreement with the data obtained by scanning electron microscopy (SEM).
3.7. SEM Analysis
Scanning electron microscopy (SEM) was used to characterize the visual and morphological changes from the starting materials to the inclusion complex; both beta-cyclodextrin and the ligand (DiMeOC) show crystalline morphology in the form of bars or elongated bars. However, the magnesium complex (DiMeOC-Mg) appears as an amorphous and irregular material (Figure 4 c).
The SEM analysis of DiMeOC-Mg-BCD (Figure 4 d)), shows morphological changes that point out the formation of the inclusion complex due to the interaction between BCD and magnesium metal complex[53]. The new inclusion complex exhibits a significant change in morphology and consists of amorphous material where regular crystal habits are absent.
3.8. TGA and DSC Analysis
The thermal analysis results allowed for evaluating the differences and stability of starting materials with respect to the inclusion complex (DiMeOC-Mg-BCD). Thus, TGA and DSC showed differences between the starting materials (BCD and DiMeOC-Mg) and the inclusion complex.
BCD presents three stages of weight loss (Figure 5). The first loss (-13%) is due to the loss of water molecules in a temperature range of 25°C-150°C, the second loss of 64% (300-360°C) corresponds to the solid transition to the liquid and a partial decomposition, and for the final stage (>380°C) there is a minimum weight loss (-8.3%) due to the total thermal decomposition of the BCD. The magnesium metal complex presents an initial weight loss of 5% (25°C-150°C) due to the evaporation of water. However, its melting point and decomposition partially occur between 230°C-420°C with a weight loss of 34%, and above 440°C, the thermal decomposition of the compound occurs.
Inclusion complexes are frequently amorphous solids with reduced crystallinity where high hydration levels can be associated. DiMeOC-Mg-BCD initially loses 8% of weight (water molecules of hydration, 25-160°C) and agrees well with a successful host-guest inclusion. We observed that in the initial stage, a 10% weight loss occurs at a higher temperature range (approx. 160 degrees, Figure 5 c)); this suggests an encapsulation efficiency due to new guest interactions[43,53]. Furthermore, the partial weight loss of 47% (280 °C - 360 °C) makes it different from the initial starting materials, resulting in a more stable product than BCD for the same temperature range.
Additionally, the DSC thermograms (Figure 6) show that the BCD presents a prominent endothermic peak at 325 °C, while the homoleptic metal complex presents it at 248 °C due to its melting points. The new inclusion complex (DiMeOC-Mg-BCD) presents a prominent endothermic peak at 334 °C, and the peak at 248 °C in the new thermogram disappears and can be attributed to the guest being wholly included in the BCD by replacement of water molecules[56]. In addition, the change in the profile of the thermogram that includes phase transitions, and the appearance of new peaks means the formation of the new inclusion complex.
The apices of melting points presented for DiMeOC-Mg and DiMeOC-Mg-BCD were 248 °C and 334 °C respectively (Figure 6). However, DiMeOC-Mg presented a smaller fusion area (21.46 J/g) compared to DiMeOC-Mg-BCD (257.6 J/g), which means that the endotherm of the new inclusion complex belongs to an amorphous solid profile with a wide melting point range.
3.9. Cytotoxic Activity in Human Tumour Cells and Evaluation of Morphological Changes
We carried out cytotoxicity studies on MDA-MB-231 triple-negative breast cancer cells because these cells are commonly used to model late-stage breast cancer and are characterized by being invasive and spontaneously generating metastasis in the lymph nodes[57]. DiMeOC alone did not show significant cytotoxic activity. However, DiMeOC-Mg showed increased cytotoxic activity towards these breast cancer cell lines. We attribute the increase in cytotoxic effect to the slightly higher metal complex solubility in aqueous media (Table 4)
Furthermore, recent studies by Yin-Yin et al.[3] on the inhibitory effects of an analogous curcuminoid (EF-24) in MDA-MB-231 cell lines demonstrated that cell death is initiated by crosstalk between autophagy and apoptosis, with induction of mitochondrial apoptosis. This observation has led us to suggest that the value of CC50 = 10.73 ± 0.1 found for the formulated inclusion complex (DiMeOC-Mg-BCD) may be related to the triggering of non-necrotizing cell death pathways.
Giemsa stain and phase contrast microscopy were applied to evaluate morphological alterations on MDA-MB-231 cells. After 48 h treatment, the cell lines had size and morphology unchanged in both control and vehicle. In contrast, MDA-MB-231 cell lines treated with DiMeOC-Mg-BCD showed cell size reduction (shrinkage), nuclear condensation (dark condensed and rounded nuclei), and the presence of membrane-bound apoptotic bodies (shown in Figure 7). Also, a significant reduction in cell number and the presence of nonadherent cells and cellular fragments appeared. The morphological alterations produced by curcumin and its derivates suggest different stages of cell death, such as apoptosis[58], lost cell integrity, promotion of cancer-cell progression and nucleic acid damage, which could be related to a downregulation of transcription factors and gene expression and inhibition of tumour growth and angiogenesis[59].
3.10. Esterase Activity and Membrane Damage Induced by DiMeOC-Mg-BCD on MDA-MB-231
To elucidate the action mechanism of DiMeOC-Mg-BCD on MDA-MB-231, the fluorescent probe (Calcein-AM and Eth-1) for esterase activity and cell membrane damage was used to confirm this compound affects cell viability by flow Cytometry[60]. The discrimination of live and dead/necrotic cells by this method considers a decreased activity of esterase, which is an early characteristic in apoptosis, followed by depolarization of mitochondrial membrane potential (ΔΨm), overexpression of caspases enzymes, the symmetrical distribution of phosphatidylserine and lipid raft on the plasma membrane, and loss of membrane integrity[61]. DiMeOC-Mg-BCD caused a significant decrease in esterase activity/viable cells (C-AM+) of breast cancer cell lines (63.57%, CC50, 48 h). The percentage (56.91%) of membrane damage cells/dead cells (Eth-1+) was statically significant compared to DMEM and DMSO controls, but they did not affect cell viability (see Figure 8).
3.11. Apoptosis Induced by DiMeOC-Mg-BCD on MDA-231-MB Breast Cancer
MDA-MB-231 cell lines were stained with annexin V-FITC (AV+) and propidium iodide (PI+) and analyzed using flow cytometry to discriminate between apoptotic and necrotic cell death. Annexin V is a protein conjugated to a green fluorescent dye to detect apoptosis. Propidium iodide (PI) is a red fluorescent dye that stains the DNA of both necrotic and late apoptotic cells with damaged membranes (see Figure 9)[62].
Figure 10 shows: a) DMEM and vehicle (1.3 % DMSO) giving 70.4% and 82.25% of live cells (AV-/PI-). DiMeOC-Mg-BCD reduces this population to 4.03%; (b) 5% DMSO produces 54.3% of early apoptotic cells (AV+/PI-), and was used as the positive control; (c) DiMeOC-Mg-BCD reached 87.625% of late apoptotic cells (AV+/PI+) in contrast with the DMEM percentage (9.7%) and vehicle (16.16%); (d) Heating at 65 degrees was used as the necrotic control showing 87.625% of AV-/PI+ cells. Our results indicate that early apoptosis is the cell death mechanism induced by DiMeOC-Mg-BCD.
3.12. Effect of DiMeOC-Mg-BCD on MDA-MB-231 Cell Migration (Wound Healing Assay)
Cell migration increase is a critical physiological process in tissue repair, immune responses and development. In cancer studies, the increase in cell migration is a hallmark of migratory ability, metastasis, and a bad clinical prognosis [2,63,64]. We examined the effect of DiMeOC-Mg-BCD on motility in breast cancer cell lines by a wound-healing assay for the MDA-MB-231 triple-negative cancer cell lines (Figure 11).
We found that this compound significantly inhibited the ability of cells to close the artificial wound at 48 h treatments, reducing the relative migration ratio concerning the vehicle control and without significant difference between 24 h and 48 h, demonstrating a reduction over time. The wound size for the vehicle reached up to 42.4% and 66% in the MDA-MB-231 control after 24 h and 48 h, respectively, while DiMeOC-Mg-BCD showed a 32.4% after 24h exposure at 1 µM and 47% after 48h. Our results show that DiMeOC-Mg-BCD can repress the motility of breast cancer cells.
3.13. Effect of DiMeOC-Mg-BCD on MMP-2 , MMP-9 and IL-6 and Total STAT3 Gene Expression on MDA-MB-231
The inhibition expression of matrix metalloproteinase as MMP-2 and MMP-9 expression levels in breast cancer tissues correlates with lymph node metastasis, tumour growth, angiogenesis, invasion, and metastasis [47]. We analyzed the expression of MMP-2 and MMP-9 on MDA-MB-231 cancer cells after treatment with DiMeOC-Mg-BCD (at CC50) for 48 h by RT-PCR. As shown in Figures 12, a) and 12 b), MMP2 and MMP9 protein expression significantly decreased (p<0.001) after normalization to the vehicle control, evidencing that this compound effectively inhibited migration and invasion on MDA-MB-231. Curcumin or curcuminoids are beneficial in inhibiting cell proliferation, migration, metastasis, modulating cancer-related pathways, and sensitizing cells to radiotherapy and chemotherapy in vivo, which could be evaluated for this compound since metalloproteins expression is used as a reference index for guiding breast cancer progression and treatment efficiency [47].
Metastasis in breast cancer occurs when cancer cells detach from the primary tumour, invade the adjacent tissues to reach the bloodstream, and colonize distant organs (Li et al., 2017). The development of distant metastasis is a crucial event that limits the survival of breast cancer patients. To date, the epithelial-mesenchymal transition (EMT) enables breast cancer cells to exhibit a self-renewal characteristic and to enhance cell motility/migration, which results in the occurrence of metastatic colonies at distant sites [2,63].
Many studies documented that STAT-3-mediated breast cancer metastasis happens through the upregulation of MMP9 and MMP2 expression. Targeting MMP9 can reduce breast cancer progression and modulate EMT genes [1,65]. In the present study, DiMeOC-Mg-BCD was found to inhibit the expression of MMP9 and MMP2 genes in the MDA-MB-231 breast cancer cell line.
We evaluated the expression of IL-6 and total STAT3 gene expression in MDA-MB-231 cells treated with DiMeOC-Mg-BCD for 48 h. IL-6 and total STAT3 gene expression decreased significantly compared to the vehicle control cells (see Figure 12 c) and 12 d)). Taken together, the interleukin-6 (IL-6) and the signal transducer and activator of transcription 3 (STAT3) or IL-6/STAT3 pathway is a central regulator of breast cancer metastasis through promoting breast cancer cell proliferation, the development of metastases (by epithelial-mesenchymal transition (EMT), enriching of cancer stem cells (CSCs)), and suppressing apoptosis. They are also related to therapeutic resistance[66].
Curcuminoid complexes downregulate STAT3 and IL-6 expression and inhibit STAT3 translocation into the nucleus, suppressing cell proliferation, invasion, and metastasis in hormone triple-negative receptor breast cancer[1]. Additional studies have observed that curcumin inhibits the IL-6/JAK/STAT3 signalling by significantly reducing the phosphorylation of JAK2 and STAT3 levels in colorectal cancer (CRC) cells. Curcumin (2 g/day) and chemotherapeutic drugs were synergistically administered in 27 with CRC patients during a clinical trial, resulting in safe and tolerable, increasing patients' overall survival and response rate when administered with chemotherapeutic drugs, which makes DiMeOC-Mg-BCD a promising compound for in vivo preclinical trials[59].
The IL-6 expression is a critical step of breast cancer metastasis, leading to activation of the JAK2/STAT3 signalling pathway that promotes proliferation, invasion, metastasis, and angiogenesis and inhibits apoptosis in breast cancers. Thus, a drug targeting this pathway may benefit breast cancer therapies[1]. So, to check the activity of DiMeOC-Mg-BCD on cancer cell lines at the molecular level, the IL-6/STAT3 signalling pathway was investigated. Our data showed that this compound reduced the expression of IL-6 mRNA and STAT3, which promote the proliferation, metastasis, invasion, and angiogenesis in breast cancers, could result in the suppression of the NF-kB/IL-6/JAK2/STAT3 signalling pathway.
The activated IL-6/STAT3 pathway can inhibit caspase-dependent apoptosis, promoting proliferation and metastasis of cancer cells[66]. Thus, targeting apoptosis became a therapeutic approach in cancer [1,62,66]. The expression of metalloproteins, IL-6, and STAT3 decreased in the MDA-MB-231 breast cancer cell line by DiMeOC-Mg-BCD, leading to the induction of apoptosis. Figure 13 summarizes the proposed molecular mechanism of the anti-proliferative, EMT inhibition, and apoptotic activities of DiMeOC-Mg-BCD against MDA-MB-231 triple-negative breast cancer cell lines. To confirm the role of this compound and inhibit the IL-6/STAT3 pathway with subsequent initiation of apoptosis[67].
3.14. Antitumoral Activity and Embryotoxicity
On day 10, tumours began to be detectable. Treatments corresponding to different groups were administrated as described in Table 5. The increase in the inclusion complex's solubility (in aqueous media) correlates appropriately with an increase in bioavailability, observing a greater antitumor effect in the new inclusion complex (DiMeOC-Mg-BCD, 30%, see Figure 14).
In our work, designing and synthesizing a homoleptic metal complex of dimethoxy curcumin with magnesium (DiMeOC-Mg) and their inclusion complex (DiMeOC-Mg-BCD) demonstrated a promising strategy for improving its cytotoxic effect and partial tumour regression in ovo (see Figure 13). Curcumin and curcuminoids are of broad interest as cytotoxic agents against several cancer cell lines or as antitumoral compounds. Research about new curcuminoid formulations aims to increase their bioavailability.
DiMeOC-Mg and DiMeOC-Mg-BCD did not produce any abnormality or embryo death. Our embryotoxicity results agree with Strojny et al.[51], who reported that curcumin did not produce any sign of embryotoxicity. Figure 15 shows that dead embryos were present in the control, paclitaxel, DiMeOC-Mg, and DiMeOC-Mg-BCD groups at different doses unrelated to experimental compounds (P = 0.6540). No abnormality was observed in chicken embryos.
4. Materials and Methods
All the chemicals were commercially available by Sigma-Aldrich and were user without purification process. Melting points were recorded using an electrothermal engineering IA9100X1 melting point apparatus, and the values are uncorrected[68].
The spectra IR-ATR determinations were recorded in the 4000–400 cm−1 range and using an equipment FT-IR NICOLET IS-50, Thermo Fisher Scientific spectrophotometer.
Mass spectra were obtained using a JEOL SX 102 A spectrometer equipped with MALDI-Flight time technology or using the MStation JMS-700 JEOL equipment (Electron Ionization, 70 eV, 250 °C, Impact positive mode and calibration standard with perfluorokerosene) and the AccuTOF JMS-T100LC JEOL equipment (DART+, 350 °C, positive ion mode and calibration standard with PEG 600)[20,69].
1H and 13C NMR liquid spectra were acquired in dimethyl sulfoxide (DMSO-d6) or deuterium oxide (D2O) on a Bruker Fourier 400 MHz spectrometer with TMS serving as the internal reference and NMR spectra were processed with MestreNova software 12.0.3.3.[70].
DOSY was acquired with a JEOL 400 MHz (JNM JEOL ECZ 400S) equipment, using the pulse sequence One-shot-DOSY, with a grad_1_amp 30 [min] and grad_2_amp 280 [min], with the follow parameters: sw = 20 ppm; at = 3.0 s; d1 = 5.0 s; nt = 32; lb = 0.1 Hz, diffusion time 500 ms, for the NMR data acquisition was used a Jeol Delta 6.0 software, and for data processing was used MestreNova software 12.0.3.3.[70]
UV–Visible. The maxima absorption measurements were recorded with an UV–Visible Shimadzu, U160 spectrophotometer. The aqueous (PBS) solubility of DiMeOC-Mg and DiMeOC-Mg-BCD were determined by the shake-flask method in triplicate (see Supporting information) and the quantification was performed by interpolation using a calibration curve previously constructed (see Supplementary material), and the determinations were analyzed by UV-vis spectroscopy at 415 nm with an enzyme-linked immunosorbent assay (ELISA) plate reader equipment (Bio-Tek Instruments, Winooski, VT, USA). Phases solubility studies were carried out according to Higuchi and Connors methods [71](see Supplementary material). Briefly and 2 mg of DiMeOC-Mg was added to a series different mole fraction of BCD (0.0, 0.125, 0.25, 0.5, 0.75, 1.0 and 1.25) in PBS medium after being shaken for 48 hours, the solution was filtered through sintered filter of 0.45 μM and the amount dissolved in each solution was measurement at 415 nm.
HPLC chromatograms were recorded using an Agilent 1260 infinity II with diode -UV detector at 417 nm, column Spherisorb 25 mm x 4.6 mm x 5 mm, eluting with a solvent isocratic acetonitrile/water (formic acid 0.02%) 55/45 and flow 1.0 mL/min [72].
13C CPMAS ssNMR spectra were recorded using a Jeol 600 MHz spectrometer (15.0 kHz of MAS) with adamantane as the reference (298 K).
The surface morphology images were recorded for BCD, DiMeOC, DiMeOC-Mg and DiMeOC-Mg-BCD and for analysis of Scanning Electronic Microscopy (SEM) the images were captured with a VEGA3 model microscope (TESCAN, Brno, Czech Republic).
TGA and DSC was carried out with a thermobalance (thermo analyzer Netzsch model STA 449 F3 Jupiter) using an aluminum crucible 25/40 µl, outer bottom Ø 5 mm (NETZSCH). The sample was heated from 25 ° to 550 °C at a heating rate of 10 °C min-1 under a nitrogen atmosphere[53].
The human breast epithelial cell lines MDA-MB-231, an estrogen receptor-negative cell line derived from a metastatic carcinoma obtained from American Type Culture Collection (ATCC; Manassas, VA, USA), were used in this study. MDA-MB-231 cells in Dulbecco’s Modified Eagle Medium (DMEM) medium supplemented with 10% fetal bovine serum (FBS), 2 mM L-glutamine, 10000 units/ml penicillin G sodium, 10000 μg/ml streptomycin sulfate, 25 μg Amphotericin B (Gibco) and 1% of non-essential amino acids (Gibco). The cell lines were kept at 37 °C in a humidified atmosphere of 5% CO2, and cell viability exceeded 95%.
We used a protein-binding dye sulforhodamine B (SRB) colourimetric assay[73]. A suspension of 100 μl containing 5000-10000 cells per well were cultured into 96 micro-litre plates (Costar). Different concentrations of DiMeOC-Mg-BCD and control vehicle DMSO 1.3%, incubated at 37 °C for 48 h in a 5% CO2 atmosphere were used. Subsequently, cells were fixed on the plastic substratum by adding 50 μl of cold aqueous 50% trichloroacetic acid for 48 h. Then, cells were removed from the tissue culture flask by treatment with trypsin and diluted with fresh media from the cell. The plates were incubated at 4 °C for one hour, washed with water, and air-dried. The addition of 4 % SRB stained trichloroacetic acid-fixed cells. The free SRB was removed by washing with 1% aqueous acetic acid, the plates were air-dried, and the dye was solubilized by adding 10 mM unbuffered Tris-base (100 μl). The plates were placed on a shaker for 10 min, and the absorption was measured at 515 nm using an ELISA plate reader (Bio Tex Instruments). The cell viability of MDA-MB-231, cells cultured in the presence of the assessed compounds was calculated as a percentage of the control cells, and the CC50 values were obtained from dose–response curves. All experiments were performed in triplicate, and the CC50 was calculated using GraphPad Software 6.0 (GraphPad Inc., San Diego, CA, USA). The results are expressed as the mean of CC50 relative to vehicle and control.
To evaluate the morphological alterations induced by the DiMeOC-Mg-BCD complex on MDA-MB-231. Cell lines were cultured on a tissue culture flask with DiMeOC-Mg-BCD (CC50) and different treatments for 48 h. After incubation, cells were washed two times with PBS, fixed with methanol 100 %, and stained with Wright-Giemsa (Sigma-Aldrich, WG32-1L). The culture flasks were examined under an Olympus IX71 Inverted Fluorescence Phase Contrast Microscope. The images were recorded with a Nikon Coolpix 4300 digital camera using the 20x objectives and analyzed by ImageJ software [74].
The esterase activity and membrane damage were determined using the LIVE/DEAD Viability/Cytotoxicity Kit (Molecular et al., OR, USA). MDA-MB-231 (0.6 106/mL) were culture and incubated at 37 °C in 24 well plates and treated with DiMeOC-Mg-BCD (CC50). After 48 h incubation, cells were centrifuged at 3000 rpm for 10 min to remove the supernatant medium; the pellet was next resuspended in 997 µl of cold phosphate-buffered saline (PBS), 2 µl of a solution of Calcein-AM (C-AM) 50 µM and 1 µl of ethidium homodimer (Eth-1) 2 mM. Then, samples were incubated for 45 min at room temperature and immediately analyzed in a ThermoFisher Attune Flow Cytometer with a 530/30 nm filter (FL1-H) for calcein (green fluorescence/ living cells) and a 670 nm/long-pass filter (FL3-H) for Eth-1 (red fluorescence/dead cells), 20,000 events per treatment were acquired. The data were analyzed using FlowJo 7.3.2 software[75] and expressed as the percentage of cells for each population phenotype. The compensation was performed using live cells grown in DMSO, unstained and stained with C-AM and dead cells by heat (65 °C for 15 min) stained with Eth-1 as dead cells control. EF
Double staining for annexin V-fluorescein isothiocyanate (AV-FITC) and propidium iodide (PI) was performed with the Annexin-V apoptosis detection kit (Molecular Probes, Eugene, OR, USA). MDA-MB-231 cells were treated with DiMeOC-Mg-BCD (CC50), or control and vehicle DMSO for 48 h. Cells were washed twice in cold annexin V-buffer and centrifuged at 3000 rpm for 10 min. Pellets were resuspended in 20 μL of annexin V FITC, and after 15 min of incubation in the dark, 480 μL of annexin V-buffer containing 0.5 mg/mL of PI was added according to the manufacturer’s instructions. Annexin V-FITC labelling was recorded on a ThermoFisher Attune Flow Cytometer and analyzed using the FlowJo 7.3.2 software[75]. (Rodríguez-Hernández et al., 2020).
To evaluate the effect of DiMeOC-Mg-BCD on cell migration, the Wound-Healing assay was carried in a mammary cancer derived cell line (MDA-MB-231), 2 x 10⁵ cells per well were seeded in 24-well plate and cultured at 38 °C and 5% CO2 until confluence reached 90-100%. Then, an artificial space called wound was made on the cell monolayer using a 200 μL sterile micropipette tip, then washed with PBS to remove suspended cells, the supernatant was removed and replaced with new supplemented medium with DiMeOC-Mg-BCD and vehicle dimethyl sulfoxide (DMSO) and incubated for 48 h. We tested with DiMeOC-Mg-BCD (at 1μM). The images were captured by an inverted microscope (DIAPHOT 300 Nikon®, Japan) with a digital camera (AmScope MD500) at 0 h, 24 h and 48 h treatment. Wound areas were obtained using polygon selection and the measure tool of ImageJ software[74]. The relative migration ratio (%) (RMR) = ((Wound area 0 h − Wound area 24 h or 48 h) ÷ Wound area 0 h) X 100). Results expressed triplicated experiments and significance was obtained by a two-way ANOVA with Tukey’s multiple comparisons test.
For the gene expression study, the cells were plated at a density of 150, 000 cells in six well plates with DMEM. Then, cells were incubated with DiMeOC-Mg-BCD for 48 h and RNA was extracted for gene expression studies. Gene expression was studied by extracting total RNA from treated cells using Trizol[76]. In all cases, the amount and quality of RNA were estimated spectrophotometrically at 260/280 nm using a Synergy HT (Biotek, USA), and a constant amount of RNA (2 µg) was reverse transcribed using the Maxima First Strand cDNA Synthesis kit for RT-qPCR (Thermo Scientific™, LT) according to the manufacturer’s instructions. Primers and probes for qPCR amplifications were designed by the Universal Probe Library Assay Design Center from Roche, and respective sequences are listed in Table 6. Identical RT-qPCR conditions were performed for all genes and in all cases, results were normalized against ribosomal protein L32 (RPL32) used as housekeeping gene. Real time RT-qPCR amplifications were carried on a LightCycler® 480 II (Roche), as previously described[77].
The statistical analyses were performed using Prism 6 software (GraphPad, San Diego, CA, USA)[78]. All the experiments represent the mean of three independent assays tested in duplicate and the data shown in the graphs are expressed as the mean ± standard deviation (SD). The data were analyzed using One-way analyses of variance (ANOVAs). Significant differences among means were identified using Dunnett's multiple comparisons tests. Values of p < 0.001 and p < 0.05 were considered statistically significant. For gene expression, the results are expressed as the mean ± S.D. Statistical differences were determined by one-way ANOVA followed by appropriate post hoc tests (Holm-Sidak method for pairwise comparisons), using a specialized software package [79](SigmaPlot 11.0, Jandel Scientific). Experiments were performed from three separated cell cultures and each variable was assessed in triplicate. Differences were considered statistically significant at p < 0.05
The antitumor tests were carried out in the in-ovo model by the company INOVOTION SAS, 5 Avenue du grand sablon 38700 La Tronche, France. Results were delivered with numbers of study: STU20220110, STU20220112, and STU20221017_CU. Double-blind testing was used, labelling the chemical compounds as FOIN-REH-M3 (Phase 1, corresponding to DiMeOC-Mg) and FOINS-REH-M3 (Phase 2, corresponding to DiMeOC-Mg-BCD). The methods used are briefly described here.
In Ovo chicken embryo experiment. Fertilized white Leghorn eggs were incubated at 37.5°C with 50% relative humidity for nine days. At that moment, the CAM was dropped by drilling a small hole through the eggshell into the airndow was cut in the eggshell above the CAM. At least 15 eggs wersurgical manipulation.
The antitumor tests were carried out in the in-ovo model by the company INOVOTION SAS, 5 Avenue du grand sablon 38700 La Tronche, France. Results were delivered with numbers of study: STU20220110, STU20220112, and STU20221017_CU. Double-blind testing was used, labelling the chemical compounds as FOIN-REH-M3 (Phase 1, corresponding to DiMeOC-Mg) and FOINS-REH-M3 (Phase 2, corresponding to DiMeOC-Mg-BCD). The methods used are briefly described here.
In Ovo chicken embryo experiment. Fertilized white Leghorn eggs were incubated at 37.5°C with 50% relative humidity for nine days. At that moment, the CAM was dropped by drilling a small hole through the eggshell into the air sac, and a 1 cm2 window was cut in the eggshell above the CAM. At least 15 eggs were grafted for each group because 10-15% of death may occur by invasive surgical manipulation.
Amplification and grafting of tumor Cells. MDA-MB-231 tumor cell line was cultivated in a DMEM medium supplemented with 10% FBS and 1% penicillin/streptomycin. On day 9, cells were detached with trypsin, washed with a complete medium, and suspended in a graft medium. An inoculum of 1 X 10⁶ cells was added onto the CAM of each egg, and then eggs were randomized into groups.
Quantitative evaluation of tumour growth. On day 18, the tumor was carefully removed, washed with PBS buffer, and then directly transferred in 4% paraformaldehyde solution for fixation for 48 h. After that, the tumors were weighed. A one-way ANOVA analysis with Student-Newman-Keuls post-test was done on the data (<0.05).
Quantitative evaluation of embryonic toxicity. Embryonic viability was checked daily. The number of dead embryos was counted on day 18 in combination with the observation of eventual visible gross abnormalities to evaluate treatment-induced embryotoxicity. Any visible abnormality observed during the study was also briefly described. A Kaplan-Meyer curve was used to evaluate the final death ratio.
4.1. Synthetic Procedures
The synthon was prepared according to the previously reported methodology and the spectroscopic data correspond adequately to the target compound previusly reported[46]. 2,2-difluoro-4,6-dimethyl-2H-1,3,2-dioxaborinin-1-ium-2-uide (Synthon, 1), Yield 95%, solid amber, melting point 40 °C. 1H NMR (400 MHz, CDCl3, TMS): δ 5.96 (s, 1H), 2.27 (s, 6H); 13C NMR (100 MHz, CDCl3, TMS): δ 192.63, 102.12, 24.32. This data coincided with literature
The aldolic condensation of 3,4-dimethoxybenzaldehyde (2 moles) was realized with experimental conditions reported in the literature[80,81].
Dimethoxycurcumin-BF2, 2: 4,6-bis((E)-3,4-dimethoxystyryl)-2,2-difluoro-2H-1λ3,3,2λ4-dioxaborinine: yield 85%, violet powder, m.p. = 226 °C. 1H NMR (400 MHz, DMSO-d6) δ 7.97 (d, J = 15.6 Hz, 2H), 7.50 (d, J = 2.0 Hz, 2H), 7.47 (dd, J = 8.3, 2.0 Hz, 2H), 7.12 (d, J = 15.6 Hz, 2H), 7.08 (d, J = 8.3 Hz, 2H), 6.50 (s, 1H), 3.84 (s, 12H). 13C NMR (100 MHz, DMSO-d6) δ 179.07, 152.58, 149.13, 146.86, 127.13, 125.20, 118.88, 111.81, 111.23, 101.42, 55.79, 55.69. IR 3115 cm−1, 2943 cm−1, 2836 cm−1, 1615 cm−1, 1583 cm−1, 1546 cm−1, 1509 cm−1, 1267 cm−1, 1159 cm−1, 1140 cm−1, 967 cm−1, 821 cm−1, 604 cm−1. MS: m/z = 444 m/z calc = 444.23 for C23H23BF2O6
Synthesis of ligand dimetoxycurcumin: the removal of BF2 group is obtained using metanol and alumina under similar experimental conditions previously reported[46].
DiMeOC, 3: (1E,4Z,6E)-1,7-bis(3,4-dimethoxyphenyl)-5-hydroxyhepta-1,4,6-trien-3-one: yield 90%, orange powder, m.p. = 130°C. 1H NMR (400 MHz, DMSO-d6) δ 7.59 (d, J = 15.9 Hz, 2H), 7.35 (d, J = 2.0 Hz, 2H), 7.26 (dd, J = 8.6, 2.0 Hz, 2H), 7.03 – 6.98 (m, 2H), 6.82 (d, J = 15.9, 2H), 6.10 (s, 1H), 3.83 (s, 6H), 3.80 (s, 6H). 13C NMR (100 MHz, DMSO-d6) δ 183.19, 150.96, 149.02, 140.40, 127.56, 122.90, 122.03, 111.67, 110.47, 100.99, 55.57. The IR spectrum and MS data are the same to previously analysis and coincided for the compound with molecular formula C23H24O6.
The synthesis of the magnesium metal complex, was carried our as follows[21]: 1 mmol of DiMeOC was dissolved in 15 mL of EtAcO later 0.6 mmol of magnesium(II) acetate. 4H2O dissolved in MeOH was added drop by drop. The mixture of reaction was stirred during 24 h. A yellow fine powder was filtered off in vacuo and washed with H2O.
DiMeOC-Mg, 4: magnesium (1E,3Z,6E)-1,7-bis(3,4-dimethoxyphenyl)-5-oxohepta-1,3,6-trien-3-olate: yield 80%, yellow powder, m.p. = 230 °C. 1H NMR (400 MHz, DMSO-d6) δ 7.36 (d, J = 15.6 Hz, 2H), 7.25 (s, 2H), 7.13 (d, J = 8.3 Hz, 2H), 6.95 (d, J = 8.4 Hz, 2H), 6.71 (d, J = 15.6 Hz, 2H), 5.64 (s, 1H), 3.81 (s, 6H), 3.78 (s, 6H). 13C NMR (100 MHz, DMSO-d6) δ 181.24, 149.74, 148.99, 135.81, 128.77, 121.44, 111.72, 109.82, 103.06, 55.54, 55.51. IR 3349 cm−1, 2934 cm−1, 2833 cm−1, 1627 cm−1, 1598 cm−1, 1581 cm−1, 1544 cm−1, 1507 cm−1, 1439 cm−1, 1255 cm−1, 1024 cm−1, 809 cm−1, 470 cm−1. MS-MALDI-TOF: m/z = 817.118 m/z calc = 817.29 for C46H46MgO12.
The inclusion complex was prepared via the coprecipitation method[43,48], using the following procedure: In a round flask of 250 mL was dissolved 1 mmol of beta-cyclodextrin (BCD) in 100 mL of distilled water, later 1 mmol of magnesium metal complex (DiMeOC-Mg) dissolved in 100 mL acetone was added dropwise, the mixture was left in continuous stirring at room temperature for 12 hours. Afterwards one yellow precipitate was filtered and washed with distilled water/acetone 1:1 to remove residual BCD or DiMeOC-Mg, precipitate was dried in high vacuum.
DiMeOC-Mg-BCD, 5 (Inclusion complex), yield 75%, pale yellow powder, m.p. = 320 °C. 1H NMR (400 MHz, DMSO-d6) δ 7.34 (d, J = 15.6 Hz, 4H), 7.25 (d, J = 2.0 Hz, 4H), 7.13 (dd, J = 8.4, 1.9 Hz, 4H), 6.95 (d, J = 8.4 Hz, 4H), 6.70 (d, J = 15.6 Hz, 4H), 5.74 (s, 7H), 5.69 (s, 7H), 5.63 (s, 2H), 4.83 (d, J = 3.6 Hz, 7H), 4.46 (t, J = 5.6 Hz, 7H), 3.81 (s, 12H), 3.78 (s, 12H), 3.64 (M, 14H), 3.57(m, 7H), 3.34 (m, 21H). 13C NMR (100 MHz, DMSO-d6) δ 181.22, 149.73, 148.98, 135.79, 128.76, 121.45, 111.73, 109.81, 103.01, 101.95, 81.55, 73.06, 72.43, 72.04, 59.92, 55.54, 55.50. IR 3386 cm−1, 2930 cm−1, 2836 cm−1, 1628 cm−1, 1600 cm−1, 1582 cm−1, 1550 cm−1, 1510 cm−1, 1438 cm−1, 1420 cm−1, 1264 cm−1, 1157 cm−1, 1139 cm−1, 1026 cm−1. MS-ESI: m/z = 1949.8 m/z calc = 1950.15 for C88H116MgO47
5. Conclusions
A rational design was undertaken based on three simple concepts: a) synthesis of curcuminoids, b) synthesis of the corresponding metal complexes, and c) preparation of their inclusion complexes to render a more soluble, stable, and bioavailable formulation to optimize the cytotoxic and antitumoral effects.
The DiMeOC-Mg-BCD formulation contributes a promising result that could enhance the effectiveness of conventional chemotherapy, including radiation therapy, and even reduce the associated side effects and increase the overall efficacy as an antitumoral agent.
DiMeOC-Mg and DiMeOC-Mg-BCD had antitumoral activity against the MDA-MB-231 cell line. DiMeOC-Mg at a dose of 1.5 mg/Kg reduced tumour weight by 16.5%, while DiMeOC-Mg-BCD at 0.065 and 0.65 mg/Kg, 29.45% and 33.76%, respectively, in chicken embryos. Furthermore, none of the compounds tested induced embryotoxicity (abnormalities or death in ovo). DiMeOC-Mg-BCD has excellent potential to be used as a therapeutic agent in the battle against breast cancer.
The present study strengthens the importance of formulating antitumor inclusion complexes from metal complexes of curcuminoids and may help expand the search for new formulations aimed at treating different types of malignant tumours and relieving human ailments.
6. Patents
An application for a patent is underway in the country of the authors.
Supplementary Materials
The following supporting information can be downloaded at the website of this paper posted on Preprints.org.
Author Contributions
Conceptualization, R.G.E., and M.A.O.-M.; methodology, W.M.-M., K.D.R.-H., M.T.R.-A., L.L.P.-G., R.T.-H., M. I.C., D.B.-H, M.G.-O, B.M.-T., M.A.O.-M.; validation, R.G.E., formal analysis, M.M.E.-C., R.S.-O., M.A.O.-M and R.G.E.; investigation, W.M.-M., K.D.R.-H., M.M.E.-C., L.L.P.-G., R.T.-H, M.T.R.-A, A.N.C., D.B.-H, M.G.-O, B.M.-T., M. I.C., R.S.-O., M.A.O.-M; resources, R.G.E.; data curation, W.M.-M., K.D.R.-H., M.M. E.-C., D.B.-H, M.G.-O, M.A.O.M, R.G.E; writing—original draft preparation, W.M.-M., K.D.R.-H., M.M.E.-C., M.A.O.-M. R.G.E; writing—review and editing, M.M.E.-C., R.T.-H., R.S.-O., M.A.O.-M. R.G.E; visualization, M.A.O.-M and R.G.E.; supervision, R.G.E.; project administration, R.G.E.; funding acquisition, R.G.E. All authors have read and agreed to the published version of the manuscript.
Funding
“This research was funded by CONAHCyT- FOINS-PRONACES 307152” and “PAPIIT DGAPA, UNAM, IT200720”.
Institutional Review Board Statement
informed in the numbers of study INOVOTION SAS: STU20220110, and STU20220112, and STU20221017_CU.
Acknowledgments
The payment of fees from CONAHCYT-FOINS-PRONACES 307152 to W.M.-M, and M.A.O.-M. is gratefully acknowledged. K.D.R.-H. thanks for the post-doctoral fellowship (1655) from DGAPA-UNAM. We are indebted to Adriana Romo Pérez (IR), Elizabeth Huerta Salazar and María de los Ángeles Peña González (NMR), María del Carmen García González (EM), Eréndira García and Lucero Ríos (HPLC) from Instituto de Química-UNAM and Rosa Isela del Villar (ssNMR) from USAII-UNAM and Alejandra Núñez (TGA and DSC) from CCIQS UAEM-UNAM. We also would like to thank LABNALCIT, IIB-UNAM and Carlos Castellanos Barba and Aleida Nuñez for assistance in Flow Cytometry and Miguel Tapia Rodríguez for assistance in microscopy analysis.
Conflicts of Interest
The authors declare no conflict of interest.
References
- Farghadani, R.; Naidu, R. Curcumin: Modulator of Key Molecular Signaling Pathways in Hormone-Independent Breast Cancer. Cancers (Basel) 2021, 13. [CrossRef]
- Dai, X.; Xiang, L.; Li, T.; Bai, Z. Cancer Hallmarks, Biomarkers and Breast Cancer Molecular Subtypes. J Cancer 2016, 7, 1281–1294. [CrossRef]
- Zhao, Y.Y.; Li, J.; Wang, H.Q.; Zheng, H.B.; Ma, S.W.; Zhou, G.Z. Activation of Autophagy Promotes the Inhibitory Effect of Curcumin Analog EF-24 against MDA-MB-231 Cancer Cells. J Biochem Mol Toxicol 2024, 38. [CrossRef]
- Ali, A.; Ali, A.; Tahir, A.; Bakht, M.A.; Salahuddin; Ahsan, M.J. Molecular Engineering of Curcumin, an Active Constituent of Curcuma Longa L. (Turmeric) of the Family Zingiberaceae with Improved Antiproliferative Activity. Plants 2021, 10. [CrossRef]
- Orona-ortiz, A.; Medina-torres, L.; Velázquez-moyado, J.A.; Pineda-peña, E.A.; Balderas-lópez, J.L.; Bernad-bernad, M.J.; Carlos, J.; Carvalho, T.; Navarrete, A. Mucoadhesive Effect of Curcuma Longa Extract and Curcumin Decreases the Ranitidine Effect , but Not Bismuth Subsalicylate on Ethanol-Induced Ulcer Model. Sci Rep 2019, 9, 16622–16633. [CrossRef]
- Zhang, Q.; Fu, Y.; Wang, H.W.; Gong, T.; Qin, Y.; Zhang, Z.R. Synthesis and Cytotoxic Activity of Novel Curcumin Analogues. Chinese Chemical Letters 2008, 19, 281–285. [CrossRef]
- Kunwar, A.; Barik, A.; Mishra, B.; Rathinasamy, K.; Pandey, R.; Priyadarsini, K.I. Quantitative Cellular Uptake, Localization and Cytotoxicity of Curcumin in Normal and Tumor Cells. Biochim Biophys Acta Gen Subj 2008, 1780, 673–679. [CrossRef]
- Chen, C.Y.; Lien, J.C.; Chen, C.Y.; Hung, C.C.; Lin, H.C. Design, Synthesis and Evaluation of Novel Derivatives of Curcuminoids with Cytotoxicity. Int J Mol Sci 2021, 22. [CrossRef]
- Kong, Y.; Ma, W.; Liu, X.; Zu, Y.; Fu, Y.; Wu, N.; Liang, L.; Yao, L.; Efferth, T. Cytotoxic Activity of Curcumin towards CCRF-CEM Leukemia Cells and Its Effect on DNA Damage. Molecules 2009, 14, 5328–5338. [CrossRef]
- Nguyen, N.T.; Nguyen, N.N.T.; Tran, N.T.N.; Le, P.N.; Nguyen, T.B.T.; Nguyen, N.H.; Bach, L.G.; Doan, V.N.; Tran, H.L.B.; Le, V.T.; et al. Synergic Activity against MCF-7 Breast Cancer Cell Growth of Nanocurcumin-Encapsulated and Cisplatin-Complexed Nanogels. Molecules 2018, 23. [CrossRef]
- Zamrus, S.N.H.; Akhtar, M.N.; Yeap, S.K.; Quah, C.K.; Loh, W.S.; Alitheen, N.B.; Zareen, S.; Tajuddin, S.N.; Hussin, Y.; Shah, S.A.A. Design, Synthesis and Cytotoxic Effects of Curcuminoids on HeLa, K562, MCF-7 and MDA-MB-231 Cancer Cell Lines. Chem Cent J 2018, 12, 1–10. [CrossRef]
- Strojny, B.; Grodzik, M.; Sawosz, E.; Winnicka, A.; Kurantowicz, N.; Jaworski, S.; Kutwin, M.; Urbańska, K.; Hotowy, A.; Wierzbicki, M.; et al. Diamond Nanoparticles Modify Curcumin Activity: In Vitro Studies on Cancer and Normal Cells and in Ovo Studies on Chicken Embryo Model. PLoS One 2016, 11. [CrossRef]
- Lateh, L.; Kaewnopparat, N.; Yuenyongsawad, S.; Panichayupakaranant, P. Enhancing the Water-Solubility of Curcuminoids-Rich Extract Using a Ternary Inclusion Complex System: Preparation, Characterization, and Anti-Cancer Activity. Food Chem 2022, 368. [CrossRef]
- Anand, P.; Kunnumakkara, A.B.; Newman, R.A.; Aggarwal, B.B. Bioavailability of Curcumin: Problems and Promises. Mol Pharm 2007, 4, 807–818. [CrossRef]
- Siviero, A.; Gallo, E.; Maggini, V.; Gori, L.; Mugelli, A.; Firenzuoli, F.; Vannacci, A. Curcumin, a Golden Spice with a Low Bioavailability. J Herb Med 2015, 5, 57–70. [CrossRef]
- Amalraj, A.; Pius, A.; Gopi, S.; Gopi, S. Biological Activities of Curcuminoids, Other Biomolecules from Turmeric and Their Derivatives – A Review. J Tradit Complement Med 2017, 7, 205–233. [CrossRef]
- Ajavakom, V.; Yutthaseri, T.; Chantanatrakul, R.; Suksamrarm, A.; Ajavakom, A. Curcuminoids in Multi-Component Synthesis. J Heterocycl Chem 2017, 46, 1259–1265. [CrossRef]
- Teymouri, M.; Barati, N.; Pirro, M.; Sahebkar, A. Biological and Pharmacological Evaluation of Dimethoxycurcumin: A Metabolically Stable Curcumin Analogue with a Promising Therapeutic Potential. J Cell Physiol 2018, 233, 124–140. [CrossRef]
- Khan, N.; Afghah, Z.; Baral, A.; Geiger, J.D.; Chen, X. Dimethoxycurcumin Acidifies Endolysosomes and Inhibits SARS-CoV-2 Entry. Frontiers in Virology 2022, 2. [CrossRef]
- Meza-Morales, W.; Machado-Rodriguez, J.C.; Alvarez-Ricardo, Y.; Obregón-Mendoza, M.A.; Nieto-Camacho, A.; Toscano, R.A.; Soriano-García, M.; Cassani, J.; Enríquez, R.G. A New Family of Homoleptic Copper Complexes of Curcuminoids: Synthesis, Characterization and Biological Properties. Molecules 2019, 24, 1–17. [CrossRef]
- Meza-Morales, W.; Mirian Estévez-Carmona, M.; Alvarez-Ricardo, Y.; Obregón-Mendoza, M.A.; Cassani, J.; Ramírez-Apan, M.T.; Escobedo-Martínez, C.; Soriano-García, M.; Reynolds, W.F.; Enríquez, R.G. Full Structural Characterization of Homoleptic Complexes of Diacetylcurcumin with Mg, Zn, Cu, and Mn: Cisplatin-Level Cytotoxicity in Vitro with Minimal Acute Toxicity in Vivo. Molecules 2019, 24. [CrossRef]
- Mohammadi, K.; Thompson, K.H.; Patrick, B.O.; Storr, T.; Martins, C.; Polishchuk, E.; Yuen, V.G.; McNeill, J.H.; Orvig, C. Synthesis and Characterization of Dual Function Vanadyl, Gallium and Indium Curcumin Complexes for Medicinal Applications. J Inorg Biochem 2005, 99, 2217–2225. [CrossRef]
- Meza-Morales, W.; Alvarez-Ricardo, Y.; Obregón-Mendoza, M.A.; Arenaza-Corona, A.; Ramírez-Apan, M.T.; Toscano, R.A.; Poveda-Jaramillo, J.C.; Enríquez, R.G. Three New Coordination Geometries of Homoleptic Zn Complexes of Curcuminoids and Their High Antiproliferative Potential. RSC Adv 2023, 13, 8577–8585. [CrossRef]
- Kim, J.Y.; Song, M.; Kim, M.S.; Natarajan, P.; Do, R.; Myung, W.; Won, H.H. An Atlas of Associations between 14 Micronutrients and 22 Cancer Outcomes: Mendelian Randomization Analyses. BMC Med 2023, 21, 1–12. [CrossRef]
- Li, T.; Yu, Y.; Shi, H.; Cao, Y.; Liu, X.; Hao, Z.; Ren, Y.; Qin, G.; Huang, Y.; Wang, B. Magnesium in Combinatorial With Valproic Acid Suppressed the Proliferation and Migration of Human Bladder Cancer Cells. Front Oncol 2020, 10, 1–17. [CrossRef]
- Mendes, P.M.V.; Bezerra, D.L.C.; dos Santos, L.R.; de Oliveira Santos, R.; de Sousa Melo, S.R.; Morais, J.B.S.; Severo, J.S.; Vieira, S.C.; do Nascimento Marreiro, D. Magnesium in Breast Cancer: What Is Its Influence on the Progression of This Disease? Biol Trace Elem Res 2018, 184, 334–339. [CrossRef]
- Gupta, A.A.; Shekatkar, M.; Raj, A.T.; Kheur, S. Potential Role of Magnesium in Cancer Initiation and Progression. Pathology and Oncology Research 2020, 26, 2001–2002. [CrossRef]
- Uçmak, Z.G.; Koenhemsi, L.; Uçmak, M.; Yalçın, E.; Ateş, A.; Gönül, R. Evaluation of Serum and Tissue Magnesium, Vascular Endothelial Growth Factor, and Osteopontin Levels in Dogs with Mammary Tumors with/without Pulmonary Metastases and in Healthy Dogs*. J Elem 2021, 26, 125–135. [CrossRef]
- Bezerra, D.L.C.; Mendes, P.M.V.; Melo, S.R. de S.; dos Santos, L.R.; Santos, R. de O.; Vieira, S.C.; Henriques, G.S.; Freitas, B. de J. e. S. de A.; Marreiro, D. do N. Hypomagnesemia and Its Relationship with Oxidative Stress Markers in Women with Breast Cancer. Biol Trace Elem Res 2021, 199, 4466–4474. [CrossRef]
- Chen, Y.; Wu, Q.; Zhang, Z.; Yuan, L.; Liu, X.; Zhou, L. Preparation of Curcumin-Loaded Liposomes and Evaluation of Their Skin Permeation and Pharmacodynamics. Molecules 2012, 17, 5972–5987. [CrossRef]
- Woźniak, M.; Nowak, M.; Lazebna, A.; Więcek, K.; Jabłońska, I.; Szpadel, K.; Grzeszczak, A.; Gubernator, J.; Ziółkowski, P. The Comparison of in Vitro Photosensitizing Efficacy of Curcumin-Loaded Liposomes Following Photodynamic Therapy on Melanoma Mug-Mel2, Squamous Cell Carcinoma Scc-25, and Normal Keratinocyte Hacat Cells. Pharmaceuticals 2021, 14. [CrossRef]
- Araya-Sibaja, A.M.; Wilhelm-Romero, K.; Quirós-Fallas, M.I.; Huertas, L.F.V.; Vega-Baudrit, J.R.; Navarro-Hoyos, M. Bovine Serum Albumin-Based Nanoparticles: Preparation, Characterization, and Antioxidant Activity Enhancement of Three Main Curcuminoids from Curcuma Longa. Molecules 2022, 27. [CrossRef]
- Hettiarachchi, S.S.; Dunuweera, S.P.; Dunuweera, A.N.; Rajapakse, R.M.G. Synthesis of Curcumin Nanoparticles from Raw Turmeric Rhizome. ACS Omega 2021, 6, 8246–8252. [CrossRef]
- Romero, K.W.; Quirós, M.I.; Huertas, F.V.; Vega-Baudrit, J.R.; Navarro-Hoyos, M.; Araya-Sibaja, A.M. Design of Hybrid Polymeric-Lipid Nanoparticles Using Curcumin as a Model: Preparation, Characterization, and in Vitro Evaluation of Demethoxycurcumin and Bisdemethoxycurcumin-Loaded Nanoparticles. Polymers (Basel) 2021, 13. [CrossRef]
- Khan, M.J.; Shameli, K.; Sazili, A.Q.; Selamat, J.; Kumari, S. Rapid Green Synthesis and Characterization of Silver Nanoparticles Arbitrated by Curcumin in an Alkaline Medium. Molecules 2019, 24. [CrossRef]
- Boarescu, P.M.; Boarescu, I.; Bocșan, I.C.; Gheban, D.; Bulboacă, A.E.; Nicula, C.; Pop, R.M.; Râjnoveanu, R.M.; Bolboacă, S.D. Antioxidant and Anti-Inflammatory Effects of Curcumin Nanoparticles on Drug-Induced Acute Myocardial Infarction in Diabetic Rats. Antioxidants 2019, 8, 1–18. [CrossRef]
- Patro, N.M.; Sultana, A.; Terao, K.; Nakata, D.; Jo, A.; Urano, A.; Ishida, Y.; Gorantla, R.N.; Pandit, V.; Devi, K.; et al. Comparison and Correlation of in Vitro, in Vivo and in Silico Evaluations of Alpha, Beta and Gamma Cyclodextrin Complexes of Curcumin. J Incl Phenom Macrocycl Chem 2014, 78, 471–483. [CrossRef]
- Moussa, Z.; Hmadeh, M.; Abiad, M.G.; Dib, O.H.; Patra, D. Encapsulation of Curcumin in Cyclodextrin-Metal Organic Frameworks: Dissociation of Loaded CD-MOFs Enhances Stability of Curcumin. Food Chem 2016, 212, 485–494. [CrossRef]
- Low, Z.X.; Teo, M.Y.M.; Nordin, F.J.; Dewi, F.R.P.; Palanirajan, V.K.; In, L.L.A. Biophysical Evaluation of Water-Soluble Curcumin Encapsulated in β-Cyclodextrins on Colorectal Cancer Cells. Int J Mol Sci 2022, 23. [CrossRef]
- Benucci, I.; Mazzocchi, C.; Lombardelli, C.; Del Franco, F.; Cerreti, M.; Esti, M. Inclusion of Curcumin in B-Cyclodextrin: A Promising Prospective as Food Ingredient. Food Additives and Contaminants - Part A 2022, 39, 1942–1952. [CrossRef]
- Alizadeh, N.; Malakzadeh, S. Changes in Chemical Stability and Bioactivities of Curcumin by Forming Inclusion Complexes of Beta- and Gama-Cyclodextrins. Journal of Polymer Research 2020, 27. [CrossRef]
- Ntuli, S.; Leuschner, M.; Bester, M.J.; Serem, J.C. Stability, Morphology, and Effects of In Vitro Digestion on the Antioxidant Properties of Polyphenol Inclusion Complexes with β-Cyclodextrin. Molecules 2022, 27. [CrossRef]
- Marcolino, V.A.; Zanin, G.M.; Durrant, L.R.; Benassi, M.D.T.; Matioli, G. Interaction of Curcumin and Bixin with β-Cyclodextrin: Complexation Methods, Stability, and Applications in Food. J Agric Food Chem 2011, 59, 3348–3357. [CrossRef]
- Mittal, A.; Nagpal, M.; Vashistha, V.K.; Arora, R.; Issar, U. Recent Advances in the Antioxidant Activity of Metal-Curcumin Complexes: A Combined Computational and Experimental Review. Free Radic Res 2024, 58, 11–26. [CrossRef]
- Miebach, L.; Berner, J.; Bekeschus, S. In Ovo Model in Cancer Research and Tumor Immunology. Front Immunol 2022, 13. [CrossRef]
- Obregón-Mendoza, M.A.; Meza-Morales, W.; Alvarez-Ricardo, Y.; Estévez-Carmona, M.M.; Enríquez, R.G. High Yield Synthesis of Curcumin and Symmetric Curcuminoids: A “Click” and “Unclick” Chemistry Approach. Molecules 2023, 28. [CrossRef]
- Li, H.; Qiu, Z.; Li, F.; Wang, C. The Relationship between MMP-2 and MMP-9 Expression Levels with Breast Cancer Incidence and Prognosis. Oncol Lett 2017, 14, 5865–5870. [CrossRef]
- Arya, P.; Raghav, N. In-Vitro Studies of Curcumin-β-Cyclodextrin Inclusion Complex as Sustained Release System. J Mol Struct 2021, 1228, 129774. [CrossRef]
- Pessine, F.B.T.,; Calderini, Adriana.,; Alexandrino., G.L. Review: Cyclodextrin Inclusion Complexes Probed by NMR Techniques. Magnetic Resonance Spectroscopy 2012, 237–262. [CrossRef]
- Jahed, V.; Zarrabi, A.; Bordbar, A.K.; Hafezi, M.S. NMR (1H, ROESY) Spectroscopic and Molecular Modelling Investigations of Supramolecular Complex of β-Cyclodextrin and Curcumin. Food Chem 2014, 165, 241–246. [CrossRef]
- Kida, T.; Iwamoto, T.; Fujino, Y.; Tohnai, N.; Miyata, M.; Akashi, M. Strong Guest Binding by Cyclodextrin Hosts in Competing Nonpolar Solvents and the Unique Crystalline Structure. Org Lett 2011, 13, 4570–4573. [CrossRef]
- dos Santos, C.; Buera, P.; Mazzobre, F. Novel Trends in Cyclodextrins Encapsulation. Applications in Food Science. Curr Opin Food Sci 2017, 16, 106–113. [CrossRef]
- Yallapu, M.M.; Jaggi, M.; Chauhan, S.C. β-Cyclodextrin-Curcumin Self-Assembly Enhances Curcumin Delivery in Prostate Cancer Cells. Colloids Surf B Biointerfaces 2010, 79, 113–125. [CrossRef]
- Gao, S.; Bie, C.; Ji, Q.; Ling, H.; Li, C.; Fu, Y.; Zhao, L.; Ye, F. Preparation and Characterization of Cyanazine-Hydroxypropyl-Beta-Cyclodextrin Inclusion Complex. RSC Adv 2019, 9, 26109–26115. [CrossRef]
- Mazurek, A.H.; Szeleszczuk, Ł.; Bethanis, K.; Christoforides, E.; Dudek, M.K.; Zielińska-Pisklak, M.; Pisklak, D.M. 17-β-Estradiol—β-Cyclodextrin Complex as Solid: Synthesis, Structural and Physicochemical Characterization. Molecules 2023, 28. [CrossRef]
- Hagbani, T. Al; Nazzal, S. Curcumin Complexation with Cyclodextrins by the Autoclave Process: Method Development and Characterization of Complex Formation. Int J Pharm 2017, 520, 173–180. [CrossRef]
- Welsh, J.E. Animal Models for Studying Prevention and Treatment of Breast Cancer. In Animal Models for the Study of Human Disease; Elsevier, 2013; pp. 997–1018 ISBN 9780124158948.
- Stoica, L.; Stoica, B.A.; Olinici, D.; Onofrei, P.; Botez, E.A.; Cotrutz, C.E. Correlations between Morphological Changes Induced by Curcumin and Its Biological Activities. Rom J Morphol Embryol 2018, 59, 65–69.
- Ahmad, I.; Ahmad, S.; Ahmad, A.; Zughaibi, T.A.; Alhosin, M.; Tabrez, S. Curcumin, Its Derivatives, and Their Nanoformulations: Revolutionizing Cancer Treatment. Cell Biochem Funct 2024, 42. [CrossRef]
- Rodríguez-Hernández, K.D.; Martínez, I.; Reyes-Chilpa, R.; Espinoza, B. Mammea Type Coumarins Isolated from Calophyllum Brasiliense Induced Apoptotic Cell Death of Trypanosoma Cruzi through Mitochondrial Dysfunction, ROS Production and Cell Cycle Alterations. Bioorg Chem 2020, 100. [CrossRef]
- Tian, M.; Ma, Y.; Lin, W. Fluorescent Probes for the Visualization of Cell Viability. Acc Chem Res 2019, 52, 2147–2157. [CrossRef]
- Hu, S.; Xu, Y.; Meng, L.; Huang, L.; Sun, H. Curcumin Inhibits Proliferation and Promotes Apoptosis of Breast Cancer Cells. Exp Ther Med 2018, 16, 1266–1272. [CrossRef]
- Hanahan, D.; Weinberg, R.A. The Hallmarks of Cancer. Cell 2000, 100, 57–70.
- Kornblatt, A.P.; Nicoletti, V.G.; Travaglia, A. The Neglected Role of Copper Ions in Wound Healing. J Inorg Biochem 2016, 161, 1–8. [CrossRef]
- Yang, C.; Mai, Z.; Liu, C.; Yin, S.; Cai, Y.; Xia, C. Natural Products in Preventing Tumor Drug Resistance and Related Signaling Pathways. Molecules 2022, 27. [CrossRef]
- Manore, S.G.; Doheny, D.L.; Wong, G.L.; Lo, H.W. IL-6/JAK/STAT3 Signaling in Breast Cancer Metastasis: Biology and Treatment. Front Oncol 2022, 12. [CrossRef]
- Alaaeldin, R.; Ali, F.E.M.; Bekhit, A.A.; Zhao, Q.L.; Fathy, M. Inhibition of NF-KB/IL-6/JAK2/STAT3 Pathway and Epithelial-Mesenchymal Transition in Breast Cancer Cells by Azilsartan. Molecules 2022, 27. [CrossRef]
- Obregón-Mendoza, M.A.; Estévez-Carmona, M.M.; Hernández-Ortega, S.; Soriano-García, M.; Ramírez-Apan, M.T.; Orea, L.; Pilotzi, H.; Gnecco, D.; Cassani, J.; Enríquez, R.G. Retro-Curcuminoids as Mimics of Dehydrozingerone and Curcumin: Synthesis, NMR, X-Ray, and Cytotoxic Activity. Molecules 2017, 22. [CrossRef]
- Obregón-Mendoza, M.A.; Arias-Olguín, I.I.; Estévez-Carmona, M.M.; Meza-Morales, W.; Alvarez-Ricardo, Y.; Toscano, R.A.; Arenas-Huertero, F.; Cassani, J.; Enríquez, R.G. Non-Cytotoxic Dibenzyl and Difluoroborate Curcuminoid Fluorophores Allow Visualization of Nucleus or Cytoplasm in Bioimaging. Molecules 2020, 25. [CrossRef]
- Mestrelab Research. MNova Software. Available Online https://mestrelab.com/Download/Mnova/ . Accesed on March, 10, 2024.
- Higuchi T., S.F.M.L., K.T., R.J.H. Solubility Determination of Barely Aqueous-Soluble Organic Solids. J Pharm Sci 1979, 68, 1267–1272.
- Jadhav, B.K.; Mahadik, K.R.; Paradkar, A.R. Development and Validation of Improved Reversed Phase-HPLC Method for Simultaneous Determination of Curcumin, Demethoxycurcumin and Bis-Demethoxycurcumin. Chromatographia 2007, 65, 483–488. [CrossRef]
- Vichai, V.; Kirtikara, K. Sulforhodamine B Colorimetric Assay for Cytotoxicity Screening. Nat Protoc 2006, 1, 1112–1116. [CrossRef]
- Rueden, C.T.; Schindelin, J.; Hiner, M.C.; DeZonia, B.E.; Walter, A.E.; Arena, E.T.; Eliceiri, K.W. ImageJ2: ImageJ for the next Generation of Scientific Image Data. BMC Bioinformatics 2017, 18, 529. [CrossRef]
- Ashland, OR.; Becton-Dickinson; and Company. FlowJoTM Software for Mac Software Application Version 7.3.2. Available Online: https://www.flowjo.com. Accesed March, 10, 2024.
- Chomczynski, P.; Sacchi, N. Single-Step Method of RNA Isolation by Acid Guanidinium Thiocyanate-Phenol-Chloroform Extraction. Anal Biochem 1987, 162, 156–159.
- Noyola-Martínez, N.; Halhali, A.; Zaga-Clavellina, V.; Olmos-Ortiz, A.; Larrea, F.; Barrera, D. A Time-Course Regulatory and Kinetic Expression Study of Steroid Metabolizing Enzymes by Calcitriol in Primary Cultured Human Placental Cells. Journal of Steroid Biochemistry and Molecular Biology 2017, 167, 98–105. [CrossRef]
- GraphPad;Software;Inc.Accessed 10, March, 2024. http://www.graphpad.com/Faq/Viewfaq.Cfm?Faq=1362.
- SigmaPlot Statistical Software. Jandel Corporation, Las Vegas. Online: https://sigmaplot.software.informer.com/11.0. Accesed 10, March, 2024.
- Weiss, H.; Reichel, J.; Görls, H.; Schneider, K.R.A.; Micheel, M.; Pröhl, M.; Gottschaldt, M.; Dietzek, B.; Weigand, W. Curcuminoid-BF2 Complexes: Synthesis, Fluorescence and Optimization of BF2 Group Cleavage. Beilstein Journal of Organic Chemistry 2017, 13, 2264–2272. [CrossRef]
- Liu, K.; Chen, J.; Chojnacki, J.; Zhang, S. BF3·OEt2-Promoted Concise Synthesis of Difluoroboron-Derivatized Curcumins from Aldehydes and 2,4-Pentanedione. Tetrahedron Lett 2013, 54, 2070–2073. [CrossRef]
Scheme 1.
Synthesis of Dimethoxycurcumin (DiMeOC, 3).
Scheme 2.
Synthesis of magnesium metal complex (DiMeOC-Mg, 4) and inclusion complex with beta-cyclodextrin (DiMeOC-Mg-BCD, 5).
Scheme 2.
Synthesis of magnesium metal complex (DiMeOC-Mg, 4) and inclusion complex with beta-cyclodextrin (DiMeOC-Mg-BCD, 5).
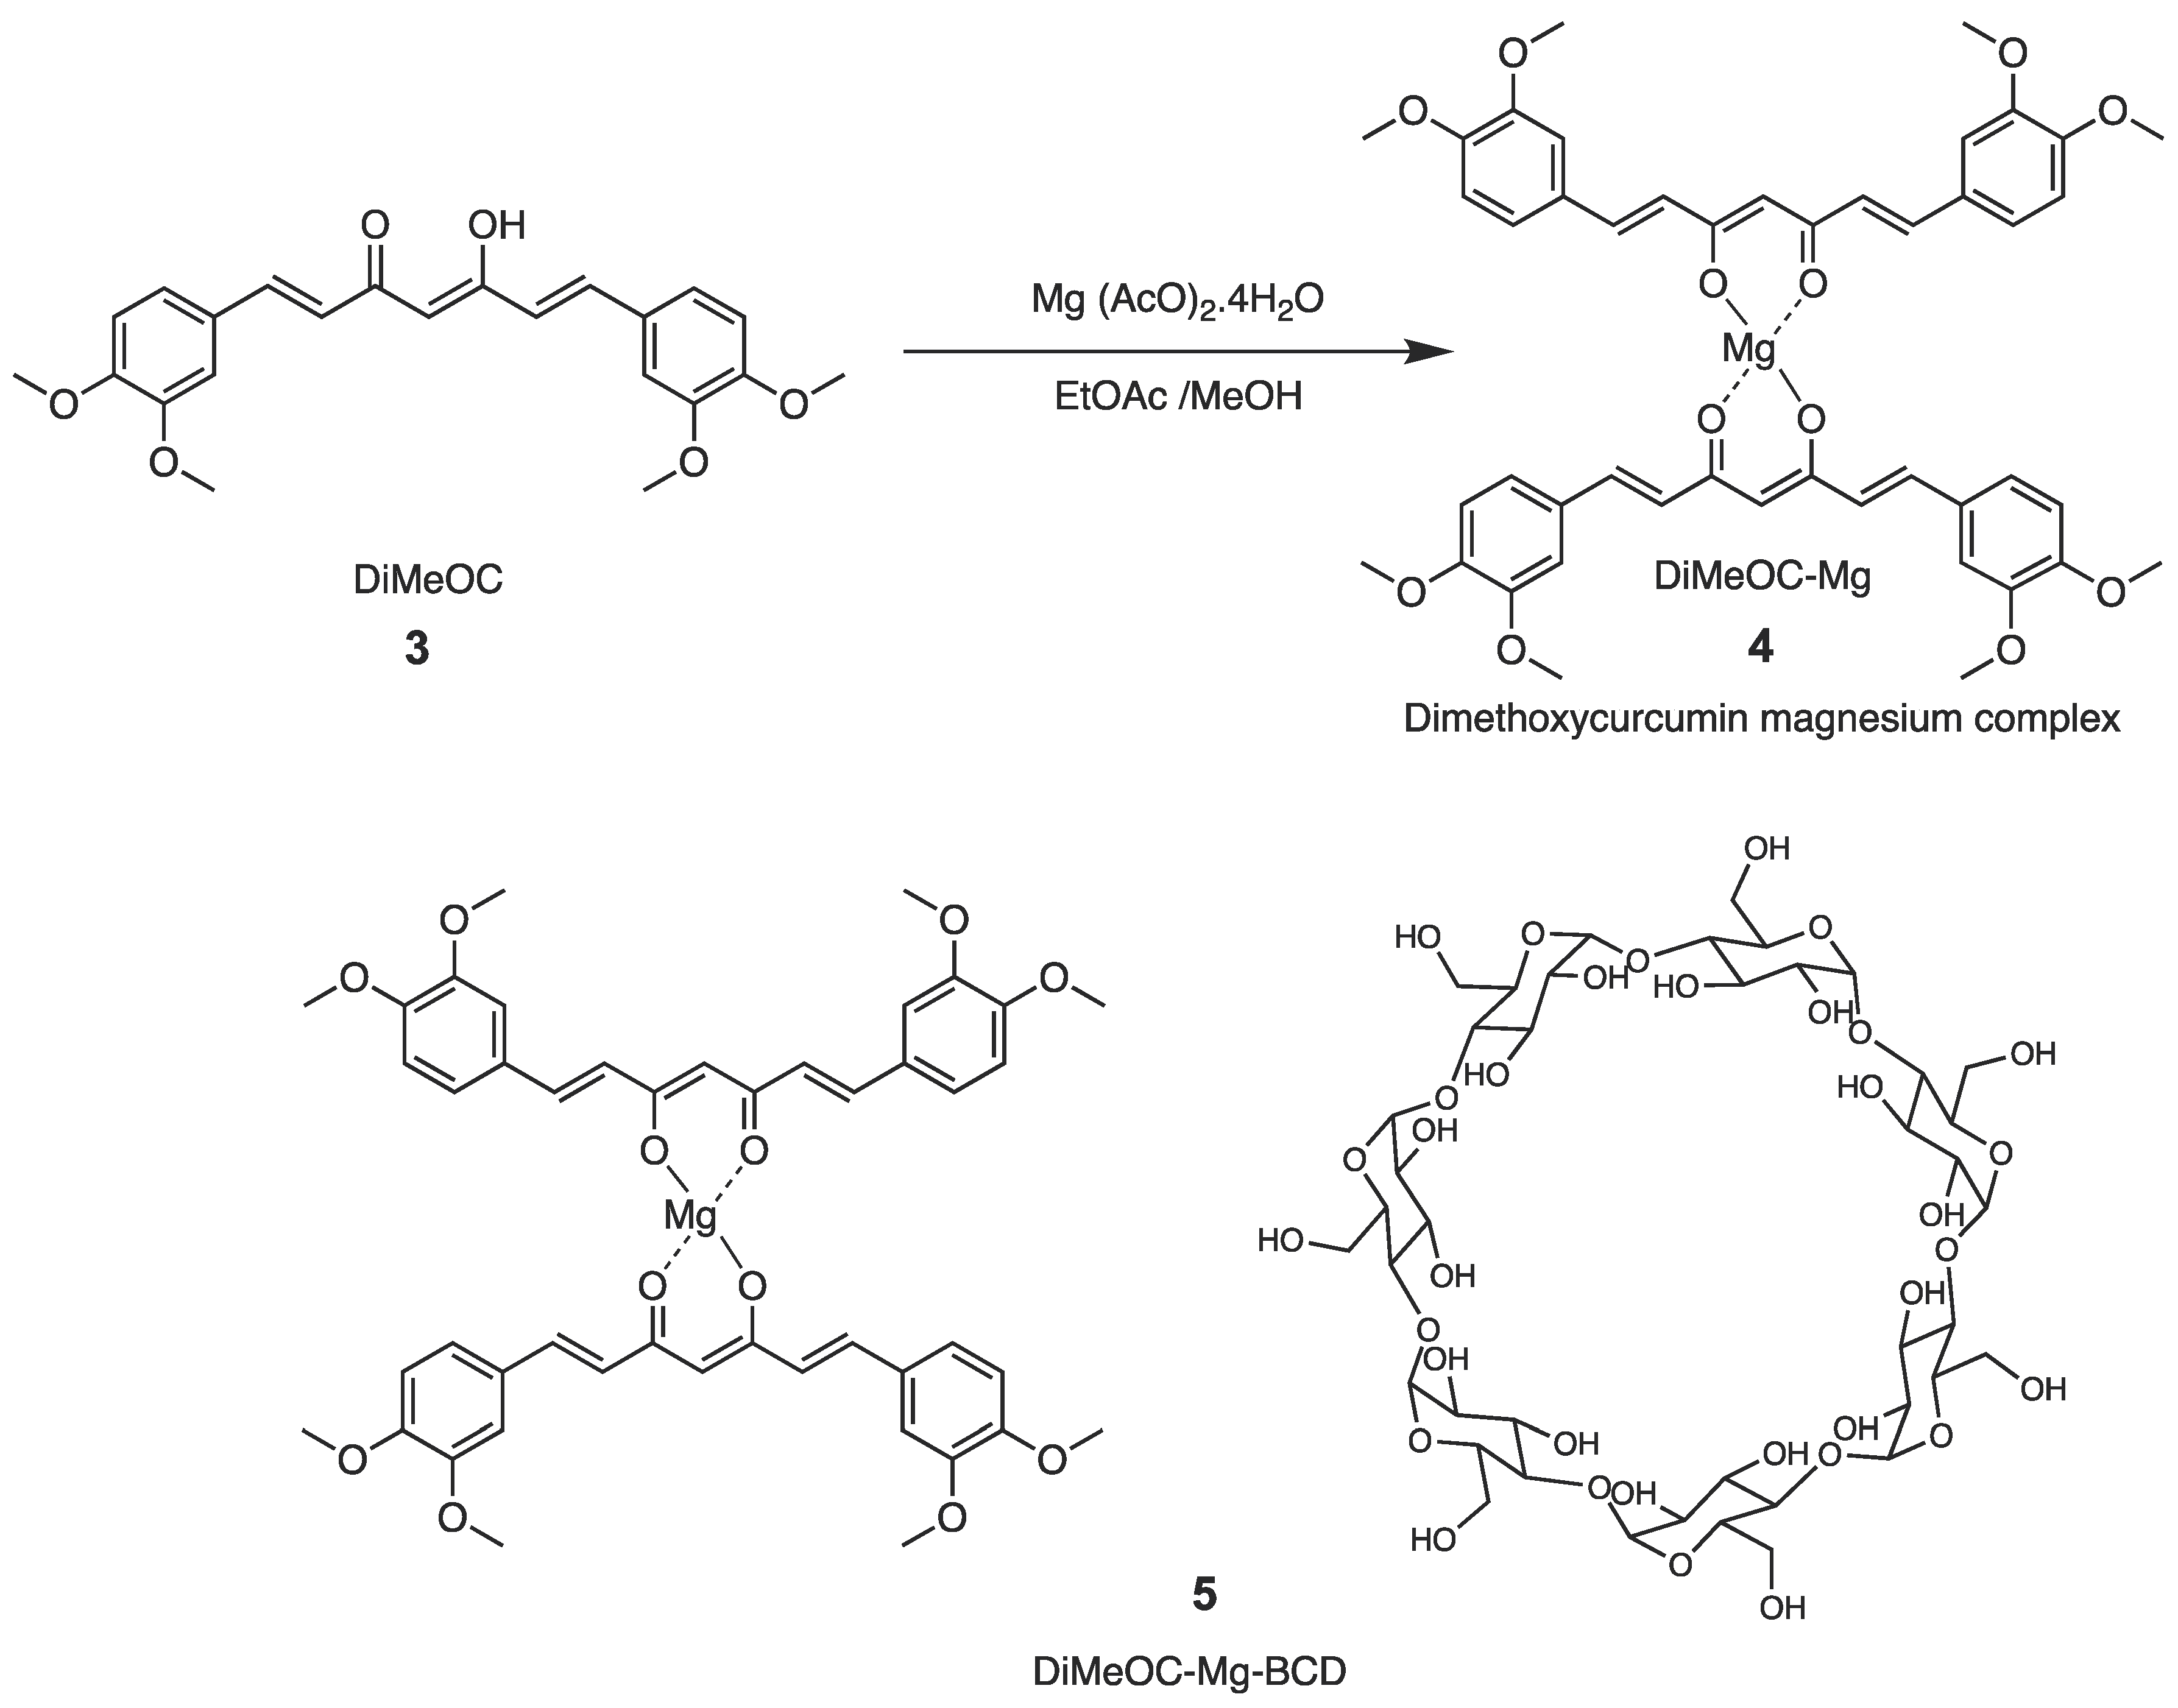
Figure 1.
1H NMR of 1) BCD inclusion complex, 2) BCD free (400 MHz, D2O δ = 4.8 ppm).
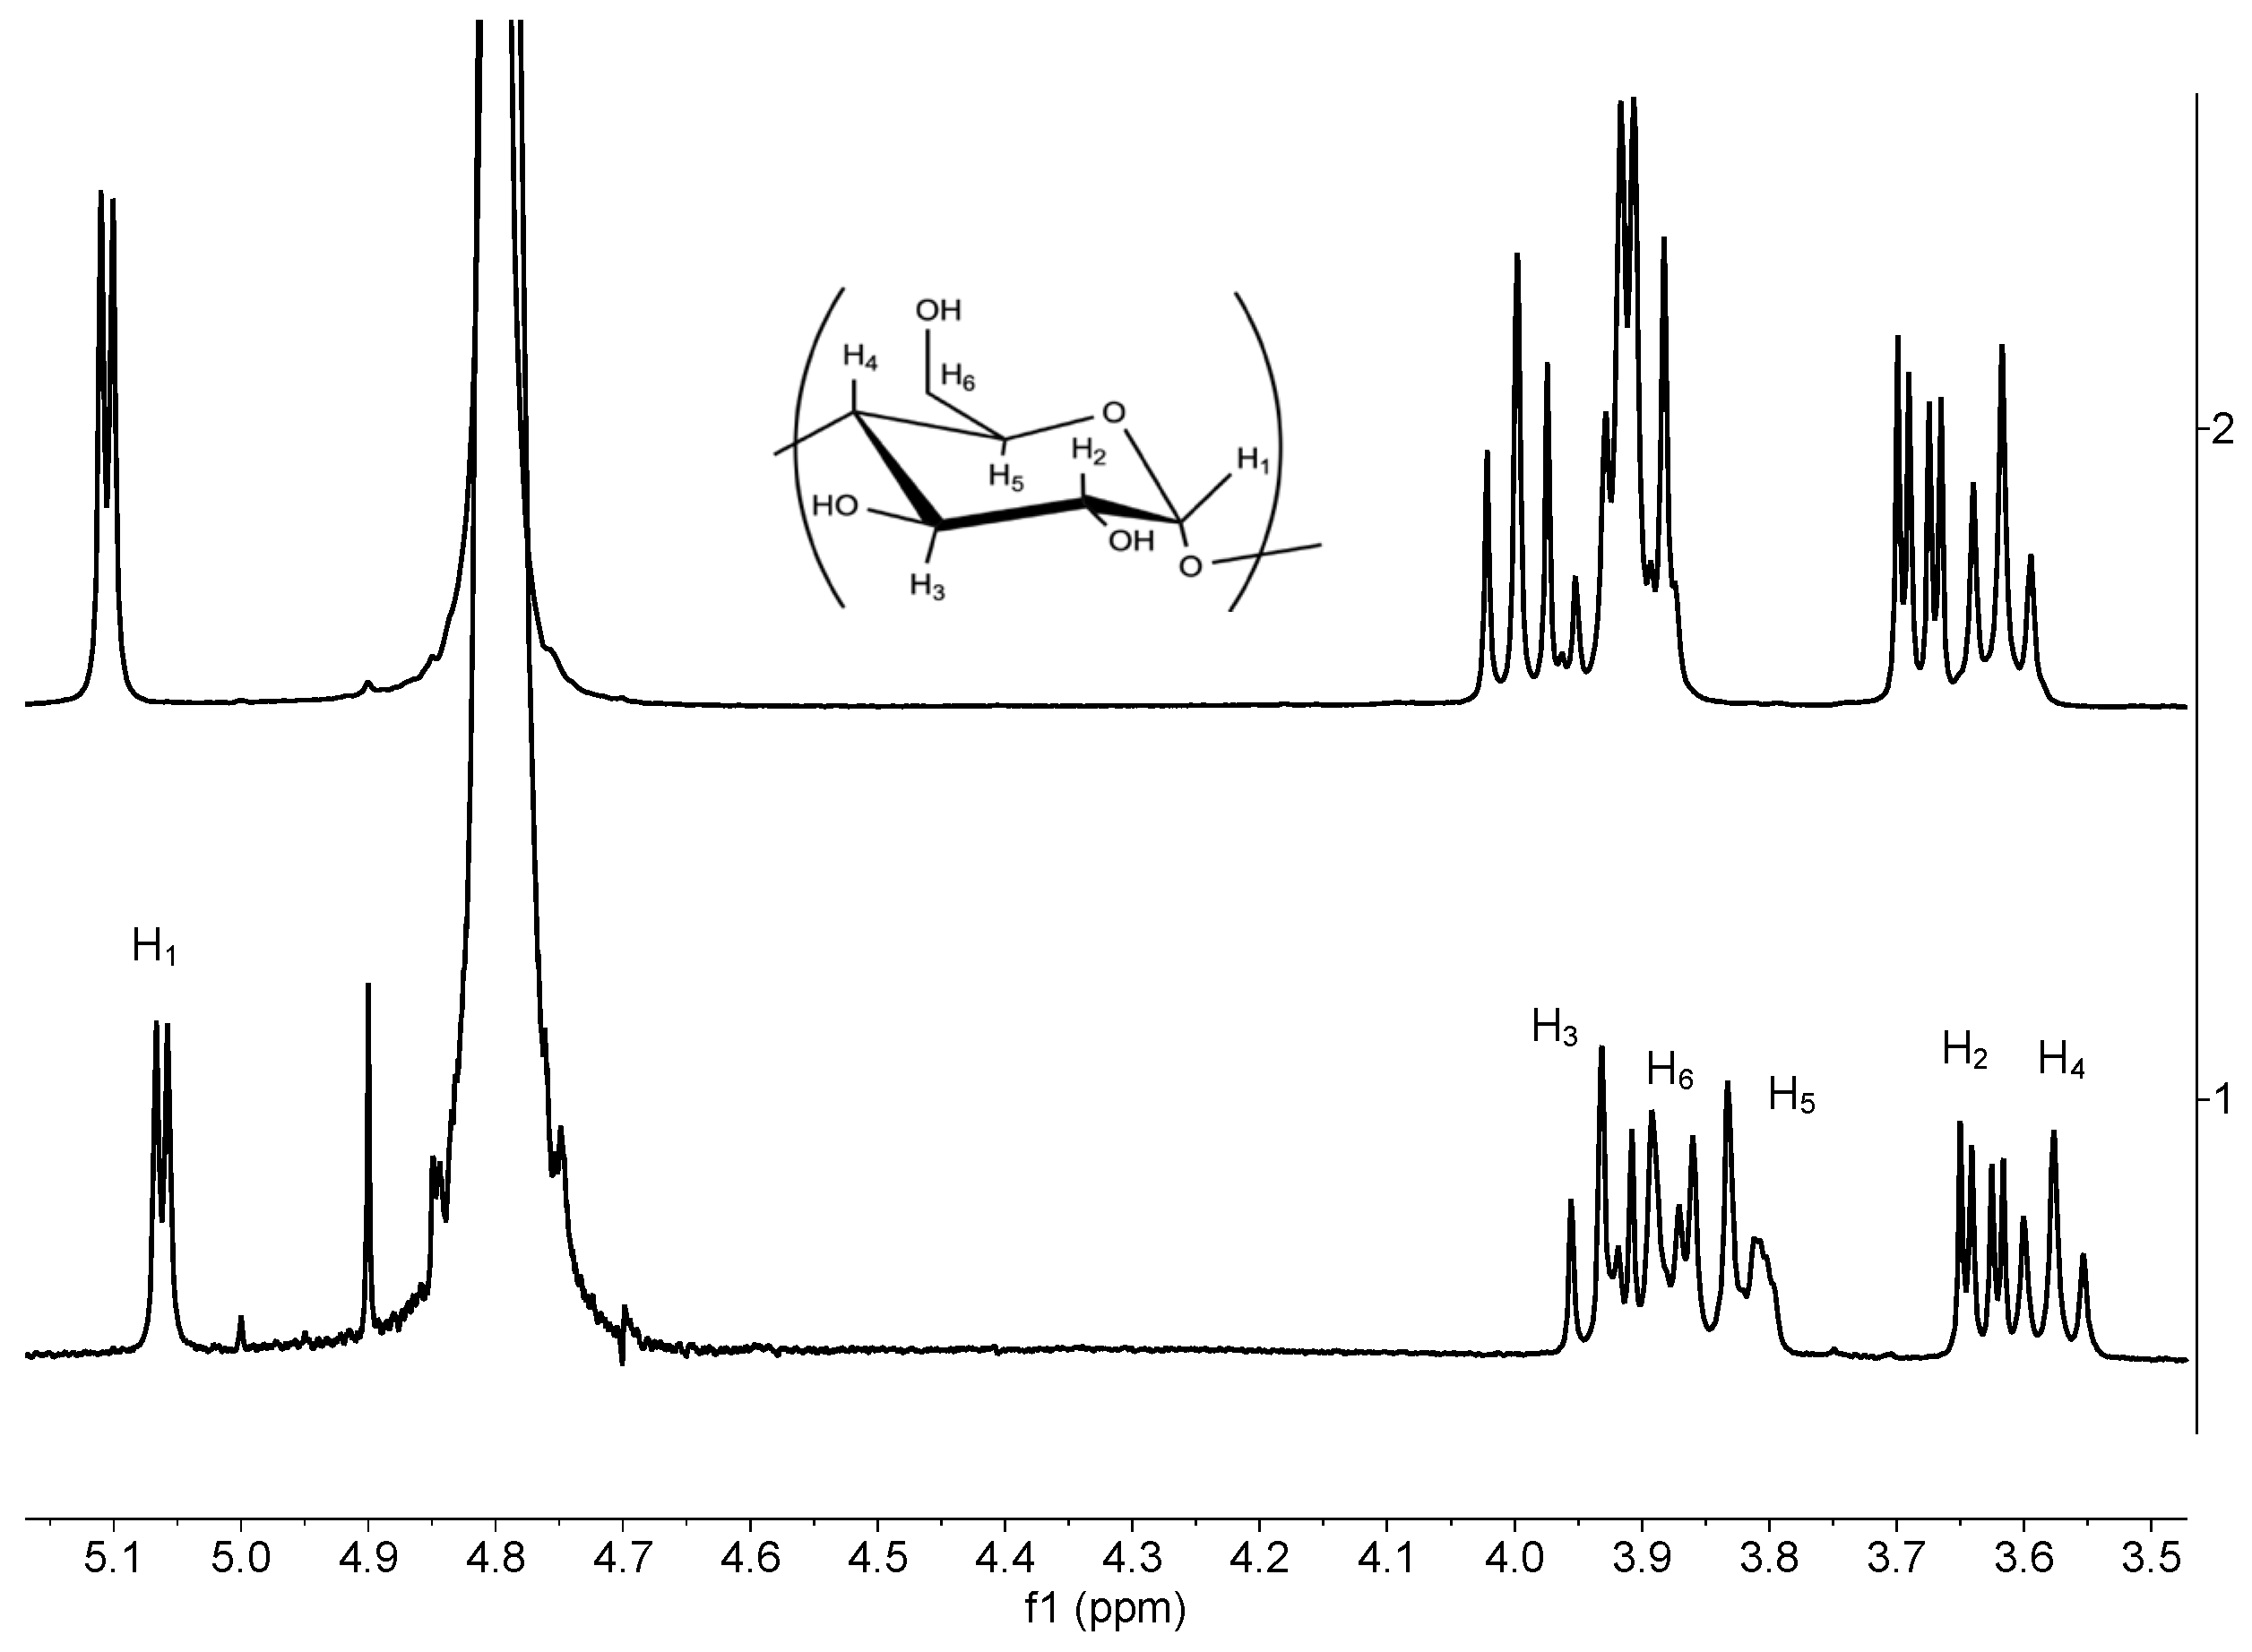
Figure 2.
1H NMR DOSY spectra a) DiMeOC-Mg, b) DiMeOC-Mg-BCD 1:1 (400MHz, DMSO-d6).
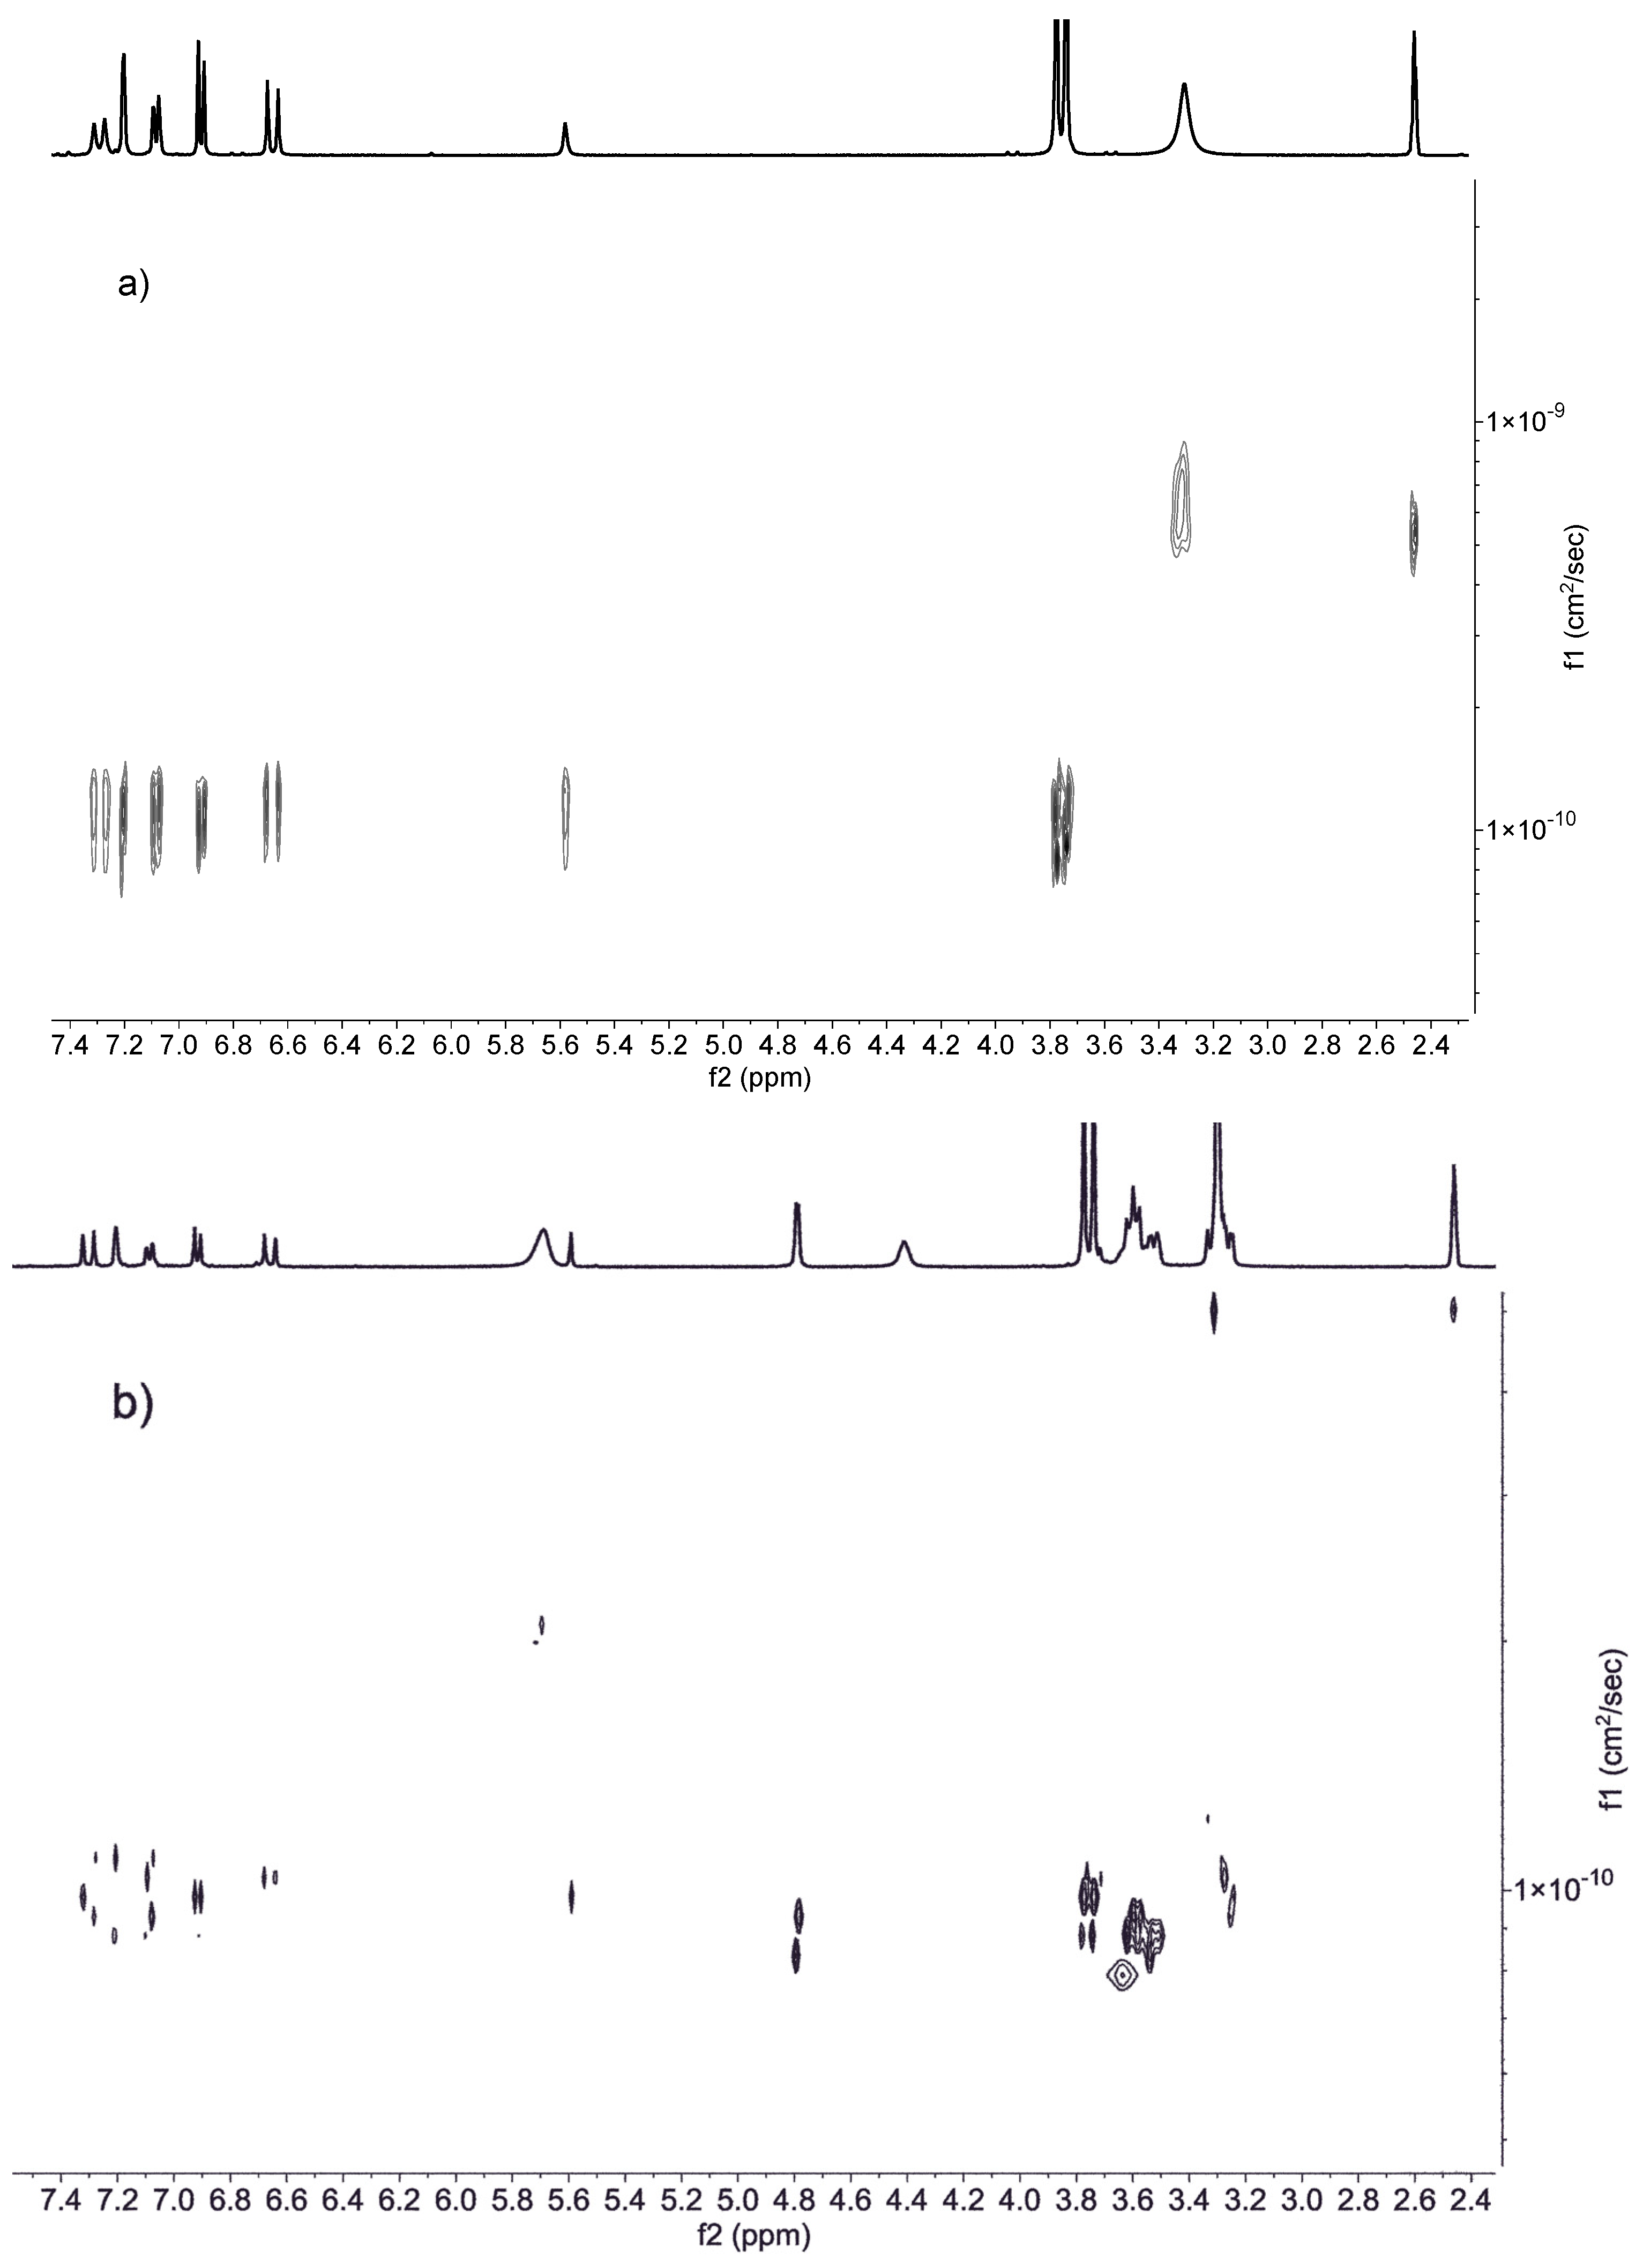
Figure 3.
150 MHz 13C ssNMR spectra of 1) DiMeOC, 2) DiMeOC-Mg, 3) BCD, 4) DiMeOC-Mg-BCD.
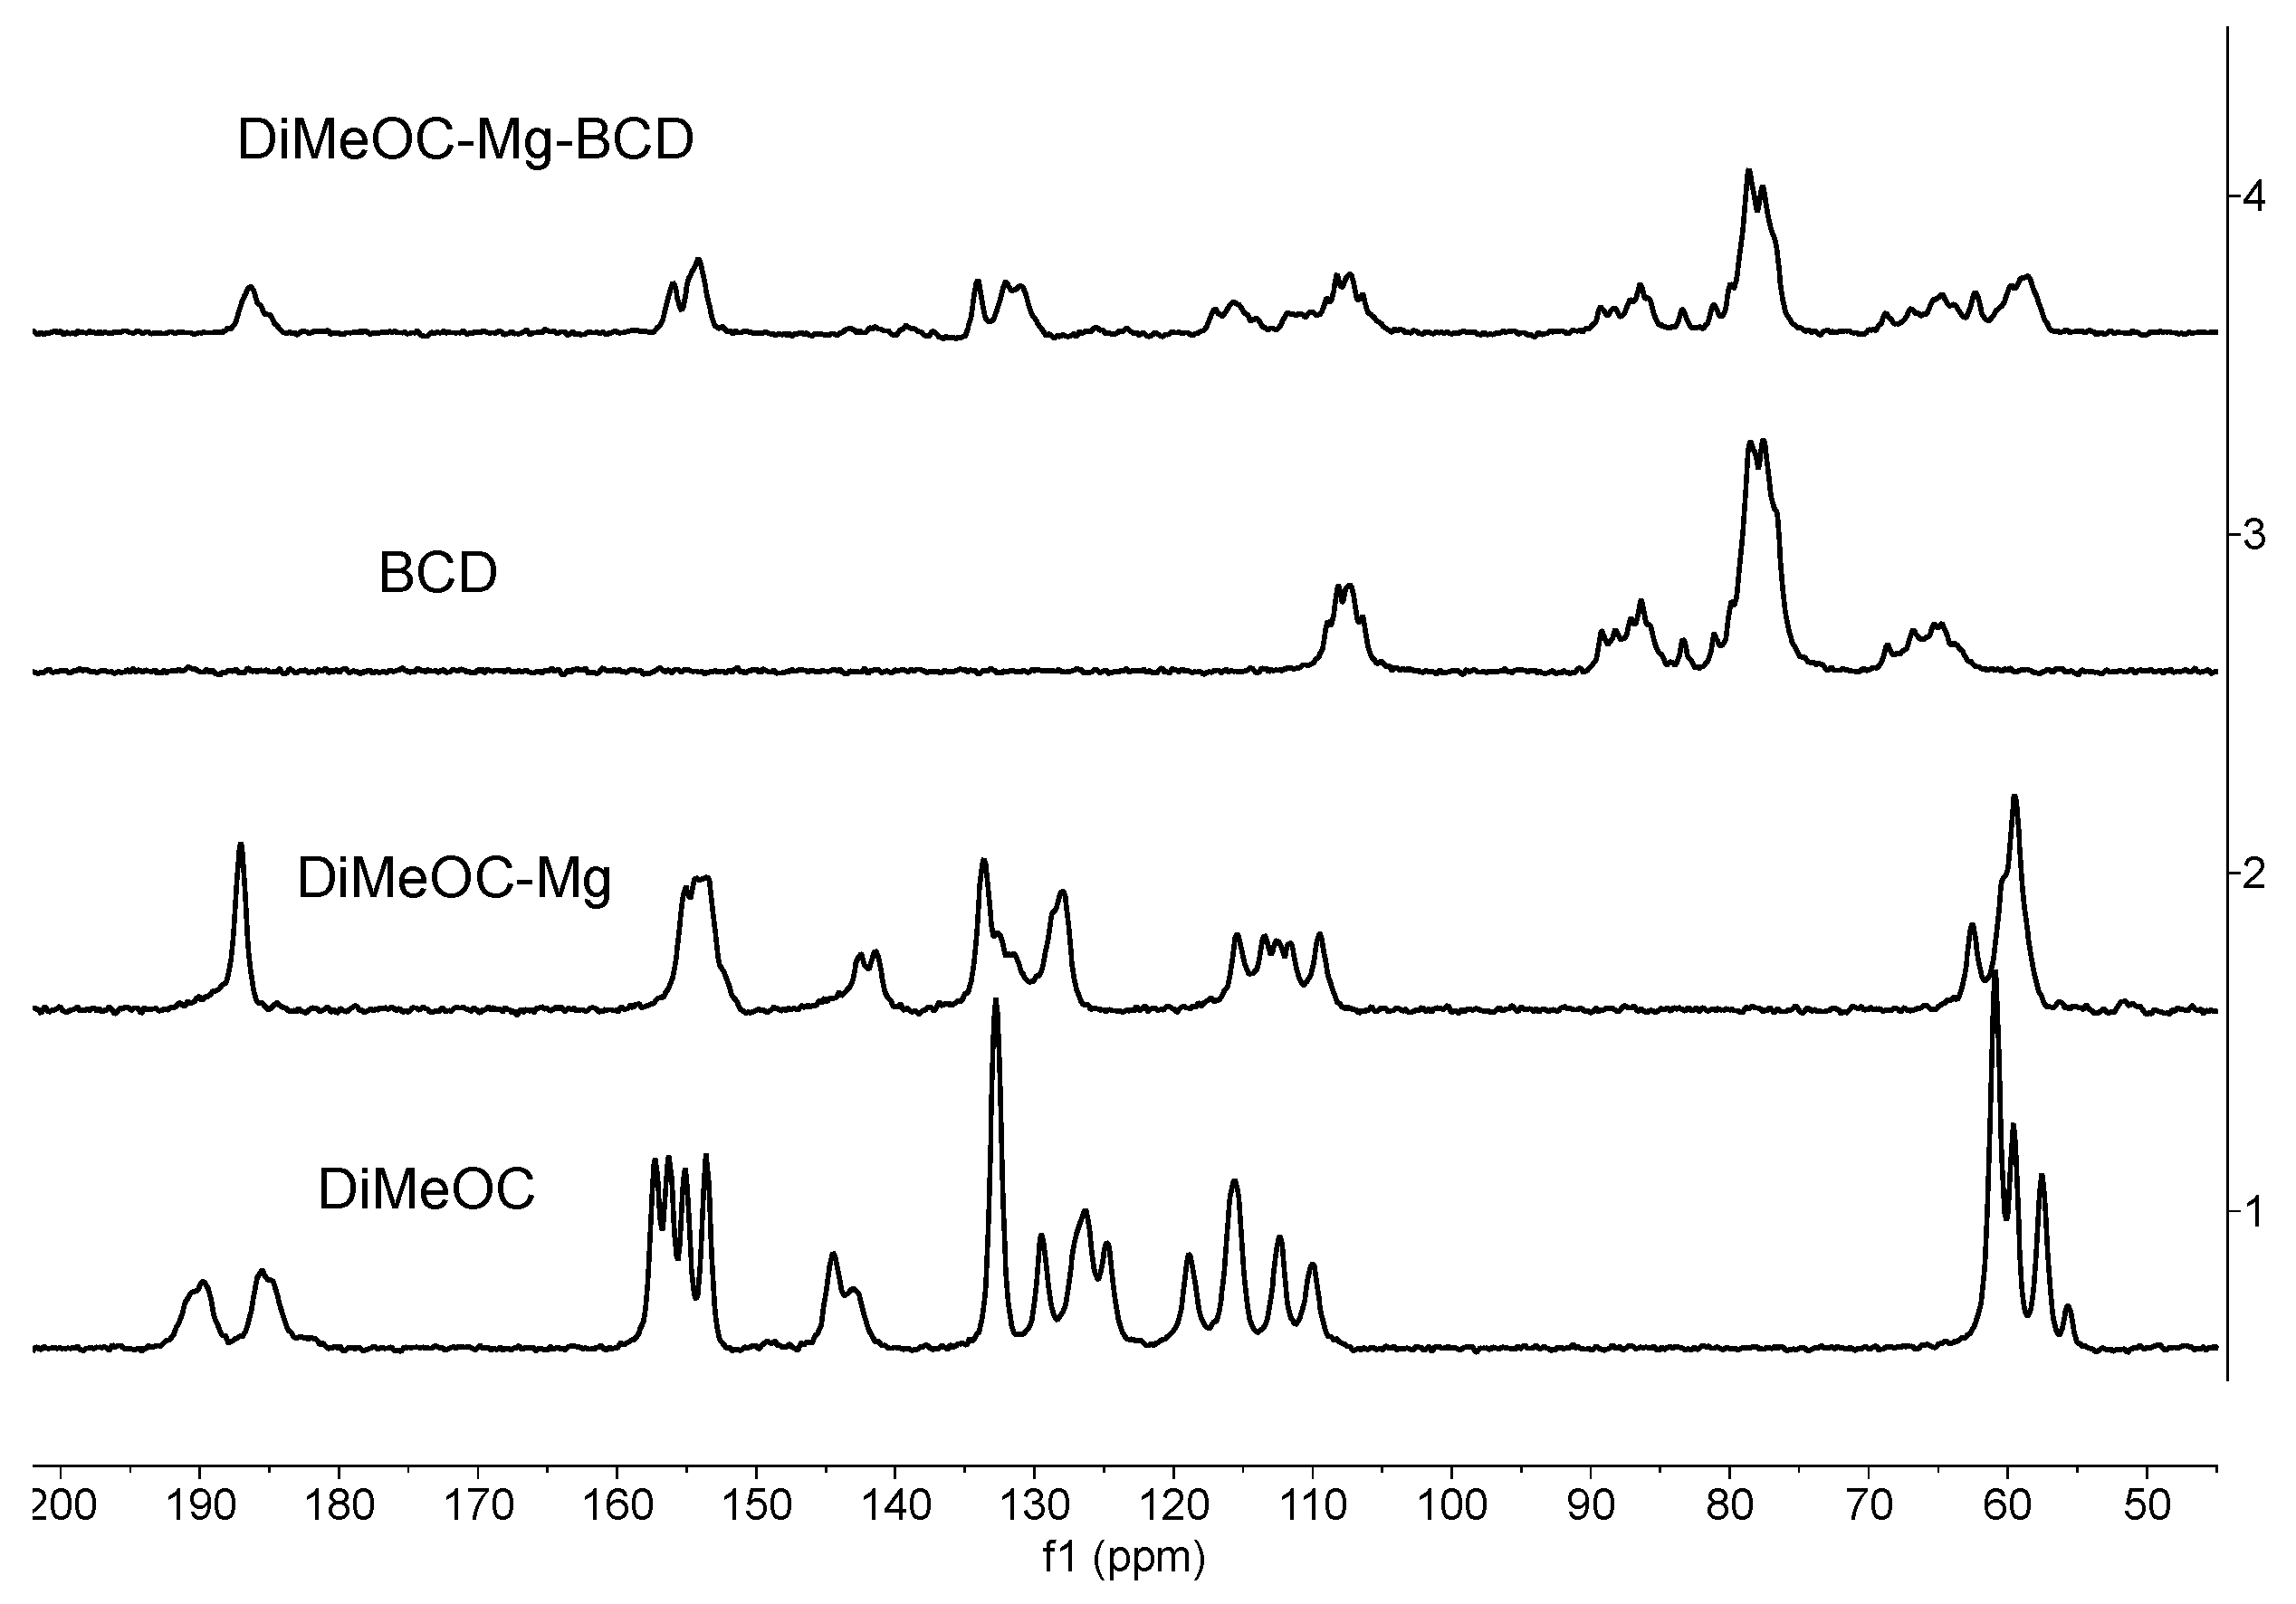
Figure 4.
SEM of a) BCD, b) DiMeOC, c) DiMeOC-Mg and d) DiMeOC-Mg-BCD.
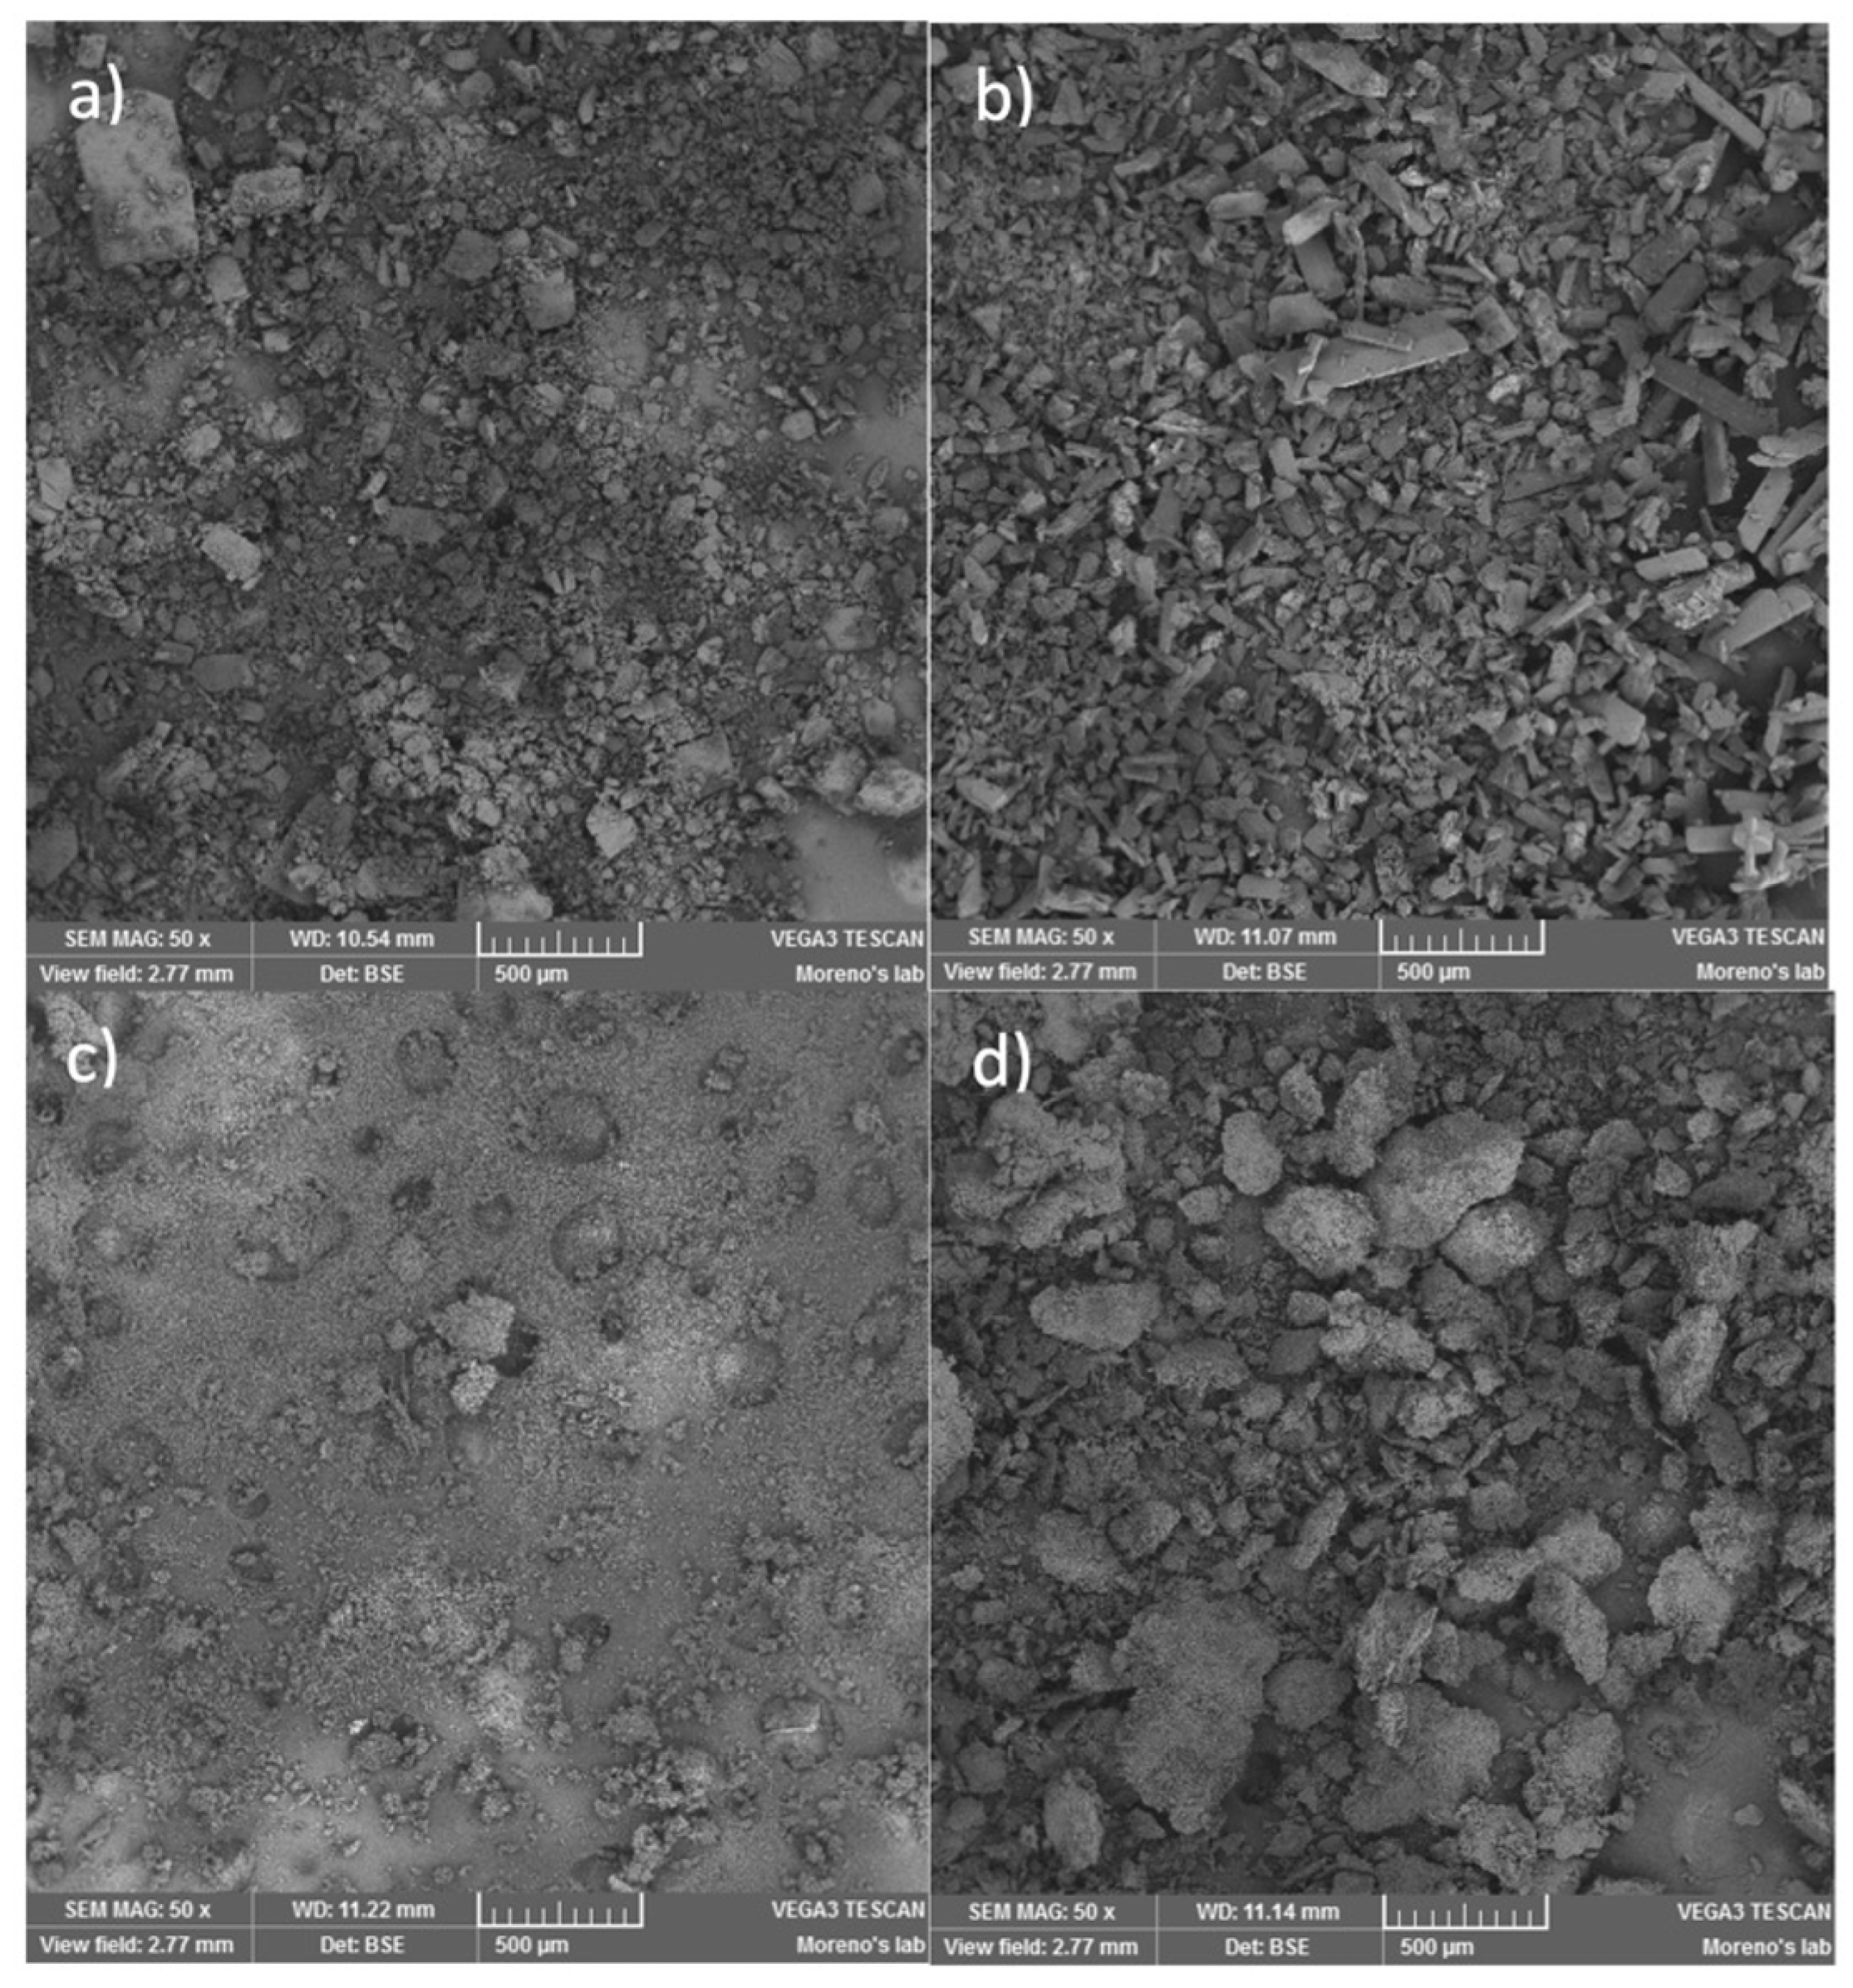
Figure 5.
TGA A) beta-cyclodextrin (BCD), B) DiMeOC-Mg and C) DiMeOC-Mg-BCD.
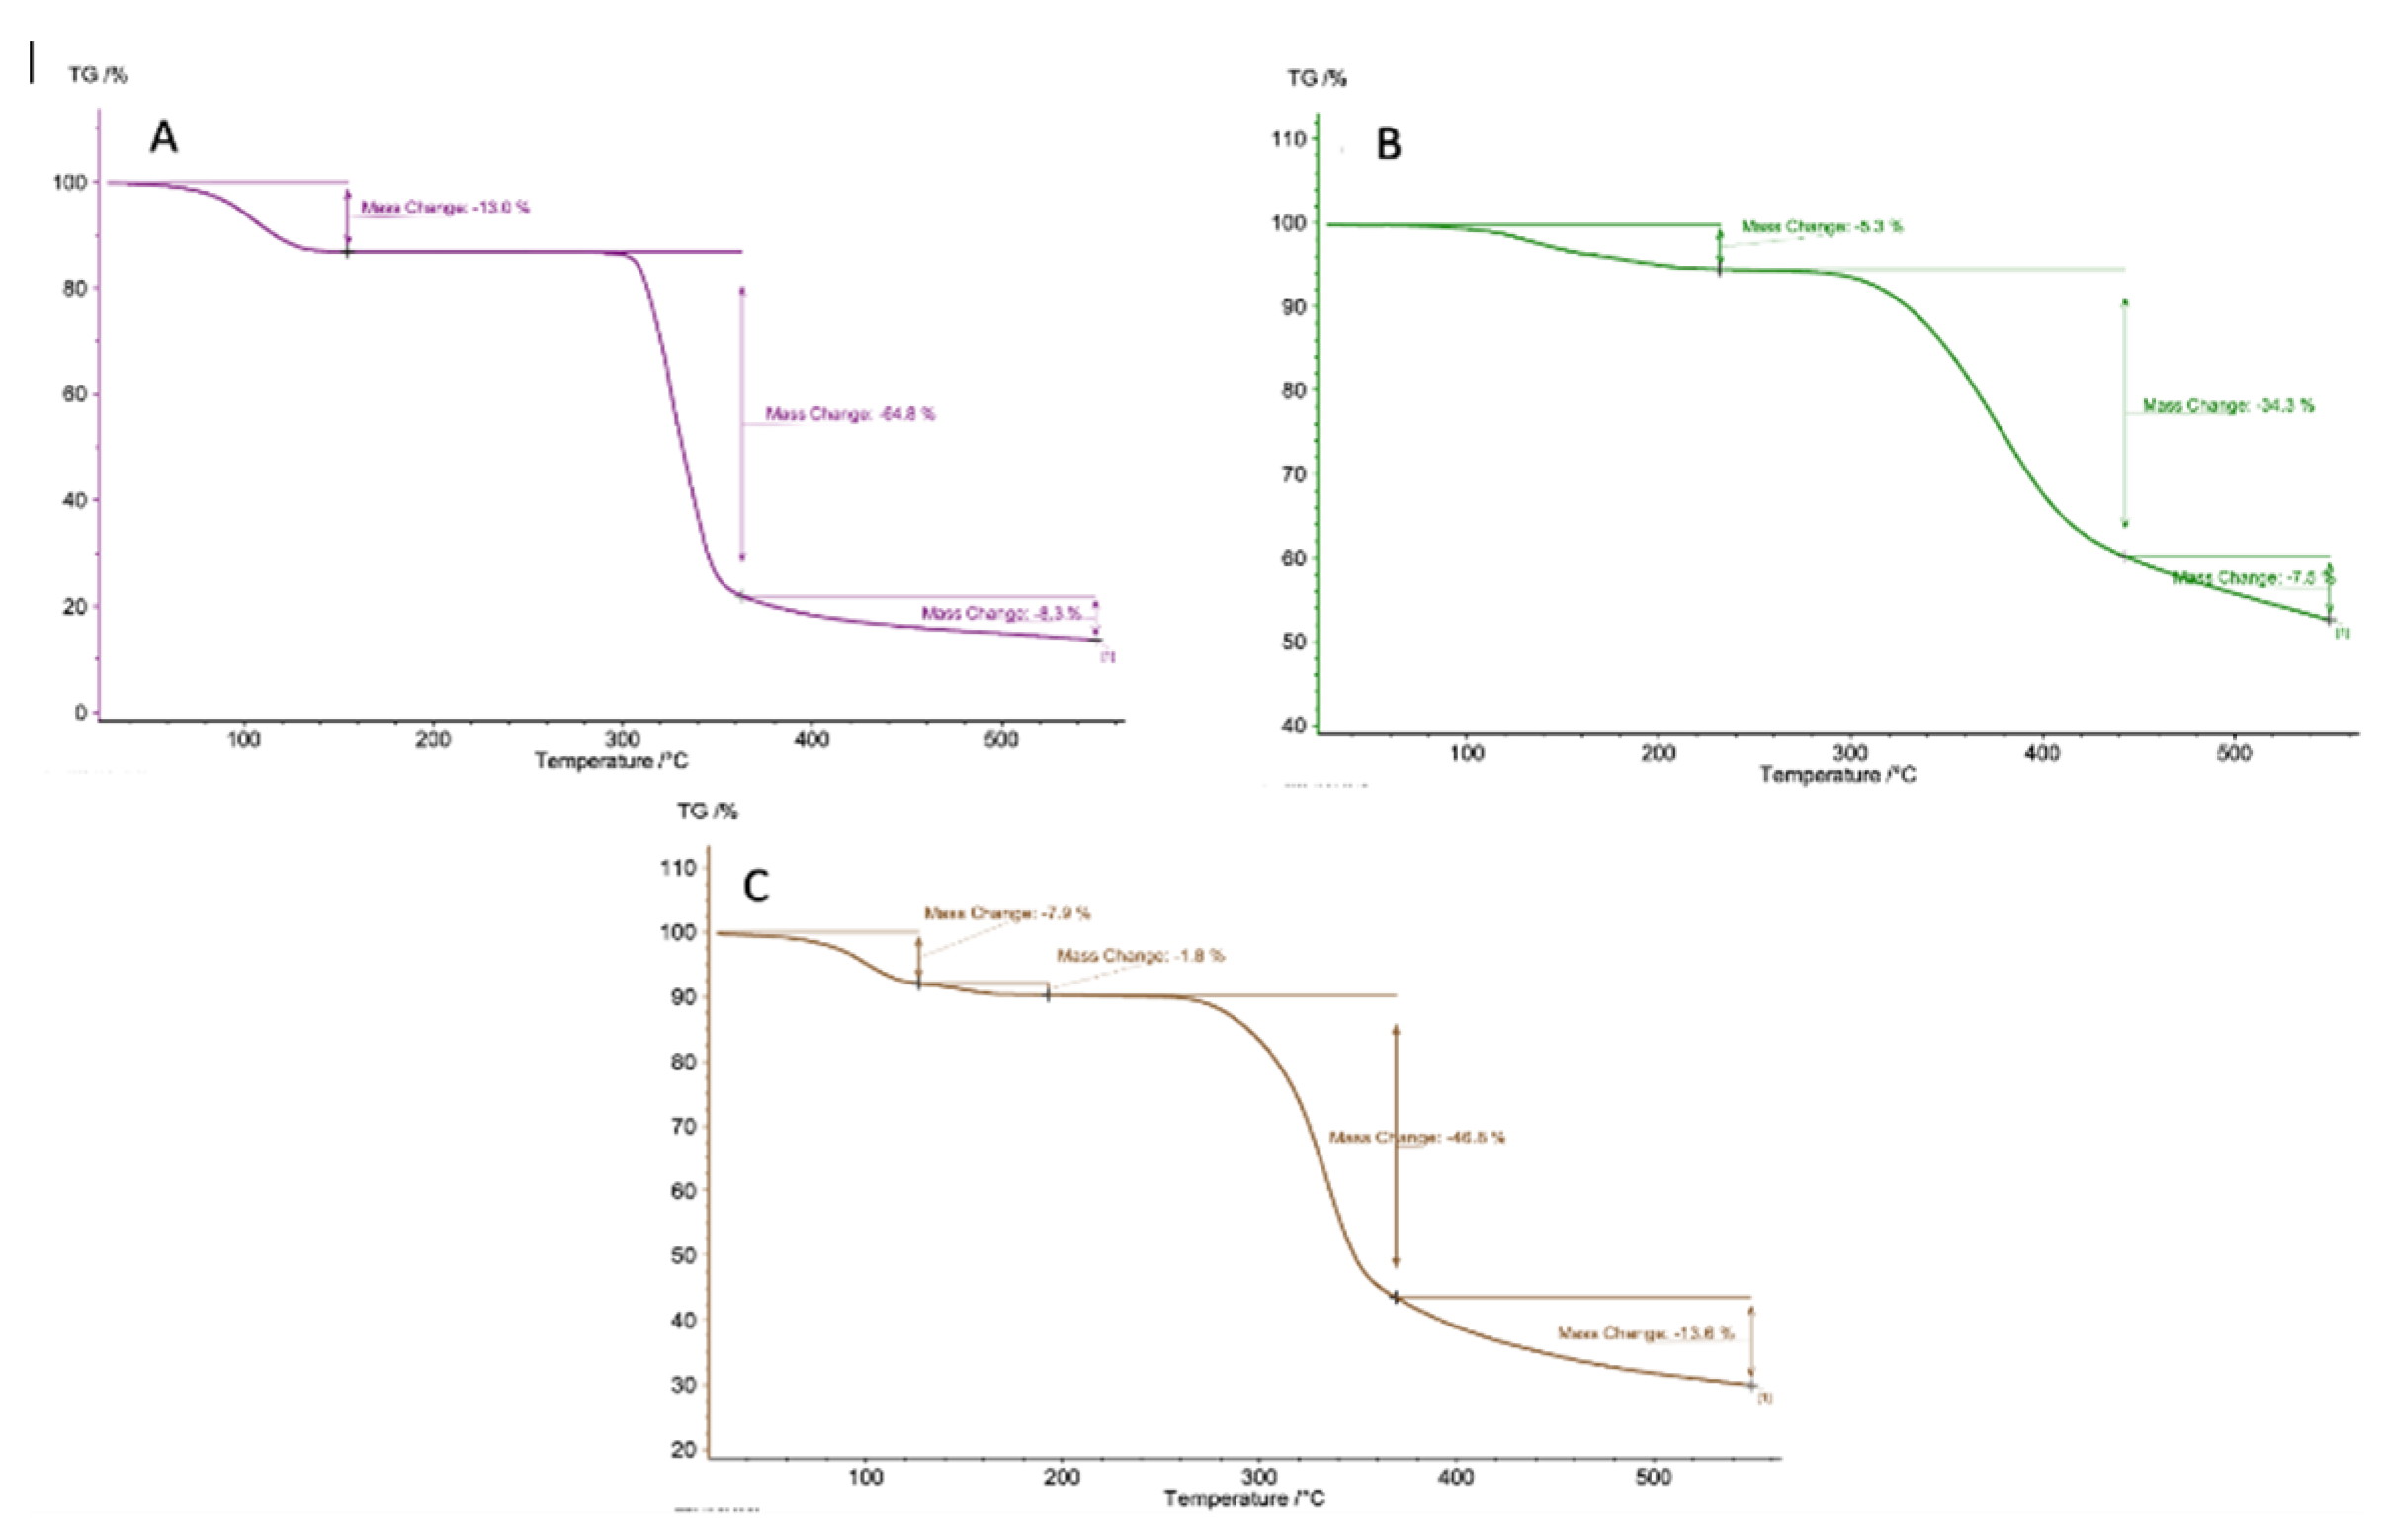
Figure 6.
DSC curves of BCD and complexes.
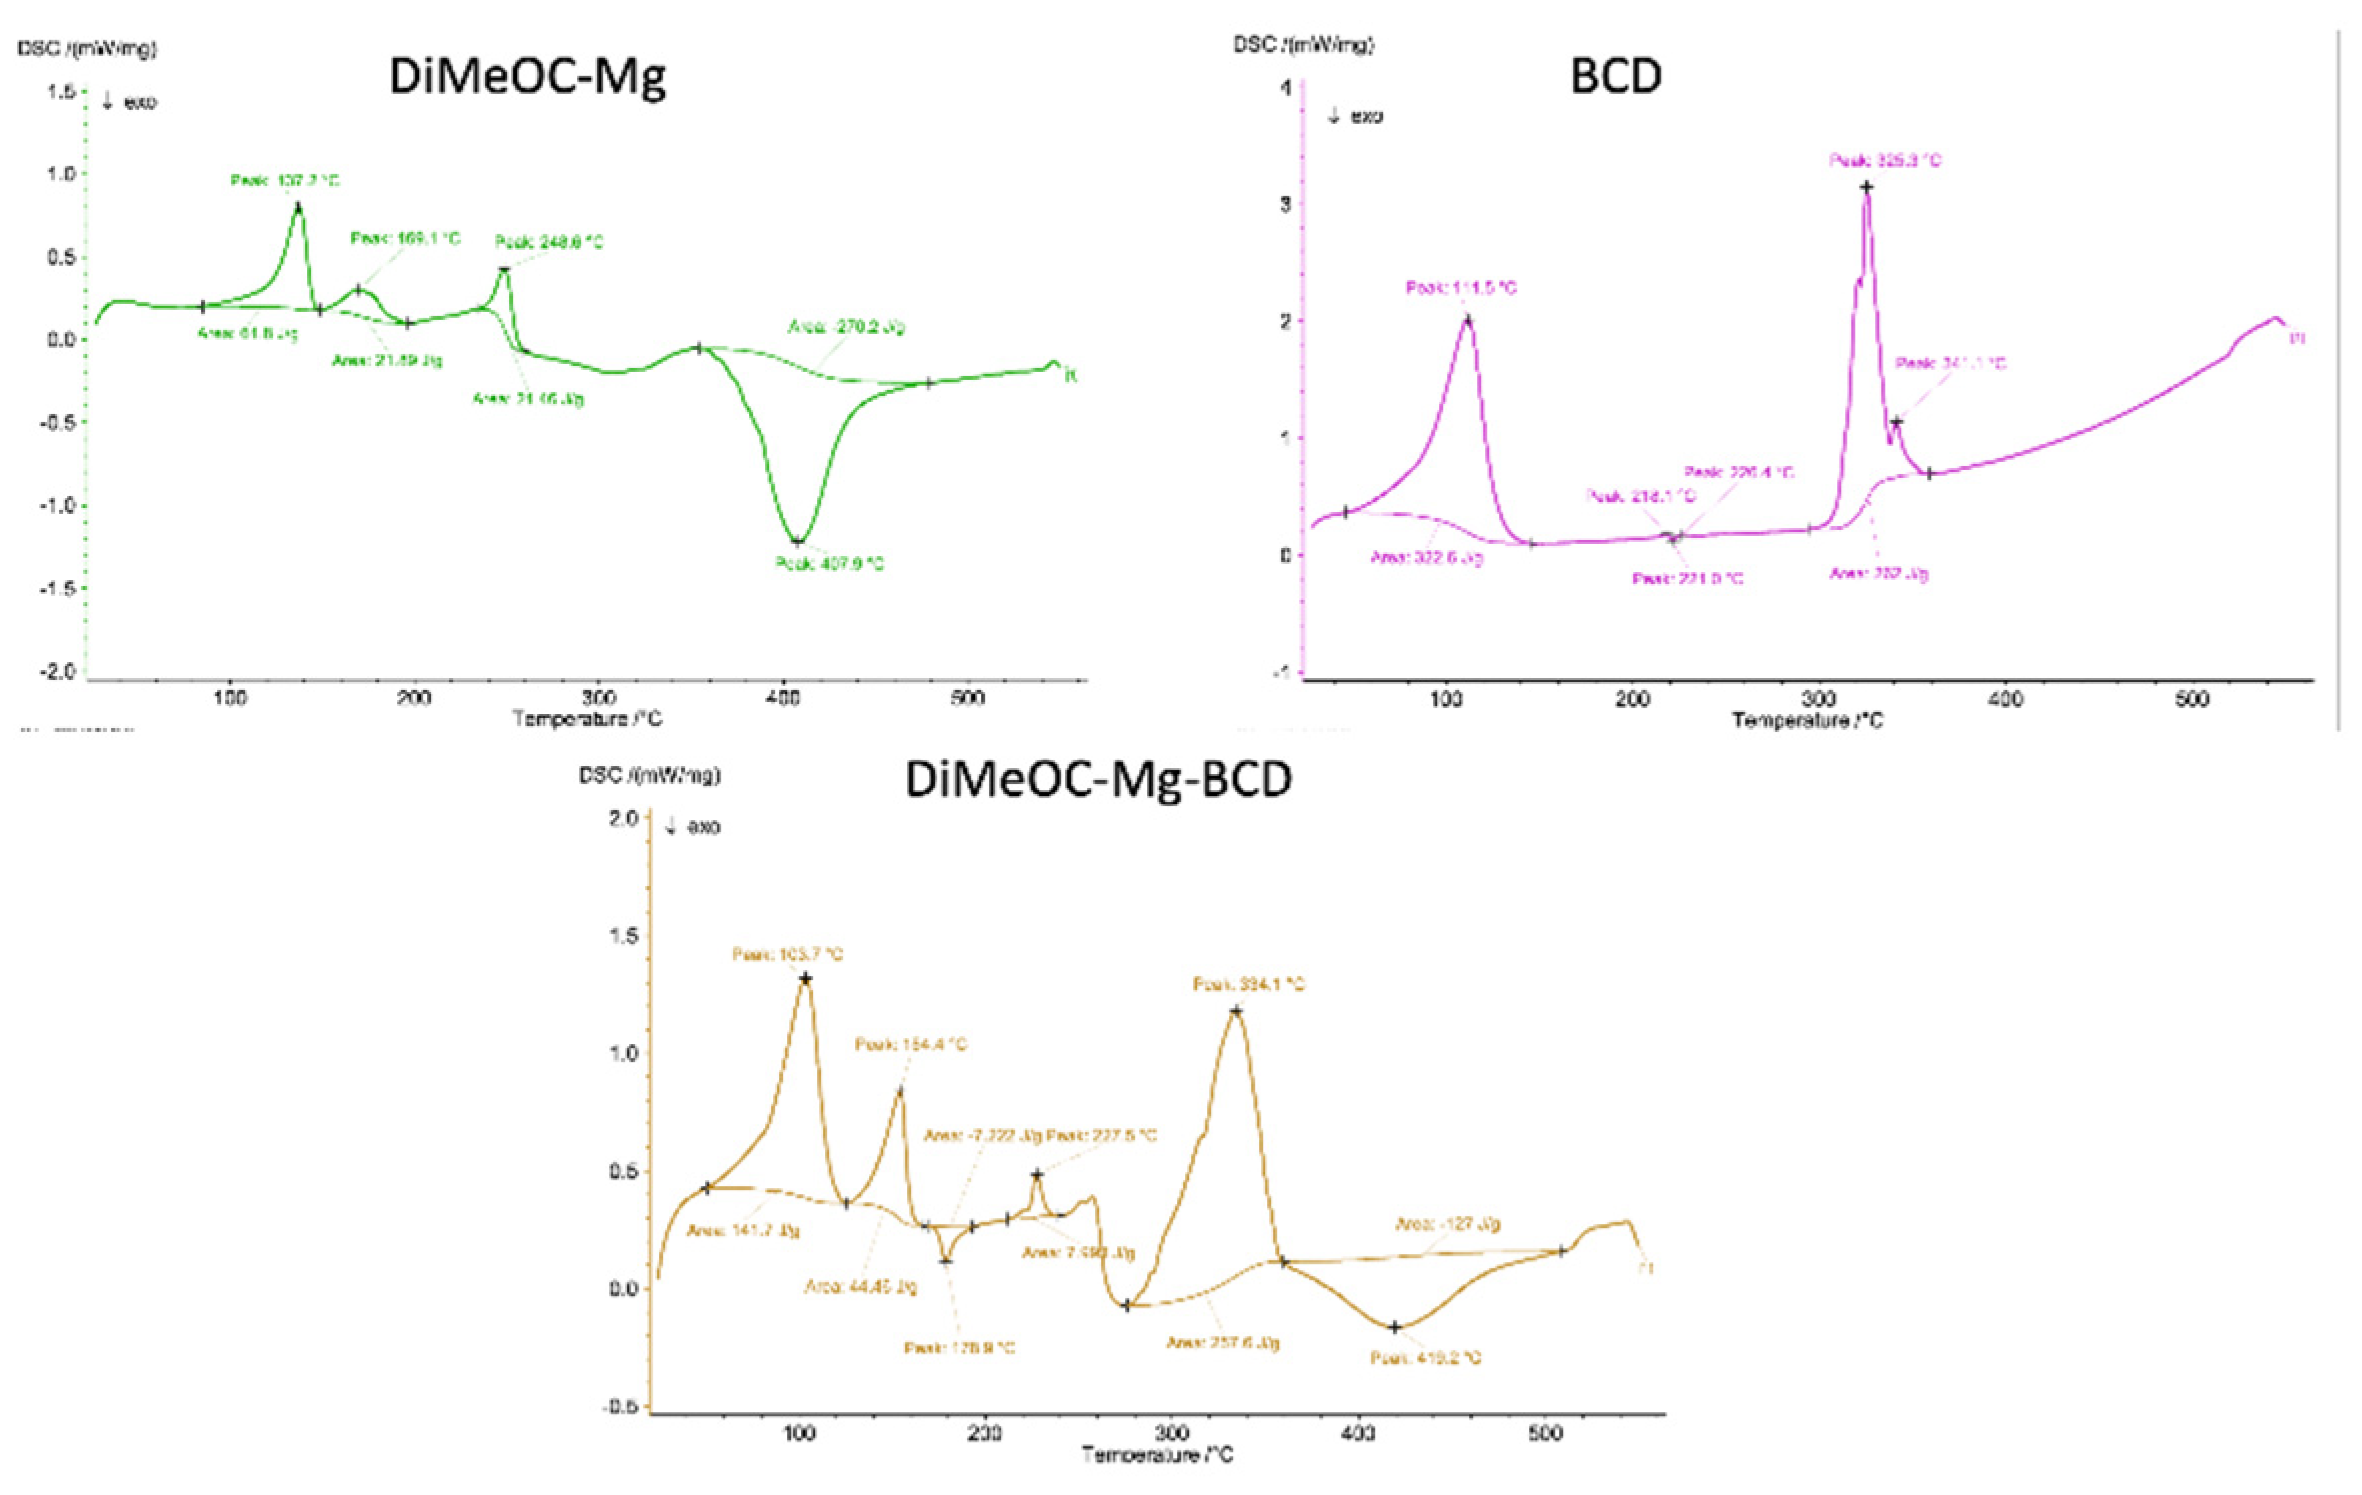
Figure 7.
DiMeOC-Mg-BCD induced morphological changes in the MDA-231-MB breast cancer cell line. Giemsa stain of cells incubated with CC50 concentrations for 48 h. Cell size reduction, rounding and pyknotic nuclei (*), cytoplasm vacuolization (+), chromatin condensation, apoptotic bodies (black arrow) Bar: 20 µm (20x).
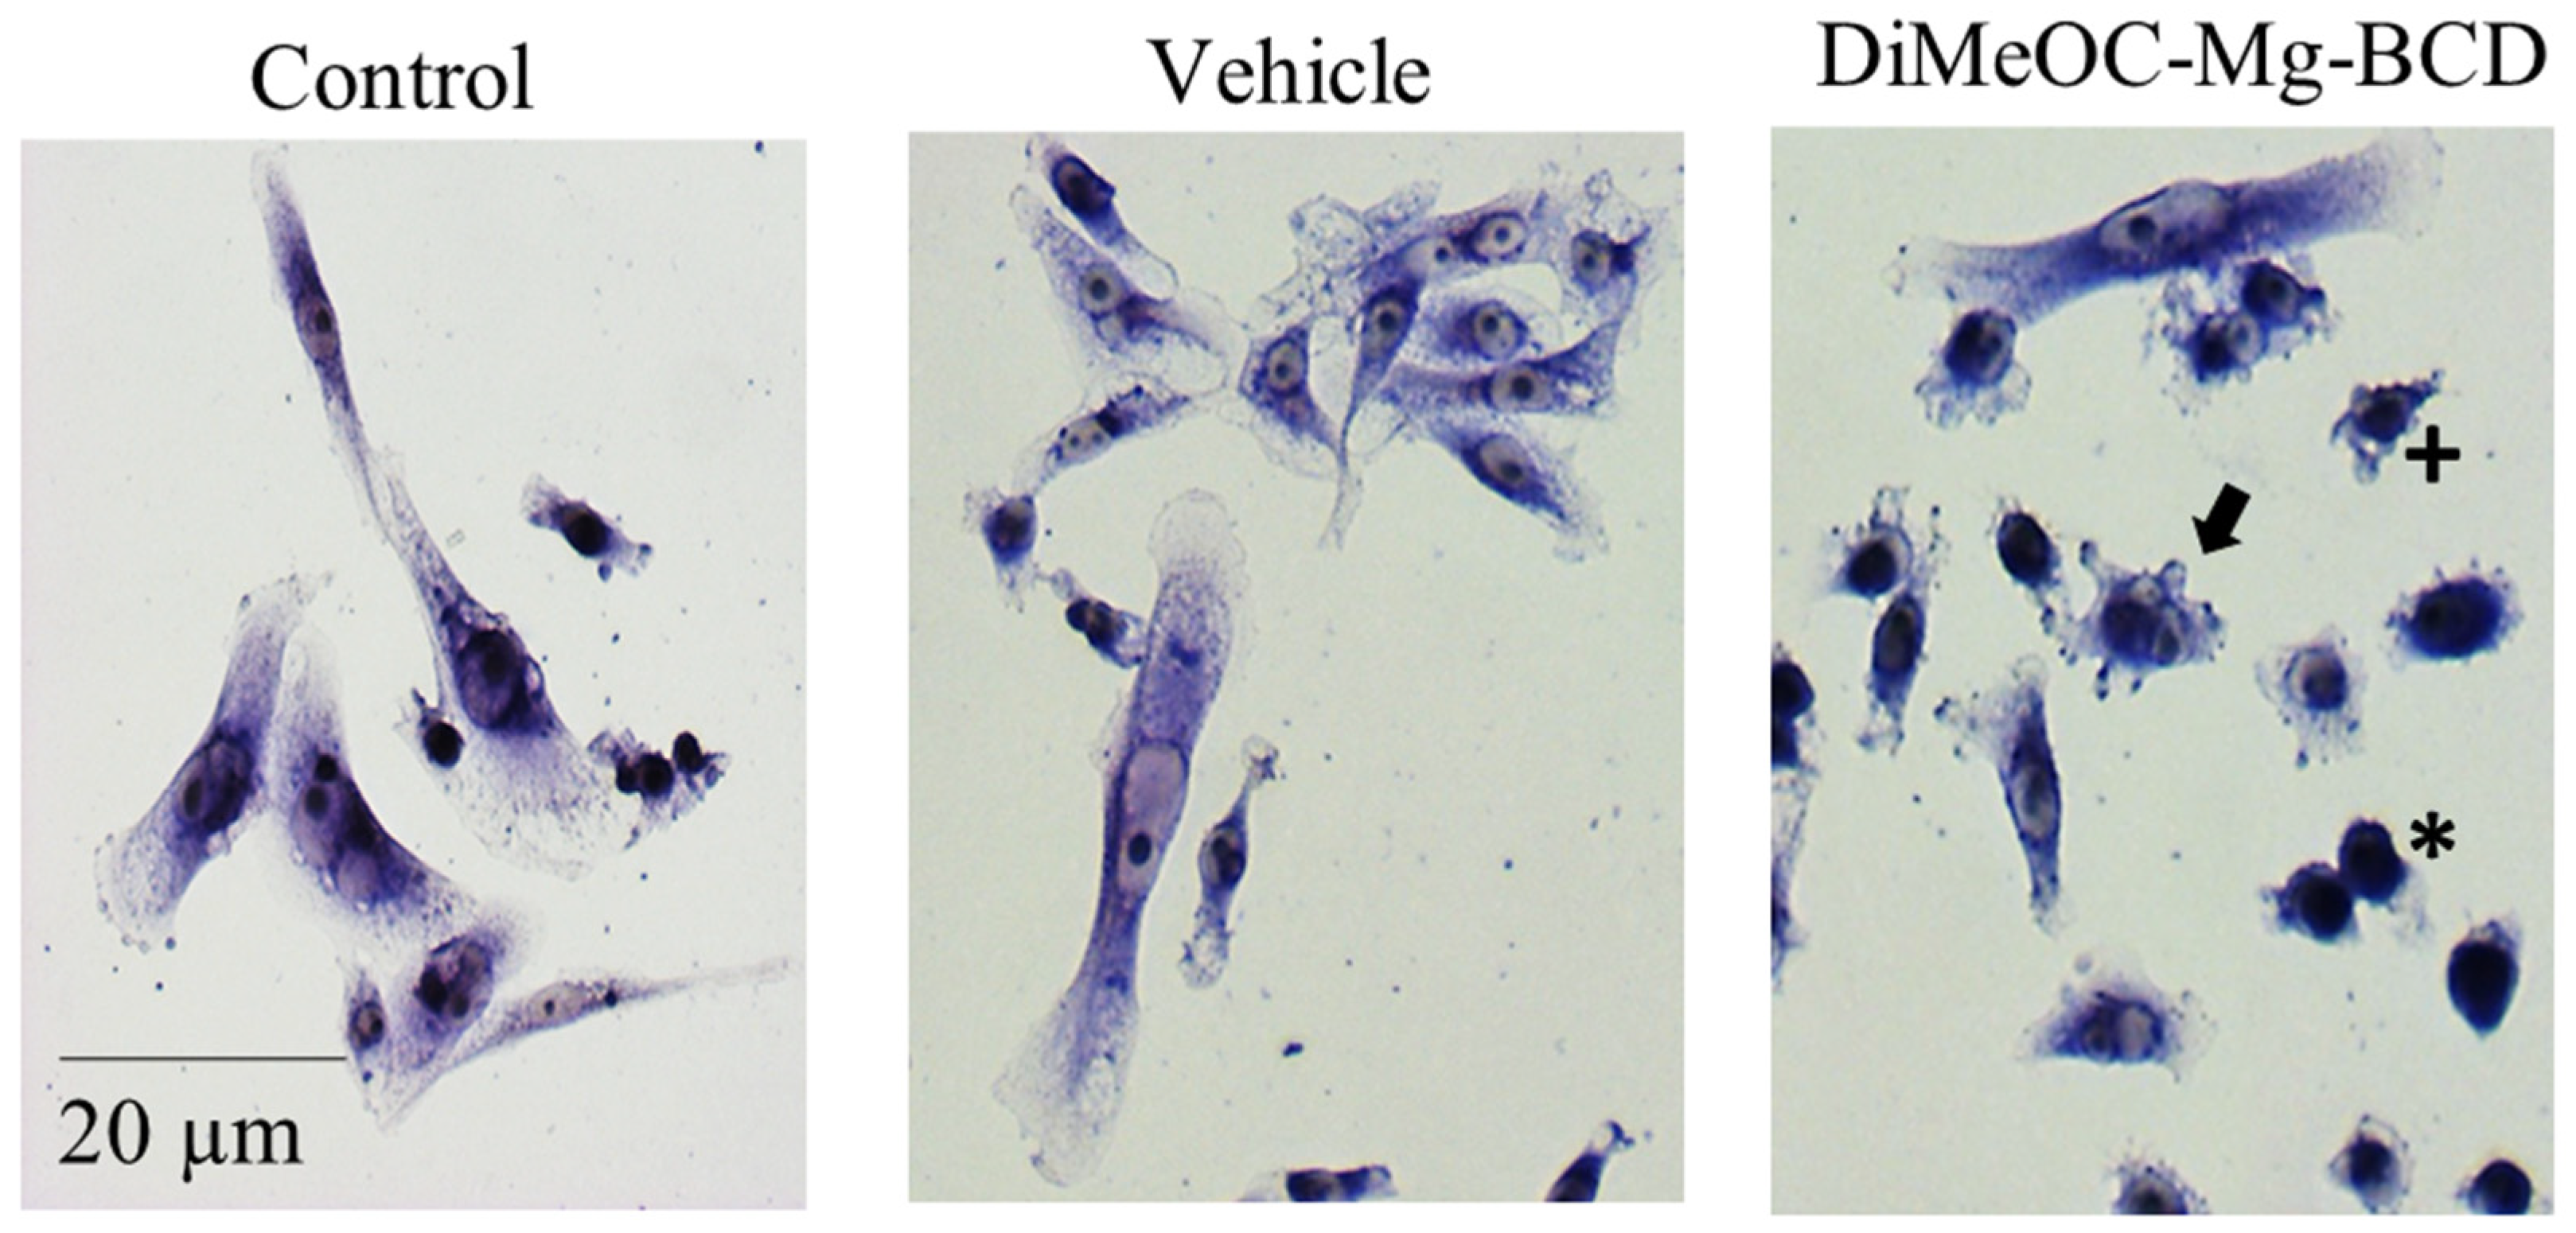
Figure 8.
Effect of DiMeOC-Mg-BCD on MDA-231-MB breast cancer cell line, esterase activity and cell membrane damage. Cells were incubated with different treatments for 48 h and stained with calcein fluorescence stain (C-AM+) and ethidium homodimer (Eth-1+). (a) Flow cytometry dot plots: 1) Unstained cells (DMEM, 2) Vehicle and live cells/C-AM+, 3) cell membrane damage shown or dead cells/Eth-1+ after heating (65ºC), 4) vehicle used and 5) DiMeOC-Mg-BCD (CC50). (b) Percentage of esterase activity, c) Percentage of dead cells. The results correspond to mean±SD in three independent duplicated experiments. One-way analysis of variance and Tukey multiple comparison test were applied. Asterisks represent significant differences compared with the Vehicle DMSO, * p< 0.001.
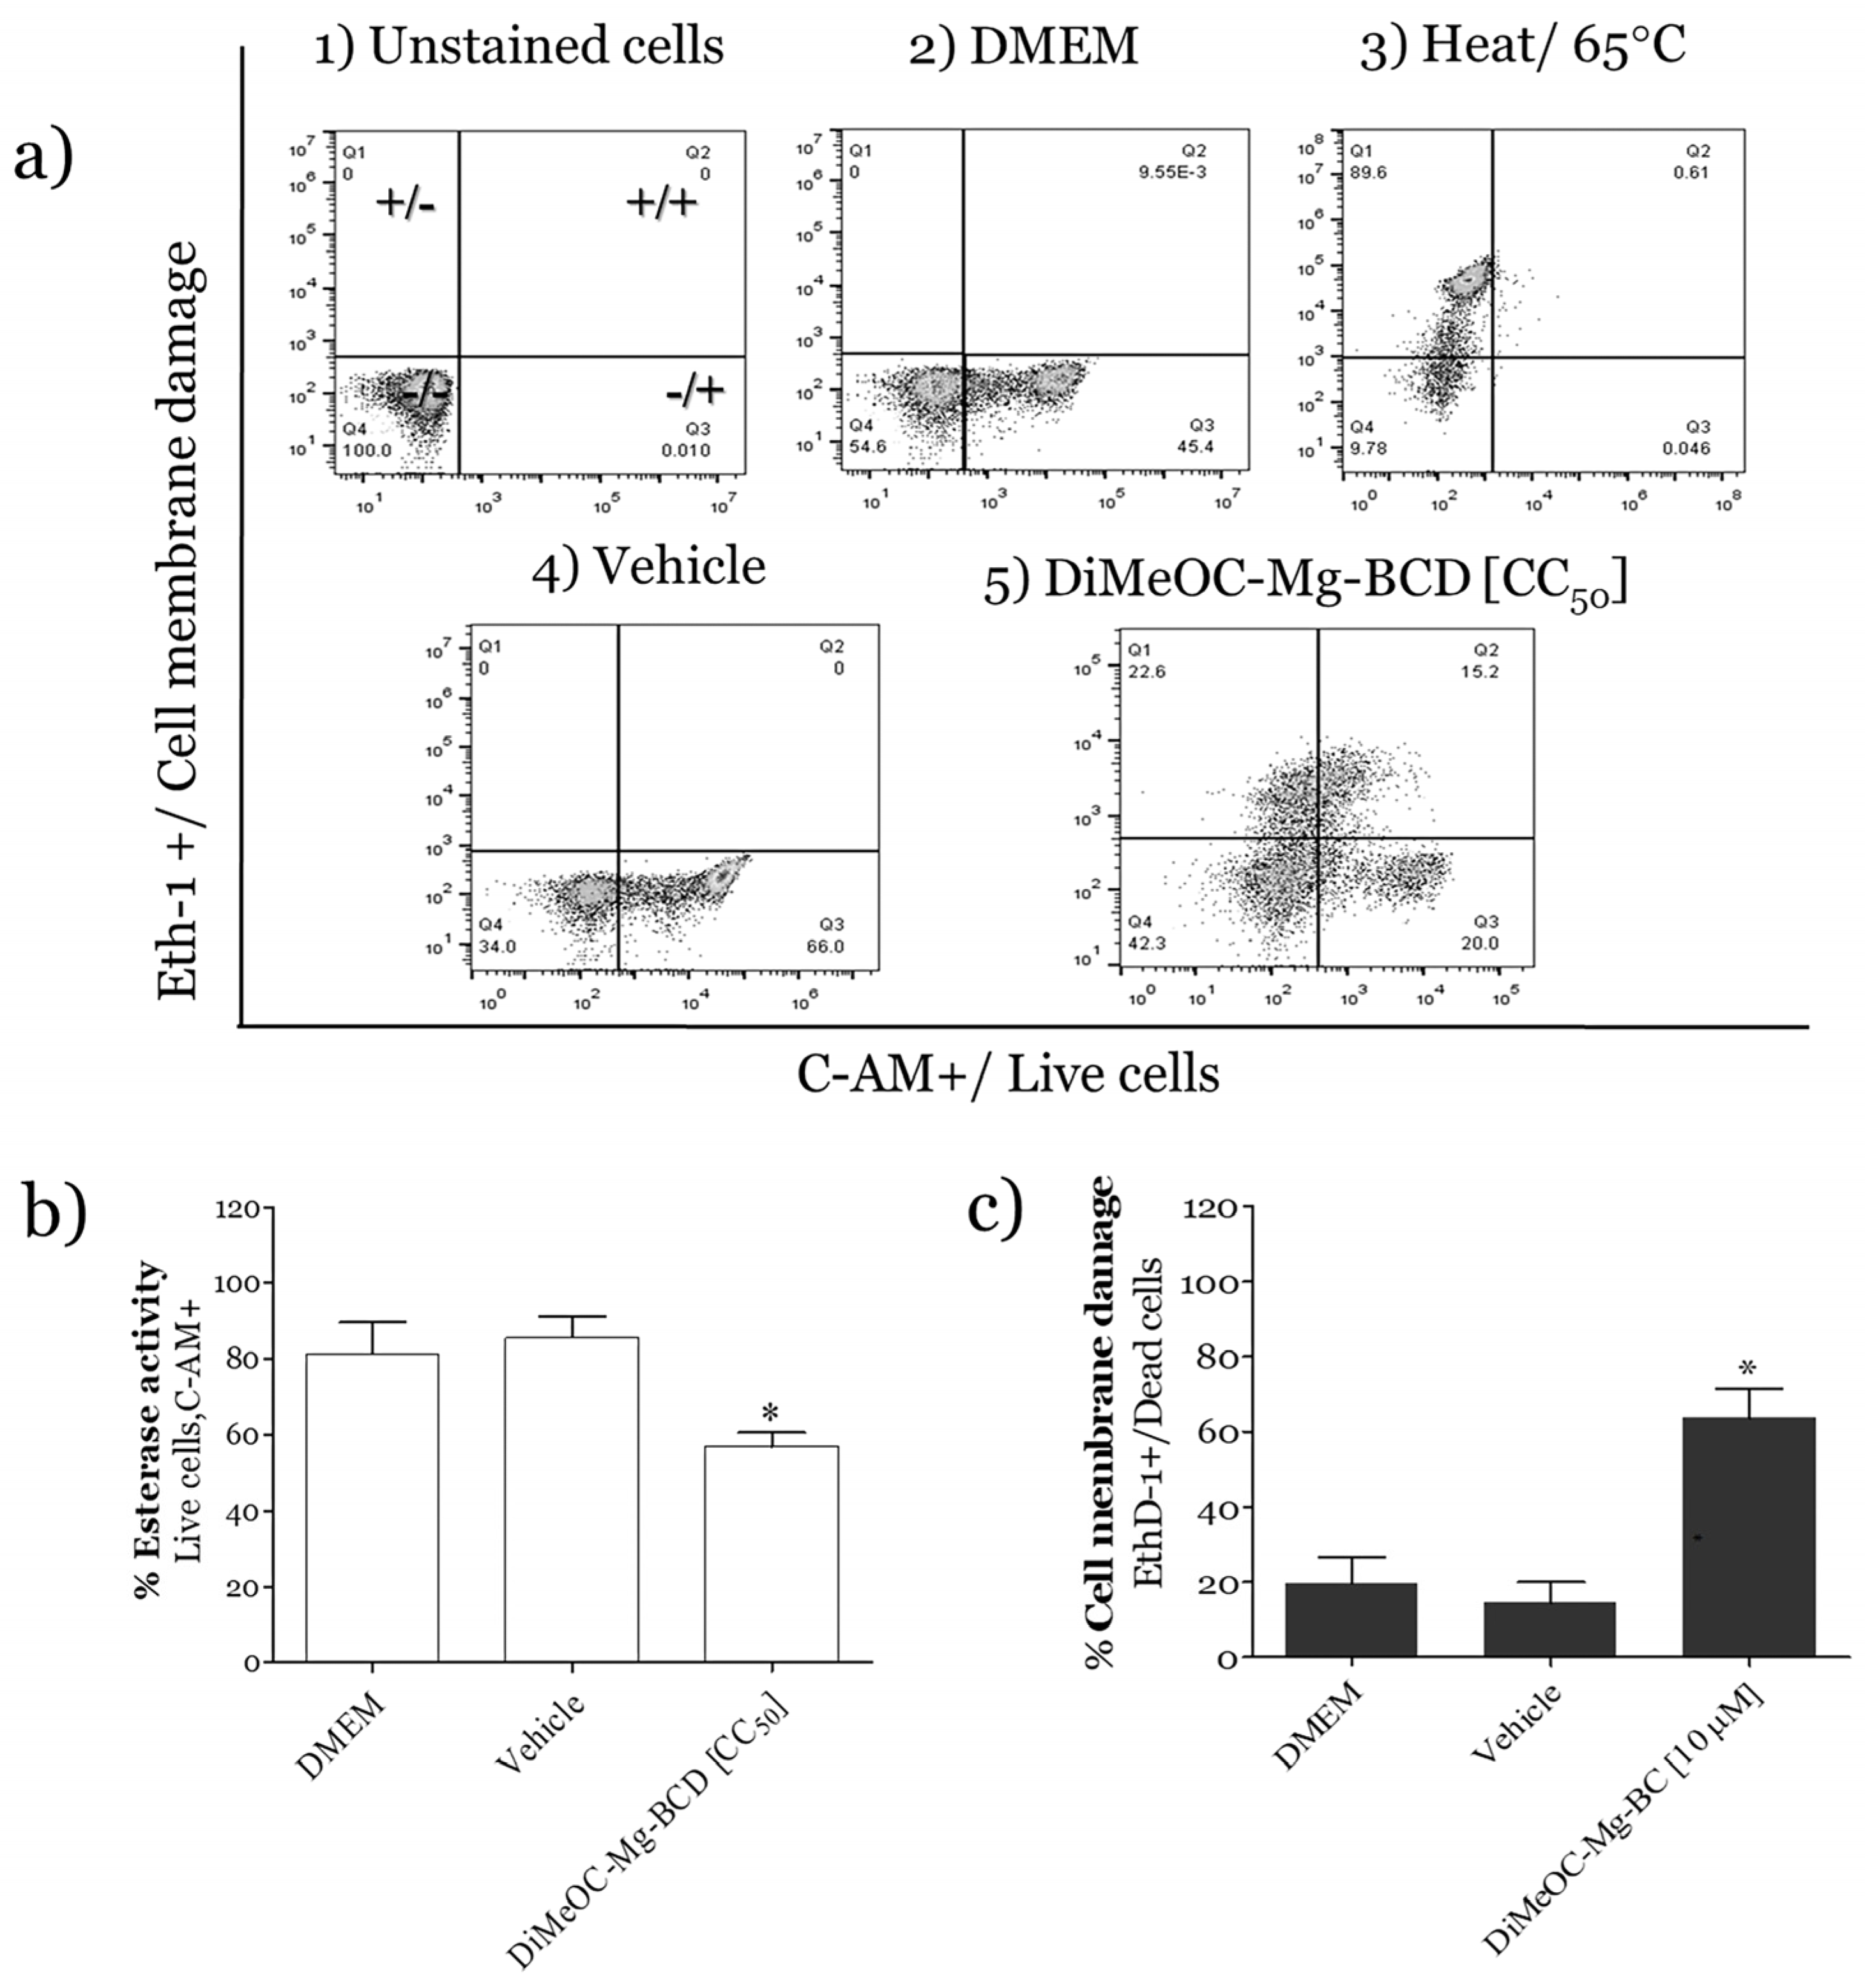
Figure 9.
Flow cytometry dot plots of the effect of DiMeOC-Mg-BCD on MDA-MB-231 breast cancer cell lines on apoptosis. Cells were incubated with different treatments for 48 h and stained with fluorescent stain Annexin V-FITC/ Propidium iodide (AV/PI). The heat renders necrotic positive cells (AV-/PI+). DMEM live cells were negative for both stains (AV-/PI-), and DMSO 5% is a positive control for early apoptosis (AV+/PI-). Vehicle DMSO 1.3% corresponds to the negative controls of the treatment. The dot plots are representatives of three independent experiments performed in duplicate.
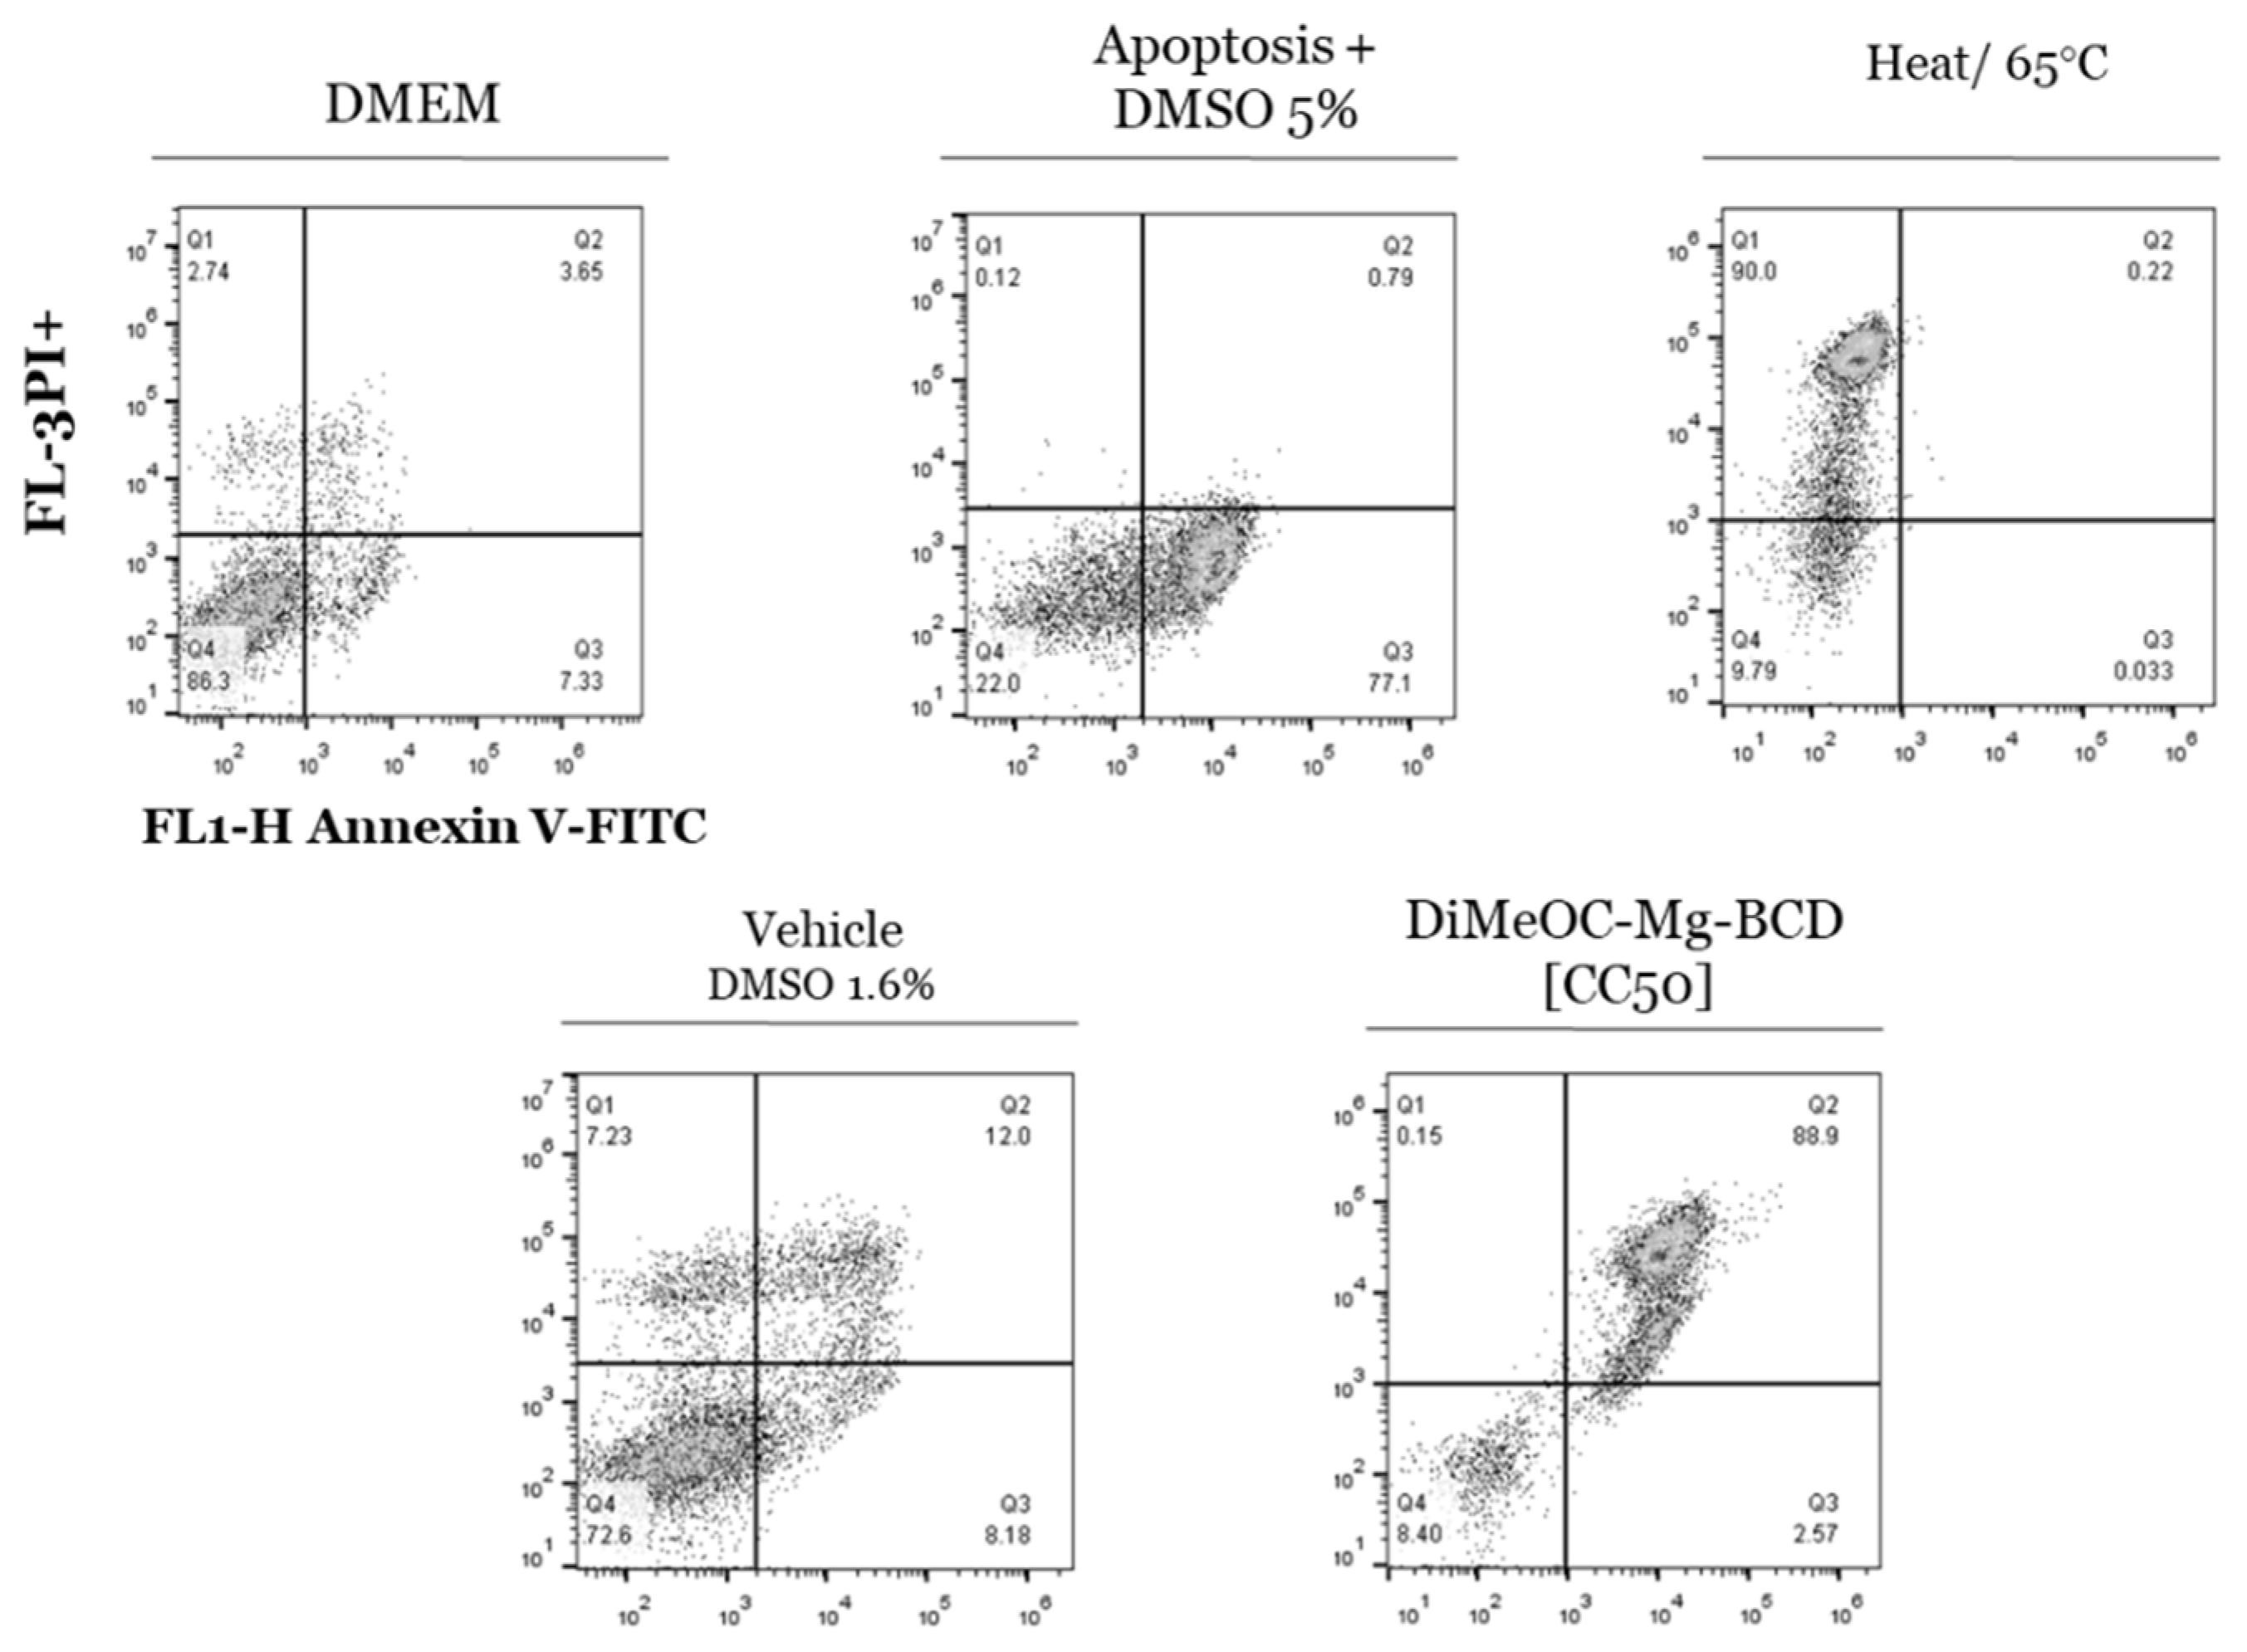
Figure 10.
Effect of DiMeOC-Mg-BCD on MDA-MB-231 breast cancer cell lines on apoptosis. Cells were incubated with different treatments for 48 h and stained with fluorescent stain Annexin V-FITC/ Propidium iodide (AV/PI). Heat was used as necrotic positive cells (AV-/PI+), DMEM live cells were negative for both stains (AV-/PI-), and DMSO 5% was the positive control of early apoptosis (AV+/PI-). Vehicle/ DMSO 1.3% corresponds to the negative control of the treatment. Data are represented by mean and SD of three independent experiments performed in duplicate. One-way analysis of variance and Tukey multiple comparison test were applied. Asterisks represent significant differences from vehicle control. *** p< 0.001.
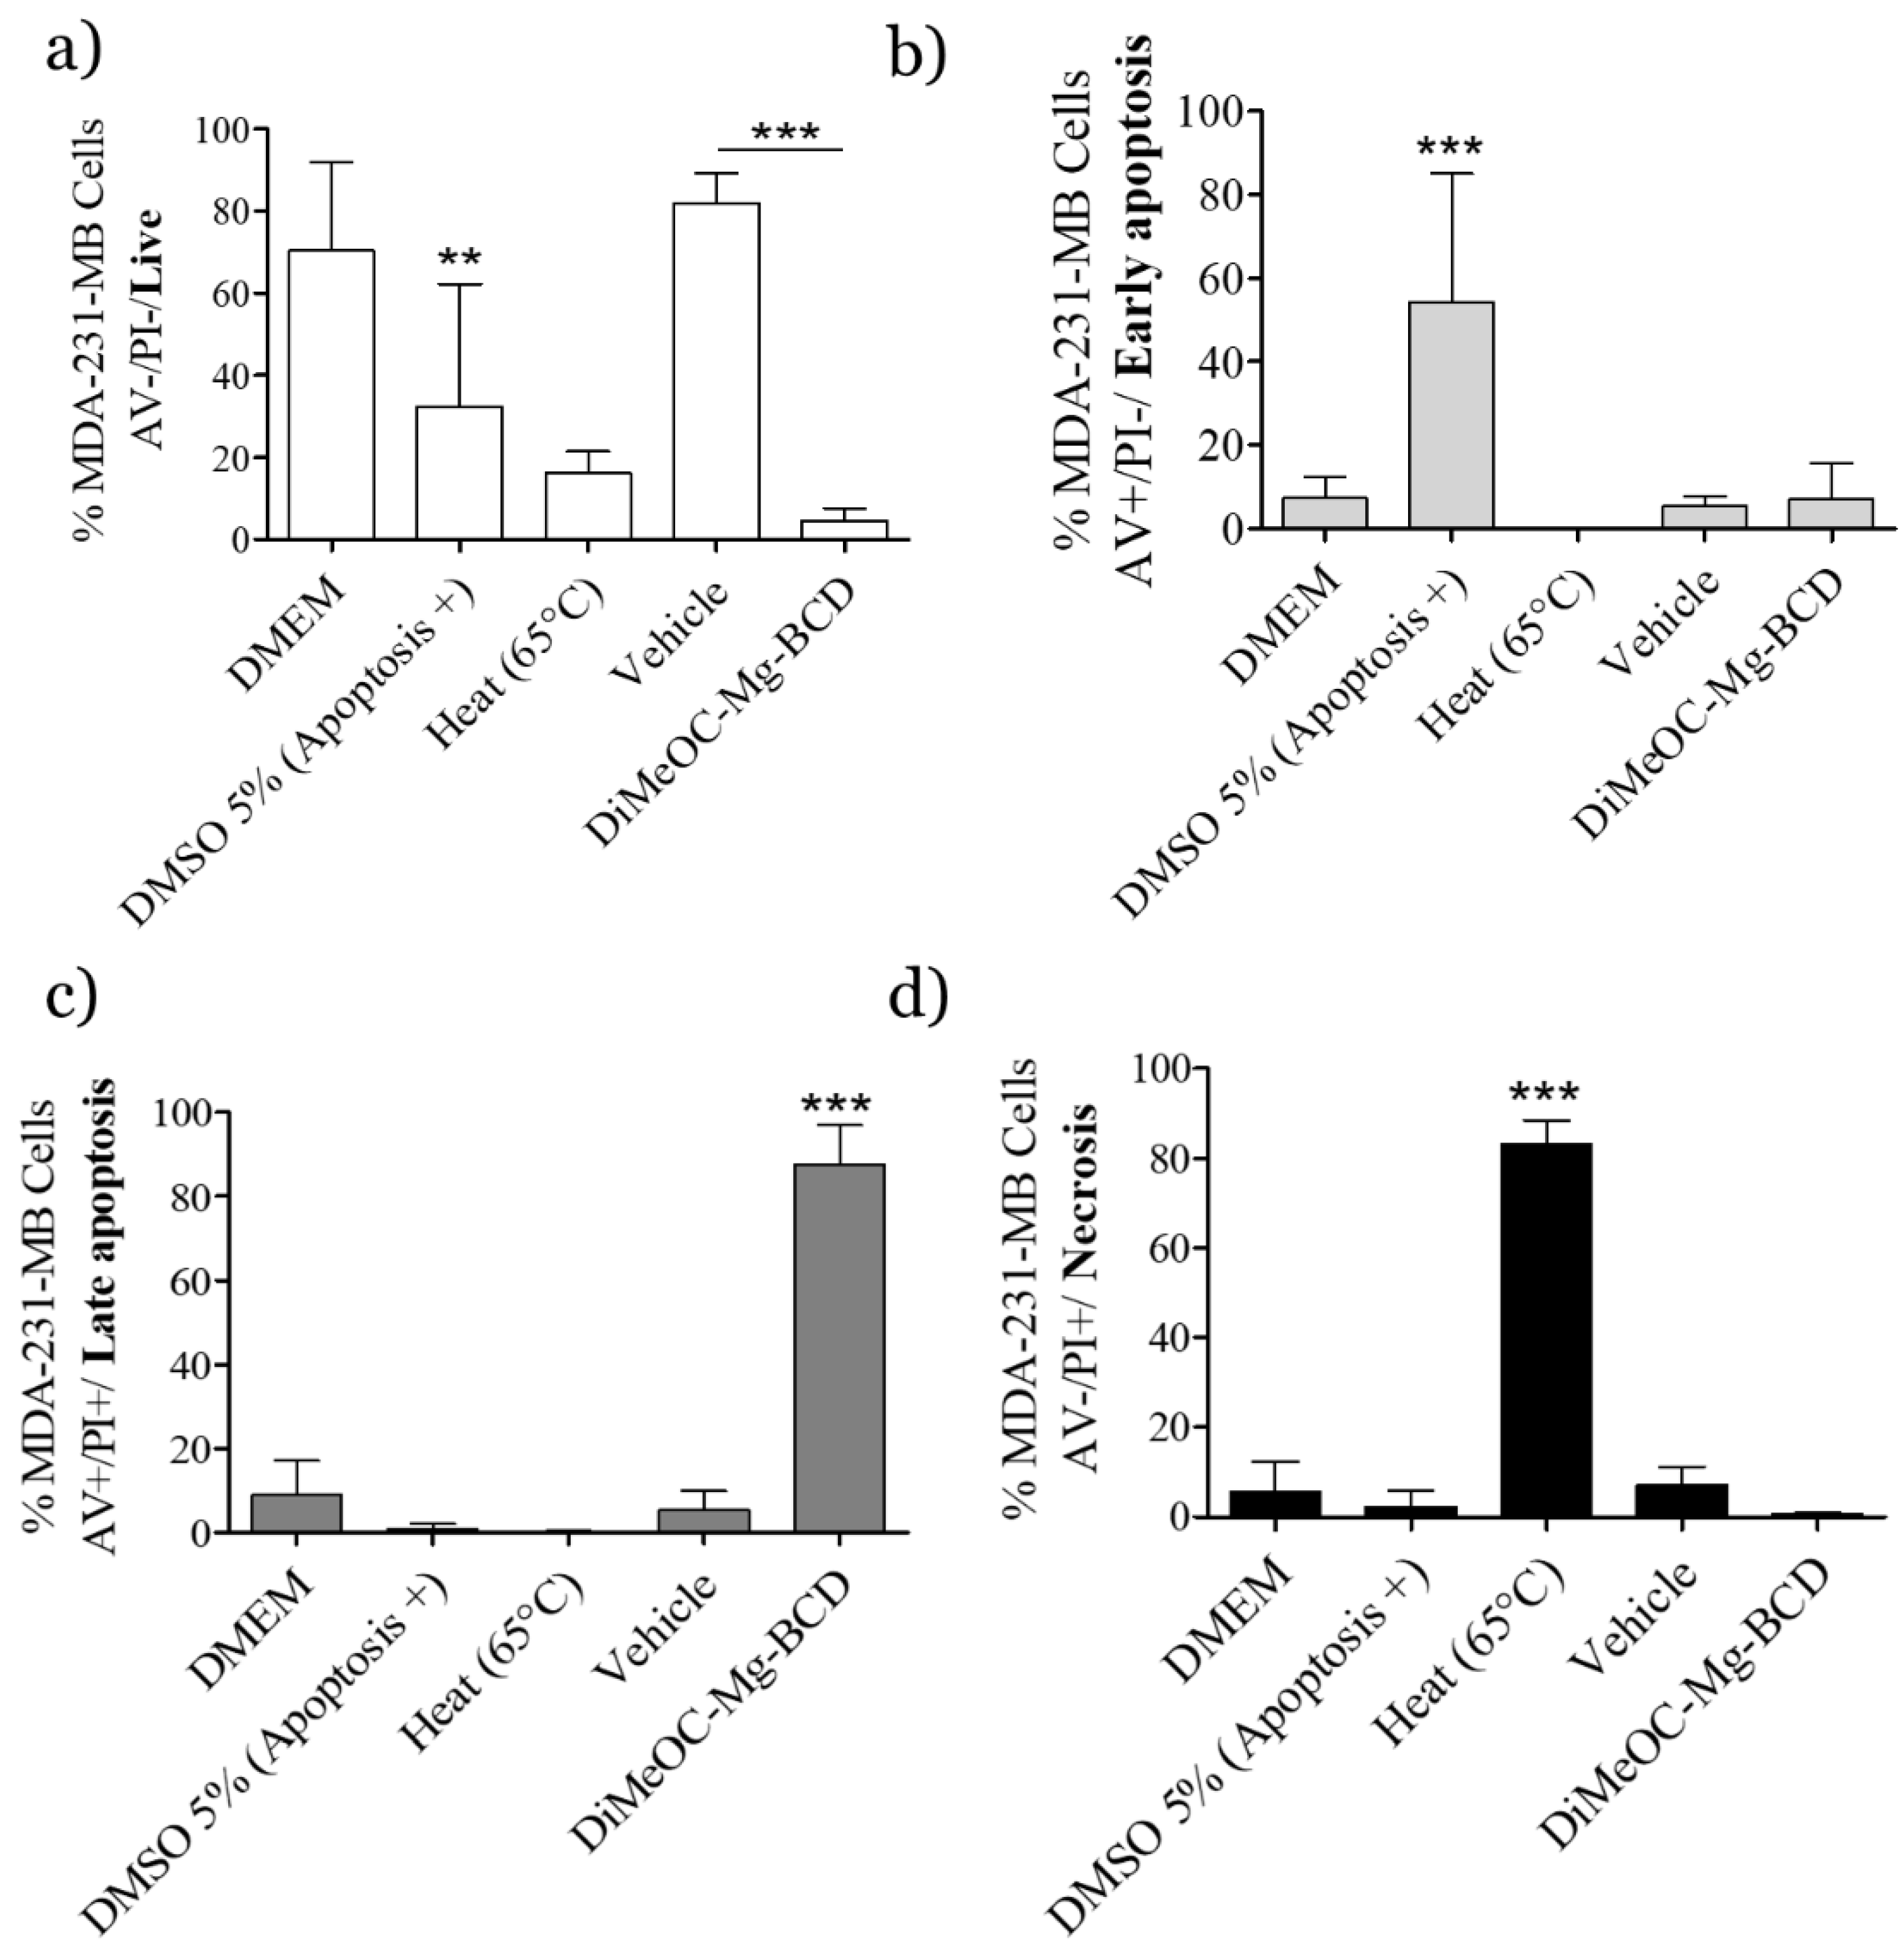
Figure 11.
Effect of DiMeOC-Mg-BCD on MDA-MB-231 cell migration. The wound-healing assay in the migration of MDA-MB-231 cancer cell lines. Vehicle/ DMSO 1.3% corresponds to the negative control of the treatment. Data are represented by mean and SD of three independent experiments performed in duplicate. One-way analysis of variance and Tukey multiple comparison test were applied. Asterisks represent significant differences from vehicle control. * p< 0.05 (24h), *** p< 0.001 (48h).
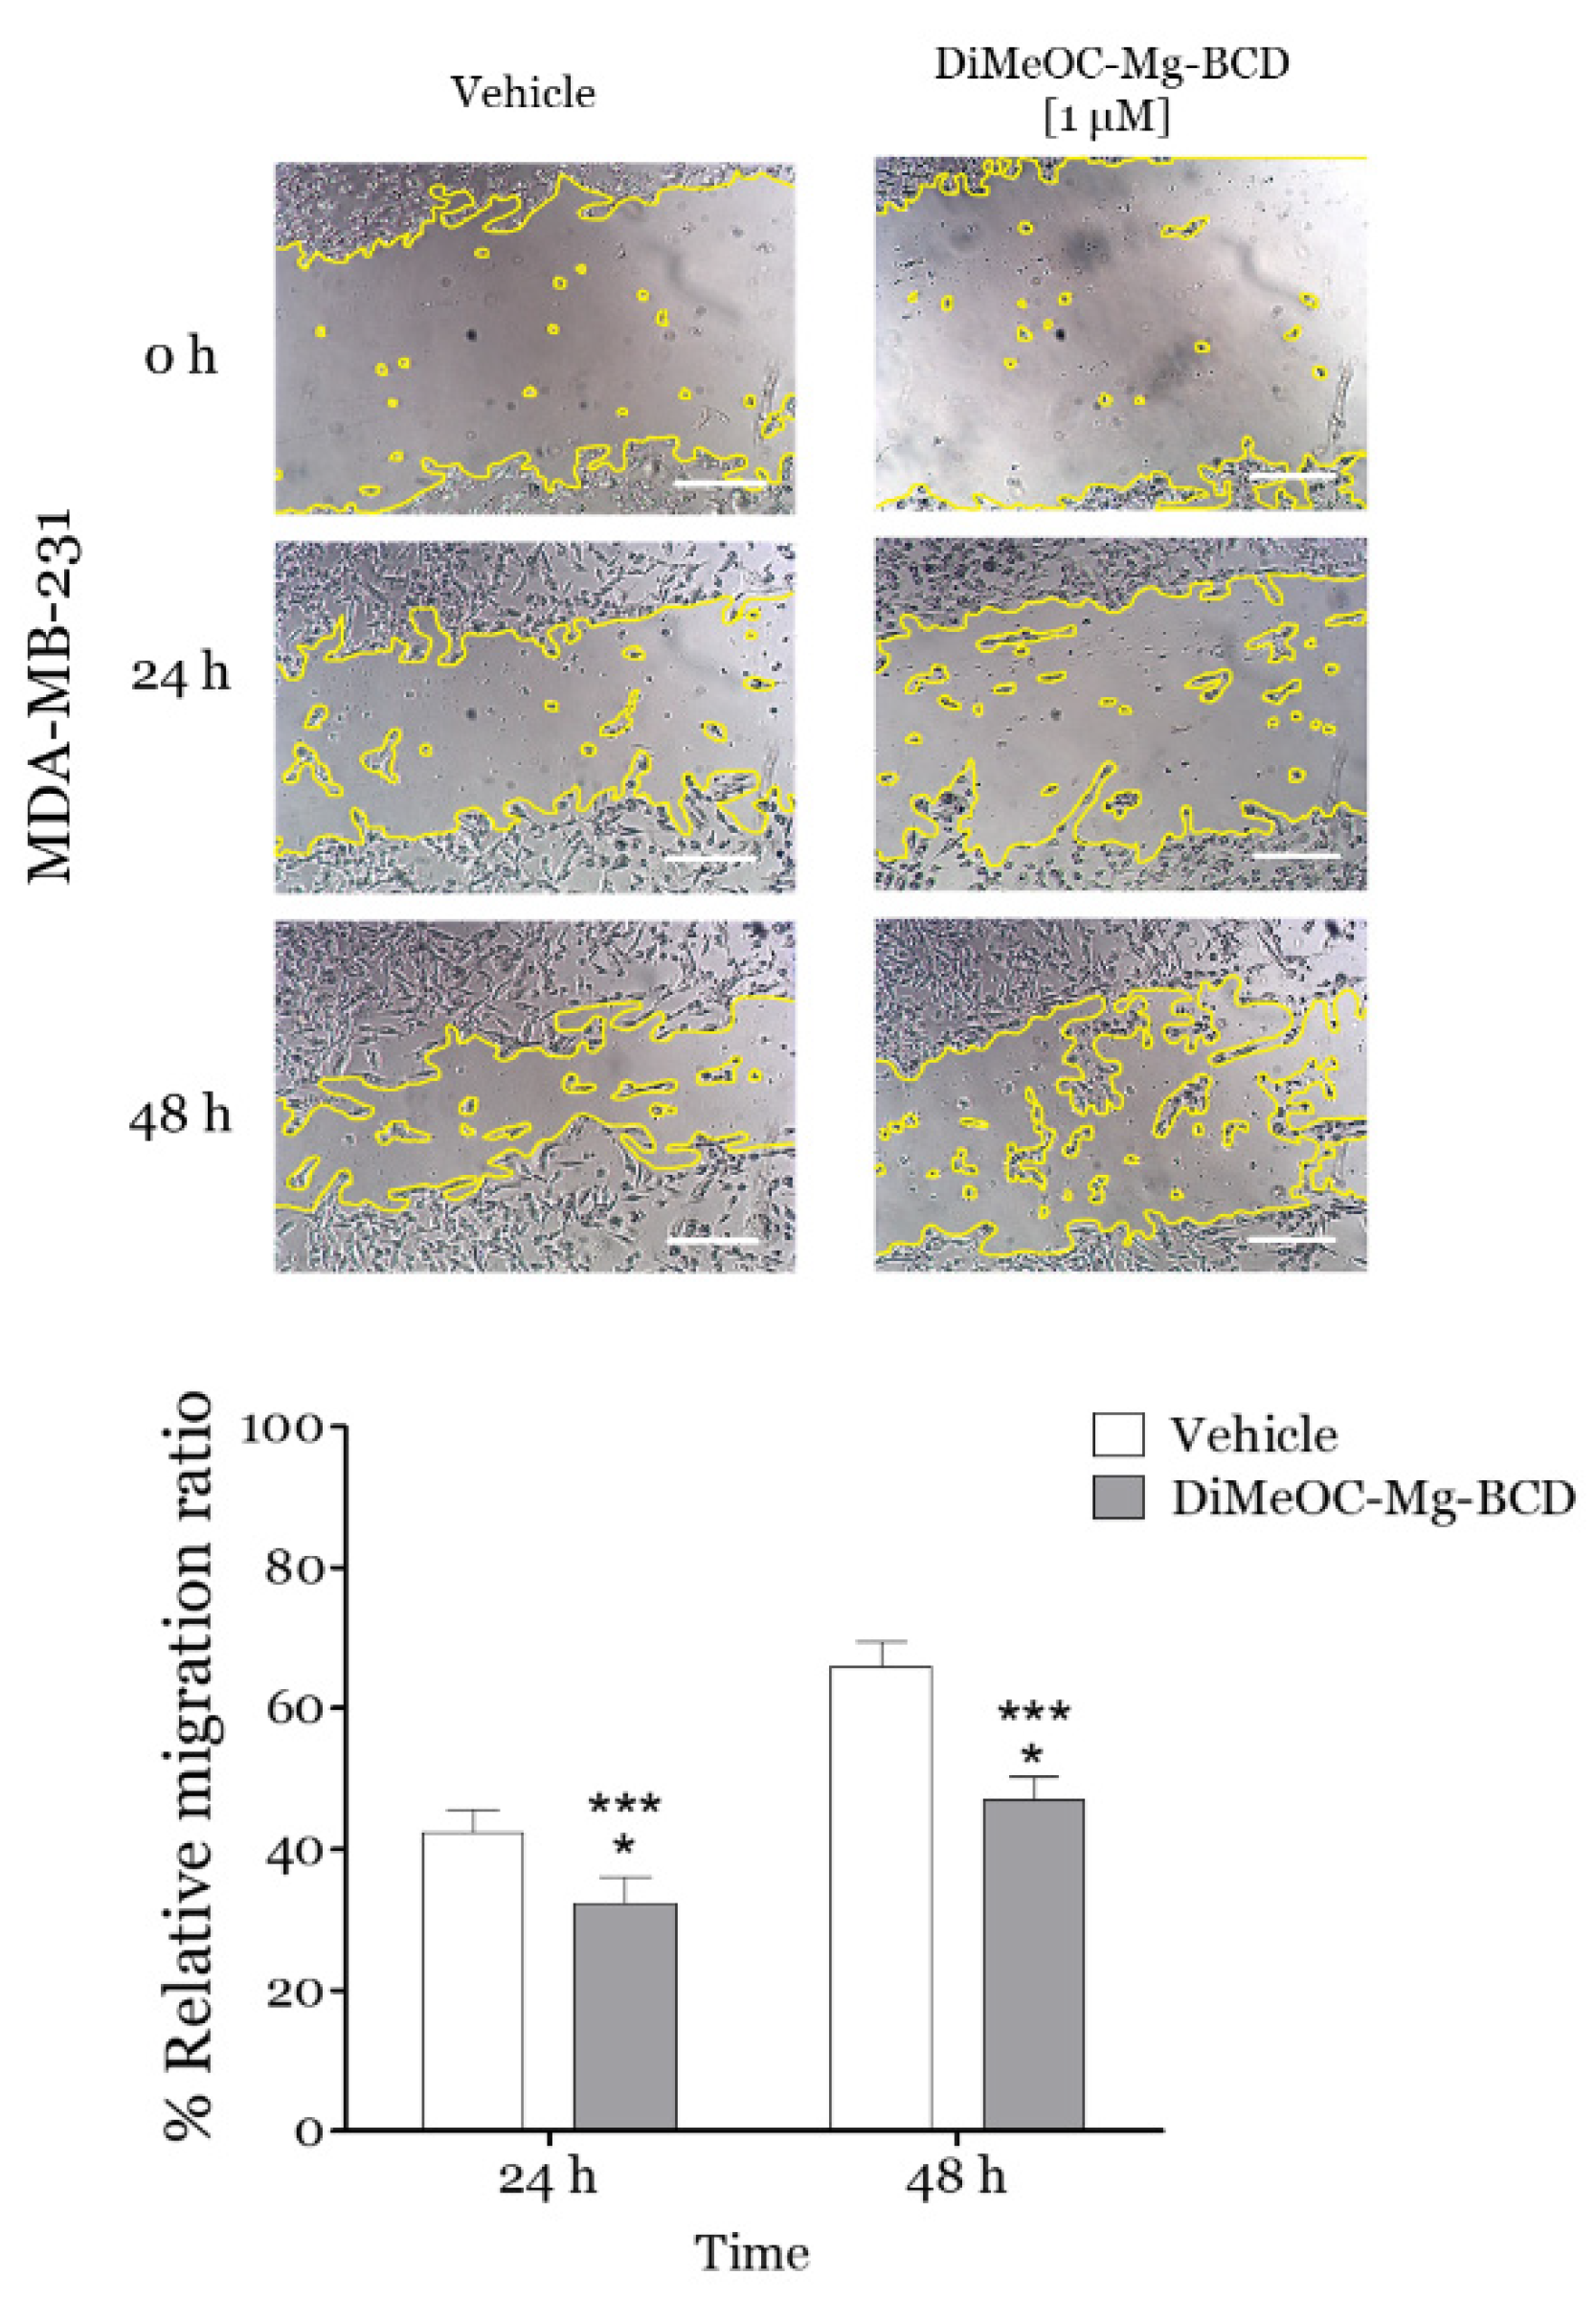
Figure 12.
Effect DiMeOC-Mg-BCD on MMP-2, MMP-9, IL-6 and STAT3 gene expression of MDA-MB-231 breast cancer cell lines. The effect on gene expression is measured after 48 h of treatment. Each bar represents the mean ± S.D. of n = 3. Values for the Vehicle control DMSO were set at 1.3% and set to 1. One-way analysis of variance and Tukey multiple comparison test were applied. Asterisks represent significant differences compared with the Vehicle, DMSO 1.3%, * p< 0.001.
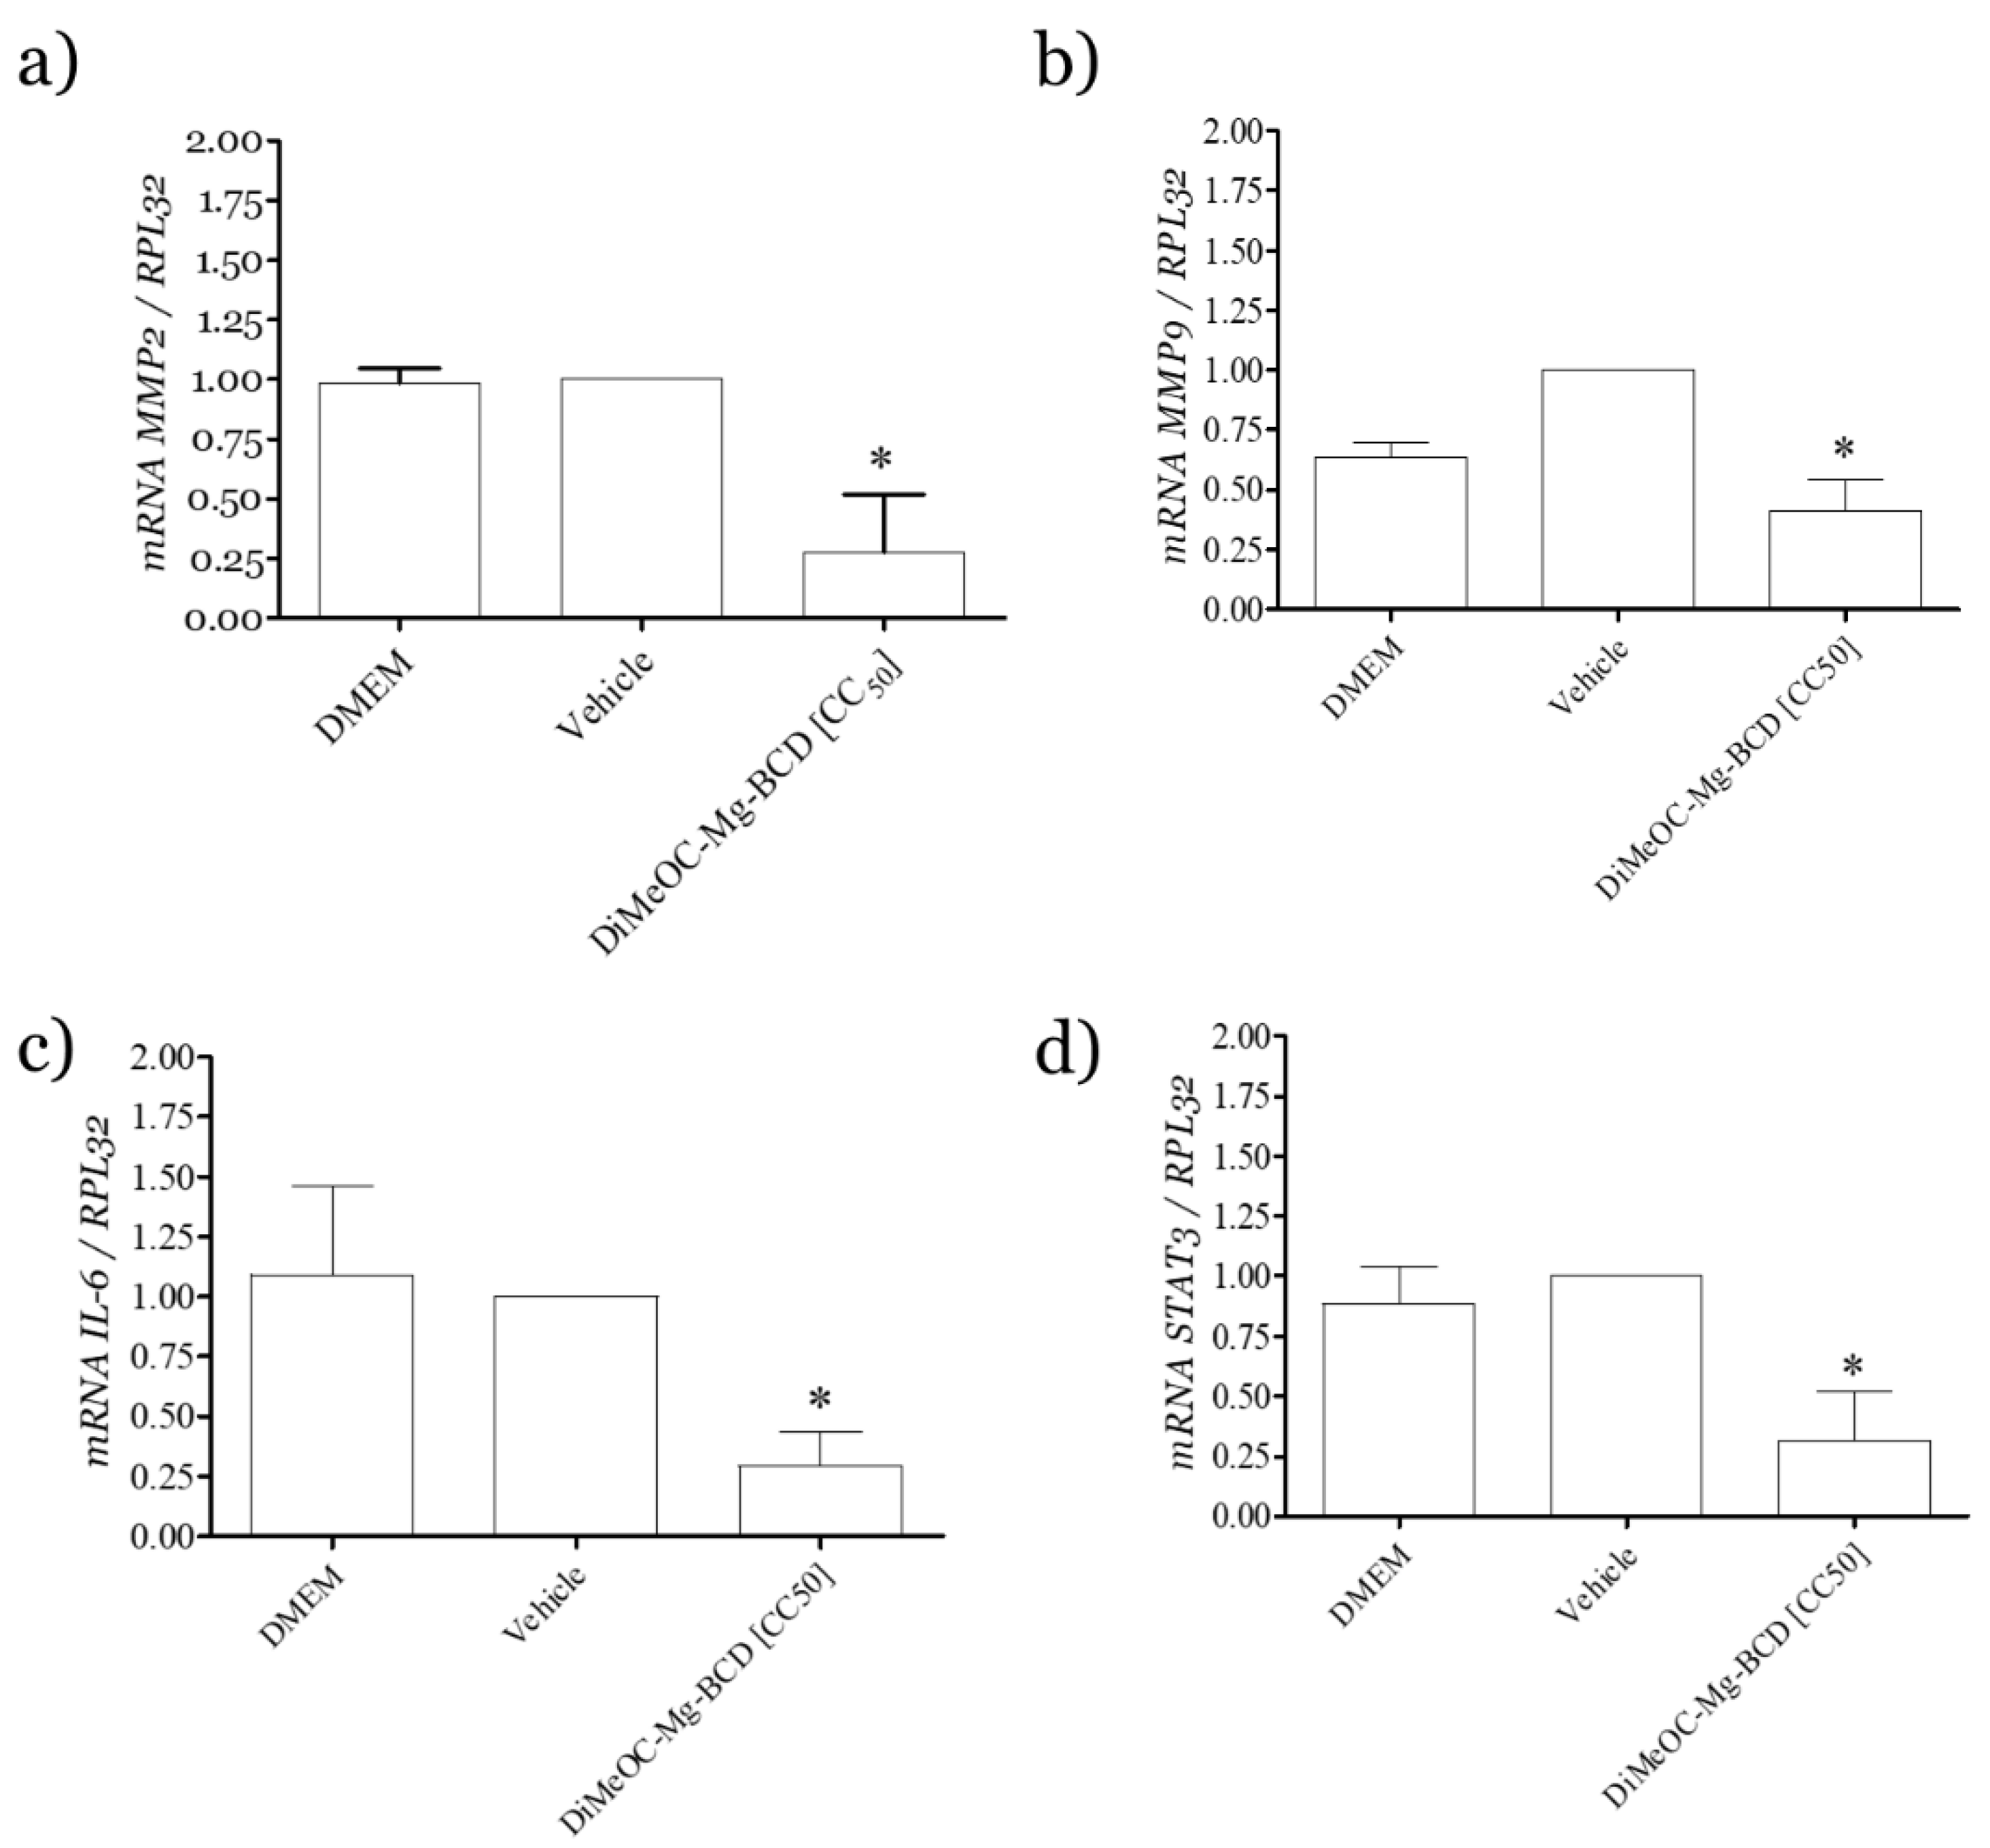
Figure 13.
The proposed mechanism of action of DiMeOC-Mg-BCD on the IL-6/ STAT3 pathway is that this compound downregulates IL-6 and STAT3 expression, which could inhibit STAT translocation into the nucleus, resulting in the suppression of cell proliferation, invasion, and metastasis in hormone receptor-negative breast cancer. DiMeOC-Mg-BCD, JAK: Janus kinase, STAT: signal transducer and activator of transcription, IL-6: interleukin-6.
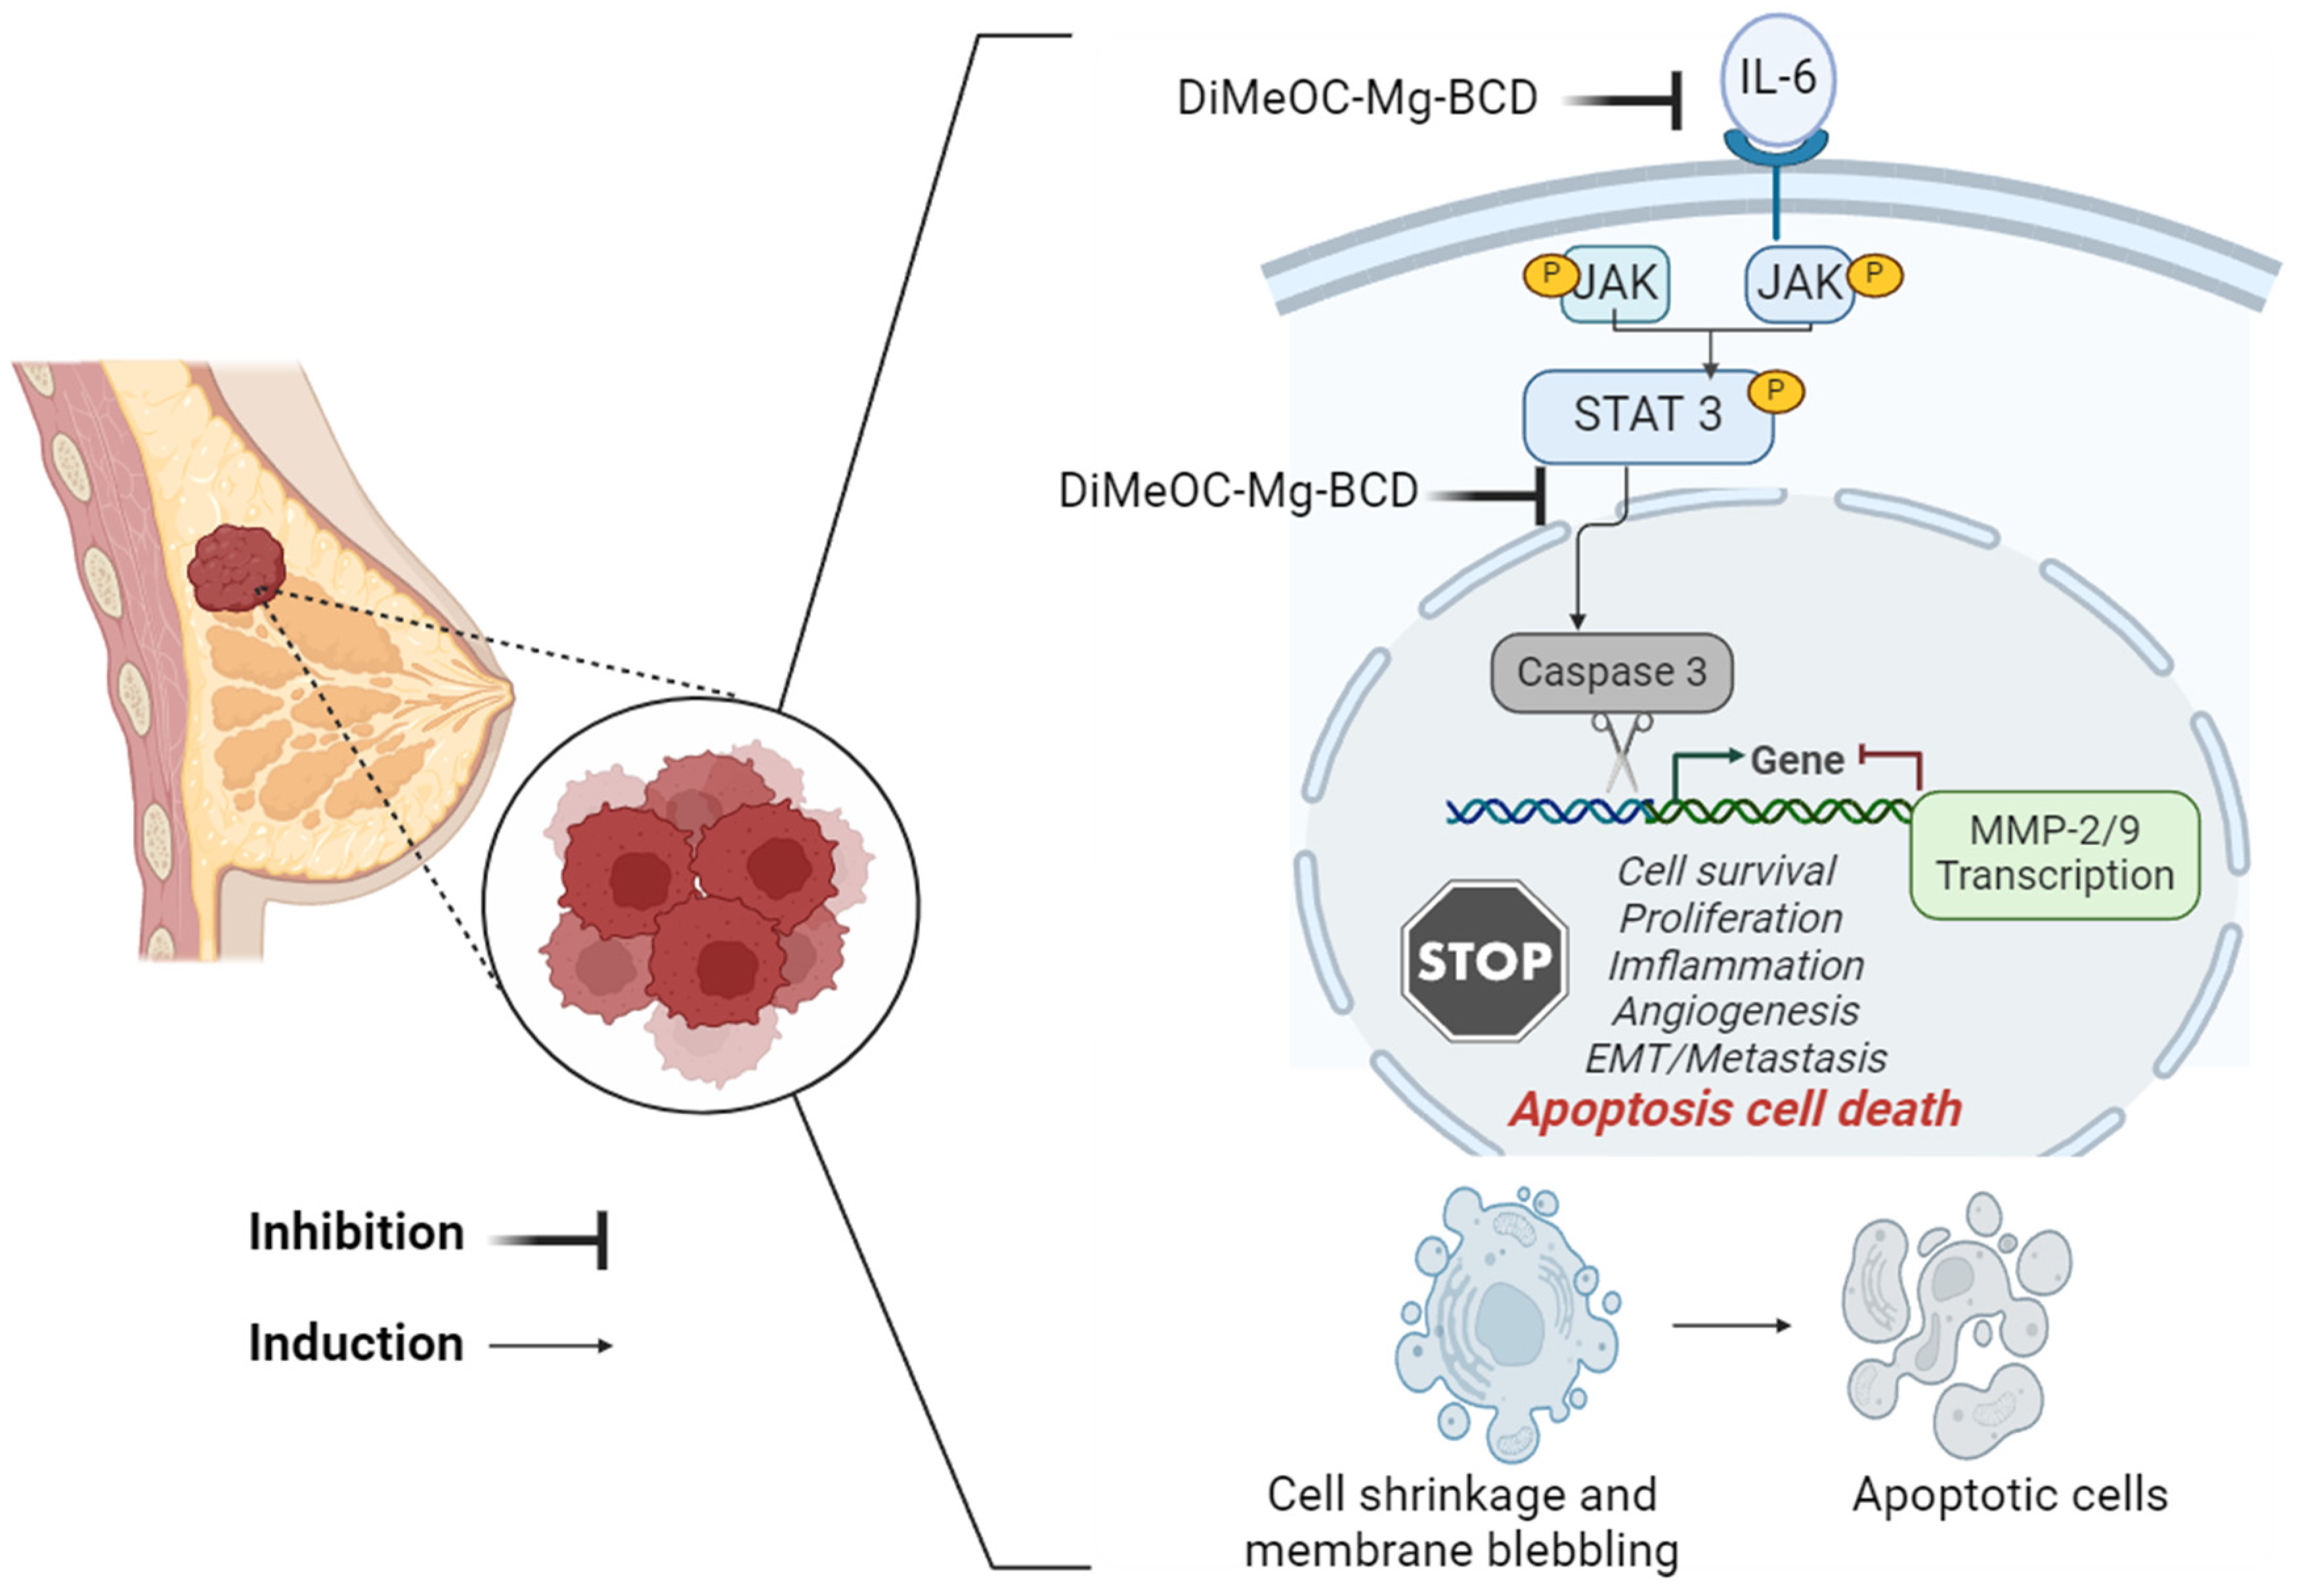
Figure 14.
The mean tumor weights (%) obtained for DiMeOC-Mg and DiMeOC-Mg-BCD treated groups at several dosages. .
Figure 14.
The mean tumor weights (%) obtained for DiMeOC-Mg and DiMeOC-Mg-BCD treated groups at several dosages. .
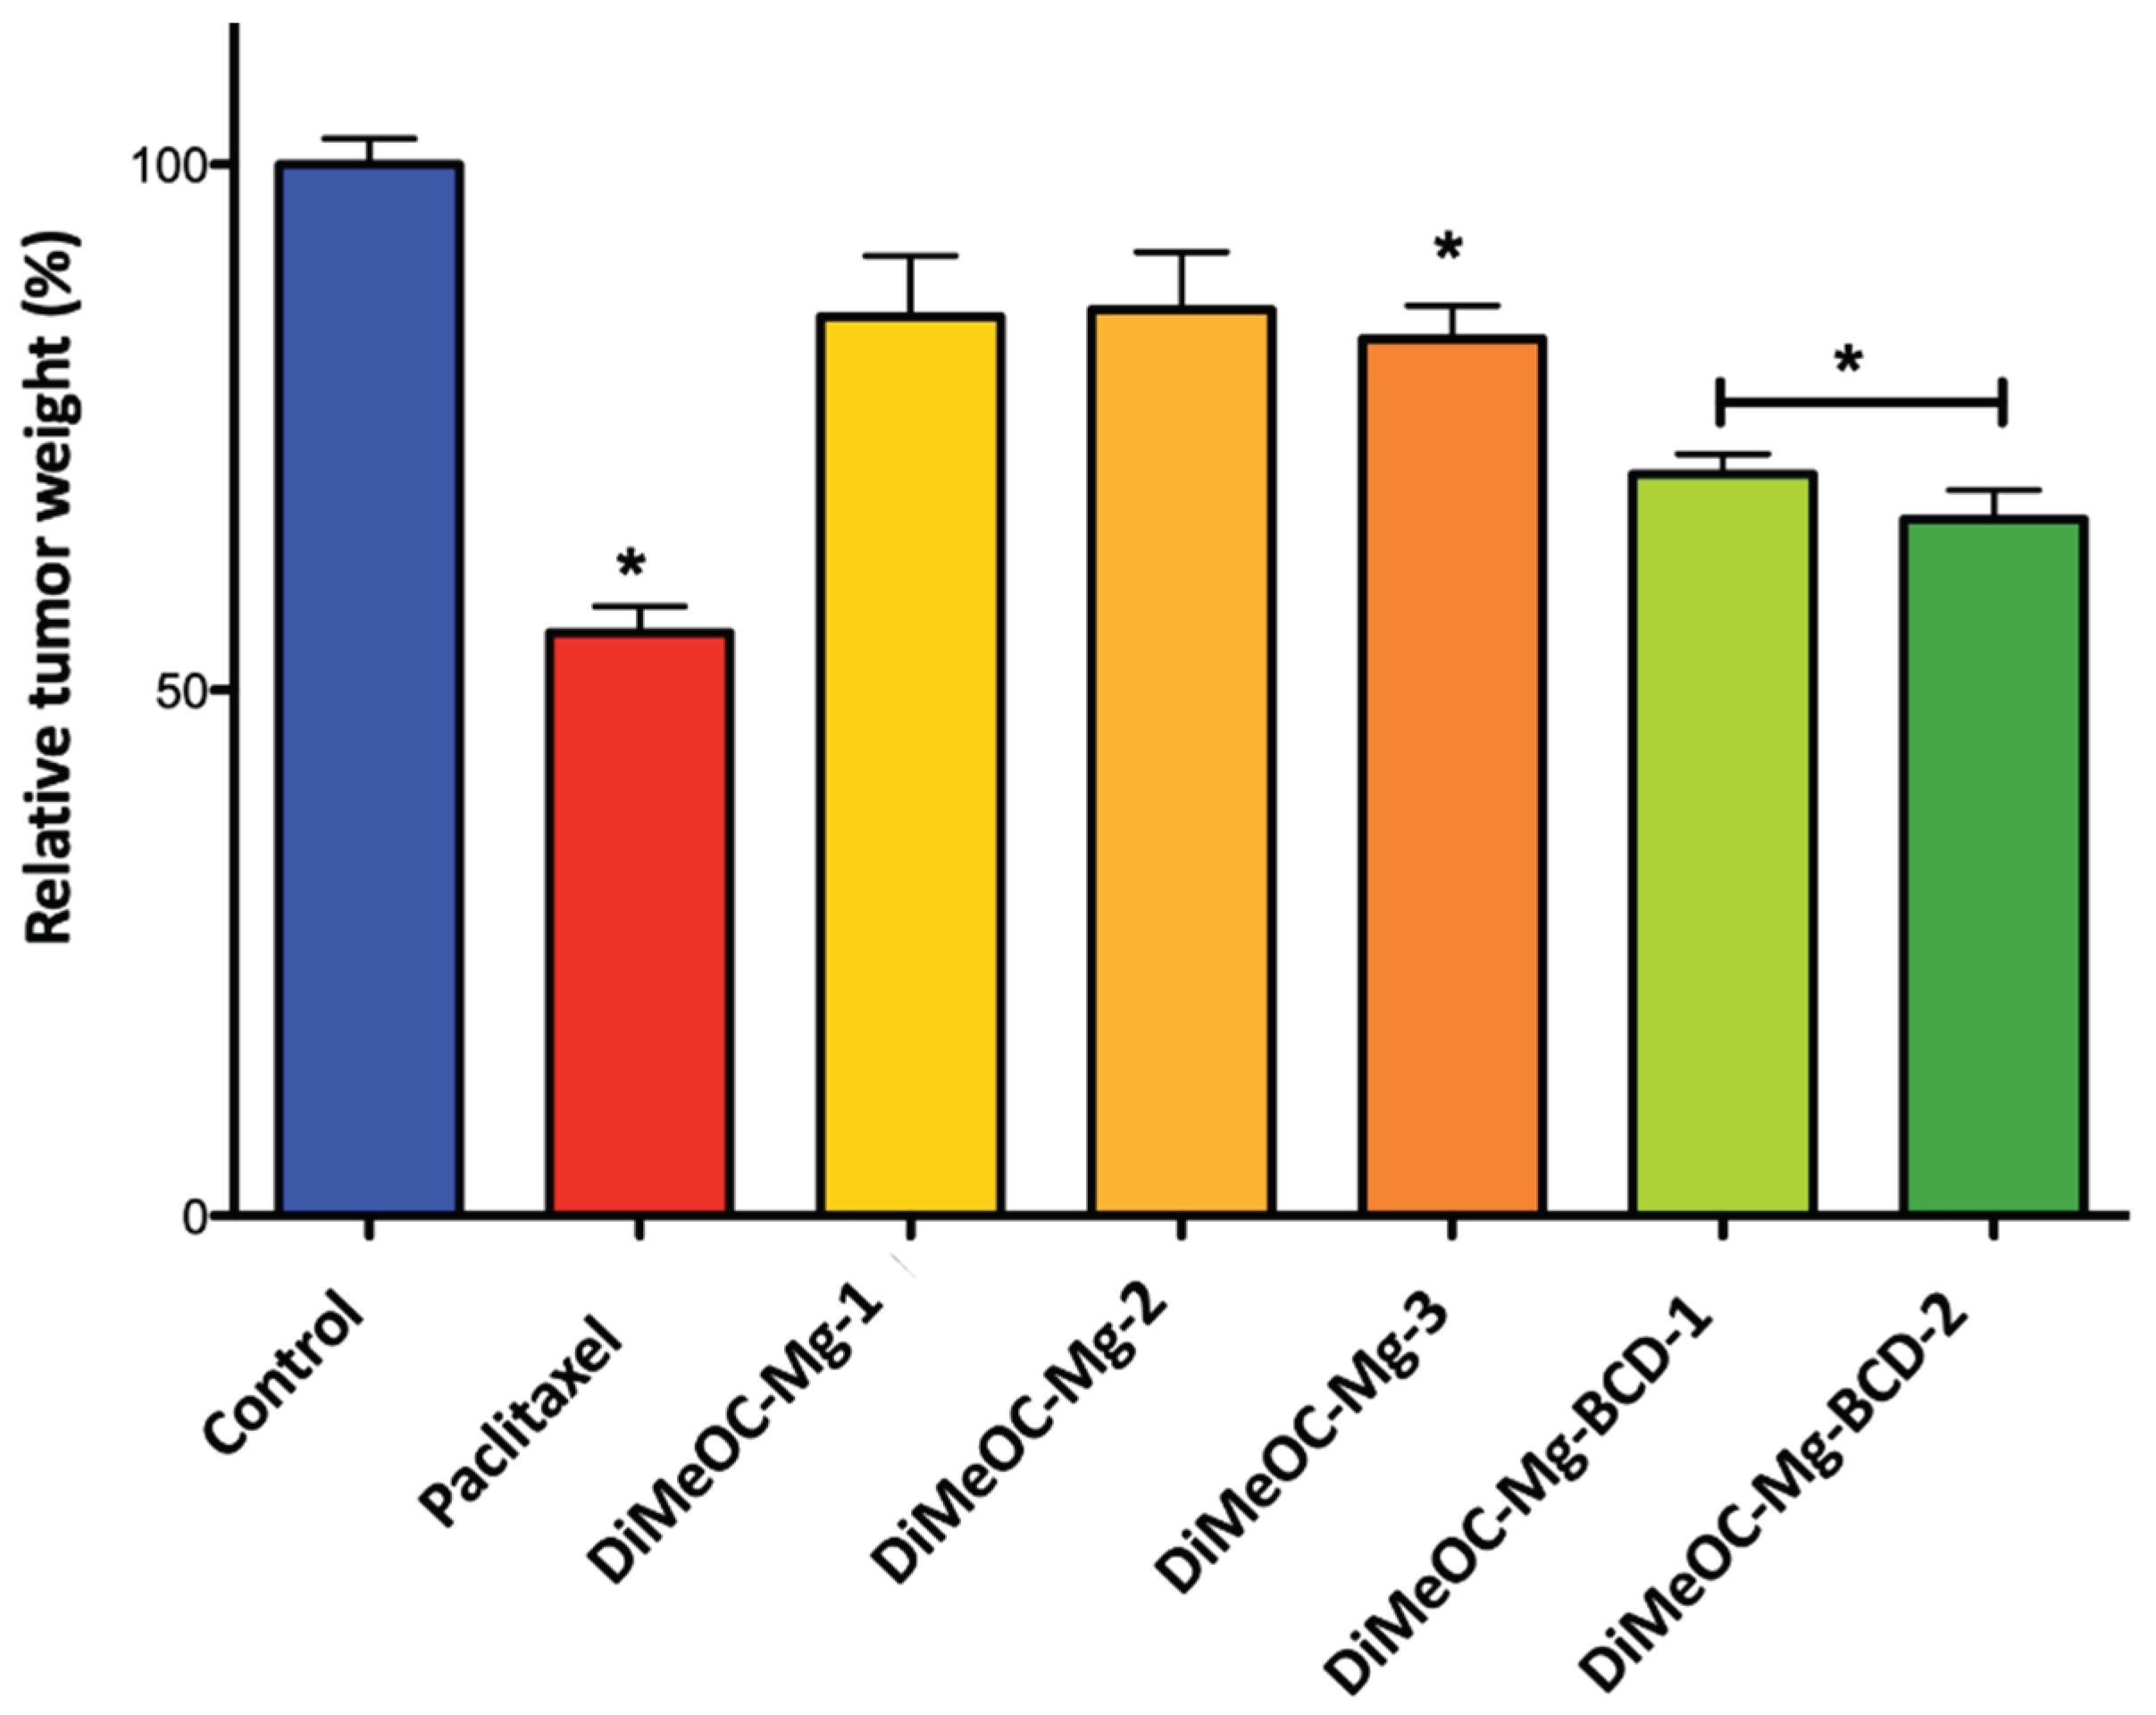
Figure 15.
Kaplan-Meier curve of embryo survival by exposition to DiMeOC-Mg at 0.375, 0.75, and 1.5 mg/Kg and DiMeOC-Mg-BCD at 0.065 and 0.65 mg/Kg, P=0.6540.
Figure 15.
Kaplan-Meier curve of embryo survival by exposition to DiMeOC-Mg at 0.375, 0.75, and 1.5 mg/Kg and DiMeOC-Mg-BCD at 0.065 and 0.65 mg/Kg, P=0.6540.
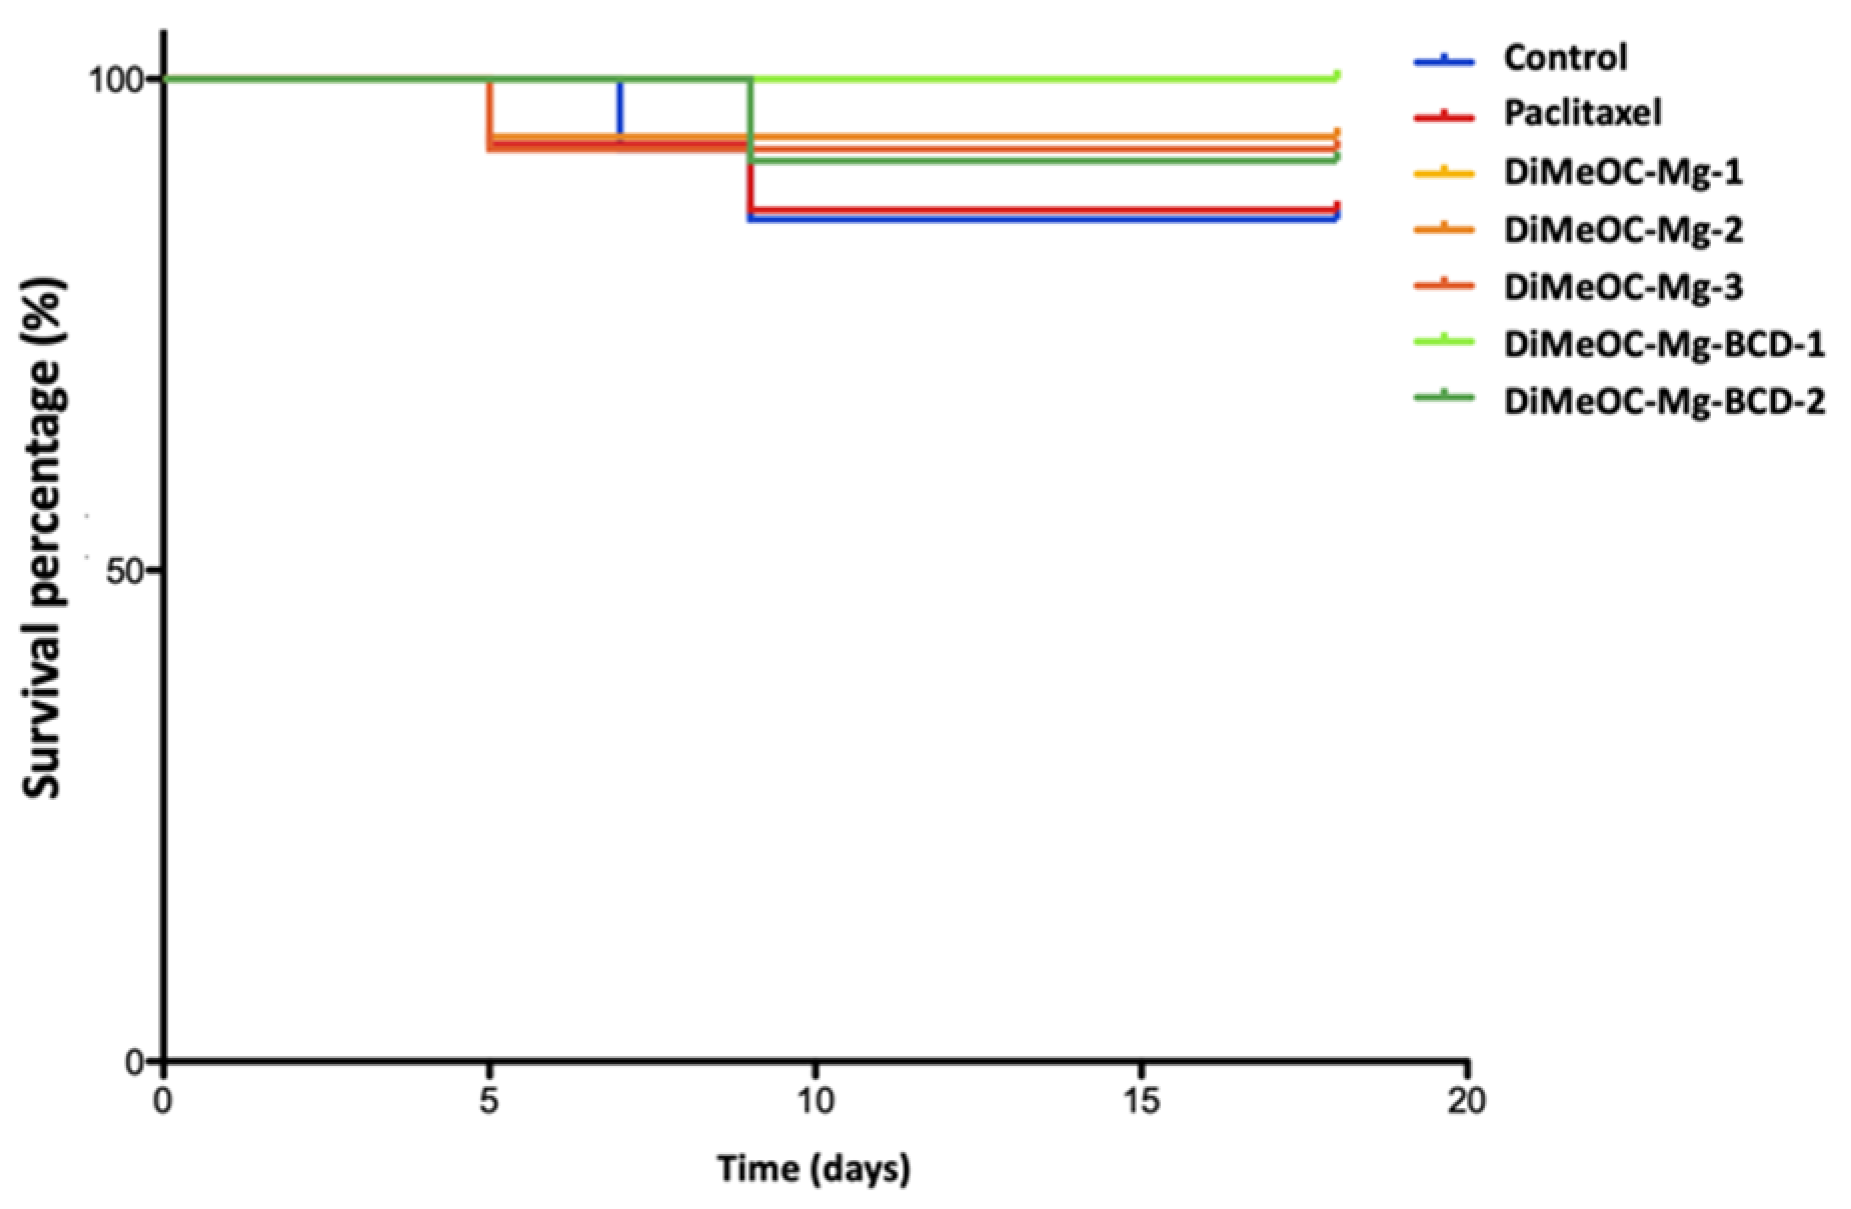

Table 1.
1H NMR chemical shifts of the BCD (D2O, 400 MHz).
| Proton | BCD free (ppm) | BCD complex (ppm) | Δδppm |
|---|---|---|---|
| H1 | 5.11 | 5.06 | -0.05 |
| H2 | 3.68 | 3.63 | -0.05 |
| H3 | 3.99 | 3.93 | -0.06 |
| H4 | 3.62 | 3.58 | -0.04 |
| H5 H6 |
3.88 3.91 |
3.80 3.89 |
-0.08 -0.02 |
Table 2.
Diffusion coefficients (D) of DiMeOC-Mg and BCD.
| Compound | Dfree | Dinclusion complex | HOD |
| DiMeOC-Mg | 1.20 x10⁻¹⁰ cm2/s | 9.82 x10⁻¹¹ cm2/s | 6.61 x10⁻¹⁰ cm2/s |
| BCD | 9.6 x10⁻¹¹ cm2/s | 8.34 x10⁻¹¹ cm2/s | 7.5 x10⁻¹⁰ cm2/s |
Table 3.
Solubility in aqueous media (PBS) of complexes.
| Compounds | Solubility μg /mL |
|---|---|
| DiMeOC-Mg | 15.6 ± 0.048 |
| DiMeOC-Mg-BCD | 98.2 ± 0.038 |
Table 4.
CC50 (μM) for cancer cell lines with DiMeOC and their complexes.
| Compounds | MDA-MB-231 |
|---|---|
| DiMeOC | >100 |
| DiMeOC-Mg | 22.04 ± 0.06 |
| DiMeOC-Mg-BCD | 10.73 ± 0.1 |
Table 5.
Treatments and final dosages for study in ovo.
| Group | Injected concentration (μM) |
In ovo final dose (mg/Kg) |
|---|---|---|
| Control (DMSO 1%) | - | - |
| Paclitaxel | 10.0 | 0.014 |
| DiMeOC-Mg-1 | 276.1 | 0.375 |
| DiMeOC-Mg-2 | 552.3 | 0.750 |
| DiMeOC-Mg-3 | 1104.5 | 1.5 |
| DiMeOC-Mg-BCD-1 | 10 | 0.065 |
| DiMeOC-Mg-BCD-2 | 100 | 0.650 |
Table 6.
Oligonucleotides used.
| Gene | Forward | Reverse | *Probe | Accession Number |
|---|---|---|---|---|
| RPL32 | GAAGTTCCTGGTCCACAACG | GAGCGATCTCGGCACAGTA | 17 | NM_000994.3 |
| MMP-2 | ATAACCTGGATG CCGTCGT | AGGCACCCTTGAA GAAGTAGC | 70 | NM_001302510.1 |
| MMP-9 | GCCACCCGAGTGTAACCATA | GAACCAATCTCAC CGACAGG | 6 | NM_004994.2 |
| IL-6 | GATGAGTACAAAAGTCCTGATCCA | CTGCAGCCACTGGTTCTGT | 40 | NM 000600.1 |
| STAT3 | CCTCTGCCGGAGAAACAGT | CATTGGGAAGCTGTCACTGTAG | 1 | NM_139276.2 |
*From the universal probe library (Roche).
Disclaimer/Publisher’s Note: The statements, opinions and data contained in all publications are solely those of the individual author(s) and contributor(s) and not of MDPI and/or the editor(s). MDPI and/or the editor(s) disclaim responsibility for any injury to people or property resulting from any ideas, methods, instructions or products referred to in the content. |
© 2024 by the authors. Licensee MDPI, Basel, Switzerland. This article is an open access article distributed under the terms and conditions of the Creative Commons Attribution (CC BY) license (http://creativecommons.org/licenses/by/4.0/).
Copyright: This open access article is published under a Creative Commons CC BY 4.0 license, which permit the free download, distribution, and reuse, provided that the author and preprint are cited in any reuse.


