Submitted:
14 March 2024
Posted:
14 March 2024
You are already at the latest version
Abstract
Managing a portfolio whose value closely tracks an index by trading only in a subset of the index constituents involves an NP-hard optimisation problem. In the prior literature, it has been suggested to solve this problem using sequential Monte Carlo (SMC, a.k.a. particle filter) methods. However, this literature does not take transaction costs into account, although transaction costs are the primary motivation for attempting to replicate the index by trading in a subset, rather than the full set of index constituents. This paper extends the SMC approach to index tracking to allow for proportional transaction costs and implements this extended method on empirical data for a variety stock indices. In addition to providing a more practically useful tracking strategy by allowing for transaction costs, we find that including a penalty for transaction costs in the optimisation objective can actually lead to better tracking performance.
Keywords:
index tracking
; sequential Monte Carlo
; transaction costs
; portfolio management
1. Introduction
Index tracking, also known as index replication, is a passive investment strategy that has gained popularity due to the higher costs associated with active investing and skepticism regarding the ability of active funds to outperform the market (see e.g. Rompotis (2013); Barber and Odean (2000)). Financial indices track the performance of a collection of financial assets or an overall market. Indices are not tradable instruments themselves, however replication can be achieved by creating a portfolio of assets that closely match the performance of an index. To perfectly replicate the performance of an index, one would need to invest in all its constituents stocks in the appropriate proportions. This may require continuously trading in hundreds of assets, which is both costly and often infeasible. More specifically, index replication’s effectiveness can be influenced by the constituent assets’ liquidity. Furthermore, continuous trading can lead to high transaction costs due to the costs incurred with each trade and the adjustments made during rebalancing of the portfolio’s composition. The goal of sparse index tracking is to create a portfolio that closely replicates the performance of a benchmark index while avoiding the need to invest in all its constituent assets. The desired solution is a portfolio of a relatively small subset of assets that replicates an index at a lower cost.
Satpathy and Shah (2022) proposed a Sequential Monte Carlo (SMC) algorithm to address the sparse index tracking problem. The key idea is to interpret the index-tracking problem as a maximization problem over the set of all possible (fixed-size) subsets of stocks composing some index and then using SMC as a global optimization technique. Despite the novelty and the success of this approach when compared to other methods, such as for example Tibshirani (1996); Xu et al. (2015); Benidis et al. (2018), it is not clear whether this technique is an optimal index-tracking strategy, as it falls short in addressing the equally significant objective of reducing transaction costs. Indeed, when rebalancing the tracking portfolio, the algorithm does not explicitly minimize transaction costs. It focuses solely on minimising the tracking error between the portfolio and index returns. This approach may lead to marginal improvements in the tracking error, but the cost associated with the portfolio rebalancing could outweigh any benefit gained.
The purpose of this work is to improve the Sequential Monte Carlo algorithm proposed by Satpathy and Shah (2022) by accounting for transaction costs in portfolio rebalancing. To this end, we redefine the dynamics of the index-tracking portfolio in such a way as to account for (proportional) transaction costs. Relying on this, we first reformulate the problem by adding a penalization term to the objective function of the index-tracking problem and then study this modified problem by adopting similar techniques.
The remainder of the report is structured as follows. The general formulation of the index tracking problem, as proposed by Satpathy and Shah (2022), is presented in Section 2. In Section 3, a description of how to adjust the index tracking problem for transaction costs is given. Section 4 details the methods used for model implementation and testing, followed by the results in Section 5. Finally, the report concludes in Section 6 with a brief summary of the outcomes as well as a short description of possible further studies.
2. Preliminaries
2.1. The Index Tracking Problem
In this section, we recall the general formulation of the index-tracking problem. Let us consider an index I comprised of n stocks. Denote by the column vector of daily returns of the index over a period of T days. For each constituent stock i, let be the corresponding returns and set . The index tracking problem at time t consists of finding , where , such that
Constraint (3) represents a full budget constraint, while (2) imposes a constraint on that limits investors to taking only long positions. The cardinality constraint (4) restricts the number of stocks used to track the index to a fixed number . An increase in p might lead to a reduction in tracking errors, but possibly incurring larger transaction costs. Thus, p allows us to control the trade-off between tracking error and trading costs.
The cardinality constraint for is non-convex and gives rise to an NP-hard problem. A wealth of methods exist in the literature to solve this. Popular methods include applying regularization, using a Lagrangian version with an approximated -norm, replacing the -norm with an -norm (the LASSO technique), employing Mixed Integer Quadratic optimization and various genetic algorithm methods. We refer to Satpathy and Shah (2022) and references therein for a more general discussion on this problem as well as an overview of these methods.
2.1.1. Optimization Problem as Sampling Problem
In Satpathy and Shah (2022), Sequential Monte Carlo Methods (SMC) are used to solve the optimization problem 1. There, the key idea is to interpret the optimization problem as a maximization problem over the set of all possible (fixed-size) permutations of stocks composing some index and then using SMC as a global optimization technique. Hereafter, we briefly recall the main idea in Satpathy and Shah (2022), see also Duan (2019).
The index tracking problem with a -norm penalty is a regression problem where the objective function in Equation 1 is minimized. Similarly, one can consider the following maximization problem:
Introducing the -norm penalty translates to finding the optimal permutation of p stocks (a fixed number of regressors) that solves:
where is the submatrix of corresponding to columns in for p regressors and is given via1
Moreover, since for every fixed permutation , and bounded above by 1, if a normalization constant is introduced, we can interpret this as a discrete probability distribution function over the permutation space. The target distribution to be maximised is then expressed as
The optimal composition of p stocks is then the permutation that maximizes this .
2.2. Sequential Monte Carlo Methods
A naive approach to solve problem (6) would comprise of drawing samples from and choosing the optimal that maximises it. However, it is not easy to sample from . For such a case, can be empirically approximated via SMC methods. SMC methods sample particles2 from an initial proposal distribution after which a sequence of (sequential) importance sampling, resampling and support boosting steps are employed. A collection of weighted particles is then obtained which then represents the approximation of the target distribution. In what follows we describe in more detail the steps within the SMC algorithm as employed in Satpathy and Shah (2022). See also Del Moral et al. (2006) for a more general discussion of the SMC method.
2.2.1. Sequential Importance Sampling
The first step in a SMC algorithm is importance sampling. It can be described as follows: N particles, denoted by , are sampled from an easy-to-sample distribution , also called proposal distribution. Then, for each , normalized importance weights are computed:
The pair completely characterizes the target distribution approximation and all quantities of interest from the distribution can be computed.
The quality of the sample drawn depends on the choice of , in particular on its closeness to the target distribution. Moreover, a necessary condition for to be a good initial choice is that its support includes the support of .
A tool to gauge the quality of the sample (and thus of the proposal distribution) is given by the computation of its Effective Sample Size defined by:
Since the weights are normalized, the ESS value will range from 1 to N, where we remember that N is the number of samples drawn from the proposal distribution. An ESS value of 1 indicates a poor choice for , contrary to a value equal to N which stands for a good choice of . Indeed, this happens if for instance each importance weight is equal to .
However, when approximating a target distribution that is high-dimensional and complex, the simple importance sampling method tends to yield poor approximations (Satpathy and Shah (2022)). To account for this, Sequential Importance Sampling (SIS) methods are used. They aim to gradually approximate the target distribution with a sequence of approximating distributions.
SIS methods are commonly employed in filtering problems, where a sequence of new information arrives sequentially. However, in the context of this report, a sequence of new information used to approximate does not occur in the same manner. To account for this, density tempering is introduced.
Density tempering is a process proposed by Del Moral et al. (2006) which allows for sampling from target distributions with higher dimensions.
Its main ideas can be summarized as follows: a collection of synthetic, intermediate target distributions are introduced, where for all , with .The sequence of -modulated distribution is computed as follows:
Notice that and , corresponding to the proposal and (true) target distribution. Similarly, the importance weights between each intermediate step are calculated according to the following formula:
The initial proposal distribution suggested by Satpathy and Shah (2022) is described as follows. Consider the regression coefficient of determination for the jth stock returns (vis-à-vis the index to be replicated). A high would imply that stock j is more likely to appear in the final that maximises . A sampling strategy without replacement is considered and the probability of the first jth stock to be chosen is described as:
Similarly, the probability for choosing the next mth stock in a set of stocks is . Following this logic, for a given permutation of p stocks is computed as follows:
Notice that described above is sequence dependent. The order in which stocks are chosen to compute matters. However, this is not the case for the regression solution that we consider. Indeed, the value of is the same for each combination of p stocks despite the order in which they appear within the permutation. We are only concerned with the choice of stocks used to track the index and their proportion of the current portfolio wealth (their respective weights).
2.2.2. Resampling
As evolves and with each re-weighting process more variability is introduced and fewer samples retain significant weights. This causes weight degeneracy and consequently a low ESS value. To overcome this phenomenon, one gets rid of samples with low-importance weights and repeatedly samples those with high-importance weights. This is in practice done by applying some resampling methods (see e.g. Chen (2003); Speekenbrink (2016); Gellert and Schlögl (2021)) whenever the ESS value falls below a certain threshold (commonly set to N/2). In Satpathy and Shah (2022) a multinomial resampling technique is implemented. Here, we instead consider the systematic resampling technique, which can be described as follows. Fix the number of particles to be resampled to . For , let
Consider the m-th resampling in the algorithm. Replace particle k with particle i according to the following condition:
where denotes the weight corresponding to the particle j on the m-th resampling.
2.2.3. Support Boosting and Metropolis Hastings Algorithm
Since in the resampling step samples with high weights are repeatedly resampled, this method leads to a loss in particle diversity, causing the support of the sequence of distributions represented by the particles and their weights to shrink. To account for this problem, an additional step is added with the intention of boosting the support. To this end, several moves of the Metropolis-Hastings (MH) algorithm are performed in Satpathy and Shah (2022). Here, we consider the same method which can be briefly described as follows: after each resampling step, MH algorithm is used for sampling from the current intermediate target distribution , by using a new distribution for proposing a new sample and then accepting or rejecting the new sample with some probability.
The MH probability of acceptance, that is the probability of replacing the current particle with the new sample , is computed as follows:
where denotes the proposal density. Notice that if the ratio is high there is a greater chance of moving from to .
The acceptance or rejection step in the MH algorithm is applied until the accumulative acceptance rate reaches 500% to ensure the support of the distribution is sufficiently boosted.
The choice of the proposal distribution3 h is done as follows. Initially, a count-based probability is considered, meaning that the probability of choosing a stock to be sampled in a permutation is proportional to the number of times the stock appears in the current sample of permutations. Notice that this choice reflects the relative importance of particles after the SMC algorithm has reached the stage indicated by the current . Then, the proposal distribution h is defined as a weighted sum of , the initial proposal distribution described in Section 2.2.1, and :
where . Moreover, the distribution employed in Satpathy and Shah (2022) h is defined in such a way that only a given subset A of the permutation is replaced. More precisely, to describe the computation of and as it is done in Satpathy and Shah (2022), consider a subset A of the permutation that we wish to replace in order to transform to . Since only a subset of is replaced, for every it holds that . Thus, we sample A from the set of stocks that exclude stocks in . In particular, if the set of all stocks is , we sample A from . We then define as the probability of sampling A from given the count-based probability described above. Similarly can be computed based on applied to the set of stocks.
Finally, Satpathy and Shah (2022) set the number of stocks for constructing an index tracking portfolio as a constant, p representing 20% of the total number of stocks in the index. We instead use Principal Component Analysis (PCA) to set the number of stocks chosen for the index tracking portfolio. The variance explained by the principal components is set to 95%. The variable p is then assigned a value equal to the number of principal components computed under this constraint.
Summary of SMC Algorithm
- Fix the number of stocks used to replicate the index to p (using PCA).
- Draw n permutations of size p from , for computed as in Equation 9. Set the importance weights for each permutation to .
- Choose and increment such that .
- At , compute the importance weights for each permutation using recursive formulas in Section 2.2.1.
- Compute ESS
-
While
- (a)
- if ESS proceed to Step 3.
- (b)
- if ESS . Resample and initialise MH with an accumulative acceptance rate of 500%.
- (c)
- Set the weights of new samples computed in MH to and proceed to Step 3.
- At , samples from are obtained, represented as pairs of permutations and their respective weights.
- Resample once more to obtain new permutations with equal weights.
- Compute for the new sample of permutations to obtain the optimal that maximises given by Equation (8).
3. Transaction Costs
As briefly mentioned in Section 1, in Satpathy and Shah (2022) transaction costs have not been considered when rebalancing the index tracking portfolio. This can potentially cause stocks to enter and exit the tracking portfolio with minimal benefit but at an increased cost. In order to consider this aspect, in this section we reformulate the index-tracking problem by adding an additional term to the objective function, which results in a more gradual rebalancing of the index-tracking portfolio.
3.1. Dynamics of the Wealth Process Given Proportional Transaction Costs
We start by describing the evolution of the value of the index-tracking portfolio over rebalancing times. Consider the rebalancing time point t. Let’s also denote the money invested in the j-th stock at time t as . If transaction costs are not considered, the value of the index tracking (self-financing) portfolio X, for an index comprised of n stocks, is given by:
where stands for the moment just before the rebalancing.
If instead transaction costs are allowed, we model the evolution of as follows:
where is the proportion of our wealth spent on the transaction costs at t. Since the portfolio wealth is less due to transaction costs, we take into account that there is now less money to invest in each stock. Here, the portfolio is constructed in such a way that after paying the transaction costs the portfolio weights are strictly equal to the target portfolio weights: . Thus, the following equation represents the value of the portfolio after rebalancing:
Recall that only p of all ’s are not zero. Now recall that we pay a transaction cost for each unit of money we buy or sell. Let be the percentage we pay per unit of money we buy or sell i.e. the rate of transaction costs. We assume here that the transaction costs for buying and selling are the same. We will incur a transaction cost of enforced on the difference in the amount of money invested in each stock before and after the rebalancing. In some sense it means that instead of buying a stock for $1 we buy it for $(1 + ).
It was demonstrated in Ruf and Xie (2019) that knowing the target portfolio weights, , and amount of money invested in each stock prior to rebalancing, , is sufficient to compute C. Refer to Ruf and Xie (2019) for a detailed approach on the computation of C. Here, we introduce notations and ideas from Ruf and Xie (2019) necessary to present the exact formula for C.
Recall that the portfolio is self-financing, that is, the amount of currency used to buy extra stocks should be exactly the amount of currency obtained from selling redundant stocks, hence the following should be satisfied:
where dividends are not taken into account. We introduce and as follows:
If we now divide both parts of (12) by we will obtain the following equation:
where the LHS of (15) is a continuous function of C and strictly increasing from 0 to 1, as C changes from to ∞. Conversely the RHS of (15) is a continuous function of C strictly decreasing from ∞ to , as C changes from to , and equals to as C changes from to ∞. Therefore, both sides of equation (15), treated as functions of C, must intersect at a unique point, indicating the existence of a unique solution for equation (15).
Given the above, an expression for C now follows:
Here , where with defined as follows:
Using this formulas we will be able to update the wealth process after each rebalancing step. The formula was given in (11).
3.2. Index Tracking Problem with Proportional Transaction Costs
Our goal is to minimize the transaction costs incurred at each rebalancing step, i.e. to minimize the money lost due to transaction costs, . In order to do that we will introduce the updated version of the regression problem from Satpathy and Shah (2022). The objective function is the following:
where is a flexible parameter needed to model the sensitivity of the algorithm to transaction costs. The intuition behind this formula is that we don’t want to change the weights too abruptly and quickly as it implies higher transaction costs.
Given all these considerations, we introduce the (simplified) index tracking problem (allowing for transaction costs) as follows:
Similarly to the approach in Satpathy and Shah (2022), we introduce distribution on the space of permutations as a means to solve this problem
Then, applying a similar reasoning as in the case of the optimization problem without transaction costs, in order to find the optimal permutation at time t, is approximated via SMC methods using density tempering.
4. Methodology and Data
The index-tracking algorithm utilized in this study builds upon the framework introduced in Section 2, with further details provided in Section 3. Here, we delve into the methodological framework used for implementing index tracking strategies, emphasizing their reliance solely on historical data. To clarify, at each rebalancing point (t), the composition of the tracking portfolio is determined based solely on market data available up to time t, within a predefined lookback period of 30 trading days. This approach ensures that no future data beyond time t influences our backtesting methodology. Furthermore, we’ve defined the temporal scope to encompass 20 portfolio rebalancing instances for each strategy under investigation. The rebalancing frequency is set to every 60 observations, corresponding to a span of 60 trading days.
4.1. Model cases
The model cases examined in this analysis primarily differ in their hyperparameter settings. To provide a concise overview of the diverse models formulated, Table 1 summarizes the hyperparameters employed for each case.
In order to assess the performance of the updated model that incorporates transaction costs compared to the initial model, we maintain the hyperparameters of both models at the values specified in Table 1. When , this corresponds to the initial model, without accounting for transaction costs.
Following an initial examination of the efficacy of the proposal distribution in identifying accurate stock selections, it became evident that its capacity to accurately pinpoint assets relevant to the experimental framework was inadequate. Consequently, an alternative proposal distribution rooted in multiple linear regression was employed. Specifically, this approach entails evaluating all assets within the designated universe at a given time point and computing the coefficients of multiple linear regression for these stock prices relative to index prices. Subsequently, the absolute values of these regression coefficients are obtained, normalized to ensure their cumulative sum equals one, thereby constituting the basis of our prior/proposal distribution. An exploratory analysis unveiled the superiority of this proposal distribution over the variant originally posited by Satpathy and Shah (2022).
The enhanced efficacy of the revised proposal distribution, coupled with considerations regarding numerical efficiency, culminated in the decision to forgo the Metropolis/Hastings support boosting step. The proposal distribution gives a good sampling of the state space and is close enough to the posterior distribution to make additional steps such as support boosting redundant or even counterproductive. Due to this, we have chosen to not use the support boosting step in our version of the particle filter algorithm.
4.2. Constraints and Optimization
In our numerical experiments, we implemented the index-tracking algorithm with the inclusion of no-short selling constraints and full-budget constraints. It is worth noting the implications of introducing these constraints. When incorporating short-selling and full-budget constraints, an explicit solution of the parameters cannot be obtained, necessitating the use of numerical optimization techniques. This introduces a critical consideration, as the numerical optimization algorithm needs to be run multiple times during the execution of the index-tracking algorithm, particularly when the Effective Sample Size (ESS) falls below the threshold, requiring Metropolis-Hastings steps. Consequently, this can significantly increase the overall runtime and potentially limit the algorithm’s performance and efficiency.
Fortunately, the problem at hand benefits from the presence of a closed-form expression for the Jacobian, which provides valuable gradient information. The closed-form expression for the Jacobian, obtained by simply differentiating Equation (19), is given by
Numerical optimizers that utilize this gradient information can leverage it to enhance the convergence speed and improve overall efficiency. In our study, we employed the Sequential Least Squares Quadratic Programming (SLSQP) algorithm while incorporating the provided Jacobian. This approach allowed us to reduce the computation time by a substantial factor of approximately 7 (compared to algorithms not using gradient information).
4.3. Data
4.3.1. Simulated Data
In the process of algorithm development, we employed simulated index and stock data where the true parameters were known. To generate the stock price paths for N stocks up to some future time , we employed the Standard Geometric Brownian Motion (GBM) model. Each stock price path follows the process
where and denotes the drift and volatility of the i-th stock, respectively, and denotes a standard Brownian Motion process. The Brownian Motion processes are correlated such that and . This leads to an explicit form to determine the stock price paths for each stock using
with time points and time increments . corresponds to the i-th element in a multivariate normal vector where denotes the correlation matrix. The multivariate normal random vectors can be calculated as where and denotes the Cholesky decomposition of the correlation matrix .
To account for the dynamic nature of index constituents, we established a fixed maximum number of stocks (n) in the asset universe and a maximum number of stocks that could compose the index (). From the asset universe , a random selection of stocks was made to form the index, along with random time points indicating when these stocks entered or exited the index. This gives the set of stocks that the index comprises of at each time point as . This simulation setup mirrors the dynamic nature of real-world indices, where stocks are added or removed based on specific criteria and timing.
In order to construct the simulated index time series, we take the weighted average of stock returns in the index at each time point, i.e.,
where at each time point we have that
The simulated data spanned a predetermined temporal window, with a daily frequency. The parameters for drift, volatility, and initial stock prices for the constituent stocks in the index were uniformly sampled within appropriate ranges. The rationale behind uniformly sampling GBM parameters was primarily to introduce random variation among the simulated stocks. By incorporating this variation, we aimed to capture the inherent diversity and unpredictability observed in real-world stock markets. This approach ensured that the simulated data reflected a realistic scenario, allowing us to evaluate the algorithm’s performance under more representative conditions.
To evaluate the accuracy and effectiveness of the index-tracking algorithm, we calculated index returns as the average of the individual stock returns that constituted it (i.e. ). By aggregating these returns, we obtained the index value, which served as a benchmark for evaluating the algorithm’s ability to accurately select the constituent stocks and their weights in the tracking portfolio.
Throughout the simulation experiments, the index-tracking algorithm consistently demonstrated the capability to effectively identify the stocks forming the index and their constituent weights. This successful performance suggests that the algorithm holds promise in real-world scenarios, where the true underlying stock dynamics are not known. The key test, however, is the algorithm’s performance on such real–world data, which will be considered next.
4.3.2. Empirical Data
Daily data for various indices was obtained from Bloomberg for an empirical study. This resulted in a diverse set of empirical datasets, encompassing the number of constituent stocks and economy sectors. Additionally, data points were excluded from the analysis when the timelines for the indices did not align with those of the individual stocks. The results presented in this paper are based on the indices from Table 2 and the period spanning 2018-10-18 to 2023-07-05. The presented number of stocks in each index is approximate as stocks enter and exit the indices from time to time.
4.4. Metrics
In this section, we outline the metrics of interest. These metrics fall into two categories: “Performance metrics,” which directly impact the decision-making process for selecting investment strategies and parameters, and “Research metrics,” which we explore in order to understand the nature of the algorithms more deeply.
4.4.1. Tracking Error
The primary performance measure we utilize is the tracking error, as defined in Satpathy and Shah (2022). For actual index returns and tracking portfolio returns at times , the tracking error can be calculated as
The tracking error quantifies the level of deviation between the returns of the index tracking portfolio and the target index. It can be calculated as the standard deviation of the return residuals, which are the differences between the returns of the index and the returns of the index tracking portfolio.
4.4.2. Total Transaction Costs
The second performance metric we looked at was the total transaction costs. In the context of transaction cost-conscious investing, monitoring the evolution of the wealth process over time becomes crucial. If transaction costs are defined as in Section 3, then the total transaction costs can be calculated as
Recall that is the moment just before the rebalancing at t. Tracking the total transaction costs allows us to assess the overall cost-effectiveness of the tracking strategy. These costs are calculated at the end of each rebalancing period, representing the expenses incurred during the adjustment of the portfolio’s composition.
The interpretation of the results regarding transaction costs should take into account the specific investment objectives and constraints of the investor. Lower total transaction costs are generally desired, as they indicate a more efficient allocation of resources. However, it is important to balance these cost considerations with the tracking error. Intuitively, there is often a trade-off between minimizing tracking error and minimizing transaction costs. Achieving a lower tracking error may require more frequent portfolio rebalancing, leading to higher transaction costs. Conversely, reducing transaction costs may involve a less frequent rebalancing strategy, potentially resulting in a higher tracking error.
4.4.3. Wealth Error
The assessment of tracking error conventionally involves the examination of the standard deviation of error terms derived from the difference between the simple returns of an index and those of a tracking portfolio. While this method provides valuable insights into tracking performance, we sought to devise a composite metric that not only evaluates tracking accuracy, but also integrates considerations of cost efficiency inherent to a tracking strategy. To this end, we have opted to employ a metric that combines both aspects by computing the average absolute differences between the cumulative returns of the portfolio wealth and the benchmark returns. Formally, our proposed metric, denoted as the Wealth Error (WE), is defined as:
where T represents the total number of observations, denotes the return of the index at time u, and represents the portfolio wealth at time t. Furthermore, represents the cumulative return of the index, whereas represents the cumulative return of the portfolio. This formulation encapsulates both the magnitude and direction of disparities between the portfolio’s cumulative returns and those of the benchmark index, thereby providing a comprehensive measure of tracking performance while considering the cost efficiency of the tracking strategy.
By evaluating both the tracking error and total transaction costs, we can comprehensively assess the performance of the index tracking strategy. It allows us to understand the trade-offs between achieving accurate index replication and managing transaction costs, enabling investors to make informed decisions based on their specific investment goals and preferences.
The following metrics relates to the “Research metrics” category.
4.4.4. Other Cost Metrics
To better understand the interplay and distribution of costs in a tracking strategy, we additionally investigate the minimum, mean and maximum transaction costs associated with a rebalancing over the investment horizon.
4.4.5. Retention
This metric indicates the proportion of stocks retained in the tracking portfolio after each rebalancing. For instance, if initially there are 20 stocks in the portfolio and after rebalancing 12 of them are replaced with others from the index, the retention is 40%.
We aggregate the values of Min, Mean, and Max Retention over all the rebalancing time points in the experiment.
4.4.6. Maximum Weight
Lastly, in order to assess the effect that our objective function has on portfolio concentration, we will look at the maximum weight metric, which is defined as the overall maximum weight achieved by a single asset in the tracking portfolio, over the entire investment horizon.
5. Results and Discussion
In this section, we present an analysis of the experimental results. Our primary objective is to investigate the various patterns exhibited by the metrics concerning changes in the number of particles, denoted as N, and the cost aversion parameter, represented by .
To examine how the metrics respond to changes in the number of particles, we compute the average value of each metric across all values of for each index. Similarly, we assess the impact of varying on the metrics by calculating their average values across different numbers of particles for each index.
5.1. Tracking Error
Consider Table 3. The highest average Tracking Error was associated with 100 particles for 5 out of 8 indices. Conversely, the lowest average Tracking Error occurred with 10 particles. This setting showed consistent performance across 6 out of 8 indices. No discernible trend was observed between the number of particles and average Tracking Error.
Similarly, examining Tracking Error metrics across different cost aversions revealed fluctuations. The highest average Tracking Error was linked to a cost aversion of 10000 which was consistent across 4 out of 8 indices. On the other hand, the lowest average Tracking Error corresponded to a cost aversion of 1000, showing consistent performance across HSI, UKX, and JALSH. The highest overall Tracking Error of 1.086% was associated with the HSI index, 100 particles, and a cost aversion of 10000 (Figure 1). Conversely, the lowest overall Tracking Error of 0.367% was linked to the SPX index, 1000 particles, and a cost aversion of 1000 (Figure 1).
It might seem counterintuitive that a larger transaction cost weighting doesn’t imply larger tracking error. However, because the future return behaviour of real-world data may differ from past behaviour and in particular correlations can change, the optimal tracking portfolio based on past returns is not necessarily optimal going forward. Therefore, as including transaction costs would tend to stabilise the tracking portfolio weights, this may result in better tracking performance, as opposed to ignoring transaction costs and rebalancing fully to reflect any change in return correlations in the lookback estimation window, which may be partly due to random noise.
5.2. Total Cost
The investigation into Total Cost (Figure 2 and Figure 3) reveals intriguing patterns across different particle counts and cost aversions. Surprisingly, the highest average Total Cost is consistently associated with 10 particles across the majority of indices, while the lowest occurs with 1000 particles, a trend observed in 4 out of 8 indices.
Despite the variation in particle count, we found no discernible correlations between the number of particles and total costs, indicating that particle count alone may not significantly impact total expenses.
Upon scrutinizing Total Cost concerning different cost aversions, expected outcomes emerge. The highest average Total Cost aligns with a cost aversion of 0, while the lowest occurs with a cost aversion of 10,000, a consistent trend across all indices.
This observed pattern is in line with expectations, as higher cost aversions are anticipated to mitigate larger transaction costs, underscoring the influence of cost aversion on total expenses.
5.3. Retention
Table 4 offers insights into the behavior of portfolio retention under varying levels of , representing transaction cost sensitivity. When is set to 0, indicating no consideration for transaction costs, there are notable instances where the entire portfolio experiences complete turnover during rebalancing.
However, as increases, reaching values as high as 10,000, the frequency of rebalancing events resulting in no stock replacements becomes more pronounced. This trend suggests a shift towards a conservative approach, where transaction costs heavily influence decision-making processes, leading to fewer adjustments in the portfolio composition.
Further examination of the Mean Retention reveals additional nuances. On average across all indices, approximately 25% of stocks persist in the portfolio post-rebalancing when . This relatively low retention rate underscores the high level of churn as a consequence of ignoring transaction costs.
Overall, the observed patterns suggest that the adjustment of plays a crucial role in determining the level of portfolio turnover, with higher values acting as a deterrent to excessive stock hopping and fostering a more consistent investment strategy.
In contrast, with set at 10,000, the average retention rate increases to around 40%, signifying a more stable portfolio composition. This implies that higher values effectively curb the turnover of stocks, promoting greater stability and potentially reducing transaction costs associated with frequent rebalancing.
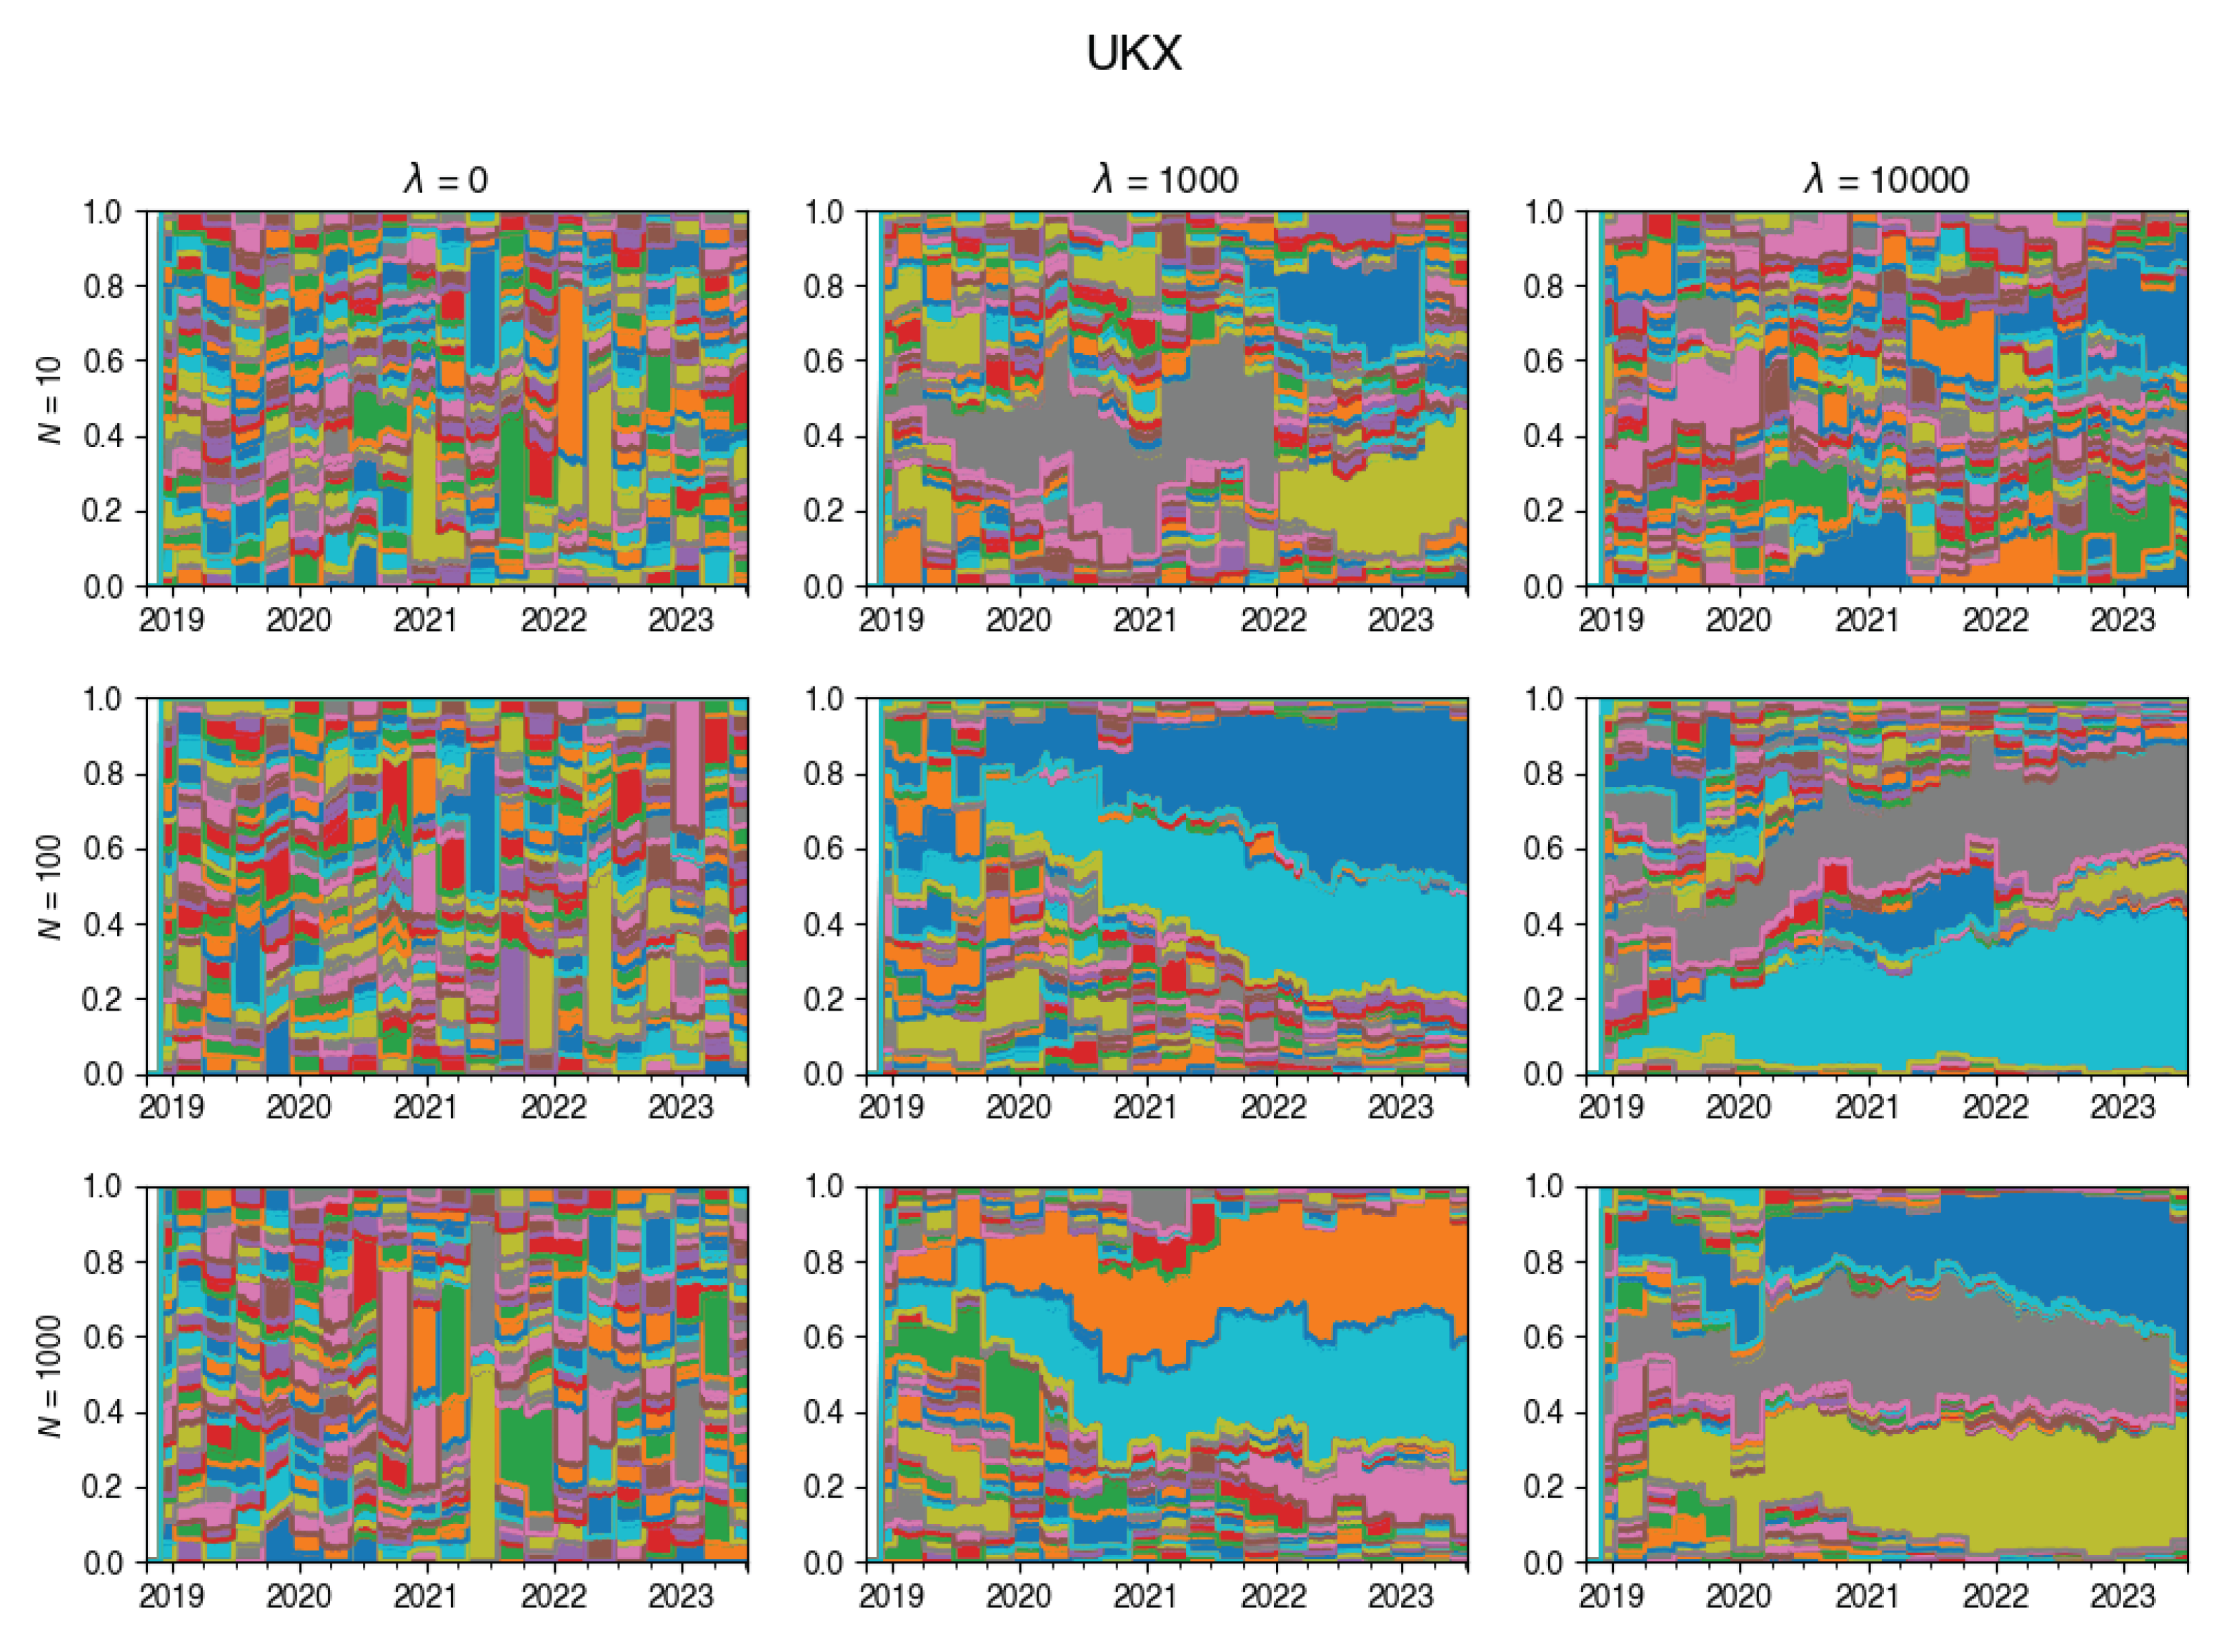
An intriguing insight is depicted through the visualization in Figure 4. This chart vividly showcases the dynamic evolution of the tracking portfolio’s composition. Notably, larger values of lead to a more stable portfolio, whereas smaller values of permit frequent changes in the portfolio composition at each rebalancing step.
5.4. Mutual Correlation
In light of the other metrics we consider, in Figure 5 we present the correlation matrix only considering cost-neutral ( = 0) strategies, followed by the correlation matrix including cost-averse tracking strategies in Figure 6.
Introduction of the parameter strengthens the relationships between the key parameters and elucidates the underlying workings of the added cost-aversion to the objective function on the overall tracking strategy. Most importantly, note how the relationships between the transaction cost metrics and the retention metrics became stronger.
Wealth error is a metric that offers the most comprehensive summary of performance by looking at both tracking performance and cost efficiency. After inspecting the correlation structure of the different factors, we can see that wealth error does not have very strong correlations. The most two notable relationships that exists with wealth error is weak positive relationships with tracking error and maximum cost. These two factors can be identified as the primary contributors to wealth error. This implies that the source of wealth error can come from tracking error and from the magnitude of the transaction costs incurred at a rebalancing.
Investigating the maximum transaction cost as a source of error, we discover that maximum transaction costs exhibit strong relationships. Although there is a weak positive relationship with the size of the index, which is a property in the particle filter algorithm beyond our control, the maximum transaction cost has a weak negative relationship with the cost aversion parameter, an independent parameter, which we can control. This suggests that the cost aversion parameter can be altered to influence the magnitude of transaction costs to some extent. It has obvious positive correlations with the other cost metrics. But perhaps, most importantly, it has a very strong inverse relationship with retention metrics. Since the retention metrics are strongly related to maximum transaction costs, and all of the transaction costs are strongly related to each other, this reveals a possible lever to control transaction costs in the tracking portfolio.
Minimum retention has a weak direct relationship with cost aversion and a weak inverse relationship with both tracking error and wealth error. In contrast, it has very strong inverse relationships with most of the cost metrics and a strong direct relationship with mean and maximum retention.
There exists a weak negative relationship between mean retention and the size of the index, suggesting that index size exerts some influence on asset retention rates. Conversely, there is a weak positive relationship observed with cost aversion. Strong negative relationships are apparent with the cost metrics, while strong positive relationships emerge with other retention metrics. Additionally, a weak positive relationship is identified with the maximum weight.
The maximum retention exhibits a strong inverse relationship with asset count, suggesting that the size of the index significantly impacts the maximum retention rate. Furthermore, it demonstrates strong negative relationships with the cost metrics, while displaying very strong positive relationships with the retention metrics. Additionally, it shows a moderate to strong positive correlation with the maximum weight, indicating that higher retention tends to align with more concentrated portfolios.
Looking at the maximum weight metric, we observe a strong negative relationship with asset count, indicating the larger indices tends to be more diversified. There is a weak to moderate positive relationship with tracking error with some weak to moderate negative relationships with the cost metrics. It has some moderate positive relationships with the mean and maximum retention rate.
After investigating tracking error as a source of wealth error, we see that it has some weak inverse relationships with the minimum cost and the size of the index. This suggests that lower minimum transaction costs tend to coincide with higher tracking error, again revealing a possible trade-off between tracking performance and cost efficiency. Tracking error has a weak positive relationship with the maximum weight metric, which reveals a tendency for concentrated portfolios leading to tracking error.
Given the interconnected nature of these factors, further exploration is warranted. Based on the evidence thus far, we hypothesize that the mechanism by which the cost aversion parameter regulates transaction costs and enhances wealth estimation operates as follows:
The cost aversion parameter has a weak direct relationship with minimum retention. Minimum retention has a strong direct relationship with the other retention metrics. The mean retention metric has a large influence over the minimum and maximum transaction cost metrics, where the maximum retention metric has a strong direct influence on the minimum transaction cost metric. Thus, higher cost aversion coefficients, will lead to portfolios where we retain more of our assets between rebalancings. This in turn will cause the minimum, maximum, mean and total transaction costs to decrease.
The total transaction costs may not directly correlate with wealth error, however, the maximum transaction cost appears to be significantly related. By reducing the maximum transaction costs as previously described, we mitigate wealth error and consequently lower total transaction costs. The total transaction costs do not inherently drive wealth error, rather, it is the maximum cost that plays a key role. This observation is evident in Figure 3, where the top performer in terms of total transaction costs may not necessarily exhibit the best performance in terms of wealth error.
It’s important to consider that the penalty term within our objective function appears to promote more concentrated portfolios and that there exists a direct relationship between portfolio concentration and tracking error, one of the sources of wealth error.
Higher asset retention, our primary lever for controlling transaction costs, may lead to increased portfolio concentration, which could cause higher tracking errors and subsequently result in higher wealth errors. However, it’s worth noting that the strong inverse relationship between index size and portfolio concentration may underlie this phenomenon.
A notable finding is the slight negative correlation between minimum transaction costs and tracking error. However, it’s crucial to understand that just because lower transaction costs are linked with higher tracking error doesn’t necessarily imply causation. Instead, it’s more probable that the primary factor at play is portfolio concentration, which tends to coincide with lower transaction costs. Given the relationships described above, the diagram in Figure 7 provides a summary.
6. Conclusions
The analysis of higher penalty terms on transaction costs yields several noteworthy conclusions. Firstly, it is observed that implementing such penalties successfully reduces the overall transaction costs for most indices, aligning with the expected outcome. This indicates that the imposition of penalties effectively achieves the objective of mitigating expenses. Perhaps somewhat surprisingly, the degree of penalty imposed on transaction costs tends not to increase the tracking error. Taking transaction costs into account can actually stabilise tracking portfolio weights, prevent excessive rebalancing in response to estimation noise and lead to an improvement in index tracking performance.
These conclusions emphasize the complex interplay between tracking error minimization and the incorporation of transaction costs into the objective function. The study reveals that there are additional factors at play beyond the straightforward trade-off between minimizing tracking error and integrating transaction costs. This highlights the need for a deeper understanding of the underlying mechanisms that govern the relationship between these variables.
Opportunities for Further Study
Future research to be explored could include:
- Consider the market impact as it can also lead to the additional losses when working with large volumes. Hence, investor should come up with smart order routing algorithms to optimize trade execution and reduce market impact. These algorithms can help split large orders into smaller ones and execute them in a way that minimizes price impact.
- Consider liquidity screening to avoid investing in assets that may have high transaction costs or are illiquid, as these can significantly impact the performance of your tracking strategy.
- Consider short sales so one can also track "short" indices. As well as considering short position, i.e. negative ’s which will relax the constraints in the proposed method.
- Consider other types of transaction costs: Tiered Commissions, Fixed-Plus-Percentage Commissions, Flat Fee Commissions.
Author Contributions
Conceptualisation, E.S.; Formal analysis, T.O., L.H.R. and D.S.; Investigation, T.O., L.H.R. and D.S.; Methodology, T.O., L.H.R., D.S. and E.S.; Software, T.O., L.H.R. and D.S.; Supervision, E.S.; Visualisation, T.O., L.H.R. and D.S.; Writing—original draft, T.O., L.H.R. and D.S.; Writing—review and editing, T.O., L.H.R., D.S. and E.S. Authors are listed in alphabetical order in the article citation. All authors have read and agreed to the published version of the manuscript.
Funding
This research received no external funding.
Institutional Review Board Statement
Not applicable.
Informed Consent Statement
Not applicable.
Data Availability Statement
Market data (history of closing prices for indices and component stocks) that support the findings of this study are available from Bloomberg. Commercial restrictions apply to the availability of this data, which were used under license for this study.
Acknowledgments
The initial research for this paper was conducted as part of the Financial Mathematics Team Challenge (FMTC) at AIFMRM, University of Cape Town. The authors thank Francesca Primavera for her contributions to this work as Team Leader at the FMTC and for subsequent helpful discussions about the formulation of the index tracking problem under transaction costs in Section 2.
Conflicts of Interest
The authors declare no conflicts of interest.
Appendix A
This part provides additional plots obtained during the experiments.
Appendix A.1. Tracking Performance
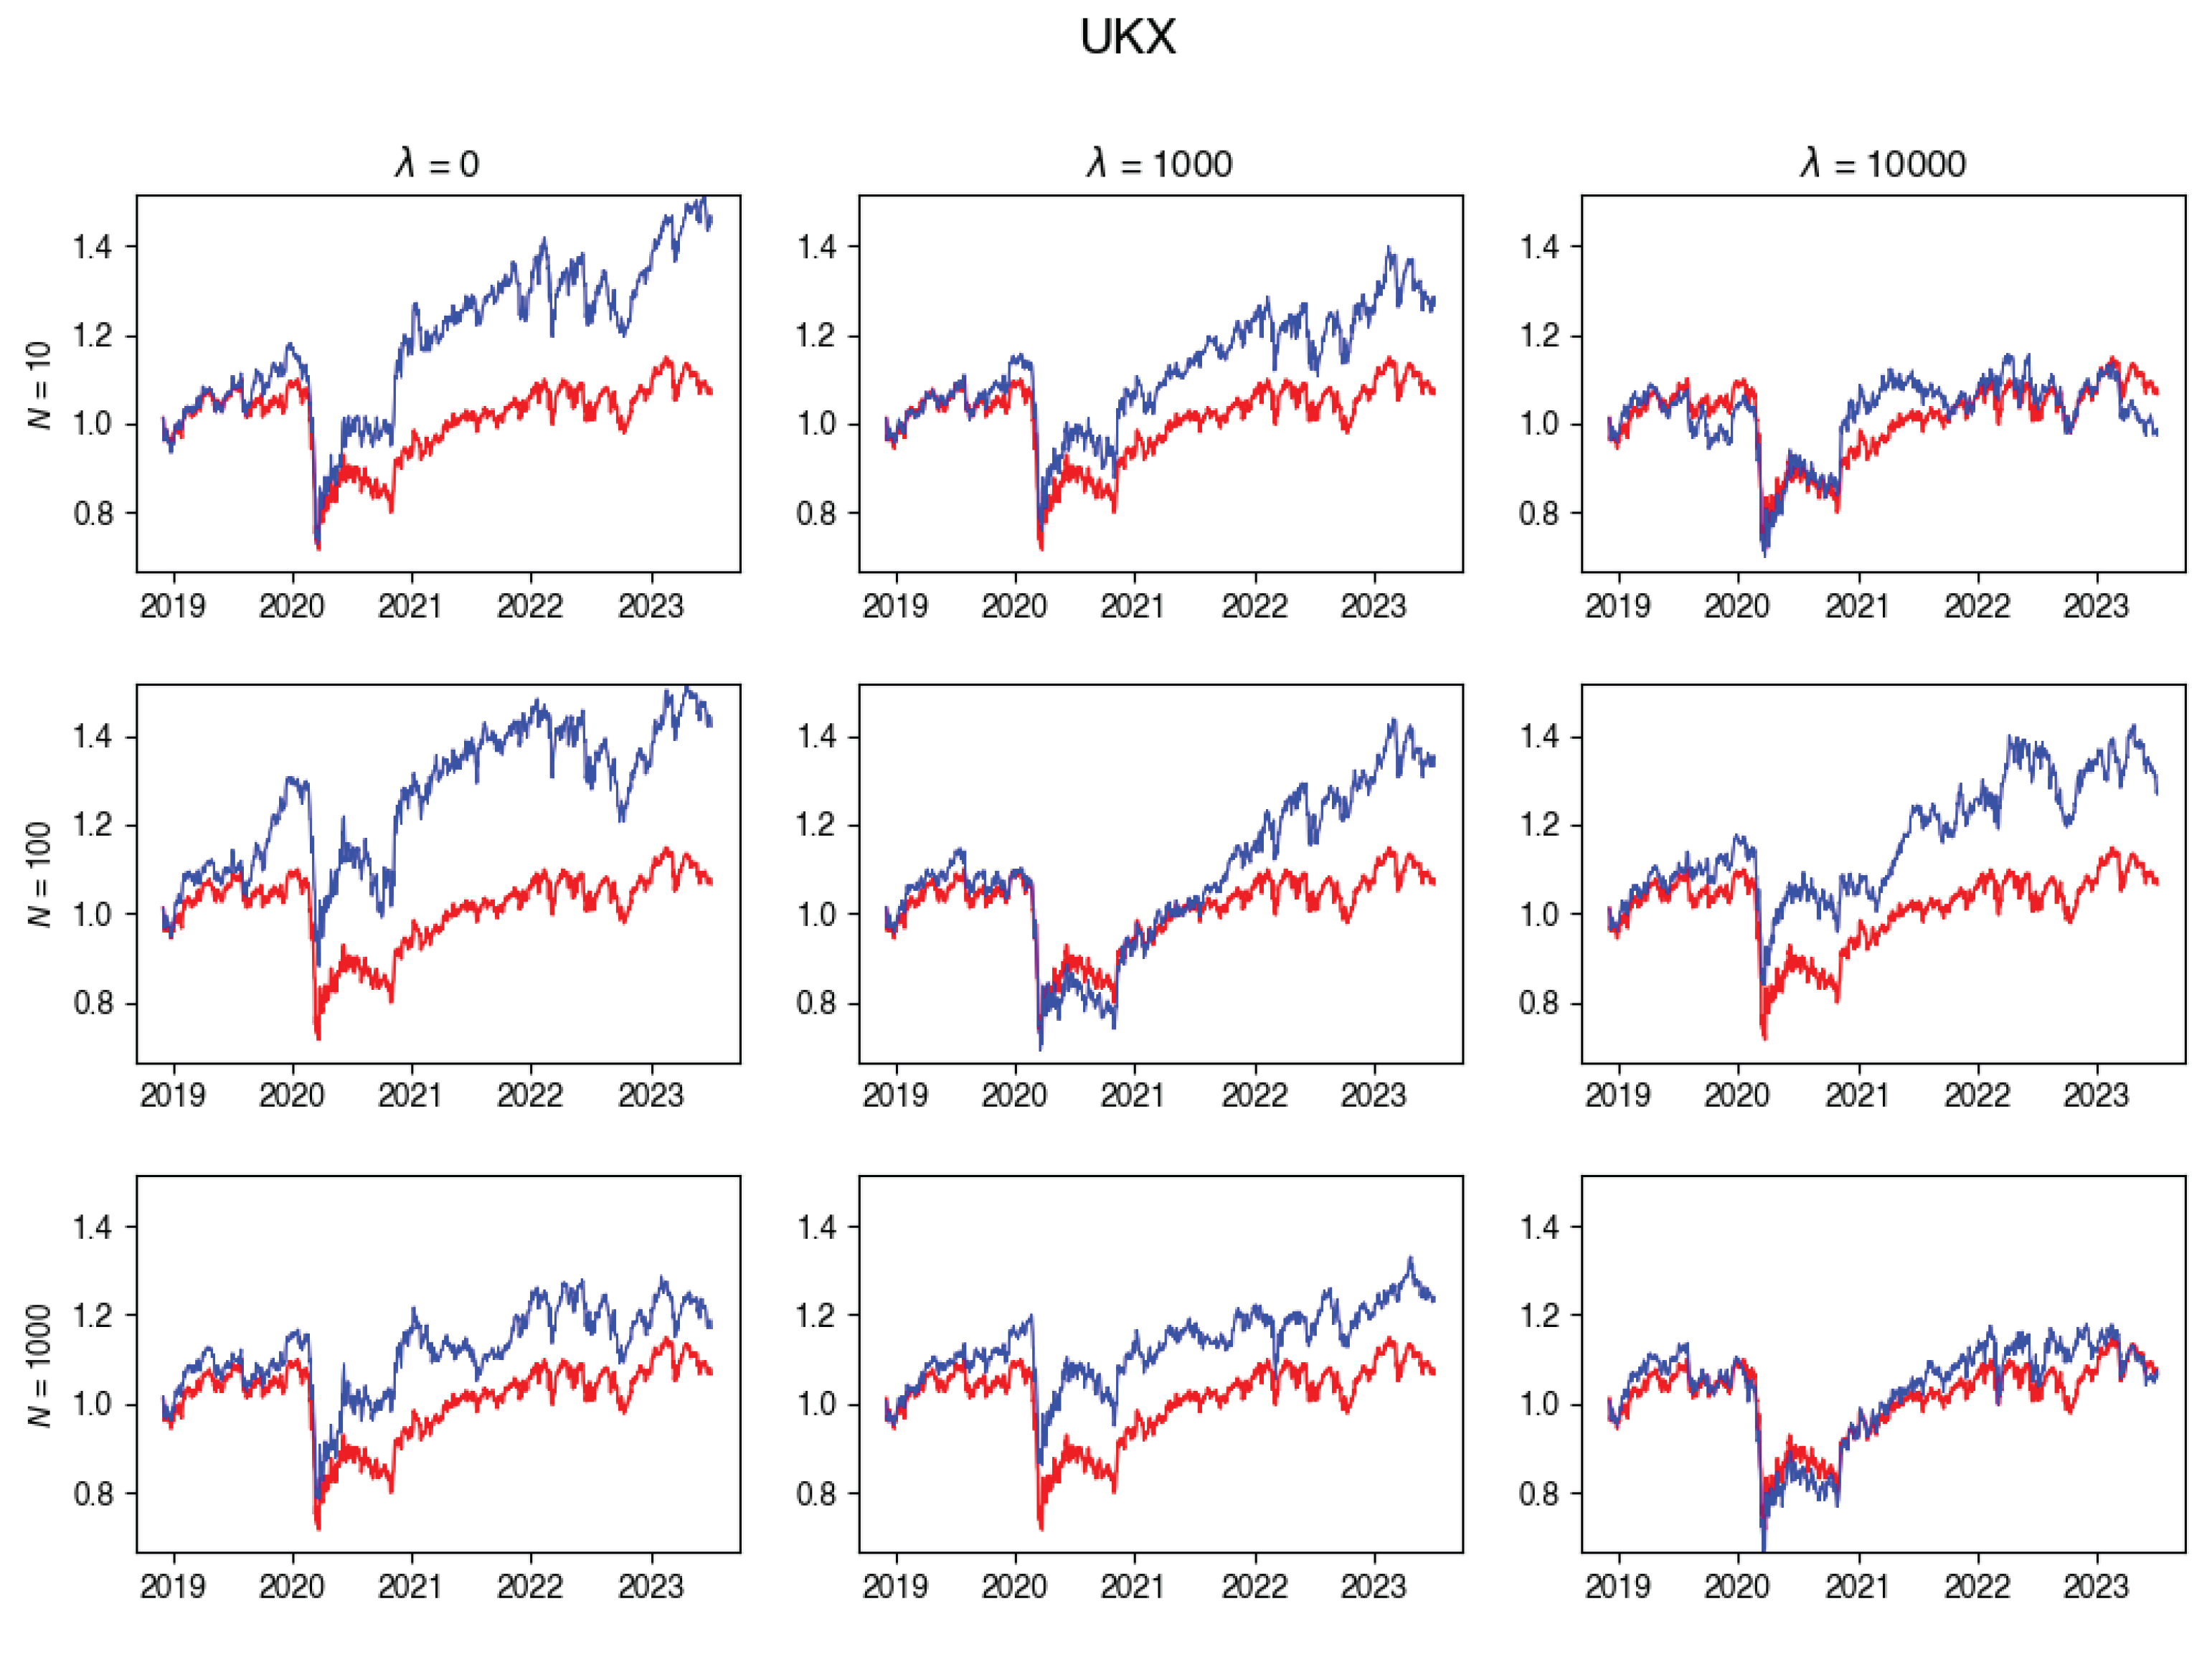
In this subsection, you’ll find plots that illustrate the returns of the constructed portfolio compared to the real index returns across various values of -s and numbers of particles. Red line indicates the index returns and blue indicates the tracking portfolio’s retruns.
Figure A1.
DAX Tracking portfolio return versus actual index returns.
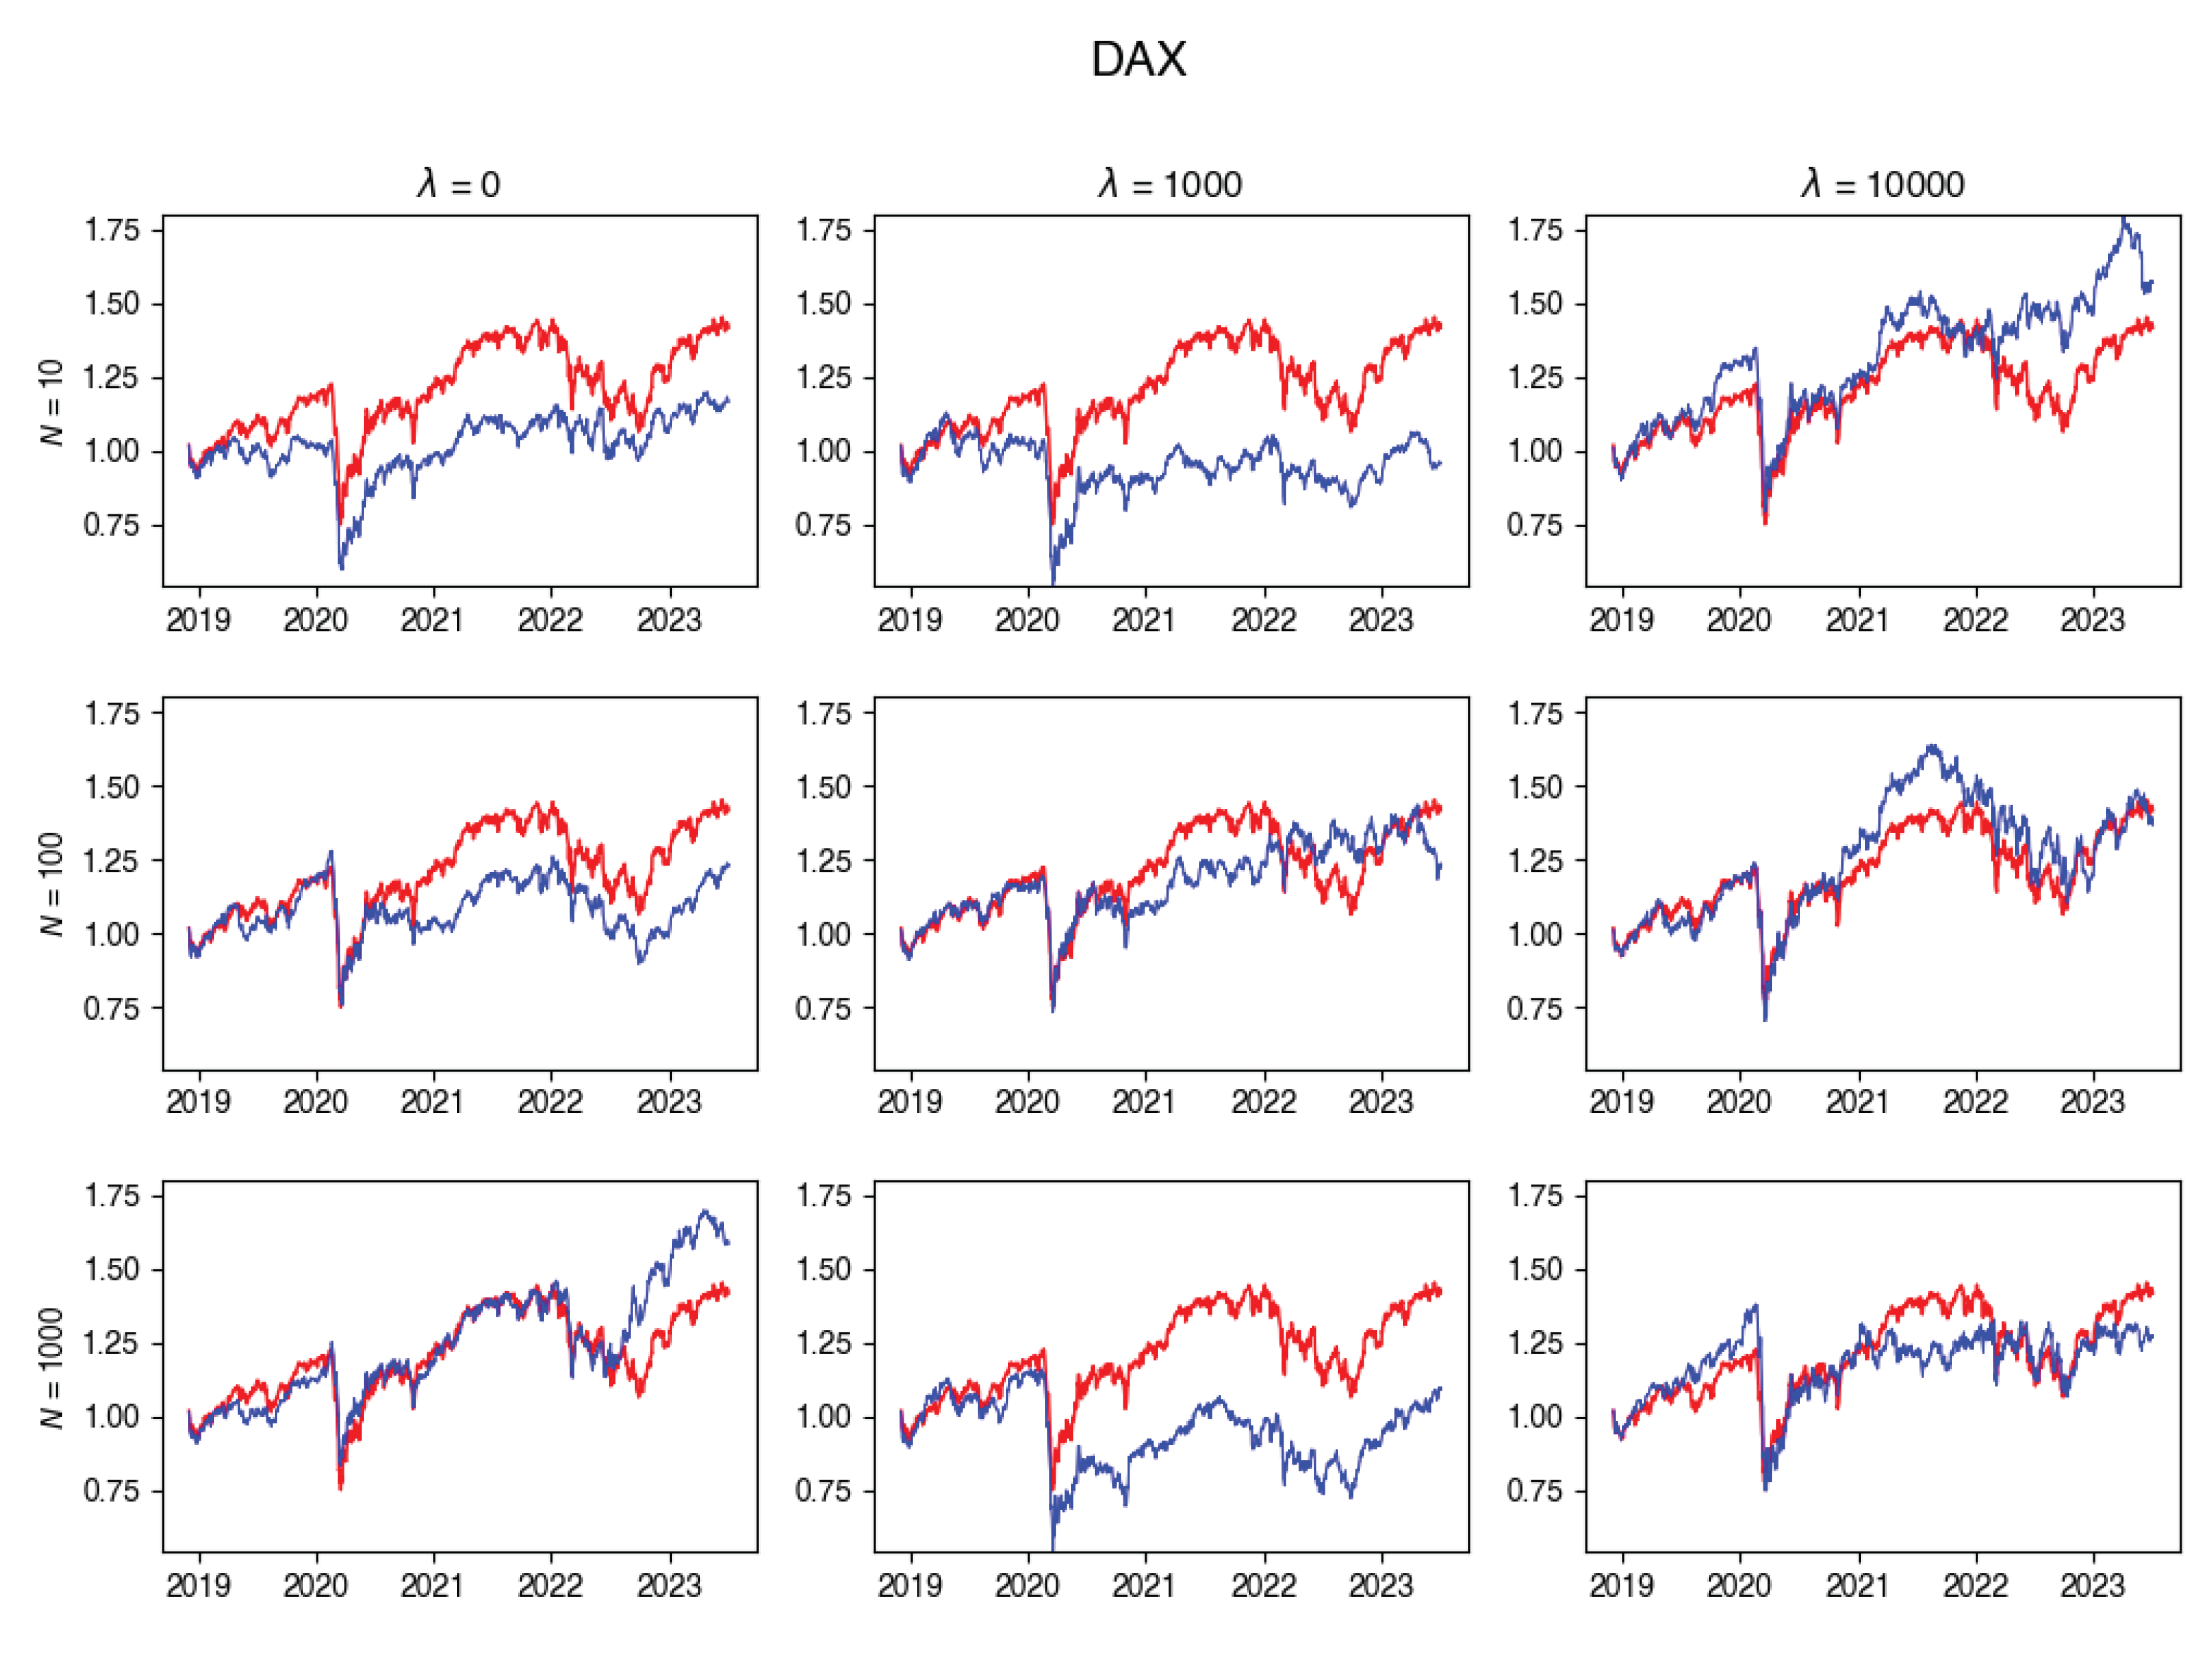
Figure A2.
HSI Tracking portfolio return versus actual index returns.
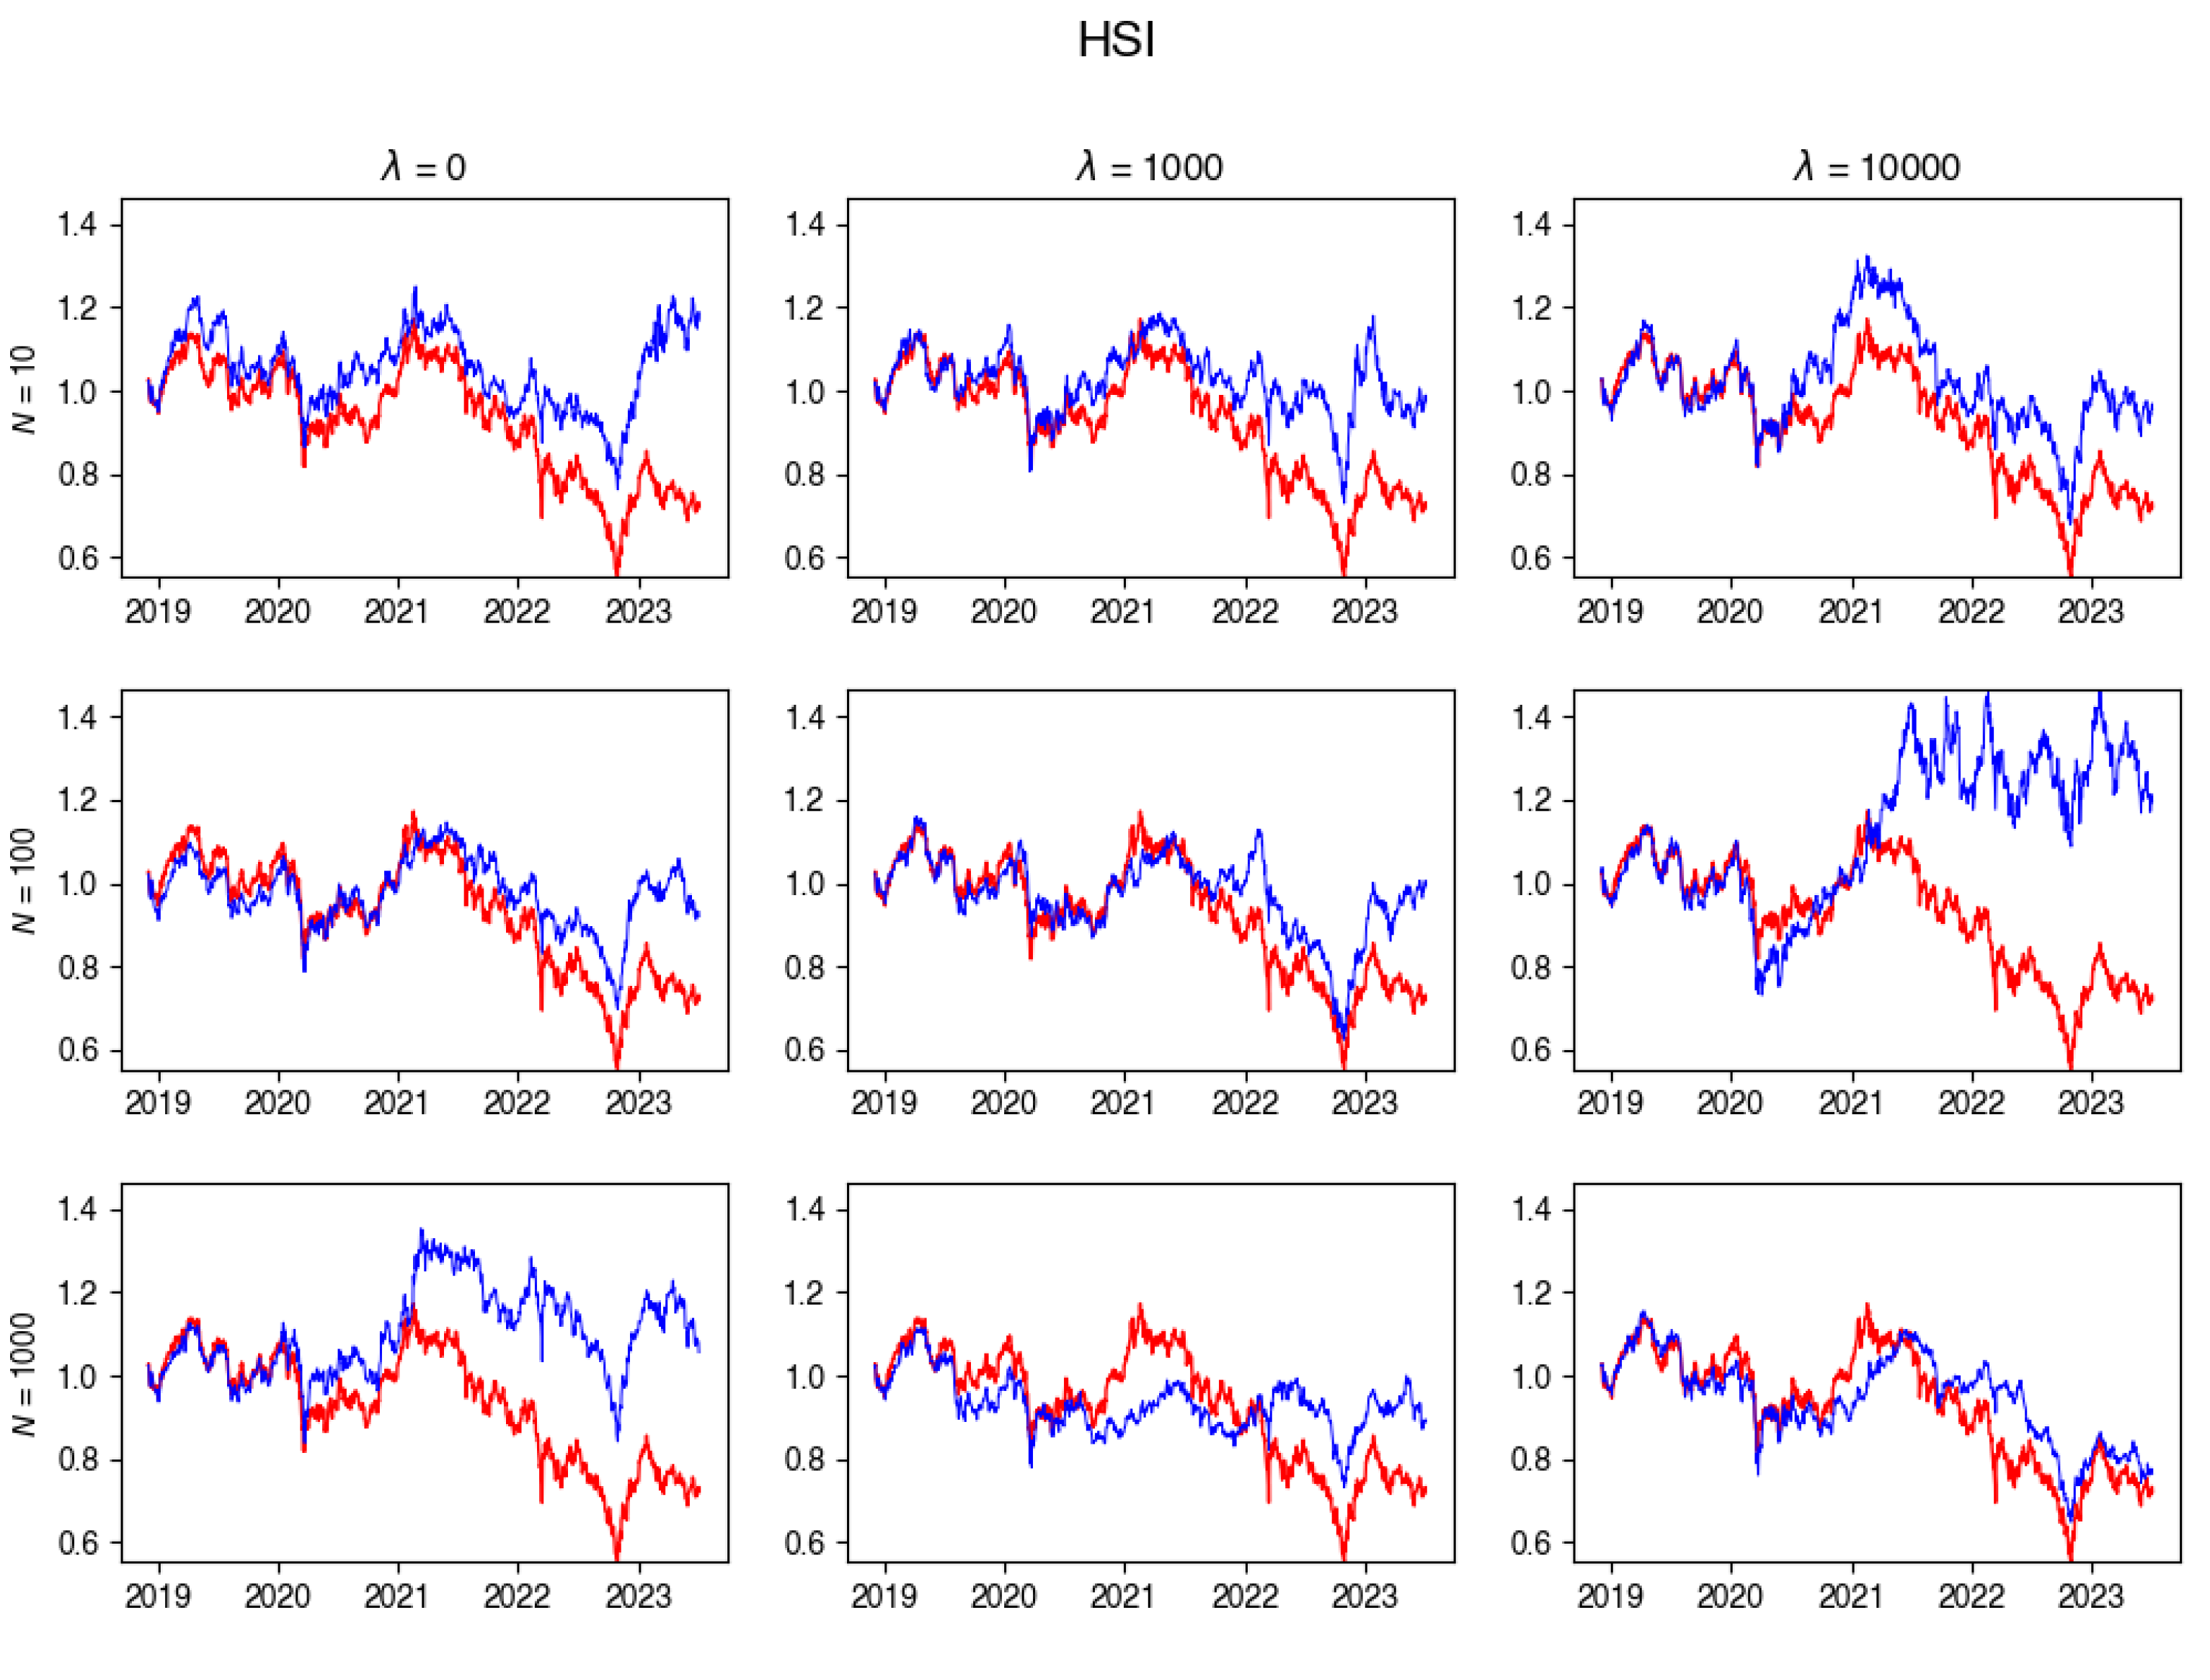
Figure A3.
JALSH Tracking portfolio return versus actual index returns.
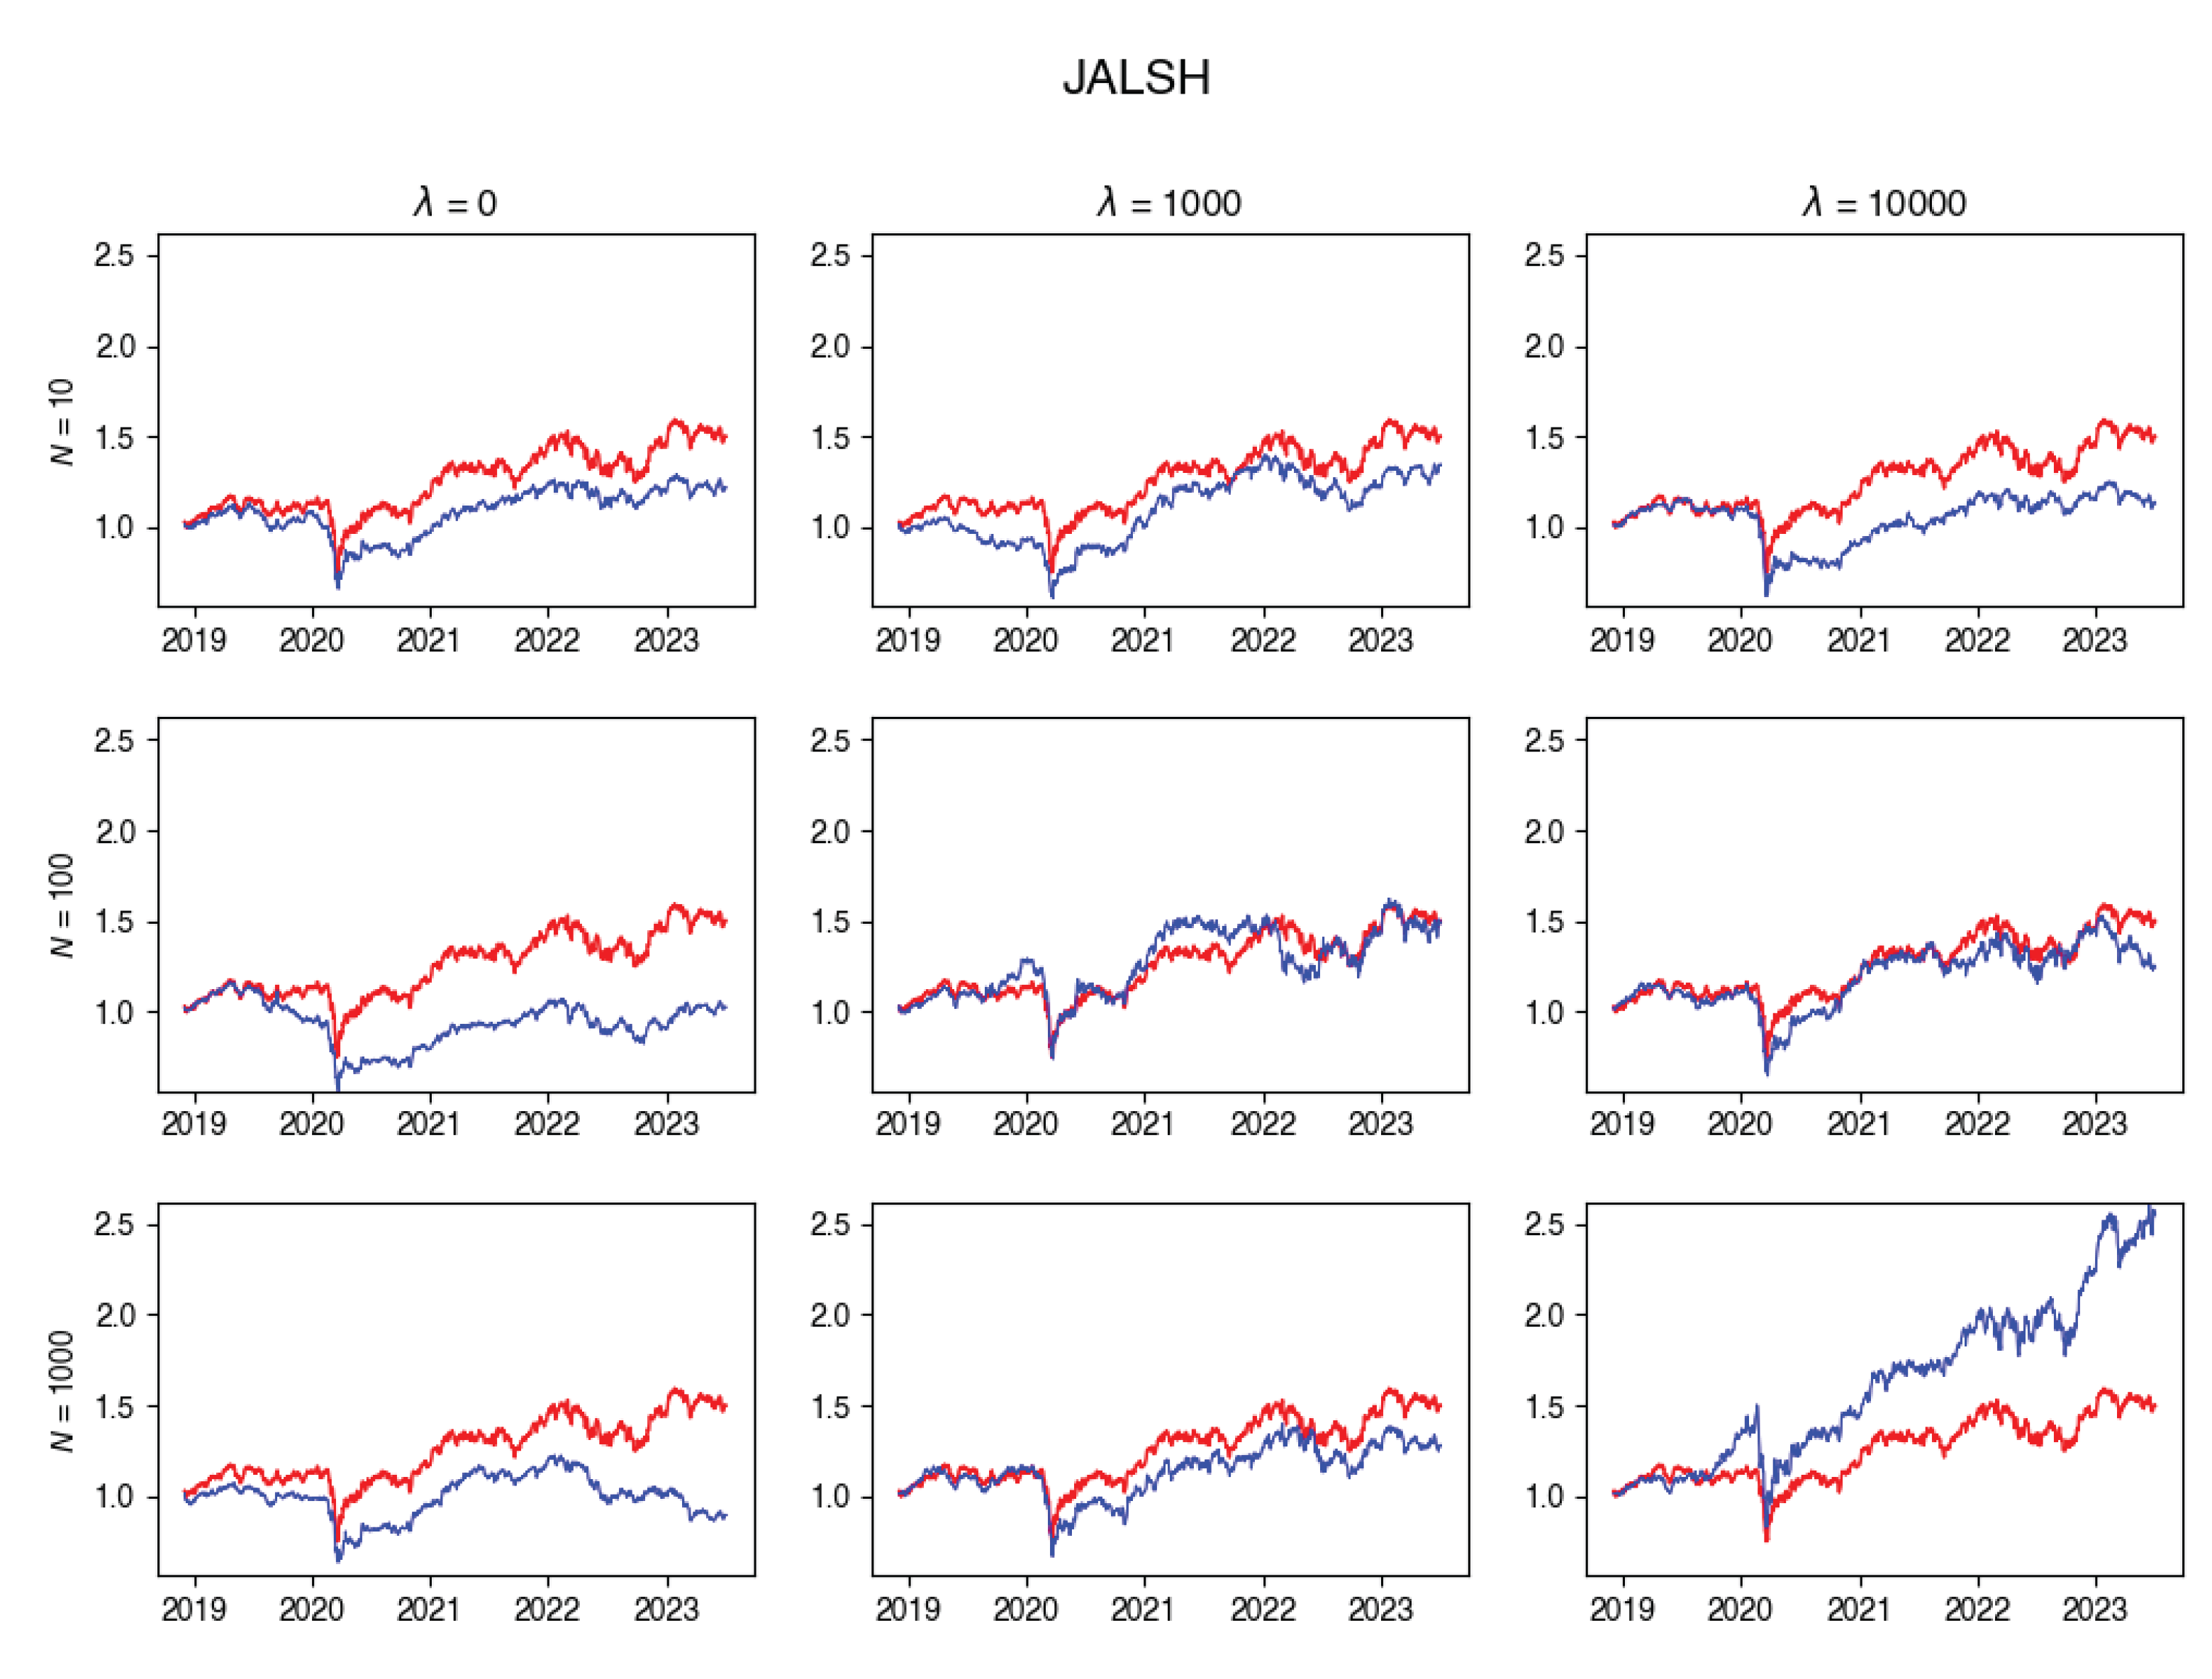
Figure A4.
SENSEX Tracking portfolio return versus actual index returns.
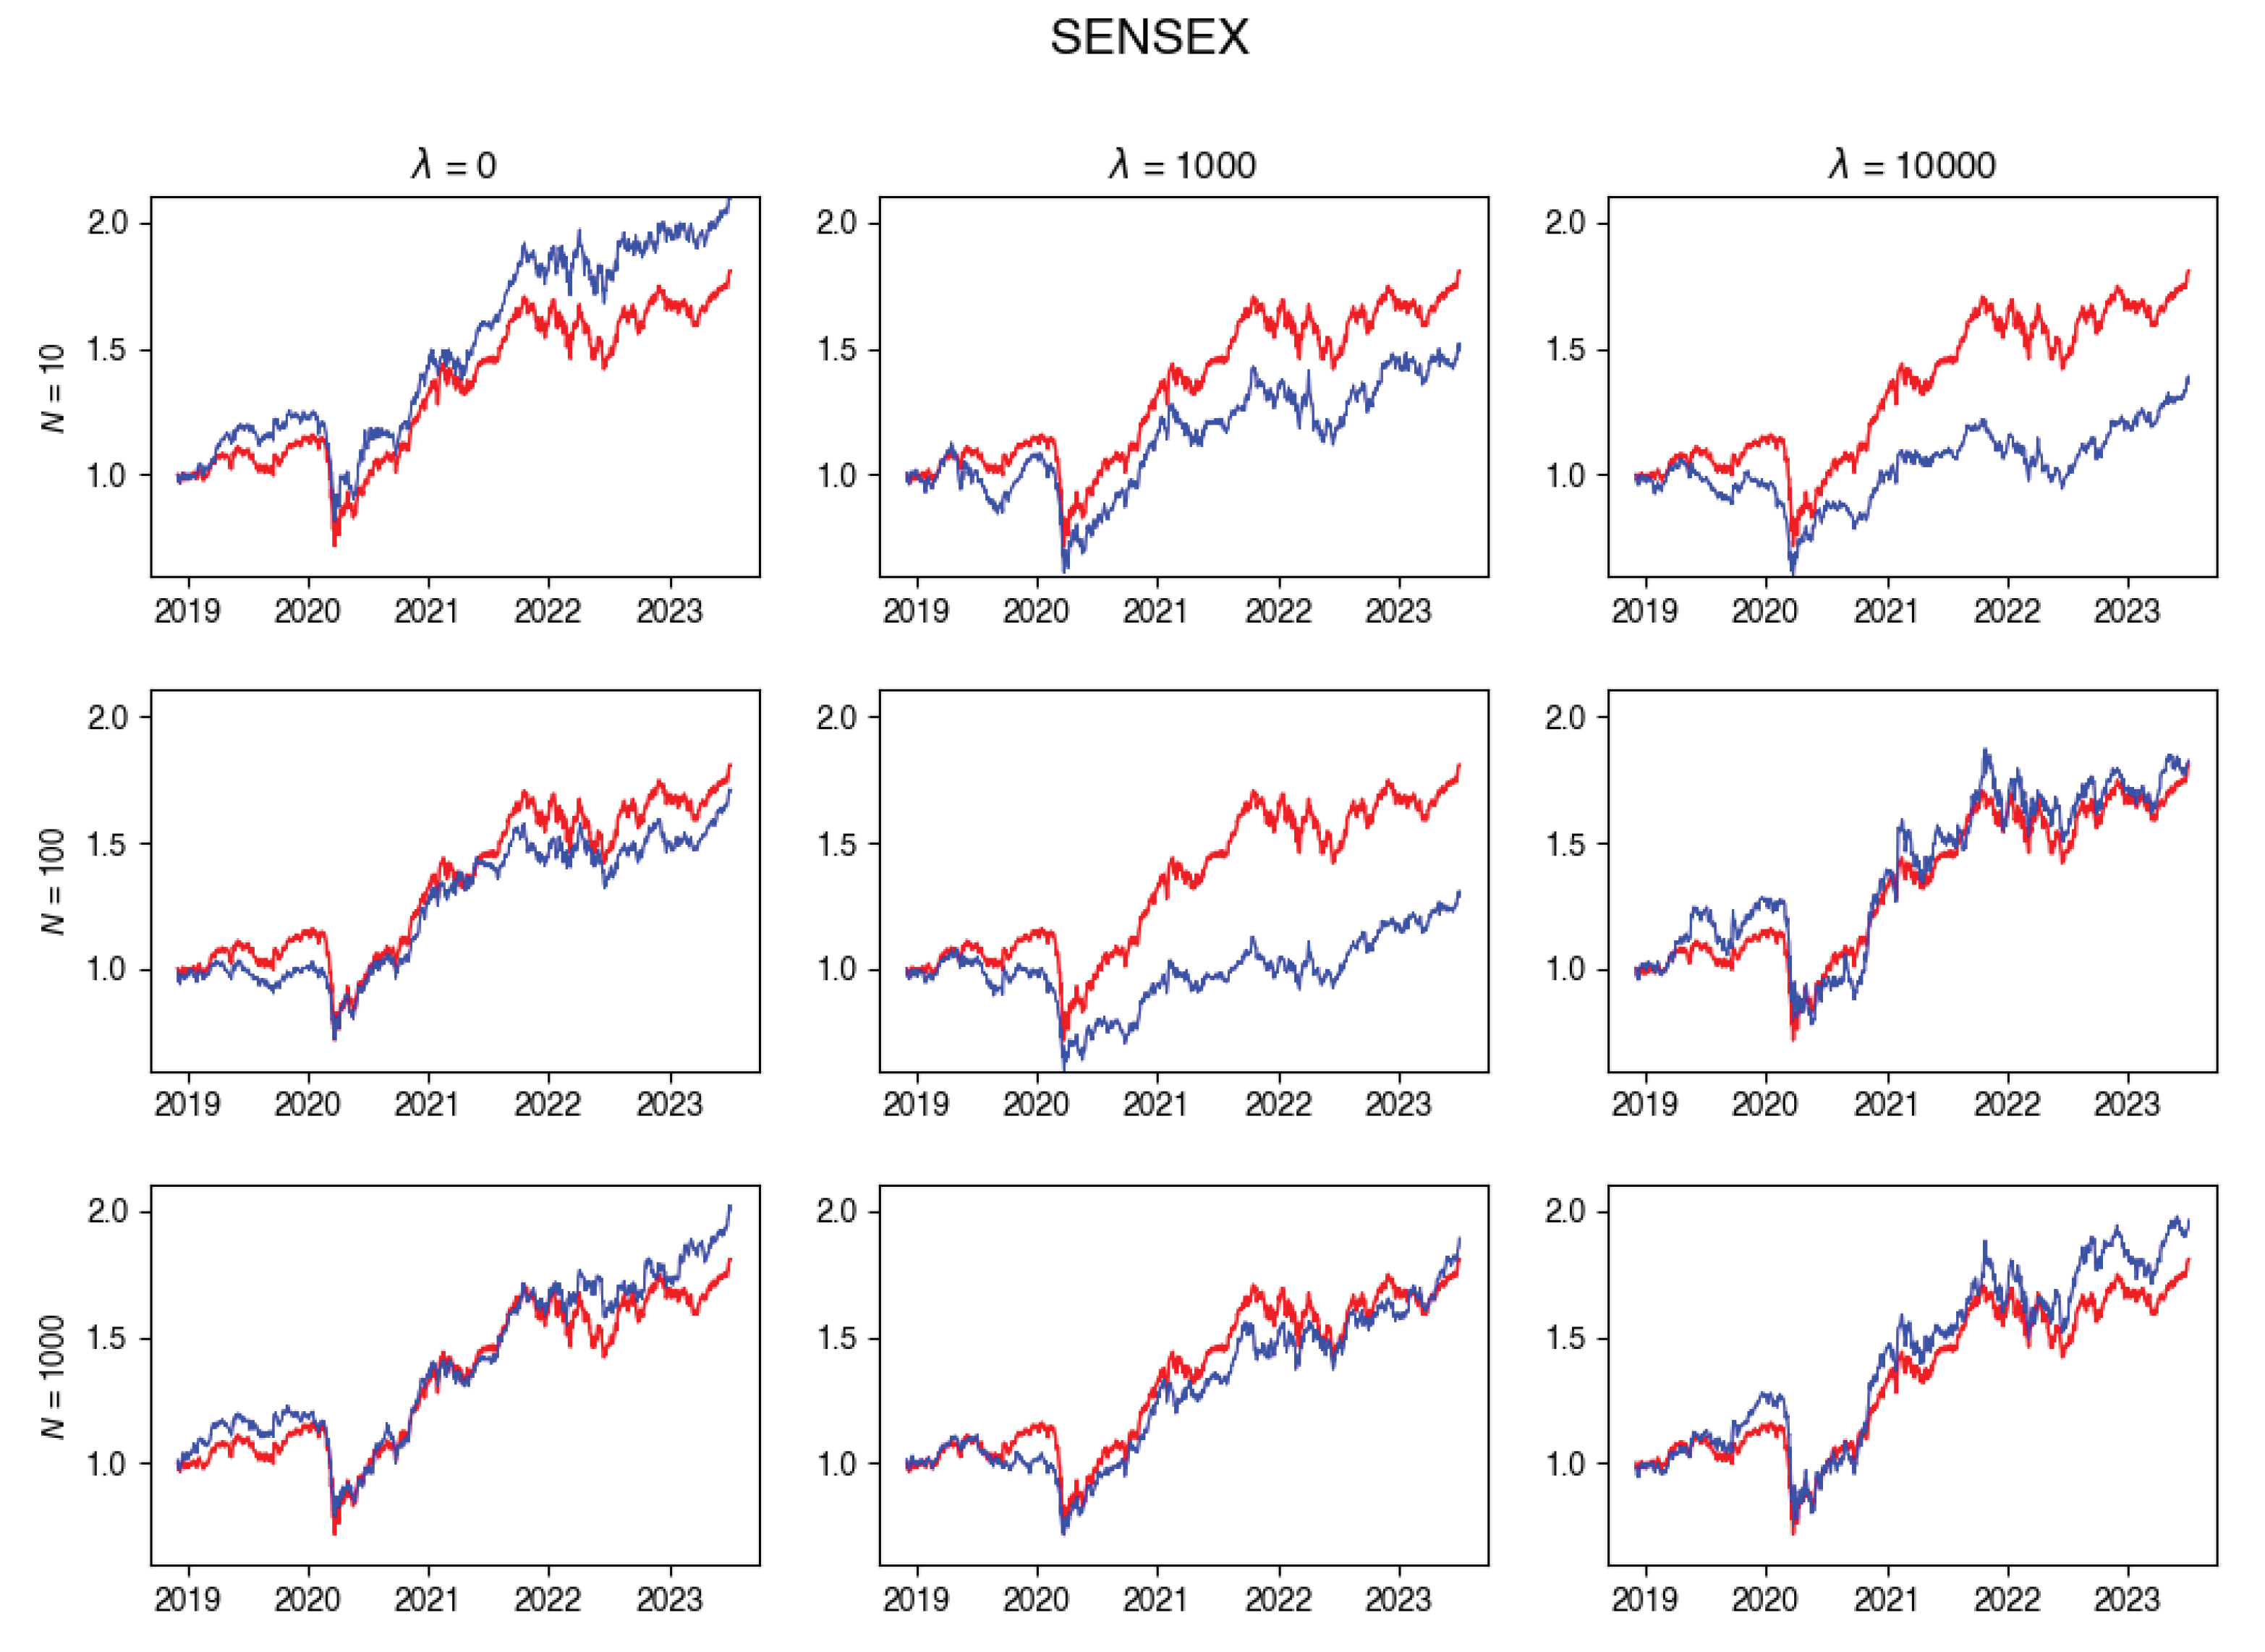
Figure A5.
SMI Tracking portfolio return versus actual index returns.
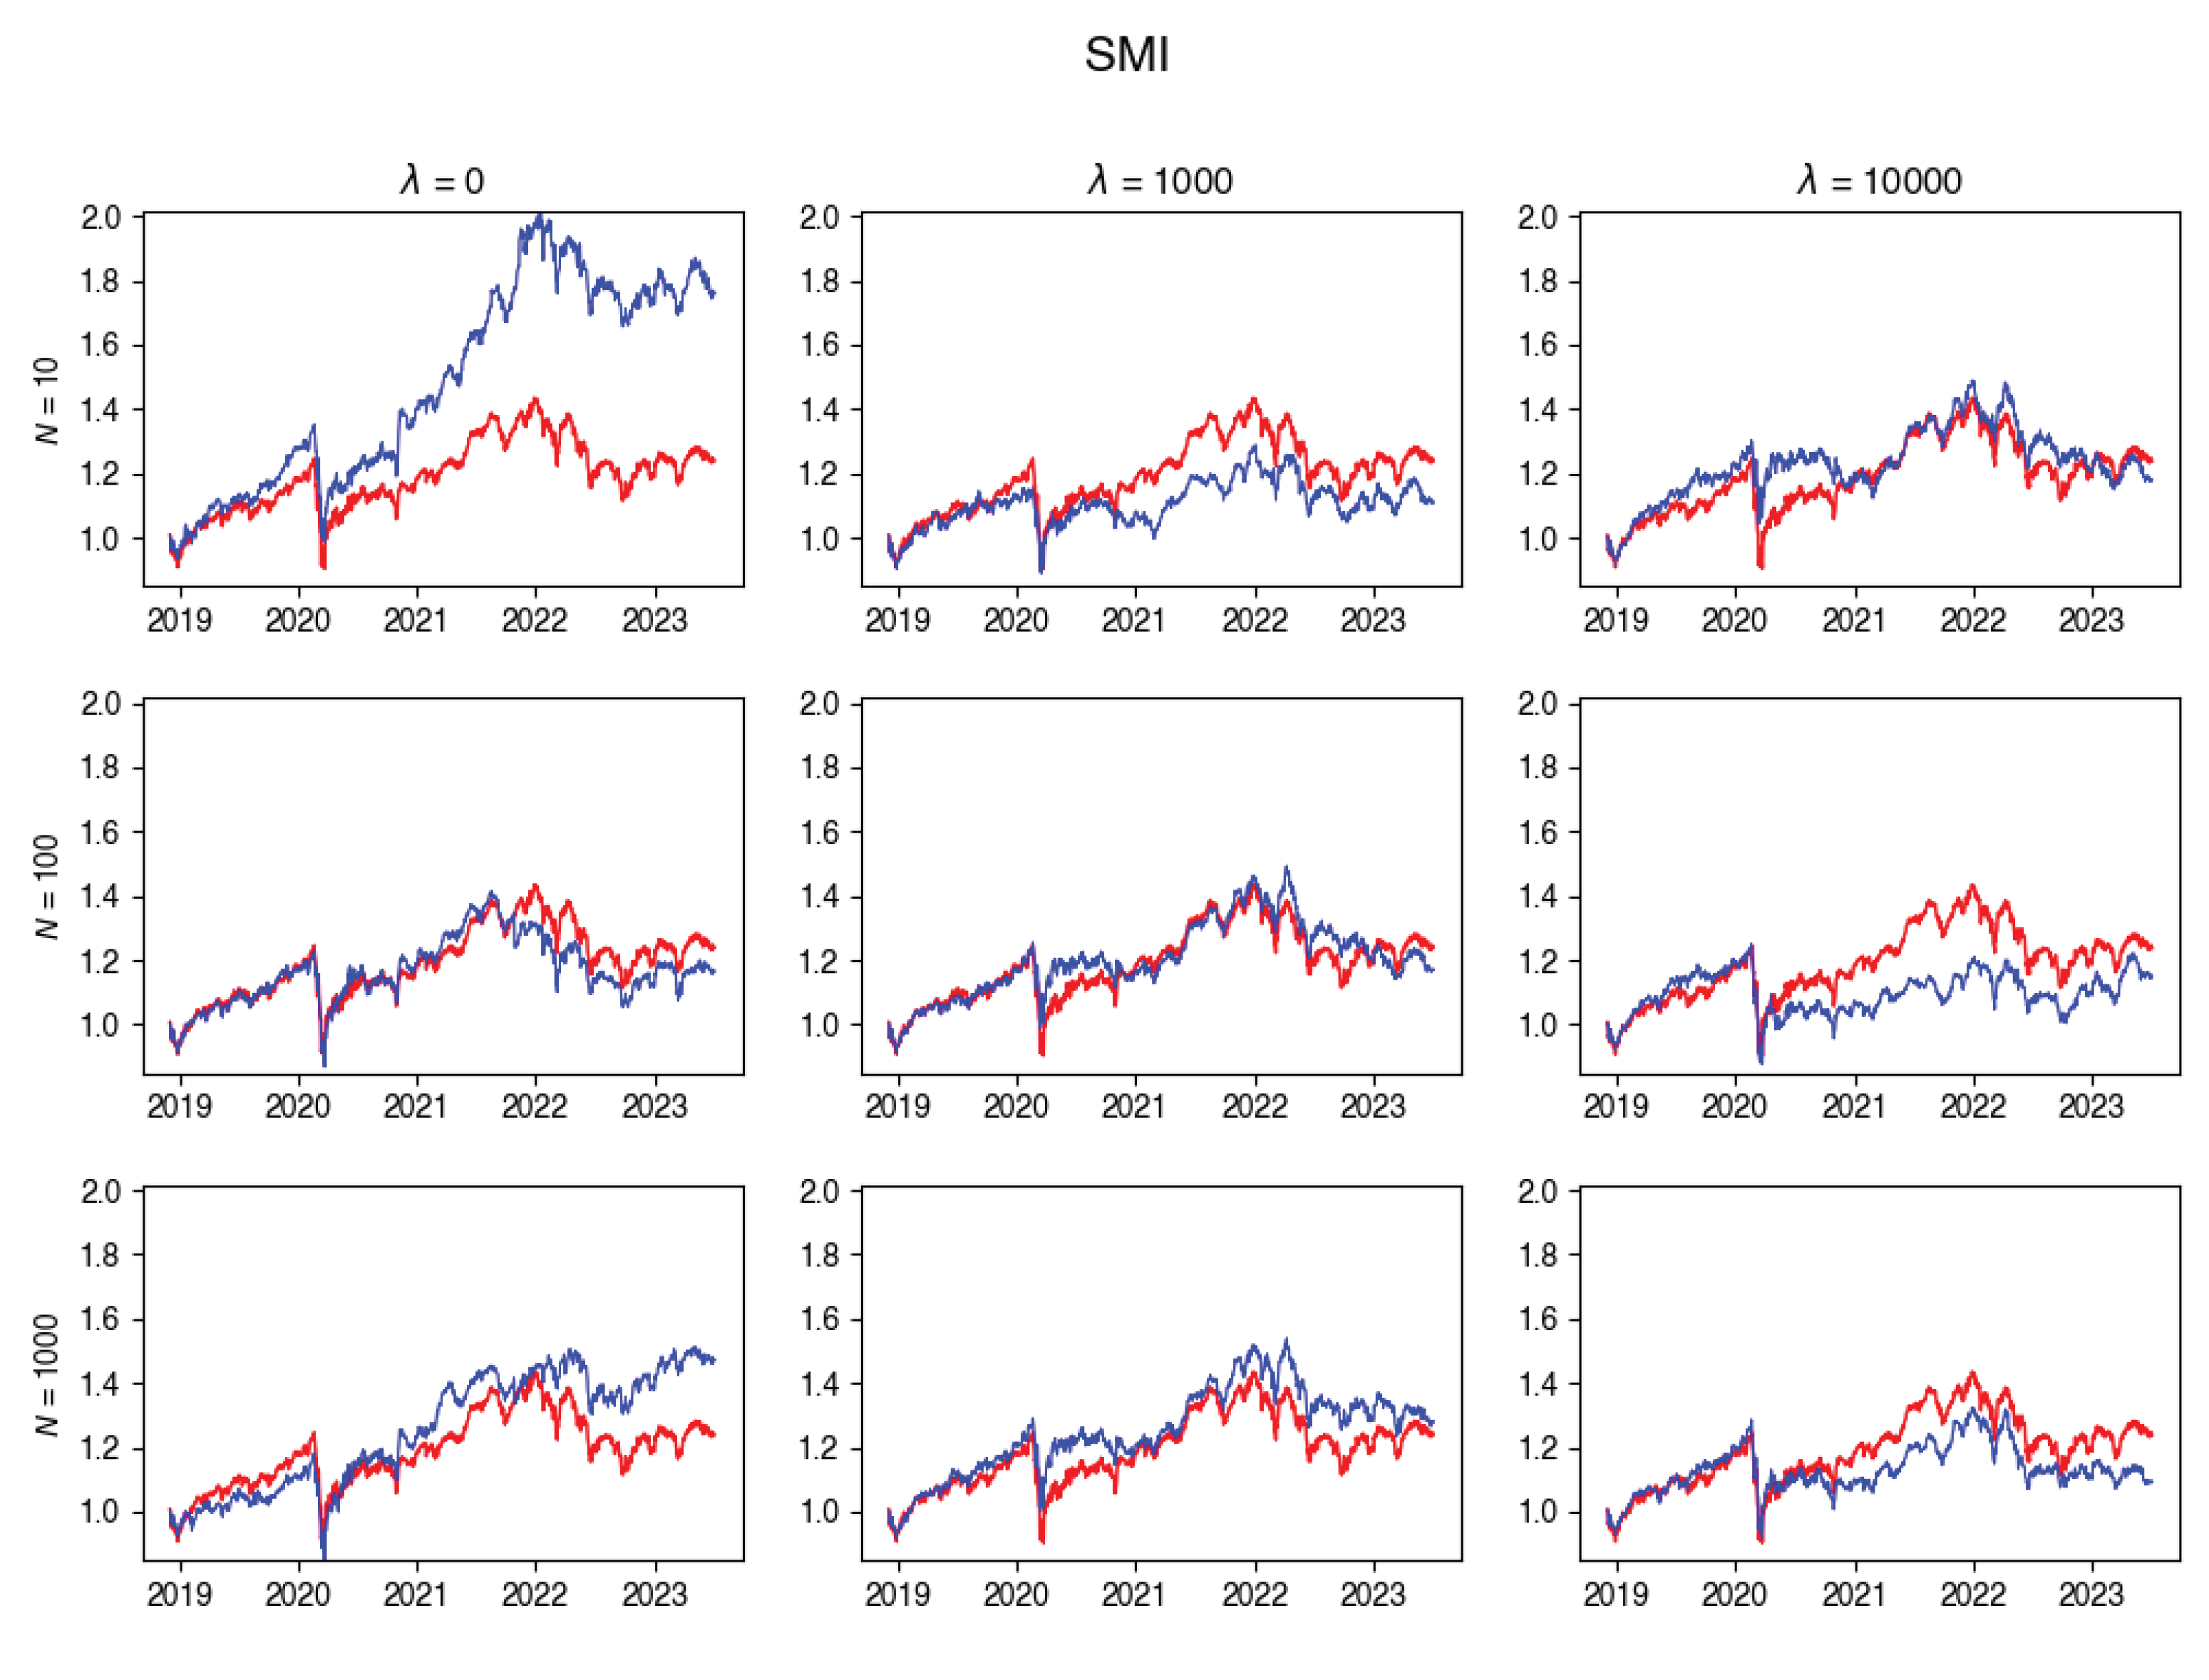
Figure A6.
SPTSX Tracking portfolio return versus actual index returns.
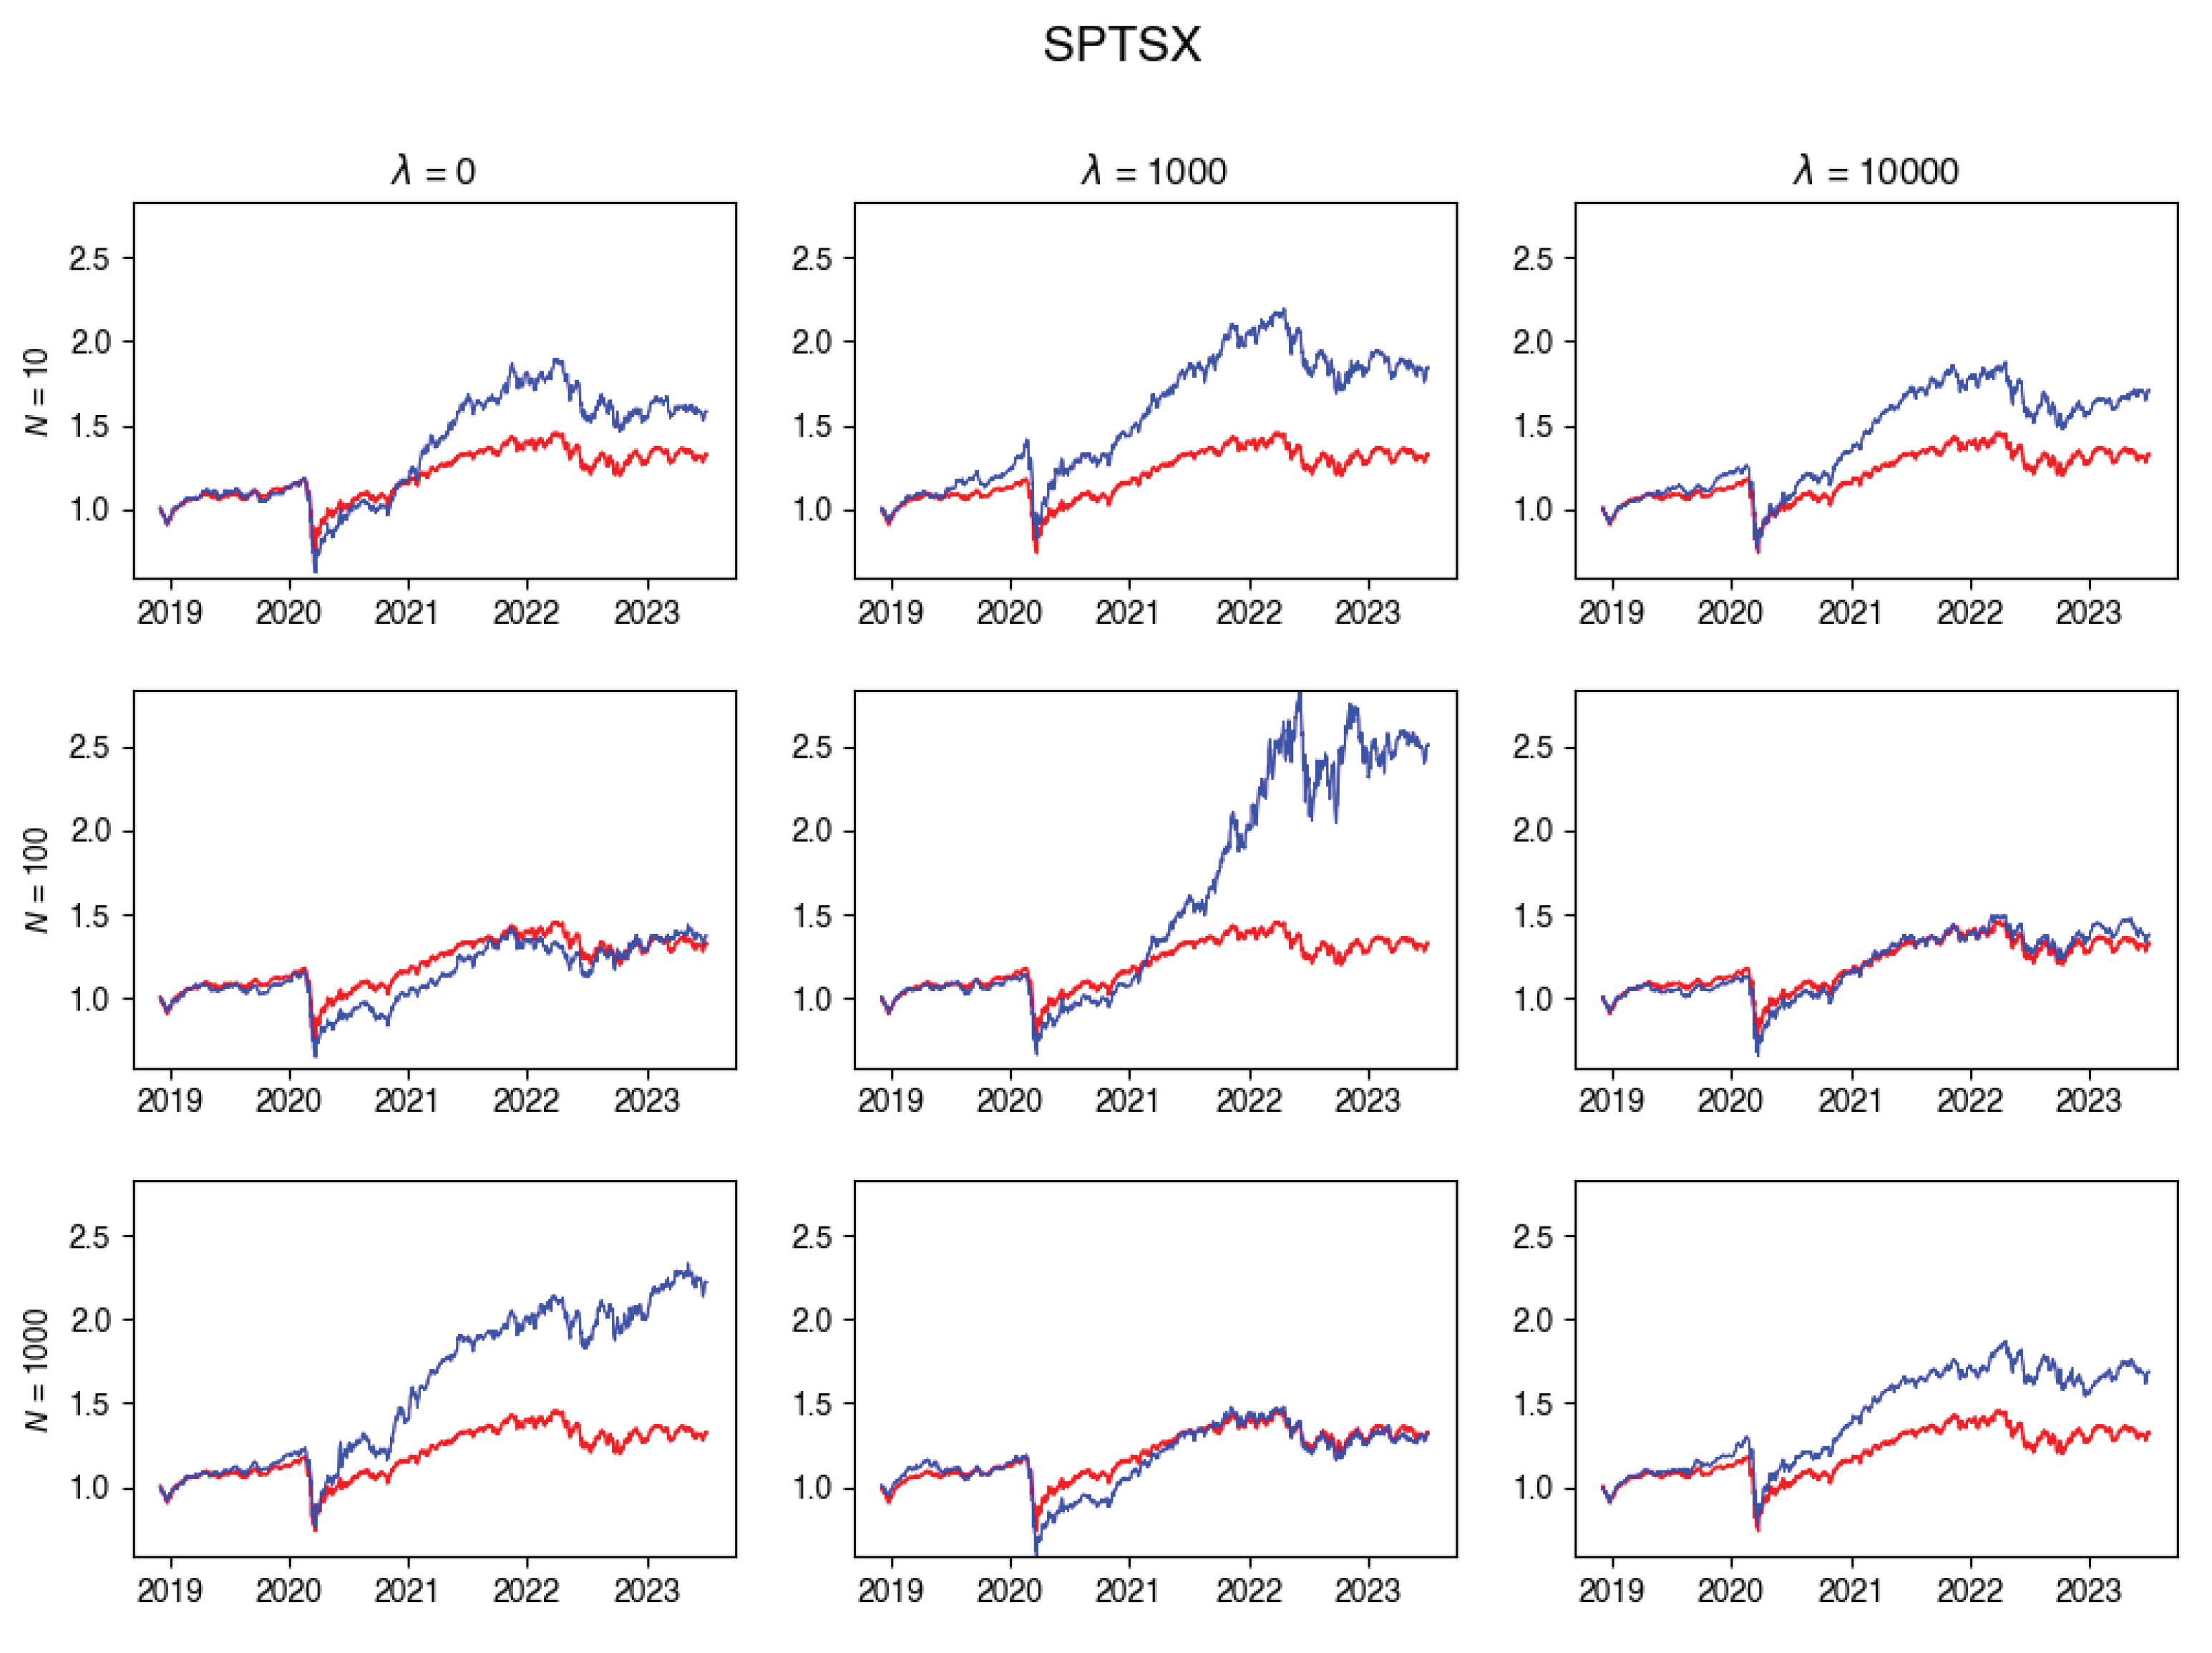
Figure A7.
SPX Tracking portfolio return versus actual index returns.
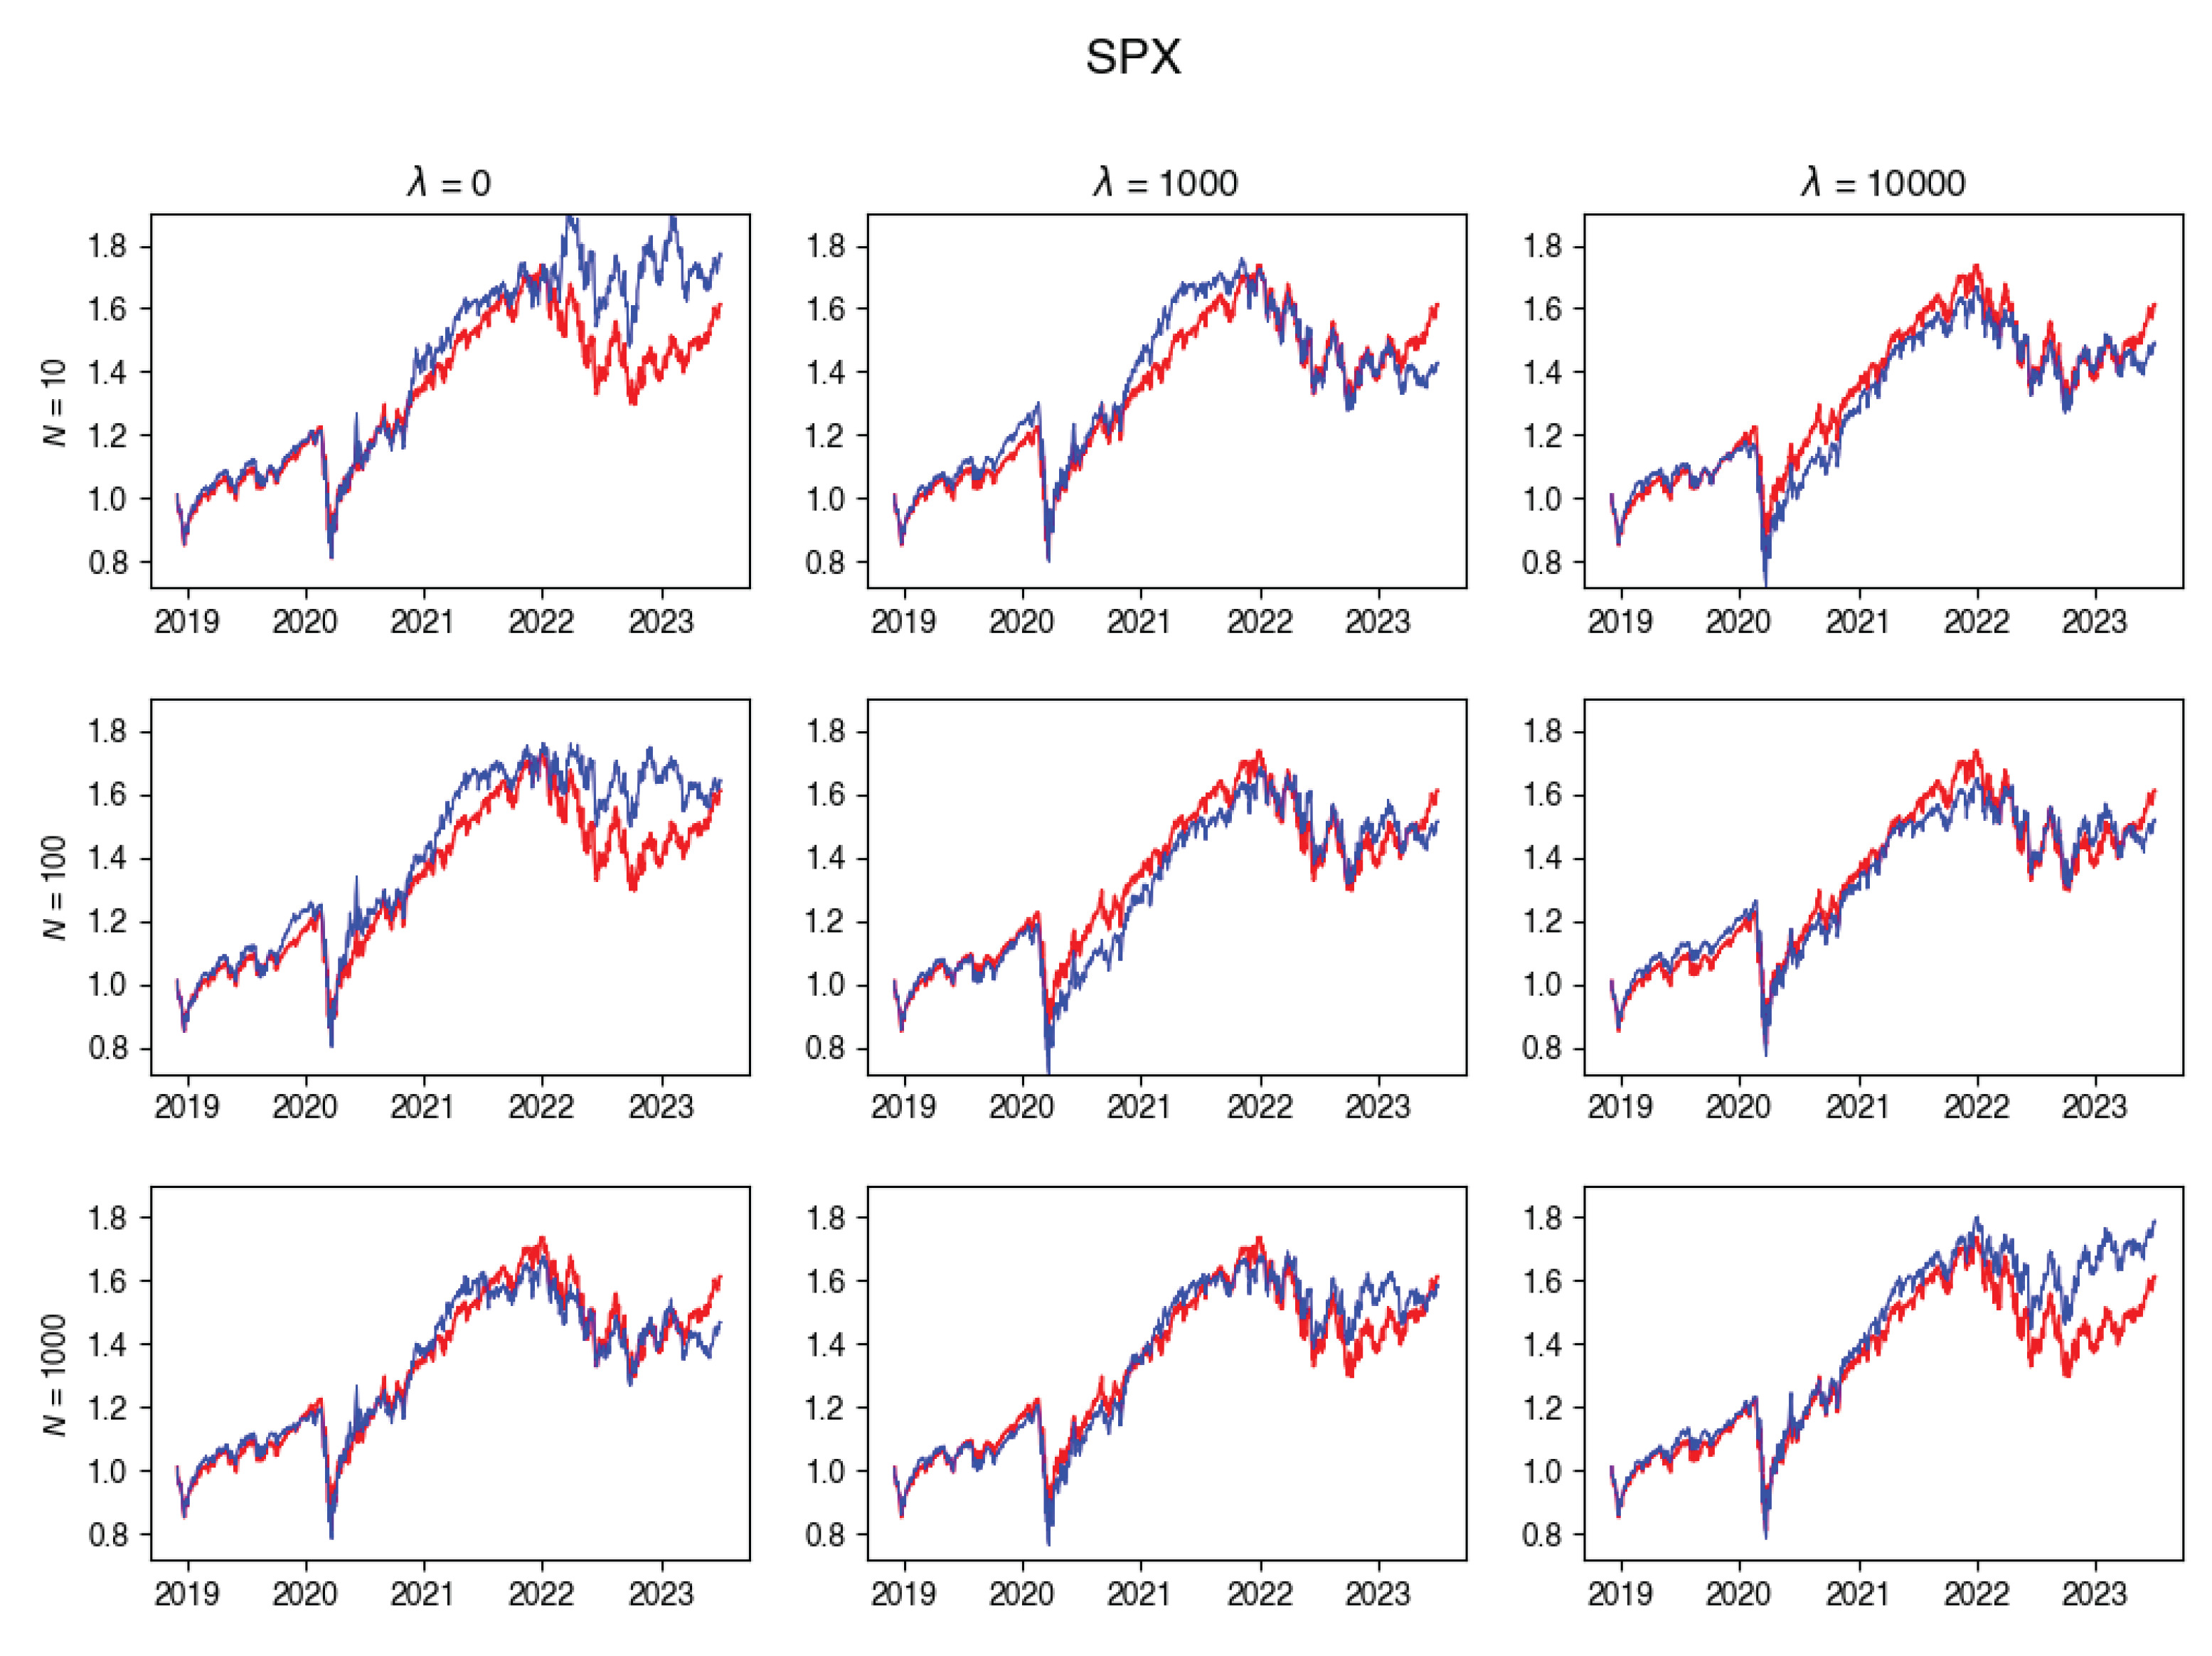
Figure A8.
UKX Tracking portfolio return versus actual index returns.
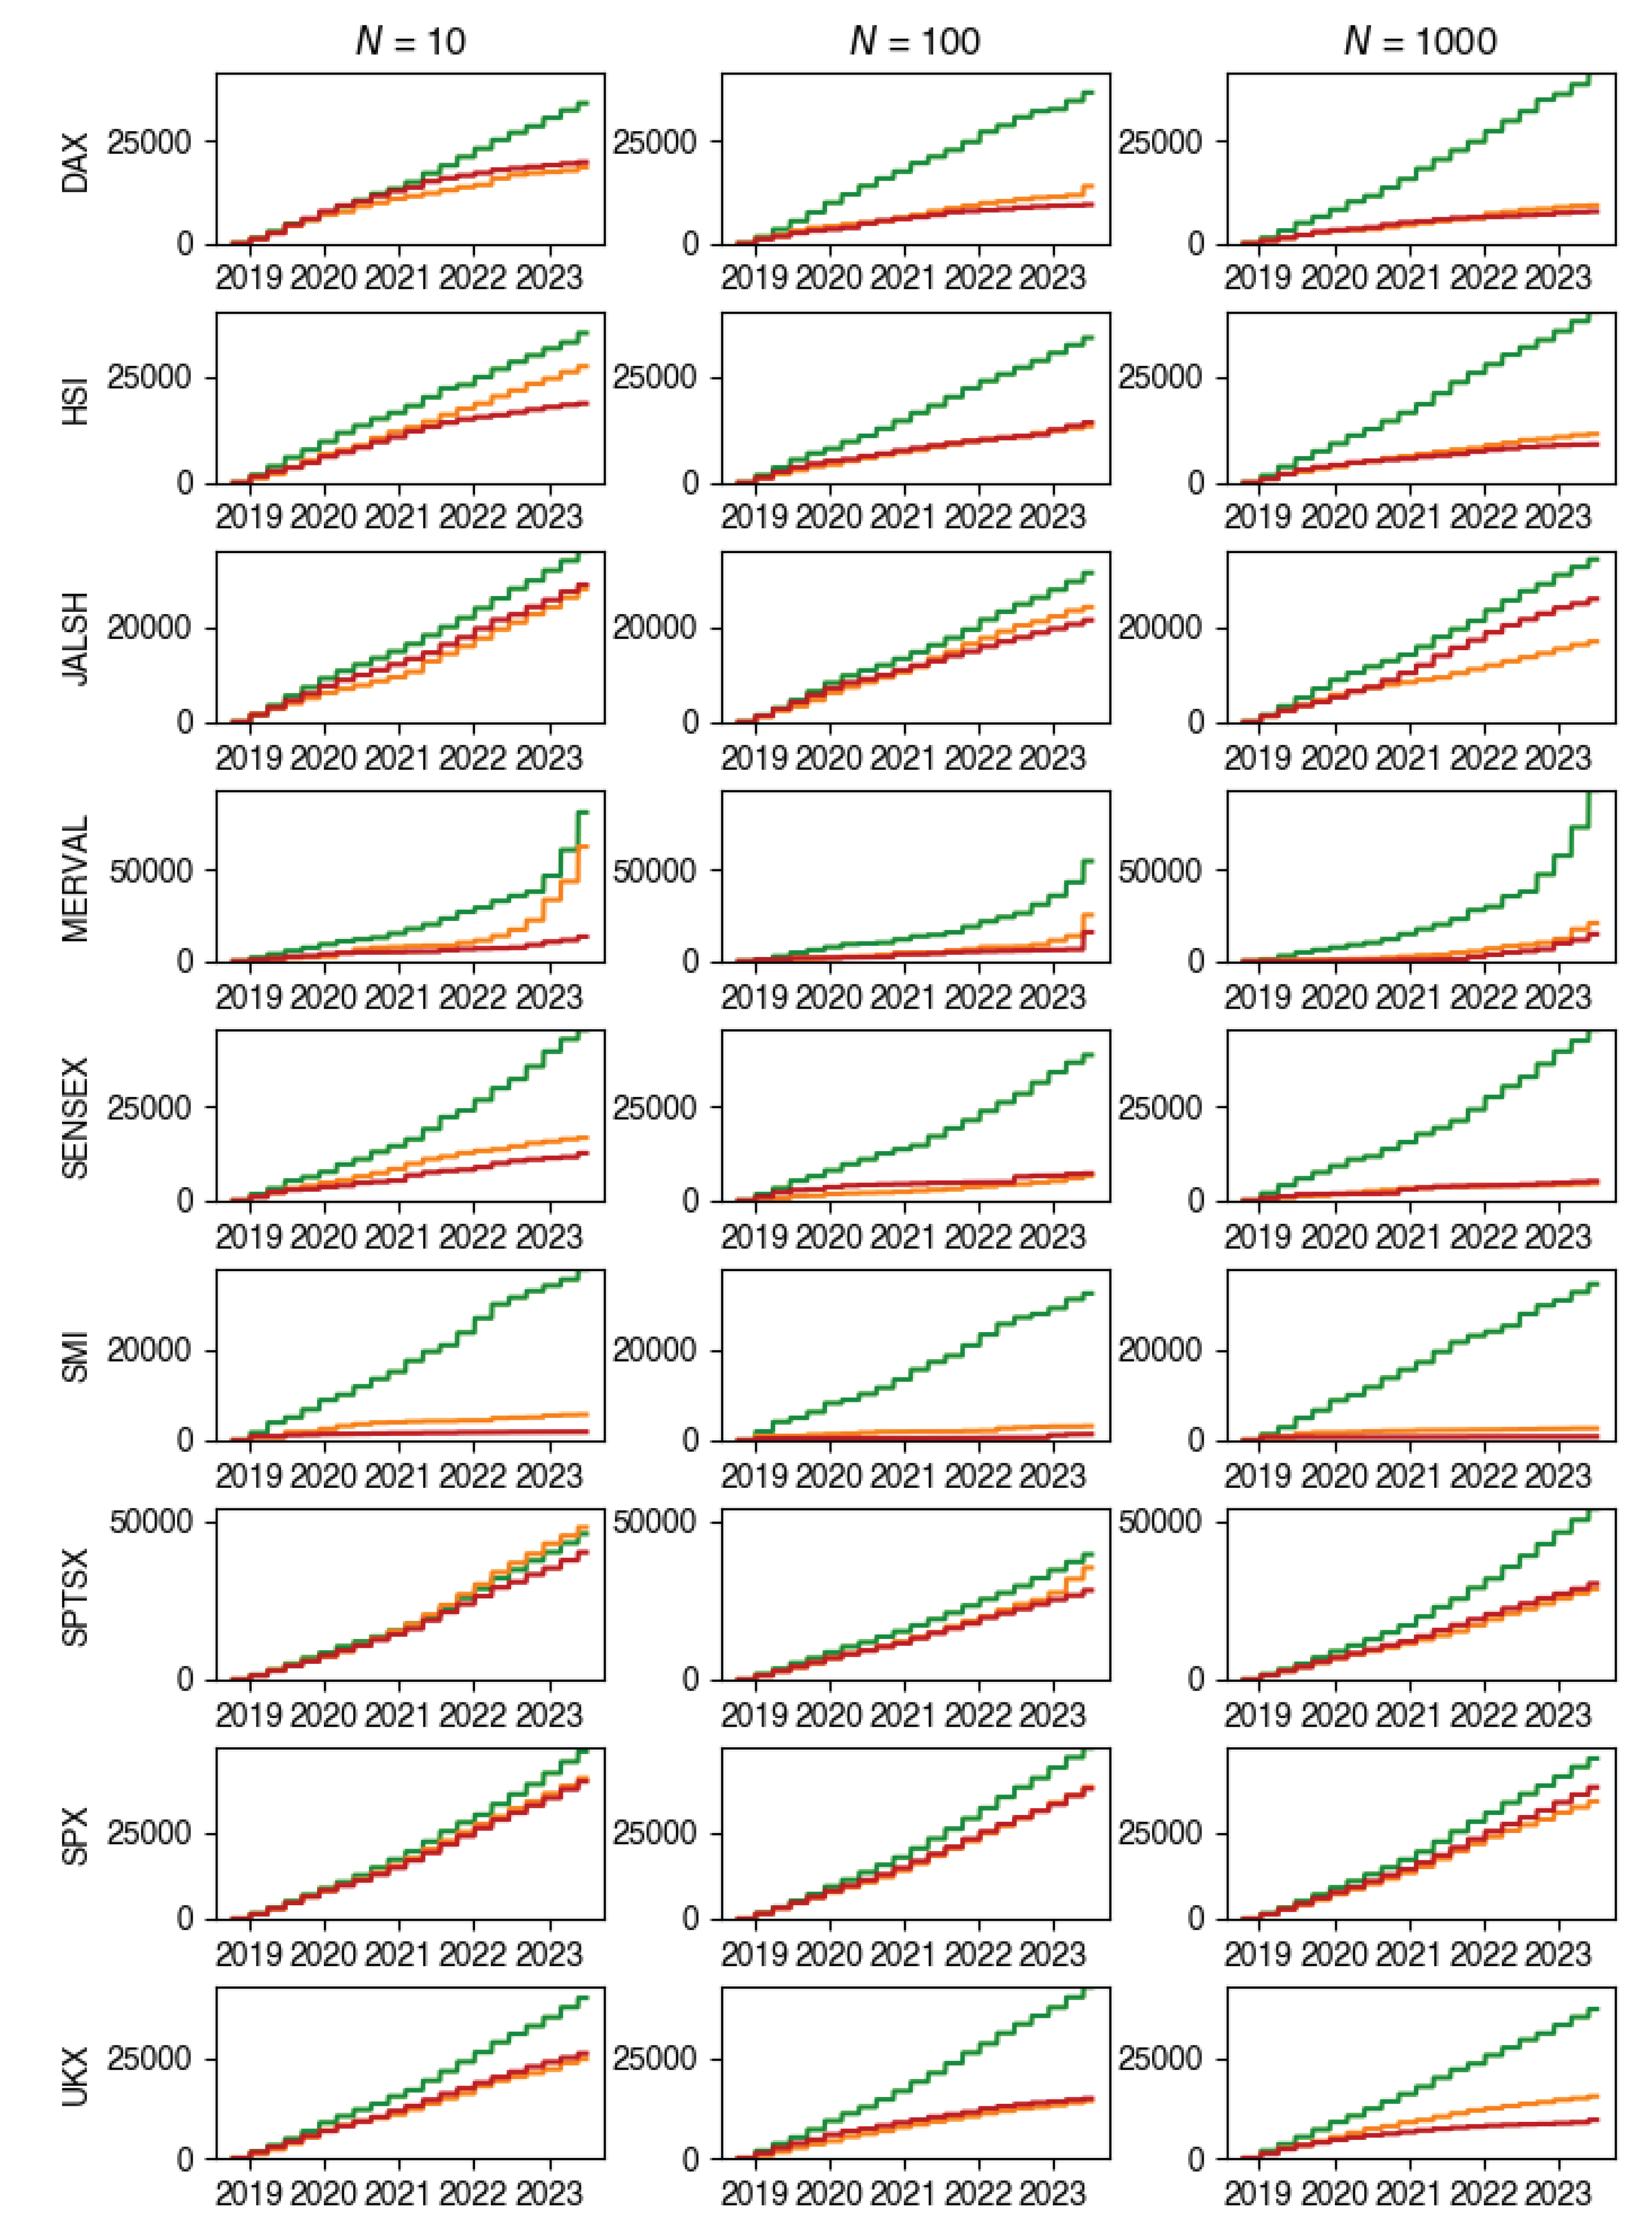
Appendix A.2. Transaction Costs
The plots below illustrate the cumulative transaction costs resulting from running the algorithm various numbers of particles.
Figure A9.
Cumulative transaction costs paid. Here, green is for , orange and red is .
Appendix A.3. Composition Plots
These plots illustrate how the composition of the tracking portfolio was changing during the experiments, for various values of .
Figure A10.
Changes in the composition of the tracking portfolio for DAX index.
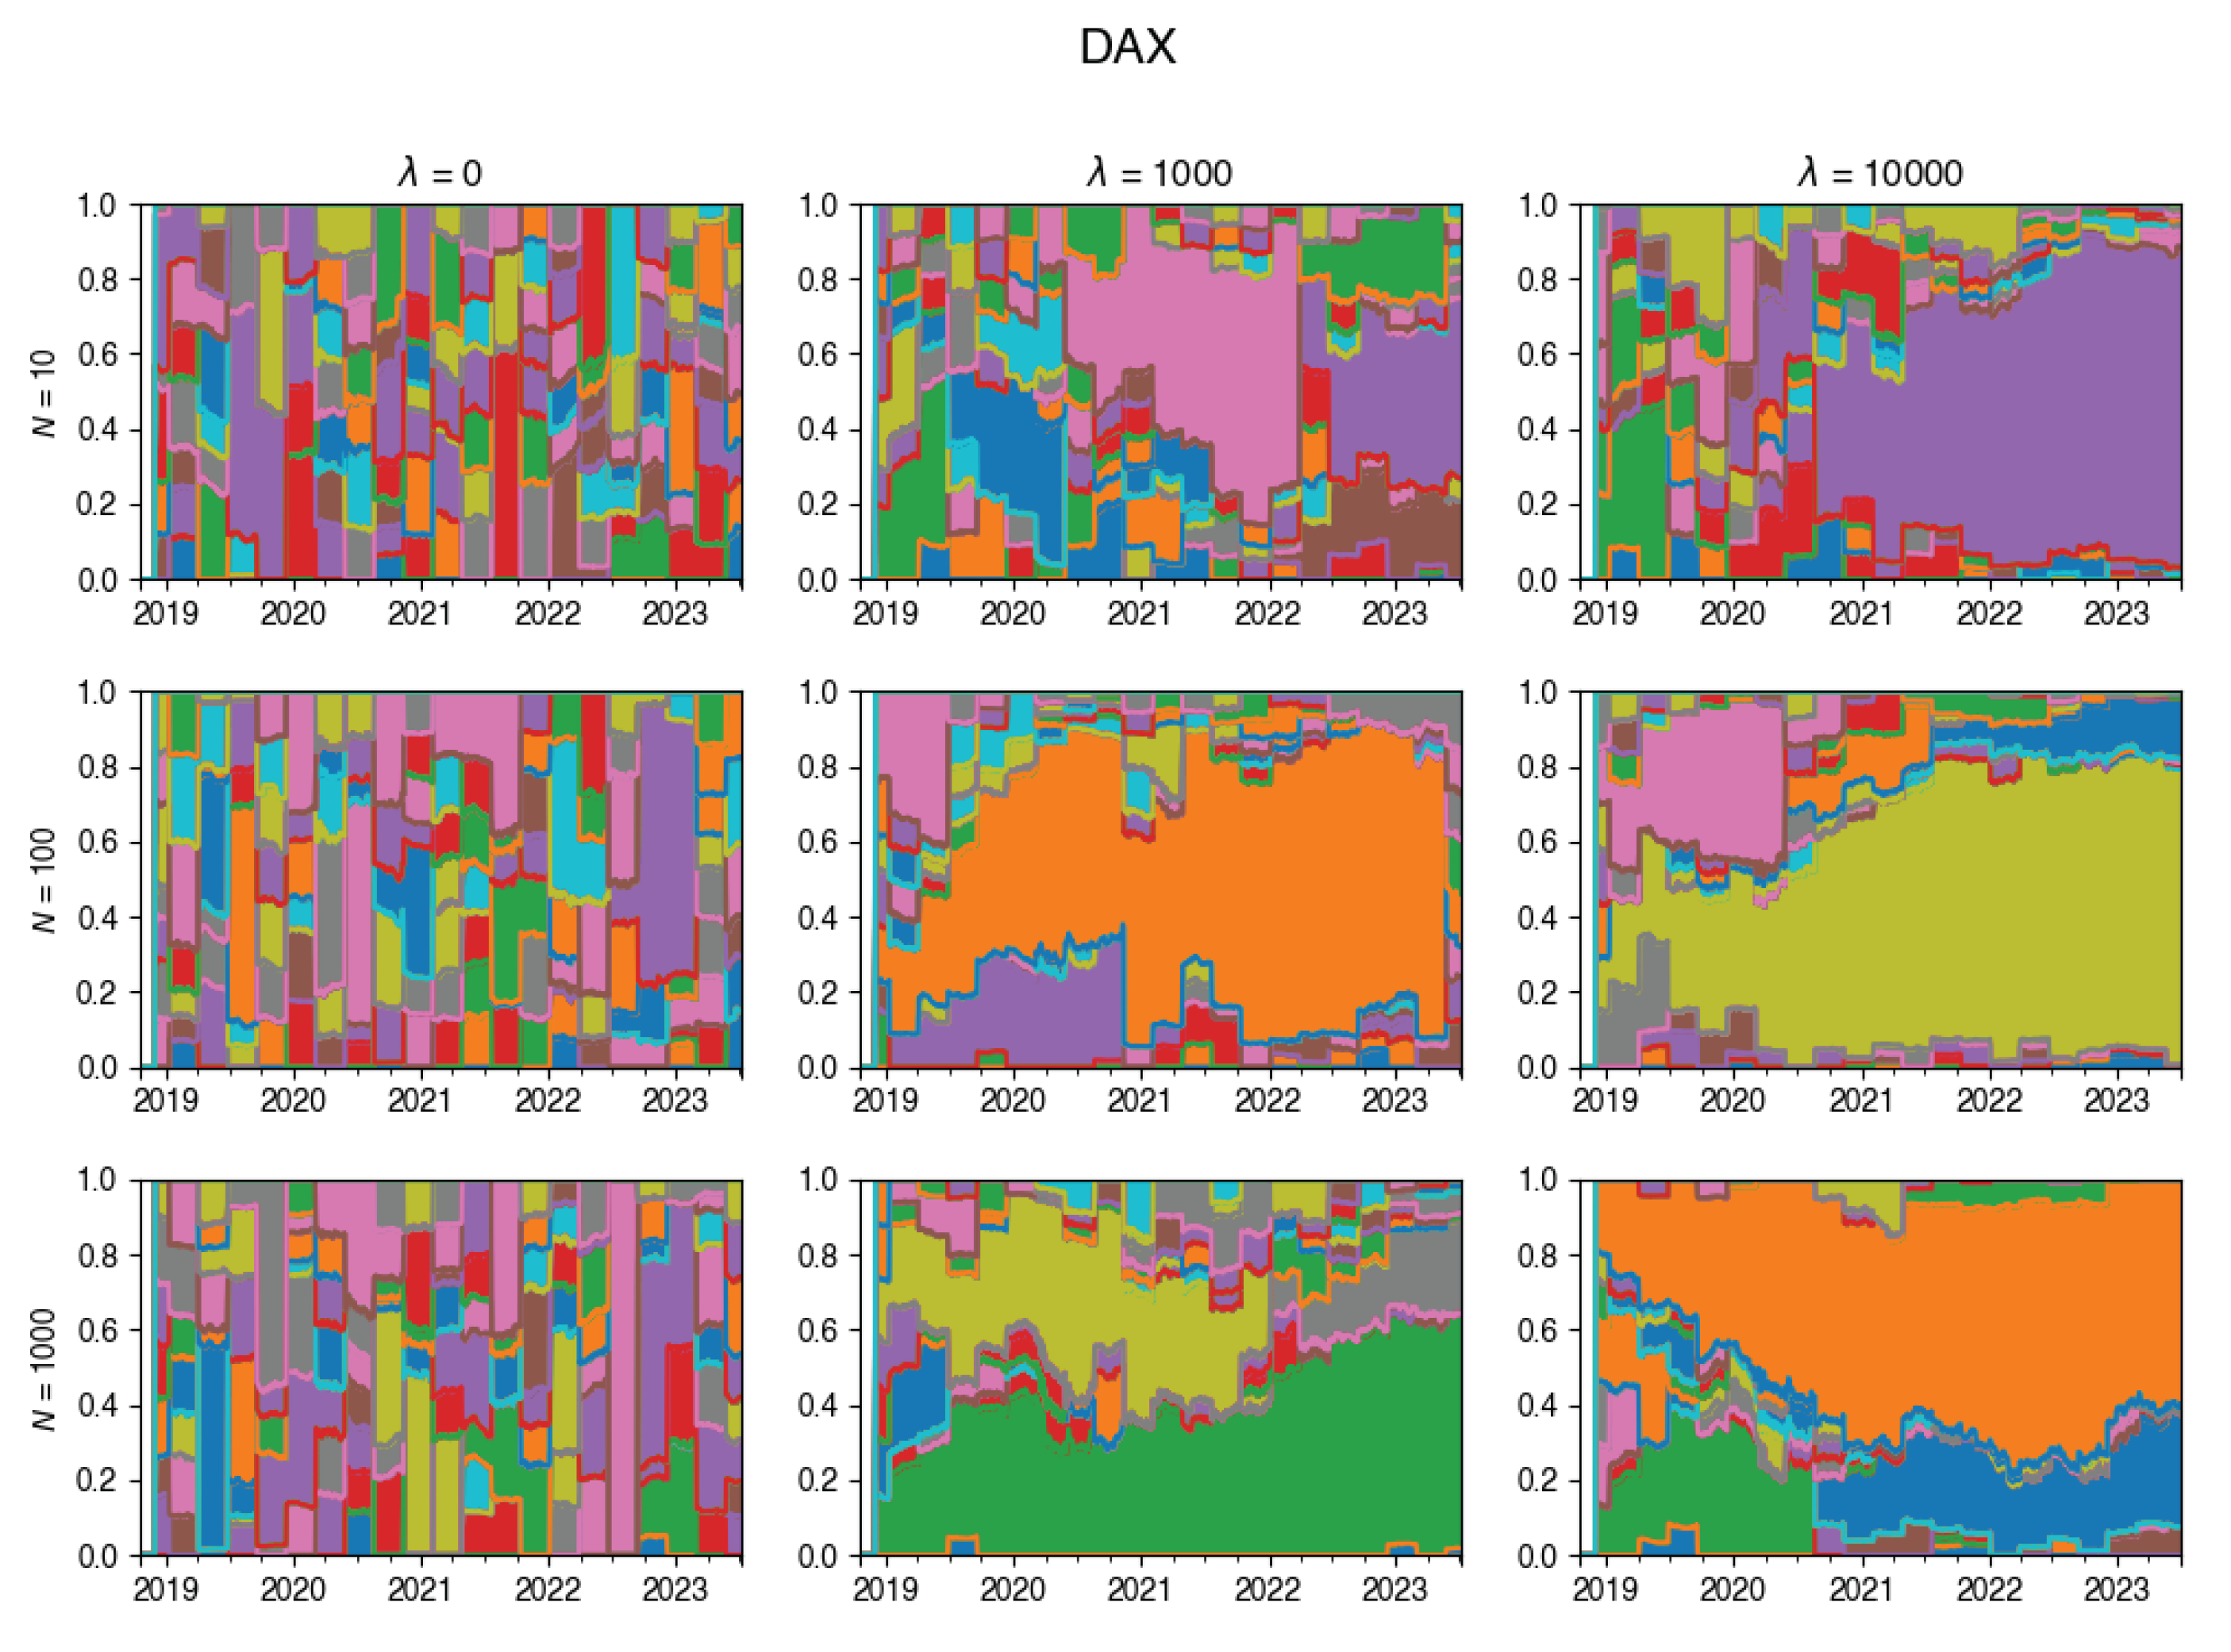
Figure A11.
Changes in the composition of the tracking portfolio for HSI index.
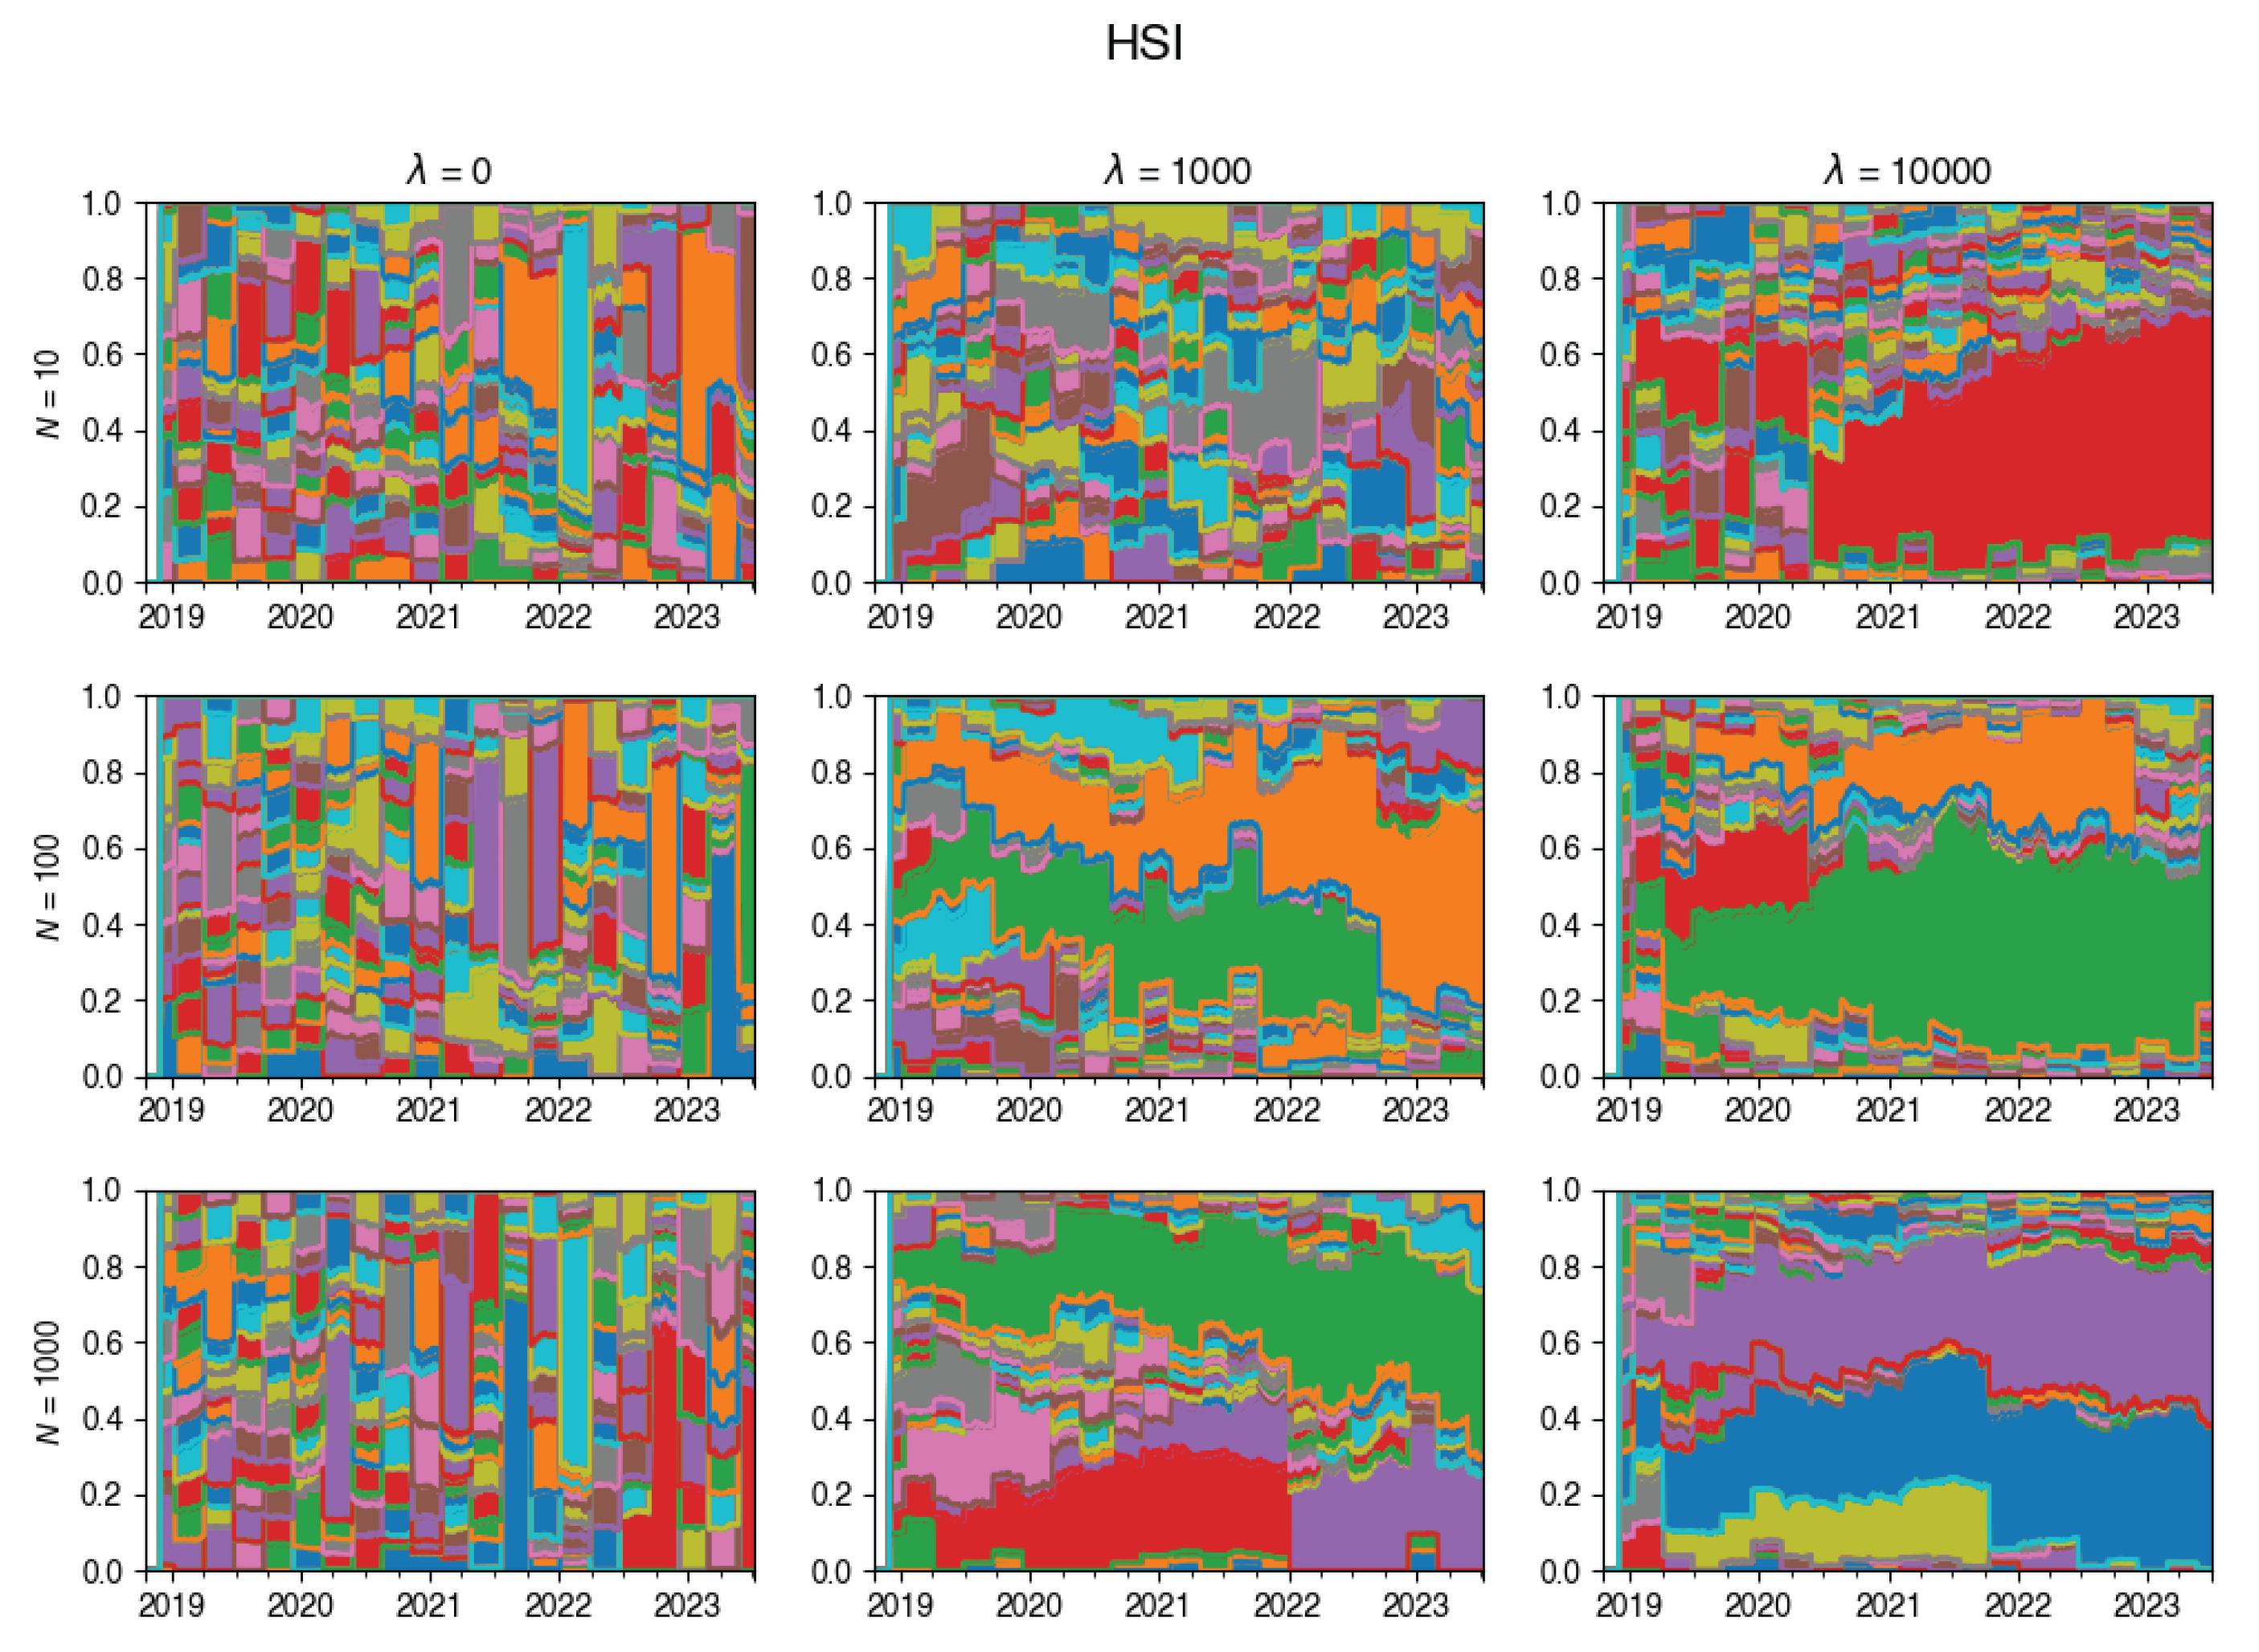
Figure A12.
Changes in the composition of the tracking portfolio for JALSH index.
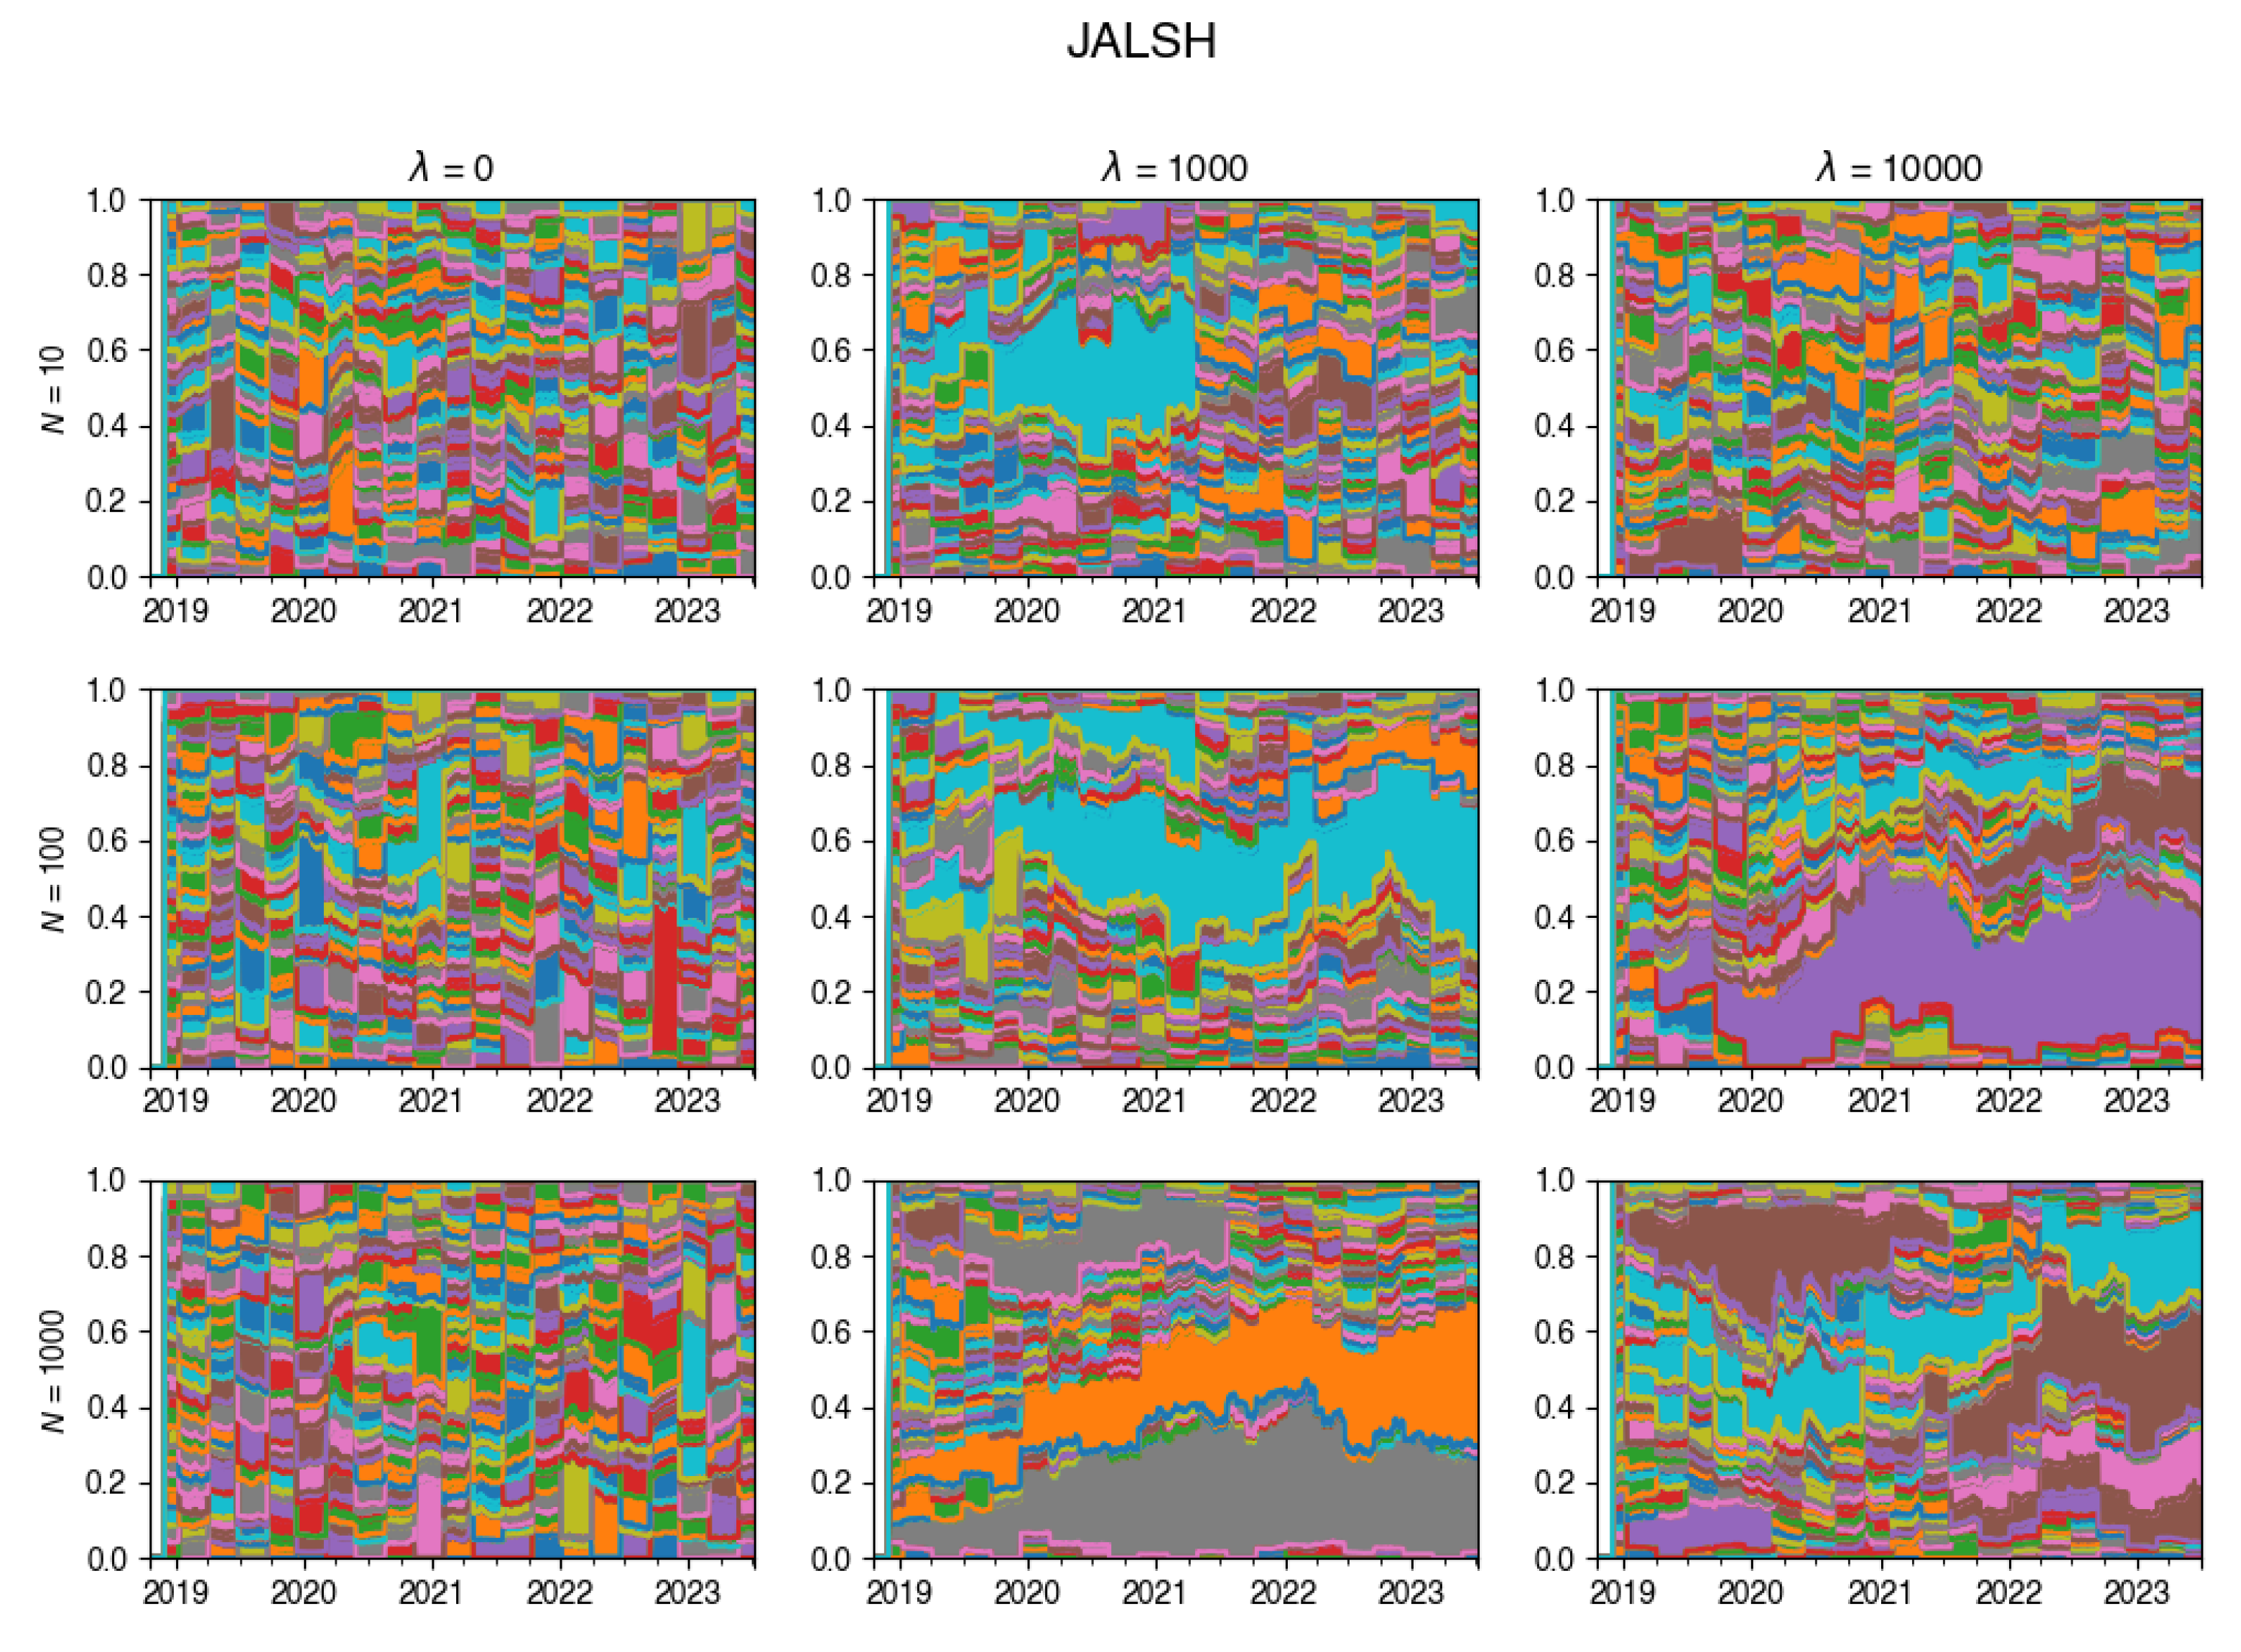
Figure A13.
Changes in the composition of the tracking portfolio for SENSEX index.
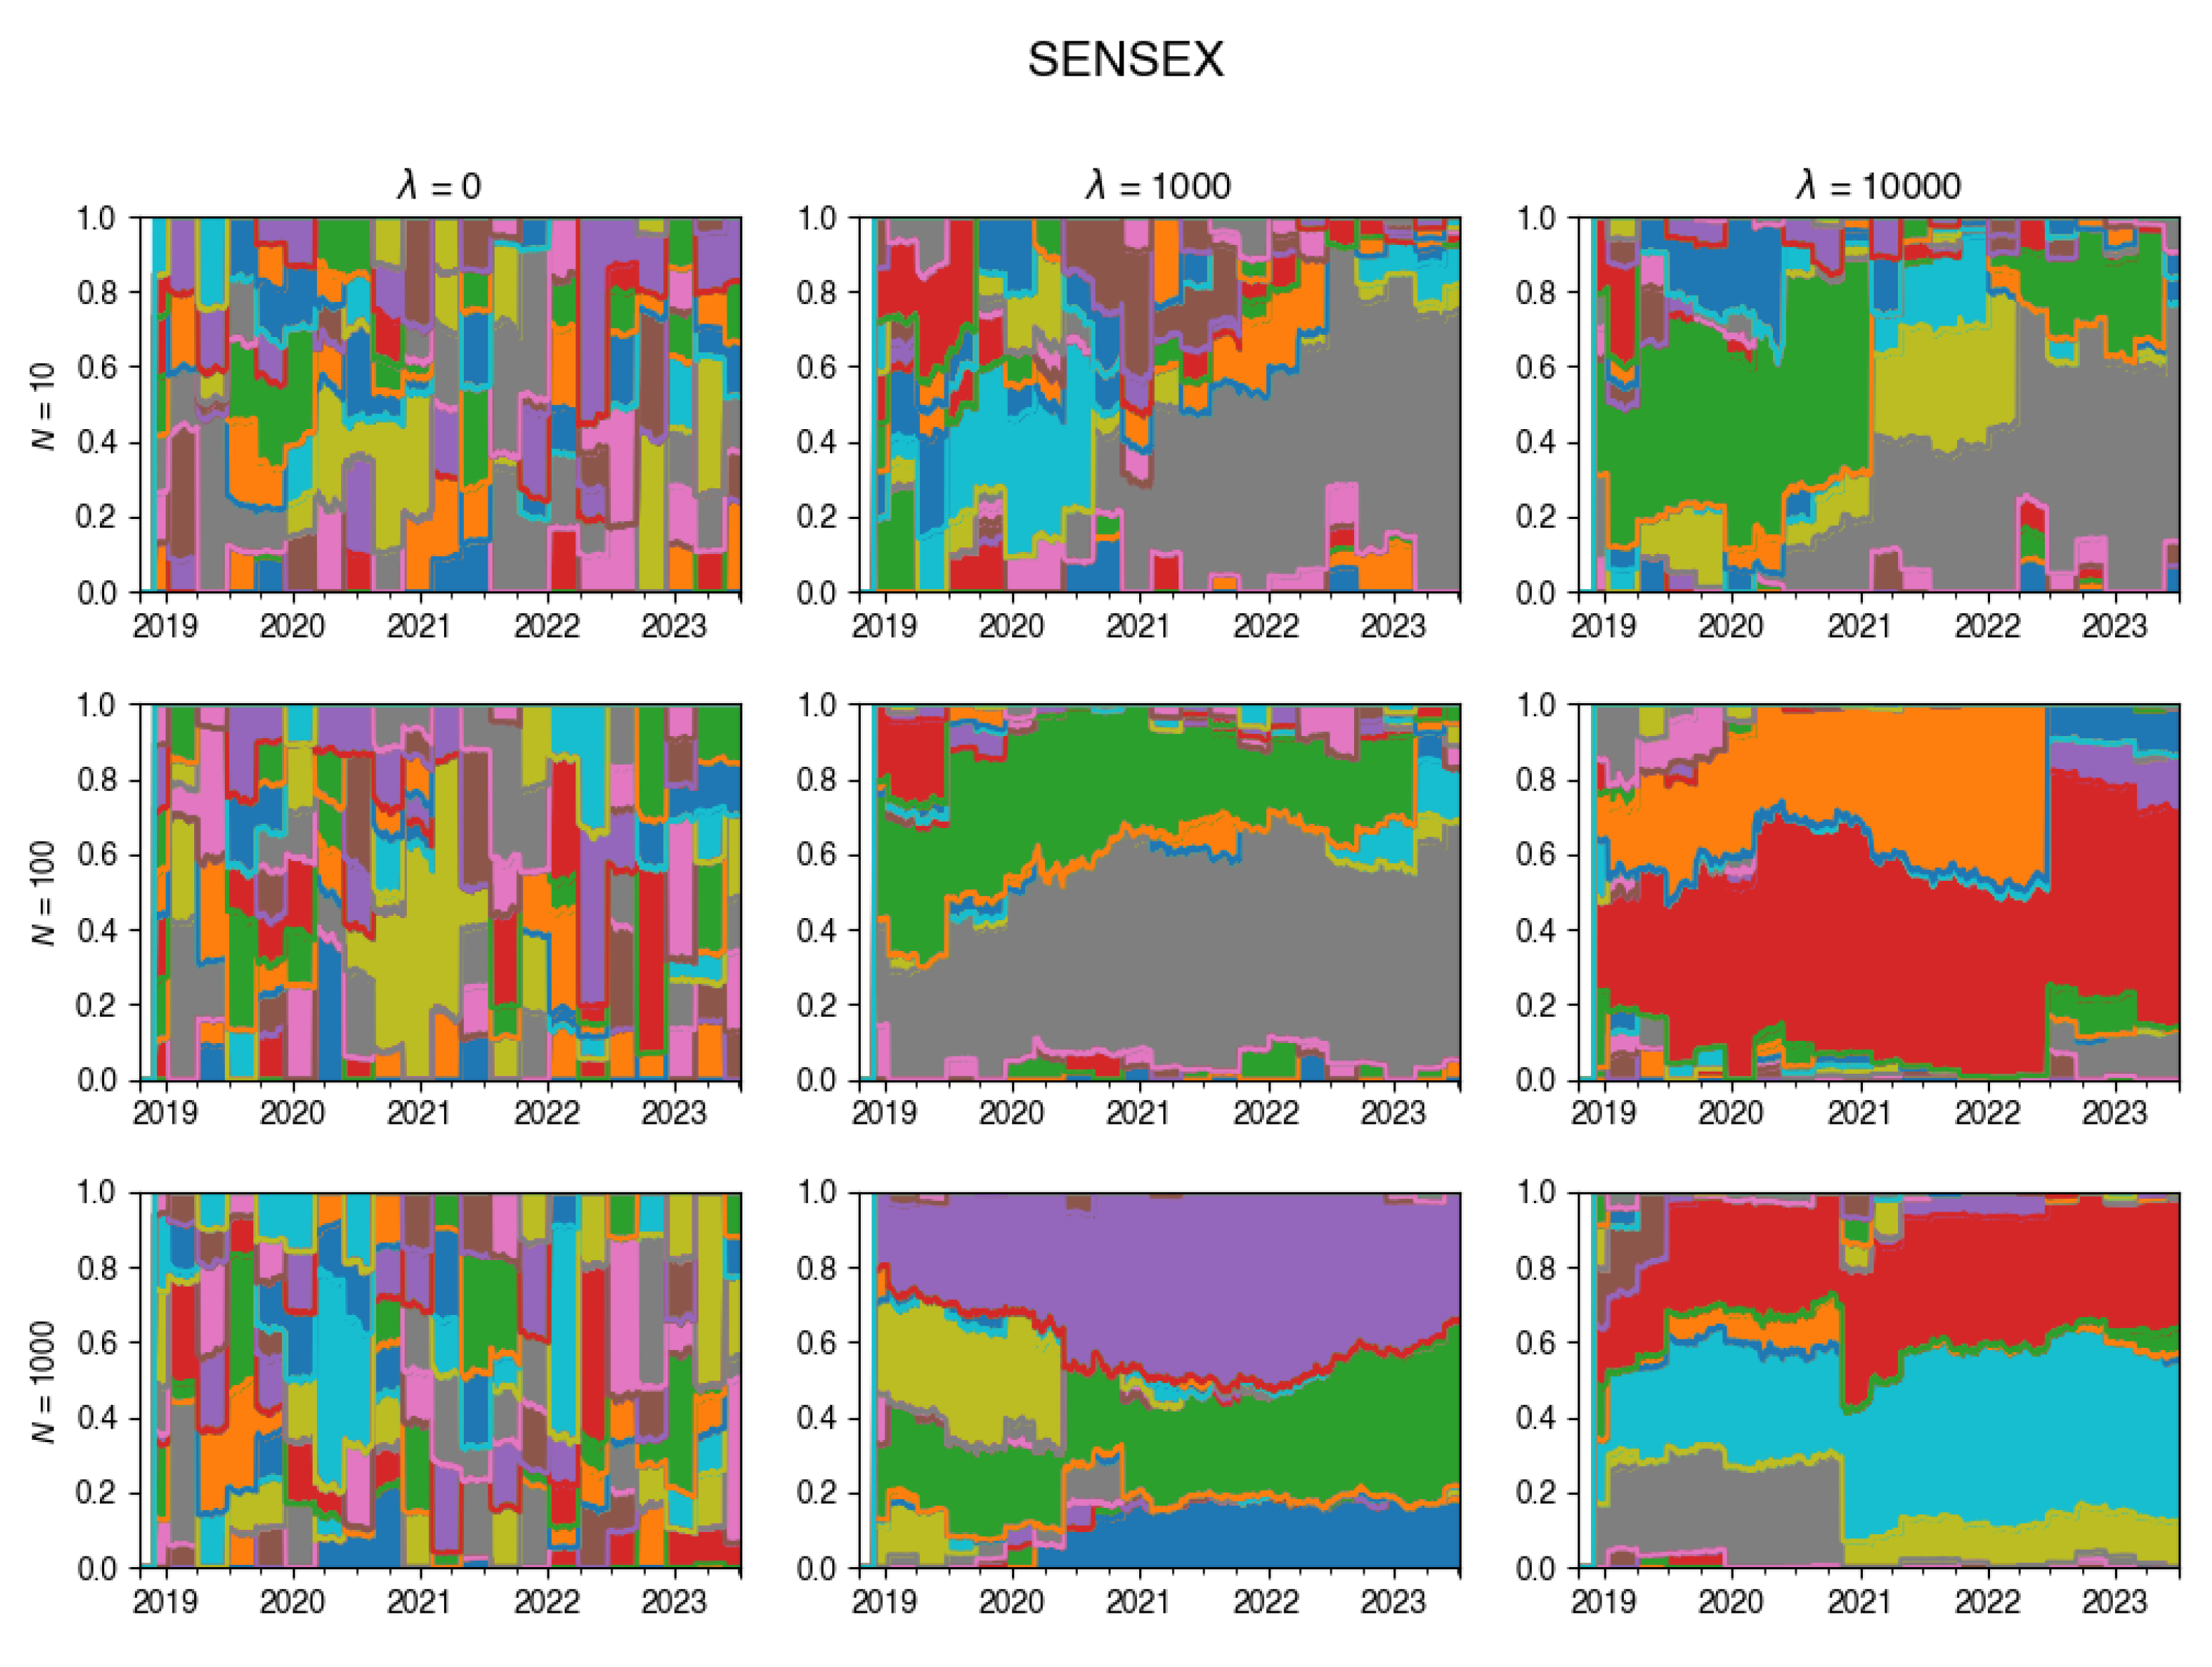
Figure A14.
Changes in the composition of the tracking portfolio for SMI index.
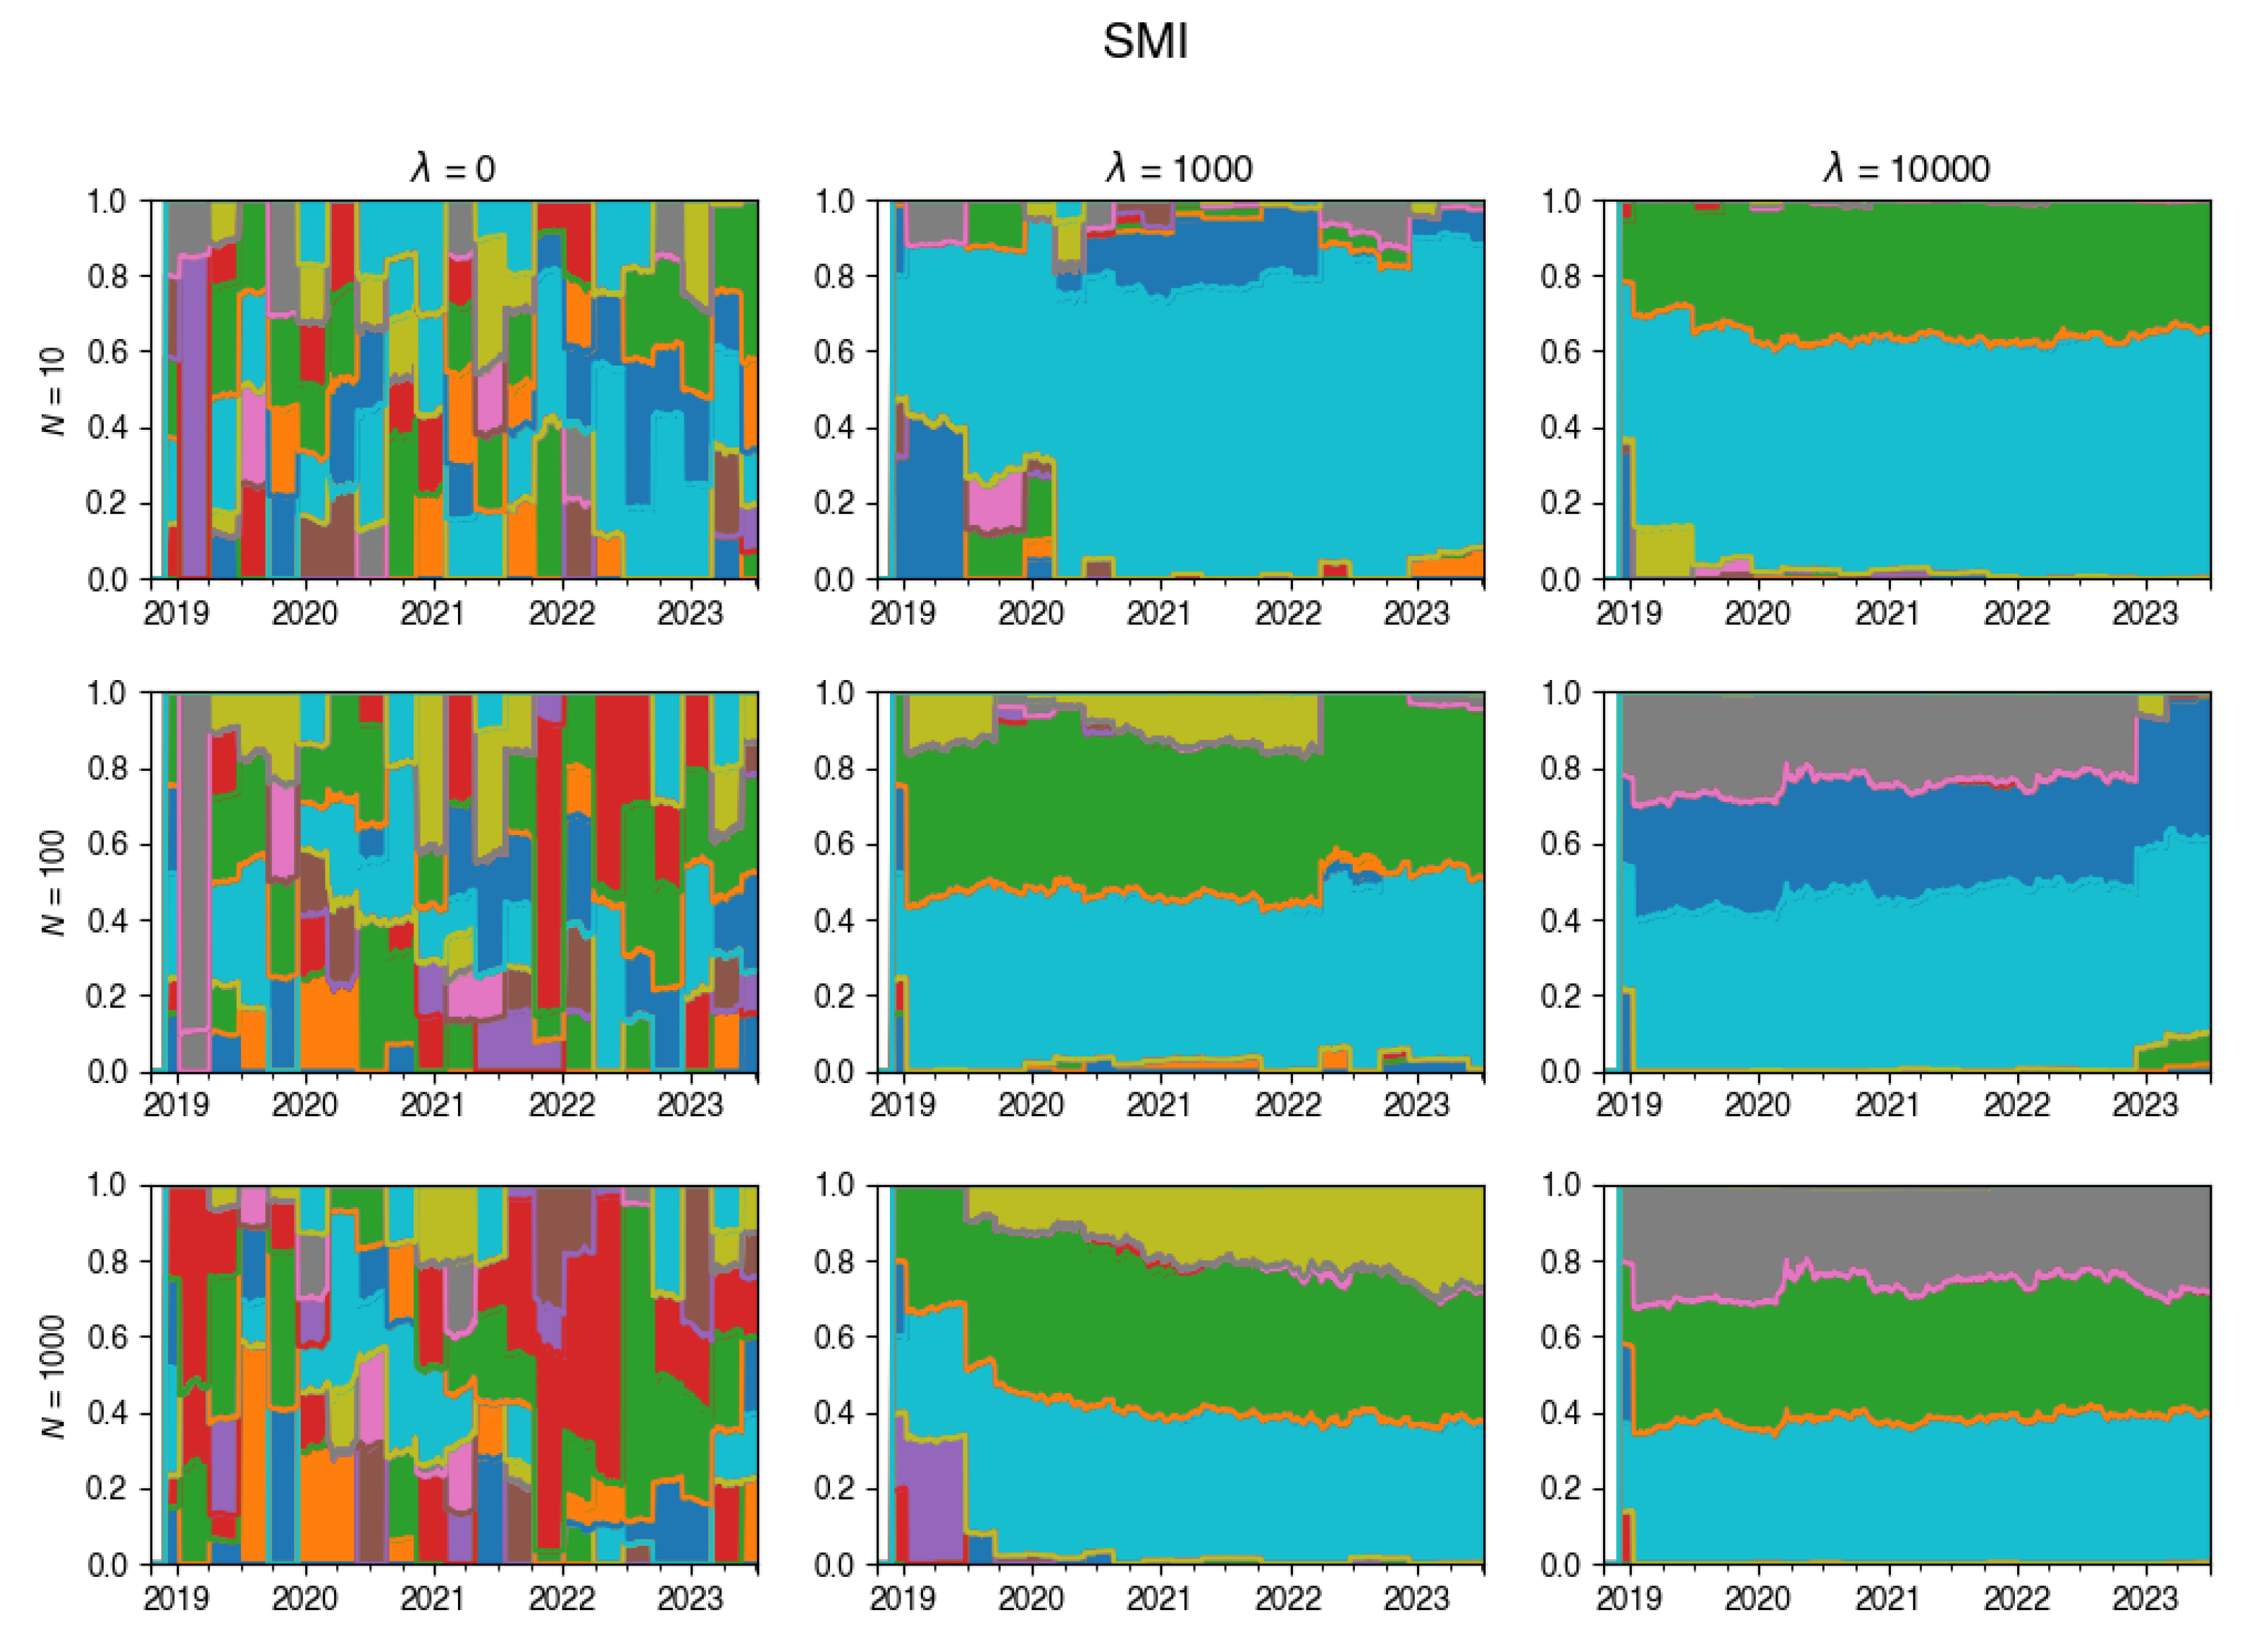
Figure A15.
Changes in the composition of the tracking portfolio for SPTSX index.
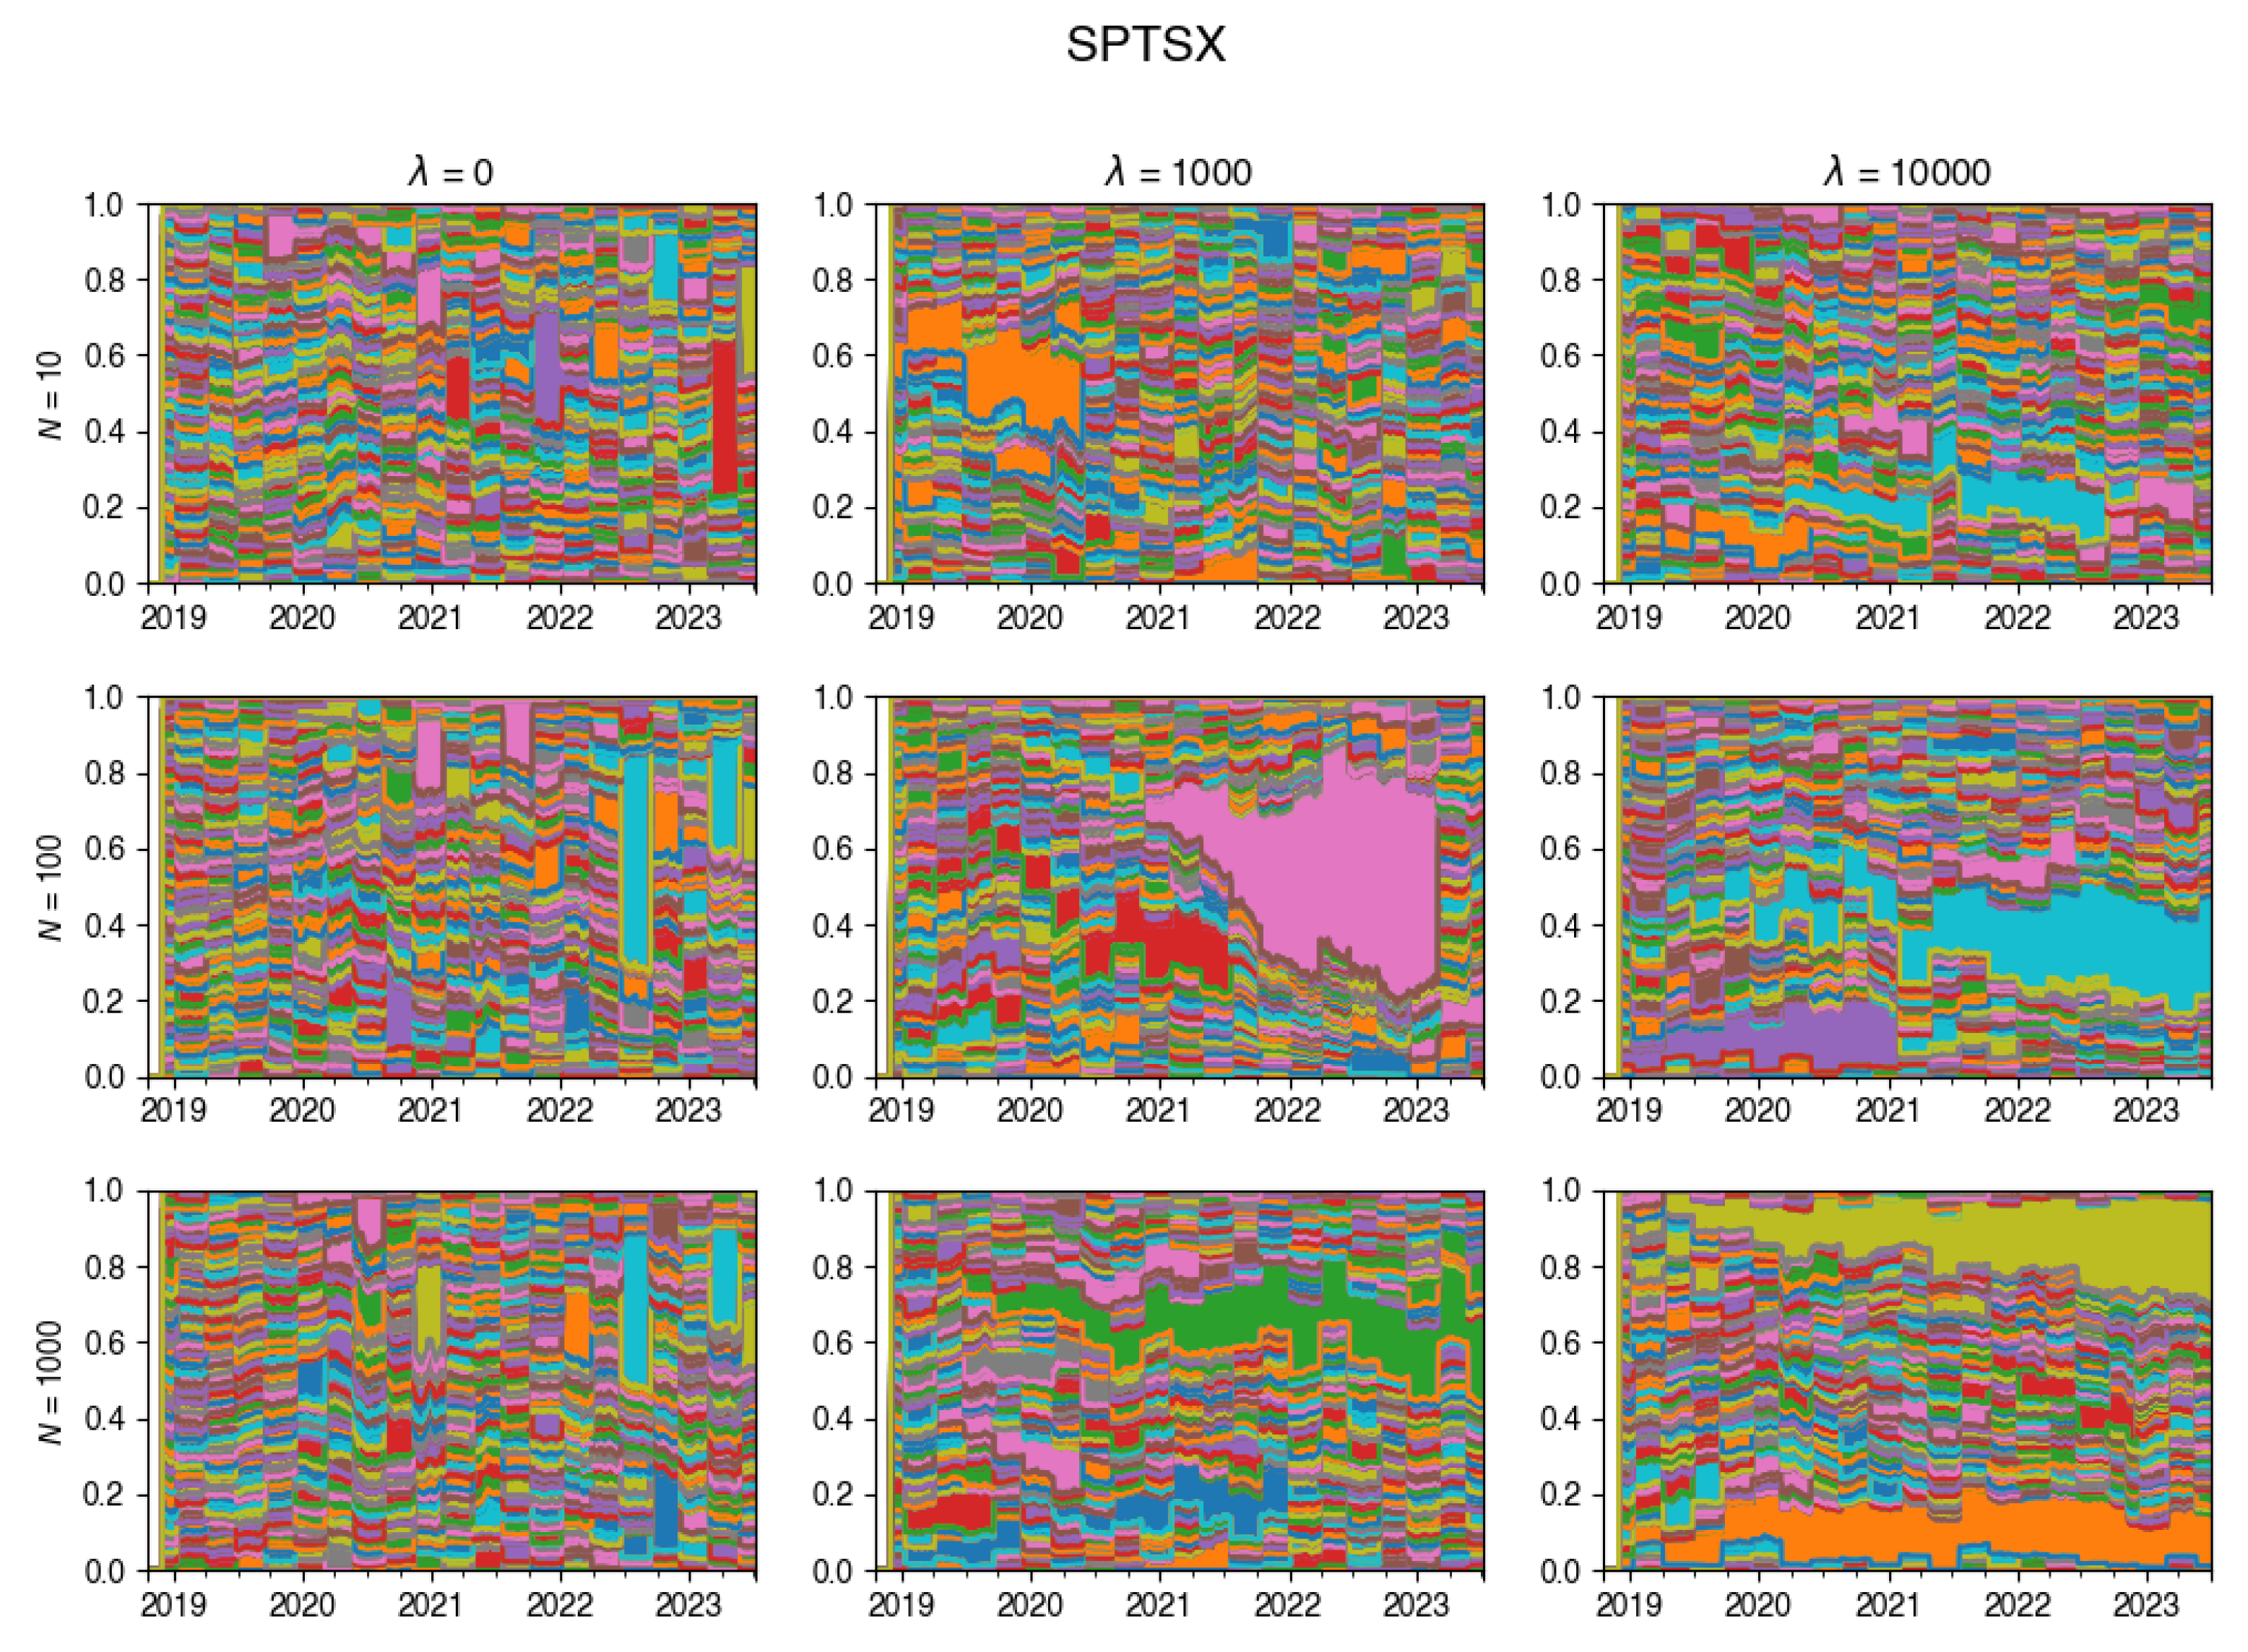
Figure A16.
Changes in the composition of the tracking portfolio for SPX index.
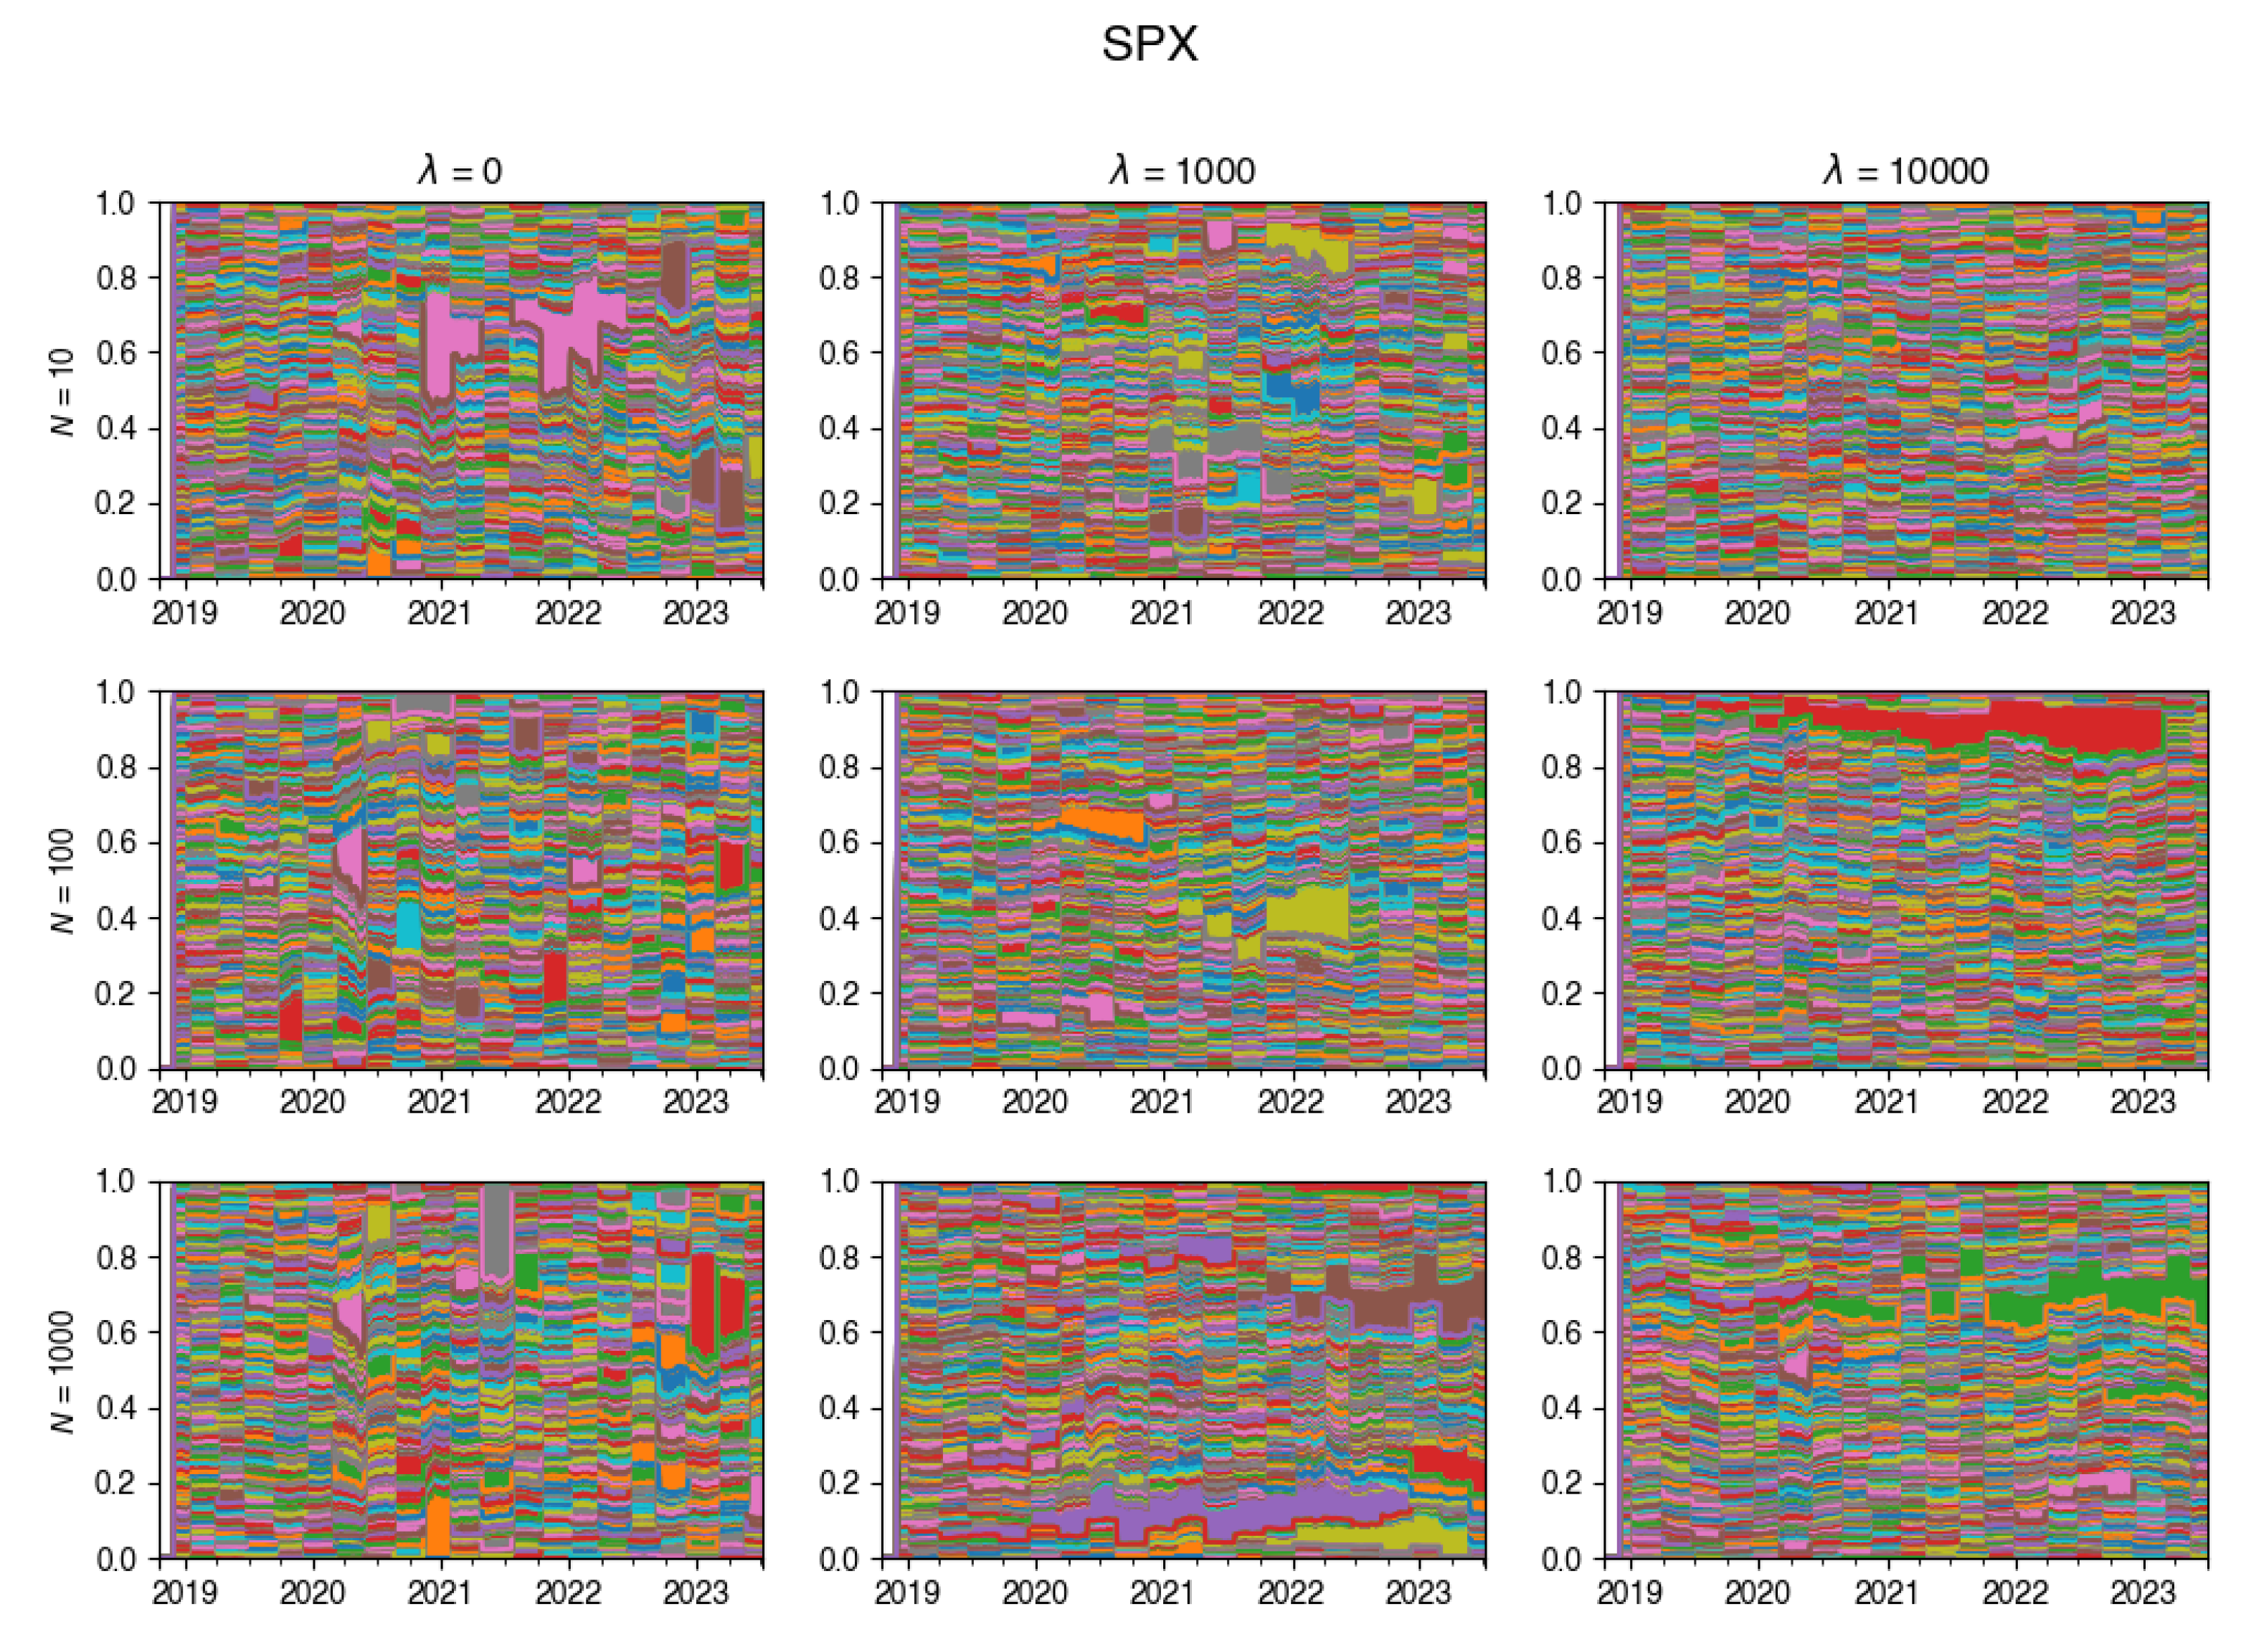
Figure A17.
Changes in the composition of the tracking portfolio for UKX index.
References
- Barber, Brad and Terrance Odean. 2000. Trading is hazardous to your wealth: The common stock investment performance of individual investors. Journal of Finance 55(2), 773–806.
- Benidis, Konstantinos, Yiyong Feng, Daniel P Palomar, et al. 2018. Optimization methods for financial index tracking: From theory to practice. Foundations and Trends® in Optimization 3(3), 171–279.
- Chen, Zhe. 2003. Bayesian filtering: From Kalman filters to particle filters, and beyond. Statistics 182(1), 1–69. [CrossRef]
- Del Moral, Pierre, Arnaud Doucet, and Ajay Jasra. 2006, June. Sequential Monte Carlo Samplers. Journal of the Royal Statistical Society Series B: Statistical Methodology 68(3), 411–436.
- Duan, Jin-Chuan. 2019. Variable selection with big data based on zero norm and via sequential monte carlo. CompSciRN: Computational (Topic). [CrossRef]
- Gellert, Karol and Erik Schlögl. 2021, December. Parameter Learning and Change Detection Using a Particle Filter with Accelerated Adaptation. Risks 9(12), 228. [CrossRef]
- Rompotis, Gerasimos G. 2013. Actively vs. passively managed exchange traded funds. Aestimatio (6), 116–135.
- Ruf, Johannes and Kangjianan Xie. 2019. The impact of proportional transaction costs on systematically generated portfolios.
- Satpathy, Tanmay and Rushabh Shah. 2022, September. Sparse index tracking using sequential Monte Carlo. Quantitative Finance 22(9), 1579–1592. 1592.
- Speekenbrink, Maarten. 2016. A tutorial on particle filters. Journal of Mathematical Psychology 73, 140–152.
- Tibshirani, Robert. 1996. Regression shrinkage and selection via the lasso. Journal of the Royal Statistical Society Series B: Statistical Methodology 58(1), 267–288.
- Xu, Kelvin, Jimmy Ba, Ryan Kiros, Kyunghyun Cho, Aaron Courville, Ruslan Salakhudinov, Rich Zemel, and Yoshua Bengio. 2015. Show, attend and tell: Neural image caption generation with visual attention. In International conference on machine learning, pp. 2048–2057. PMLR.
| 1 | In Satpathy and Shah (2022) the sparse index problem is solved without considering any constraints on the . In such a case the optimal solution admits an explicit form. |
| 2 | Going forward particles, samples and permutations will be used interchangeably, i.e., each particle represents a particular subset of p of the n stocks comprising the index. |
| 3 | The proposal in MH algorithm has no relation to the proposal in the Importance Sampling step. |
Figure 1.
Index Returns for the best (SPX) and worst (HSI) performing cases, where the blue graph is the tracking portfolio and red is the index.
Figure 1.
Index Returns for the best (SPX) and worst (HSI) performing cases, where the blue graph is the tracking portfolio and red is the index.
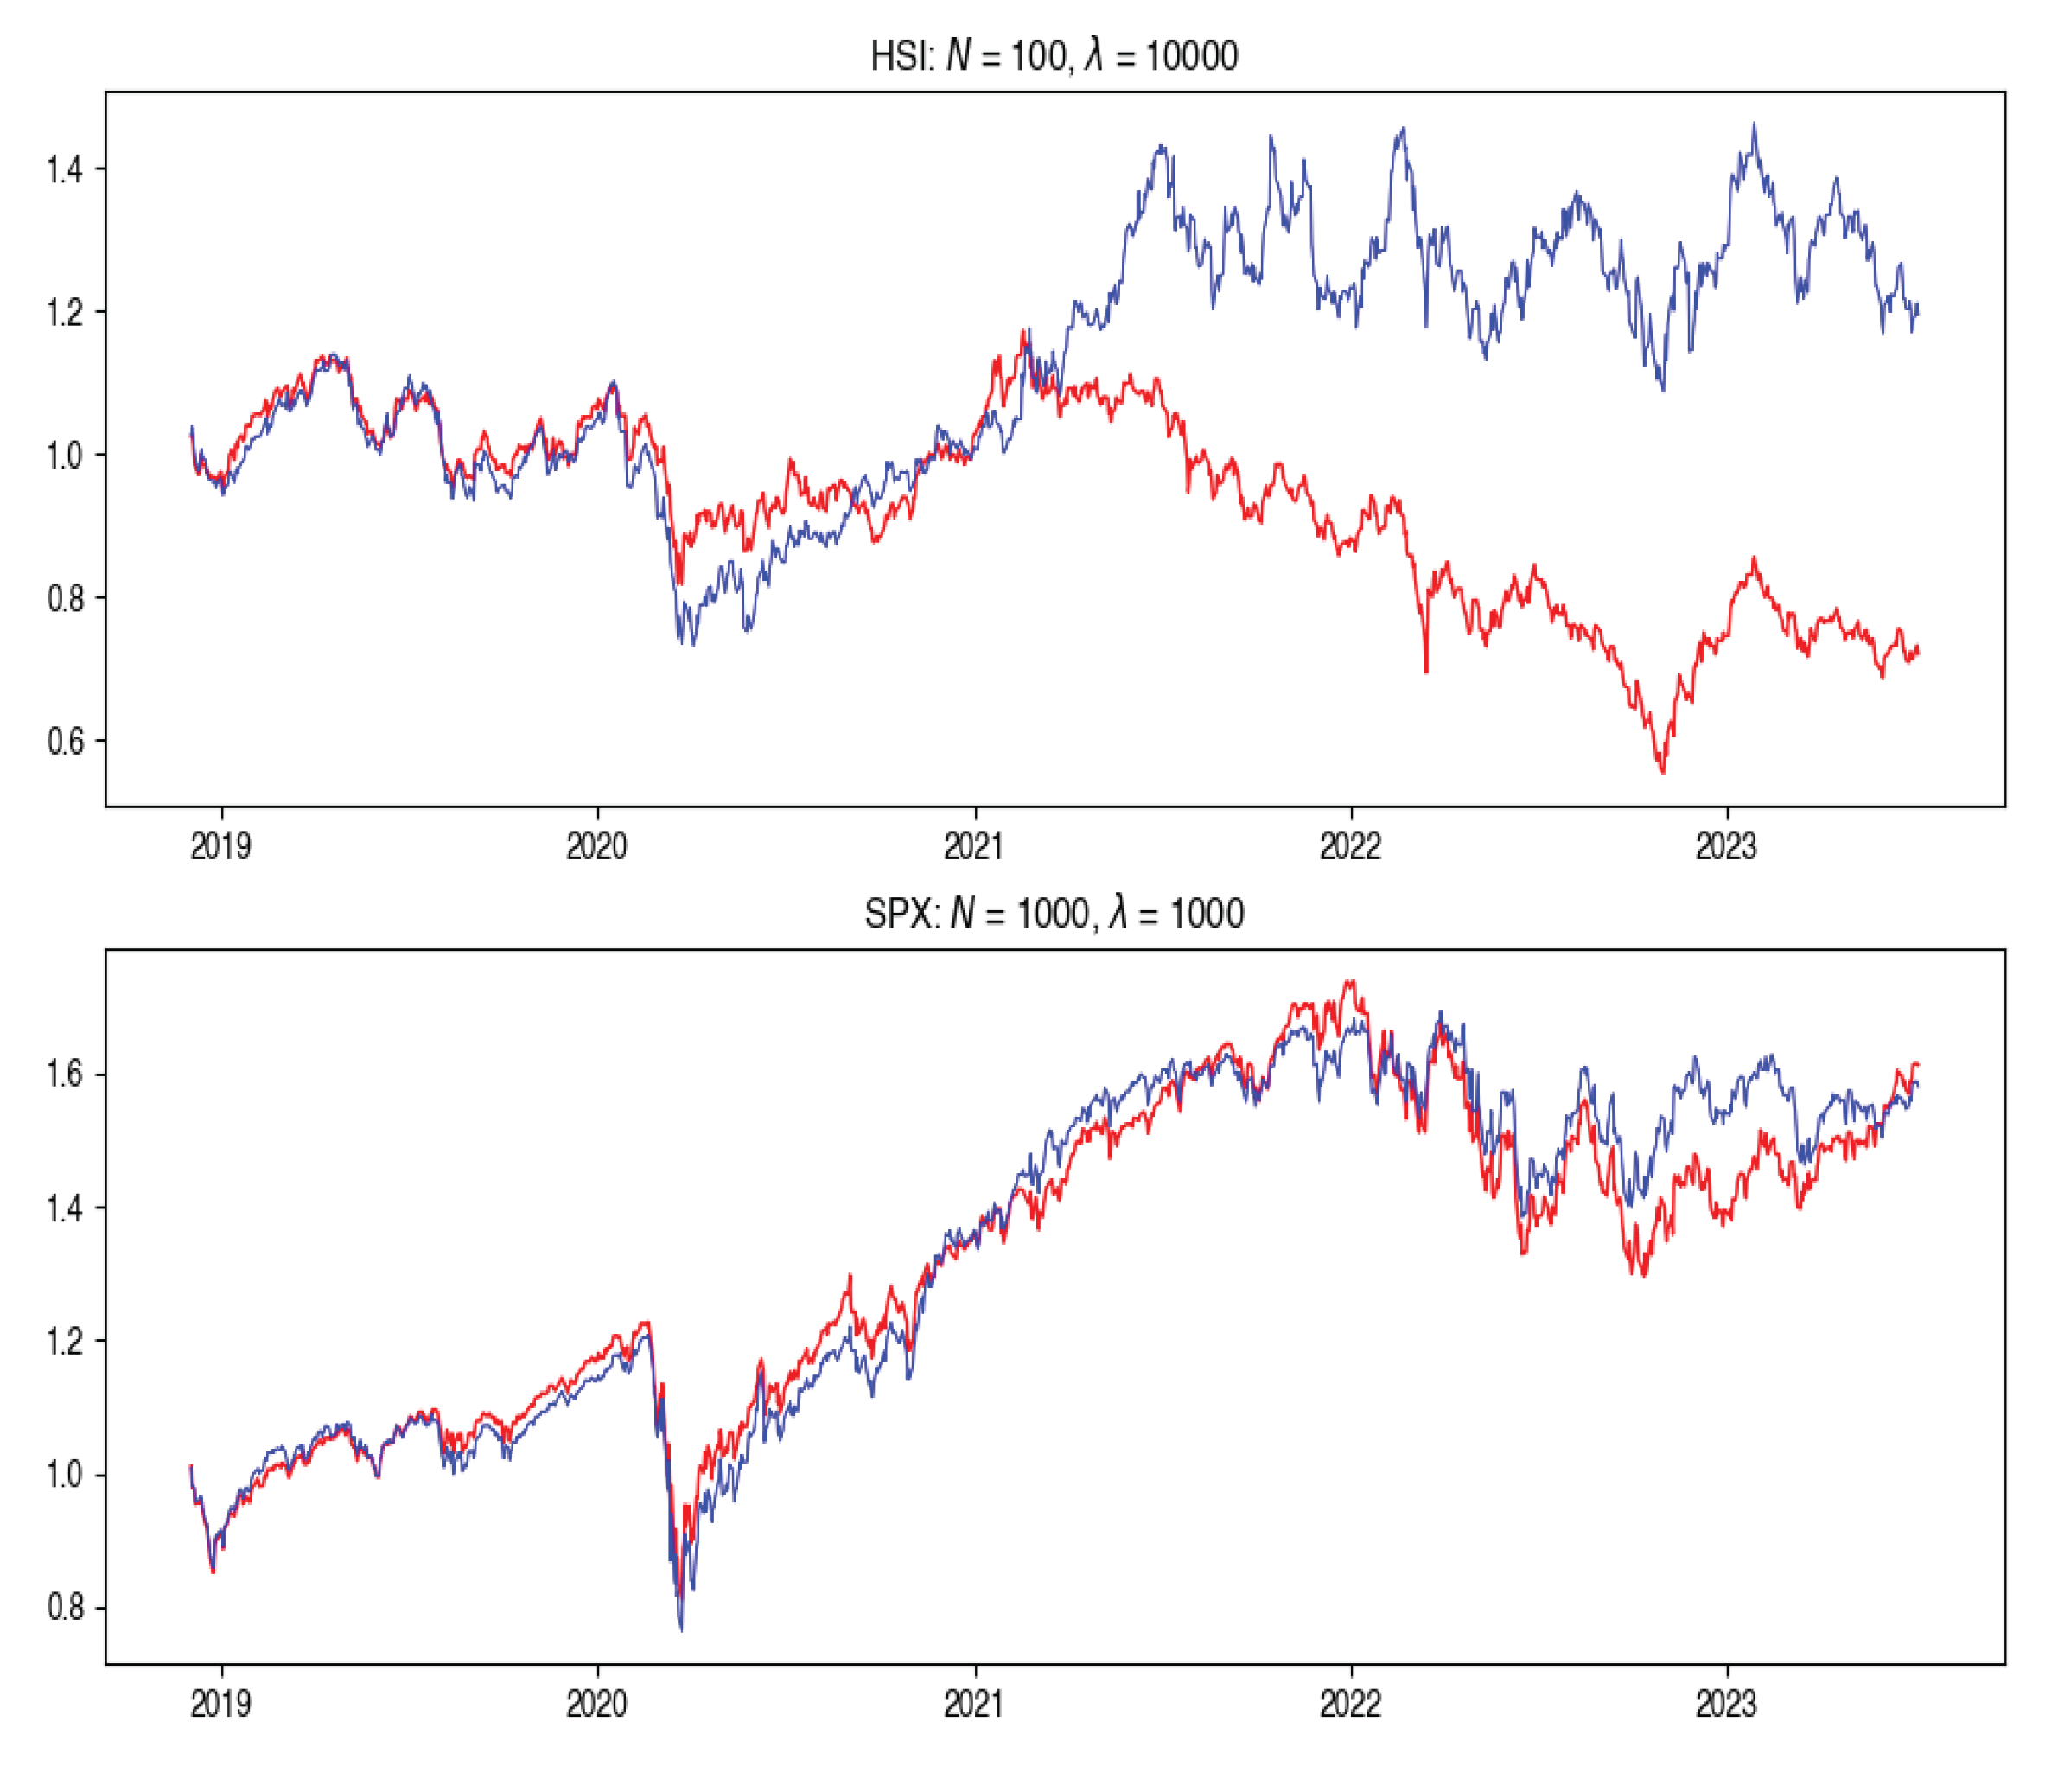
Figure 2.
Total Cost for each index and all cases of . Here, the green line represents , the orange line represents and the red line represents .
Figure 2.
Total Cost for each index and all cases of . Here, the green line represents , the orange line represents and the red line represents .
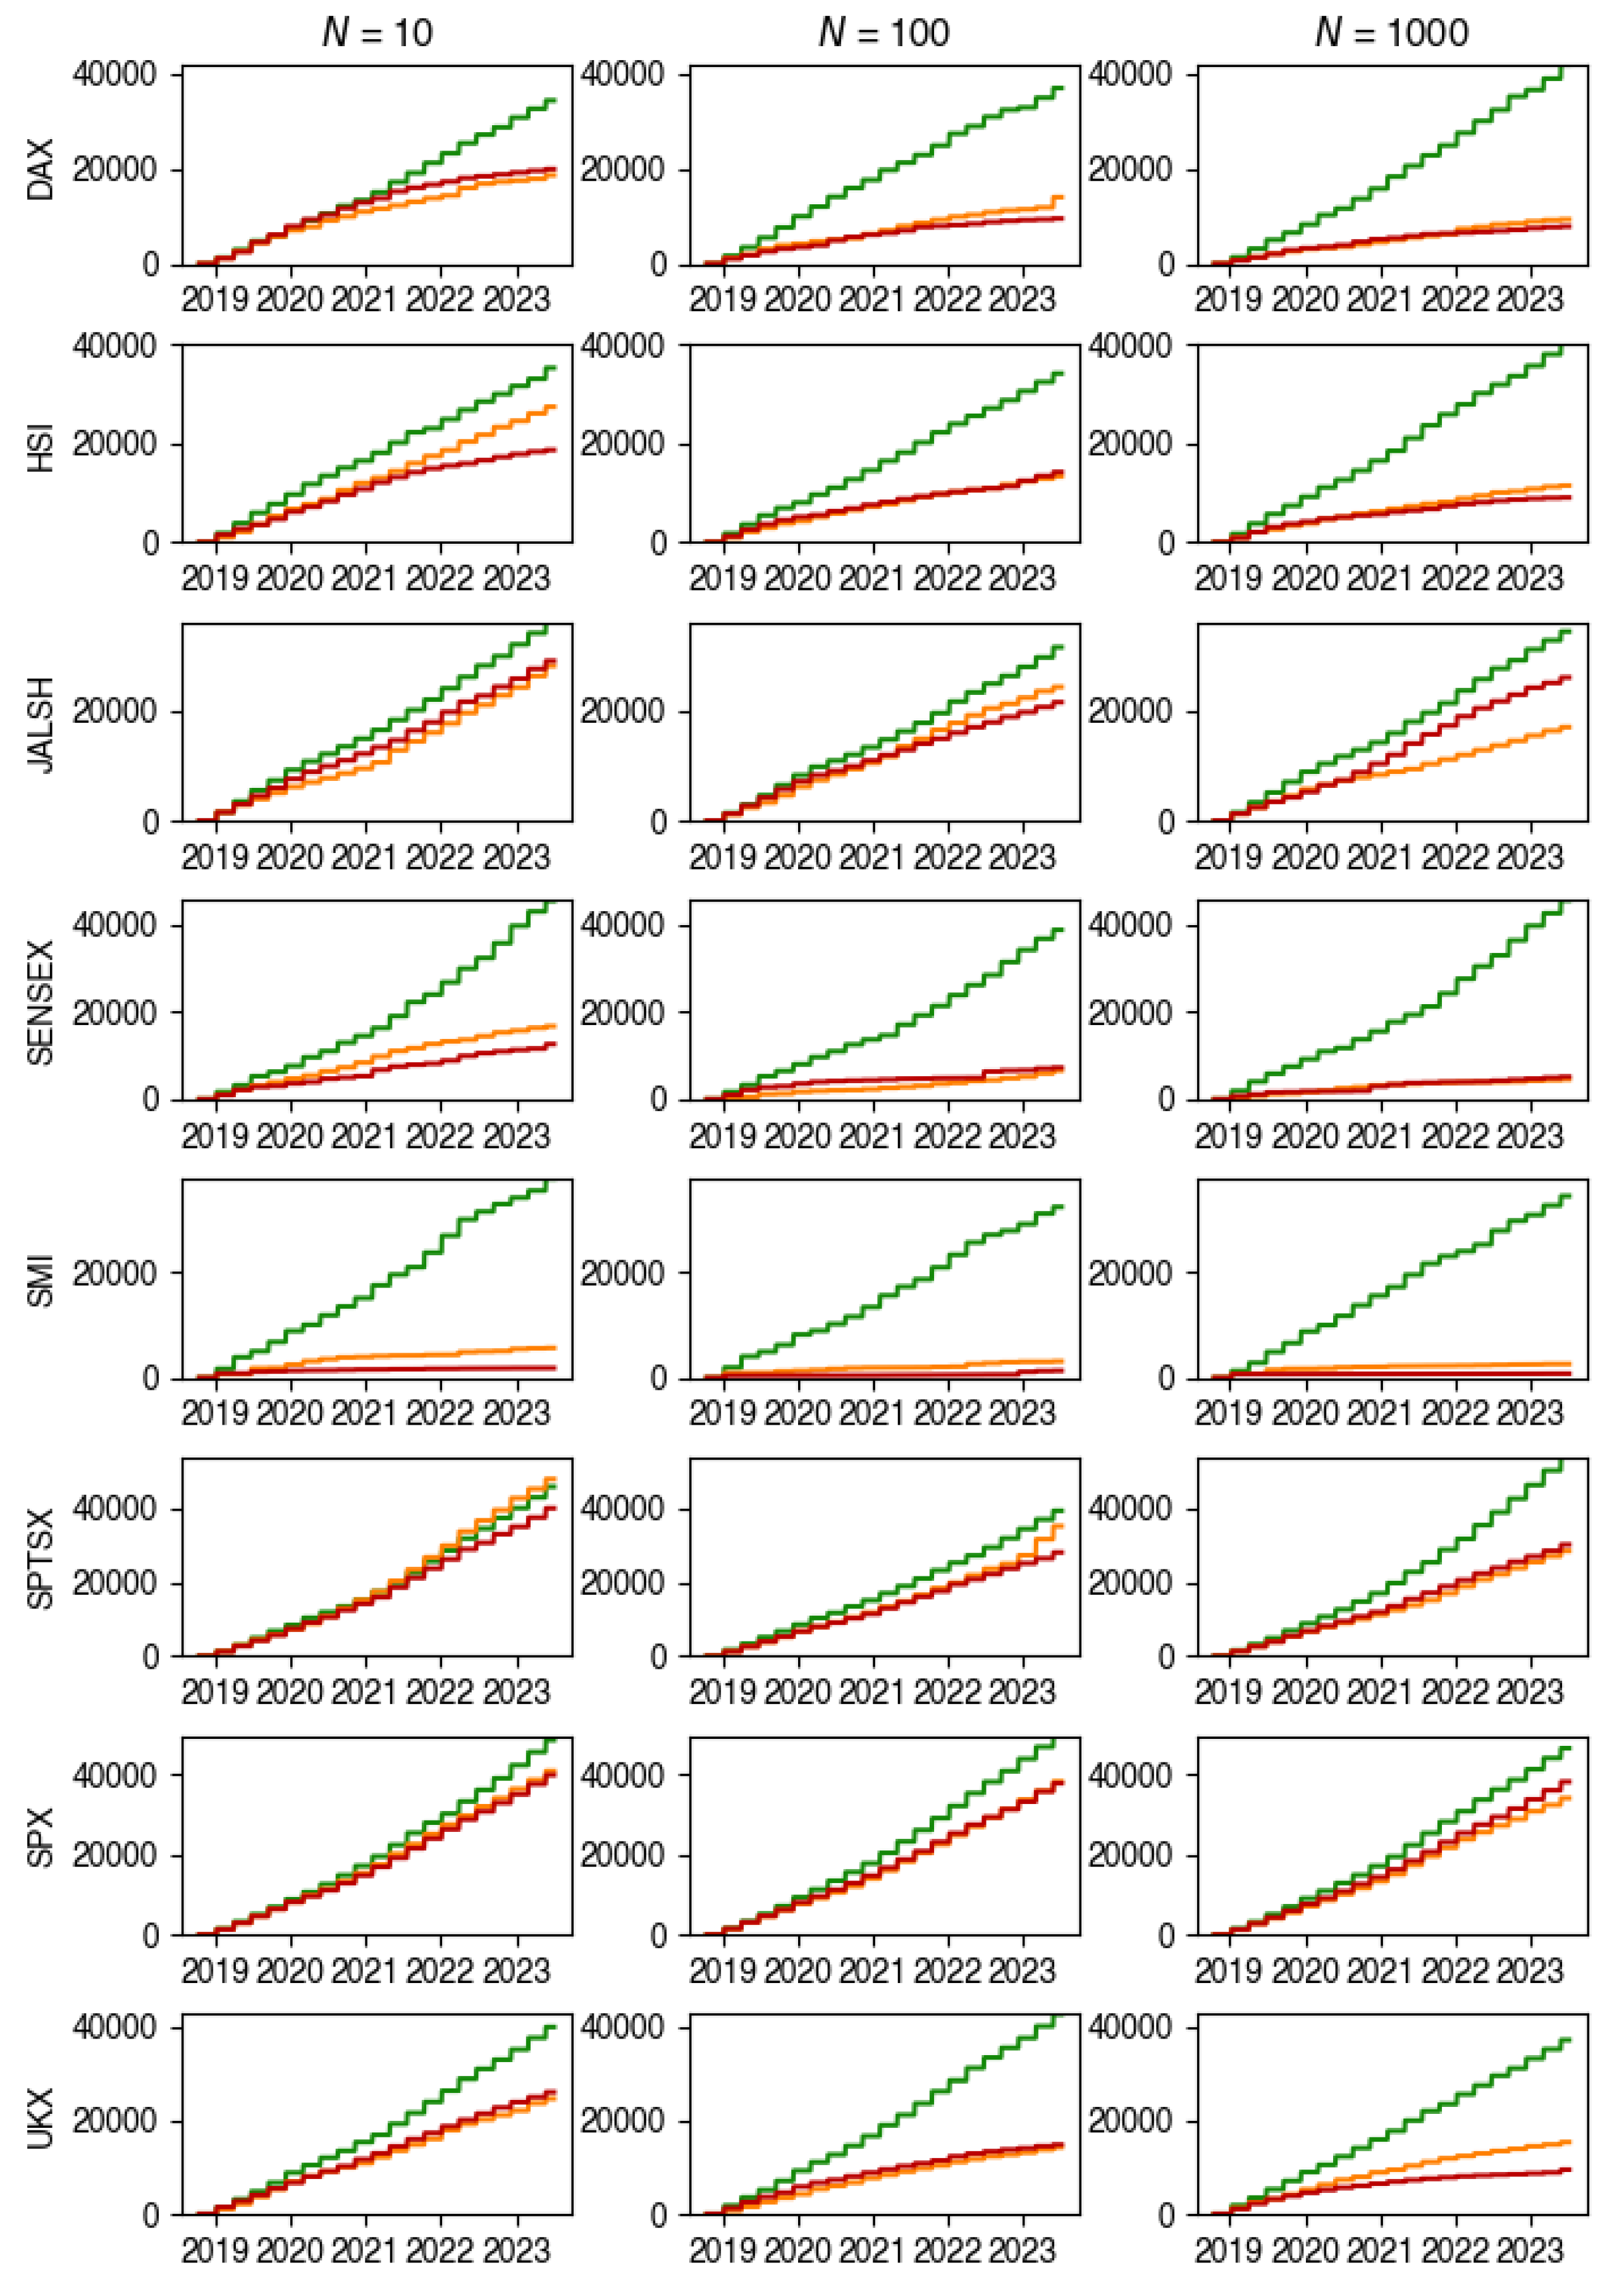
Figure 3.
Total Cost for the best (SMI) and worst (SPTSX) cases, where blue is the tracking portfolio and red is the index
Figure 3.
Total Cost for the best (SMI) and worst (SPTSX) cases, where blue is the tracking portfolio and red is the index
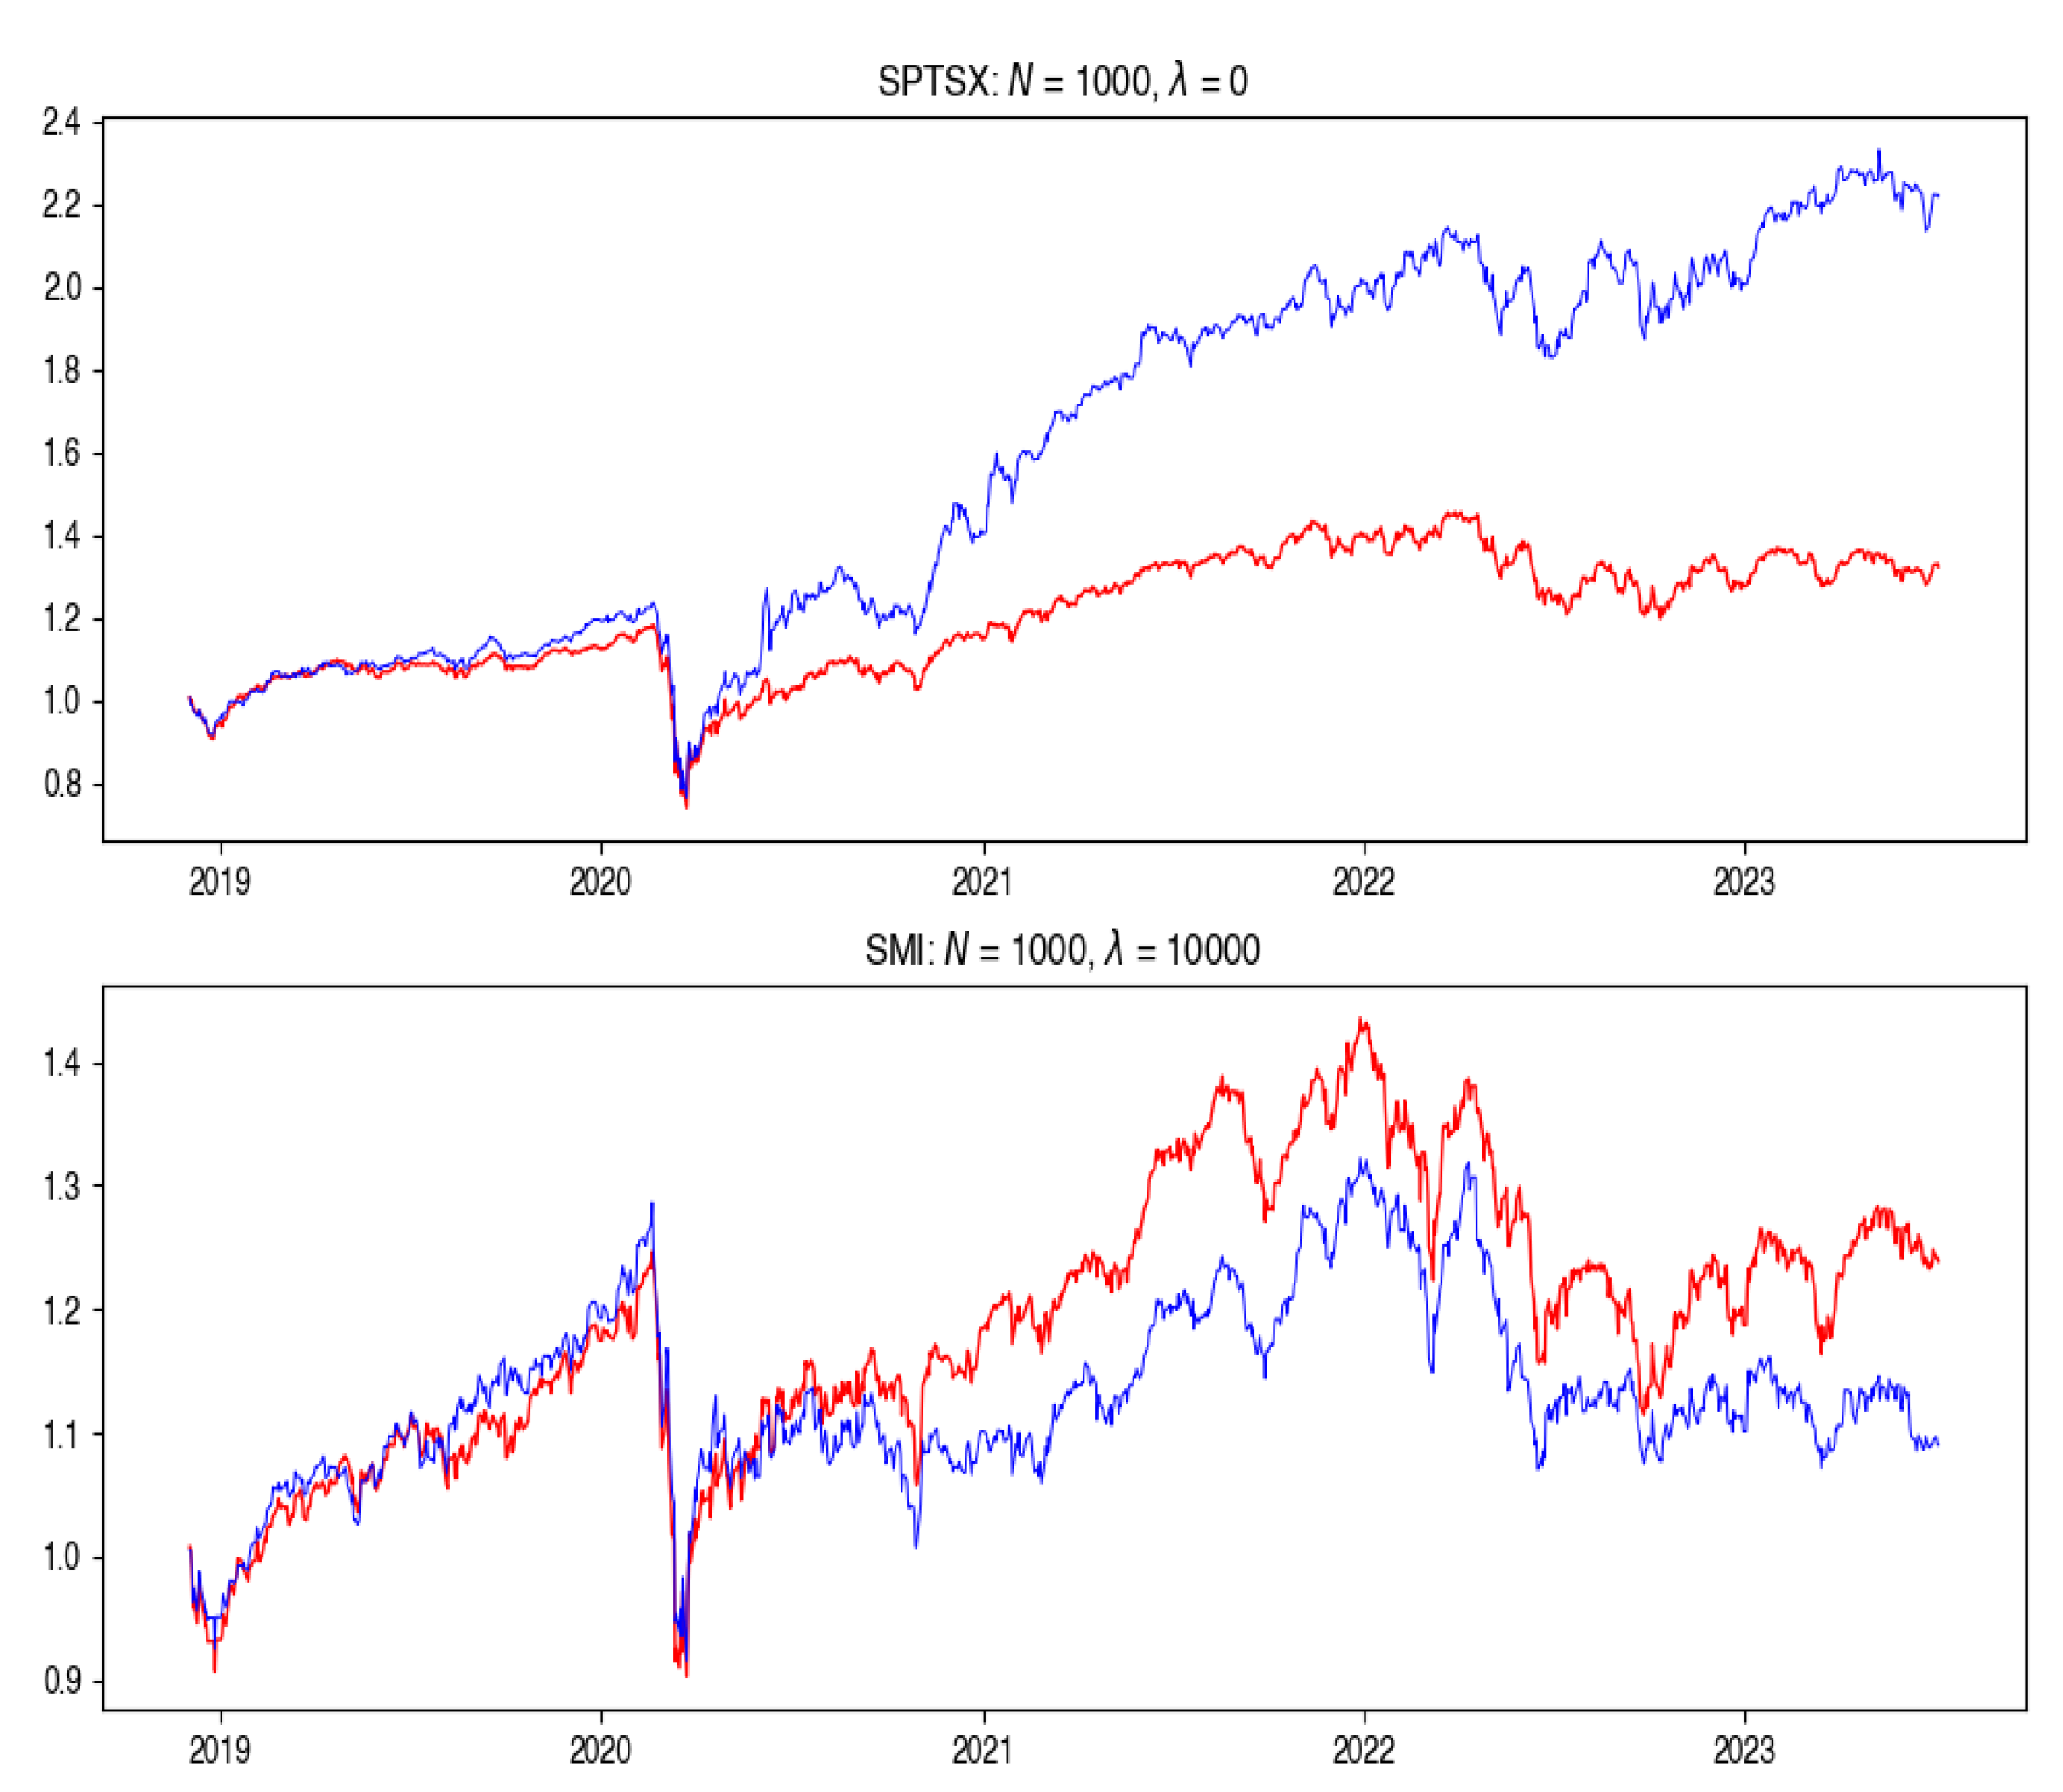
Figure 4.
Changes in the composition of the tracking portfolio for the DAX index.
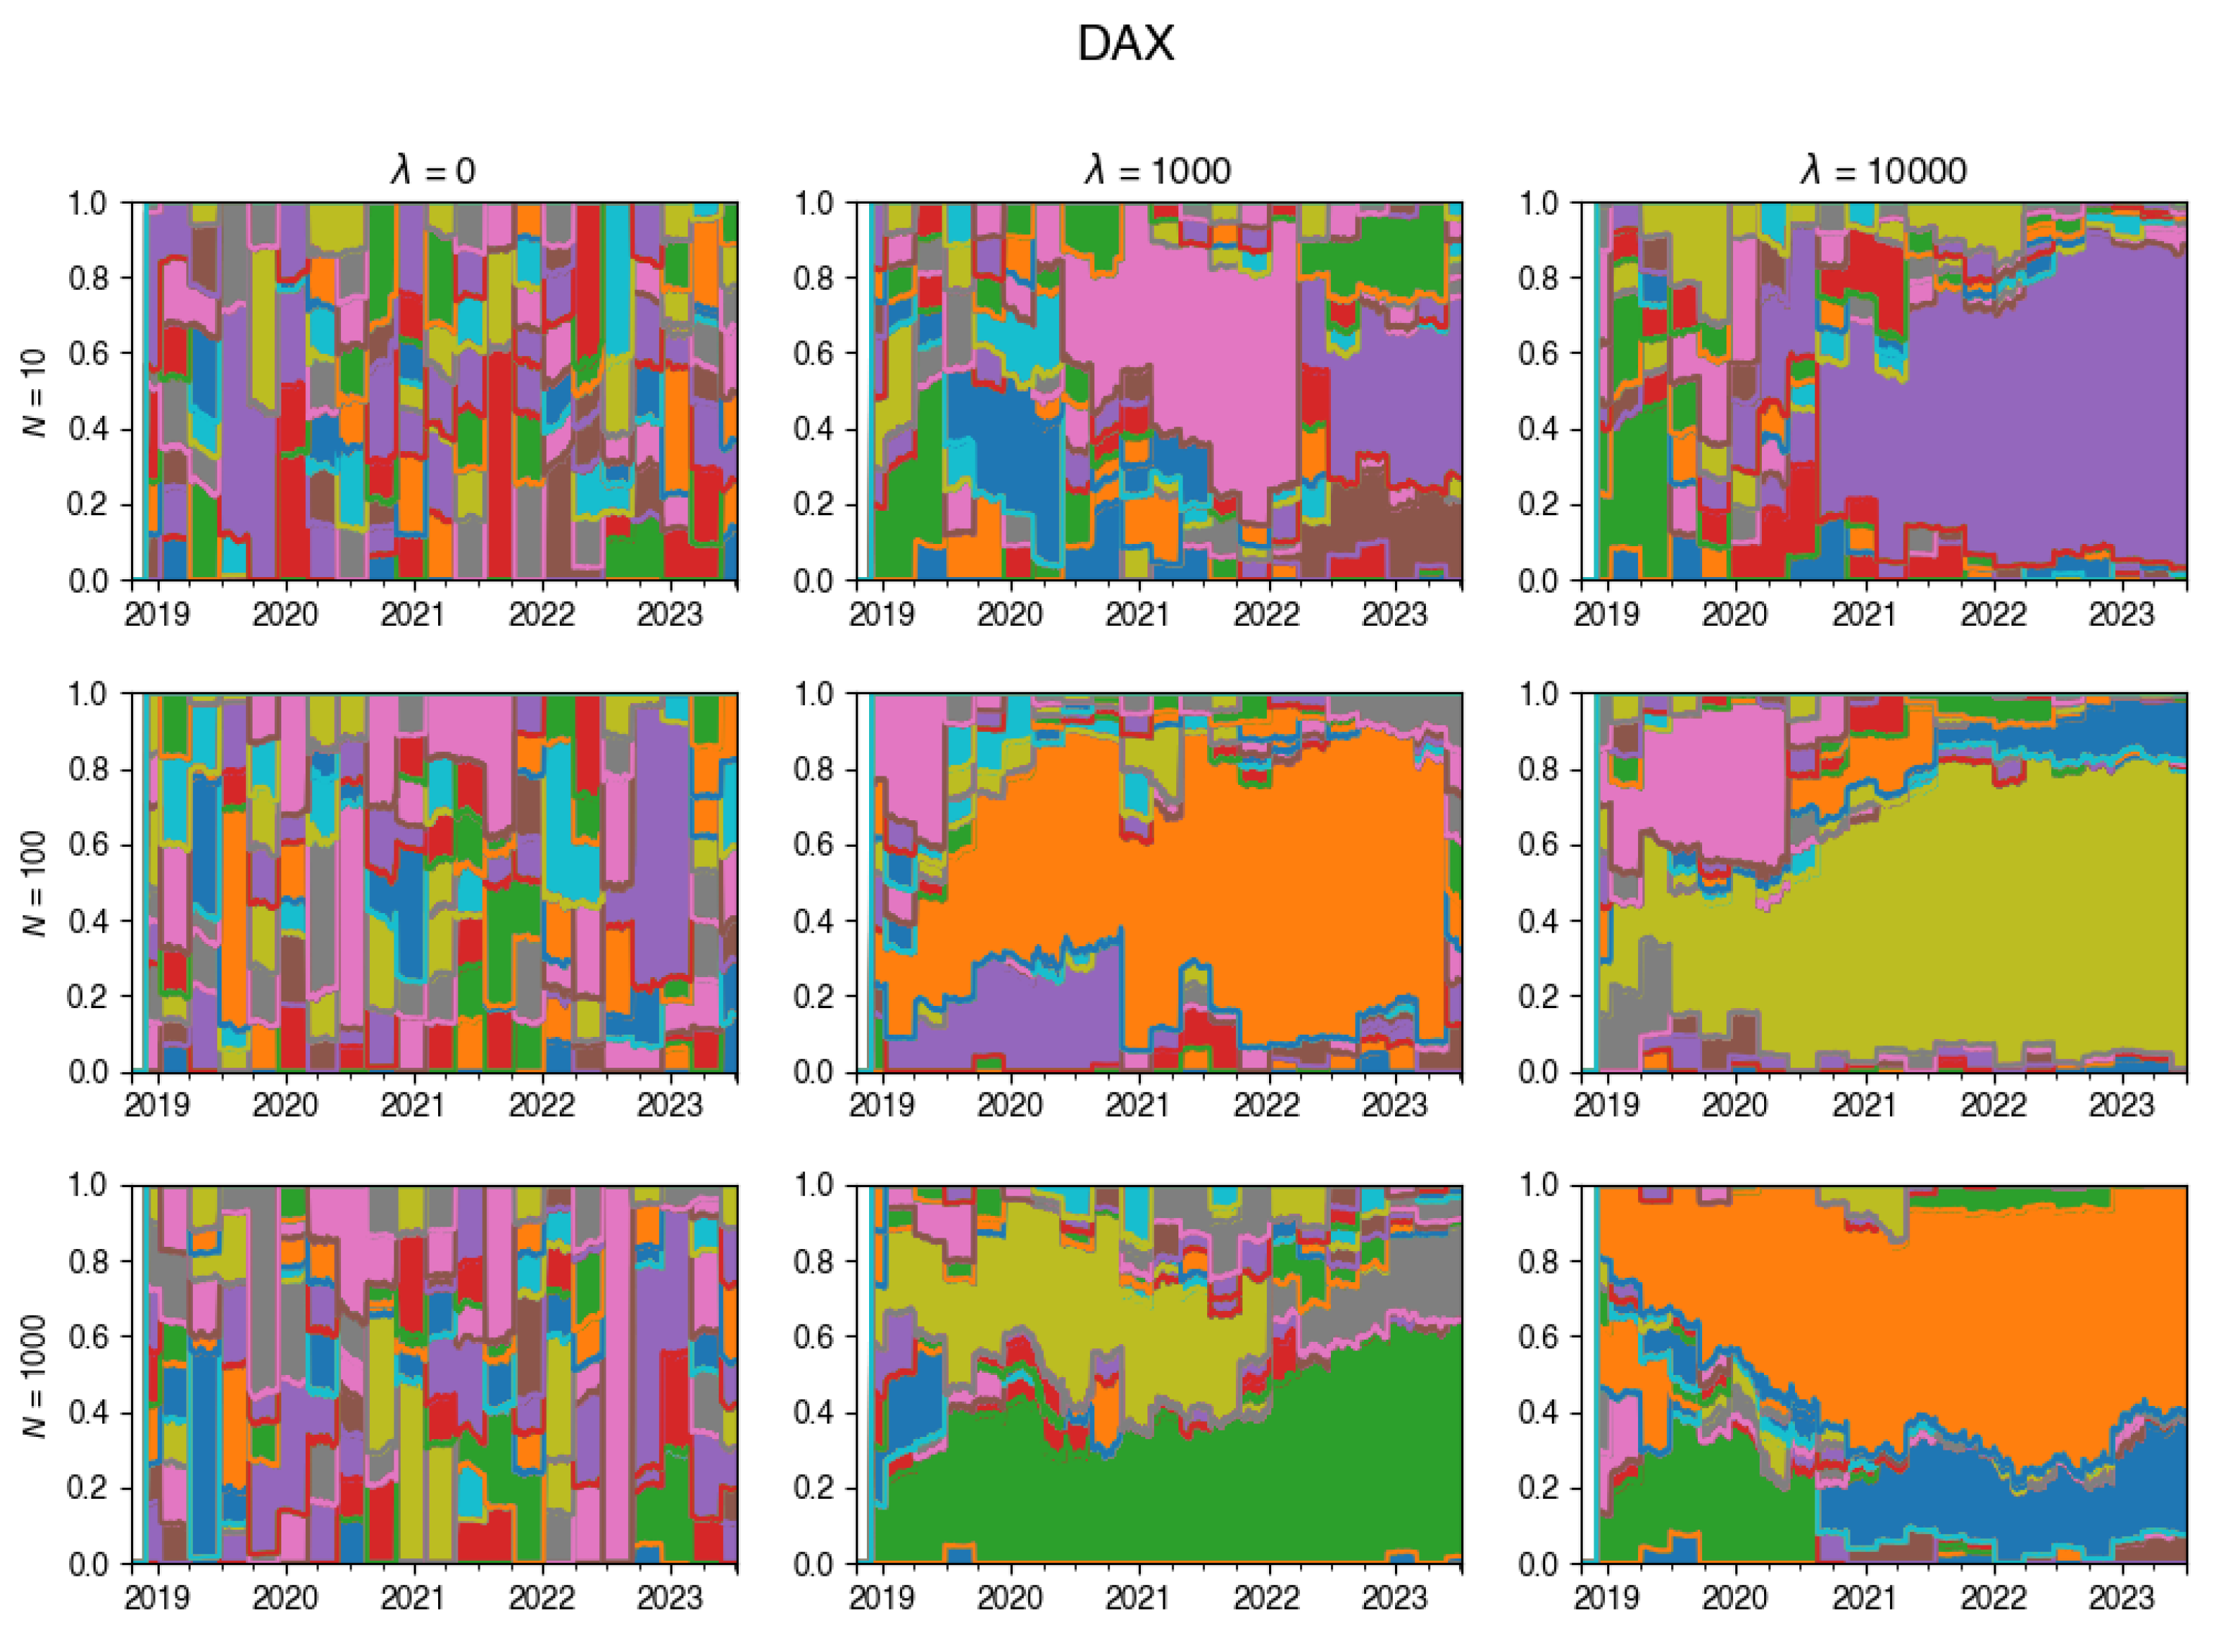
Figure 5.
Correlation heat map for all observed metrics for .
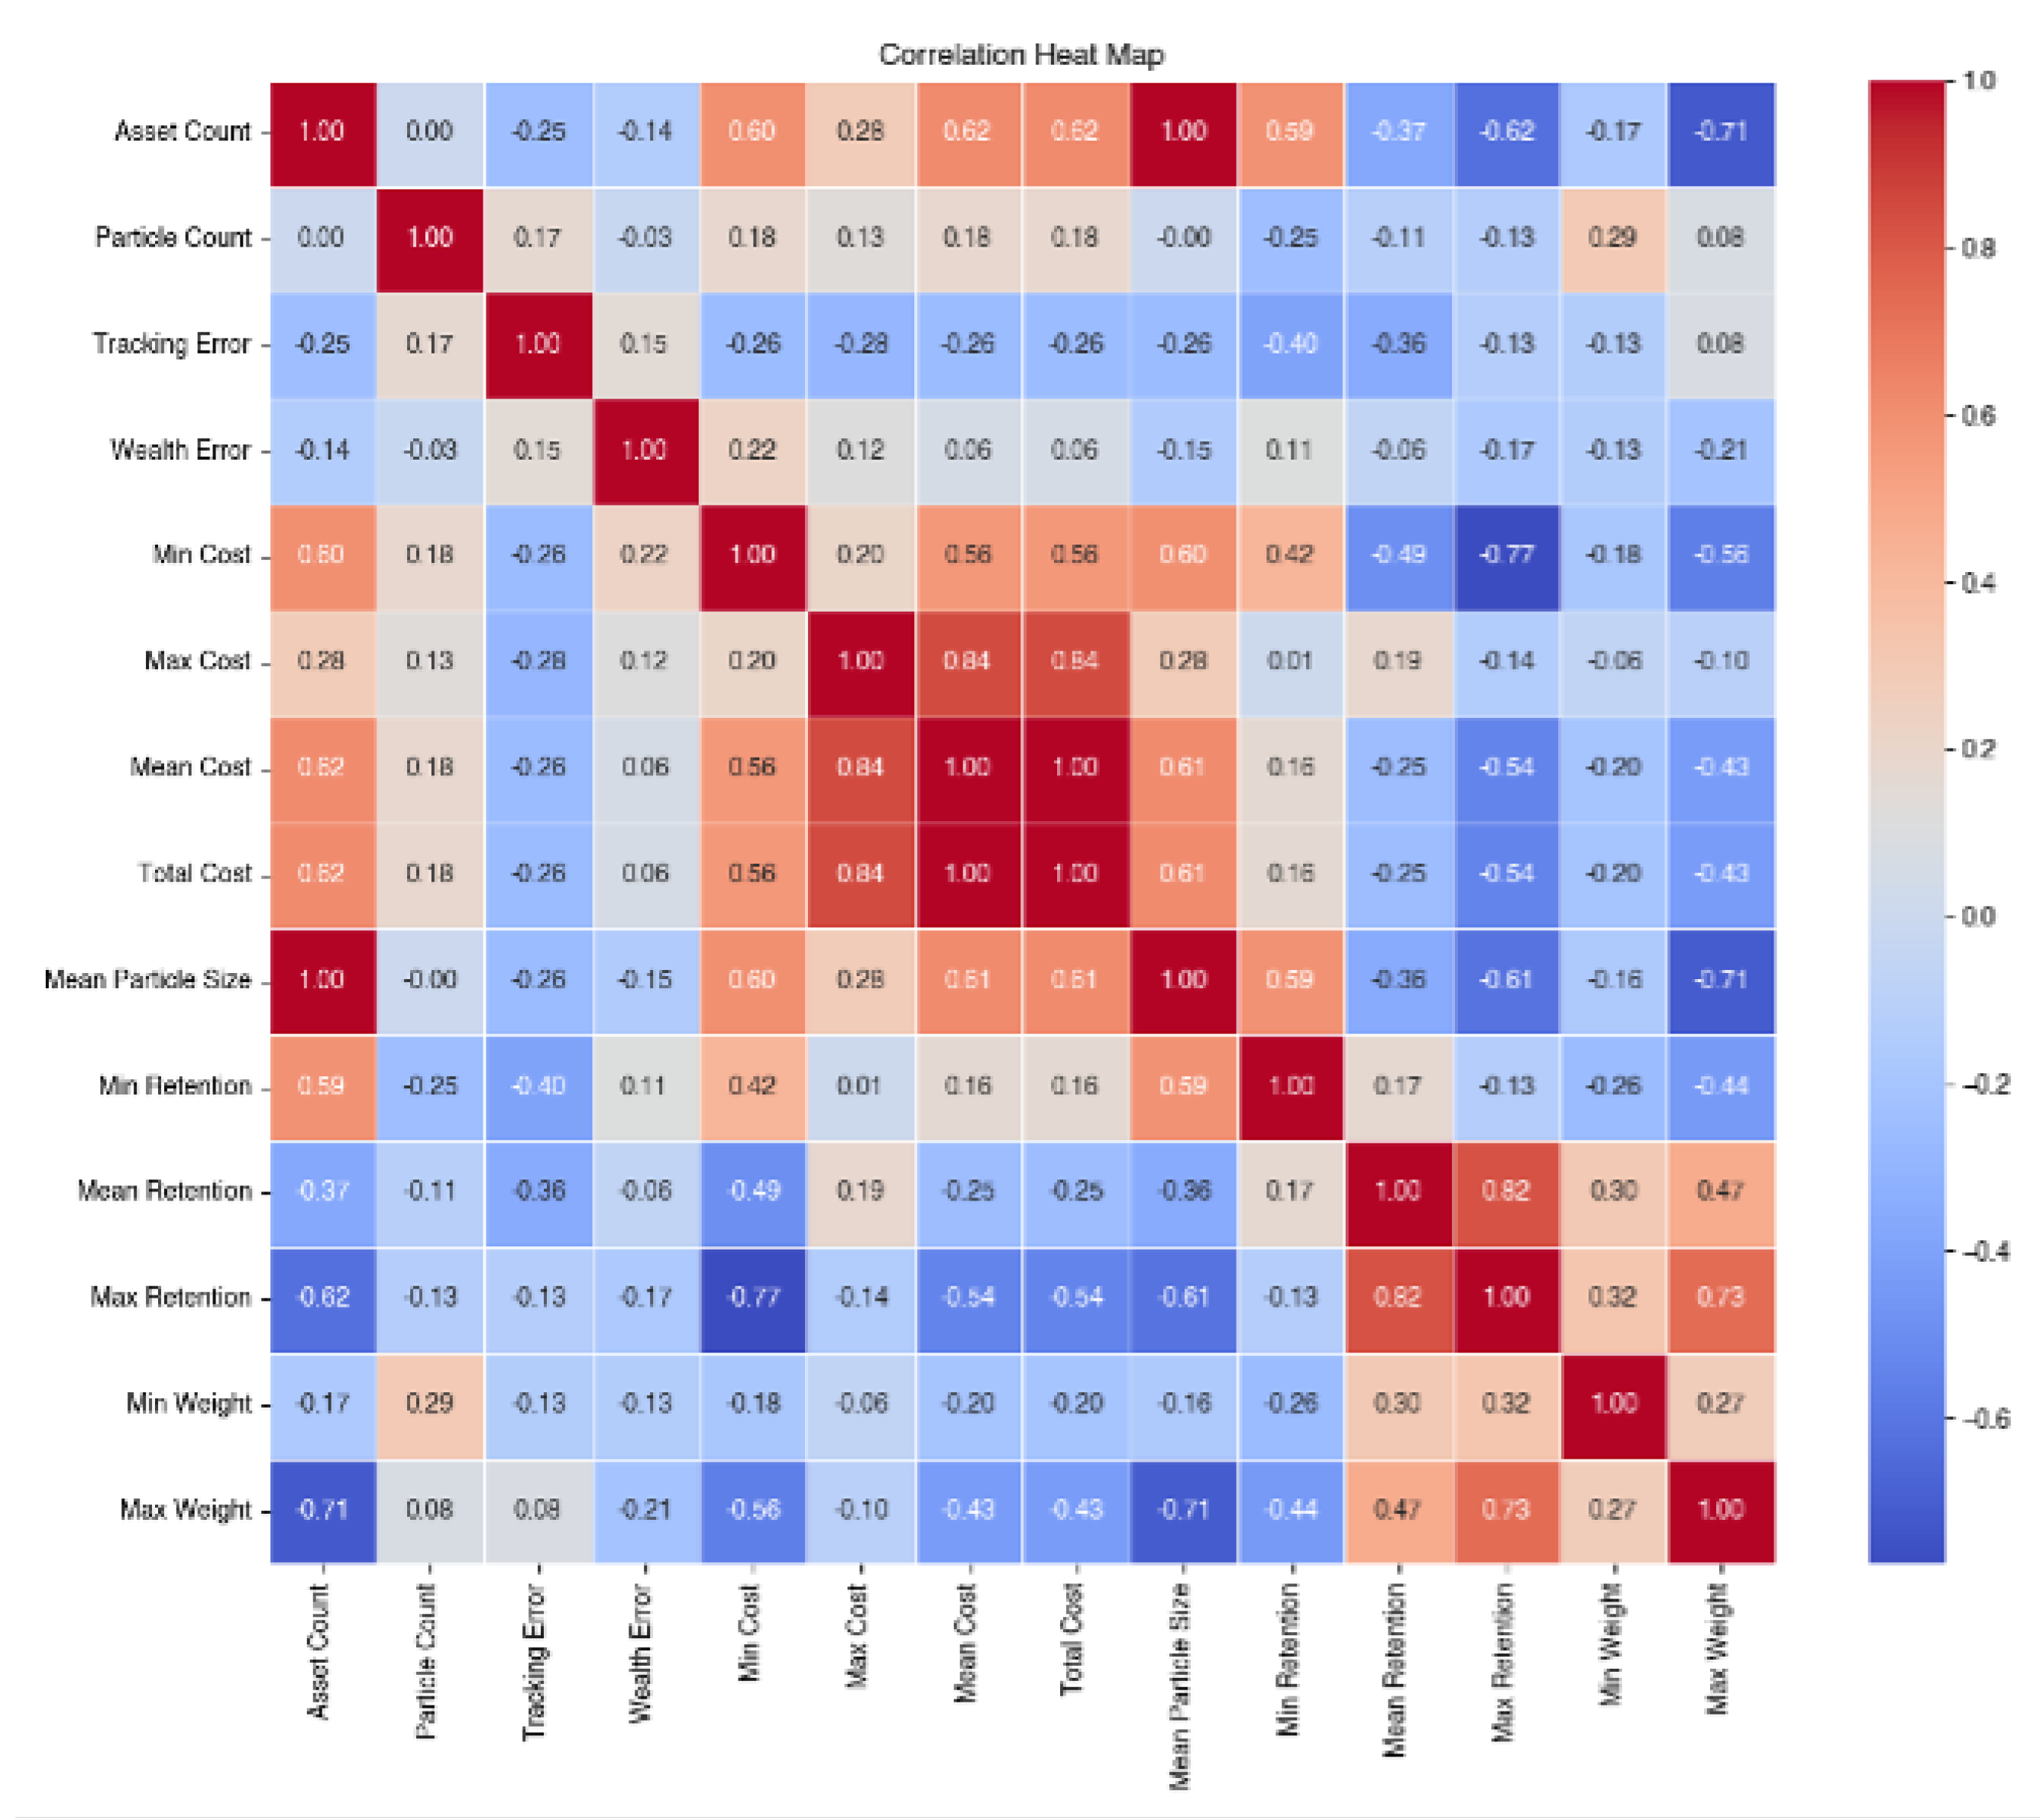
Figure 6.
Correlation heat map for all observed metrics for all s.
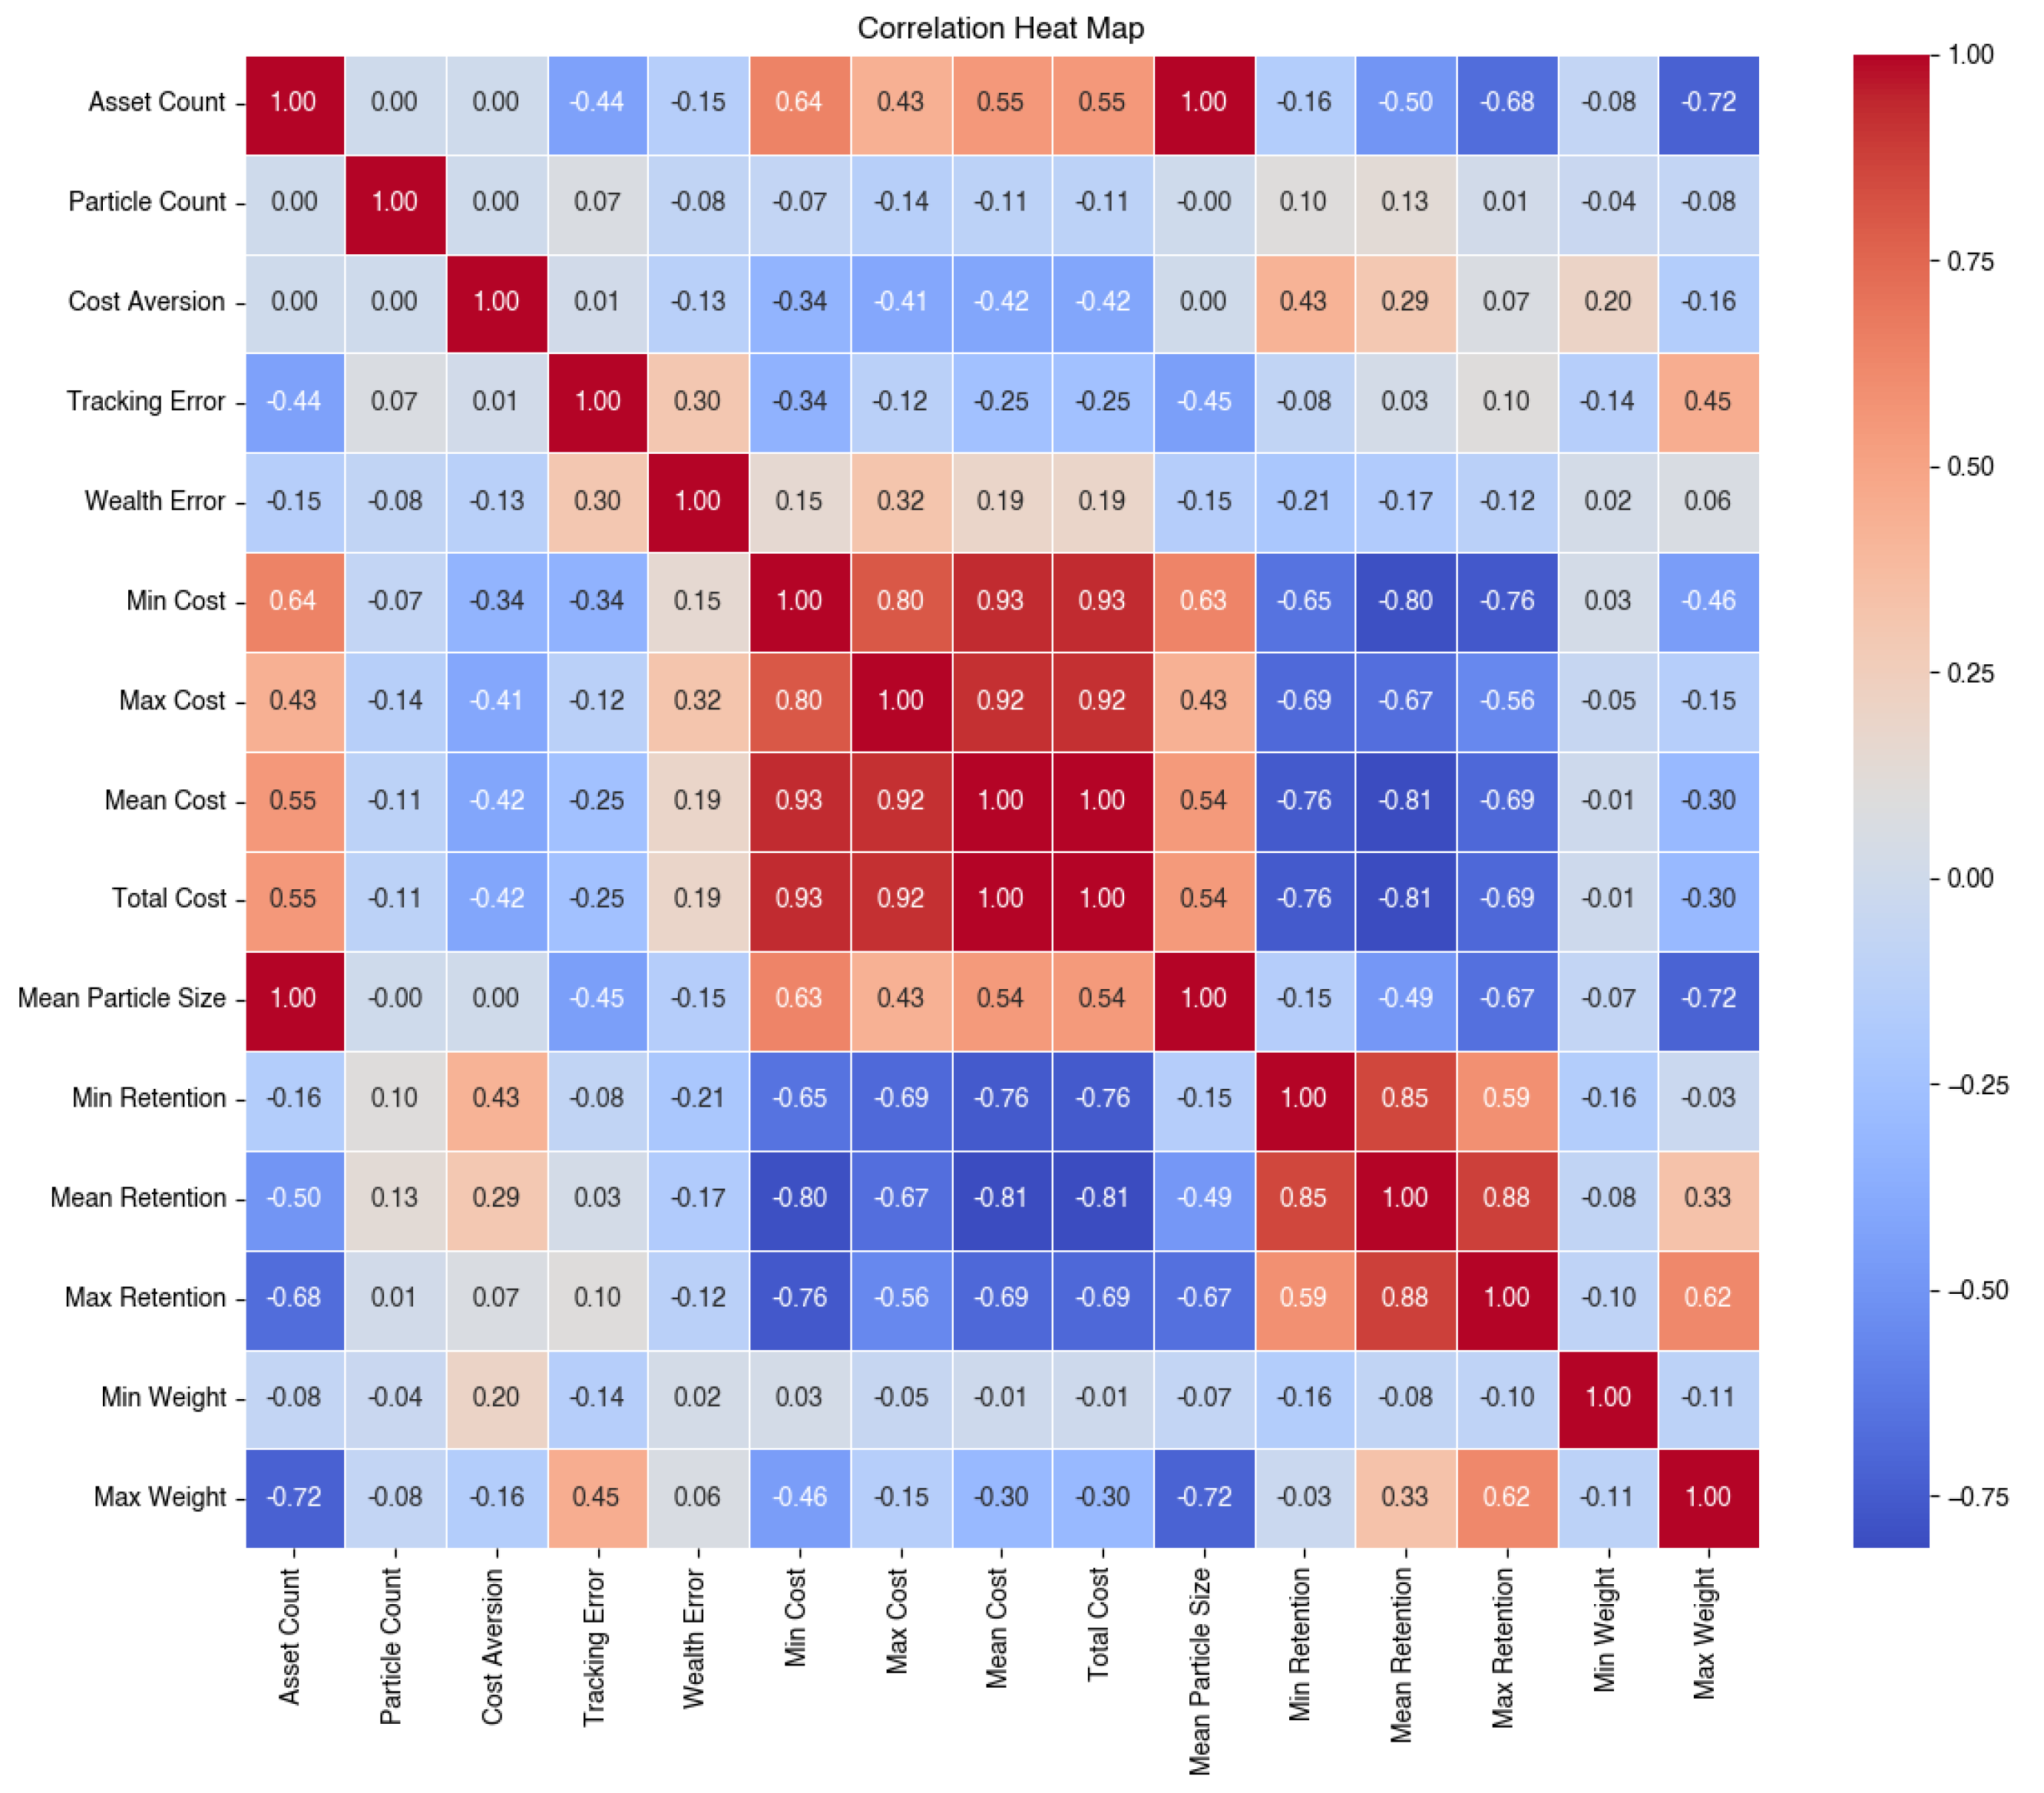
Figure 7.
Relationships observed for key metrics: Here, red lines refer to a positive correlation and blue lines refer to a negative correlation. Lines with more weight represent strong correlations (||>0.65). Lines with less weight represent weak correlations (0.3 < || < 0.65).
Figure 7.
Relationships observed for key metrics: Here, red lines refer to a positive correlation and blue lines refer to a negative correlation. Lines with more weight represent strong correlations (||>0.65). Lines with less weight represent weak correlations (0.3 < || < 0.65).
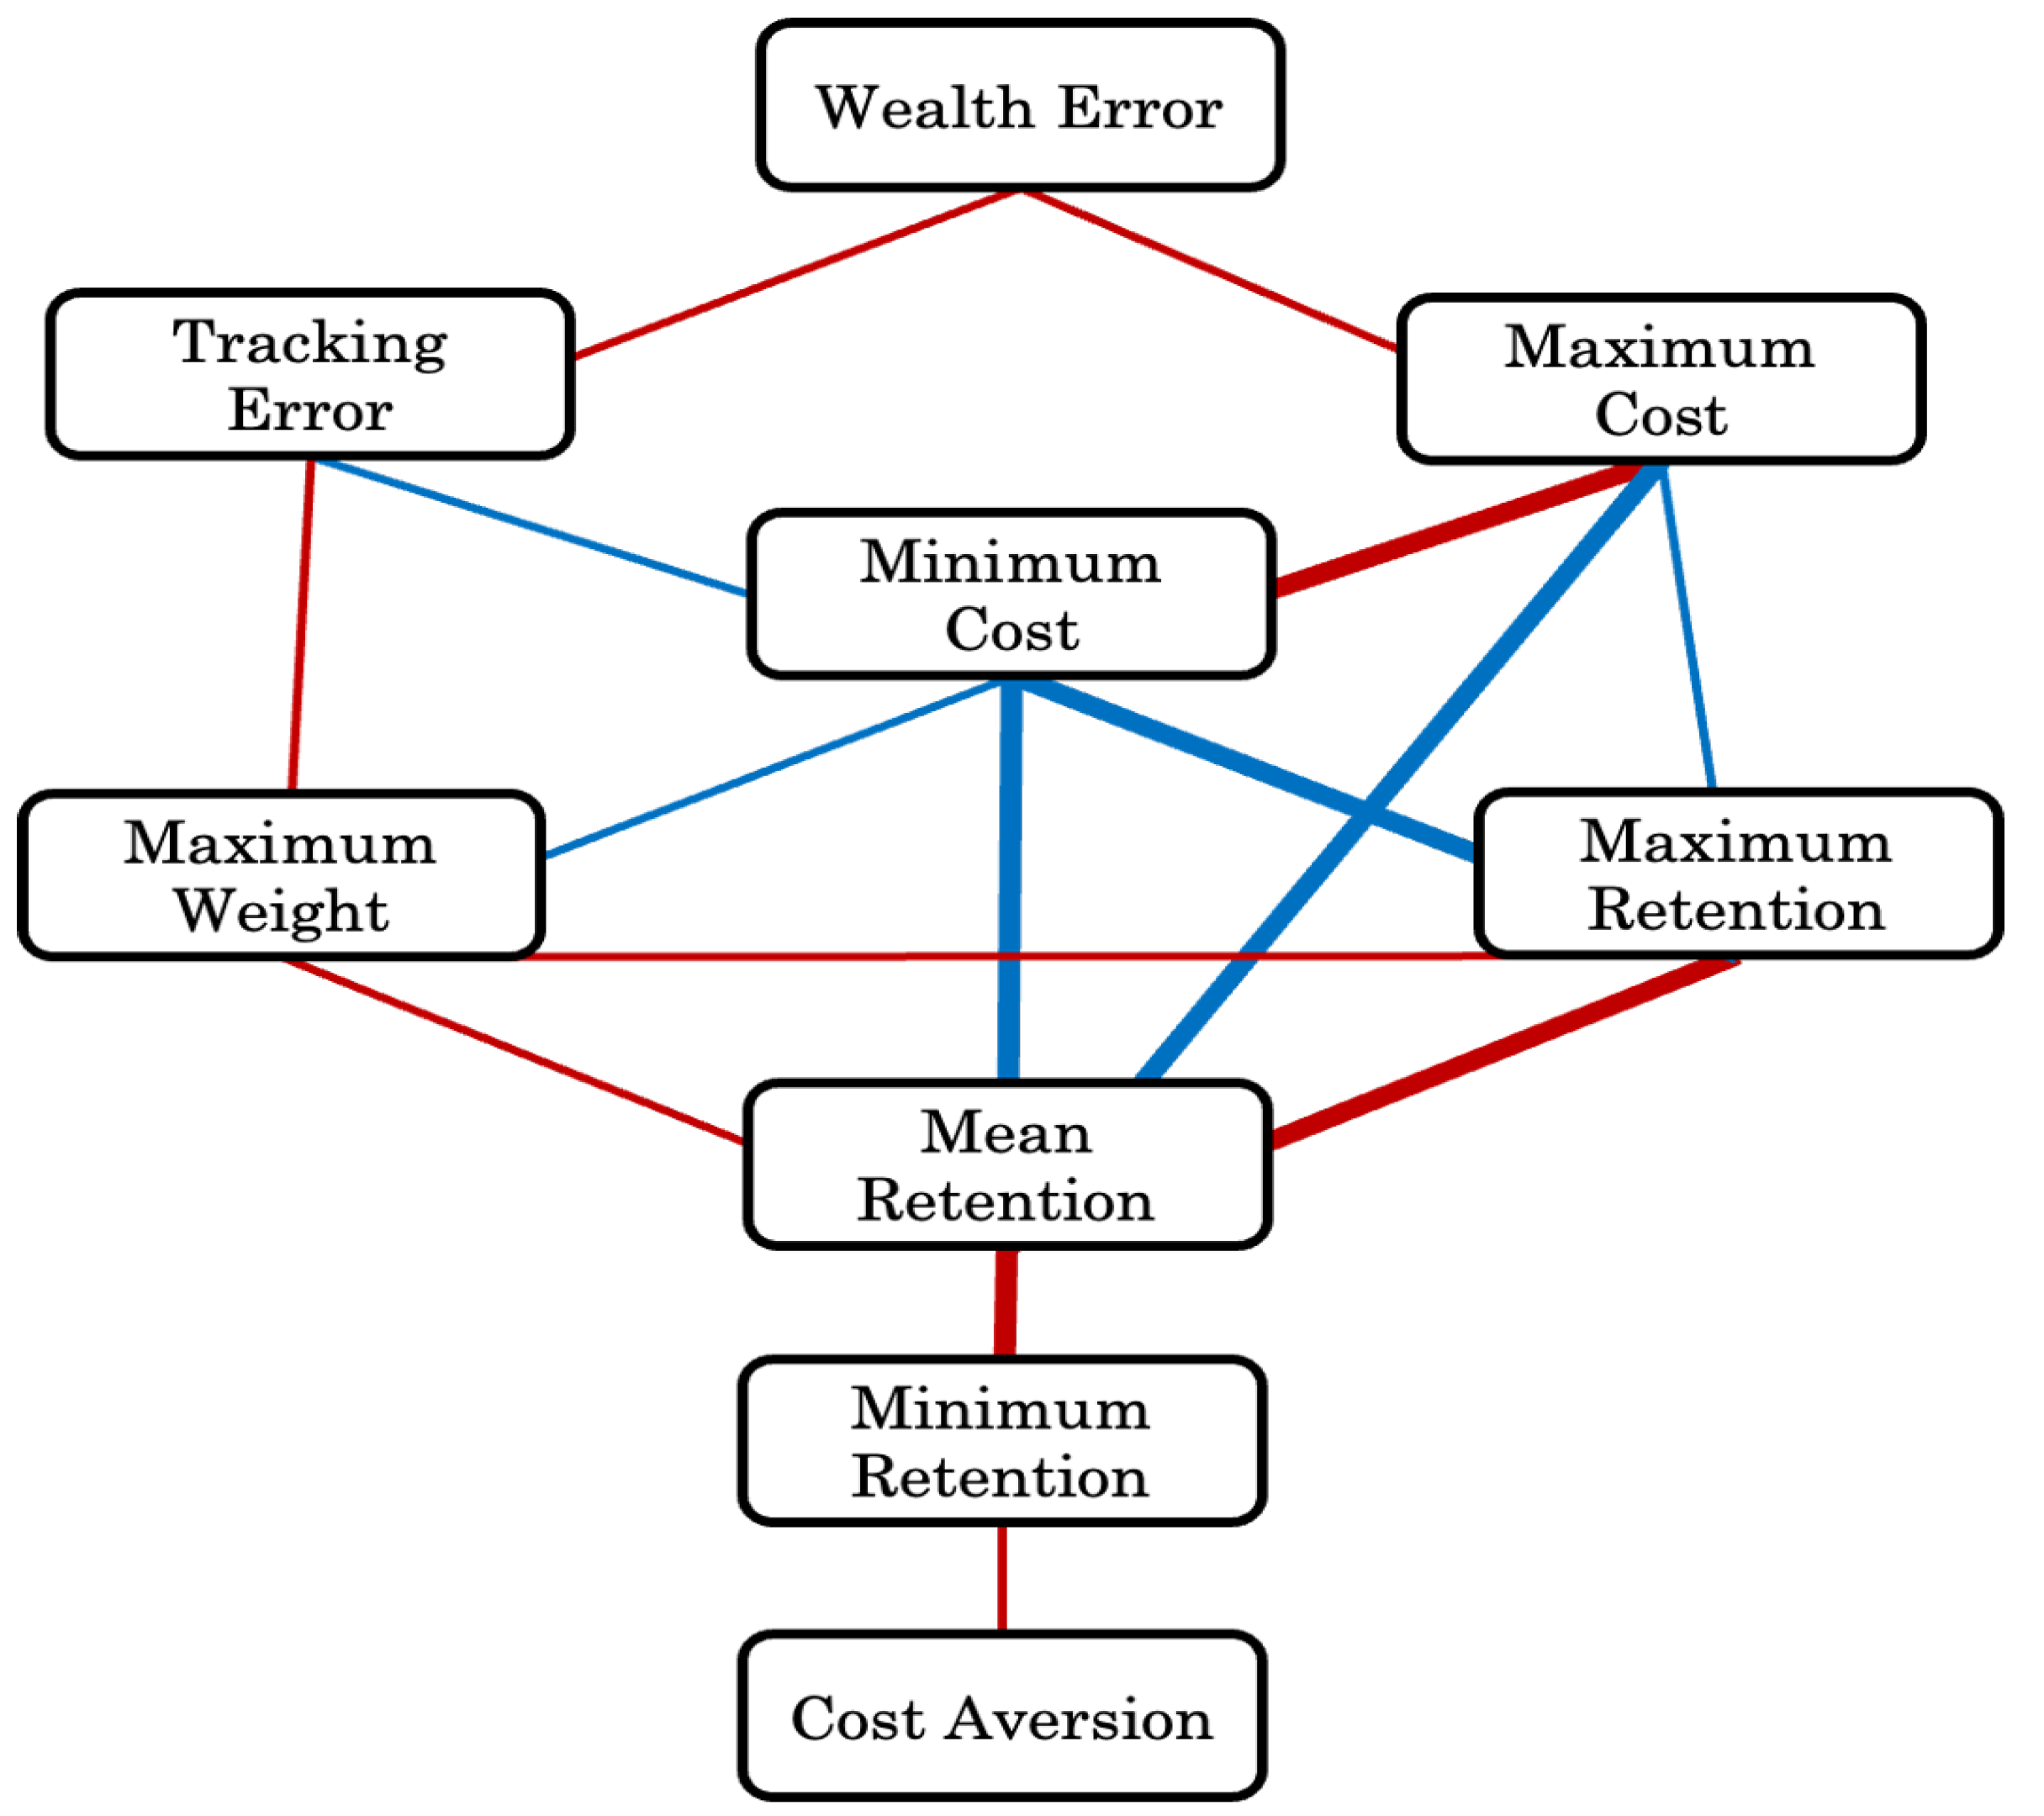

Table 1.
Hyperparameters chosen for implementation and comparison of model cases on real–world data.
Table 1.
Hyperparameters chosen for implementation and comparison of model cases on real–world data.
| Hyper-parameters | Values |
|---|---|
| Step Size () | 0.2 |
| Lookback Window Size (T) | 30 |
| ESS Threshold | |
| Number of Particles (n) | |
| Variance Explained | 95% |
| Rebalance Frequency (Observations) | 60 |
| Transaction Cost per Unit Nominal () | 0.001 |
| Transaction Cost Penalty () |
Table 2.
Equity indices used to test the performance of the algorithm.
| Index | Location | Number of Stocks | Sectors |
|---|---|---|---|
| SMI | Switzerland | 20 | Financials, industrials, pharmaceuticals and technology |
| SENSEX | India | 30 | Information technology, financial services, energy, and consumer goods. |
| DAX | Germany | 30 | Automotive, financial services, industrials and technology. |
| HSI | Hong Kong | 50 | Financials, real estate, technology and consumer goods. |
| UKX | United Kingdom | 100 | Financials, energy, consumer goods and pharmaceuticals. |
| JALSH | South Africa | 164 | Financials, mining, consumer goods and telecommunications. |
| SPTSX | Canada | 230 | Financials, energy, materials, and industrials. |
| SPX | United States | 500 | Financials, technology, healthcare and consumer discretionary. |
Table 3.
Tracking Error, Wealth Error and Transaction Costs Observed for all Combinations of Number of Particles (N) and Cost Aversions () for Each Index Observed.
Table 3.
Tracking Error, Wealth Error and Transaction Costs Observed for all Combinations of Number of Particles (N) and Cost Aversions () for Each Index Observed.
| Tracking Error | Wealth Error | Total Cost | |||||||
|---|---|---|---|---|---|---|---|---|---|
| N = 10 | 0.59877% | 0.58457% | 0.59178% | 17.27785% | 16.36773% | 13.40419% | 40393.76 | 26249.92 | 23510.09 |
| DAX | 0.58689% | 0.72071% | 0.76259% | 18.71743% | 26.21527% | 11.35055% | 34235.95 | 18562.46 | 19843.48 |
| HSI | 0.82953% | 0.63888% | 0.69552% | 12.35483% | 10.12154% | 10.09875% | 35225.75 | 27373.53 | 18640.06 |
| JALSH | 0.64292% | 0.62397% | 0.69927% | 17.15719% | 15.79817% | 20.58057% | 36106.94 | 28107.81 | 29007.45 |
| SENSEX | 0.61286% | 0.67109% | 0.74528% | 16.08276% | 19.30123% | 30.29464% | 45328.63 | 16664.50 | 12578.89 |
| SMI | 0.50931% | 0.55798% | 0.57527% | 29.17910% | 8.33662% | 5.28817% | 37639.89 | 5636.16 | 1827.69 |
| SPTSX | 0.54980% | 0.57193% | 0.39170% | 17.28082% | 35.47859% | 20.98324% | 45940.40 | 48004.04 | 40105.69 |
| SPX | 0.57546% | 0.38831% | 0.37443% | 9.85225% | 4.74101% | 4.52234% | 48630.53 | 40897.98 | 39905.47 |
| UKX | 0.48338% | 0.50373% | 0.49014% | 17.59846% | 10.94941% | 4.11529% | 40042.00 | 24752.89 | 26171.98 |
| N = 100 | 0.65428% | 0.68345% | 0.67622% | 13.24902% | 14.64676% | 9.74140% | 38163.94 | 18630.72 | 16815.02 |
| DAX | 0.69572% | 0.83409% | 0.83155% | 12.95641% | 7.62099% | 6.69474% | 36843.25 | 13963.39 | 9471.72 |
| HSI | 0.81485% | 0.77457% | 1.08637% | 7.70339% | 6.42025% | 23.29781% | 34100.34 | 13288.64 | 14176.46 |
| JALSH | 0.76951% | 0.81020% | 0.77314% | 31.79696% | 6.70502% | 6.78045% | 31491.44 | 24276.11 | 21502.14 |
| SENSEX | 0.67007% | 0.68515% | 0.87292% | 9.05378% | 34.55286% | 7.30683% | 38671.82 | 6561.78 | 7200.32 |
| SMI | 0.51122% | 0.47362% | 0.43846% | 4.21370% | 3.68650% | 10.42701% | 32318.57 | 3103.56 | 1326.33 |
| SPTSX | 0.59226% | 0.98857% | 0.40284% | 6.73261% | 44.14928% | 3.91737% | 39423.03 | 35252.99 | 28133.31 |
| SPX | 0.58038% | 0.41832% | 0.38740% | 8.34139% | 4.98613% | 3.90626% | 49695.05 | 38282.31 | 37832.97 |
| UKX | 0.60027% | 0.48307% | 0.61705% | 25.19396% | 9.05303% | 15.60073% | 42768.02 | 14316.99 | 14876.88 |
| N = 1000 | 0.66062% | 0.63942% | 0.65255% | 15.06630% | 10.34565% | 12.39240% | 41729.76 | 15367.46 | 15836.81 |
| DAX | 0.67222% | 0.90155% | 1.01459% | 6.95423% | 26.81817% | 7.27033% | 41729.35 | 9298.69 | 7814.12 |
| HSI | 0.84903% | 0.90031% | 0.98868% | 17.99268% | 9.28388% | 5.53880% | 40210.23 | 11448.09 | 9021.65 |
| JALSH | 0.78545% | 0.69222% | 0.79928% | 25.66035% | 12.01656% | 37.61821% | 34345.00 | 16989.90 | 25995.95 |
| SENSEX | 0.70163% | 0.78741% | 0.70523% | 6.79509% | 7.14030% | 8.94453% | 45435.92 | 4534.44 | 5113.80 |
| SMI | 0.57148% | 0.41061% | 0.41420% | 9.44854% | 6.38063% | 6.90988% | 34374.99 | 2601.58 | 778.90 |
| SPTSX | 0.65343% | 0.50946% | 0.42155% | 39.18594% | 4.76414% | 21.71314% | 53907.41 | 28532.57 | 30234.32 |
| SPX | 0.52266% | 0.36746% | 0.40129% | 3.65117% | 4.24413% | 7.47839% | 46589.27 | 34119.90 | 38219.30 |
| UKX | 0.52907% | 0.54635% | 0.47563% | 10.84243% | 12.11736% | 3.66587% | 37245.90 | 15414.52 | 9516.43 |
| AVERAGE | 0.63789% | 0.63582% | 0.64018% | 15.19773% | 13.78671% | 11.84600% | 40095.82 | 20082.70 | 18720.64 |
Table 4.
Portfolio retention under varying levels of the transaction cost penalty .
| Min Retention | Mean Retention | Max Retention | Max Weight | |||||||||
|---|---|---|---|---|---|---|---|---|---|---|---|---|
| 10 | 8.705% | 15.408% | 21.348% | 25.048% | 32.504% | 33.770% | 46.902% | 52.568% | 48.031% | 50.386% | 45.648% | 42.404% |
| DAX | 0.000% | 14.286% | 14.286% | 17.826% | 34.398% | 32.989% | 42.857% | 62.500% | 57.143% | 63.028% | 71.368% | 84.534% |
| HSI | 7.143% | 12.500% | 18.750% | 22.676% | 28.691% | 30.356% | 56.250% | 53.846% | 50.000% | 67.825% | 31.116% | 62.487% |
| JALSH | 12.500% | 16.000% | 12.000% | 21.952% | 27.401% | 26.963% | 38.462% | 34.615% | 38.462% | 20.843% | 34.718% | 16.469% |
| SENSEX | 0.000% | 16.667% | 33.333% | 30.961% | 43.818% | 45.447% | 50.000% | 66.667% | 66.667% | 56.195% | 74.368% | 64.280% |
| SMI | 16.667% | 25.000% | 50.000% | 44.474% | 55.088% | 59.211% | 80.000% | 100.000% | 75.000% | 85.063% | 84.874% | 65.526% |
| SPTSX | 11.905% | 11.111% | 11.628% | 21.558% | 21.741% | 23.810% | 31.707% | 31.111% | 33.333% | 41.747% | 22.745% | 14.569% |
| SPX | 16.162% | 17.172% | 15.000% | 20.936% | 22.124% | 21.799% | 28.571% | 26.804% | 26.804% | 25.796% | 10.552% | 7.094% |
| UKX | 5.263% | 10.526% | 15.789% | 20.000% | 26.773% | 29.584% | 47.368% | 45.000% | 36.842% | 42.592% | 35.445% | 24.272% |
| 100 | 9.665% | 22.845% | 25.789% | 25.532% | 37.482% | 39.257% | 50.660% | 57.074% | 57.471% | 55.490% | 50.188% | 47.683% |
| DAX | 0.000% | 14.286% | 25.000% | 21.930% | 38.158% | 45.019% | 66.667% | 62.500% | 71.429% | 73.474% | 79.150% | 78.900% |
| HSI | 6.667% | 25.000% | 18.750% | 21.583% | 34.948% | 33.136% | 50.000% | 50.000% | 50.000% | 62.346% | 52.145% | 60.134% |
| JALSH | 11.538% | 20.000% | 20.000% | 23.593% | 32.551% | 30.030% | 42.308% | 46.154% | 42.308% | 40.864% | 40.055% | 41.143% |
| SENSEX | 0.000% | 28.571% | 33.333% | 28.321% | 45.405% | 54.595% | 50.000% | 83.333% | 83.333% | 66.602% | 63.731% | 63.303% |
| SMI | 16.667% | 50.000% | 50.000% | 43.684% | 67.456% | 69.912% | 100.000% | 100.000% | 100.000% | 90.251% | 50.437% | 53.204% |
| SPTSX | 17.778% | 11.111% | 15.909% | 23.719% | 24.644% | 25.510% | 38.636% | 35.714% | 37.778% | 53.869% | 54.694% | 26.812% |
| SPX | 14.141% | 18.000% | 17.000% | 20.069% | 22.703% | 23.017% | 26.087% | 26.263% | 27.551% | 15.480% | 14.424% | 13.783% |
| UKX | 10.526% | 15.789% | 26.316% | 21.357% | 33.989% | 32.839% | 31.579% | 52.632% | 47.368% | 41.030% | 46.865% | 44.187% |
| 1000 | 5.721% | 25.437% | 28.054% | 23.525% | 41.154% | 43.755% | 43.607% | 57.573% | 55.807% | 56.290% | 39.176% | 38.516% |
| DAX | 0.000% | 14.286% | 28.571% | 18.252% | 46.523% | 47.932% | 50.000% | 71.429% | 71.429% | 100.000% | 62.516% | 69.324% |
| HSI | 0.000% | 25.000% | 20.000% | 16.684% | 36.394% | 37.876% | 28.571% | 57.143% | 46.667% | 71.379% | 43.143% | 42.285% |
| JALSH | 8.333% | 16.000% | 23.077% | 21.220% | 30.132% | 32.222% | 42.308% | 40.000% | 40.000% | 26.412% | 39.078% | 30.861% |
| SENSEX | 0.000% | 42.857% | 50.000% | 30.326% | 58.312% | 66.458% | 57.143% | 66.667% | 83.333% | 55.485% | 51.655% | 48.034% |
| SMI | 0.000% | 50.000% | 50.000% | 35.175% | 73.509% | 81.842% | 75.000% | 100.000% | 100.000% | 83.152% | 45.231% | 40.284% |
| SPTSX | 11.905% | 18.182% | 11.111% | 21.700% | 26.451% | 26.308% | 31.818% | 41.463% | 33.333% | 38.698% | 21.954% | 27.368% |
| SPX | 15.000% | 17.172% | 20.619% | 21.358% | 23.893% | 24.524% | 27.174% | 31.250% | 29.592% | 25.586% | 14.770% | 13.270% |
| UKX | 10.526% | 20.000% | 21.053% | 23.485% | 34.017% | 32.881% | 36.842% | 52.632% | 42.105% | 49.609% | 35.064% | 36.699% |
| AVERAGE | 8.030% | 21.230% | 25.064% | 24.702% | 37.047% | 38.927% | 47.056% | 55.738% | 53.770% | 54.055% | 45.004% | 42.868% |
Disclaimer/Publisher’s Note: The statements, opinions and data contained in all publications are solely those of the individual author(s) and contributor(s) and not of MDPI and/or the editor(s). MDPI and/or the editor(s) disclaim responsibility for any injury to people or property resulting from any ideas, methods, instructions or products referred to in the content. |
© 2024 by the authors. Licensee MDPI, Basel, Switzerland. This article is an open access article distributed under the terms and conditions of the Creative Commons Attribution (CC BY) license (http://creativecommons.org/licenses/by/4.0/).
Copyright: This open access article is published under a Creative Commons CC BY 4.0 license, which permit the free download, distribution, and reuse, provided that the author and preprint are cited in any reuse.


