
Submitted:
01 April 2024
Posted:
02 April 2024
You are already at the latest version
Abstract
In the process of climate change mitigation and adaptation, the focus on climate risk driven by transition innovations has received widespread attention from governments, regulators, and investors. Based on the identification of low-carbon patents through the Green and Low-carbon Technology Inventory in China, this study constructs low-carbon innovation measurements of listed firms in China from 2015 to 2021. Then, an empirical model is used to investigate the impact and mechanism of climate transition innovations on the default risk. The baseline regression model shows that low-carbon innovations can mitigate the default risk of listed firms. Moreover, our findings are supported by instrumental variable regressions that use the time costs of innovation. Finally, the mediation effect demonstrates that investor attention, total factor productivity, and technology spillovers are paths through which transition innovations can affect the default risk. This study reveals that low-carbon technological advances have a positive effect on climate transition risks.
Keywords:
climate change transition
; default risk
; low-carbon innovations
1. Introduction
After the Paris Agreement was signed with the objective of limiting the increase in global temperatures, climate change is increasingly becoming a social issue of high concern. However, at the UNFCCC COP28 meeting in Dubai in 2023, it was shown that progress in climate change adaptation is being achieved too slowly across all areas of climate action. In the sixth IPCC report, insufficient financing and lack of incentives for finance are considered as barriers for climate mitigation and adaptation to be undertaken with high confidence. For example, the average annual investment requirements for 2020 to 2030 in scenarios that limit temperatures increasing up to 2°C or 1.5°C are three to six times greater than the current levels across all sectors and regions with medium confidence. Indeed, an adequate decarbonization of production and consumption activities requires substantial financial support and involvement, but there is neither enough confidence nor motivation to invest in. As a result, there is an urgent need for research on the impact of climate change transition and adaptation on economics and the financial markets before deep financial involvement.
The climate risk from climate change is classified as climate physical risks and climate transition risks. Climate change transition risks refer to the economic impact that arises from the change in valuation of carbon-intensive and low-carbon assets induced by climate transition action, including drivers like technological advances. Focusing on the technological drivers in relation to climate transition risks, which cover a range of effects on firms’ operation and transition to a low-carbon economy, enterprises must play a key role in making low-carbon innovations for climate change transition. Green innovations and patent information are often taken as indicators for climate-related transition. To distinguish a patent of low-carbon innovation from other patents, the IPC code is used for identification purposes. This code directly refers to the IPC Green Inventory, which was developed by the World Intellectual Property Office (WIPO) with reference to the United Nations Framework Convention on Climate Change [1]. The Chinese National Intellectual Property Administration (CNIPA) has proposed the Green and Low-carbon Technology Inventory in order to make low-carbon innovation identification more relevant and accurate in the transition to a green development mode which promotes carbon dioxide peaking and carbon neutrality. This new inventory highlights the carbon-reducing capacity of technologies. Further, it focuses on relevant technology that can help achieve either carbon-reduction, zero-carbon, or a carbon-negative effect mainly through the clean utilization of conventional energy, energy savings, efficiency enhancements, utilization of new energy, and greenhouse gas capture, utilization, and storage. With the help of the low-carbon inventory, it is able to exclude pollution reduction technology and pertinent low-carbon innovation measurements can be obtained. From 2016 to 2022, the quantity and proportion of low-carbon patents displayed an increasing trend (shown in Figure 1), which confirms the transition to a low-carbon economy. Compared with other intellectual property administrations shown in Figure 1, the low-carbon patent applications via the CNIPA has the largest share and the trend is on the rise.
With the innovation transition to a low-carbon economy, there is a possible channel for firms’ credit risks. First of all, stringent climate and environmental regulation affecting the performance of business will devaluate carbon-intensive firms [2]. The implications of this channel can be explained using the framework of institutional and stakeholder theories, where stakeholders will consider employing an active strategy and be incentivized to mitigate carbon risk and revalue carbon-intensive assets [3,4]. Beyond the regulatory and policy shocks on the climate transition risk, technological advances and changing consumer preferences could also damage high-carbon activities and favor low-carbon firms. Based on the production theory, productivity plays a positive role in corporate default risk in the framework of climate change transition risk [5]. Other theoretical models suggest that technological progress makes a net positive contribution, through representing that the positive effect on the climate beta of uncertainty about exogenous, emission-neutral technological progress overwhelms the negative effect on the climate beta of uncertainty about the carbon-climate-response [6,7]. Empirical research also provides support for the proposition that technological innovations in climate change transition lead to good enterprise performance [8,9]. Through stranded assets and innovation, firms advance to low-carbon production that has a positive effect on the default risk [10,11].
As the low-carbon innovations develop steadily, the main purpose of this paper is to analyze the influence of transition to low-carbon innovations on the firms’ credit and default risk, which is a realization of the climate transition risks. Therefore, this study firstly identify the low-carbon patents of Chinese-listed firms and construct three low-carbon innovation measurements [12] using the new inventory proposed by the CNIPA. Then, the direct effect of low-carbon technological innovations on default risks is investigated in this work.
2. Literature Review
There is already a large body of research in the existing literature on the effect of innovation and firms’ performance. After a long period of research, a consensus has emerged on the positive effects of corporate innovation on business performance [14,15]. Innovations include products, processes, marketing, and the organization. Focusing on the technological innovations, the effect has heterogeneous results. For example, Wang [16] discovered that radical innovations are positively related to a firm’s performance in SMEs, but the incremental innovation strategies have a negative impact on a firm’s performance. Xu et al. [17] concluded that a direct positive effect of innovation inputs on return on assets (ROA) is significant, and technological innovations can be the mediator of different types of capital. Based on studies of firms’ performance, the firms’ risk is a natural focus for research on the effects of innovation. Most research has found that innovations, such as patents and R&D, can decrease the firms’ risk in terms of bond defaults and stock price [12,18,19].
With the basis of innovation and firms’ performance, when it turns to the climate change transition field, green or climate change innovations are represented by a number of studies [20]. One insight is that low-carbon technology can decrease costs with deployment [21]; however, the other side is that the implementation of low-carbon innovations can create investment difficulties because of the long development lead-in and high costs [22]. However, with the support of government policy, many countries have attained achievements in research and innovation for climate change transition, such as the renewable energy policies across Europe that were mentioned by Zhou et al. [23] and the policy drivers behind the development of photovoltaics and wind power in the European Union [24]. In China, Zhu et al. [1] found that an emission trading scheme increased low-carbon innovations by 5-10% without crowding out other technology. From the aspect of effectiveness, Acemoglu et al. [25] suggested that climate friendly innovations can move away from reliance on carbon-intensive industries and Davis et al. [26] proposed that the transition to new infrastructure using fossil fuels will be necessary for mitigation in the future. However, from short-term and empirical studies, it is evident that climate-change technology will not always decrease the level of carbon dioxide, especially in the medium- and low-income countries [27]. At least it can be concluded that research into climate change innovations is growing with the effect of climate change, but currently the effectiveness remains ambiguous. It is time to focus on the effect of climate change transition on individual firms.
Before analysis of the risks for firms, the effects of climate change innovation on firms’ performance remain controversial. From the early 20th century to 2014, the study of Cheng et al. [28] illustrated that organizational innovations were able to promote business performance through eco-processes and eco-product innovation. As for positive effects, Liao [29] presented a theoretical model and tested the promotional effect of environmental innovations on a firm’s financial performance, through different types of culture. Huang and Li [30] tested the positive effects of green product and process innovation on environmental and organizational performance in the information and communication technology industry. Rezende et al. [31] proved a lagged positive relationship between green innovation intensity and financial performance, yet no significant effects in the immediate year. Li et al. [8] focused on low-carbon innovations in manufacturing companies. They presented that carbon reduction innovations can significantly and positively affect firms’ performance, via the mechanism of green competence and firm size.
On the other hand, studies that provide results illustrating negative effects are relatively less frequent than those illustrating the positive effects. From a broad perspective, the negative effects are associated with general innovations. The negative effects stem from complexity and risk during innovation [32], investment crowding-out [33,34], and disruptive product innovation [35]. Aguilera-Caracuel and Ortiz-de-Mandojana [36] observed that green innovative firms do not show improved financial performance compared to non-green innovative firms. However, the positive effect exists when focusing on green innovative firms. Other studies tend to deliver ambiguous results. Aastvedt et al. [37] investigated a non-linear effect on the financial performance of oil and gas companies. The effect transformed from positive to negative in different areas and at different levels of innovation.
In summary, existing researches concentrated on the effect of general innovations on firm performance and default risks and the effect of climate change transition innovations on the default risk still lack of empirical results. This study fills this gap in literature by testing the relationship and mechanism between the low-carbon innovations and the default risk. The formal hypotheses and empirical results are demonstrated as follows.
3. Hypotheses Development
3.1. Hypothesis 1
Hypothesis 1: Low-carbon innovation is positively or negatively associated with firm default risks.
Based on the empirical results from the effects on firms’ performance, company risks are also impacted, although there is far less research in this area. A positive effect can originate from many different aspects. As a result, Gutiérrez-López et al. [11] empirically investigated that firms investing effort in low-carbon production operated more safely, with a moderating effect of stranded assets and innovation. A related analysis was presented by Bannier et al. [9]. They revealed that the higher a firm’s level of corporate social responsibility, the lower the default risk in US and European firms. Another positive relationship was presented in the study of Safiullah et al. [10], with their hypothesis explaining pro-environmental orientation and information asymmetry.
An important source of potential risks from climate adaption is divesting stranded assets. Since low-carbon transition requires a significant decline in fossil fuel usage, so-called fossil shock can generate risks in all production activities, which was highlighted in the study of Cahen-Fourot et al. [38]. The potential damage that stranded assets can cause are also presented in environment-related risk factors [39] and early obsolescence [40]. Chevallier et al. [41] proved that if firms operate with substantial stranded assets, they become vulnerable to the financial risks of default based on the simulation from a stochastic model. In summary, the uncertainties surrounding low-carbon innovation may result in the devaluation of stranded assets.
3.2. Hypothesis 2
Hypothesis 2: Investor attention is a mediation actor between low-carbon innovations and the default risk.
With the existence of innovation effects on the default risks, the effects can be explained by instrumental stakeholder theory and information asymmetry. As firms expend effort in relation to green innovations, stakeholders tend to pay attention to other firms because of the disclosure effect of innovations. Significant relationships between investor attention and green innovations were supported in the work of He et al. [42] and Gao et al. [43]. Liu et al. [44] also proved that firms’ green performance can affect the stock price via the mediation of investor attention. Specifically, firms with high pollution receive more attention on trading days, translating into stock prices. Deng et al. [38] posited that investor attention can affect energy-intensive enterprises negatively with spillovers, and sometimes environmental events are significantly related with individual attention. Another research study conducted by Hao and Xiong [46] also confirmed the positive effect of investor attention on firms’ risk in China, through the Baidu search index. From the evidence previously obtained, it is assumed that investor attention should be a channel between low-carbon innovation and firm default risks, similarly with that in the area of pollution performance [44].
3.3. Hypothesis 3
Hypothesis 3: Total factor productivity is a mediator between low-carbon innovations and the default risk.
The positive effect of corporate low-carbon innovations on firms’ performance and default risk is abundant based on a comprehensive literature review [15] and representative research [8,11,12]. Investors consider a firm competitive when owning more and higher quality patents. As for low-carbon innovations, the transitions to low-carbon production also imply relatively high productivity and enterprise competitiveness, since low-carbon innovations often occur in high-performance firms as an adaption for climate change. There are numerous empirical studies that reveal a positive correlation between climate change transition and total factor productivity, including transition policy [47] and innovations [48,49]. Better competitiveness indicates better firm performance and lower risks [50]. The theoretical mechanism is indirectly proven by the climate change risk theory model [5]. Battison et al. presented a systemic theory for climate change default risk, in which the default probability is negatively related to firms’ total factor productivity.
3.4. Hypothesis 4
Hypotheses 4: Technology spillover is a mediator between low-carbon innovations and the default risk.
Research and innovation spillovers can affect the performance and risks of firms. In the literature previously presented, innovations have an impact effect on the performance and risks of firms. Furthermore, the existence and effects of technological spillovers from innovation were widely recognized by de Faria and Lima [51], who argued that there was a positive spillover of innovation on firm values in different innovation types. Another study containing empirical evidence was that of Aiello and Cardamone [52]; they found a positive effect from R&D spillovers on firms’ production. Yao et al. [53] revealed that the type of firm dual network structure has a positive influence on firms’ performance, on the basis of social network theory. With the development of natural language processing, it can measure patent similarity, knowledge linkage, and technology spillovers through textual analysis [54,55]. Thus, as the effects from low-carbon innovations on firms’ risk are proved in hypothesis 1, it is assumed that innovation spillovers measured by centrality in the network are a mediator.
4. Data and Methods
4.1. Sample Selection and Data Source
Chinese A-share listed firms, excluding financial firms and ST, from 2015 to 2021 were selected as the samples in this study. These data were obtained after the carbon emissions trading market pilot, which is the most important policy for reducing carbon directly. The data used in this study can be divided into three parts. First of all, the patent data are derived from the CCER1. This dataset collects daily patent application details for listed firms in China from 1990 to 2022, which consist of the applicant, application date, application number, patent classification, patent name, and patent abstract. In addition to the patent data, patent citation data is collected for patent importance measurement from CNRDS2. Secondly, the risk variables and covariates of Chinese listed firms were collected from CSMAR3, including financial variables, such as distance-to-default, z-score, net ROA, ROE, and so on. Last, the Baidu search index with the stock code of listed firms is selected to represent investor attention, which is provided by CNRDS. In summary, daily data is transformed into yearly data, and the three parts of data based on the stock code of each dataset are merged. Then, the missing value of patent and investor attention are filled with zero. Finally, the panel data from 4474 firms from 2015 to 2021 is obtained in this study.
4.2. Dependent Variables
In this study, it needs to measure firm default risks with the dependent variable. According to the research from Bannier et al. [9], Gutierrez-Lopez et al. [11], and Meles et al. [13], distance-to-default (DD) is taken as the main dependent variable. The distance-to-default measures credit default risks, meaning that firms with a higher DD have lower default risks. Three types of DD [56,57] from CSMAR are used in this study for robustness tests. The Merton DD from Bharath and Shumway [57] was main dependent variable and two other dependent variables were used for robustness test. The DD from Bharath and Shumway can be calculated as follows:
where E means the market value of the firm’s equity and D means the overall value of the firm’s liquid liability and illiquid liability. Other notations are that of the risk-free interest rate and the prediction range T. mean the volatility concerning the firm’s asset value, equity, and debt, respectively, and an approximation is calculated as . Then, is calculated based on the variance in the logarithmic stock return.
4.3. Independent Variables
Independent variables included low-carbon patent measurement, financial covariates, investor attention measurement, and patent network measurement, in which low-carbon patent classification and measurement was the core variable of this study. The low-carbon patent classification refers to the Patent Classification System for Green and Low-Carbon Technologies. In this system, classification standards were based on the International Patent Classification (IPC) and a keyword search. In the IPC classification, the system takes IPC 2022 as the reference base to identify a patent as low-carbon technologies in 142 technological branches. In some branches, the IPC covers too many patents unrelated to carbon emission reduction; therefore, the system provides keywords for these branches. For example, in the branch of carbon capture, “carbon dioxide” and “carbon monoxide” should be added to our search statements other than the IPC classification. In summary, this study classified all patents of Chinese listed firms into either low-carbon patent or non-low-carbon patent in order to correctly designate them. Then, this study calculated the quantity of green patents, their generality, and importance as the measurement for climate change transition. Low-carbon patent measurements were yearly for each listed firm, which were summarized from the daily patent classification. Low-carbon quantity was the number of low-carbon patents in a year. Low-carbon generality was the number of low-carbon classifications in which the patent was classified in a year. Low-carbon importance was the green quantity weighted by the citation of each low-carbon patent. The quantity, generality, and importance measurements partly refer to the research of Hsu et al. [12]. Another low-carbon patent measurement was the low-carbon time cost, which was calculated by the industry average duration from application to approval. Low-carbon time cost is taken as the instrumental variable, reflecting the time costs of firms’ low-carbon patenting activities [12].
Financial covariates were selected to control other financial measurements which would influence the default risk of listed firms. This study used the annual financial statements and financial indicators, describing solvency, operation, profitability, and growth. These constituents are the main elements deciding the default risk [10,11]. Investor attention was measured using the daily Baidu search index. In order to prove our hypothesis from annual panel data, this study grouped the search index by each listed firm and used an average and median index to describe the annual investor attention.
To measure technology spillovers, it needs to build a patent network from their association. A patent network is built from patent similarity between claimants and abstracts, which is better than a traditional citation relationship for representing technology spillovers [54,55,58]. To build patent similarity, the Doc2vec model was used for this study. Each patent was transformed into a vector and this study calculated cosine similarity. For the purpose of describing firms’ technology spillovers, this paper merged patent similarity into firm-level similarity and built a patent spillovers network. Finally, this research calculated the degree centrality for testing potential mechanisms. In the end, the descriptions of our dependent variables and independent variables are shown in Table 1.
4.4. Empirical Method
To investigate the relationship between low-carbon innovations and default risks and prove the theoretical hypothesis, this study mainly builds on the panel fixed effect empirical model. To test hypothesis H1, regression models are constructed as the benchmark model:
In Equation (4), DD represents the distance-to-default, which is the measurement of firm default risks; the LCI indicates the low-carbon innovation measurements referred to in previous studies [12]; and controls are the control variables listed in Table 1. is the firm and is the time. is the individual fixed effect and is the time fixed effect. is the coefficient of the effect of low-carbon innovations on firm default risks. If , a negative relationship is validated in H1. As for the robustness test, this study took different distance-to-default measurements and standardization methods to test.
To inspect the heterogeneous effect of climate change transition innovations on default risks, this study built a regression model with the introduction of intersection terms as Equation (5):
In Equation (5), denotes the group identification. If the firm is in the group, such as policy treatment, . Otherwise, . If , Equation (5) is the same as Equation (4). If is significantly not equal to zero, there is a significant innovation effect difference between groups. The heterogeneous effect also indicates an exogenous shock because the group assignments are independent of the innovation measurements [12].
The regression model often involves endogenous issues, as presented in previous studies. This study took accurate low-carbon patent classifications to solve measurement error and use control variables and individual fixed effect to mitigate the problem of missing variables. However, simultaneity occurs if firms with a lower risk have conditions for more low-carbon innovations. Therefore, the IV-2SLS model is constructed for the endogeneity issue. Equation (6) is the first stage of the IV-2SLS model and Equation (7) is the second stage, which uses the estimated low-carbon innovations in the regression model:
In Equation (6), denotes the instrumental variable, which is the time costs of the low-carbon patent as demonstrated in Table 1. This study implemented the F-test, the under-identification test, and the weak instrument test for Equation (6). In Equation (7), denotes the estimated low-carbon innovations based on Equation (6). The is the effect of transition innovations on default risks and it is compared with the baseline model in Equation (4) to test the endogeneity issue. If the effect of Equations (4) and (7) is in the same direction, the endogeneity will not have a significant influence on the effect.
To verify the mechanisms of innovation impact on default risks, this study constructed a mediation effect model. Equation (8) shows the relationship between low-carbon innovations and intermediary variables and Equation (9) reveals the effects of low-carbon innovations and intermediary variables on the default risks:
(9)
In Equation (8) and Equation (9), denotes the intermediary variable, which is the investor attention, total factor productivity, and patent centrality measurement. If and are significantly different from zero, the mechanism of H2, H3, and H4 is verified.
5. Results and Discussion
5.1. Summary Statistics
Table 2 shows the descriptive statistics of the variables used in the empirical model. In Table 2, the panel data have 23580 observations and 4474 firms from 2015 to 2021. Firstly, the means of the main dependent variable, distance-to-default, is 10.10, with minimum and maximum values of 0.824 and 3306, respectively. It is suggested that the default risk is diversified and thick-tailed among the listed firms. As for independent variables, this study built low-carbon innovation measurements, including quantity, generality, and importance. The means of quantity, generality, and importance are 0.556, 0.603, and 0.864, respectively, with a standard deviation of 6.937, 7.465, and 11.87. The measurements of low-carbon innovations are similar in sample distribution. Other control variables are selected and calculated from the financial statements of the sample listed firms. Most of them are similar within the same group of financial indicators. For example, current ratio and asset loan rate, which measure the solvency capability of firms, have similar average values, standard deviation, minimum values, and maximum values.
5.2. The Effect of Low-Carbon Innovations on Default Risks
To test the hypothesis 1, Table 3 presents the baseline empirical results of innovation effects on the default risk based on Equation (4). In Table 3, columns (1) and (2) report the results of model (4), with the low-carbon patent quantity representing the climate change transition measurement. They omit and control the province fixed effect and industry fixed effect, respectively. Columns (3) and (4) present the results of the innovation effect, with the low-carbon patent generality representing the climate change transition measurement. Columns (5) and (6) show the low-carbon innovation effects on default risks, using low-carbon patent importance as the innovation measurement. First of all, the results are robust and similar both with and without control of the province fixed effect and industry fixed effect; in particular, the difference is concentrated on the constant terms. Secondly, three low-carbon innovation measurements all show positive and significant effects on the default risk, and the effect of low-carbon patent importance is relatively smaller than the other two measurements. The effect of low-carbon patent quantity and generality is significantly positive and at the 5% level, and the coefficients of the low-carbon patent importance are significantly positive and at the 10% level.
The results of the baseline model support the negative relationship in H1, that low-carbon innovations have negative impacts on the default risk. Although this finding is similar to the innovation effect on default risks [12,15], it is a new result for climate change transition innovations. The baseline result suggests that low-carbon transitions can have a new and positive impact on the firm’s situation. However, the empirical results could be influenced by the default risk indicator and data scale; therefore, the robustness check needs to be performed to verify the hypothesis.
As shown in Table 4, columns (1), (2), and (3) show the robustness check via standardization of the z-score, which transforms the low-carbon innovation indicator by . is the numeric data after normalization and is the numeric data before normalization, and denote the group mean and standard deviation, respectively. Columns (4), (5), and (6) present the robustness check using min–max normalization, which normalizes the low-carbon innovation indicators by . After normalization, this study can compare the effects on the default risk from different innovation measurements [59]. All effects remain significantly positive as the baseline model. Further, the magnitude of the low-carbon innovation effect is almost the same between three measurements, with a difference in the standard deviation of estimation, indicating the robustness and comparability between different low-carbon innovation measurements.
In Table 5, columns (1), (2), and (3) display the robustness check by changing distance-to-default from the method of Bharath and Shumway [57] to Merton [56], and columns (4), (5), and (6) display the robustness check by calculating distance-to-default according to the Kealhofer–Merton–Vasicek (KMV) model. All the low-carbon innovation effects are significantly positive for three measurements at the 1% level. The difference is the standard deviation of estimation for the low-carbon patent importance measurement. The hypothesis is verified by different default risk measurements and the positive effect of low-carbon innovation shows robustness.
5.3. Heterogeneity Effects
After verifying hypothesis 1, the climate change transition effect on the default risk could be heterogeneous among different groups. In the first heterogenous analysis, the low-carbon city pilot policy (LCCP), which has become one of the most significant development initiatives, is introduced as a treatment assignment to explore the intergroup difference of innovation effects. This study used the first and the second batches of LCCP projects by consulting governmental documents in 2010 and 2012 [60,61]. In Table 6, columns (1), (2), and (3) demonstrate the heterogeneous effects for three low-carbon innovation measurements, respectively, especially the coefficient of LCCPInnovation. The low-carbon innovation effect is significant at –0.018 and -0.016 for quantity and generality measurements at the 10% level, but it is also significant at 0.006 for the innovation importance measurement at the 5% level. There is a different heterogeneous effect for different measurements. As for firms in the low-carbon city pilot, the significantly positive innovation effect on default risks is less than other firms for the average low-carbon patent quantity and the innovation effect on default risks is more than other firms for the average low-carbon patent citation. It is suggested that high-quality low-carbon innovation does have a more significant effect on alleviating the default risks inherent to low-carbon regulations.
Another heterogeneous effect comes from the green credit policy shock in 2012, which may have impacted the effect on the default risk of firms [62]. This study selected heavily polluting industries, including the textile industry, paper industry, petrochemical industry, metallic manufacturing, and non-metallic manufacturing industry, as the group treated by green credit policy [63]. Based on columns (1), (2), and (3) in Table 7, firms in the green credit policy have significantly (-0.062, -0.052, and -0.049) lower low-carbon innovation effect compared with other firms without the support of green credit. This could be explained as the green credit policy acting to reduce firms’ performance in these polluting industries [62]; thus, the improvement from low-carbon innovation to default risk could be weakened. Furthermore, the heterogeneous effects are similar in number and sign among the three low-carbon innovation measurements.
5.4. Endogeneity Issues
The endogeneity issue was introduced in the previous Section 3.4, so this study constructed the IV-2SLS model to test the simultaneity issue. The low-carbon time costs are chosen as the instrumental variable for three low-carbon innovation measurements in the model, as shown in Table 1. This instrumental variable represents the time costs of firms’ patenting activities and should influence low-carbon innovation incentives to produce a significant amount of innovations. On the other hand, it is exclusive because it is uncorrelated with the dependent variable, that is distance-to-default, because a firm’s relative patenting performance at the industry level has no effect on dependent variables. In addition to these conceptual arguments, it was also conducted relevant statistical tests, including the F-test, the under-identification, and the weak identification test, to empirically justify the validity of the instrumental variable in Table 8.
In Table 8, columns (1) and (2) demonstrate the effect of low-carbon innovation quantity in two stages. Columns (3) and (4) present the innovation effects of low-carbon generality and columns (5) and (6) present the innovation effects of low-carbon patent importance. For all innovation measurements, there are significant overall positive effects on default risks, indicating the validity of our verification of hypothesis 1. In columns (1), (2), (3), and (4), the coefficient estimates of the instrument variable is significantly positive at the 5% level. In columns (5) and (6), estimates for low-carbon patent importance are significantly negative at the 10% and 5% level, respectively. As for statistic tests, the first-stage F-statistics for excluded instrument are 5.06, 5.12, and 6.17, which are significant at the 5% level. Furthermore, the Kleibergen–Paap rank LM statistics are significant at the 5% level for under-identification and the Cragg–Donald–Wald F-statistics for weak identification are 201.65, 201.79, and 113.31, which all exceed the critical value of 16.38 at the 10% weak instrument bias level according to the Stock–Yogo weak instrument threshold.
5.5. Mechanism of Low-Carbon Innovation Effects
To test hypothesis 2 and hypothesis 3, this study constructed three mediation models based on two-step regression. As for hypothesis 2, based on instrumental stakeholder theory and information asymmetry, this study took investor attention paid to listed firms as the mediation variable as shown in Table 1. In Table 9, columns (1), (3), and (5) display the first stage results from mediator to independent variables and columns (2), (4), and (6) show the second stage regression including independent variables and mediation variables. In columns (1) and (2), the coefficients are -6.275 and -0.001 significantly at the 1% level, which shows incomplete mediation. In columns (3) and (4), the estimates are significant -5.840 and insignificant 0.006, and significant -5.397 and insignificant 0.000 in columns (5) and (6). The investor focus is a complete mediator for low-carbon patent generality and importance. Overall, for three low-carbon innovation indicators, there is a significant path from low-carbon innovation to alleviate default risks through decreasing the investor focus.
To verify hypothesis 3, total factor productivity (TFP) is calculated by the general moment model [64]. With the TFP as the mediator, this study tried to argue that low-carbon innovations can improve the risk profile through overall production performance. In Table 10, columns (1), (3), and (5) show the first stage result of three low-carbon innovation measurements on TFP. Columns (2), (4), and (6) display the second stage result including mediators and independent variables. As shown in columns (1), (2), (3), and (4), these mediation effects are significantly positive for low-carbon quantity and generality measurements. However, the mechanism is not significant for the low-carbon innovation importance based on columns (5) and (6). In conclusion, the TFP acts as a suppression mediator in the low-carbon innovation effects on default risks and hypothesis 3 is partly tested.
As for verifying hypothesis 4, this study tried to test the mediation effect through the technology spillovers. It is demonstrated in Table 11 that columns (1), (3), and (5) show the first-stage mediation result and columns (2), (4), and (6) show the second-stage mediation regression. In columns (1) and (2), the two-step mediation effects are 0.003 and 2.488 at the 1% and 10% level, respectively. In columns (3) and (4), the mediation effects are 0.003 and 2.500 significantly at the 1% and 10% level, and columns (5) and (6) show significant mediation effects as 0.001 and 2.435 at the 1% and 5% level. This study can test hypothesis 4 with these complete mediation effects for all low-carbon innovation measurements. Low-carbon technology similarity network centrality acts as the influential power in the field of low-carbon technology. This finding provides evidence that firms’ low-carbon innovations can alleviate default risks through their low-carbon technology spillovers.
In summary, analyzing the straightforward relationship of low-carbon technological innovations on default risks, it is concluded that low-carbon innovations positively affect a firm’s distance-to-default, which is the indicator of default risks, and is also consistent with the previous results of low-carbon transition and traditional innovations [11,12,13]. Taking alternative default risk measurements, normalization methods, heterogeneous analysis, and instrumental variables, the straightforward effects are tested with robustness and endogeneity issues. By means of several proxies for stakeholder attention, productivity, and technology spillovers, this study find that climate change transition innovations affect the credit risk through the mechanism of stakeholder theory and production theory, consistent with previous research [5,10]. Indeed, the positive relationship between low-carbon innovations and distance-to-default suggests that the positive effects of transition to the carbon-neutral economy overwhelm the negative effect of costs and stakeholder theory is the main channel. Firms should make an effort to embrace transition innovations, showing their adaptation to the new economic development mode, which will enhance stakeholder confidence and reduce the likelihood of default.
This study contributes to the literature in several ways. First of all, this study extends the novel stream of research on the relationship between green and low-carbon innovations and corporate performance by verifying whether low-carbon innovations positively or negatively influence the measurement of default risk. Secondly, this study enriches the research on climate change transition risks from technological advances by empirically testing the relationship between innovations and default risks. Thirdly, this study focuses on the low-carbon technology advances by using a new patent inventory compared with the IPC Green Inventory of WIPO. This labeling of low-carbon innovations can accurately measure the technological driver of climate change risk and three low-carbon innovation measurements are constructed to make a robust and comprehensive evaluation of innovation effects on default risks. Lastly, results in this study demonstrate possible mechanisms from theories like stakeholder attention.
Further, our results are of interest to corporate managers, investors, and policymakers. From a managerial perspective, this study suggests that managers should expedite the adoption of low-carbon and carbon-neutral practices, particularly for enterprises operating in industries not subject to regulatory oversight. Additionally, the climate change transition information disclosure should be enforced as an effective instrument for value management according to the mechanism of low-carbon innovation effects on default risks. As for investors, low-carbon innovations are verified as a good indicator for investing. However, it was noticed that firms under regulation have insufficient innovation effects, as might be supposed. From the perspective of policymakers, the climate finance barrier is an issue of high concern. Recognizing the effect of low-carbon innovations, it is now necessary to propose policies that will promote engagement in climate transition innovations. An effective method is through the development of a low-carbon technology inventory and providing subsidies relating to its development.
To our knowledge, this is the first study to analyze a low-carbon innovation mediation channel of technological spillovers using patent similarity to measure low-carbon technology spillovers. However, some limitations still exist in this study, providing possible suggestions for future research. First, our analysis concentrates on Chinese-listed firms and patents, which are an important part of low-carbon innovations in the world. If the low-carbon patent inventory is expanded to the scope of global patents, the climate change risk driven from low-carbon innovations can be analyzed in the context of different national climate change transformation processes and objectives. Secondly, the mechanism tests in this work are still simple and unrefined in terms of the method and theory. Although the existing theory of climate change transition risks provide an illuminating framework for our mediation models [5], the economic theory can be developed for specific mechanisms, like technological spillovers. Last but not least, this study only formulate the linear regression effect. For further research, scholars can try to analyze nonlinear relationships, such as a U-shaped or inverted U-shaped curve between low-carbon innovations and default risk indicators. It would be interesting to explore the positive effects and negative effects separately according to nonlinear relationships.
6. Conclusions
This study examined whether and how climate change transition innovation affects firms’ default risk through the examination of the green and low-carbon patent inventory proposed by CNIPA between 2015 and 2021. The regression model used in this study considered different low-carbon innovation measurements, robustness check, heterogenous analysis, and endogeneity issues. Further, three indicators of transition risk channels are constructed to investigate possible mechanisms based on theories that had been proposed in previous research. This paper is the first to investigate the relationship between low-carbon innovations and default risk based on a more accurate low-carbon patent inventory.
Our findings can be summarized as follows:
- This study finds that low-carbon transition innovation significantly decreases default risk as measured by distance-to-default. This result was tested with three low-carbon innovation measurements, including quantity, generality, and importance. The result is robust with alternative normalization methods and default risk measurements.
- As a heterogeneous analysis, it is concluded that firms under climate policy treatment will obtain lower innovation effects on default risks compared with other firms.
- Innovation time costs are taken as instrumental variables to test endogeneity and our results are robust under the IV-2SLS model.
- This paper finds that the three identified mechanisms can explain how low-carbon innovations affect the default risk, including stakeholder attention, productivity, and technological spillovers.
| 1 | CCER is a database of economics and finance, which is built by Sinofin and the China
Centre for Economic Research, Peking University. |
| 2 | CNRDS is the Chinese Research Data Services Platform, which provides
high-quality and open data for Chinese economic research. |
| 3 | CSMAR is the China Stock Market and Accounting Research Database, which
provides various datasets for the Chinese stock market. |
References
- Zhu, J.; Fan, Y.; Deng, X.; Xue, L. Low-Carbon Innovation Induced by Emissions Trading in China. Nat Commun 2019, 10, 4088. [Google Scholar] [CrossRef] [PubMed]
- Monasterolo, I. Climate Change and the Financial System. Annu. Rev. Resour. Econ. 2020, 12, 299–320. [Google Scholar] [CrossRef]
- Jung, J.; Herbohn, K.; Clarkson, P. Carbon Risk, Carbon Risk Awareness and the Cost of Debt Financing. J Bus Ethics 2018, 150, 1151–1171. [Google Scholar] [CrossRef]
- Giglio, S.; Kelly, B.; Stroebel, J. Climate Finance. Annual Review of Financial Economics 2021, 13, 15–36. [Google Scholar] [CrossRef]
- Battiston, S.; Mandel, A.; Monasterolo, I.; Roncoroni, A. Climate Credit Risk and Corporate Valuation. In Climate credit risk and corporate valuation: Battiston, Stefano| uMandel, Antoine| uMonasterolo, Irene| uRoncoroni, Alan; [Sl]: SSRN, 2023. [Google Scholar]
- Lemoine, D. The Climate Risk Premium: How Uncertainty Affects the Social Cost of Carbon. Journal of the Association of Environmental and Resource Economists 2021, 8, 27–57. [Google Scholar] [CrossRef]
- Dietz, S.; Gollier, C.; Kessler, L. The Climate Beta. Journal of Environmental Economics and Management 2018, 87, 258–274. [Google Scholar] [CrossRef]
- Li, F.; Xu, X.; Li, Z.; Du, P.; Ye, J. Can Low-Carbon Technological Innovation Truly Improve Enterprise Performance? The Case of Chinese Manufacturing Companies. Journal of Cleaner Production 2021, 293, 125949. [Google Scholar] [CrossRef]
- Bannier, C.E.; Bofinger, Y.; Rock, B. Corporate Social Responsibility and Credit Risk. Finance Research Letters 2022, 44, 102052. [Google Scholar] [CrossRef]
- Safiullah, S.; Phan, D.H.B.; Kabir, M.N. Green Innovation and Corporate Default Risk 2022.
- Gutiérrez-López, C.; Castro, P.; Tascón, M.T. How Can Firms’ Transition to a Low-Carbon Economy Affect the Distance to Default? Research in International Business and Finance 2022, 62, 101722. [Google Scholar] [CrossRef]
- Hsu, P.-H.; Lee, H.-H.; Liu, A.Z.; Zhang, Z. Corporate Innovation, Default Risk, and Bond Pricing. Journal of Corporate Finance 2015. [Google Scholar] [CrossRef]
- Meles, A.; Salerno, D.; Sampagnaro, G.; Verdoliva, V.; Zhang, J. The Influence of Green Innovation on Default Risk: Evidence from Europe. International Review of Economics & Finance 2023, 84, 692–710. [Google Scholar] [CrossRef]
- Gunday, G.; Ulusoy, G.; Kilic, K.; Alpkan, L. Effects of Innovation Types on Firm Performance. International Journal of Production Economics 2011, 133, 662–676. [Google Scholar] [CrossRef]
- Naqbi, E.A.; Alshurideh, M.; AlHamad, A.; Al, B. The Impact of Innovation on Firm Performance: A Systematic Review. International Journal of Innovation 2020, 14. [Google Scholar]
- Wang, D.S. Association between Technological Innovation and Firm Performance in Small and Medium-Sized Enterprises: The Moderating Effect of Environmental Factors. International Journal of Innovation Science 2019, 11, 227–240. [Google Scholar] [CrossRef]
- Xu, J.; Shang, Y.; Yu, W.; Liu, F. Intellectual Capital, Technological Innovation and Firm Performance: Evidence from China’s Manufacturing Sector. Sustainability 2019, 11, 5328. [Google Scholar] [CrossRef]
- Ben-Nasr, H.; Bouslimi, L.; Zhong, R. Do Patented Innovations Reduce Stock Price Crash Risk?*. International Review of Finance 2021, 21, 3–36. [Google Scholar] [CrossRef]
- Fernandes, A.M.; Paunov, C. THE RISKS OF INNOVATION: ARE INNOVATING FIRMS LESS LIKELY TO DIE? THE REVIEW OF ECONOMICS AND STATISTICS 2015. [Google Scholar] [CrossRef]
- Matos, S.; Viardot, E.; Sovacool, B.K.; Geels, F.W.; Xiong, Y. Innovation and Climate Change: A Review and Introduction to the Special Issue. Technovation 2022, 117, 102612. [Google Scholar] [CrossRef]
- Viardot, E. The Role of Cooperatives in Overcoming the Barriers to Adoption of Renewable Energy. Energy Policy 2013, 63, 756–764. [Google Scholar] [CrossRef]
- Ghisetti, C.; Pontoni, F. Investigating Policy and R&D Effects on Environmental Innovation: A Meta-Analysis. Ecological Economics 2015, 118, 57–66. [Google Scholar] [CrossRef]
- Zhou, S.; Matisoff, D.C.; Kingsley, G.A.; Brown, M.A. Understanding Renewable Energy Policy Adoption and Evolution in Europe: The Impact of Coercion, Normative Emulation, Competition, and Learning. Energy Research & Social Science 2019, 51, 1–11. [Google Scholar] [CrossRef]
- Lacal Arantegui, R.; Jäger-Waldau, A. Photovoltaics and Wind Status in the European Union after the Paris Agreement. Renewable and Sustainable Energy Reviews 2018, 81, 2460–2471. [Google Scholar] [CrossRef]
- Acemoglu, D.; Akcigit, U.; Hanley, D.; Kerr, W. Transition to Clean Technology. Journal of Political Economy 2016. [Google Scholar] [CrossRef]
- Davis, S.J.; Caldeira, K.; Matthews, H.D. Future CO2 Emissions and Climate Change from Existing Energy Infrastructure. Science 2010, 329, 1330–1333. [Google Scholar] [CrossRef] [PubMed]
- Du, K.; Li, P.; Yan, Z. Do Green Technology Innovations Contribute to Carbon Dioxide Emission Reduction? Empirical Evidence from Patent Data. Technological Forecasting and Social Change 2019, 146, 297–303. [Google Scholar] [CrossRef]
- Cheng, C.C.J.; Yang, C.; Sheu, C. The Link between Eco-Innovation and Business Performance: A Taiwanese Industry Context. Journal of Cleaner Production 2014, 64, 81–90. [Google Scholar] [CrossRef]
- Liao, Z. Corporate Culture, Environmental Innovation and Financial Performance. Business Strategy and the Environment 2018, 27, 1368–1375. [Google Scholar] [CrossRef]
- Huang, J.-W.; Li, Y.-H. Green Innovation and Performance: The View of Organizational Capability and Social Reciprocity. J Bus Ethics 2017, 145, 309–324. [Google Scholar] [CrossRef]
- Rezende, L. de A.; Bansi, A.C.; Alves, M.F.R.; Galina, S.V.R. Take Your Time: Examining When Green Innovation Affects Financial Performance in Multinationals. Journal of Cleaner Production 2019, 233, 993–1003. [Google Scholar] [CrossRef]
- Saliba de Oliveira, J.A.; Cruz Basso, L.F.; Kimura, H.; Sobreiro, V.A. Innovation and Financial Performance of Companies Doing Business in Brazil. International Journal of Innovation Studies 2018, 2, 153–164. [Google Scholar] [CrossRef]
- Wagner, M. How to Reconcile Environmental and Economic Performance to Improve Corporate Sustainability: Corporate Environmental Strategies in the European Paper Industry. Journal of Environmental Management 2005, 76, 105–118. [Google Scholar] [CrossRef] [PubMed]
- Misani, N.; Pogutz, S. Unraveling the Effects of Environmental Outcomes and Processes on Financial Performance: A Non-Linear Approach. Ecological Economics 2015, 109, 150–160. [Google Scholar] [CrossRef]
- Trumpp, C.; Guenther, T. Too Little or Too Much? Exploring U-Shaped Relationships between Corporate Environmental Performance and Corporate Financial Performance. Business Strategy and the Environment 2017, 26, 49–68. [Google Scholar] [CrossRef]
- Aguilera-Caracuel, J.; Ortiz-de-Mandojana, N. Green Innovation and Financial Performance: An Institutional Approach. Organization & Environment 2013, 26, 365–385. [Google Scholar] [CrossRef]
- Aastvedt, T.M.; Behmiri, N.B.; Lu, L. Does Green Innovation Damage Financial Performance of Oil and Gas Companies? Resources Policy 2021, 73, 102235. [Google Scholar] [CrossRef]
- Cahen-Fourot, L.; Campiglio, E.; Godin, A.; Kemp-Benedict, E.; Trsek, S. Capital Stranding Cascades: The Impact of Decarbonisation on Productive Asset Utilisation. Energy Economics 2021, 103, 105581. [Google Scholar] [CrossRef]
- Muldoon-Smith, K.; Greenhalgh, P. Suspect Foundations: Developing an Understanding of Climate-Related Stranded Assets in the Global Real Estate Sector. Energy Research & Social Science 2019, 54, 60–67. [Google Scholar] [CrossRef]
- Curtin, J.; McInerney, C.; Ó Gallachóir, B.; Hickey, C.; Deane, P.; Deeney, P. Quantifying Stranding Risk for Fossil Fuel Assets and Implications for Renewable Energy Investment: A Review of the Literature. Renewable and Sustainable Energy Reviews 2019, 116, 109402. [Google Scholar] [CrossRef]
- Chevallier, J.; Goutte, S.; Ji, Q.; Guesmi, K. Green Finance and the Restructuring of the Oil-Gas-Coal Business Model under Carbon Asset Stranding Constraints. Energy Policy 2021, 149, 112055. [Google Scholar] [CrossRef]
- He, F.; Yan, Y.; Hao, J.; Wu, J. (George) Retail Investor Attention and Corporate Green Innovation: Evidence from China. Energy Economics 2022, 115, 106308. [Google Scholar] [CrossRef]
- Gao, Y.; Li, Y.; Wang, Y. The Dynamic Interaction between Investor Attention and Green Security Market: An Empirical Study Based on Baidu Index. China Finance Review International 2021, 13, 79–101. [Google Scholar] [CrossRef]
- Liu, F.; Kang, Y.; Guo, K.; Sun, X. The Relationship between Air Pollution, Investor Attention and Stock Prices: Evidence from New Energy and Polluting Sectors. Energy Policy 2021, 156, 112430. [Google Scholar] [CrossRef]
- Deng, C.; Zhou, X.; Peng, C.; Zhu, H. Going Green: Insight from Asymmetric Risk Spillover between Investor Attention and pro-Environmental Investment. Finance Research Letters 2022, 47, 102565. [Google Scholar] [CrossRef]
- Hao, J.; Xiong, X. Retail Investor Attention and Firms’ Idiosyncratic Risk: Evidence from China. International Review of Financial Analysis 2021, 74, 101675. [Google Scholar] [CrossRef]
- Zhang, H.; Huang, L.; Zhu, Y.; Si, H.; He, X. Does Low-Carbon City Construction Improve Total Factor Productivity? Evidence from a Quasi-Natural Experiment in China. International Journal of Environmental Research and Public Health 2021, 18, 11974. [Google Scholar] [CrossRef]
- Su, T.; Chen, Y.; Lin, B. Uncovering the Role of Renewable Energy Innovation in China’s Low Carbon Transition: Evidence from Total-Factor Carbon Productivity. Environmental Impact Assessment Review 2023, 101, 107128. [Google Scholar] [CrossRef]
- Wu, J.; Xia, Q.; Li, Z. Green Innovation and Enterprise Green Total Factor Productivity at a Micro Level: A Perspective of Technical Distance. Journal of Cleaner Production 2022, 344, 131070. [Google Scholar] [CrossRef]
- İmrohoroğlu, A.; Tüzel, Ş. Firm-Level Productivity, Risk, and Return. Management Science 2014, 60, 2073–2090. [Google Scholar] [CrossRef]
- de Faria, P.; Lima, F. Interdependence and Spillovers: Is Firm Performance Affected by Others’ Innovation Activities?
- Aiello, F.; Cardamone, P. R&D Spillovers and Firms’ Performance in Italy: Evidence from a Flexible Production Function. Empirical Economics 2008, 34, 143–166. [Google Scholar] [CrossRef]
- Yao, Y.; Gao, H.; Sun, F. The Impact of Dual Network Structure on Firm Performance: The Moderating Effect of Innovation Strategy. Technology Analysis & Strategic Management 2020, 32, 1020–1034. [Google Scholar] [CrossRef]
- Chen, L. Do Patent Citations Indicate Knowledge Linkage? The Evidence from Text Similarities between Patents and Their Citations. Journal of Informetrics 2017, 11, 63–79. [Google Scholar] [CrossRef]
- Whalen, R.; Lungeanu, A.; DeChurch, L.; Contractor, N. Patent Similarity Data and Innovation Metrics. J Empirical Legal Studies 2020, 17, 615–639. [Google Scholar] [CrossRef]
- Merton, R.C. On the Pricing of Corporate Debt: The Risk Structure of Interest Rates. The Journal of Finance 1974, 29, 449–470. [Google Scholar] [CrossRef]
- Bharath, S.T.; Shumway, T. Forecasting Default with the Merton Distance to Default Model. The Review of Financial Studies 2008, 21, 1339–1369. [Google Scholar] [CrossRef]
- Arts, S.; Cassiman, B.; Gomez, J.C. Text Matching to Measure Patent Similarity. Strategic Management Journal 2018, 39, 62–84. [Google Scholar] [CrossRef]
- Liang, Y.; Rudik, I.; Zou, E.Y.; Johnston, A.; Rodewald, A.D.; Kling, C.L. Conservation Cobenefits from Air Pollution Regulation: Evidence from Birds. Proceedings of the National Academy of Sciences USA 2020, 117, 30900–30906. [Google Scholar] [CrossRef] [PubMed]
- Li, S.; Zheng, X.; Liao, J.; Niu, J. Low-Carbon City Pilot Policy and Corporate Environmental Performance: Evidence from a Quasi-Natural Experiment. International Review of Economics & Finance 2024, 89, 1248–1266. [Google Scholar] [CrossRef]
- Yang, G. Can the Low-Carbon City Pilot Policy Promote Firms’ Low-Carbon Innovation: Evidence from China. PLoS ONE 2023, 18, e0277879. [Google Scholar] [CrossRef] [PubMed]
- Yao, S.; Pan, Y.; Sensoy, A.; Uddin, G.S.; Cheng, F. Green Credit Policy and Firm Performance: What We Learn from China. Energy Economics 2021, 101, 105415. [Google Scholar] [CrossRef]
- Zhang, K.; Li, Y.; Qi, Y.; Shao, S. Can Green Credit Policy Improve Environmental Quality? Evidence from China. Journal of Environmental Management 2021, 298, 113445. [Google Scholar] [CrossRef]
- Huang, J.; Cai, X.; Huang, S.; Tian, S.; Lei, H. Technological Factors and Total Factor Productivity in China: Evidence Based on a Panel Threshold Model. China Economic Review 2019, 54, 271–285. [Google Scholar] [CrossRef]
Figure 1.
(a) The quantity and ratio of applications for low-carbon patents in China with an increasing trend; (b) display of the distribution of and trend in applications for low-carbon patents in the global economy. Note: USPTO, JPO, EPO, KIPO, and CNIPA represent the patent offices of United States, Japan, Europe, Korea, and China, respectively. In (a), the quantity is the number of low-carbon patent applications in a year and the ratio is the proportion of low-carbon patent applications to total patent applications. In (b), the number of low-carbon applications in different patent offices is displayed in the stacked bar chart.
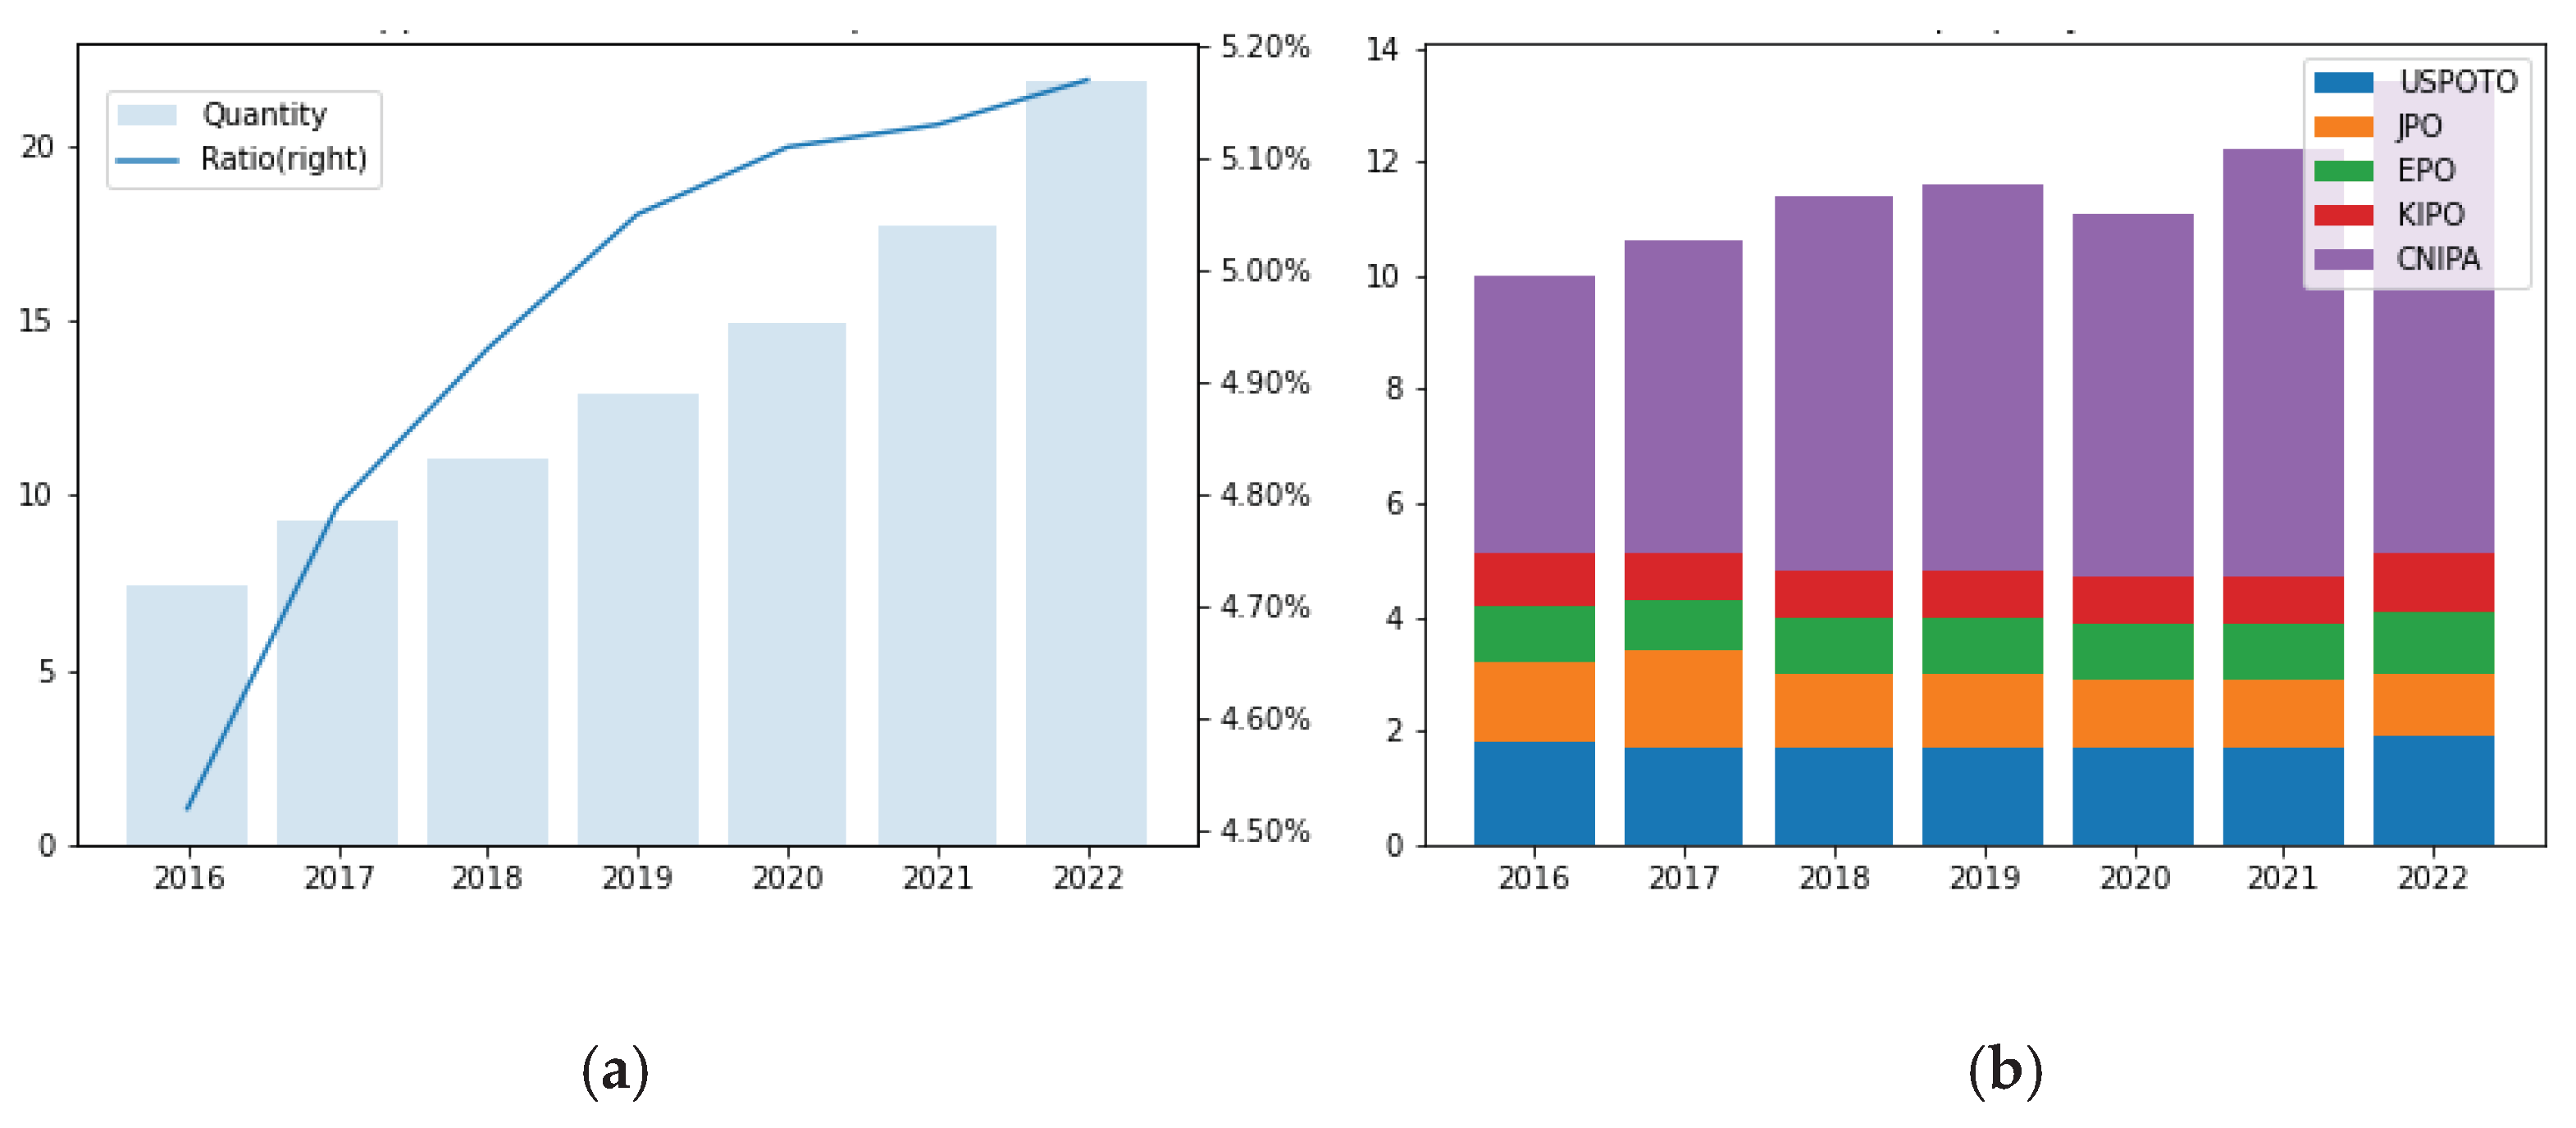

Table 1.
Variable definitions.
| Variables | Definition |
|---|---|
| Distance-to-default (DD) | The measurement of default risks developed by the Merton model [57]; the more the DD is, the less is the default risk. |
| Current ratio | Current ratio is the ratio of current assets and current liabilities, which measures the ability to pay short-term obligations within one year. |
| Debt-to-asset ratio | Debt-to-asset ratio is total liabilities divided by total assets, which measures the level of debt. |
| Total asset turnover | Total asset turnover ratio is the ratio of net sales divided by the average total assets, which measures the efficiency of generating revenue and sales. |
| Net return on assets (ROA) | The return on net assets is the ratio of net income divided by average net assets, which measures the profitability of the business. |
| Return on equity (ROE) | The return on equity is the ratio of net income divided by average shareholders’ equity, which measures the profitability and efficiency of generating profits. |
| Total asset change | Total asset change is the percentage of total asset change, which measures the growth of assets. |
| ROA change | ROA change is the percentage of ROA change, which measures the growth of profitability. |
| Low-carbon patent quantity | The quantity measurement of low-carbon patents, denoting the number of climate change transition innovations. |
| Low-carbon patent generality | The generality measurement of low-carbon patent, denoting the intensity of broad usage of climate transition. |
| Low-carbon patent importance | The importance measurement of low-carbon patent citations, denoting the quality and importance for climate change transition innovations. |
| Low-carbon patent time costs | The difference between the application date and the approval date of the low-carbon patent in the industry level, indicating time costs of innovations. |
| Investor attention score | The annual median of daily Baidu search index for listed firms. |
| Total factor productivity | Total factor productivity (TFP) is the efficiency of productive activities over time, a productivity indicator that measures total output per unit of total inputs and is calculated with the generalized method of moments. |
| Patent centrality | The centrality degree of patent similarity network to describe the technology spillovers. |
Table 2.
Descriptive statistics of main variables.
| Variables | Signal | Observations | Mean | SD | Min | Max |
|---|---|---|---|---|---|---|
| Distance-to-default | DD | 23,580 | 8.683 | 5.953 | 0 | 315.6 |
| Current ratio | CR | 23,580 | 2.620 | 3.145 | 0.00592 | 80.66 |
| Asset loan rate | AL | 23,580 | 0.428 | 1.201 | 0.00836 | 178.3 |
| Total asset turnover | TAT | 23,580 | 0.643 | 0.529 | -0.0479 | 12.37 |
| Net ROA | ROA | 23,580 | 0.0396 | 0.144 | -9.117 | 12.21 |
| ROE | ROE | 23,580 | 0.0429 | 1.229 | -174.9 | 14.02 |
| Total asset change | TAG | 23,580 | 0.217 | 0.710 | -0.961 | 37.03 |
| ROA change | ROAG | 23,580 | -7.743 | 362.8 | -36,206 | 7,310 |
| Low-carbon patent quantity | LCQ | 23,580 | 0.790 | 8.935 | 0 | 417 |
| Low-carbon patent generality | LCG | 23,580 | 0.860 | 9.621 | 0 | 450 |
| Low-carbon patent importance | LCI | 23,580 | 1.260 | 15.26 | 0 | 750 |
| Low-carbon patent time costs | LCT | 23,580 | 23.45 | 73.61 | 0 | 1,250 |
| Total factor productivity | TFP | 23,580 | 3.119 | 1.408 | 0 | 9.391 |
| Investor attention score | IA | 23,580 | 942.7 | 1,423 | 0 | 44,965 |
| Patent centrality | PC | 23,580 | 0.0325 | 0.0703 | 0 | 0.888 |
Table 3.
Default risks and low-carbon innovations.
| (1) | (2) | (3) | (4) | (5) | (6) | |
|---|---|---|---|---|---|---|
| LCQ | 0.007** | 0.007** | ||||
| (0.003) | (0.003) | |||||
| LCG | 0.007** | 0.007** | ||||
| (0.003) | (0.003) | |||||
| LCI | 0.004* | 0.004* | ||||
| (0.002) | (0.002) | |||||
| CR | 0.273*** | 0.271*** | 0.273*** | 0.271*** | 0.273*** | 0.271*** |
| (0.048) | (0.049) | (0.048) | (0.049) | (0.048) | (0.049) | |
| AL | -0.029* | -0.021 | -0.029* | -0.021 | -0.029* | -0.021 |
| (0.016) | (0.022) | (0.016) | (0.022) | (0.016) | (0.022) | |
| TAT | 0.356** | 0.352* | 0.356** | 0.351* | 0.358** | 0.353* |
| (0.177) | (0.180) | (0.177) | (0.180) | (0.177) | (0.180) | |
| ROA | -0.478*** | -0.494*** | -0.478*** | -0.494*** | -0.476** | -0.492*** |
| (0.185) | (0.187) | (0.185) | (0.187) | (0.185) | (0.187) | |
| ROE | -0.009 | -0.010 | -0.009 | -0.010 | -0.009 | -0.010 |
| (0.007) | (0.009) | (0.007) | (0.009) | (0.007) | (0.009) | |
| TAG | 0.316*** | 0.339*** | 0.316*** | 0.339*** | 0.316*** | 0.339*** |
| (0.081) | (0.091) | (0.081) | (0.091) | (0.081) | (0.091) | |
| ROAG | 0.000** | 0.000** | 0.000** | 0.000** | 0.000** | 0.000** |
| (0.000) | (0.000) | (0.000) | (0.000) | (0.000) | (0.000) | |
| Cons | 5.954*** | 10.234*** | 5.954*** | 10.234*** | 5.956*** | 10.235*** |
| (0.166) | (1.348) | (0.166) | (1.348) | (0.166) | (1.348) | |
| Firm FE | YES | YES | YES | YES | YES | YES |
| Year FE | YES | YES | YES | YES | YES | YES |
| Prov FE | NO | YES | NO | YES | NO | YES |
| Ind FE | NO | YES | NO | YES | NO | YES |
| Obs | 23,580 | 23,580 | 23,580 | 23,580 | 23,580 | 23,580 |
| 0.050 | 0.053 | 0.050 | 0.053 | 0.050 | 0.053 |
Note: *, **, *** denote significance at the 10%, 5%, and 1% levels, respectively, and the values in parentheses are robust standard errors of clustering in the firm–year dimension.
Table 4.
Robustness test for normalization.
| (1) | (2) | (3) | (4) | (5) | (6) | |
| z-score normalization | Min–max normalization | |||||
| LCQ | 0.005*** | 3.042*** | ||||
| (0.002) | (1.187) | |||||
| LCG | 0.005** | 3.056** | ||||
| (0.002) | (1.251) | |||||
| LCI | 0.005* | 3.228* | ||||
| (0.002) | (1.801) | |||||
| CR | 0.016*** | 0.016*** | 0.016*** | 0.000*** | 0.000*** | 0.000*** |
| (0.003) | (0.003) | (0.003) | (0.000) | (0.000) | (0.000) | |
| AL | -0.001 | -0.001 | -0.001 | -0.000 | -0.000 | -0.000 |
| (0.001) | (0.001) | (0.001) | (0.000) | (0.000) | (0.000) | |
| TAT | 0.020* | 0.020* | 0.021* | 0.000* | 0.000* | 0.000* |
| (0.010) | (0.010) | (0.011) | (0.000) | (0.000) | (0.000) | |
| ROA | -0.029*** | -0.029*** | -0.029*** | -0.000*** | -0.000*** | -0.000*** |
| (0.011) | (0.011) | (0.011) | (0.000) | (0.000) | (0.000) | |
| ROE | -0.001 | -0.001 | -0.001 | -0.000 | -0.000 | -0.000 |
| (0.000) | (0.000) | (0.000) | (0.000) | (0.000) | (0.000) | |
| TAG | 0.020*** | 0.020*** | 0.020*** | 0.000*** | 0.000*** | 0.000*** |
| (0.005) | (0.005) | (0.005) | (0.000) | (0.000) | (0.000) | |
| ROAG | 0.000** | 0.000** | 0.000** | 0.000** | 0.000** | 0.000** |
| (0.000) | (0.000) | (0.000) | (0.000) | (0.000) | (0.000) | |
| Cons | 0.008 | 0.008 | 0.008 | 0.003*** | 0.003*** | 0.003*** |
| (0.078) | (0.078) | (0.078) | (0.000) | (0.000) | (0.000) | |
| Obs | 23,580 | 23,580 | 23,580 | 23,580 | 23,580 | 23,580 |
| 0.053 | 0.053 | 0.053 | 0.053 | 0.053 | 0.053 | |
Note: *, **, *** denote significance at the 10%, 5%, and 1% levels, respectively, and the values in parentheses are robust standard errors of clustering in the firm–year dimension.
Table 5.
Robustness test for different default risk indicators.
| (1) Merton |
(2) Merton |
(3) Merton |
(4) KMV |
(5) KMV |
(6) KMV |
|
|---|---|---|---|---|---|---|
| LCQ | 0.009*** | 0.003*** | ||||
| (0.003) | (0.001) | |||||
| LCG | 0.009*** | 0.003*** | ||||
| (0.003) | (0.001) | |||||
| LCI | 0.006*** | 0.004*** | ||||
| (0.002) | (0.001) | |||||
| CR | 0.325*** | 0.325*** | 0.325*** | 0.068*** | 0.068*** | 0.068*** |
| (0.055) | (0.055) | (0.055) | (0.014) | (0.014) | (0.013) | |
| AL | -0.023 | -0.023 | -0.023 | -0.048*** | -0.048*** | -0.048*** |
| (0.028) | (0.028) | (0.028) | (0.018) | (0.019) | (0.018) | |
| TAT | 0.498** | 0.498** | 0.500** | 0.173 | 0.173 | 0.174 |
| (0.199) | (0.199) | (0.199) | (0.120) | (0.120) | (0.120) | |
| ROA | 0.079 | 0.079 | 0.081 | 0.412*** | 0.412*** | 0.413*** |
| (0.253) | (0.253) | (0.253) | (0.155) | (0.155) | (0.155) | |
| ROE | -0.013** | -0.013** | -0.013** | 0.001 | 0.001 | 0.001 |
| (0.005) | (0.005) | (0.005) | (0.012) | (0.012) | (0.012) | |
| TAG | 0.259*** | 0.259*** | 0.259*** | 0.009 | 0.009 | 0.008 |
| (0.086) | (0.086) | (0.086) | (0.022) | (0.022) | (0.022) | |
| ROAG | 0.000** | 0.000** | 0.000** | 0.000 | 0.000 | 0.000 |
| (0.000) | (0.000) | (0.000) | (0.000) | (0.000) | (0.000) | |
| Cons | 11.399*** | 11.399*** | 11.400*** | 2.987** | 2.987** | 2.988** |
| (1.457) | (1.457) | (1.458) | (1.384) | (1.384) | (1.386) | |
| Obs | 23,580 | 23,580 | 23,580 | 23,580 | 23,580 | 23,580 |
| 0.036 | 0.036 | 0.035 | 0.076 | 0.076 | 0.076 |
Note: **, *** denote significance at the 5% and 1% levels, respectively, and the values in parentheses are robust standard errors of clustering in the firm–year dimension.
Table 6.
Heterogeneous analysis from low-carbon city pilot.
| (1) | (2) | (3) | |
| Innovation= | Quantity | Generality | Importance |
| LCCPInnovation | -0.018* | -0.016* | 0.006** |
| (0.010) | (0.010) | (0.003) | |
| LCCP | 0.166 | 0.166 | 0.158 |
| (0.559) | (0.559) | (0.558) | |
| Innovation | 0.024** | 0.022** | 0.000 |
| (0.010) | (0.009) | (0.001) | |
| CR | 0.273*** | 0.273*** | 0.273*** |
| (0.048) | (0.048) | (0.048) | |
| AL | -0.029* | -0.029* | -0.029* |
| (0.016) | (0.016) | (0.016) | |
| TAT | 0.355** | 0.355** | 0.356** |
| (0.177) | (0.177) | (0.177) | |
| ROA | -0.479*** | -0.479*** | -0.476*** |
| (0.185) | (0.185) | (0.185) | |
| ROE | -0.009 | -0.009 | -0.009 |
| (0.007) | (0.007) | (0.007) | |
| TAG | 0.316*** | 0.316*** | 0.316*** |
| (0.081) | (0.081) | (0.081) | |
| ROAG | 0.000** | 0.000** | 0.000** |
| (0.000) | (0.000) | (0.000) | |
| Cons | 5.858*** | 5.858*** | 5.866*** |
| (0.349) | (0.349) | (0.349) | |
| Obs | 23,580 | 23,580 | 23,580 |
| 0.050 | 0.050 | 0.050 |
Note: *, **, *** denote significance at the 10%, 5%, and 1% levels, respectively, and the values in parentheses are robust standard errors of clustering in the firm–year dimension.
Table 7.
Heterogeneous analysis from green credit policy shocks.
| (1) | (2) | (3) | |
| Innovation= | Quantity | Generality | Importance |
| PolicyInnovation | -0.062*** | -0.052*** | -0.049* |
| (0.020) | (0.018) | (0.029) | |
| Policy | 1.309** | 1.309** | 1.376** |
| (0.618) | (0.619) | (0.610) | |
| Innovation | 0.007** | 0.006** | 0.003 |
| (0.003) | (0.003) | (0.002) | |
| CR | 0.145*** | 0.145*** | 0.146*** |
| (0.018) | (0.018) | (0.018) | |
| AL | -0.030 | -0.030 | -0.030 |
| (0.027) | (0.027) | (0.027) | |
| TAT | -0.262** | -0.262** | -0.262** |
| (0.125) | (0.125) | (0.125) | |
| ROA | -0.243 | -0.244 | -0.241 |
| (0.158) | (0.158) | (0.158) | |
| ROE | -0.008 | -0.008 | -0.007 |
| (0.006) | (0.006) | (0.006) | |
| TAG | -0.050 | -0.050 | -0.050 |
| (0.035) | (0.035) | (0.035) | |
| ROAG | 0.000*** | 0.000*** | 0.000*** |
| (0.000) | (0.000) | (0.000) | |
| Cons | 7.636*** | 7.636*** | 7.634*** |
| (0.604) | (0.604) | (0.603) | |
| Obs | 23,580 | 23,580 | 23,580 |
| 0.272 | 0.272 | 0.271 |
Note: **, *** denote significance at the 5% and 1% levels, respectively, and the values in parentheses are robust standard errors of clustering in the firm–year dimension.
Table 8.
Endogeneity issues in 2SLS without endogeneity.
| Quantity | Generality | Importance | ||||
| 1st-stage | 2nd-stage | 1st-stage | 2nd-stage | 1st-stage | 2nd-stage | |
| (1) | (2) | (3) | (4) | (5) | (6) | |
| LCT | 0.047** | 0.052** | -0.058** | |||
| (0.021) | (0.023) | (0.023) | ||||
| Innovations | 0.187** | 0.174** | -0.156* | |||
| (0.097) | (0.090) | (0.081) | ||||
| Obs | 23,059 | 23,059 | 23,059 | 23,059 | 23,059 | 23,059 |
| 0.021 | 0.021 | 0.021 | 0.021 | 0.126 | 0.126 | |
| Controls | YES | YES | YES | YES | YES | YES |
| Instrument Validity Tests for IV regression | ||||||
| (i) F-test for excluded instrument in first stage | ||||||
| Sanderson–Windmeijer F-test | 5.06** | 5.12** | 6.17** | |||
| (ii) Under-identification test | ||||||
| Kleibergen–Paap LM statistic | 4.891** | 4.941** | 6.04** | |||
| (iii)Weak identification test | ||||||
| Cragg–Donald–Wald F statistic | 201.65 | 201.79 | 113.31 | |||
| Stock–Yogo weak ID test | ||||||
| 10% max IV size | 16.38 | 16.38 | 16.38 | |||
| 15% max IV size | 8.96 | 8.96 | 8.96 | |||
| 20% max IV size | 6.66 | 6.66 | 6.66 | |||
| 25% max IV size | 5.53 | 5.53 | 5.53 | |||
Note: *, ** denote significance at the 10% and 5% levels, respectively, and the values in parentheses are robust standard errors of clustering in the firm–year dimension.
Table 9.
Mediator effects from investor attention.
| (1) | (2) | (3) | (4) | (5) | (6) | |
| investor attention | DD | investor attention | DD | investor attention | DD | |
| IA | -0.001*** | -0.001*** | -0.001*** | |||
| (0.000) | (0.000) | (0.000) | ||||
| LCQ | -6.275*** | 0.007* | ||||
| (1.598) | (0.004) | |||||
| LCG | -5.840*** | 0.006 | ||||
| (1.531) | (0.004) | |||||
| LCI | -5.397*** | 0.000 | ||||
| (1.643) | (0.002) | |||||
| CR | -9.765*** | 0.141*** | -9.767*** | 0.141*** | -12.818*** | 0.262*** |
| (3.299) | (0.018) | (3.299) | (0.018) | (2.909) | (0.048) | |
| AL | 9.565 | -0.030 | 9.569 | -0.030 | 6.476 | -0.017 |
| (5.955) | (0.026) | (5.956) | (0.026) | (5.004) | (0.020) | |
| TAT | 65.143** | -0.232* | 65.171** | -0.232* | 43.898* | 0.385** |
| (28.621) | (0.122) | (28.625) | (0.122) | (26.622) | (0.180) | |
| ROA | 83.995* | -0.226 | 84.059* | -0.226 | 60.848* | -0.447** |
| (43.369) | (0.147) | (43.378) | (0.147) | (36.741) | (0.184) | |
| ROE | 1.341 | -0.007 | 1.340 | -0.007 | 2.582** | -0.008 |
| (0.945) | (0.006) | (0.946) | (0.006) | (1.079) | (0.009) | |
| TAG | -15.286* | -0.057* | -15.298* | -0.057* | -19.690*** | 0.324*** |
| (7.960) | (0.034) | (7.961) | (0.034) | (7.097) | (0.088) | |
| ROAG | -0.010*** | 0.000*** | -0.010*** | 0.000*** | -0.010*** | 0.000** |
| (0.003) | (0.000) | (0.003) | (0.000) | (0.003) | (0.000) | |
| Cons | 2,354.184*** | 8.646*** | 2,354.560*** | 8.646*** | 2,192.537*** | 11.850*** |
| (185.072) | (0.612) | (185.111) | (0.612) | (170.333) | (1.446) | |
| Obs | 23,580 | 23,580 | 23,580 | 23,580 | 23,580 | 23,580 |
| 0.215 | 0.286 | 0.215 | 0.286 | 0.199 | 0.063 |
Note: *, **, *** denote significance at the 10%, 5% and 1% levels, respectively, and the values in parentheses are robust standard errors of clustering in the firm–year dimension.
Table 10.
Mediator effects from production efficiency.
| (1) | (2) | (3) | (4) | (5) | (6) | |
| TFP | DD | TFP | DD | TFP | DD | |
| TFP | 0.227*** | 0.227*** | 0.973*** | |||
| (0.053) | (0.053) | (0.119) | ||||
| LCQ | 0.001* | 0.010** | ||||
| (0.001) | (0.004) | |||||
| LCG | 0.001* | 0.008** | ||||
| (0.000) | (0.004) | |||||
| LCI | -0.001 | 0.004 | ||||
| (0.000) | (0.003) | |||||
| CR | 0.005 | 0.147*** | 0.005 | 0.147*** | -0.069*** | 0.204*** |
| (0.004) | (0.018) | (0.004) | (0.018) | (0.009) | (0.042) | |
| AL | 0.000 | -0.034 | 0.000 | -0.034 | 0.004 | -0.018 |
| (0.010) | (0.026) | (0.010) | (0.026) | (0.007) | (0.019) | |
| TAT | 0.843*** | -0.069 | 0.843*** | -0.069 | 0.475*** | 0.816*** |
| (0.071) | (0.128) | (0.071) | (0.128) | (0.050) | (0.221) | |
| ROA | 0.294** | -0.196 | 0.294** | -0.196 | 0.427*** | -0.077 |
| (0.130) | (0.136) | (0.130) | (0.136) | (0.103) | (0.162) | |
| ROE | -0.007* | -0.009 | -0.007* | -0.009 | -0.009** | -0.019*** |
| (0.004) | (0.006) | (0.004) | (0.006) | (0.004) | (0.006) | |
| TAG | -0.021* | -0.056 | -0.021* | -0.056 | -0.217*** | 0.127** |
| (0.012) | (0.035) | (0.012) | (0.035) | (0.048) | (0.065) | |
| ROAG | 0.000 | 0.000*** | 0.000 | 0.000*** | 0.000 | 0.000** |
| (0.000) | (0.000) | (0.000) | (0.000) | (0.000) | (0.000) | |
| Cons | 0.702** | 7.779*** | 0.702** | 7.777*** | -0.068 | 10.169*** |
| (0.293) | (0.564) | (0.293) | (0.565) | (0.279) | (1.325) | |
| Obs | 23,580 | 23,580 | 23,580 | 23,580 | 23,580 | 23,580 |
| 0.260 | 0.272 | 0.260 | 0.272 | 0.178 | 0.078 |
Note: *, **, *** denote significance at the 10%, 5% and 1% levels, respectively, and the values in parentheses are robust standard errors of clustering in the firm–year dimension.
Table 11.
Mediator effects from technology spillovers.
| (1) | (2) | (3) | (4) | (5) | (6) | |
| spillovers | DD | spillovers | DD | spillovers | DD | |
| PC | 2.488* | 2.500* | 2.435** | |||
| (1.332) | (1.344) | (1.126) | ||||
| LCQ | 0.003*** | -0.000 | ||||
| (0.001) | (0.004) | |||||
| LCG | 0.003*** | -0.000 | ||||
| (0.001) | (0.004) | |||||
| LCI | 0.001*** | 0.004 | ||||
| (0.000) | (0.003) | |||||
| CR | -0.000 | 0.272*** | -0.000 | 0.272*** | -0.000 | 0.272*** |
| (0.000) | (0.049) | (0.000) | (0.049) | (0.000) | (0.049) | |
| AL | 0.000* | -0.022 | 0.000* | -0.022 | 0.000* | -0.022 |
| (0.000) | (0.022) | (0.000) | (0.022) | (0.000) | (0.022) | |
| TAT | 0.001* | 0.348* | 0.001* | 0.348* | 0.000 | 0.349* |
| (0.001) | (0.180) | (0.001) | (0.180) | (0.001) | (0.180) | |
| ROA | 0.004* | -0.503*** | 0.004* | -0.503*** | 0.005** | -0.503*** |
| (0.002) | (0.187) | (0.002) | (0.187) | (0.002) | (0.187) | |
| ROE | 0.000 | -0.010 | 0.000 | -0.010 | 0.000 | -0.010 |
| (0.000) | (0.009) | (0.000) | (0.009) | (0.000) | (0.009) | |
| TAG | 0.000 | 0.339*** | 0.000 | 0.339*** | 0.000 | 0.338*** |
| (0.000) | (0.091) | (0.000) | (0.091) | (0.000) | (0.091) | |
| ROAG | -0.000 | 0.000*** | -0.000 | 0.000*** | -0.000 | 0.000*** |
| (0.000) | (0.000) | (0.000) | (0.000) | (0.000) | (0.000) | |
| Cons | 0.016*** | 10.193*** | 0.016*** | 10.193*** | -0.014** | 10.195*** |
| (0.005) | (1.347) | (0.005) | (1.347) | (0.006) | (1.348) | |
| Obs | 23,580 | 23,580 | 23,580 | 23,580 | 23,580 | 23,580 |
| 0.253 | 0.054 | 0.261 | 0.054 | 0.124 | 0.054 |
Note: *, **, *** denote significance at the 10%, 5%, and 1% levels, respectively, and the values in parentheses are robust standard errors of clustering in the firm–year dimension.
Disclaimer/Publisher’s Note: The statements, opinions and data contained in all publications are solely those of the individual author(s) and contributor(s) and not of MDPI and/or the editor(s). MDPI and/or the editor(s) disclaim responsibility for any injury to people or property resulting from any ideas, methods, instructions or products referred to in the content. |
© 2024 by the authors. Licensee MDPI, Basel, Switzerland. This article is an open access article distributed under the terms and conditions of the Creative Commons Attribution (CC BY) license (https://creativecommons.org/licenses/by/4.0/).
Copyright: This open access article is published under a Creative Commons CC BY 4.0 license, which permit the free download, distribution, and reuse, provided that the author and preprint are cited in any reuse.


