Submitted:
09 March 2024
Posted:
12 March 2024
You are already at the latest version
Abstract
Inflammation is a cause of number of disorders. Many anti-inflammatory drugs are available to cure and prevent inflammation and its related disorders. Some of the drugs are from plant and animal origin. Among animals snake venom is also utilized as treatment option of certain disorders. In the current study the venom of N. oxiana from Northern areas of Pakistan is assayed to determine its anti-inflammatory activity. The Naja oxiana is also called central Asian cobra is endemic to Central Asia. Naja oxiana belong to family Elapidae and it is highly venomous snake. The venom has many enzymatic proteins as well as nonenzymatic proteins that is neurotoxins. The venom is lethal having very high mortality rate and the death may occur due to respiratory failure in 45 minutes to 24 hrs depending upon the nature and amount of venom. As the venom is highly toxic so initially after venom milking its protein estimation was done and toxicity profile and LD50 was determined to find out its therapeutic dose at which anti-inflammatory activity was observed. The toxicity and anti-inflammatory activity was determined on mice model. Inflammation was induced by carrageenan induced peritonitis method. The inflammatory markers ROS, TNF-α and IL-β were determined by ELIZA in peritoneal fluid. The LD50 of crude venom, fraction 1 and fraction 2 was found as 34 µg/kg, 7.4 µg/kg and 416 µg/kg respectively. Anti-inflammatory activity crude venom, fraction 1 and fraction 2 was found at dose 19 µg/kg, 1.8 µg/kg and 267 µg/kg respectively. The levels of inflammatory markers reduced after therapeutic dose administration of venom and its fractions that indicates that it can be utilized as anti-inflammatory agent and so can be effective in various disorders.
Keywords:
Naja oxiana
; anti-inflammatory
; carrageenan induced peritonitis
; Toxicity testing
; LD50
Introduction
About thousands of years, natural products have been playing an influential role in the prevention and treatment of human diseases. The first product recorded come from the civilizations of Greece, Mesopotamia, China, Egypt and the Arabs. Indeed, the term “drug” probably comes from Arabic [1,2,3]. According to the World Health Organization (WHO), treatment with traditional medicinal agents has greatly valuable and around the 65% of the world’s population has incorporated them into the mainstream of medical care [4,5].
One of the eminent examples is the approval of commercial Exenatide, an analogue of glycogen peptide type-1 (GLP-1). An innovation in the diabetes treatment having a valid and safe compound that lower glucose levels and improves metabolic control in patients with type-II diabetes. This was obtained from Exendin-4 by synthetic derivation, which was isolated from the world’s poisonous lizard venom named the “Gila monster”, after extensive screening of the toxic chemical structure and biological effects. The main idea of finding an anti-diabetic compound in a lizard’s poison was a “clinical” observation that pancreatitis could develop in lizard bite victims, and it was believed to be caused by the venom inducing the inflammation of the organ. The later on, scientists ascertain the active moiety can be isolated and its ability to lower blood sugar level appears to be the result of its resemblance to the human hormone GLP-1, which stimulates insulin growth from the pancreas. Moreover, 15 years required to delivered the right medication to the market, but the success pathway started with the observations of the effect of lizard venom on humans, retrograde translation, preclinical and clinical development of the new drug named Exenatide; which was achieved due to their unique function of reducing HbA1C levels as a measure of glucose and reducing weight on the same place [6,7]. Caspian cobra venom was also found to have anti-rabies activity [8] as well antileishmania activity [9]. Venom proteins can have cardiotoxic as well cardioprotective effects. As some are cardiotoxins, phospholipases A2, natriuretic and bradykinin potentiating peptides. Venom proteins also have vasoactive and cardiotropic effects and can participate in preventing effect of cardiovascular diseases [10,11].
Systematic research into animal venom-based drugs has been conducted in other areas too, i.e., Hirudin and its derivative Bivalirudin [12] found in the saliva of medicinal Leech or “Ancord” derived from the snake venom [13] having an anticoagulant effect. Since many companies and academic institutions carried out the systematic screening of animal venom due to their strong biological effect. However, there are a few approaches to snake venom intended to cure cancer [14], which seems quite a long way from the reason why snake venoms were originally created. Researches also worked for antivenom production and it is found that use of MF59 adjuvant by subcutaneous route is better alternate of Freund’s adjuvants that gives better immunopotentiation capability and is safe [15].
The snake has been used as traditional Chinese medicine for centuries; however, their active components and mechanisms remain primarily unclear. Studies have shown that snake venom is a mixture of proteins and peptides with different biological activity [16].
The treatment of pain and arthritis with cobra snake venom was followed in the conventional systems of medicine in India [17]. It was reported that Indian cobra (Naja kaouthia) venom (NKV) prevented arthritis by lowering the proinflammatory cytokines in adjuvant induced arthritis animal model [18]. Furthermore, a protein toxin Naja kaouthia cytotoxin 1 (NKCT-1) was found to possess anti-inflammatory and anti-nociceptive properties [19].
The Elapid snakes are exemplified by cobras that are extensively found at Asia and Africa, having importance at medical aspects includes Naja species: N. haje , N. nigricollis, N. kaouthia, N. siamensis, N. atra, Ophiophagus Hannah (king cobra), Naja naja and many more [20].
Asian cobras form a complex and widespread group of venomous snakes belongs to the genus Naja as they have ambiguous taxonomy [21,22]. In Pakistan two types of cobra are found generally: (1) black which is common at regions of Southern and Eastern Pakistan (2) brown ox cobra (N. oxiana) only present in Northern parts of Pakistan [23,24].
Cobra venom is a complex mixture that can be divided into proteins, peptides, and enzymes having variety of biochemical and pharmacological functions i.e., 1) proteins such as Neurotoxins, Cardiotoxins, (PLA2) Phospholipase A2, (LAAO) L-amino acid oxidase, Protease and Acetylcholinesterase; 2) peptides such as Disintegrins; 3) low-molecular-weight organic compounds such as Histamines and Carbohydrates; and 4) inorganic ions such as Magnesium, Potassium, Iron, Cobalt and so on [25].
Nevertheless, the snake’s venom composition may have inter and intra-species distinction, depending on gender, habitat, diet and ontogeny [26]. Sadat et al., in 2023 isolated a peptide (Oxineur) from Iranaian Caspian cobra (Naja naja oxiana) having molecular weight range of 7kDa and it was found to have effective against colorectal cancer as on HT-29 cell line of colon cancer it produced apoptotic effect [27].
Thus, chronic inflammatory illness is the most significant cause of deaths; prevalence rate was approximately 350 million people worldwide. However, these conditions emphasize to develop the new & natural therapies for better treatment. Despite of its destructive tendency, snake venom has been studied extensively to identify lead compounds; it is currently believed that snake venom had the potential source of new compounds with wide range of biological activities and pharmacological effect that can be utilized in the development of new therapeutic agents [28]. An optimistic review on antitumor, antinociceptive, antimicrobial, anti-inflammatory, antifibrinolytic, anticoagulant and anti-hypertensive activities of snake venom have initiated more intensive studies to be conducted for venom and venom glands by applying the venomics [29,30,31]. However, it is generally speculated that nutritional and environmental conditions affect the distribution and concentration of snake venom components that causes divergence between the families, genera, species and individuals [32].
Shi et al. demonstrated that cobratoxin isolated from NKV, reduced the amount of time rats spend to licking the formalin injected paw both in the early phase (0-15 min) and in the late phase (20-60 min) [33]. In the meantime, NNAV showed similar results, indicating that the cobra venom might improve the inflammation [34].
The core factor called nuclear factor-kappa B (NF-κB) is a transcription factor that regulates inflammatory reactions [35,36]; under normal condition, NF-κB binds to IκB inhibitor proteins (IκB-a, IκB-β, IκB-ε etc.) in the cytoplasm [37]. But, in inflammation, the pro-inflammatory cytokines such as TNF-α and IL-1β can activate the phosphorylation of IκB kinases (IKK) [38]. When P-IKKs are up-regulated, IκB proteins are cleaved by proteasomes that precipitate the NF-κB translocation which is released into the nucleus to induce transcription of the target gene, including TNF-α, interleukins [39]. Previous studies have shown NNAV down-regulated P-IKK-α levels and elevated IκB-α expression, thereby restricting the NF-κB p65 nuclear translocation. Meanwhile, it reduced the levels of TNF-α and IL-1β in a model of adriamycin-induced rat nephropathy [40].
In another study by Ruan et al. NNAV neurotoxin-Nna inhibits the activation of NF-κB and reduced the levels of TNF-α, IL-1β, cell-cell adhesion molecule-1 (ICAM-1), myeloperoxidase (MPO), Malondialdehyde (MDA) and inducible nitric oxide synthase (iNOS). Furthermore, cobratoxin suppressed the expression of TNF-α, interleukin-4 (IL-4), cytoxygenase-2 (COX-2) and iNOS in astrocytes induced by lipopolysaccharide (LPS) [41].
This overview reflects that the cobra venom and its active constituents have a potent anti-inflammatory effect. In Pakistan pharmacological screening of Naja oxiana venom for the discovery of new compounds has not been investigated. Thus, the present study aims to reveal the therapeutic potential of N. oxiana venom and to understand the depth of proteins present in venom (as shown in Figure 1).
Results
2. Protein Estimation
(a) Nano Drop Method
Micro-volume protein concentration was determined by a direct A 280 measurement assay; determined the concentration (mg/mL) based on the extinction coefficient of the protein of interest at 280 nm absorbance. The crude venom, Fraction-1 and Fraction-2 protein concentration against Bovine Serum Albumin as a standard was calculated using the mass extinction coefficient of 6.7 at 280 nm for a 1% (10 mg/mL) BSA solution followed by Beer’s Lambert equation as described above in the methodology section. The protein estimated in Pooled venom was (110 mg/mL) Crude venom (9.8 mg/mL), Fraction-1 (90.3 mg/mL), Fraction-2 (0.81 mg/mL) with reference to standard (i.e., BSA = 2 mg/mL) (Table 1).
The table represents the protein concentrations (mg/mL) in Pooled venom, 10x diluted Crude venom and partially purified Fraction-1 and Fraction-2 of Naja oxiana venom.
(a) Bradford ASSAY
The average absorbance at 595 nm for blank (0.475) was subtracted from the all individual standard and sample absorbance reading. The standard curve and the equation of the calibration were generated by plotting measurement at 595 nm of each standard versus its concentration (μg in 250 μL) using Microsoft Office Excel – 2010 (Figure 2). The protein concentration of sample calculated using the below formula:
The average protein concentration (μg/µL) of Pooled venom, Crude venom, F-1 and F-2 with the dilution factor of five in each sample were 115, 11.1, 93.4 and 1.1 μg/µL respectively, i.e., approximately same as the protein values determined by Nano drop.
Protein estimation by using Bradford method; in equation (x) stand for sample concentration and (y) stand for average net absorbance.
Where, OD = Optical Density is the measure of absorbance (595 nm).
Median Lethal Dose (LD50) Determination
2.Toxicity Studies
The intraperitoneal administration of crude venom (25.5, 19, 9.5 µg/Kg), F-1 (5 and 3.7 µg/Kg) and F-2 (333, 267, 200 µg/Kg) in animals (n= 5mice for each dose) produce no effect on food consumption (24 ± 0.9 g) when it was compared with control mice group (25 ± 0.8 g) and mice tolerated it very well. No visible changes were observed in behavior as agitation, restlessness, tremors, convulsions, dullness as well piloerection. The animals were observed for 14 days after once administration of dose for acute toxicity and repeated administration for sub acute toxicity.
The haematological parameters and histopathological changes were also observed. In Blood picture. Plateletes, WBCs, RBCs and Haemoglobin levels were raised (Table 6 and Table 9). Levels of creatinine were almost normal. BUN level was slightly raised. Levels of ALT and AST were almost normal after administration of crude venom. (Table 7 and Table 10). The histopathology of brain, heart, liver and kidney were normal as control after acute toxicity test. In subacute toxicity the histopathology of brain was normal (Figure 3, Figure 4, Figure 5 and Figure 6). In heart some hemorrhages were observed. Congestion in sinusoid and glomerular interstitial congestion were observed in liver and kidney (Figure 7, Figure 8, Figure 9 and Figure 10).
2.Anti-Inflammatory Effect
The dose of Crude venom (19 µg/Kg), Fraction-1 (1.8 µg/Kg) and Fraction-2 (267 µg/Kg) was selected on the basis of the presence of therapeutic activity as mentioned above in Parkinson’s disease model. The selected doses were used to observe their effects on inflammation by analyzing the ROS, TNF-α and IL-β that was found in the peritoneal cavity by the carrageenan-induced peritonitis method.
(a) Effect of Crude Venom, Fraction-1, Fraction-2 and Standard as Dexamethasone on ROS Levels by the Carrageenan-Induced Peritonitis Method on Mice
The DCFH-DA dye was used to observe venom and its Fractions effect on generation of ROS. Their basal levels in peritoneal fluid were 5630 ± 198 RFU which significantly increased by 25323.23 ± 419 RFU upon i.p. administration of Carrageenan. The therapeutic values obtained from Haloperidol-induced Parkinsonism in the presence of Crude venom (19 µg/Kg), Fraction-1 (1.8 µg/Kg) and Fraction-2 (267 µg/Kg) the levels were significantly decreased by 34%, 9% and 31% respectively as compared to (negative) control. In addition dexamethasone also inhibited the production at (3 mg/Kg) 31.2% and (5 mg/Kg) 52% (Figure 11). The potency order appeared to be Dexamethasone (5 mg/Kg) > Crude > Dexamethasone (3 mg/Kg) = Fraction-2 > Fraction-1.
(a) Effect of Crude Venom, Fraction-1, Fraction-2 and Standard as Dexamethasone on the TNF-α Levels by the Carrageenan-Induced Peritonitis Method on Mice
The production of TNF-α were observed by using therapeutic values derived from Haloperidol-induced parkinsonism through ELISA kit. Initially, a standard curve was plotted of TNF-α (0-1000 pg/mL) between concentration v/s absorbance by measuring the absorbance at 450 nm, a linear graph is presented in (Figure 12). The TNF-α basal level 183 ± 4.3 pg/mL in peritoneal fluid were significantly increased after the i.p administration of carrageenan to 563 ± 15.7 pg/ml. The mice treated with values Crude venom (19 µg/Kg), Fraction-1 (1.8 µg/Kg) and Fraction-2 (267 µg/Kg) significantly reduced the concentration by 27.5%, 2% and 28%, respectively. Dexamethasone (3 and 5 mg/Kg) also suppresses its levels by 27% and 45.6% (Figure 14). The potency order appeared to be Dexamethasone (5 mg/Kg) > Fraction-2 > Crude > Dexamethasone (3 mg/Kg) > Fraction-1.
(a) Effect of Crude Venom, Fraction-1, Fraction-2 and Standard as Dexamethasone on the IL-1β Levels by the Carrageenan-Induced Peritonitis Method on Mice
The levels of IL-1β were observed by using the same therapeutic values derived from Haloperidol-induced parkinsonism through IL-1β ELISA Kit. Initially, a standard curve was plotted of IL-1β (0-1000 pg/mL) between concentration v/s absorbance by measuring the absorbance at 450 nm, a linear graph is presented in (Figure 13). The IL-1β basal levels were 322.7 ± 7.1 pg/mL which significantly increased 1519.5 ± 562 pg/mL by i.p administration of carrageenan. In the presence of Crude venom (19 µg/Kg), Fraction-1 (1.8 µg/Kg) and Fraction-2 (267 µg/Kg), IL-1β levels were significantly inhibited by 30.4%, 7.2% and 35%, respectively (Figure 15). The reference drug Dexamethasone (3 and 5 mg/Kg) also significantly reduced its levels to 33% and 55% respectively in a dose dependent manner. The potency order appeared to be Dexamethasone (5 mg/Kg) > Fraction-2 > Dexamethasone (3 mg/Kg) > Crude > Fraction-1.
Values represented mean ± SEM of time (n = 5) in three independent experiments. Cg (1%) induced 25323.23 ± 419 RFU in negative control mice.
Asterisks indicate significant differences in ROS (*p < 0.05, **p < 0.01 and ***p < 0.001) with respect to negative control.
Where,
Control received (100 µL N/S),
Dexa is Dexamethasone (3 and 5 mg/Kg),
Crude venom (19 µg/Kg),
Fraction-1 (1.8 µg/Kg)
Fraction-2 (267 µg/Kg)
Cg is Carrageenan 1% ( 0.5 mL).
To obtain the TNF-α concentration in the presence as well as absence of test compounds, a graph was plotted between the (100 µL) TNF-α of various concentrations (0, 15.6, 31.2, 62.5, 125, 250, 500 and 1000 pg/mL) on X-axis v/s their absorbance on Y-axis to generate the linear regression line.
To obtain the IL-1β concentration in the presence as well as absence of test compounds, a graph was plotted between the IL-1β of various concentrations (0, 7.8, 15.6, 31.2, 62.5, 125, 250, 500 and 1000 pg/mL) on X-axis v/s there absorbance on Y-axis to generate the best fit line.
Values represented mean ± SEM of time (n = 5) in three independent experiments. Cg (1%) induced 563 ± 15.7 pg/mL in negative control mice.
Asterisks indicate significant differences in TNF-α level (*p < 0.05, **p < 0.01 and ***p < 0.001) with respect to negative control.
Where,
Control received (100 µL N/S),
Dexa is Dexamethasone (3 and 5 mg/Kg),
Crude venom (19 µg/Kg),
Fraction-1 (1.8 µg/Kg)
Fraction-2 (267 µg/Kg)
Cg is Carrageenan 1% ( 0.5 mL).
Values represented mean ± SEM of time (n = 5) in three independent experiments. Cg (1%) induced 1519.5 ± 562 pg/ml in negative control mice.
Asterisks indicate significant differences in IL-1β level (*p < 0.05, **p < 0.01 and ***p < 0.001) with respect to negative control.
Where,
Control received (100 µL N/S),
Dexa is Dexamethasone (3 and 5 mg/Kg),
Crude venom (19 µg/Kg),
Fraction-1 (1.8 µg/Kg)
Fraction-2 (267 µg/Kg)
Cg is Carrageenan 1% ( 0.5 mL).
Discussion
The scientific world has been fascinating from composition and evolutionary annals of animal venoms for centuries. Venoms have expanded from the long time to enable defense or capturing the predators. Snake venoms particularly originated in period known as ‘Cenozoic Era’ [53,54], and they are amongst the most well-characterized of animal venoms regarding their evolution, complexity, and therapeutic applicability. The venom of Elapid snakes, genus Naja, have a vast range of polypeptides, in which the majority is being toxins (neurotoxins and cardiotoxins) , in addition, comprising of biologically active proteins and peptides [55]
Venom toxins are extendedly used as prototypes and a pharmacological tool for drug development due to their high target-specificity [56]. The present study was carried out to evaluate the protein concentration and anti- inflammatory activity of the Crude and its Fractions (F-1 and F-2) of Central Asian Cobra (Naja oxiana) venom on the experimental animal model.
The quantification of total protein content in a sample is a basic step; the crude venom, F-1 and F-2 protein concentration was determined by using Bradford method and Nano drop. The polypeptides which were present in complex mixrure were separated. However, its alternate method is SDS-PAGE under both (reducing and non-reducing) conditions, use for determination of molecular weights. Furthermore, for the isolation and characterization of bioactive proteins present in venom were followed by chromatography, HPLC, UPLC and MALDI-TOF MS methods [57]. The proteome analysis of toxic fraction of Naja naja oxiana was followed by two dimensional electrophoresis and Mass spectrometry [58]. The Nano drop is an advance and rapid assay technique [44] as very less amount of sample (2 µL) required for quantitation. Therefore, for current study Nano drop and Bradford methods were preferred for isolation of the polypeptides which were in the venom. The protein content presented in Crude venom, F-1 and F-2 measured was 9.8, 90.3 and 0.81 µg/µL respectively, whereas in other methods, The Bradford assay is most widely used because of its simpler, sensitive and more convenient protocol in comparison with other dye binding protein estimation techniques (e.g., Lowry Method). The protein concentration calculated in Crude, F-1 and F-2 was 11.1, 93.4 and 1.1 µg/µL respectively. The total protein estimated in samples through Nano drop and Bradford assay, both had shown approximately similar results, thus Bradford readings was slightly different in comparison to Nano drop measurements, which may be due to dye-protein interaction as reported earlier [59,60].
The toxicological study of cobra venom was carried out to identify their effect on the normal physiology of the animals including any behavior changes, sign of toxicity and mortality was observed. To the determination of lethal dose LD50 the acute toxicity experiments were performed at the initial screening of the compounds in the search of new drug. It is that a dose which kills 50% of the test group animals. The route of administration plays an important role in the values of LD50 as it increases with the sequence: intravenous, intraperitoneal, subcutaneous and oral route [61]. The data gathered from the acute toxicity study can serve as to identify the toxic dose and their mode of action of the new compounds [62].
In present study the LD50 determined for the crude venom, F-1 and F-2 was 34, 7.4 and 416 µg/Kg respectively, obtained by intraperitoneal administration of aforementioned test agents. The test samples at doses crude (25.5, 19 and 9.5µg/Kg), F-1 (5 and 3.7 µg/Kg) and F-2 (333, 267 and 200 µg/Kg) were found to be safe however, some dose dependent toxic manifestations were observed such as agitation, restlessness, dullness, piloerection, tremor, forelimb paralysis, convulsions and death in mice. This may due to the presence of complex mixture of constituents present in the venom for example, neurotoxins, cardiotoxins, PLA2, L-amino acid oxidase, metalloproteinase, hydrolases and serine proteases [63].
N. oxiana venom and its fractions didnot produce any toxicity in acute administration. The hematological studies showed raised in blood count and histopathology was also almost normal. In subacute toxicity determination there were some histopathological changes that may be reduced by reducing the dose.
The principle objective of this study was the exploration of the anti-inflammatory activity present in the Cobra venom (Naja oxiana).
Venom therapy has been used as a corresponding and alternative medicine from antiquity for the treatment of arthritis in folk medicine. A brief survey of literature reported that the biotoxins might have pain –relieving and anti-arthritic activity likely as bee venom [64]. Besides this, snake venom also presents the anti-arthritis effect, in recent a compound Crotoxin, a major component found in the venom of Crotalus durissus terrificus snake showed significant reduction in the migration of polymorphonuclear cells and edema in the carrageenan-induced arthritic animal model [65,66]. In the same, cobra venom of Indian monocellate (Naja kaouthia) snake had been effective in arthritis was also verified [67]. The α-neurotoxin (long chain peptide) known as Cobratoxin (CTX) purified from the Thailand cobra venom attains to relieve pain during formalin-induced inflammation [33], anti-nociceptive and anti-inflammatory effects on adjuvant-induced arthritis [68]. A number of studies demonstrated that the cobra (Naja Naja atra), crude venom or isolated components possess analgesic effects, whereas it was heeded as a medicine in Chinese traditional therapy [69,70,71].
To the date, the effect of (N. oxiana) venom on classical models of inflammation has not been investigated yet. The carrageenan-induced inflammatory models had been implied to identify the pathophysiological pathways of acute inflammation and to evaluate the anti-inflammatory response of the compounds [72,73,74]. In the present study carrageenan-induced peritonitis model was used to analyze the anti-inflammatory activity.
Carrageenan is one of the edemogen use to induce inflammation when administered intraperitoneally it produce inflammatory response in the mice which was confirmed by observing the increase number of pro-inflammatory cytokines such as TNF-α and IL-1β. Carrageenan-induced inflammation in peritoneal and pleural cavities is marked by immense exudation and migration of neutrophils [75].
Carrageenan-induced inflammation was attenuated after 4 h of oral administration of Crude venom F-1 and F-2 (Figure 14 and Figure 15) depicted ~1.5x and 1x reduction in the levels of TNF-α and IL-1β respectively. These results revealed that Naja oxiana venom suppress inflammation by attenuating pro-inflammatory cytokines pathway. Similar results were reported previously in a study conducted on the Crotalus durissus terrificus (Cdt) venom, terrifically venomous snake belongs to the pit viper species found in South America. They have a characteristic feature that is presences of a rattle in the tip of their tail, known as rattlesnakes [76]. Crotoxin is key isolated component, β-neurotoxin with heterodimeric structure, composed of both acidic and basic subunits i.e., non-enzymatic and non-toxic subunit (CA), and poorly toxic, phospholipase A2 protein (CB), respectively [77,78]. It was observed that the Cdt venom decreases the cell migration in carrageenan-induced peritonitis, either before 1, 7 and 14 h or 21 days, or even after 1 h of the Cg administration. This consequence was typically ascribed to the inhibition of polymorphonuclear migration, indicated by the differential count, substantiated the earlier observations illustrating that the Cdt venom reduced the cell migration to peritoneal cavity in a thioglycolate-induced inflammatory model [79], Naja kaouthia cytotoxin-1 conjuated with nano gold particles also reduced TNF-α and IL-1β levels 36% and 58.6% inhibition respectively, considering the presence of anti-inflammatory effect as displayed by Crude venom, F-1 and F-2 [80,81,82].
Reactive oxygen species are considered as a basic signaling molecule that play a key role in the progression of inflammation induced disorders. The polymorphonuclear neutrophils (PMNs) generated at the inflammation site enhanced the ROS production that causes the endothelial debility and tissue insult [83]. The passage of inflammatory cells and macromolecules are regulated by the vascular endothelium through blood to tissues. The oxidative stress triggered by the inflammation, opens the inter-endothelial junctions and leads to the migration of inflammatory cells; this would abolish the foreign particles and pathogen but also causes the tissue injury [84]. Therefore, one of the important parameters to evaluate the anti-inflammatory effect of the compound is to measure the ROS Levels.
A carrageenan induced peritonitis mice animal model was followed as the Crude venom (19 µg/Kg) and Fraction-2 (267 µg/Kg) presents a significant decrease ~1.5x respectively (Figure 11), in ROS while Fraction-1 (1.8 µg/Kg) did not produce significant changes in the levels of ROS suggesting that Crude venom and F-2 producing anti-inflammatory effect by ROS pathway. Thus, N. oxiana venom may have a prime role in the management of inflammation which mediated through the oxidative stress signaling mechanisms.
Therefore, in view of literature studies and present findings it is postulated that the N. oxiana venom may contribute in the development of new compound having an anti-inflammatory potential.
Materials and Methods
Sample Collection:
The study was approved from Review Board of Animal Research and Ethics (AR-IRB-013/DUHS/Approval/2018/017) and Institutional Review Board (IRB-1115/DUHS/Approval/2018). Snakes (Naja oxiana, Family: Elapidae) were collected at the month of March-September from Interior Sindh, Karachi and identified by Associate Prof. Dr. Mehtab Alam, Dr. Zafar H. Zaidi, Center for Proteomics, University of Karachi, Pakistan. Venom extracted by the snake charmers through mechanical stimulation a process called “Venom milking”, collected using the sterilize glass bottles and then transferred into deionized water kept at 4 °C & centrifuged at 14,000 rpm for 15 min. The pooled venom was stored in the form of aliquots at -20°C till further use [42].
Protein Fractionation
Amicon centrifugal filter unit (Amicon Ultra-4 10K Merck Millipore, USA) was used for the concentration and purification of cobra venom, diluted with saline (0.9%, 2000 µL) with ratio of 1:10; centrifuged at 7,500 rpm (4℃) for 60 mins [43] using cold centrifuge (Universal Centrifuge Z - 366 K, Germany). The two fractions were obtained; Fraction-1 which contains high molecular weight peptides/proteins known as Retentate & Fraction-2 had high concentration of short chain peptides/proteins known as Filtrate. Samples Treated-1 (i.e., diluted (10x) venom before filtration known as Crude), Treated-2 (Fraction-1) & Treated-3 (Fraction-2) were stored in the form of aliquots (200 µL) at -20°C till the further experiments.
Protein Estimation
(a) Nano Drop Method
Amount of protein in samples (Crude, F-1 & F-2) against the Bovine serum albumin as a standard was estimated by using Nano drop (Nano drop lite-PR, Thermo Scientific, USA), placing 2.0 µL sample by adjuster on the hollow surface of the instrument, closing the lid & press the RUN command. The concentration of proteins (mg/mL) in the sample [44] was determined by follow Beer’s Lambert equation:
Where,
c = the protein concentration
A = the sample absorbance
ɛ = the protein mass extinction coefficient
1 = the path length in cm
(a) Bradford Method
The concentration of protein in crude & fractionated (F-1 & F-2) venom was analyzed by using clear, flat bottom 96 well plates followed the Bradford protein assay [45]. The standard (Bovine serum albumin) in 0 - 10 µg (BSA, MP Biomedicals, France) was used. The different standard concentration at the absorbance 595 nm were plotted to obtained the standard curve, by using Microsoft excel The linear equation was applied to calculate the protein concentration in test samples.
Material
Dexamethasone, λ-carrageenan (Sigma-Aldrich, Germany), Lysis buffer (Tris-HCL) (Boehringer Mannheim), Saline (0.9%), Syringes (1mL-29 G), Eppendrof tubes (2 mL) (Local market, Karachi), ELISA (Enzyme linked immunosorbant assay) kit of TNF-α mouse (Invitrogen Co, Carlsbad, CA, USA) containing: TNF-α standard, Microwell plate coated with antibody, Biotin-Conjugate IL-1β, Streptavidin-HRP and Sample Diluent, wash buffer, substrate (chromogen), stop solution and plate covers. ELISA kit of mouse IL-1β (Invitrogen, USA) containing: IL-1β standard, Microwell plate coated with antibody, Biotin-Conjugate IL-1β, Streptavidin-HRP and Sample Diluent, wash buffer, substrate and stop solution. For ROS, DCFH-DA ie 2’, 7´- dichlorodihydrofluorescein diacetate of Sigma-Aldrich, Germany was used. Equipment: Fluorescene microplate reader (SpectraMax M2, Molecular Devices CA, USA), ELISA-Plate reader (EPOCH/2, Biotek-USA), micro-centrifuge (HSA01264, Molequle-on-USA,) and vortex mixer (VMS-2500, Molequle-on, New zealand).
Animals
The studies were conducted using Swiss albino mice of both sexes (22–30 g) of NMRI (Naval Medical Research Institute) strain. After the clearance of the Institutional Animal Use Committee (IRB-013/DUHS/Approval/2018/017), mice were obtained from the animal house colony of the Dow University of Health Sciences, (Ojha Campus, Karachi, Pakistan), housed on a 12-h light/dark cycle with temperature (22 ± 2 ºC) and humidity (50 ± 10%) and allowed free access to standard laboratory food and tap water. All the animal procedures were performed in according to the recommendations provided by the Organization of Economic Cooperation and Development (OECD).
Median Lethal Dose (LD50) Determination
The lethal dose was determined as described by Behrens and Karber [46] for the crude venom, F-1 and F-2 using the arithmetic method as modified by Aliu and Nwude followed the formula:
Where, LD50 = Median lethal dose;LD100 = Least dose required to kill 100%;a = Dose difference;b = Mean mortality;ƞ = Group population.
Toxicity Experiment
Acute and subacute toxicity test for the Crude venom and their Fractions was carried out as per OECD guidelines. Three arbitrary doses were selected for the study to observe any sign of toxicity or mortality [47].
Anti-Inflammatory Study
Mice weighing 20-28 g of both sex (n=5/dose) were administered with vehicle IP (Intraperitoneal) (saline 0.9%), test agents; crude venom (19 µg/Kg), Fraction-1 (1.8 µg/Kg), Fraction-2 (267 µg/Kg) and dexamethasone (3 and 5 mg/Kg per oral) served as positive control, 30 min prior to carrageenan induced peritonitis [48,49]. Carrageenan 1% and 0.5ml was administered after 30 minutes of dose administration to induce peritonitis, 4 h later, mice were sacrificed by cervical dislocation, 1 ml cold saline was administered in the peritoneal cavity before dissecting the animal and it was collected and centrifuged at 3000 rpm for 5 minutes.
The (200 µL) aliquots of supernatant sample was further proceed to measure ROS, TNF-α and IL-1β levels with as well without test compounds.
To calculate the levels of ROS, TNF-α and IL-1β following formula was used:
(a) Determination of Reactive Oxygen Species (ROS) Levels
The collected peritoneal exudates were followed to centrifugation (3000 rpm) for 5 min. The (50 µL) supernatant and (50 µL, 20 µM) DCFH-DA (2´, 7´ - dichlorodihydrofluorescein diacetate) were incubated at 30 min (dark, 37 ºC) in 96 black wells plate. The DCFH-DA dye, in the presence of ROS, converted into highly fluorescent DCF (2´, 7´ - dichlorodihydrofluorescein) was measured at the excitation (485 nm) and emission (538 nm) wavelengths using fluorescence microplate reader [50,51] (Figure 17).
(a) Determination of Tumor Necrosis Factor (TNF-α) Levels
The levels of TNF-α in the supernatant sample of peritoneal fluid was measured by using ELISA (sandwich enzyme-linked immunosorbent assay) Kit followed by Xian et al. [51]. To (100 µL) of each sample, (50 µL) diluent buffer, (50 µL) Biotin-Conjugate (anti-mouse TNF-α monoclonal antibody) were added except to blank wells followed by incubation (37ºC) for 90 min. Washed (4 times) and (100 µL) streptavidin-HRP were added followed by incubation (18ºC to 25ºC) with constant shaking. After 30 min all the wells were washed 6x with (400 µL) wash buffer. (100 µL) of substrate solution (tetramethyl-benzidine) added to all wells, the solution immediately begins to turn blue; incubated (dark, 25 ºC) for 30 min. By adding the (100 µL) of stop solution (Sulphuric acid, 2M) the reaction ends and the standard yellow color were obtained that is measured at (620 nm) using ELISA-plate reader (Figure 18). The absorbance of blank was subtracted, and TNF-α value was calculated.
To obtain the TNF-α concentration in the presence or absence of test agents, a graph was plotted between the (100 µL) TNF-α of different concentrations (0, 15.6, 31.2, 62.5, 125, 250, 500 and 1000 pg/mL) on X-axis v/s their absorbance on Y-axis to generate the linear regression line.
(a) Determination of Interleukin-1β (IL-1β) Levels
The supernatant (200 µL) aliquots were used to measure the levels of cytokine IL-1β [52] following the manufacturer’s instructions available in ELISA kit. To (50 µL) of each sample, (100 µL) diluent buffer, (50 µL) Biotin-Conjugate (anti-mouse IL-1β monoclonal antibody) and (100 µL) streptavidin-HRP were added except to blank wells followed by incubation (18ºC to 25ºC) with constant shaking at (400 rpm). After 3 h all the wells were washed 6x with (400 µL) wash buffer. (100 µL) of substrate solution (tetramethyl-benzidine) added to all wells, the solution immediately begins to turn blue; incubated (dark, 25 ºC) for 30 min. By adding the (100 µL) of stop solution (Phosphoric acid, 1M) the reaction ends and the standard yellow color were obtained that is measured at (620 nm) using ELISA-plate reader (Figure 19). The absorbance of blank was subtracted, and IL-1β value was calculated.
To obtain the IL-1β concentration in the presence or absence of test agents, a graph was plotted between the (100 µL) IL-1β of different concentrations (0, 7.8, 15.6, 31.2, 62.5, 125, 250, 500 and 1000 pg/mL) on X-axis v/s there absorbance on Y-axis to generate the best fit line.
Statistical Analysis
The comparison between the groups (control v/s treated) and within the treatment was performed by applying SPSS software using ANOVA (Analysis of Variance). The Tukey’s test was conducted for the comparison of data followed by LSD (least significant difference). The p - value (< 0.05) was considered statistically significant (*p < 0.05, **p < 0.01 and ***p < 0.001).
Conclusions
It is concluded that the Crude venom and the Fraction-2 significantly attenuated the levels of pro-inflammatory mediators TNF-α, IL-1β and ROS by dual oxidative/cytokines inhibition pathways. However, changes in the cytokines (TNF-α, IL-1β and ROS) levels were less potently produced by the Fraction-1 of the cobra venom possibly due to high molecular weight proteins with complex structure which alters selectivity toward the receptors.
The current study proved that Naja oxiana venom have anti-inflammatory activity. At acute administration it has no toxicity. However, it is required to understand in depth to pursue the proteins present in venom into lifesaving medicine and to be studied in detail in the drug discovery studies.
Author Contributions
Conceptuation and Methodology, N.J., F. S, M. A.; Methodology, Formal Analysis, writing-original draft preparation, N. J., F. A., M., W. A. F.; Review and editing, N.J., N. A., S. M.. All authors have read and agreed to the published version of the manuscript.
Funding
The study was conducted by self-generated finance.
Institutional Review Board Statement
The study was approved by the Review Board of Animal Research and Ethics (AR-IRB-013/DUHS/Approval/2018/017) and Institutional Review Board (IRB-1115/DUHS/Approval/2018).All experiments were conducted with respect to animal welfare and care.
Informed Consent Statement
Not applicable.
Data Availability Statement
The raw data supporting the conclusions of this article will be made available by the authors on request.
Acknowledgments
We are very grateful to the editor and reviewers for critically evaluating this manuscript and providing constructive comments for its improvement.
Conflicts of Interest
The authors declare no conflicts of interest.
References
- Jones, A.W. Early drug discovery and the rise of pharmaceutical chemistry. Drug testing and analysis. 2011, 3, 337–344. [Google Scholar] [CrossRef] [PubMed]
- Dias, D.A.; Urban, S.; Roessner, U. A historical overview of natural products in drug discovery. Metabolites. 2012, 2, 303–336. [Google Scholar] [CrossRef] [PubMed]
- Huang, X.; Kong, L.; Li, X.; Chen, X.; Guo, M.; Zou, H. Strategy for analysis and screening of bioactive compounds in traditional Chinese medicines. Journal of chromatography B, Analytical technologies in the biomedical and life sciences. 2004, 812, 71–84. [Google Scholar] [CrossRef] [PubMed]
- Patil, K.R.; Mahajan, U.B.; Unger, B.S.; Goyal, S.N.; Belemkar, S.; Surana, S.J.; et al. Animal models of inflammation for screening of anti-inflammatory drugs: Implications for the discovery and development of phytopharmaceuticals. International journal of molecular sciences. 2019, 20, 4367. [Google Scholar] [CrossRef]
- Rahman, A.; Anjum, S.; El-Seedi, H. Natural Products in Clinical Trials: Bentham Science Publishers, 2018.
- DeFronzo, R.A.; Ratner, R.E.; Han, J.; Kim, D.D.; Fineman, M.S.; Baron, A.D. Effects of exenatide (exendin-4) on glycemic control and weight over 30 weeks in metformin-treated patients with type 2 diabetes. Diabetes care. 2005, 28, 1092–1100. [Google Scholar] [CrossRef]
- Lear, S.; Amso, Z.; Shen, W. Chapter Eight - Engineering PEG-fatty acid stapled, long-acting peptide agonists for G protein-coupled receptors. In: Shukla AK, editor. Methods in Enzymology. 622: Academic Press, 2019. p. 183-200.
- Farzad, R.; Gholami, A.; Hayati Roodbari, N.; Shahbazzadeh, D. The anti-rabies activity of Caspian cobra venom. Toxicon. 2020, 186, 175–181. [Google Scholar] [CrossRef] [PubMed]
- Fallahi, N.; Shahbazzadeh, D.; Maleki, F.; Aghdasi, M.; Tabatabaie, F.; Khanaliha, K. The In Vitro Study of Anti-leishmanial Effect of Naja naja oxiana Snake Venom on Leishmania major. Infect Disord Drug Targets. 2020, 20, 913–919. [Google Scholar] [CrossRef]
- verin, A.S.; Utkin, Y.N. Cardiovascular Effects of Snake Toxins: Cardiotoxicity and Cardioprotection. Acta Naturae. 2021, 13, 4–14. [Google Scholar] [CrossRef]
- Kini, R.M.; Koh, C.Y. Snake venom three-finger toxins and their potential in drug development targeting cardiovascular diseases. Biochemical Pharmacology. 2020, 181, 114105. [Google Scholar] [CrossRef]
- White, H.D.; Chew, D.P. Bivalirudin: An anticoagulant for acute coronary syndromes and coronary interventions. Expert opinion on pharmacotherapy. 2002, 3, 777–788. [Google Scholar] [CrossRef]
- Kirmani, J.F.; Alkawi, A.; Panezai, S.; Gizzi, M. Advances in thrombolytics for treatment of acute ischemic stroke. Neurology. 2012, 79, S119–S125. [Google Scholar] [CrossRef] [PubMed]
- Liu, Y.; Ming, W.; Wang, Y.; Liu, S.; Qiu, Y.; Xiang, Y.; et al. Cytotoxin 1 from Naja atra Cantor venom induced necroptosis of leukemia cells. Toxicon : Official journal of the International Society on Toxinology. 2019, 165, 110–115. [Google Scholar] [CrossRef]
- Kashkooli, S.; Khamehchian, S.; Dabaghian, M.; Namvarpour, M.; Tebianian, M. Effects of Adjuvant and Immunization Route on Antibody Responses against Naja Naja oxiana Venom. Arch Razi Inst. 2023, 78, 1177–1184. [Google Scholar]
- Tu, A.T. Neurotoxins of Animal Venoms: Snakes. Annual Review of Biochemistry. 1973, 42, 235–258. [Google Scholar] [CrossRef] [PubMed]
- Pal, S.K.; Gomes, A.; Dasgupta, S.C.; Gomes, A. Snake venom as therapeutic agents: From toxin to drug development. Indian journal of experimental biology. 2002, 40, 1353–1358. [Google Scholar] [PubMed]
- Gomes, A.; Bhattacharya, S.; Chakraborty, M.; Bhattacharjee, P.; Mishra, R.; Gomes, A. Anti-arthritic activity of Indian monocellate cobra (Naja kaouthia) venom on adjuvant induced arthritis. Toxicon : Official journal of the International Society on Toxinology. 2010, 55, 670–673. [Google Scholar] [CrossRef]
- Saha, P.P.; Bhowmik, T.; Dasgupta, A.K.; Gomes, A. In vivo and in vitro toxicity of nanogold conjugated snake venom protein toxin GNP-NKCTToxicol Rep. 2014, 1, 74–84. 1.
- Kularatne, S.A.M.; Senanayake, N. Chapter 66 - Venomous snake bites, scorpions, and spiders. In: Biller J, Ferro JM, editors. Handbook of Clinical Neurology. 120: Elsevier, 2014. p. 987-1001.
- Leviton, A.E. Chapter 18 - The Venomous Terrestrial Snakes of East Asia, India, Malaya, and Indonesia. In: BÜCherl W, Buckley EE, Deulofeu V, editors, Venomous Animals and their Venoms: Academic Press, 1968. p.529-76.
- Wüster, W. Taxonomic changes and toxinology: Systematic revisions of the asiatic cobras (Naja naja species complex). Toxicon : Official journal of the International Society on Toxinology. 1996, 34, 399–406. [Google Scholar] [CrossRef]
- Razi, M.T.; Asad, M.H.; Khan, T.; Chaudhary, M.Z.; Ansari, M.T.; Arshad, M.A.; et al. Antihaemorrhagic potentials of Fagonia cretica against Naja naja karachiensis (black Pakistan cobra) venom. Natural product research. 2011, 25, 1902–1907. [Google Scholar] [CrossRef]
- Al-Sadoon, M.K.; Fahim, A. Possible recovery from an acute envenomation in male rats with LD50 of Echis coloratus crude venom: I-A seven days hematological follow-up study. Saudi Journal of Biological Sciences. 2012, 19, 221–227. [Google Scholar] [CrossRef]
- Izidoro, L.F.M.; Sobrinho, J.C.; Mendes, M.M.; Costa, T.R.; Grabner, A.N.; Rodrigues, V.M.; et al. Snake venom L-amino acid oxidases: Trends in pharmacology and biochemistry. Biomed Res Int. 2014, 2014, 196754. [Google Scholar] [CrossRef]
- Augusto-de-Oliveira, C.; Stuginski, D.R.; Kitano, E.S.; Andrade-Silva, D.; Liberato, T.; Fukushima, I.; et al. Dynamic Rearrangement in Snake Venom Gland Proteome: Insights into Bothrops jararaca Intraspecific Venom Variation. Journal of Proteome Research. 2016, 15, 3752–3762. [Google Scholar] [CrossRef]
- Sadat, S.N.; Bagheri, K.P.; Maghsoudi, H.; Shahbazzadeh, D. Oxineur, a novel peptide from Caspian cobra Naja naja oxiana against HT-29 colon cancer. Biochim Biophys Acta Gen Subj. 2023, 1867, 130285. [Google Scholar] [CrossRef]
- Azim, S.; McDowell, D.; Cartagena, A.; Rodriguez, R.; Laughlin, T.F.; Ahmad, Z. Venom peptides cathelicidin and lycotoxin cause strong inhibition of Escherichia coli ATP synthase. International journal of biological macromolecules. 2016, 87, 246–251. [Google Scholar] [CrossRef]
- Iwanaga, S.; Suzuki, T. Enzymes in Snake Venom. In: Lee C-Y, editor. Snake Venoms. Berlin, Heidelberg: Springer Berlin Heidelberg, 1979. p. 61-158.
- King, G.F. Venoms as a platform for human drugs: Translating toxins into therapeutics. Expert opinion on biological therapy. 2011, 11, 1469–1484. [Google Scholar] [CrossRef]
- Koh, D.C.; Armugam, A.; Jeyaseelan, K. Snake venom components and their applications in biomedicine. Cellular and molecular life sciences : CMLS. 2006, 63, 3030–3041. [Google Scholar] [CrossRef]
- de Lima, D.C.; Alvarez Abreu, P.; de Freitas, C.C.; Santos, D.O.; Borges, R.O.; Dos Santos, T.C.; et al. Snake Venom: Any Clue for Antibiotics and CAM? Evidence-based complementary and alternative medicine : Ecam. 2005, 2, 39–47. [Google Scholar] [CrossRef] [PubMed]
- Shi G-n Liu Y-l Lin H-m Yang S-l Feng Y-l Reid, P.F.; et al. Involvement of cholinergic system in suppression of formalin-induced inflammatory pain by cobratoxin. Acta Pharmacol Sin. 2011, 32, 1233–1238. [Google Scholar]
- Zhu, K.Z.; Liu, Y.L.; Gu, J.H.; Qin, Z.H. Antinociceptive and anti-inflammatory effects of orally administrated denatured naja naja atra venom on murine rheumatoid arthritis models. Evidence-based complementary and alternative medicine : eCAM. 2013, 2013, 616241. [Google Scholar] [CrossRef] [PubMed]
- Han, Y.M.; Koh, J.; Kim, J.W.; Lee, C.; Koh, S.J.; Kim, B.; et al. NF-kappa B activation correlates with disease phenotype in Crohn’s disease. PLoS ONE. 2017, 12, e0182071. [Google Scholar] [CrossRef] [PubMed]
- Lin, T.H.; Pajarinen, J.; Lu, L.; Nabeshima, A.; Cordova, L.A.; Yao, Z.; et al. NF-kappaB as a Therapeutic Target in Inflammatory-Associated Bone Diseases. Advances in protein chemistry and structural biology. 2017, 107, 117–154. [Google Scholar] [PubMed]
- Hayden, M.S.; Ghosh, S. Shared principles in NF-kappaB signaling. Cell. 2008, 132, 344–362. [Google Scholar] [CrossRef] [PubMed]
- Lipniacki, T.; Paszek, P.; Brasier, A.R.; Luxon, B.; Kimmel, M. Mathematical model of NF-kappaB regulatory module. Journal of theoretical biology. 2004, 228, 195–215. [Google Scholar] [CrossRef] [PubMed]
- Wu, G.R.; Mu, T.C.; Gao, Z.X.; Wang, J.; Sy, M.S.; Li, C.Y. Prion protein is required for tumor necrosis factor alpha (TNFalpha)-triggered nuclear factor kappaB (NF-kappaB) signaling and cytokine production. The Journal of biological chemistry. 2017, 292, 18747–18759. [Google Scholar] [CrossRef] [PubMed]
- Wang, S.-Z.; He, H.; Han, R.; Zhu, J.-L.; Kou, J.-Q.; Ding, X.-L.; et al. The Protective Effects of Cobra Venom from Naja naja atra on Acute and Chronic Nephropathy. Evid Based Complement Altern. Med. 2013, 2013, 478049. [Google Scholar]
- Park, M.H.; Song, H.S.; Kim, K.H.; Son, D.J.; Lee, S.H.; Yoon, D.Y.; et al. Cobrotoxin inhibits NF-kappa B activation and target gene expression through reaction with NF-kappa B signal molecules. Biochemistry. 2005, 44, 8326–8336. [Google Scholar] [CrossRef]
- Ali, S.A.; Stoeva, S.; Schütz, J.; Kayed, R.; Abassi, A.; Zaidi, Z.H.; et al. Purification and primary structure of low molecular mass peptides from scorpion (Buthus sindicus) venom. Comp Biochem Physiol A Mol Integr Physiol. 1998, 121, 323–332. [Google Scholar] [CrossRef]
- Johnsen, E.; Brandtzaeg, O.K.; Vehus, T.; Roberg-Larsen, H.; Bogoeva, V.; Ademi, O.; et al. A critical evaluation of Amicon Ultra centrifugal filters for separating proteins, drugs and nanoparticles in biosamples. J. Pharm. Biomed. Analysis. 2016, 120, 106–111. [Google Scholar] [CrossRef]
- Desjardins, P.; Hansen, J.B.; Allen, M. Microvolume protein concentration determination using the NanoDrop 2000c spectrophotometer. J Vis Exp. 2009, 33, 1610. [Google Scholar]
- Bradford, M.M. A rapid and sensitive method for the quantitation of microgram quantities of protein utilizing the principle of protein-dye binding. Analytical biochemistry. 1976, 72, 248–254. [Google Scholar] [CrossRef]
- Hamilton, M.A.; Russo, R.C.; Thurston, R.V. Trimmed Spearman-Karber method for estimating median lethal concentrations in bioassays. Environ. Sci. & Technol. 1977, 11, 714–719. [Google Scholar]
- National Research Council Steering Committee on Identification of TPTCfCbtNT, Program. The National Academies Collection: Reports funded by National Institutes of Health. Toxicity Testing: Strategies to Determine Needs and Priorities. Washington (DC): National Academies Press (US), 1984.
- Longhi-Balbinot, D.T.; Lanznaster, D.; Baggio, C.H.; Silva, M.D.; Cabrera, C.H.; Facundo, V.A.; et al. Anti-inflammatory effect of triterpene 3β, 6β, 16β-trihydroxylup-20(29)-ene obtained from Combretum leprosum Mart & Eich in mice. Journal of Ethnopharmacology. 2012, 142, 59–64. [Google Scholar]
- Montanher, A.; Zucolotto, S.; Schenkel, E.; Fröde, T. Evidence of anti-inflammatory effects of Passiflora edulis in an inflammation model. Journal of Ethnopharmacology. 2007, 109, 281–288. [Google Scholar] [CrossRef]
- Best, T.M.; Fiebig, R.; Corr, D.T.; Brickson, S.; Ji, L. Free radical activity, antioxidant enzyme, and glutathione changes with muscle stretch injury in rabbits. Journal of applied physiology (Bethesda, Md : 1985). 1999, 87, 74–82. [Google Scholar] [CrossRef]
- Xian, Y.F.; Mao, Q.Q.; Ip, S.P.; Lin, Z.X.; Che, C.T. Comparison on the anti-inflammatory effect of Cortex Phellodendri Chinensis and Cortex Phellodendri Amurensis in 12-O-tetradecanoyl-phorbol-13-acetate-induced ear edema in mice. J Ethnopharmacol. 2011, 137, 1425–1430. [Google Scholar] [CrossRef]
- Mizgerd, J.P.; Spieker, M.R.; Doerschuk, C.M. Early response cytokines and innate immunity: Essential roles for TNF receptor 1 and type I IL-1 receptor during Escherichia coli pneumonia in mice. Journal of Immunology (Baltimore, Md : 1950). 2001, 166, 4042–4048. [Google Scholar] [CrossRef] [PubMed]
- Fry, B.G. From genome to “venome”: Molecular origin and evolution of the snake venom proteome inferred from phylogenetic analysis of toxin sequences and related body proteins. Genome research. 2005, 15, 403–420. [Google Scholar] [CrossRef] [PubMed]
- Fry, B.G.; Vidal, N.; Norman, J.A.; Vonk, F.J.; Scheib, H.; Ramjan, S.F.R.; et al. Early evolution of the venom system in lizards and snakes. Nature. 2006, 439, 584–588. [Google Scholar] [CrossRef] [PubMed]
- Veterinary Pharmacology Toxicology Experiments [press release], Z. a.r.i.a.; , A.B.U. Press, 1982. [Google Scholar]
- Calvete, J.J.; Sanz, L.; Angulo, Y.; Lomonte, B.; Gutiérrez, J.M. Venoms, venomics, antivenomics. FEBS letters. 2009, 583, 1736–1743. [Google Scholar] [CrossRef] [PubMed]
- Damotharan, P.; Veeruraj, A.; Arumugam, M.; Balasubramanian, T. Isolation and characterization of biologically active venom protein from sea snake Enhydrina schistosa. Journal of biochemical and molecular toxicology. 2015, 29, 140–147. [Google Scholar] [CrossRef]
- Samianifard, M.; Nazari, A.; Tahoori, F.; Mohamadpour Dounighi, N. Proteome Analysis of Toxic Fractions of Iranian Cobra (Naja naja Oxiana) Snake Venom Using Two-Dimensional Electrophoresis and Mass Spectrometry. Arch Razi Inst. 2021, 76, 127–138. [Google Scholar]
- JM, W. The protein protocols handbook. New Jersey: Humana Press, 2002.
- Noble, J.E.; Bailey, M.J. Quantitation of protein. Methods in enzymology. 2009, 463, 73–95. [Google Scholar]
- Turner, R. Screening methods in pharmacology: Elsevier, 2013.
- Akhila, J.; Alwar, M. Acute toxicity studies and determination of median lethal dose. Curr Sci. 2007, 93, 917–920. [Google Scholar]
- Bickler, P.E. Amplification of Snake Venom Toxicity by Endogenous Signaling Pathways. Toxins (Basel). 2020, 12, 68. [Google Scholar] [CrossRef]
- Son, D.J.; Lee, J.W.; Lee, Y.H.; Song, H.S.; Lee, C.K.; Hong, J.T. Therapeutic application of anti-arthritis, pain-releasing, and anti-cancer effects of bee venom and its constituent compounds. Pharmacology & therapeutics. 2007, 115, 246–270. [Google Scholar]
- Farsky, S.H.; Antunes, E.; Mello, S.B. Pro and antiinflammatory properties of toxins from animal venoms. Current Drug Targets-Inflammation & Allergy. 2005, 4, 401–411. [Google Scholar]
- Nunes, F.P.; Sampaio, S.C.; Santoro, M.L.; Sousa-e-Silva, M.C.C. Long-lasting anti-inflammatory properties of Crotalus durissus terrificus snake venom in mice. Toxicon. 2007, 49, 1090–1098. [Google Scholar] [CrossRef] [PubMed]
- Gomes, A.; Bhattacharya, S.; Chakraborty, M.; Bhattacharjee, P.; Mishra, R.; Gomes, A. Anti-arthritic activity of Indian monocellate cobra (Naja kaouthia) venom on adjuvant induced arthritis. Toxicon. 2010, 55, 670–673. [Google Scholar] [CrossRef] [PubMed]
- Liu Y-l Lin H-m Zou, R.; Wu J-c Han, R.; Raymond, L.N.; et al. Suppression of complete Freund’s adjuvant-induced adjuvant arthritis by cobratoxin. Acta Pharmacologica Sinica. 2009, 30, 219–227. [Google Scholar]
- Chen, R.; Robinson, S.E. The effect of cholinergic manipulations on the analgesic response to cobrotoxin in mice. Life sciences. 1990, 47, 1949–1954. [Google Scholar] [CrossRef] [PubMed]
- Liang Y-x Jiang W-j Han L-p Zhao, S.-j. Peripheral and spinal antihyperalgesic activity of najanalgesin isolated from Naja naja atra in a rat experimental model of neuropathic pain. Neuroscience letters. 2009, 460, 191–195. [Google Scholar]
- Pu, X.; Wong, P.; Gopalakrishnakone, P. A novel analgesic toxin (hannalgesin) from the venom of king cobra (Ophiophagus hannah). Toxicon. 1995, 33, 1425–1431. [Google Scholar] [CrossRef]
- Levy, L. Carrageenan paw edema in the mouse. Life Sciences. 1969, 8, 601–606. [Google Scholar] [CrossRef] [PubMed]
- Henriques M, Silva P, Martins M, Flores C, Cunha F, Assreuy-Filho J; et al. Mouse paw edema. A new model for inflammation? Brazilian journal of medical and biological research= Revista brasileira de pesquisas medicas e biologicas. 1987, 20, 243–249.
- Posadas, I.; Bucci, M.; Roviezzo, F.; Rossi, A.; Parente, L.; Sautebin, L.; et al. Carrageenan-induced mouse paw oedema is biphasic, age-weight dependent and displays differential nitric oxide cyclooxygenase-2 expression. British journal of pharmacology. 2004, 142, 331–338. [Google Scholar] [CrossRef] [PubMed]
- Malech, H.L.; Gallin, J.I. Neutrophils in human diseases. New England Journal of Medicine. 1987, 317, 687–694. [Google Scholar] [CrossRef] [PubMed]
- Travaglia-Cardoso, S. Crotalus durissus terrificus - a case of xanthism. Herpetological Bulletin. 2006, 97, 38–39. [Google Scholar]
- Cardoso, D.F.; Lopes-Ferreira, M.; Faquim-Mauro, E.L.; Macedo, M.S.; Farsky, S.H. Role of crotoxin, a phospholipase A2 isolated from Crotalus durissus terrificus snake venom, on inflammatory and immune reactions. Mediators of inflamm. 2001, 10, 125–133. [Google Scholar] [CrossRef] [PubMed]
- Fernandes, C.A.H.; Pazin, W.M.; Dreyer, T.R.; Bicev, R.N.; Cavalcante, W.L.G.; Fortes-Dias, C.L.; et al. Biophysical studies suggest a new structural arrangement of crotoxin and provide insights into its toxic mechanism. Scientific Reports. 2017, 7, 43885. [Google Scholar] [CrossRef]
- Silva, M.C.; Gonçalves, L.R.; Mariano, M. The venom of South American rattlesnakes inhibits macrophage functions and is endowed with anti-inflammatory properties. Mediators of inflamm. 1996, 5, 18–23. [Google Scholar] [CrossRef]
- Sampaio, S.; Sousa-e-Silva, M.; Borelli, P.; Curi, R.; Cury, Y. Crotalus durissus terrificus snake venom regulates macrophage metabolism and function. Journal of Leukocyte Biology. 2001, 70, 551–558. [Google Scholar] [CrossRef]
- Ruan, Y.; Yao, L.; Zhang, B.; Zhang, S.; Guo, J. Anti-inflammatory effects of Neurotoxin-Nna, a peptide separated from the venom of Naja naja atra. BMC Complement Altern Med. 2013, 13, 86. [Google Scholar] [CrossRef] [PubMed]
- Gomes, A.; Saha, P.P.; Bhowmik, T.; Dasgupta, A.K.; Dasgupta, S.C. Protection against osteoarthritis in experimental animals by nanogold conjugated snake venom protein toxin gold nanoparticle-Naja kaouthia cytotoxin The Indian journal of medical research. 2016, 144, 910–917. 144.
- Kolaczkowska, E.; Kubes, P. Neutrophil recruitment and function in health and inflammation. Nature reviews Immunology. 2013, 13, 159–175. [Google Scholar] [CrossRef] [PubMed]
- Mittal, M.; Siddiqui, M.R.; Tran, K.; Reddy, S.P.; Malik, A.B. Reactive oxygen species in inflammation and tissue injury. Antioxid Redox Signal. 2014, 20, 1126–1167. [Google Scholar] [CrossRef] [PubMed]
Figure 1.
The Inflammation Cascade (Adapted from Kalpesh R. Patil et al., 2019) [4].
Figure 1.
The Inflammation Cascade (Adapted from Kalpesh R. Patil et al., 2019) [4].
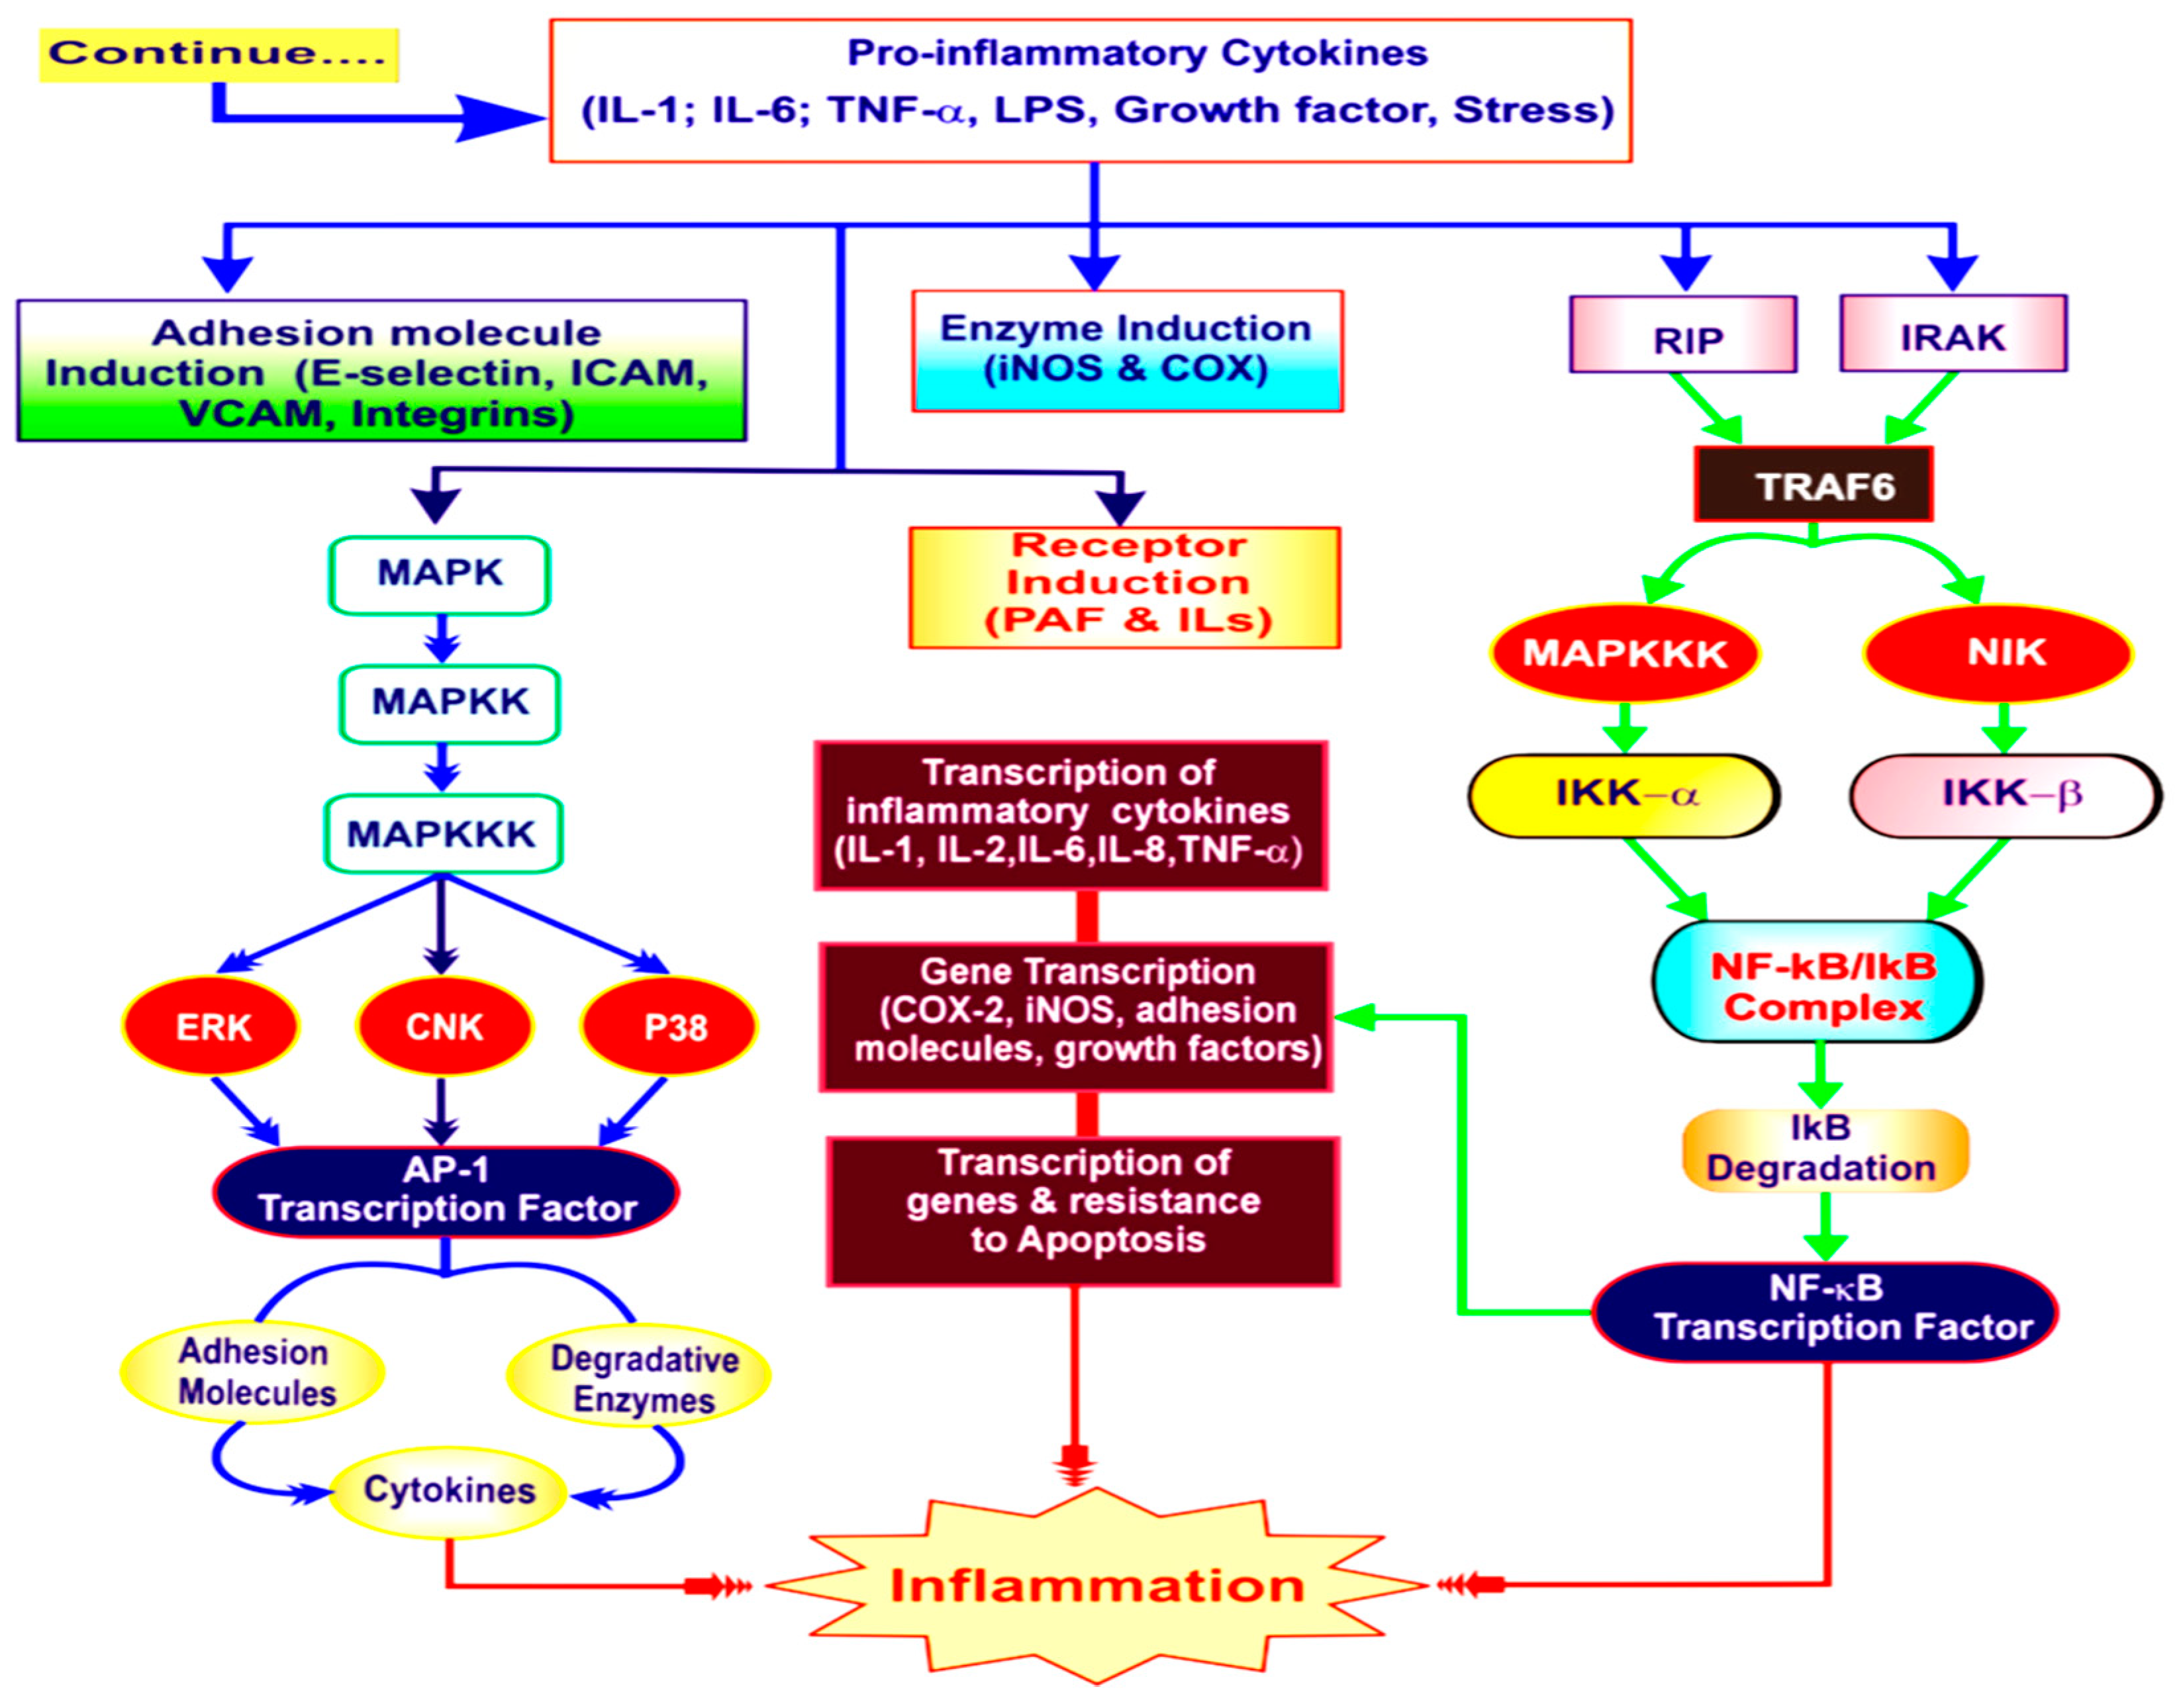
Figure 2.
Standard curve of Bovine Serum Albumin (BSA).
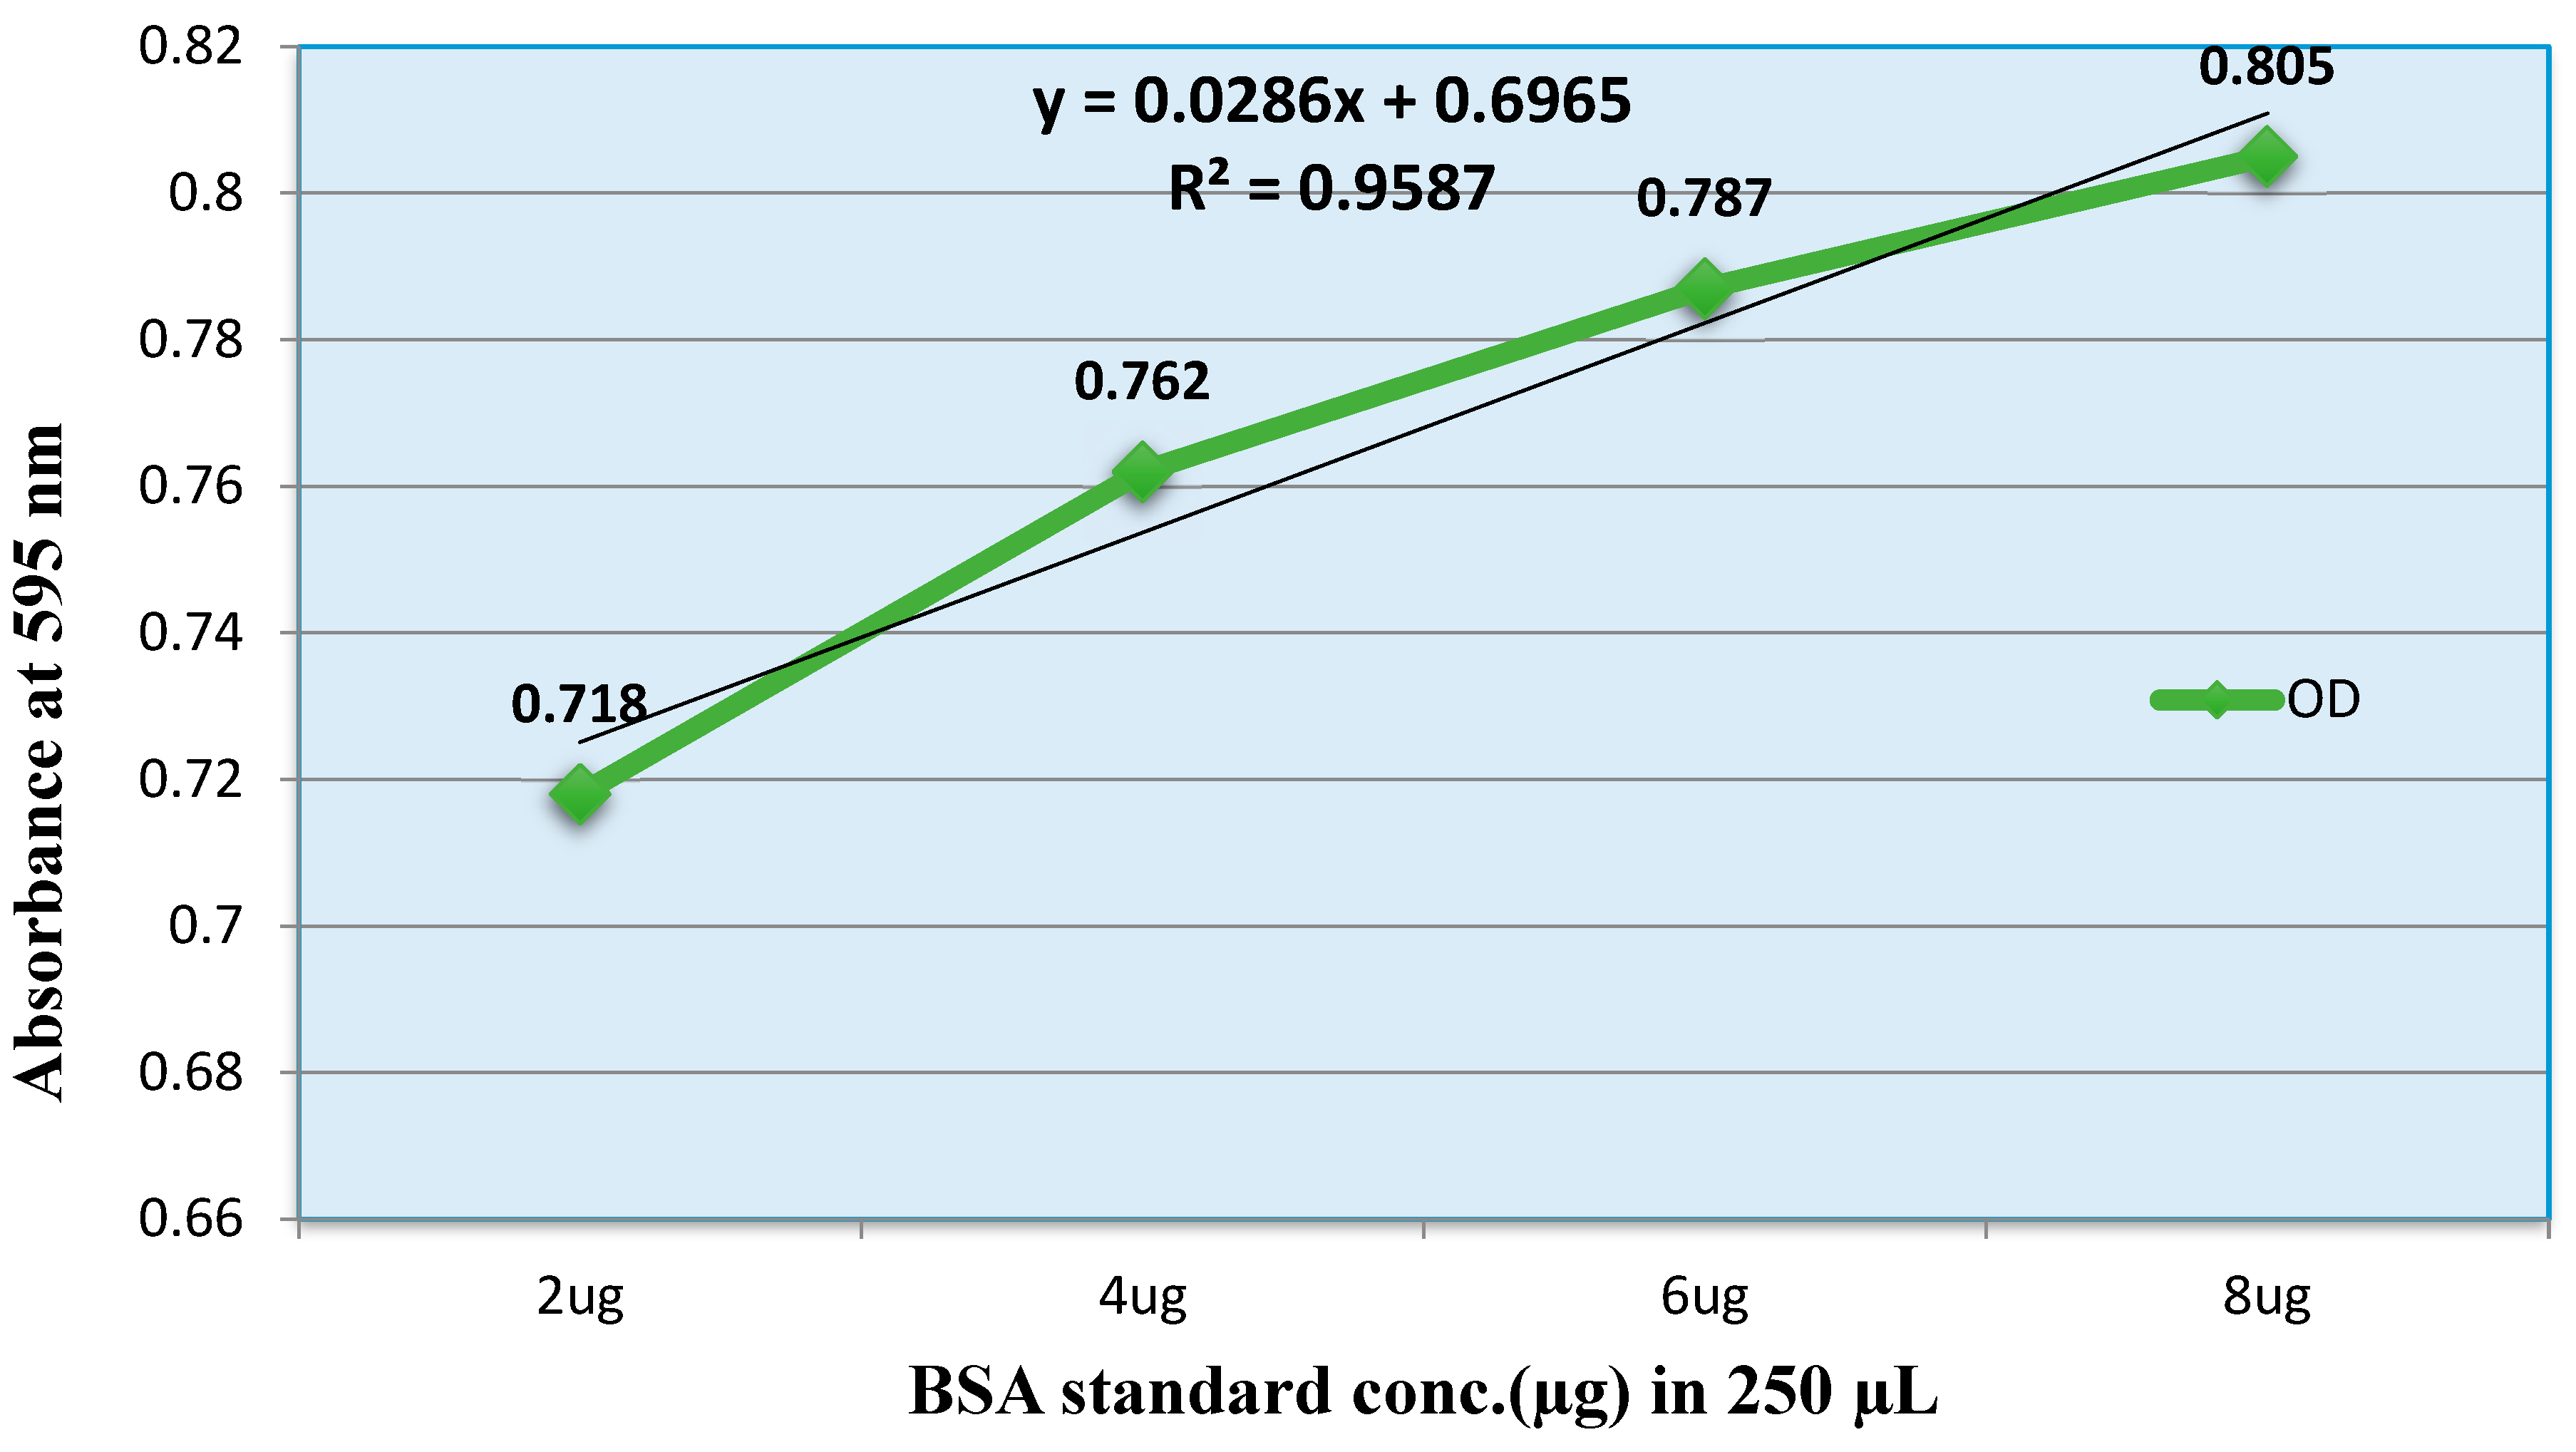
Figure 3.
Effect of Crude venom and F-1 and F-2 on mice Brain during Acute toxicity study. Sections were stained by hematoxylin and eosin (H&E) and observed at 40x magnification under light microscope.
Figure 3.
Effect of Crude venom and F-1 and F-2 on mice Brain during Acute toxicity study. Sections were stained by hematoxylin and eosin (H&E) and observed at 40x magnification under light microscope.
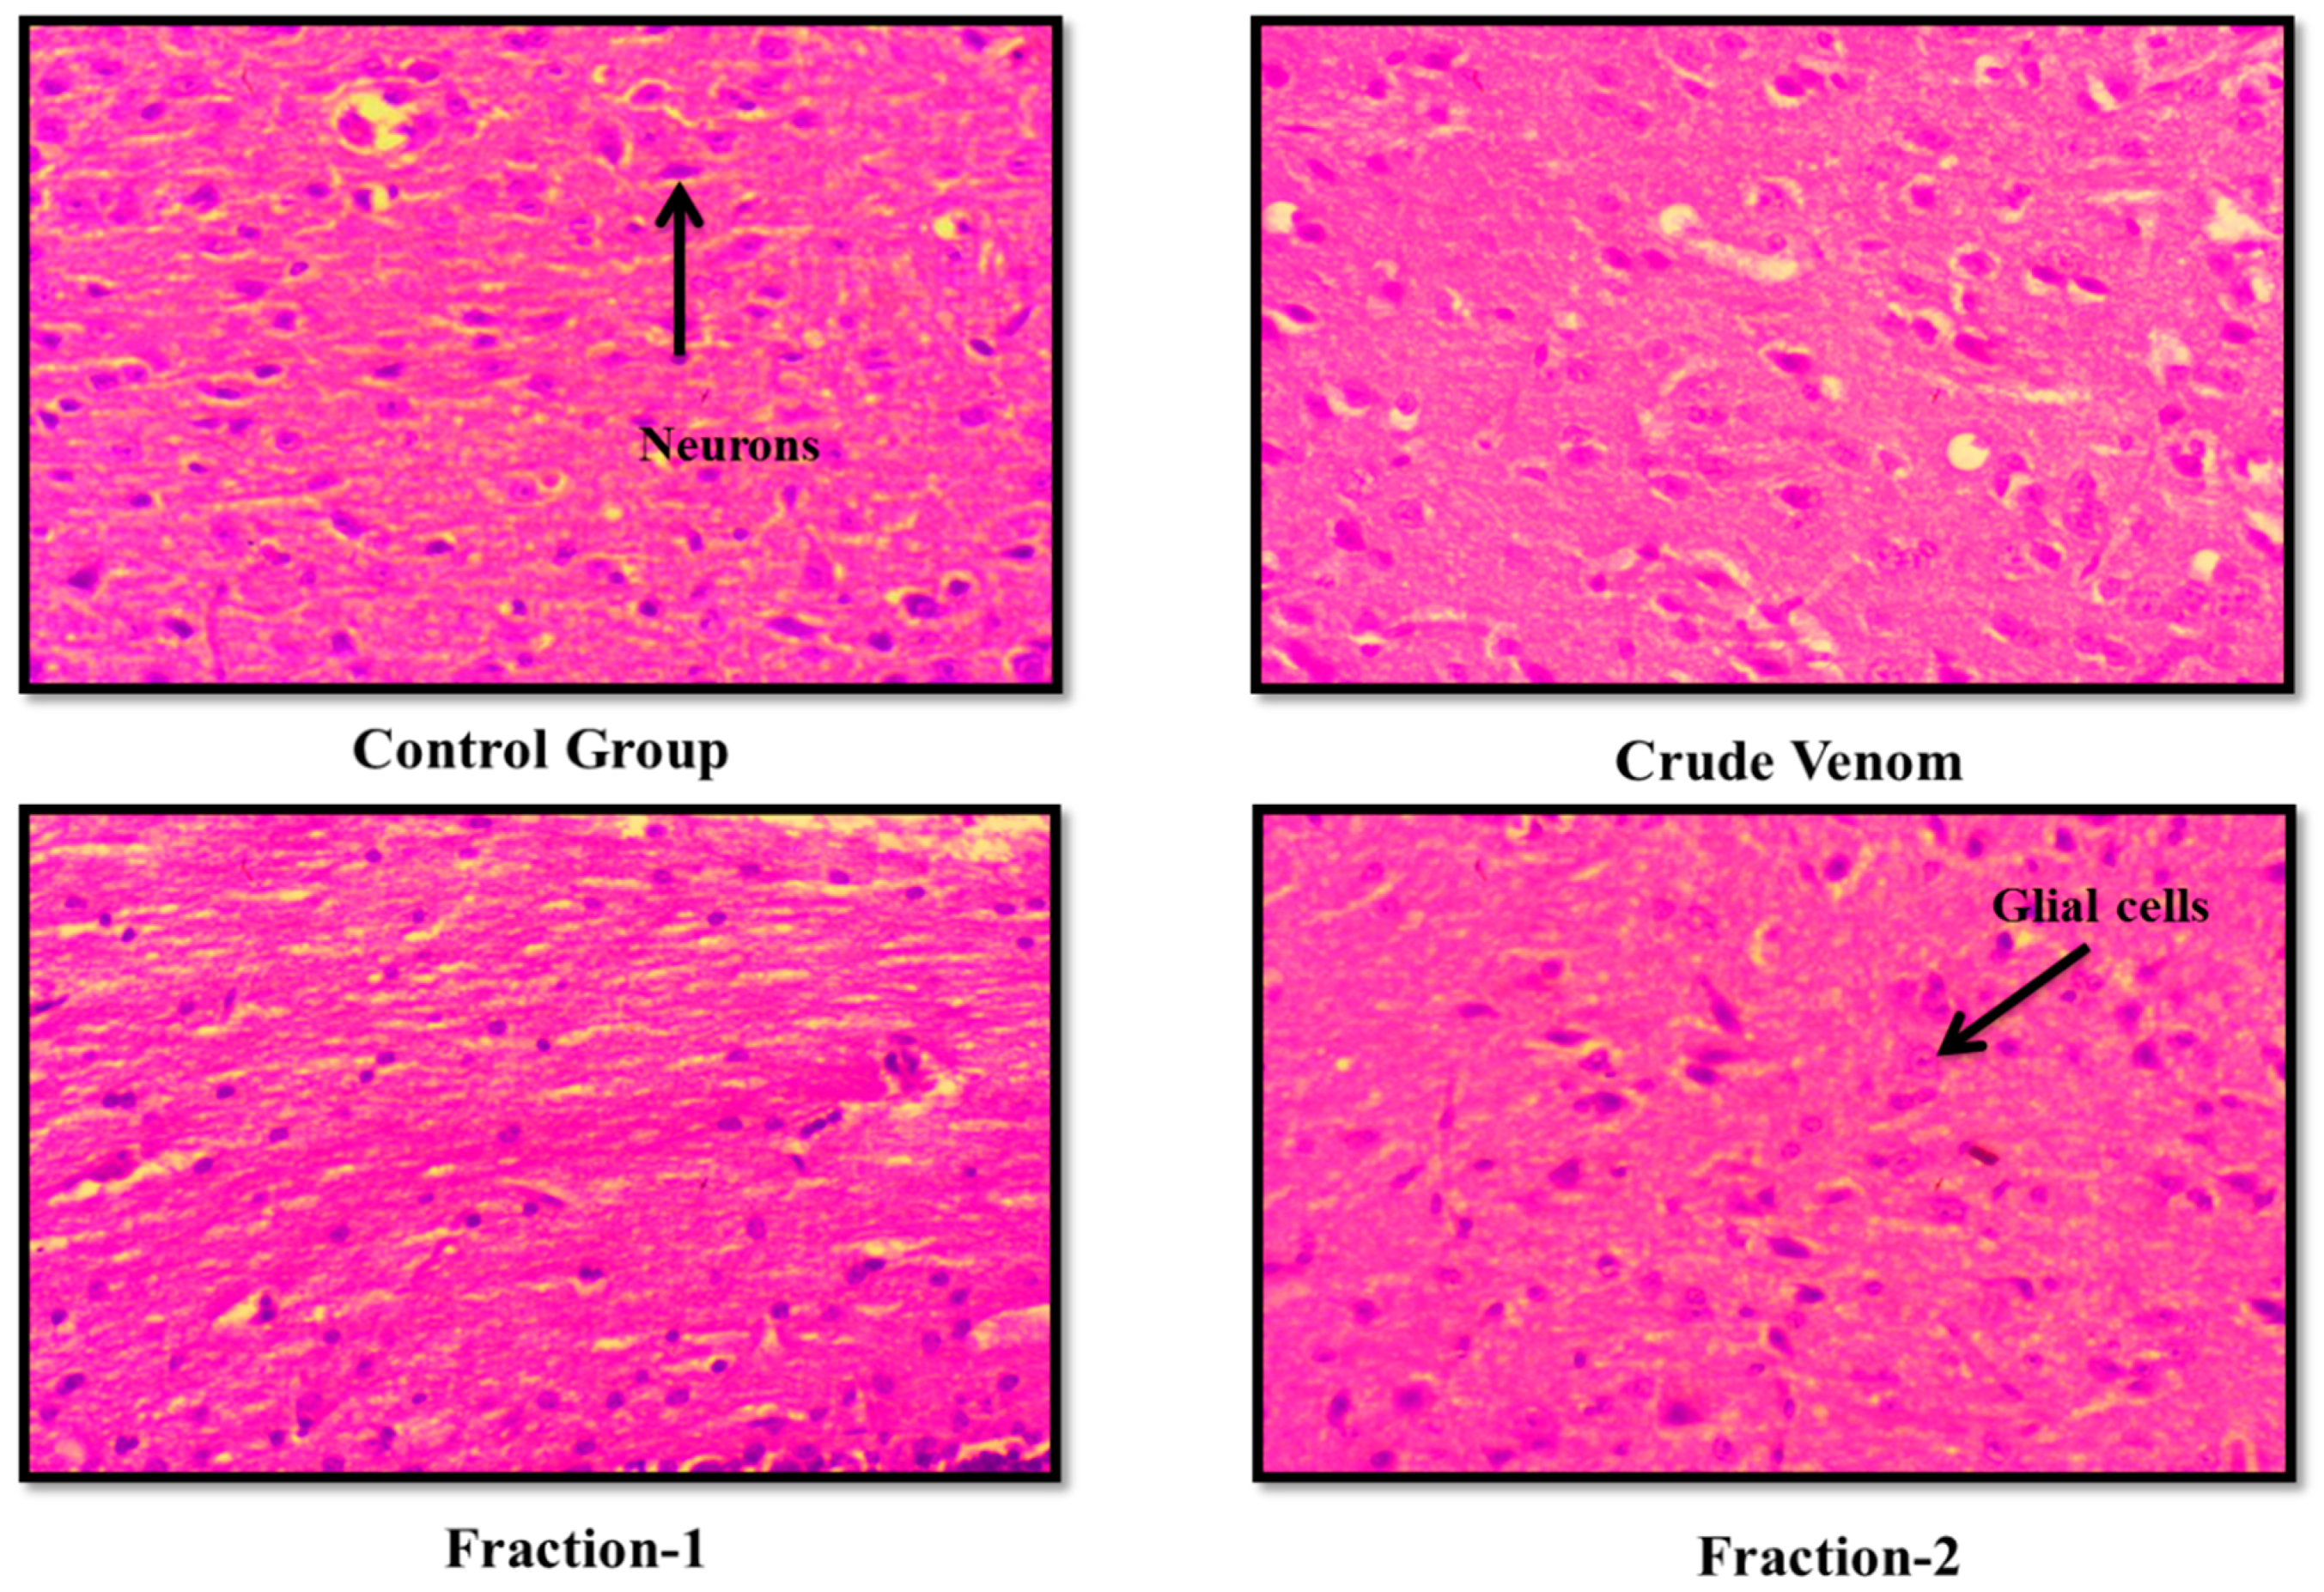
Figure 4.
Effect of Crude venom and F-1 and F-2 on mice Heart during Acute toxicity study. Sections were stained by hematoxylin and eosin (H&E) and observed at 40x magnification under light microscope.
Figure 4.
Effect of Crude venom and F-1 and F-2 on mice Heart during Acute toxicity study. Sections were stained by hematoxylin and eosin (H&E) and observed at 40x magnification under light microscope.
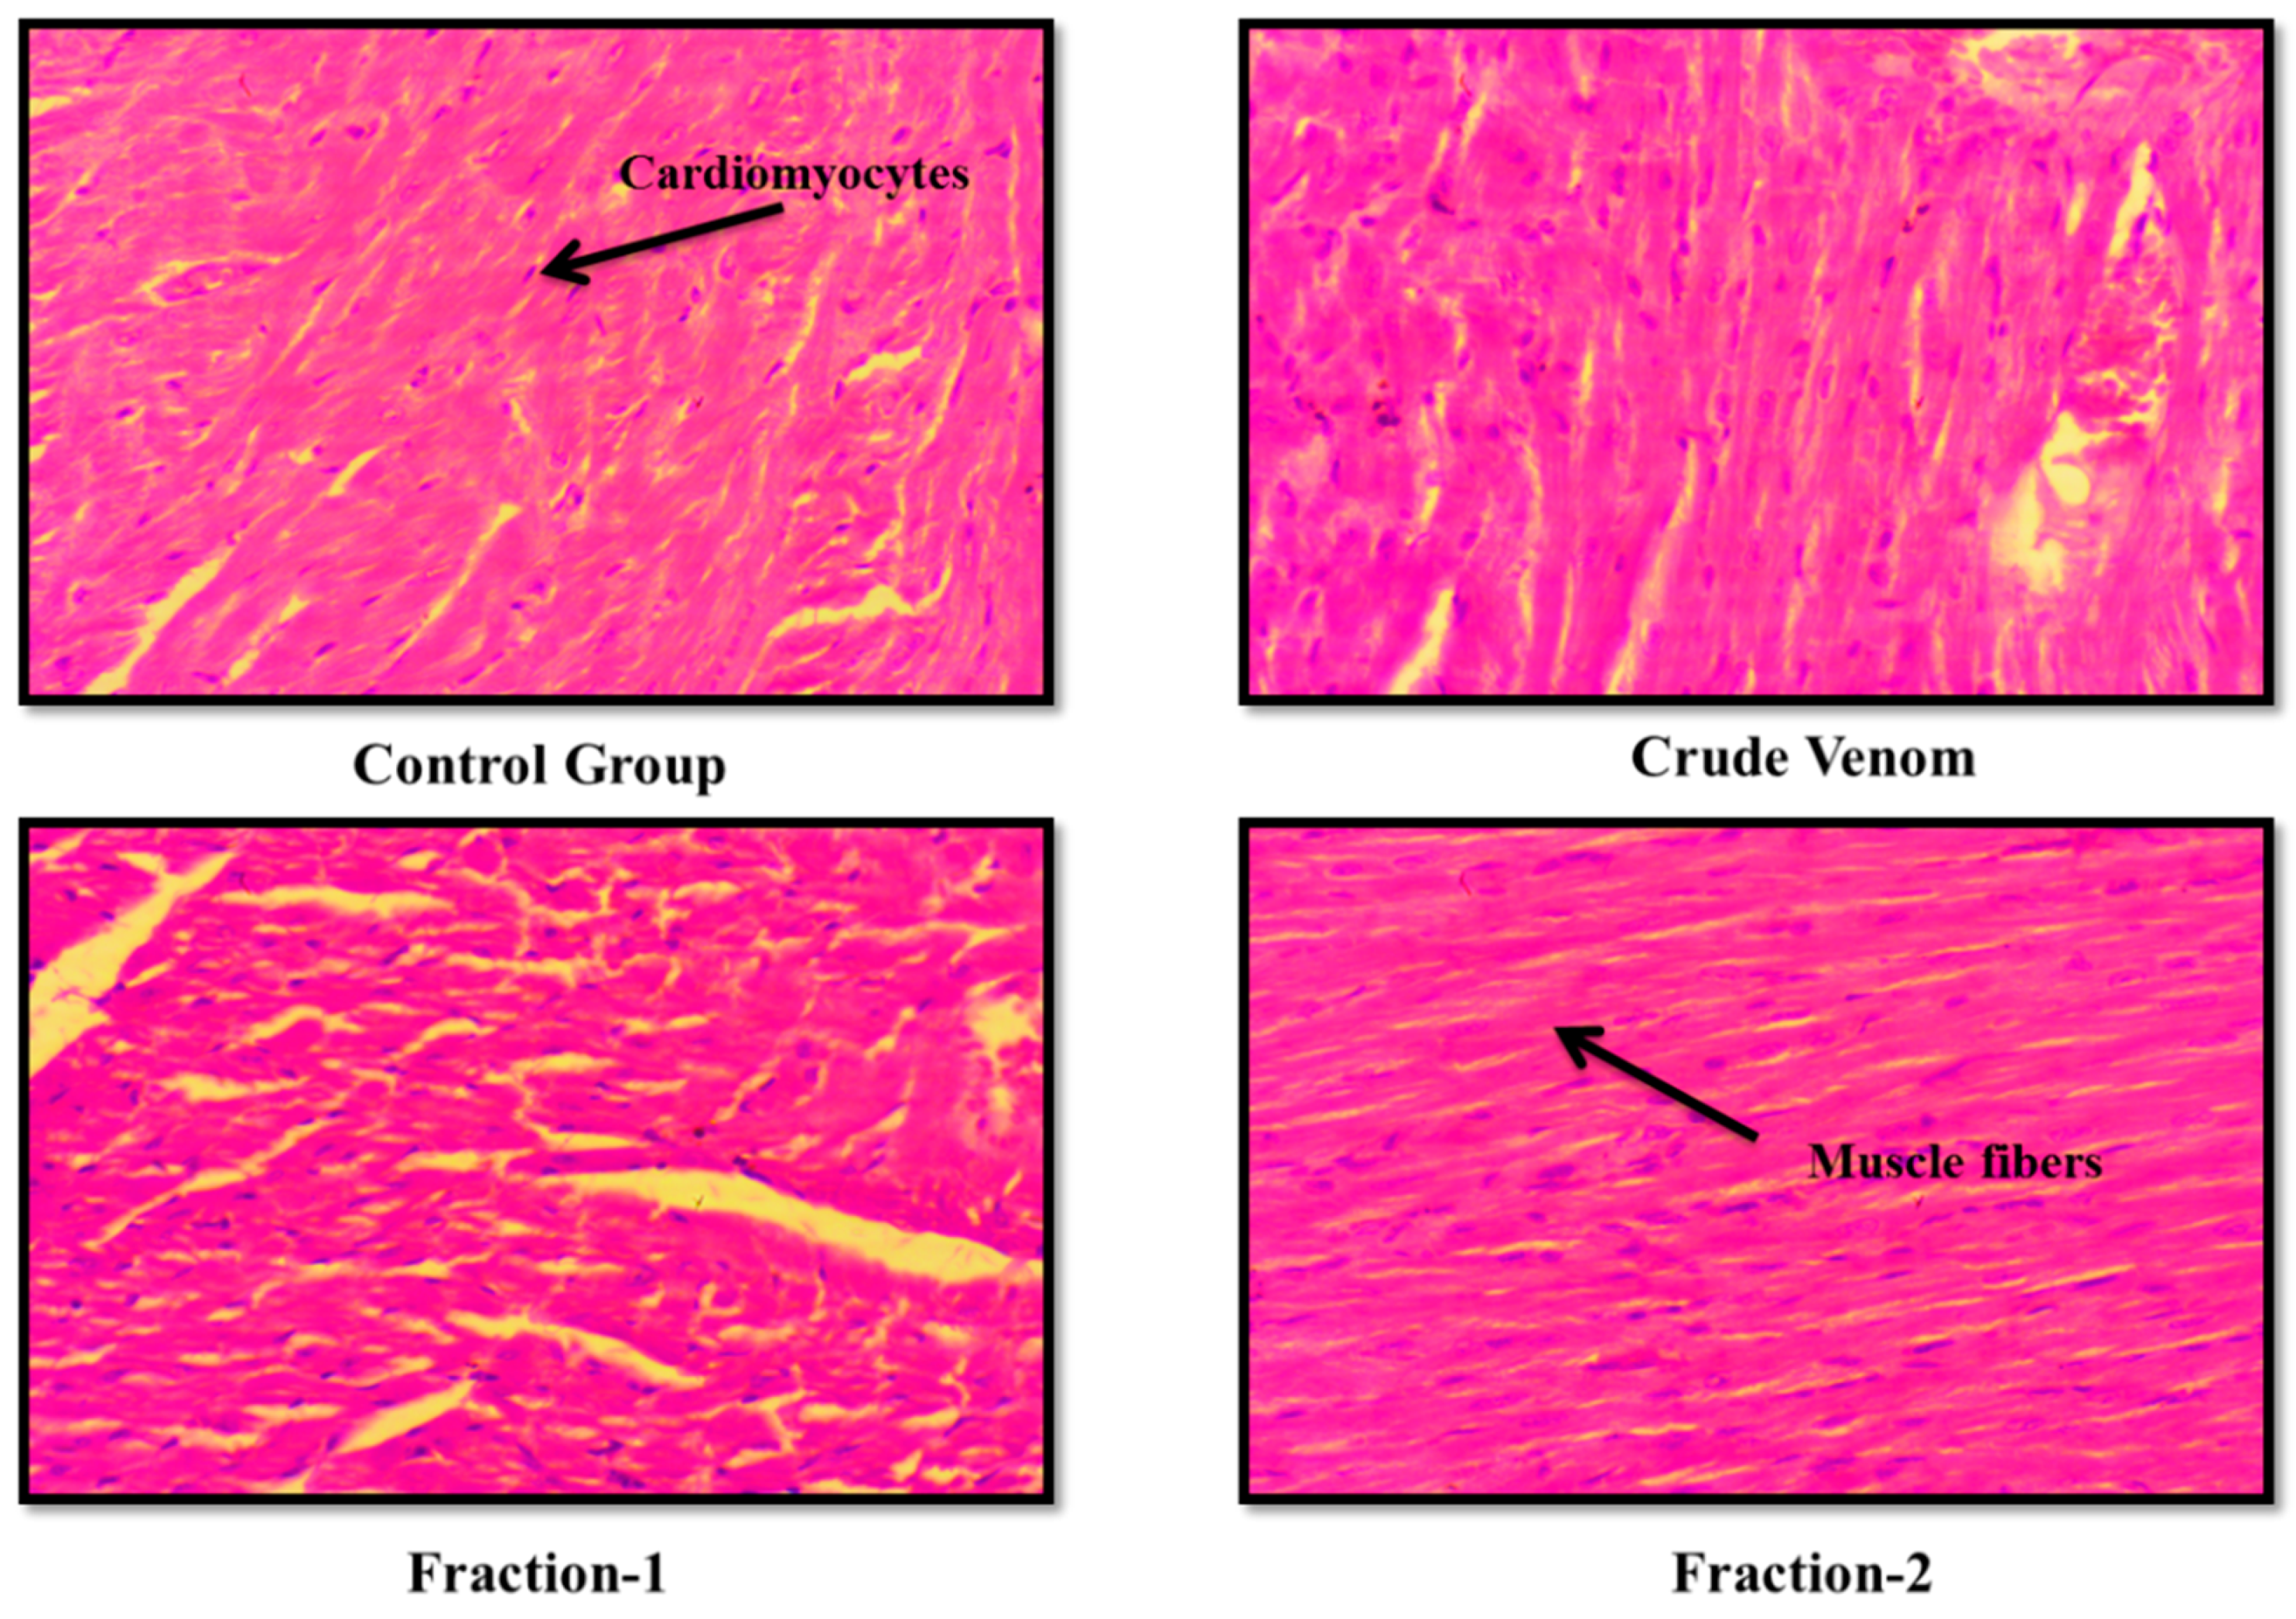
Figure 5.
Effect of Crude venom and F-1 and F-2 on mice Liver during Acute toxicity study. Sections were stained by hematoxylin and eosin (H&E) and observed at 40x magnification under light microscope.
Figure 5.
Effect of Crude venom and F-1 and F-2 on mice Liver during Acute toxicity study. Sections were stained by hematoxylin and eosin (H&E) and observed at 40x magnification under light microscope.
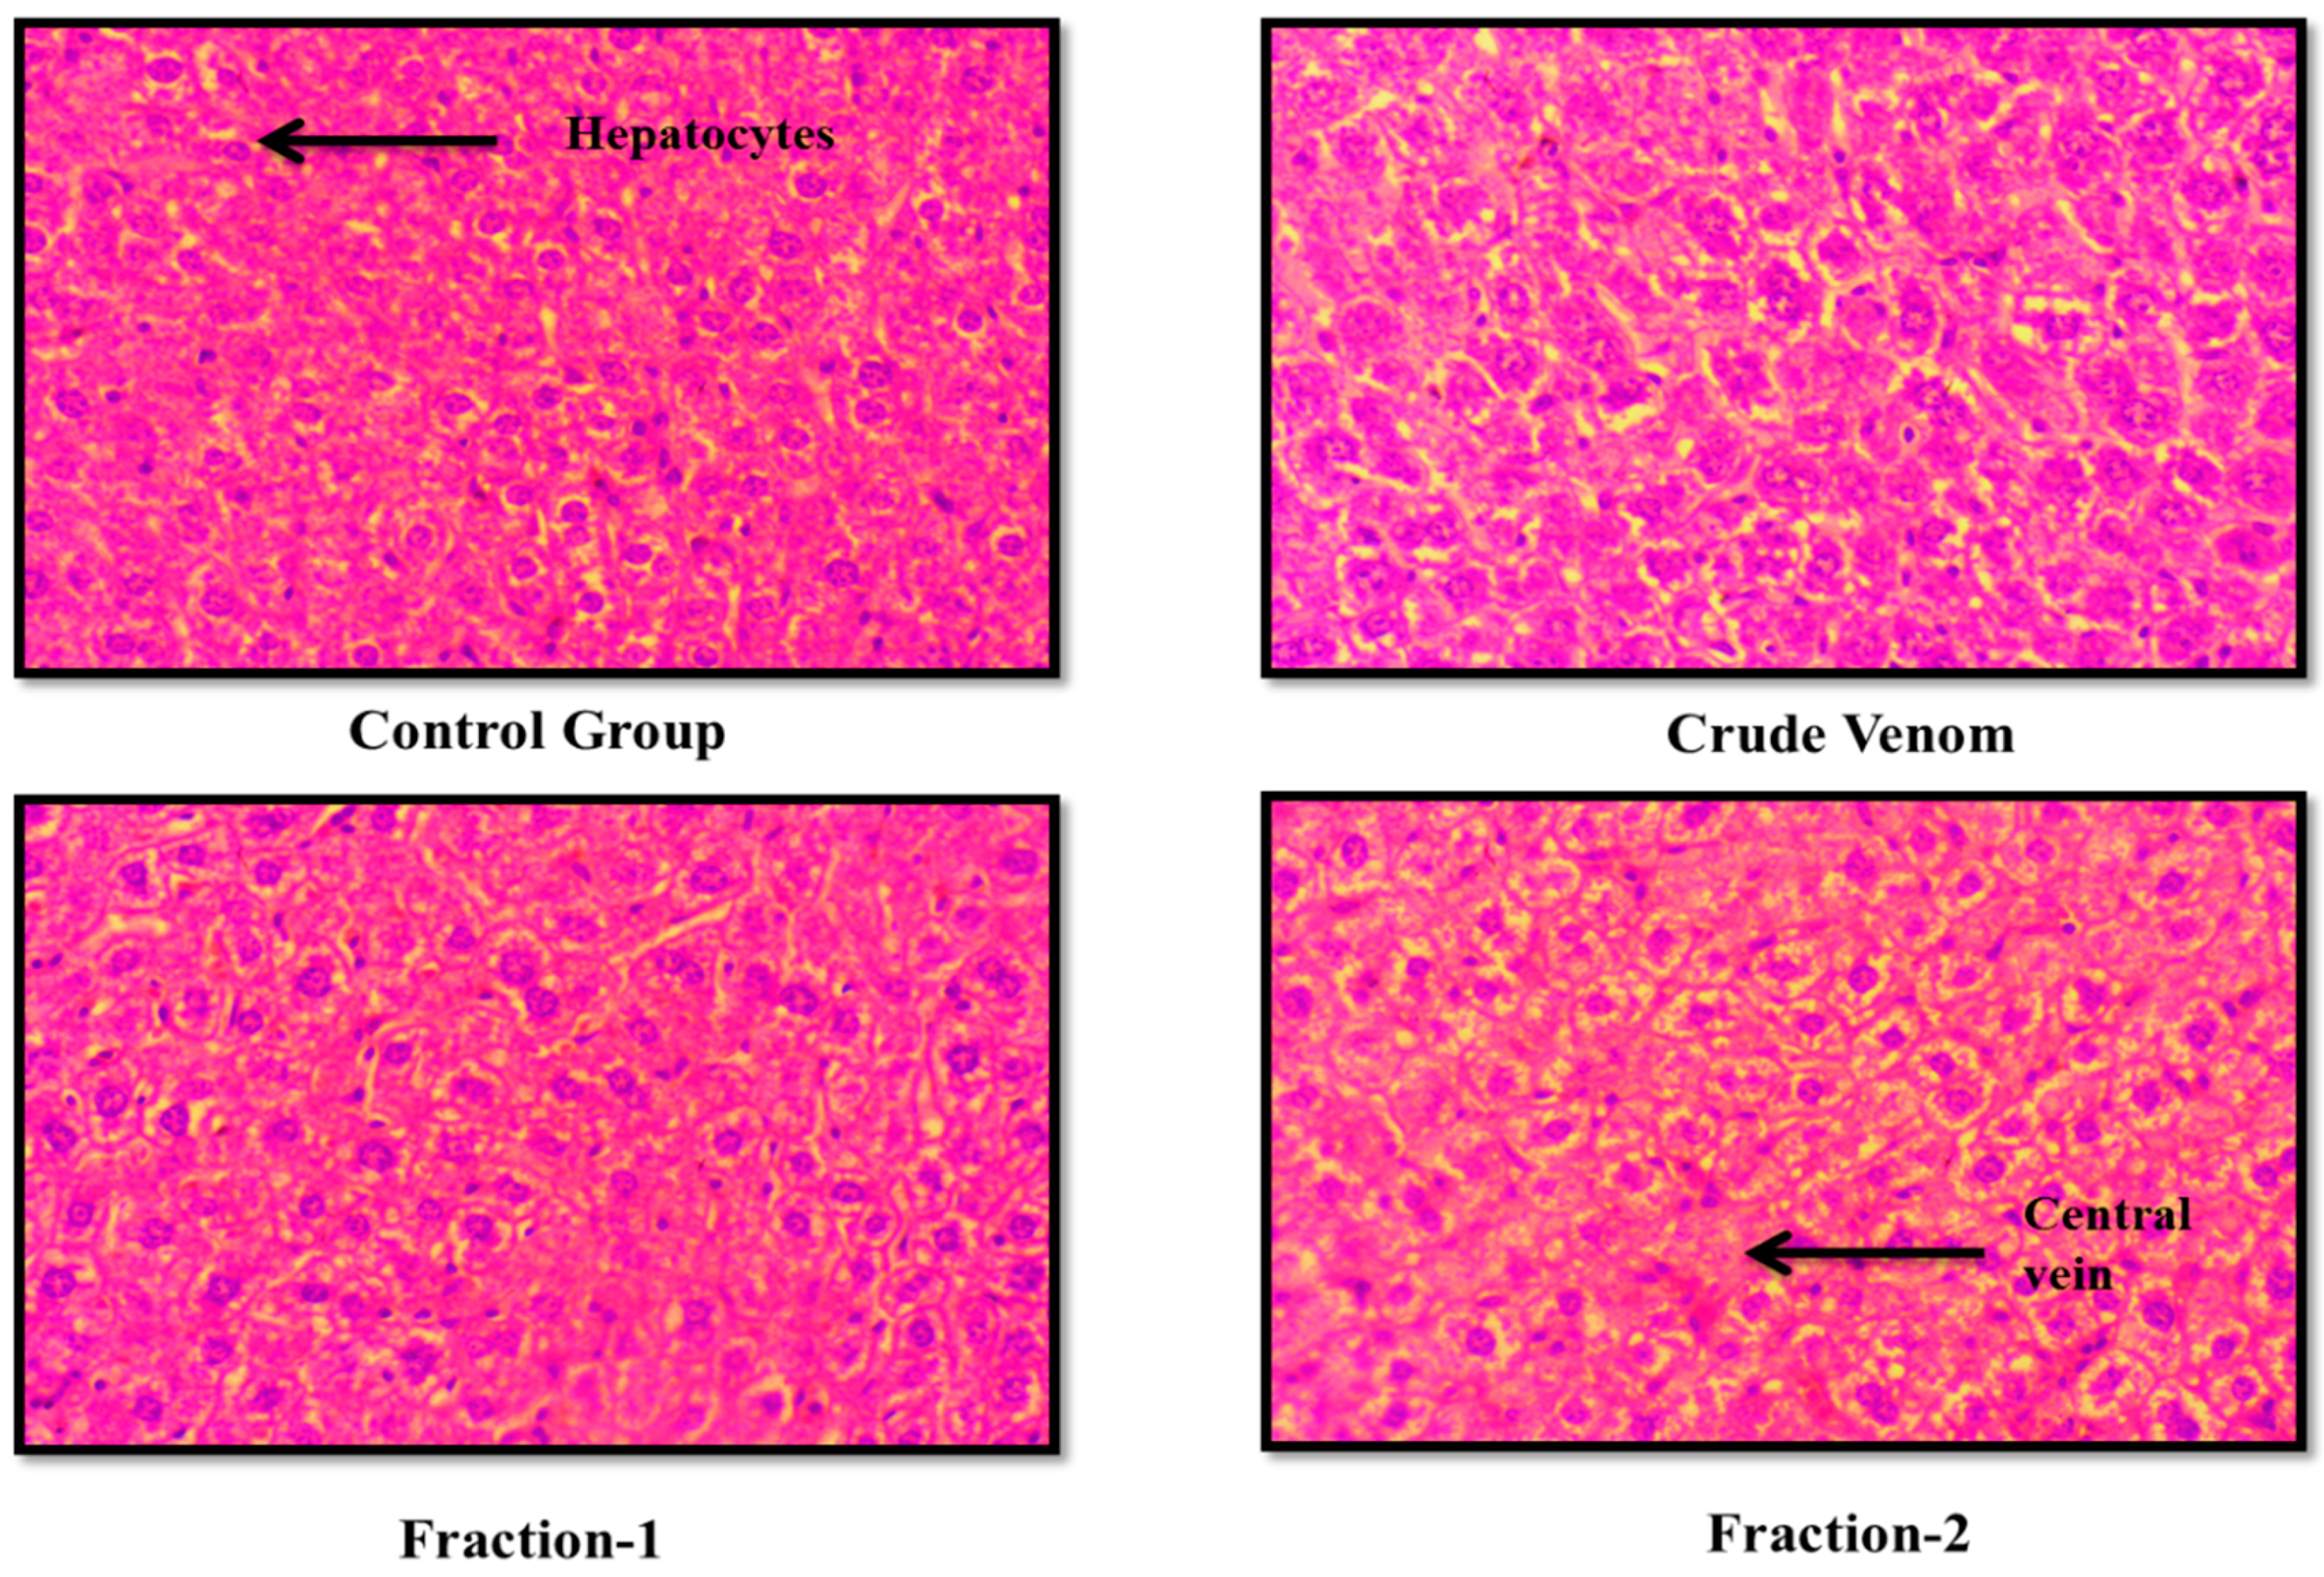
Figure 6.
Effect of Crude venom and F-1 and F-2 on mice Kidney during Acute toxicity study. Sections were stained by hematoxylin and eosin (H&E) and observed at 40x magnification under light microscope.
Figure 6.
Effect of Crude venom and F-1 and F-2 on mice Kidney during Acute toxicity study. Sections were stained by hematoxylin and eosin (H&E) and observed at 40x magnification under light microscope.
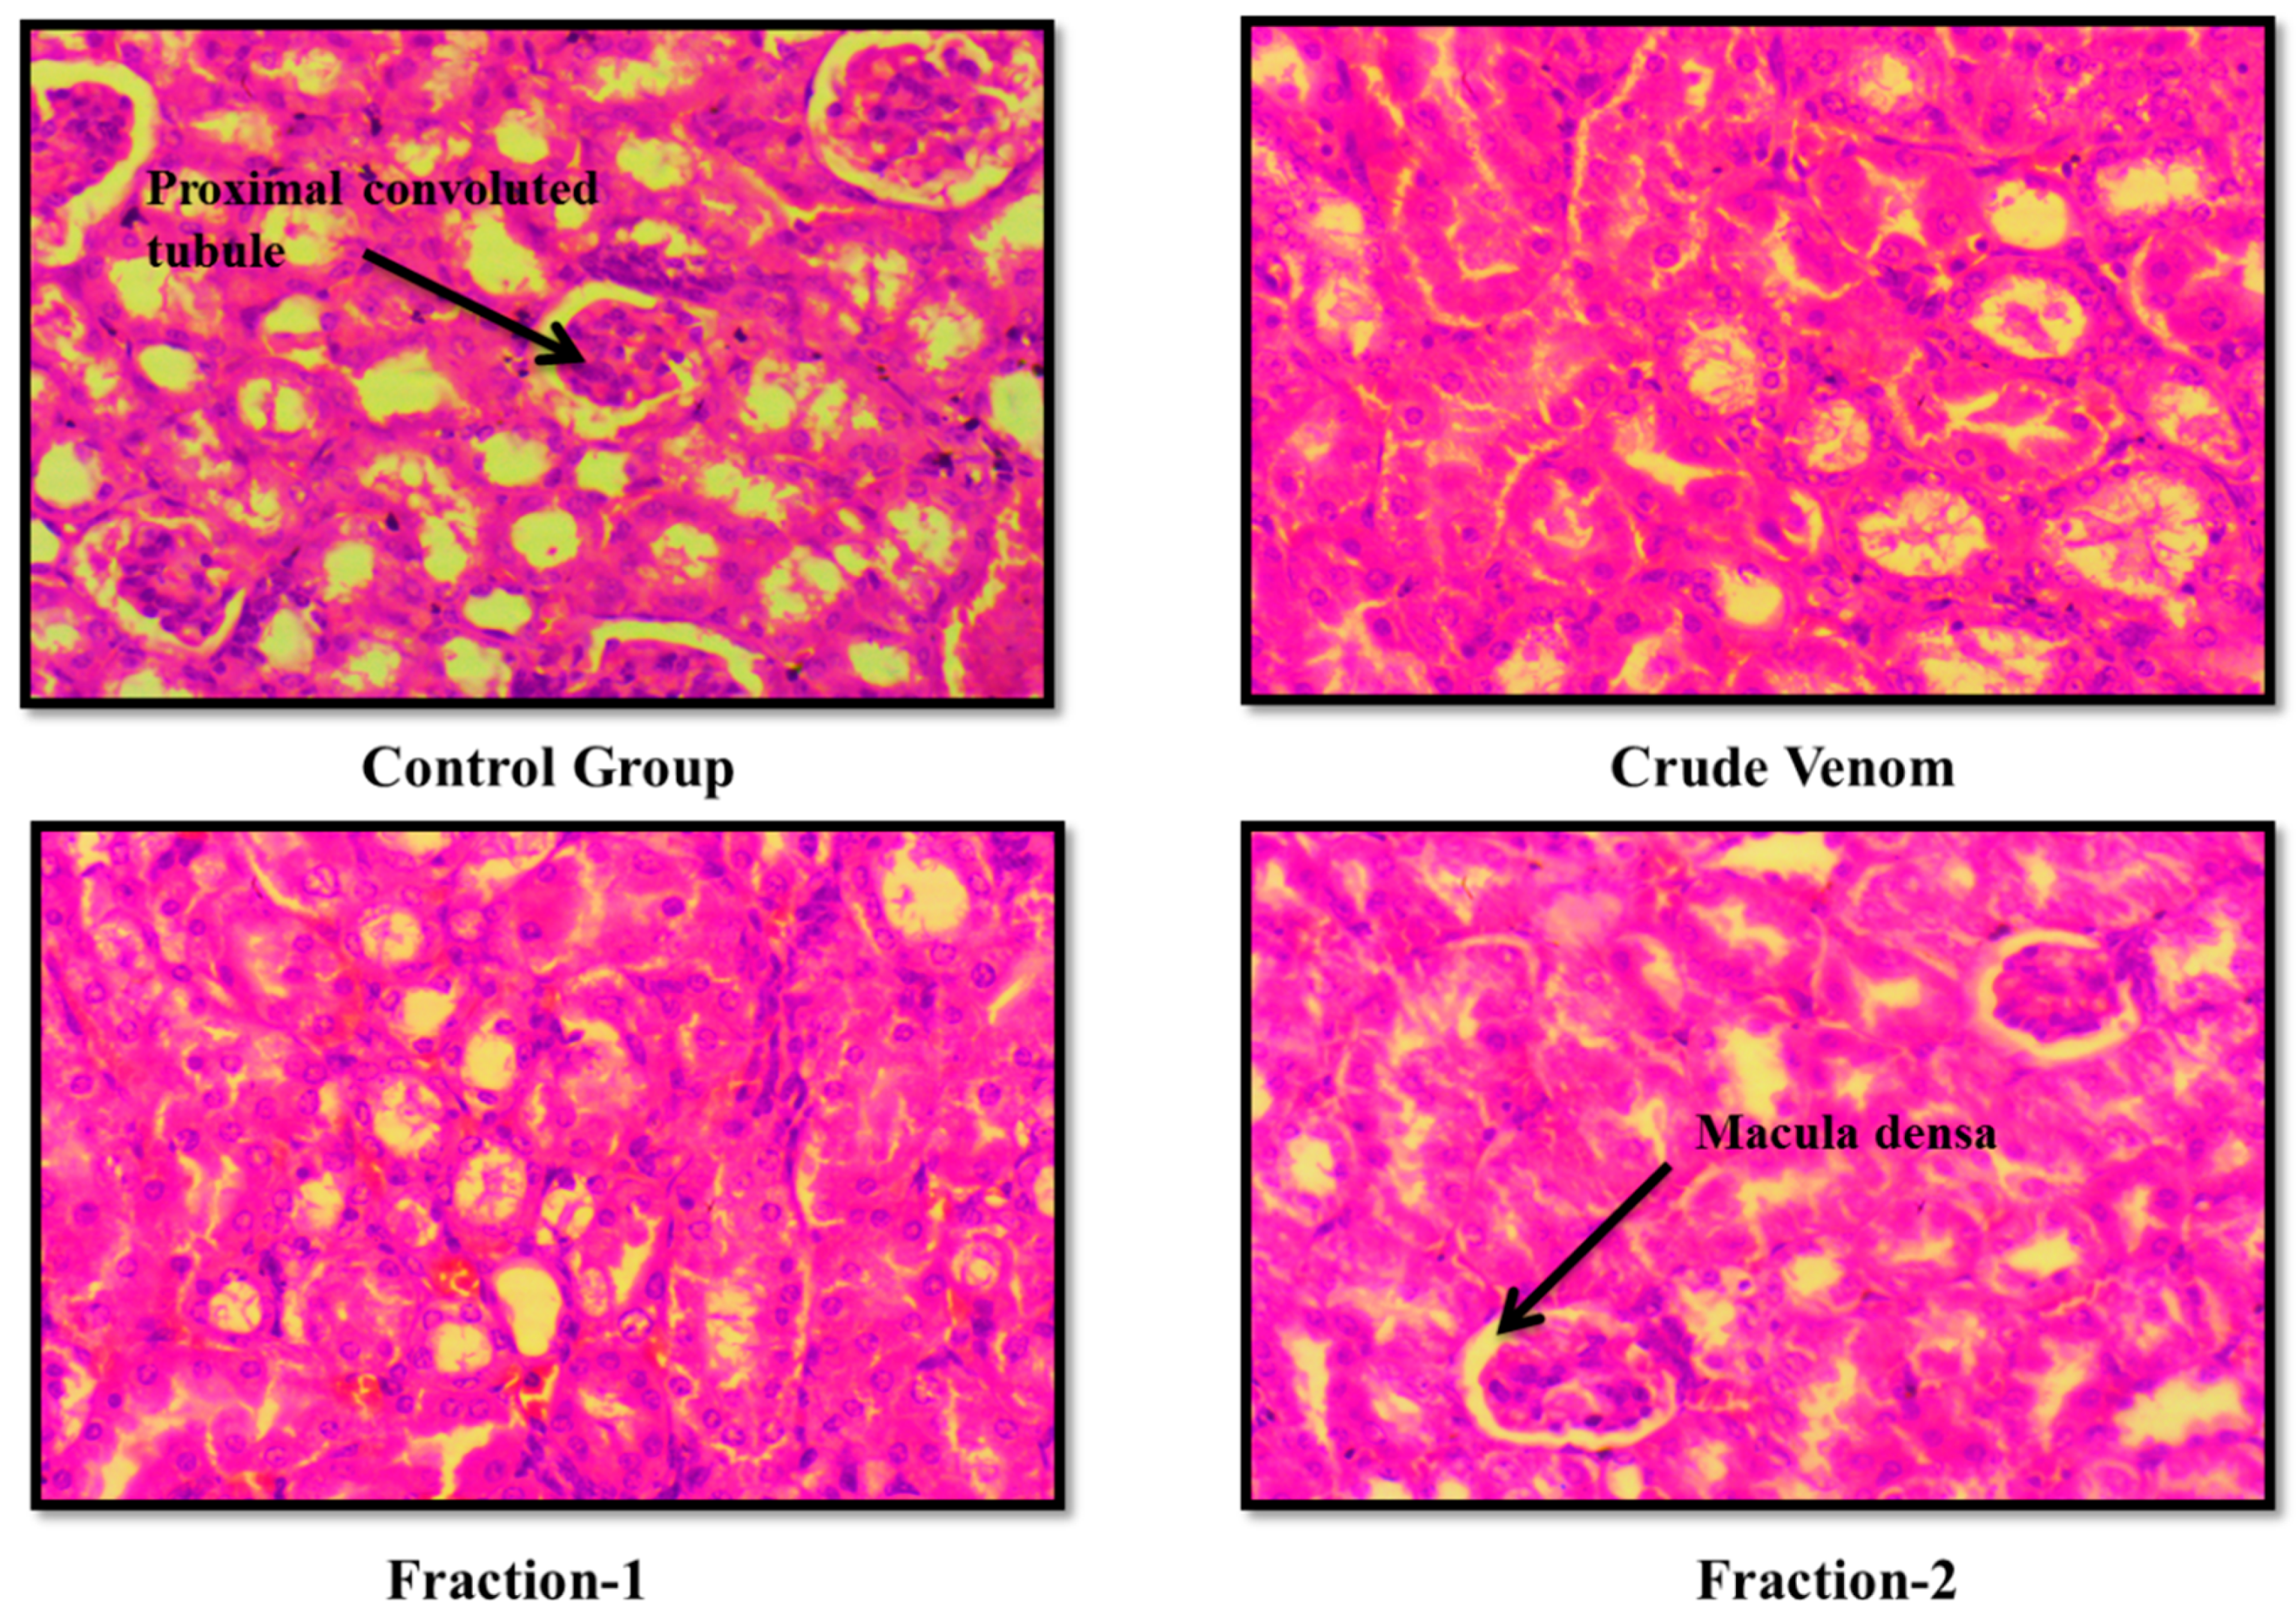
Figure 7.
Effect of Crude venom and F-1 and F-2 on mice Brain during Sub- Acute toxicity study. Sections were stained by hematoxylin and eosin (H&E) and observed at 40x magnification under light microscope.
Figure 7.
Effect of Crude venom and F-1 and F-2 on mice Brain during Sub- Acute toxicity study. Sections were stained by hematoxylin and eosin (H&E) and observed at 40x magnification under light microscope.
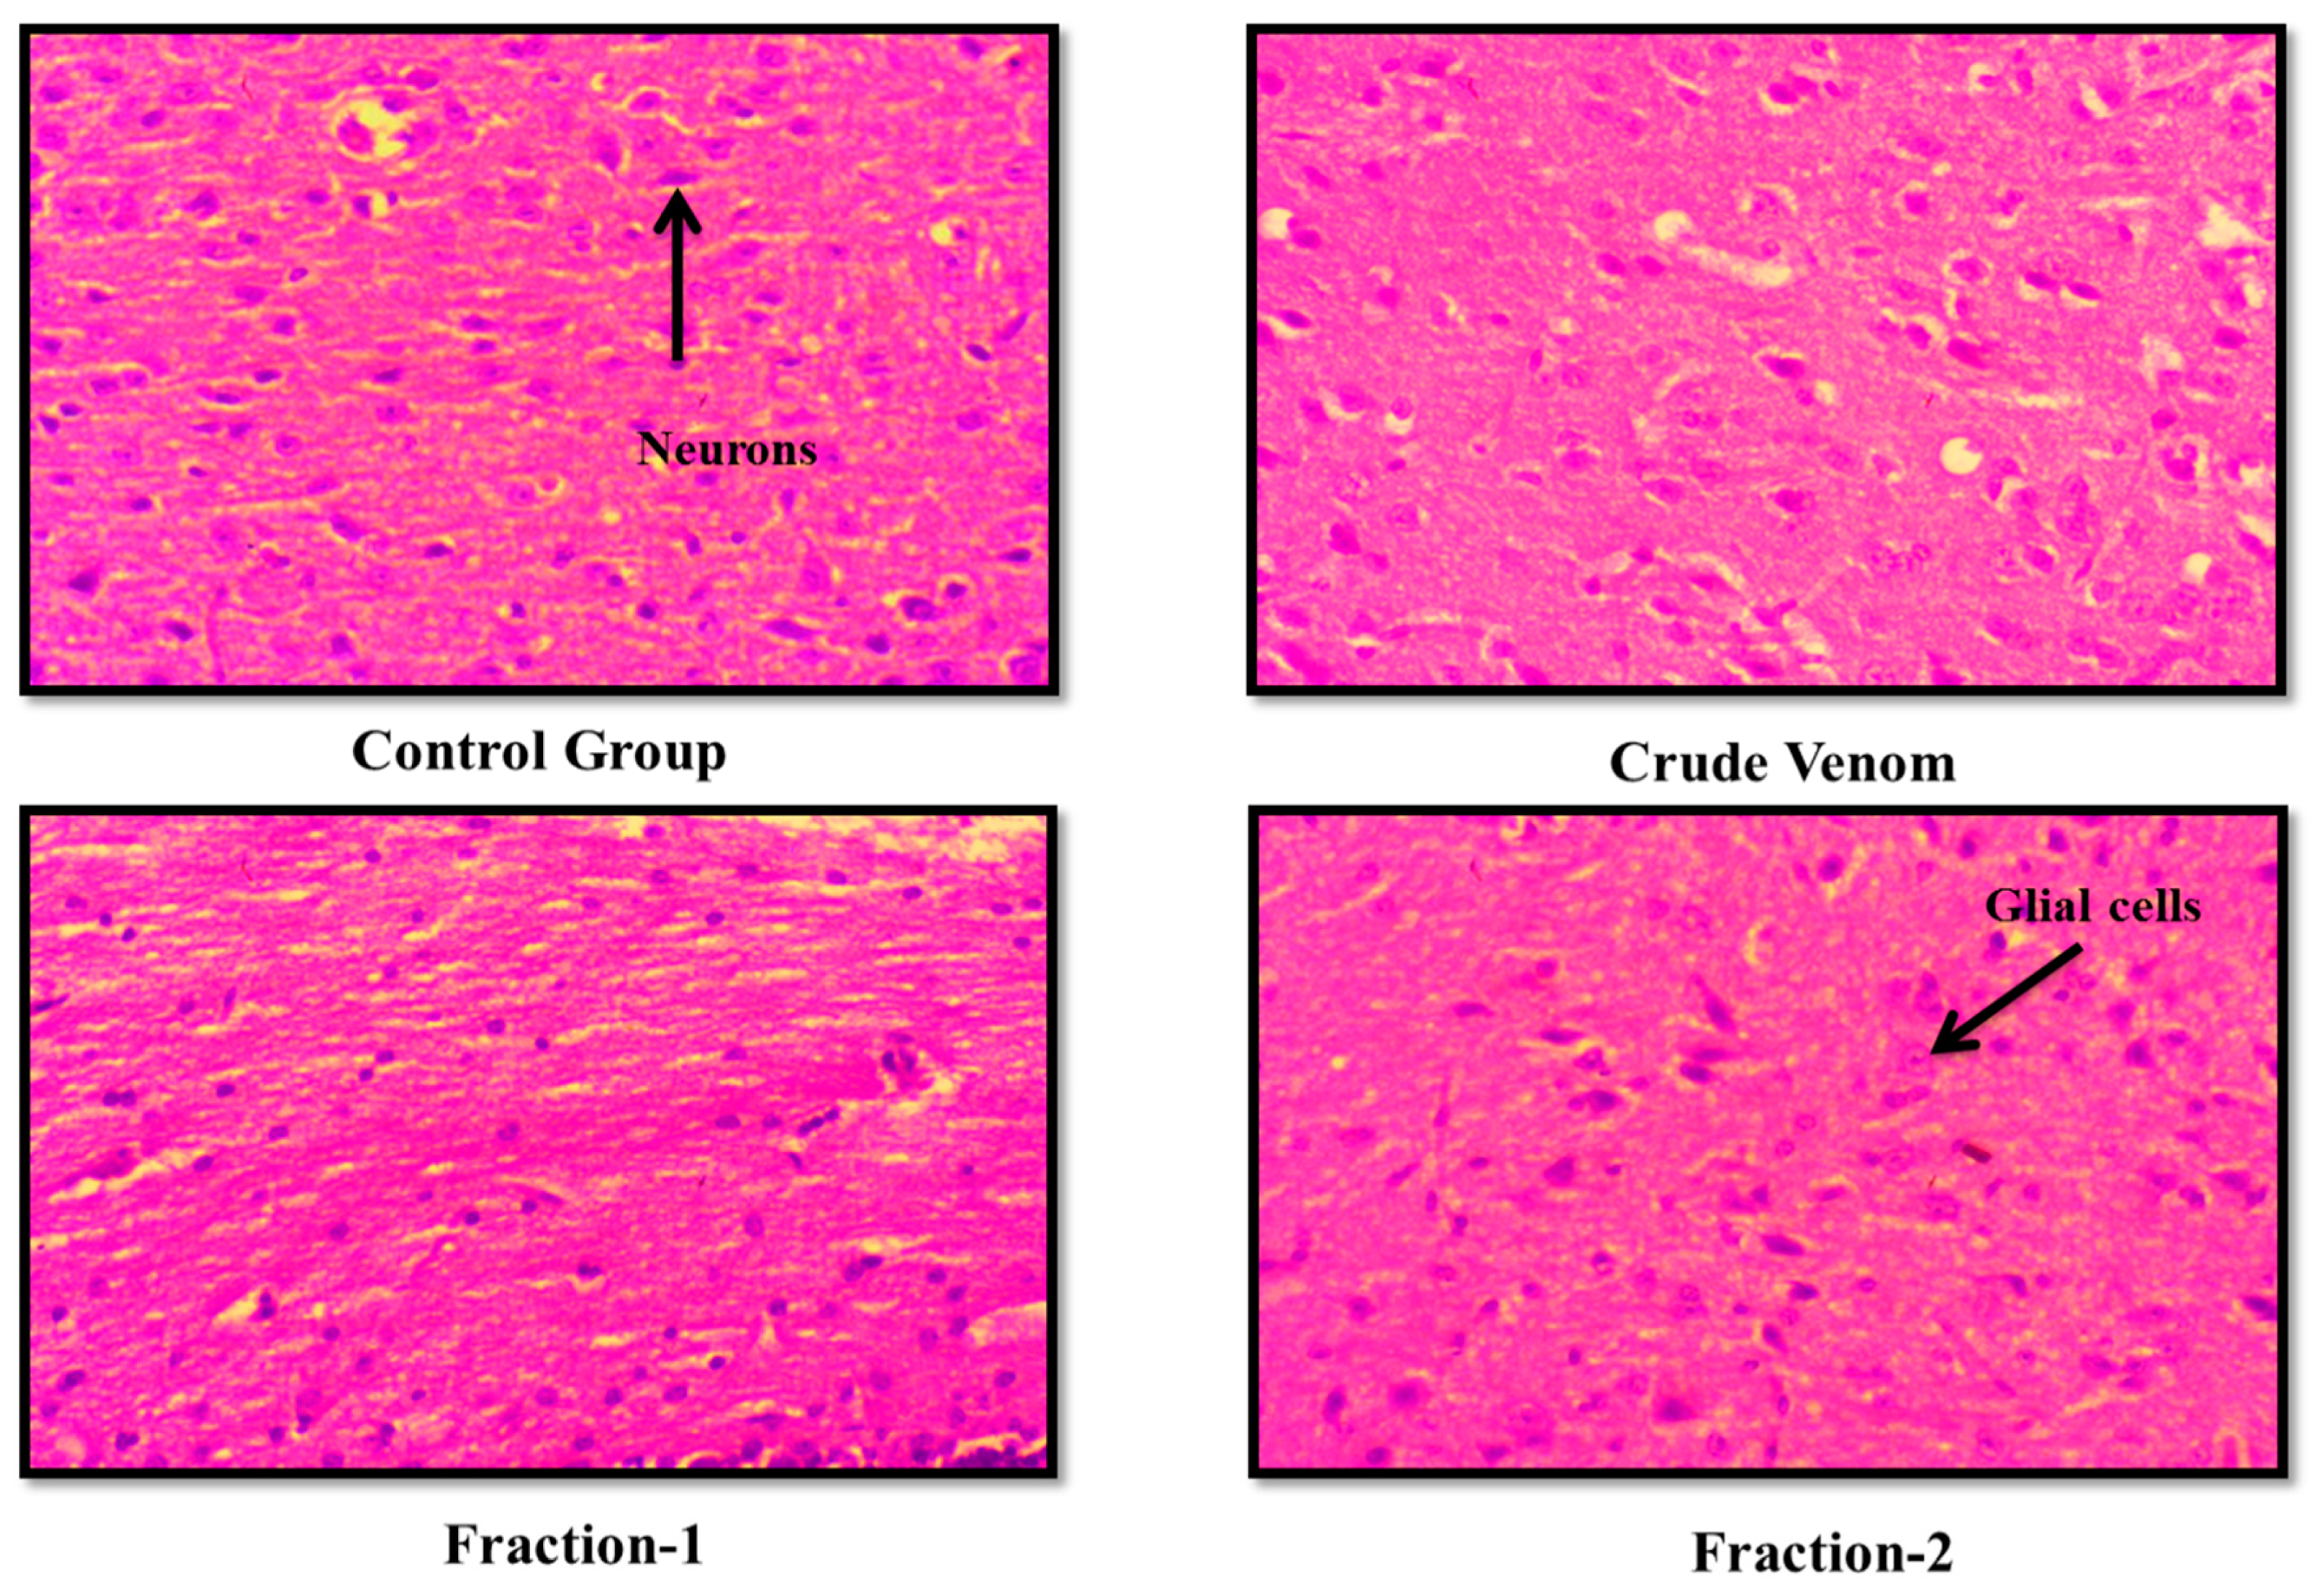
Figure 8.
Effect of Crude venom and F-1 and F-2 on mice Heart during Sub-Acute toxicity study. Sections were stained by hematoxylin and eosin (H&E) and observed at 40x magnification under light microscope.
Figure 8.
Effect of Crude venom and F-1 and F-2 on mice Heart during Sub-Acute toxicity study. Sections were stained by hematoxylin and eosin (H&E) and observed at 40x magnification under light microscope.
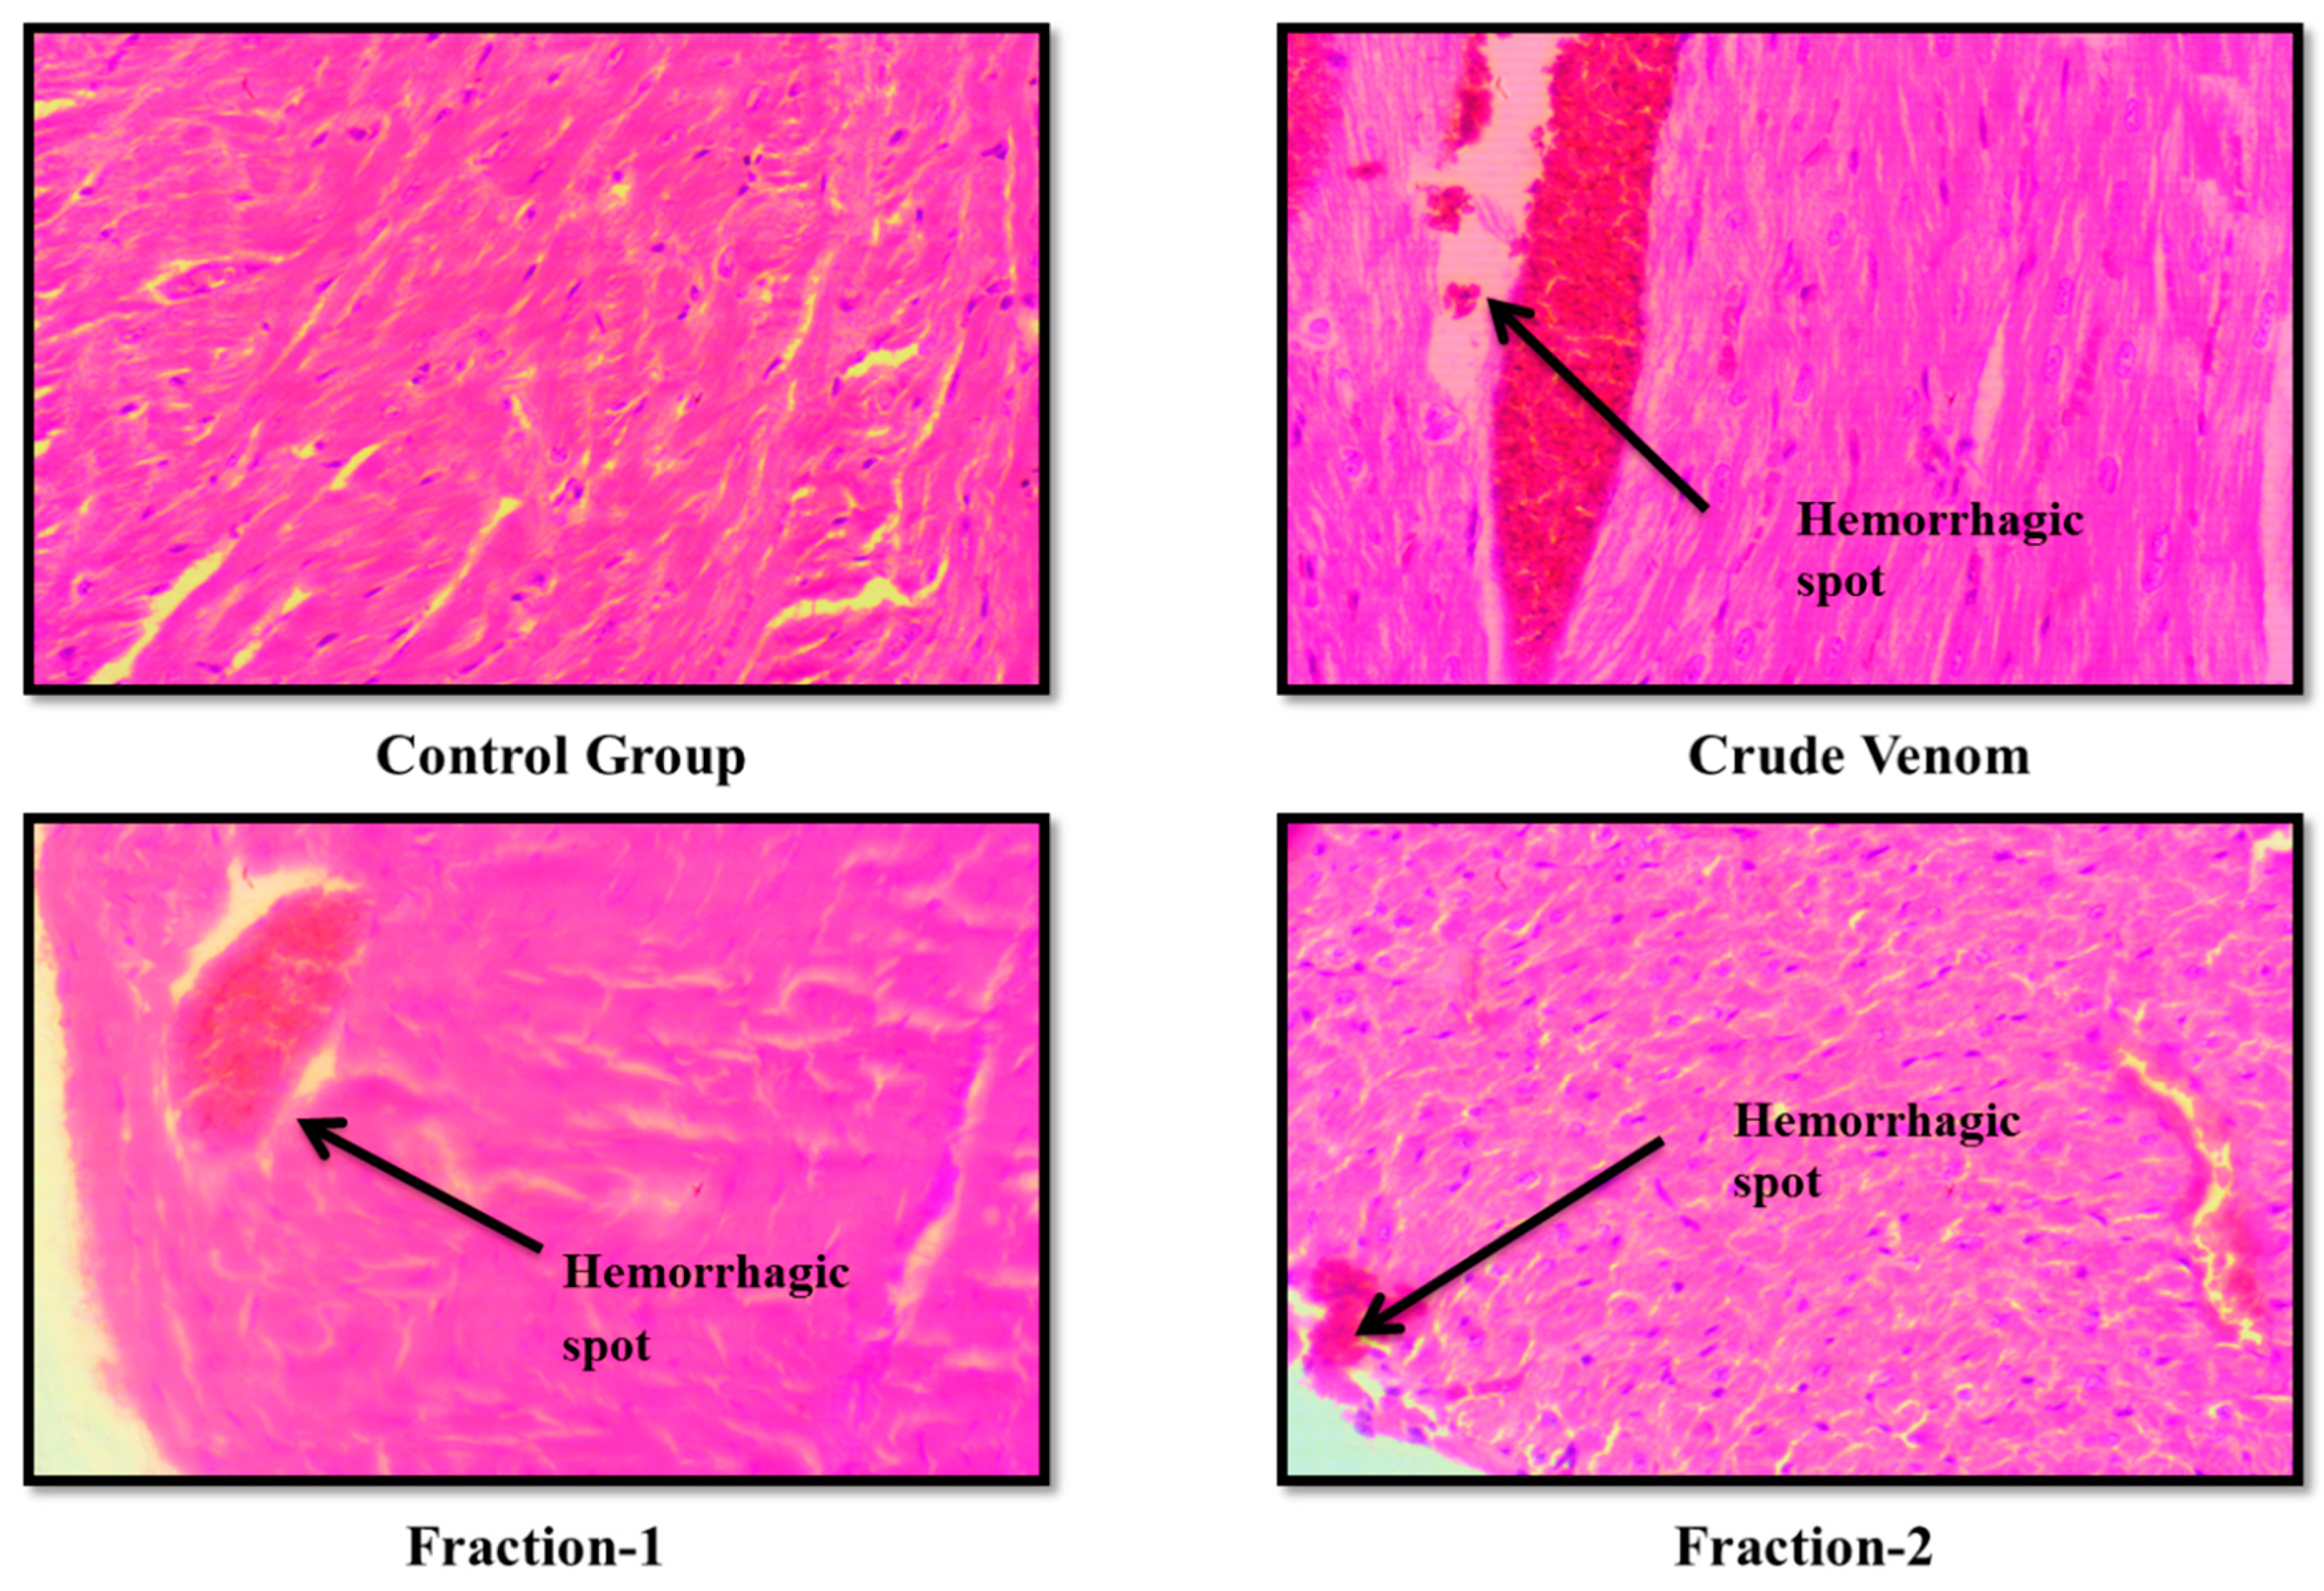
Figure 9.
Effect of Crude venom and F-1 and F-2 on mice Liver during Sub-Acute toxicity study. Sections were stained by hematoxylin and eosin (H&E) and observed at 40x magnification under light microscope.
Figure 9.
Effect of Crude venom and F-1 and F-2 on mice Liver during Sub-Acute toxicity study. Sections were stained by hematoxylin and eosin (H&E) and observed at 40x magnification under light microscope.
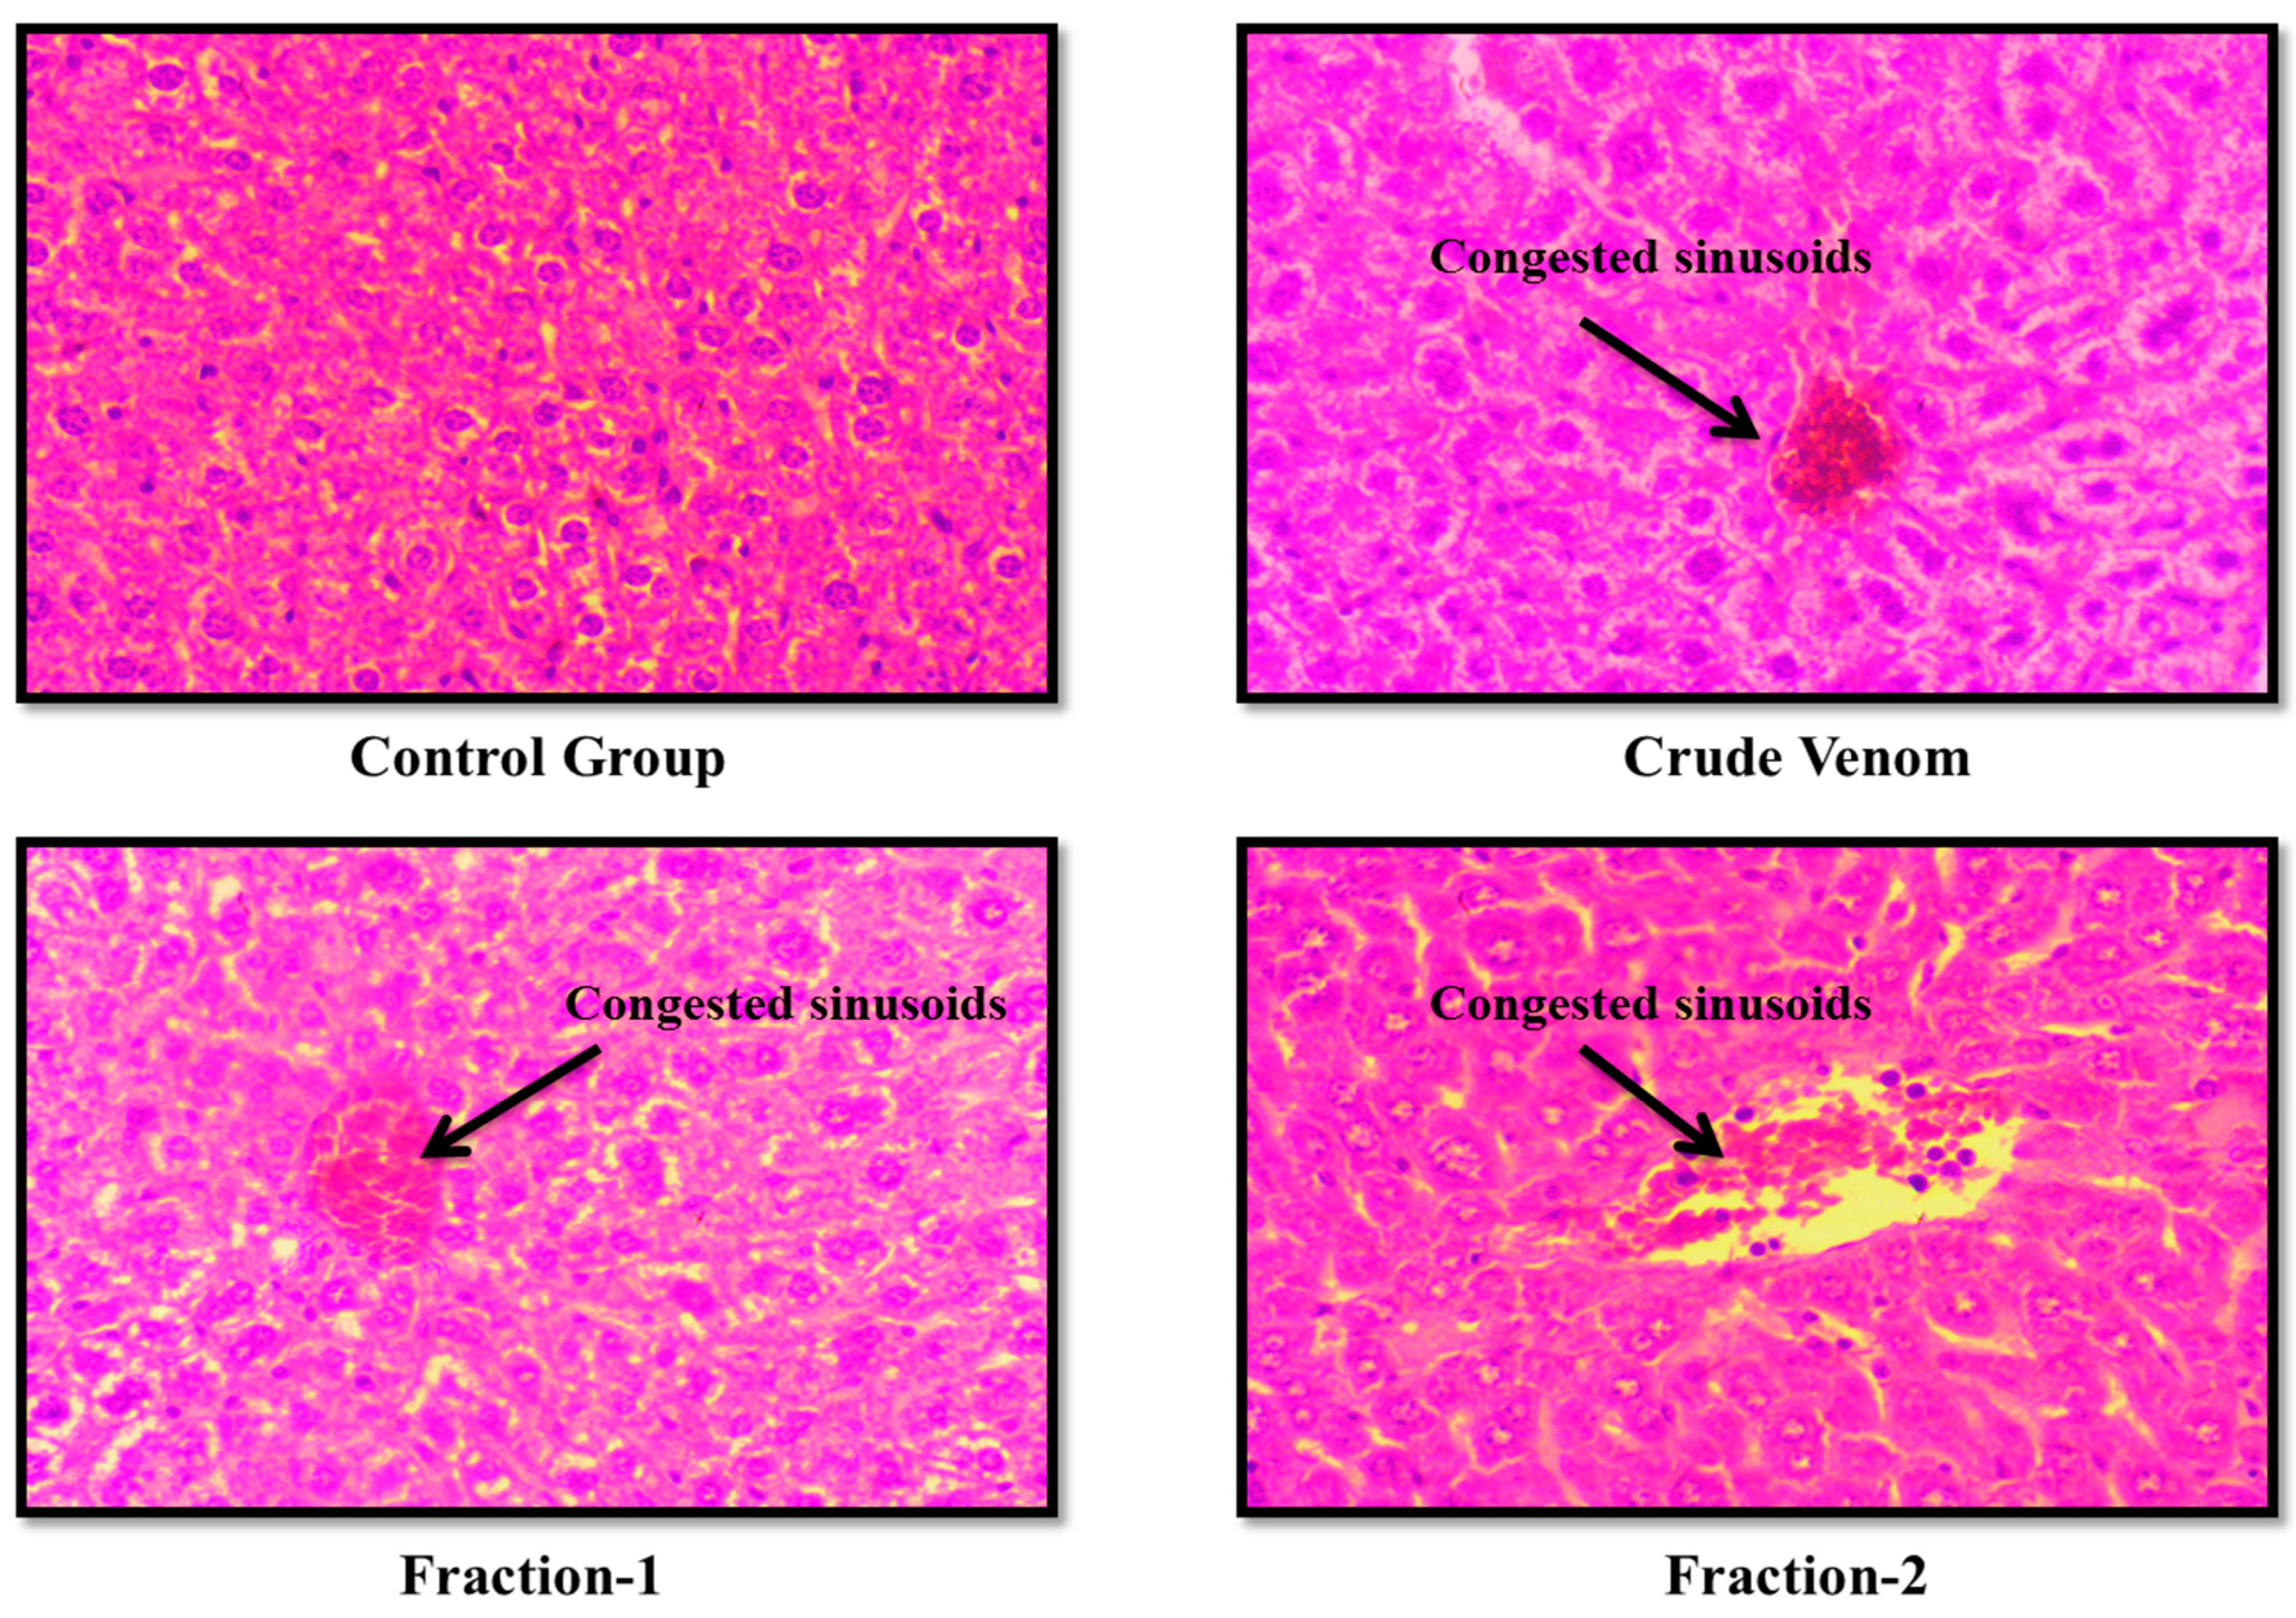
Figure 10.
Effect of Crude venom and F-1 and F-2 on mice Kidney during Sub-Acute toxicity study. Sections were stained by hematoxylin and eosin (H&E) and observed at 40x magnification under light microscope.
Figure 10.
Effect of Crude venom and F-1 and F-2 on mice Kidney during Sub-Acute toxicity study. Sections were stained by hematoxylin and eosin (H&E) and observed at 40x magnification under light microscope.
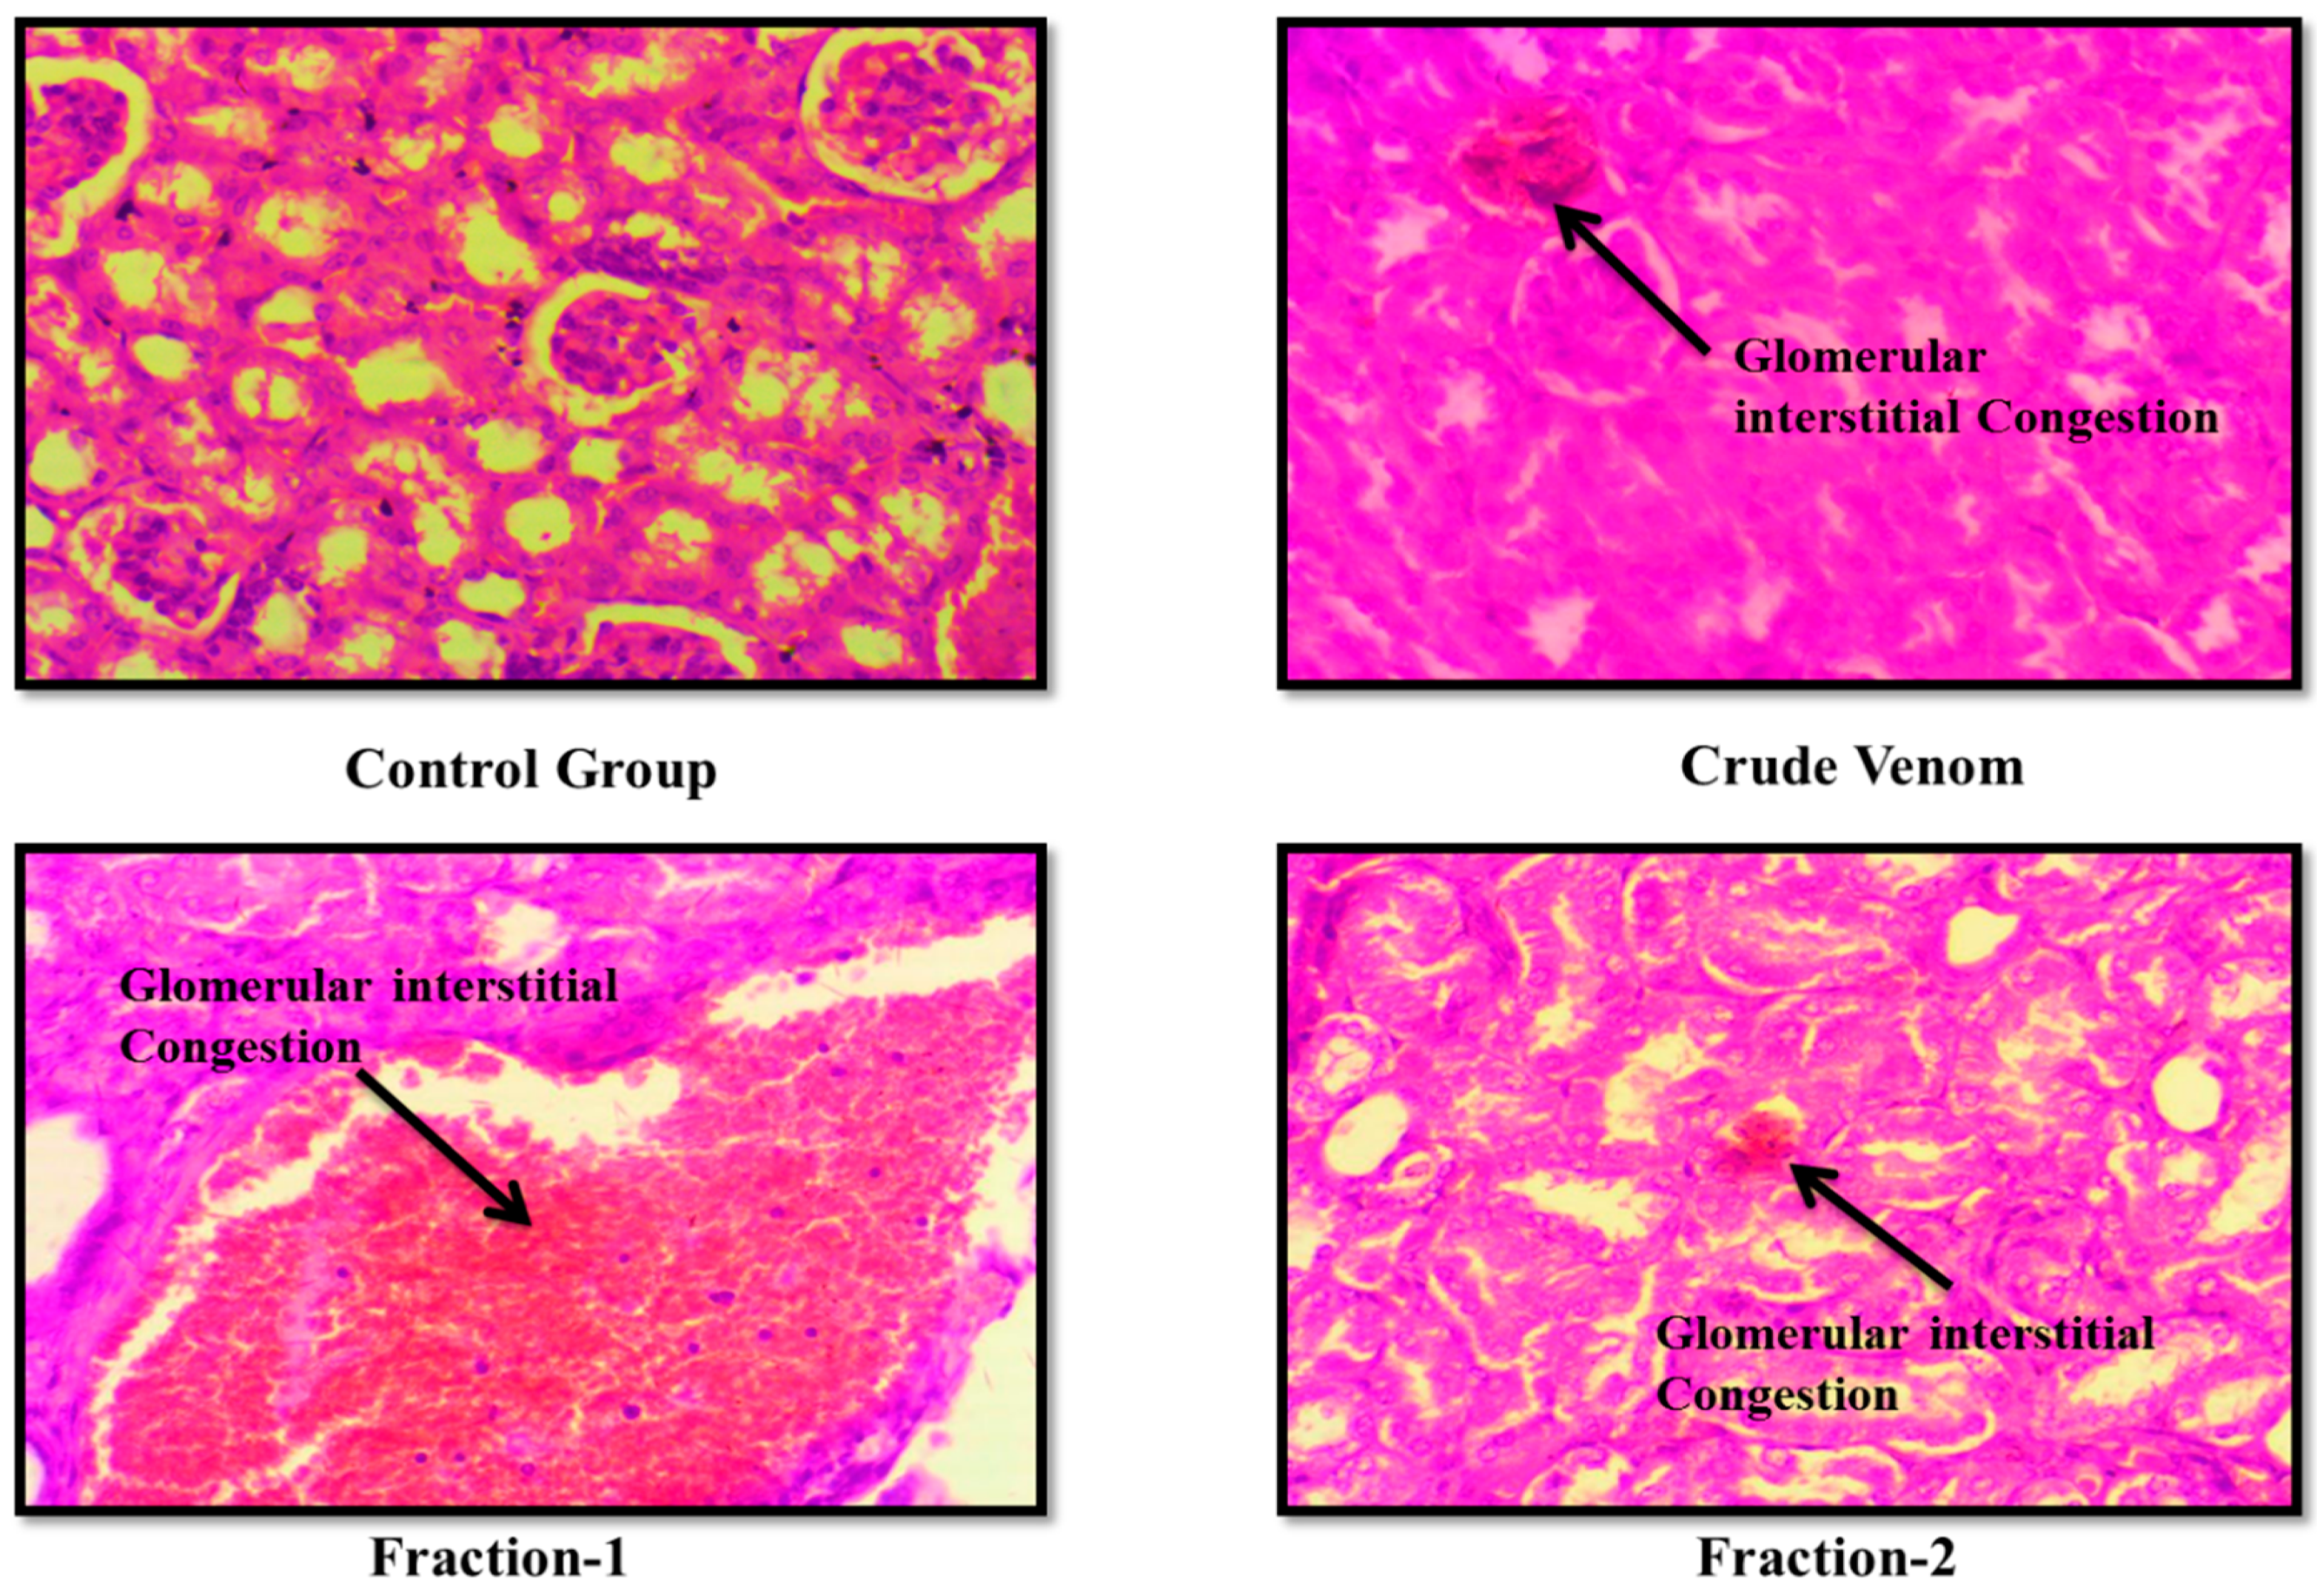
Figure 11.
Effect of Crude Venom, Fraction-1, Fraction-2 and standard drugs on the level of ROS by the Carrageenan induced Peritonitis method on mice.
Figure 11.
Effect of Crude Venom, Fraction-1, Fraction-2 and standard drugs on the level of ROS by the Carrageenan induced Peritonitis method on mice.
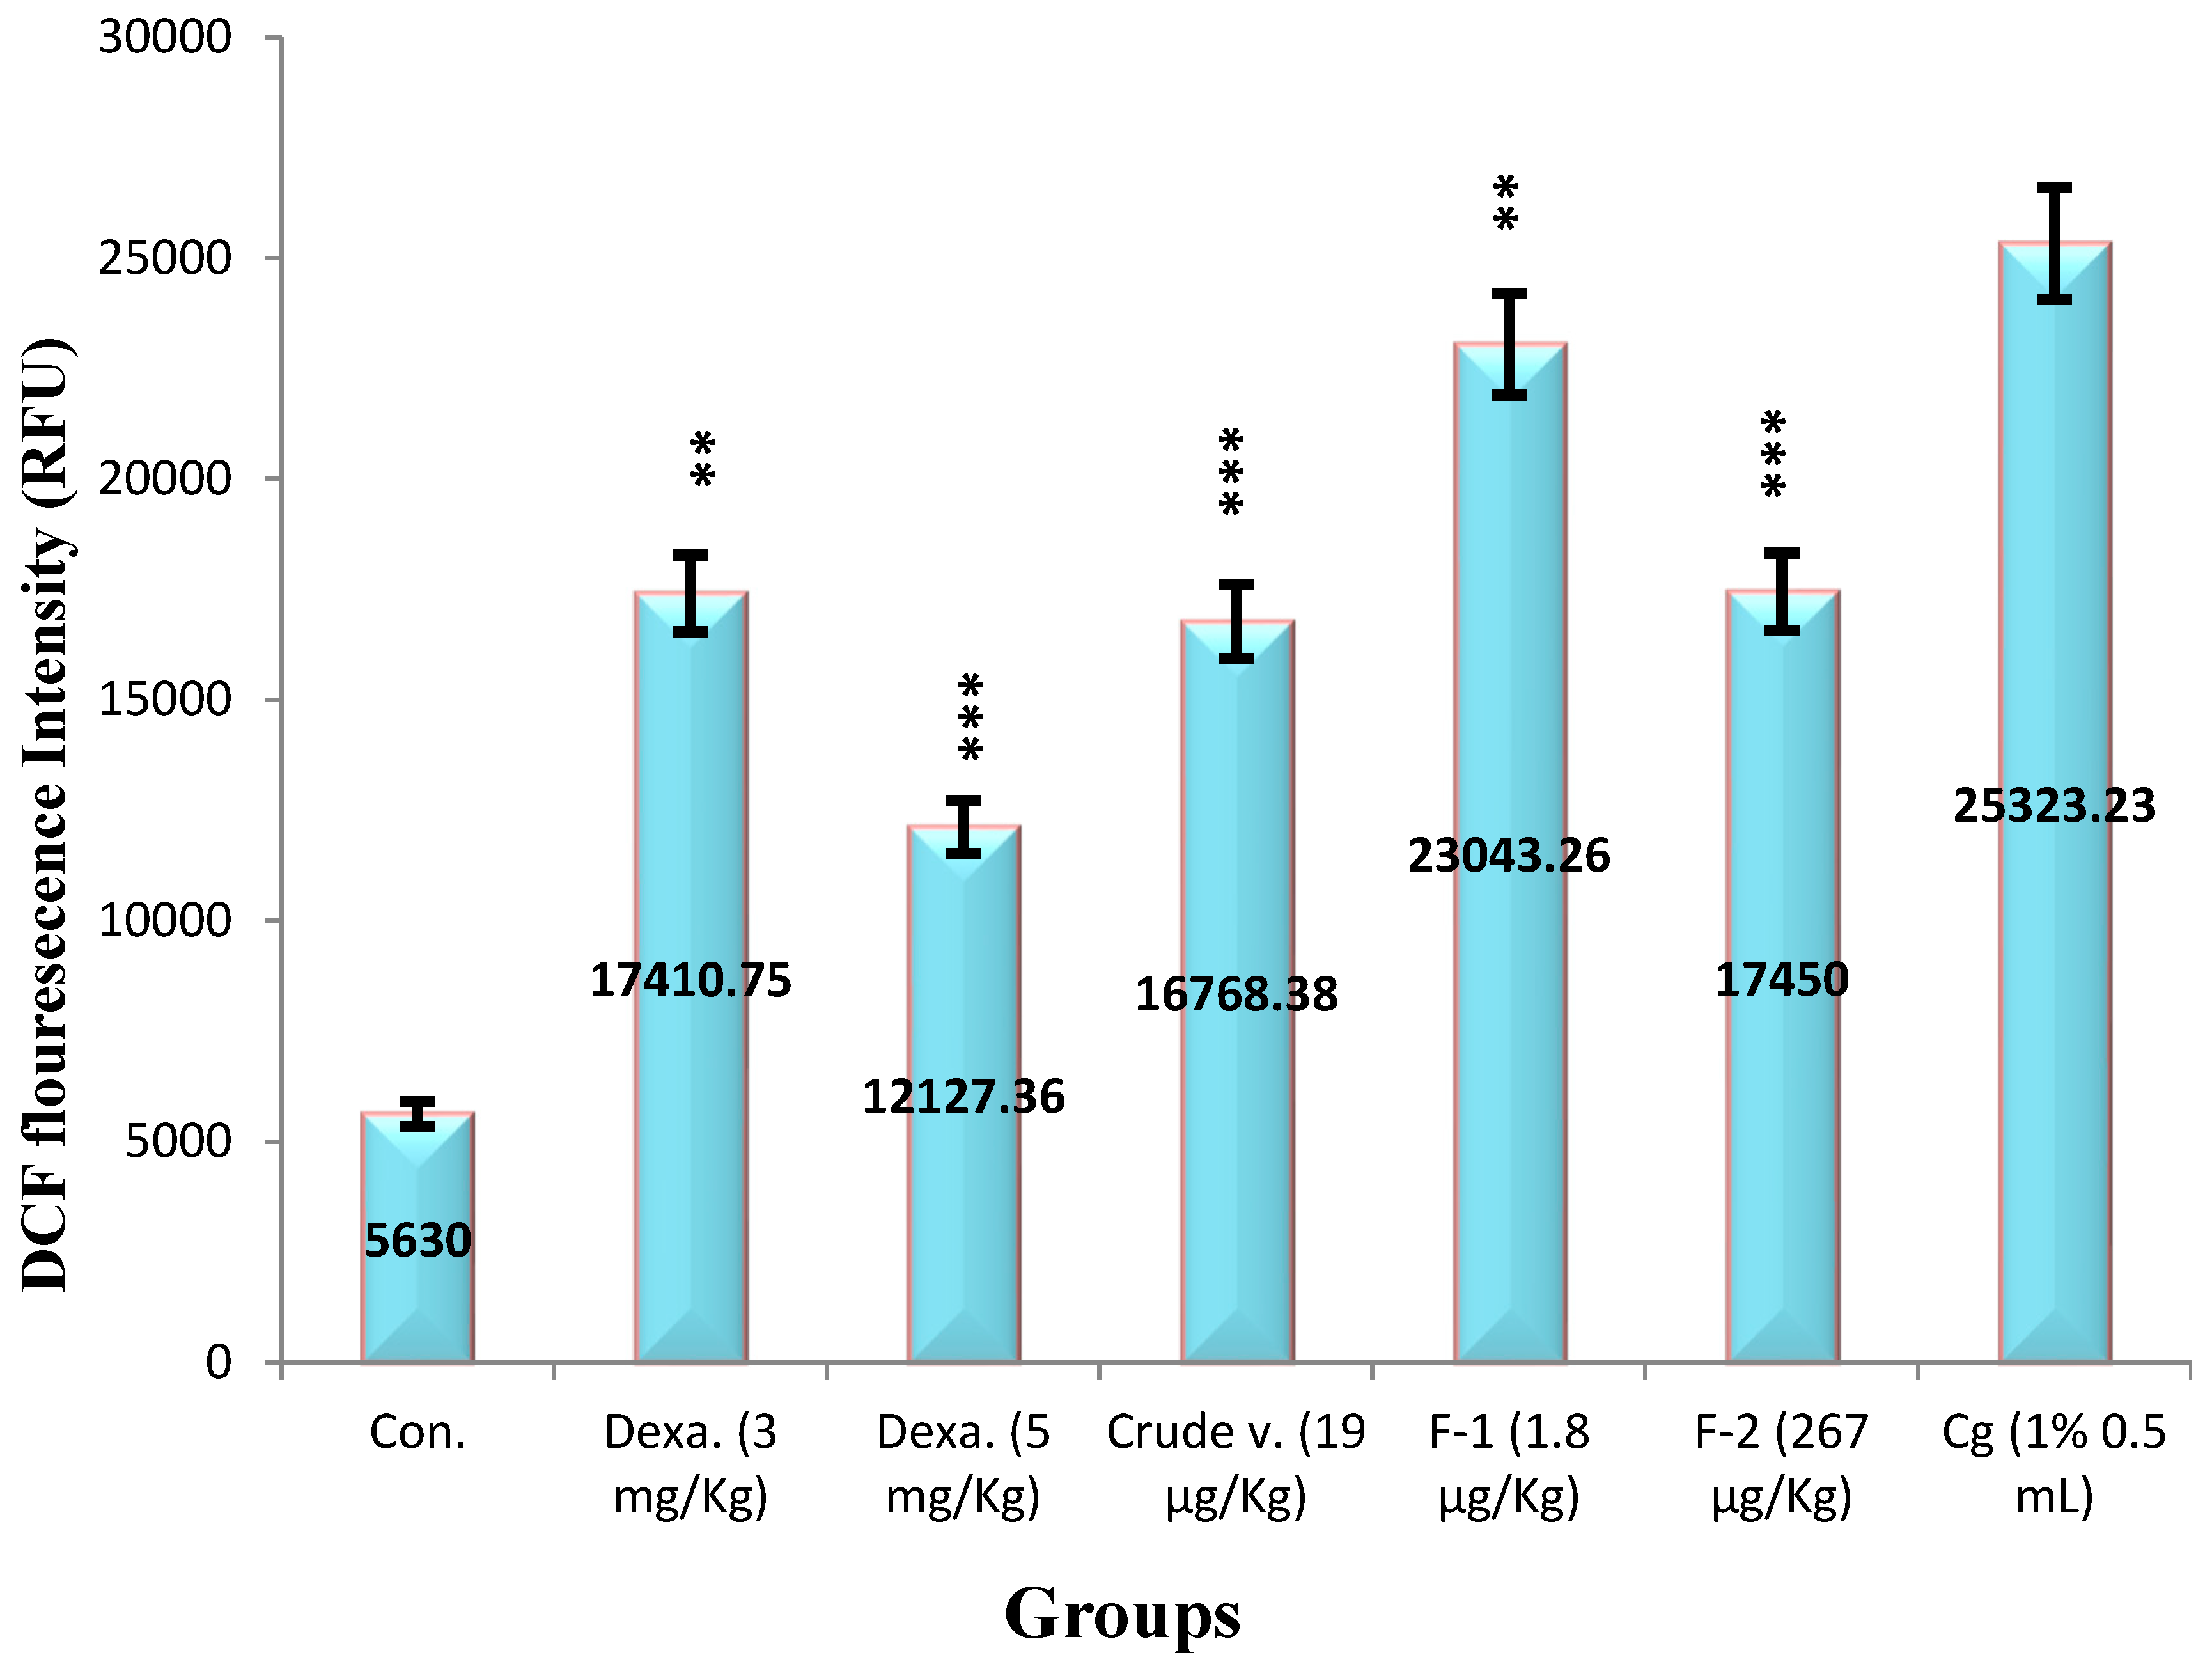
Figure 12.
Standard curve of TNF-α.
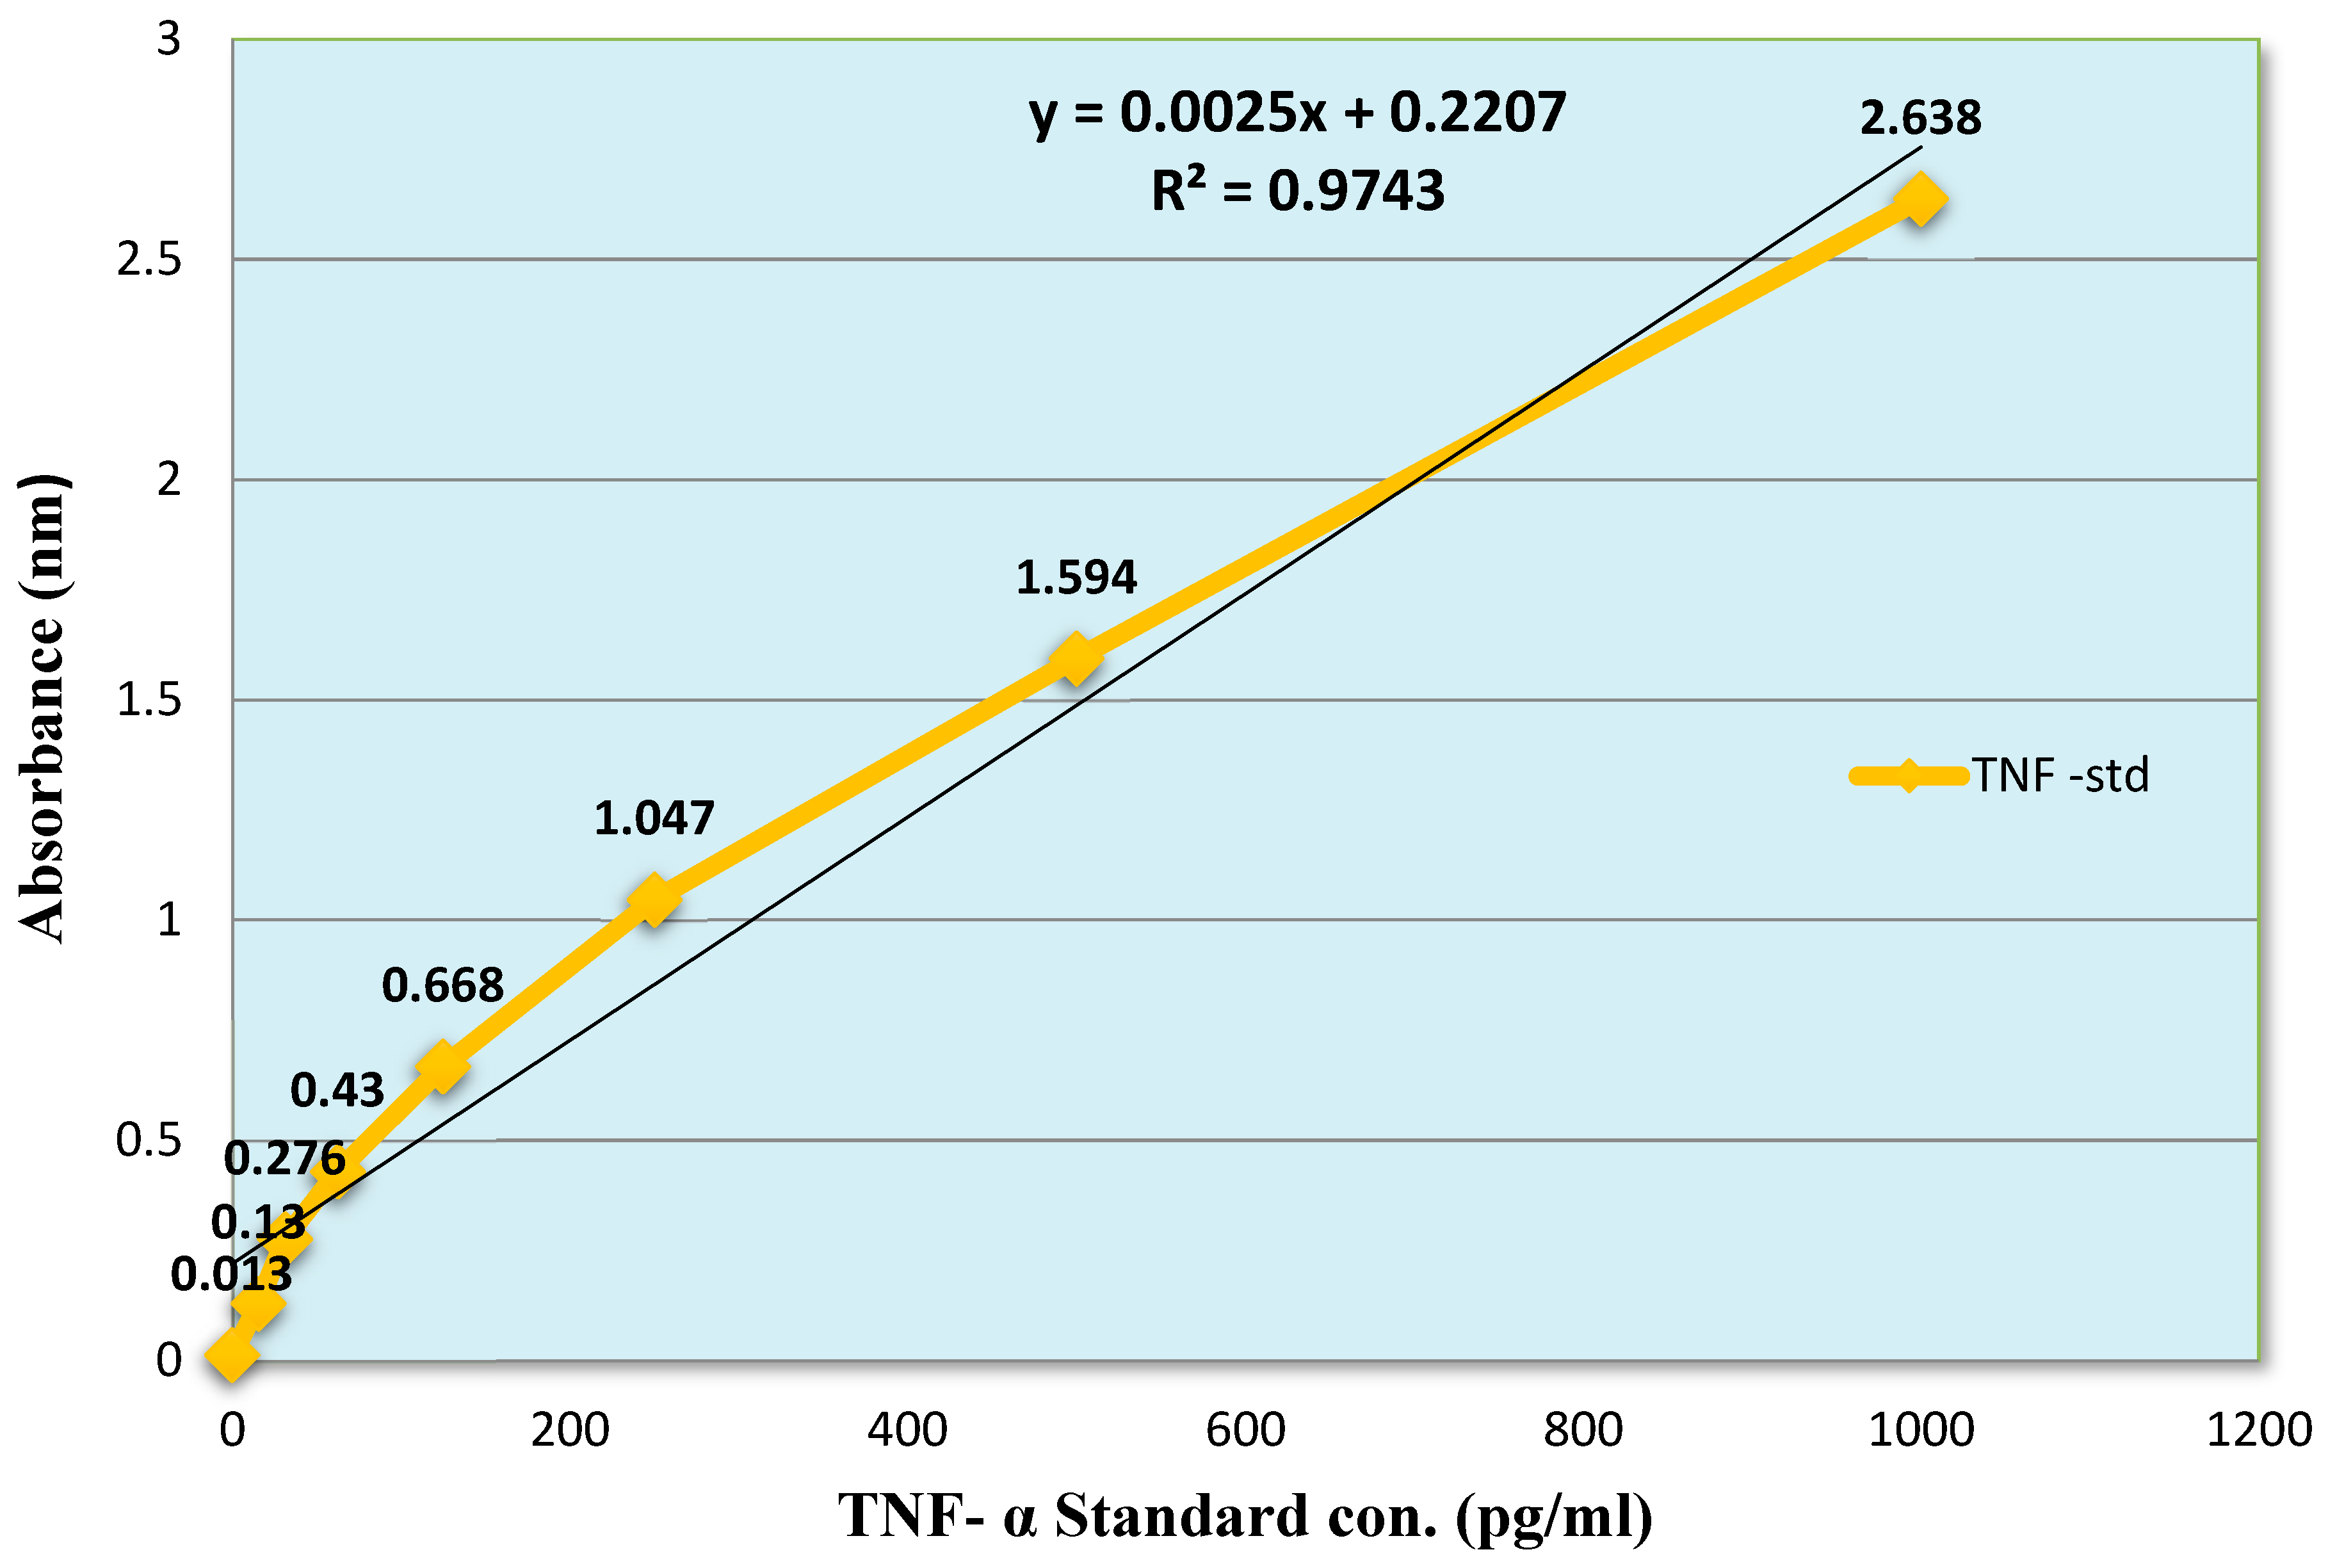
Figure 13.
Standard curve of IL-1β.
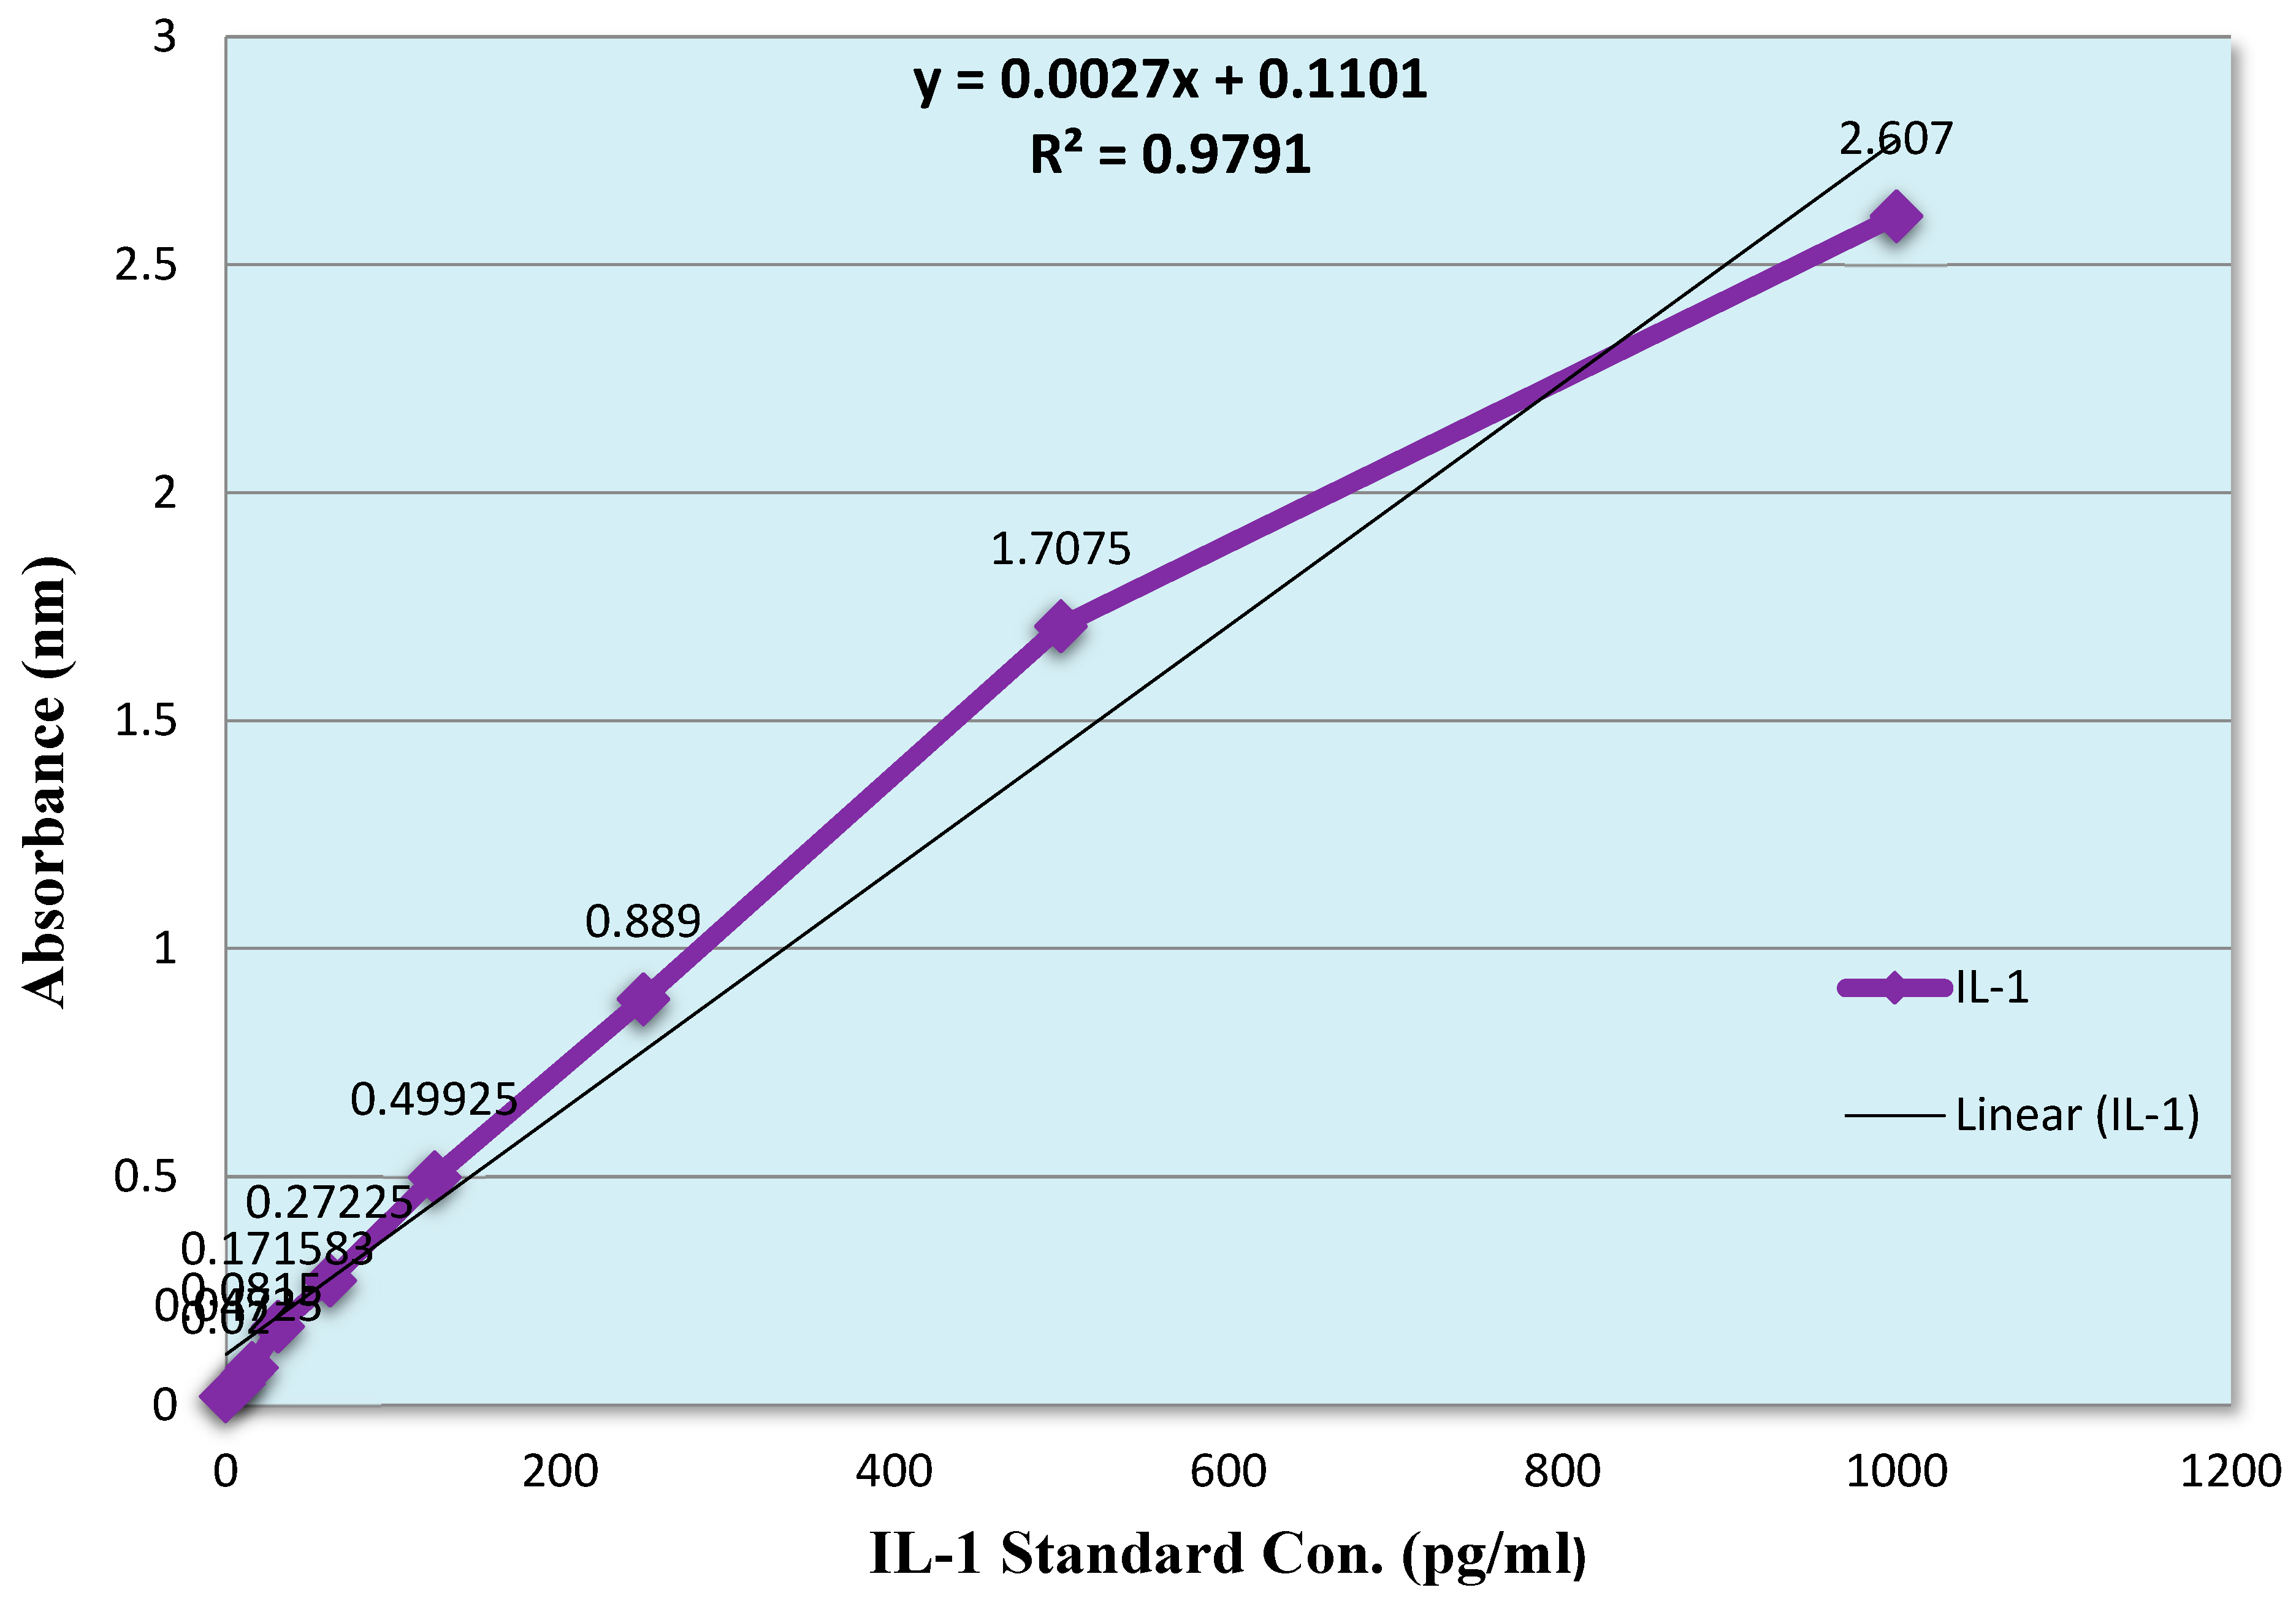
Figure 14.
Effect of Crude Venom, Fraction-1, Fraction-2 and standard drugs on the level of TNF-α by the Carrageenan induced Peritonitis method on mice.
Figure 14.
Effect of Crude Venom, Fraction-1, Fraction-2 and standard drugs on the level of TNF-α by the Carrageenan induced Peritonitis method on mice.
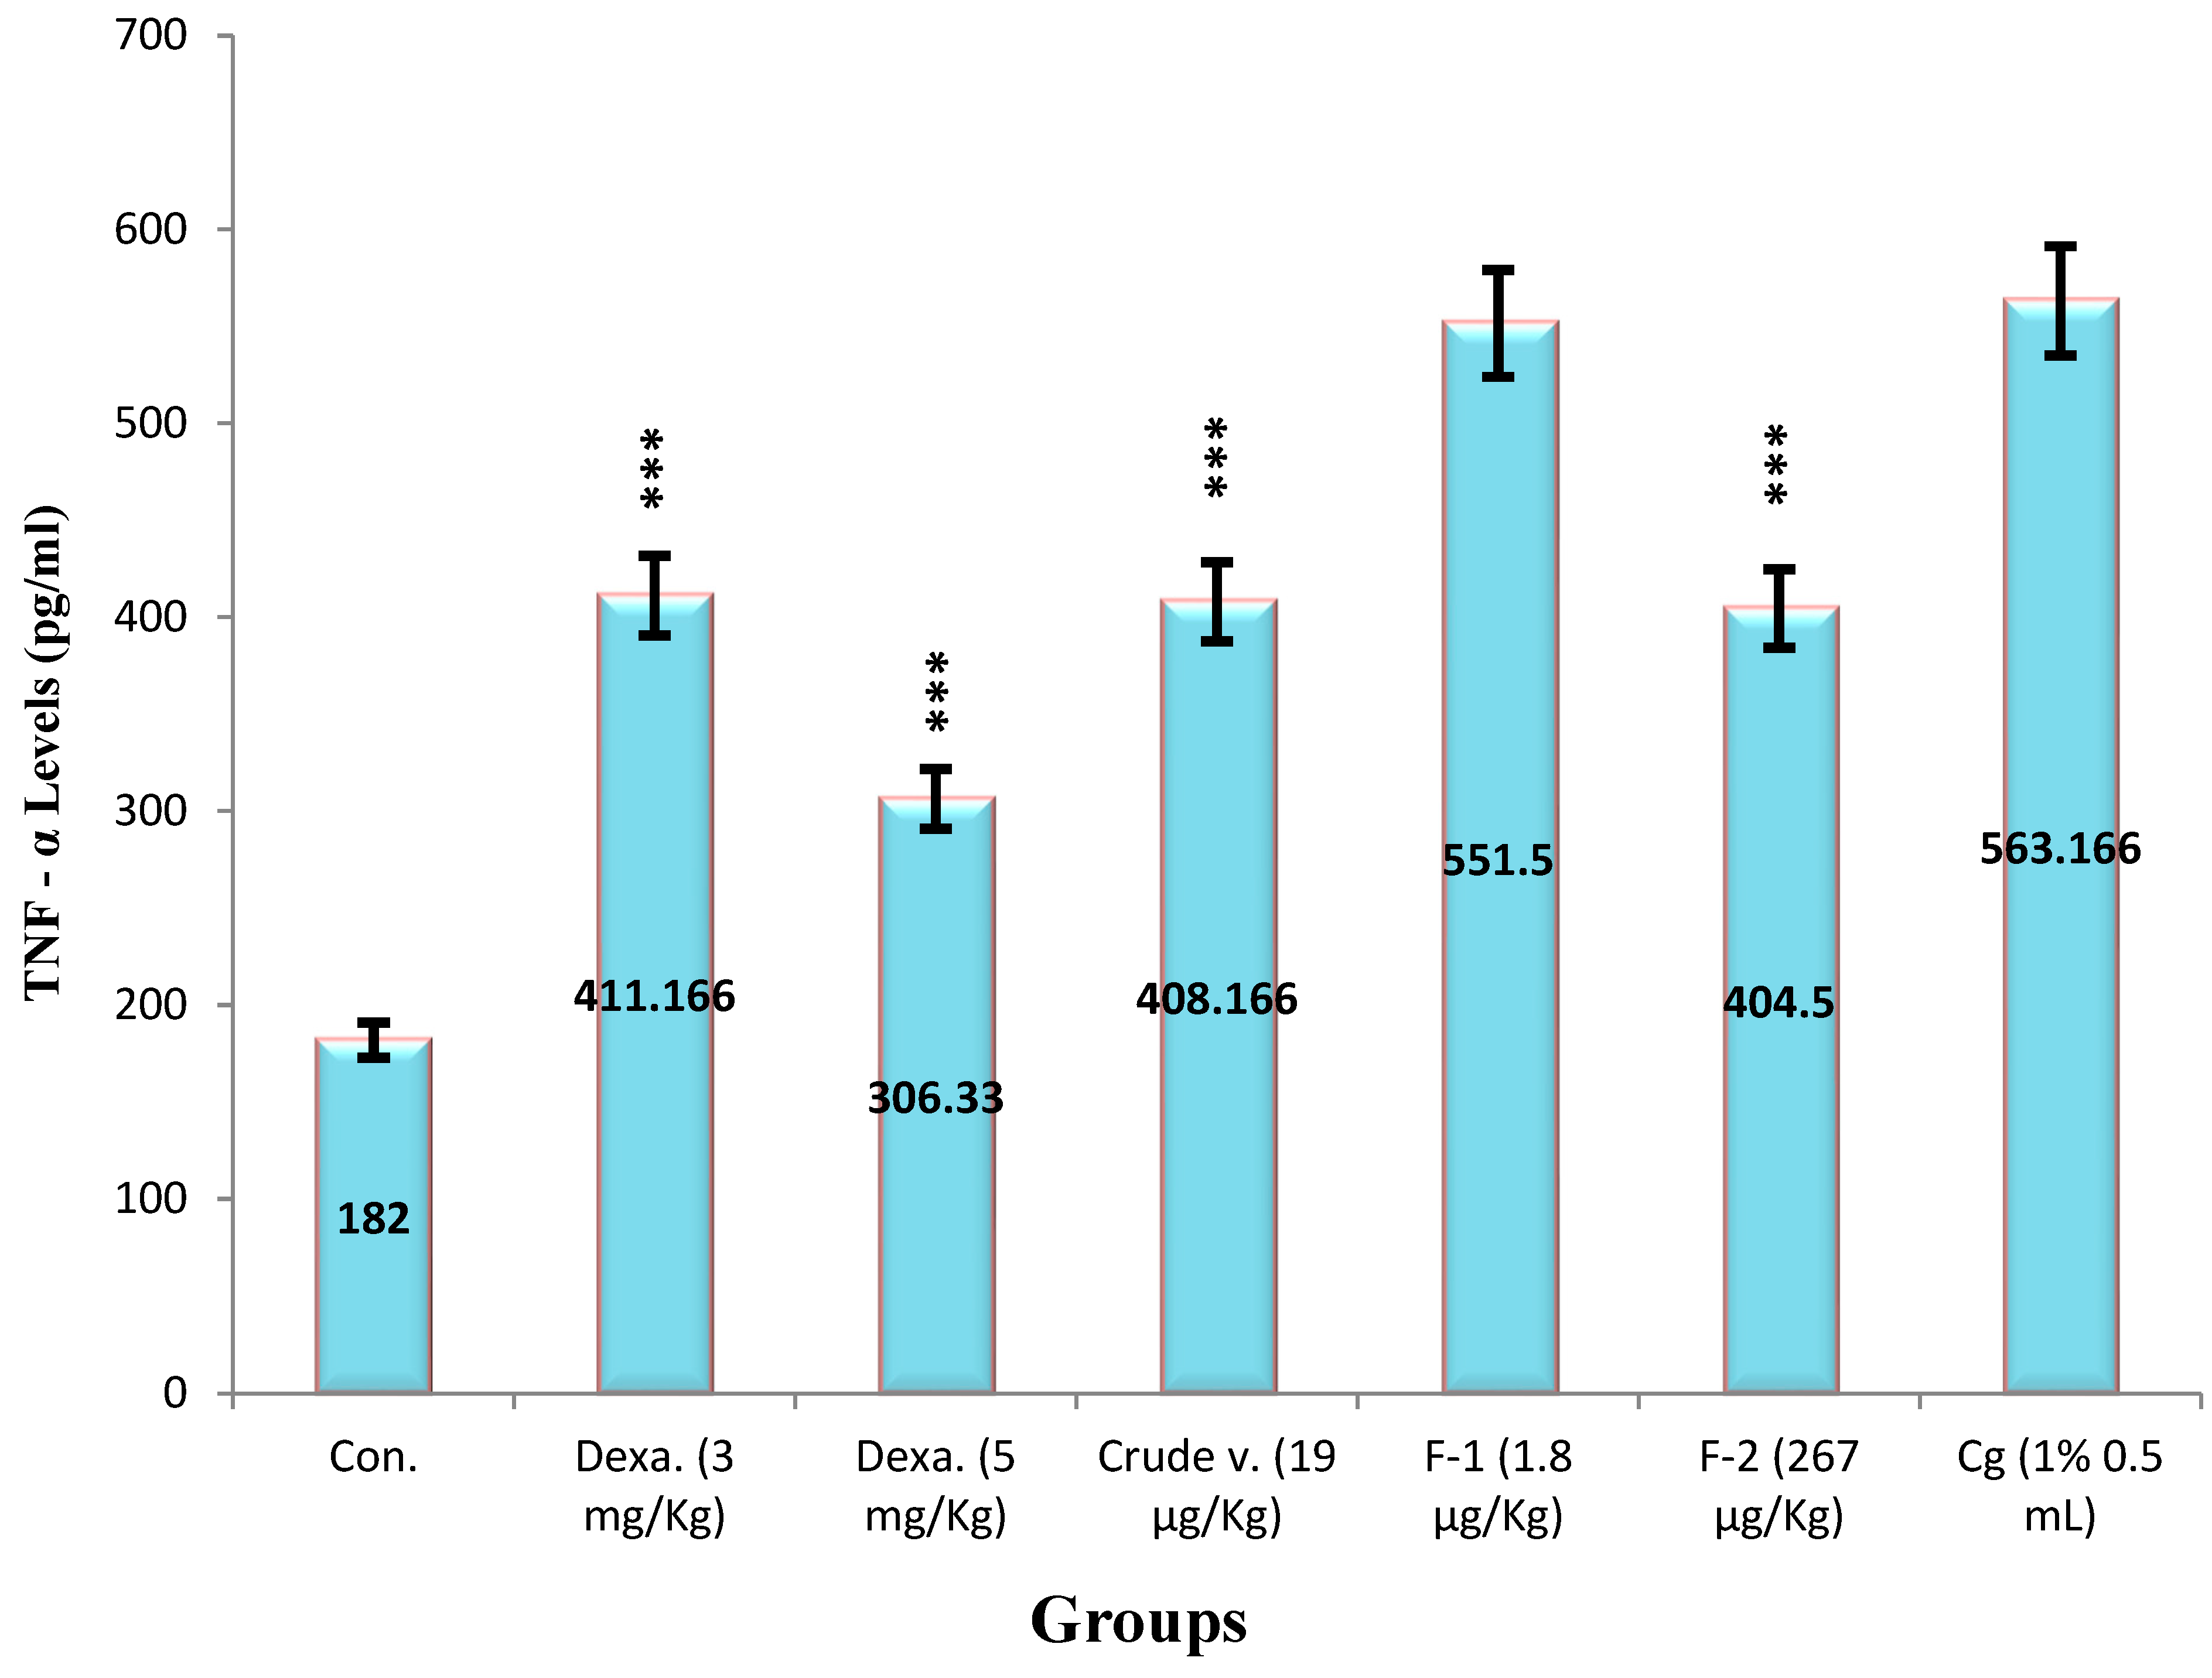
Figure 15.
Effect of Crude Venom, Fraction-1, Fraction-2 and standard drugs on the level of IL-1β by the Carrageenan induced Peritonitis method on mice.
Figure 15.
Effect of Crude Venom, Fraction-1, Fraction-2 and standard drugs on the level of IL-1β by the Carrageenan induced Peritonitis method on mice.
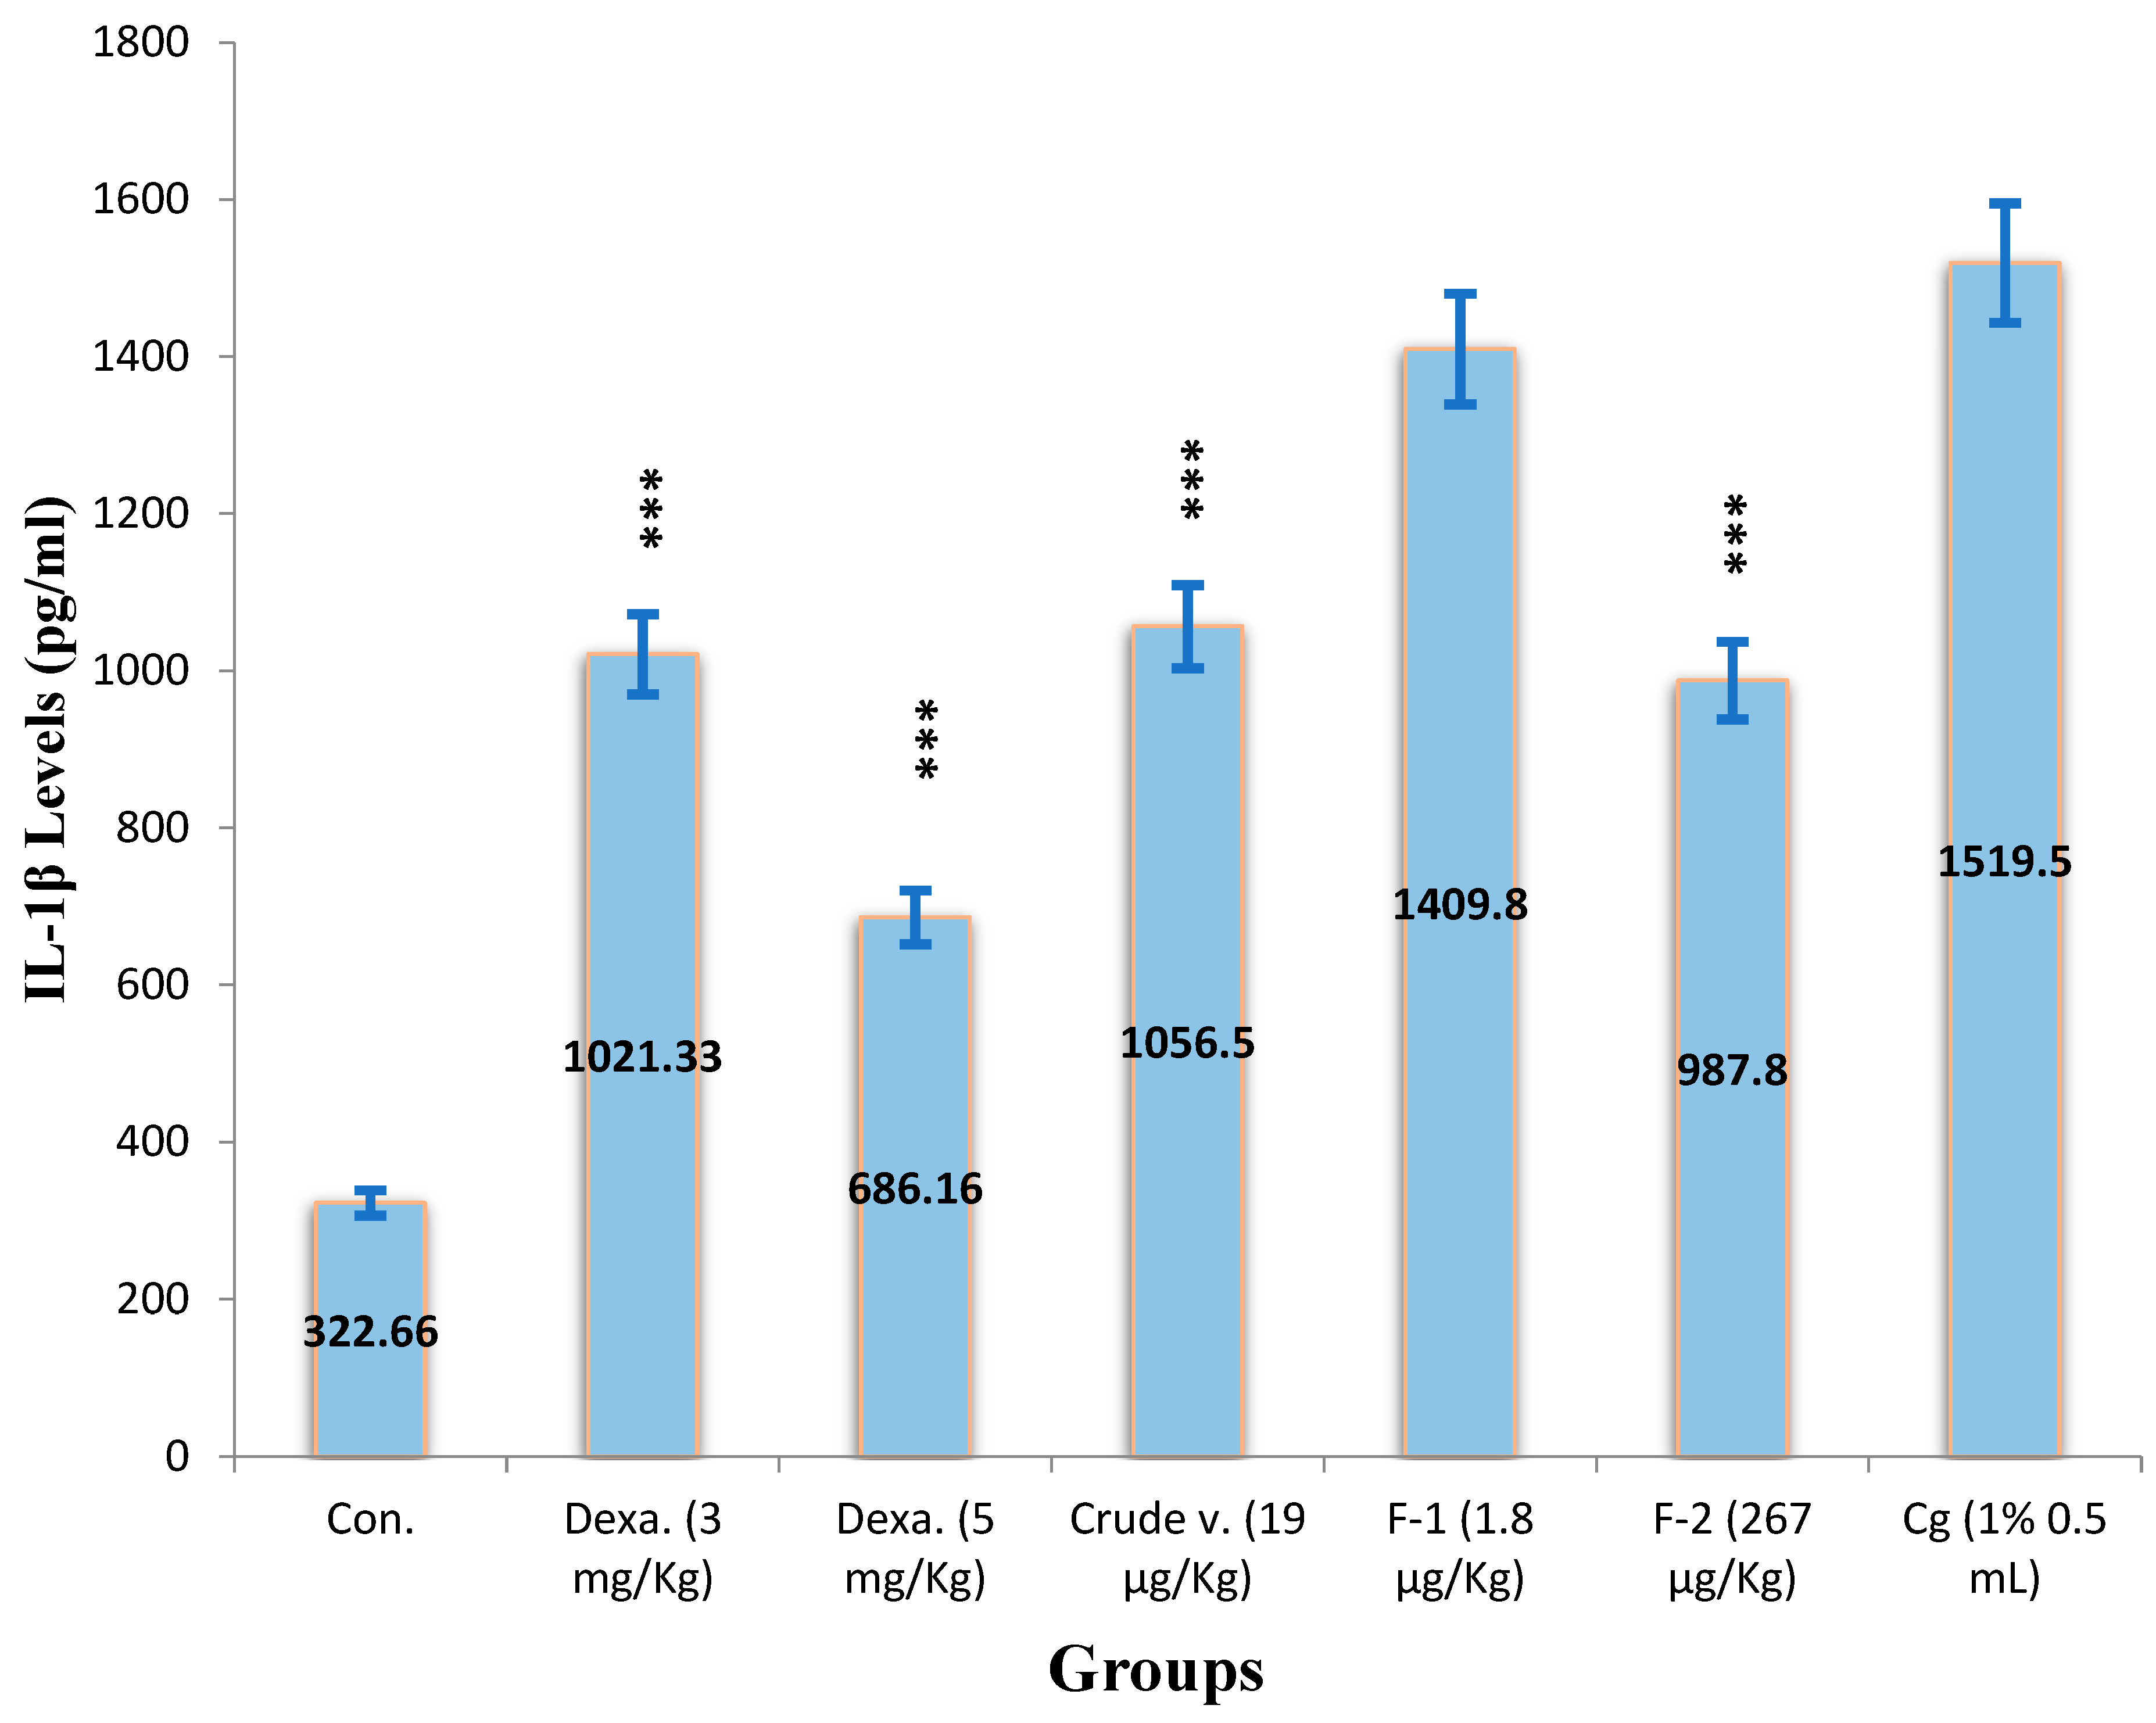
Figure 16.
Venom milking and Aliquots (-20 •C).
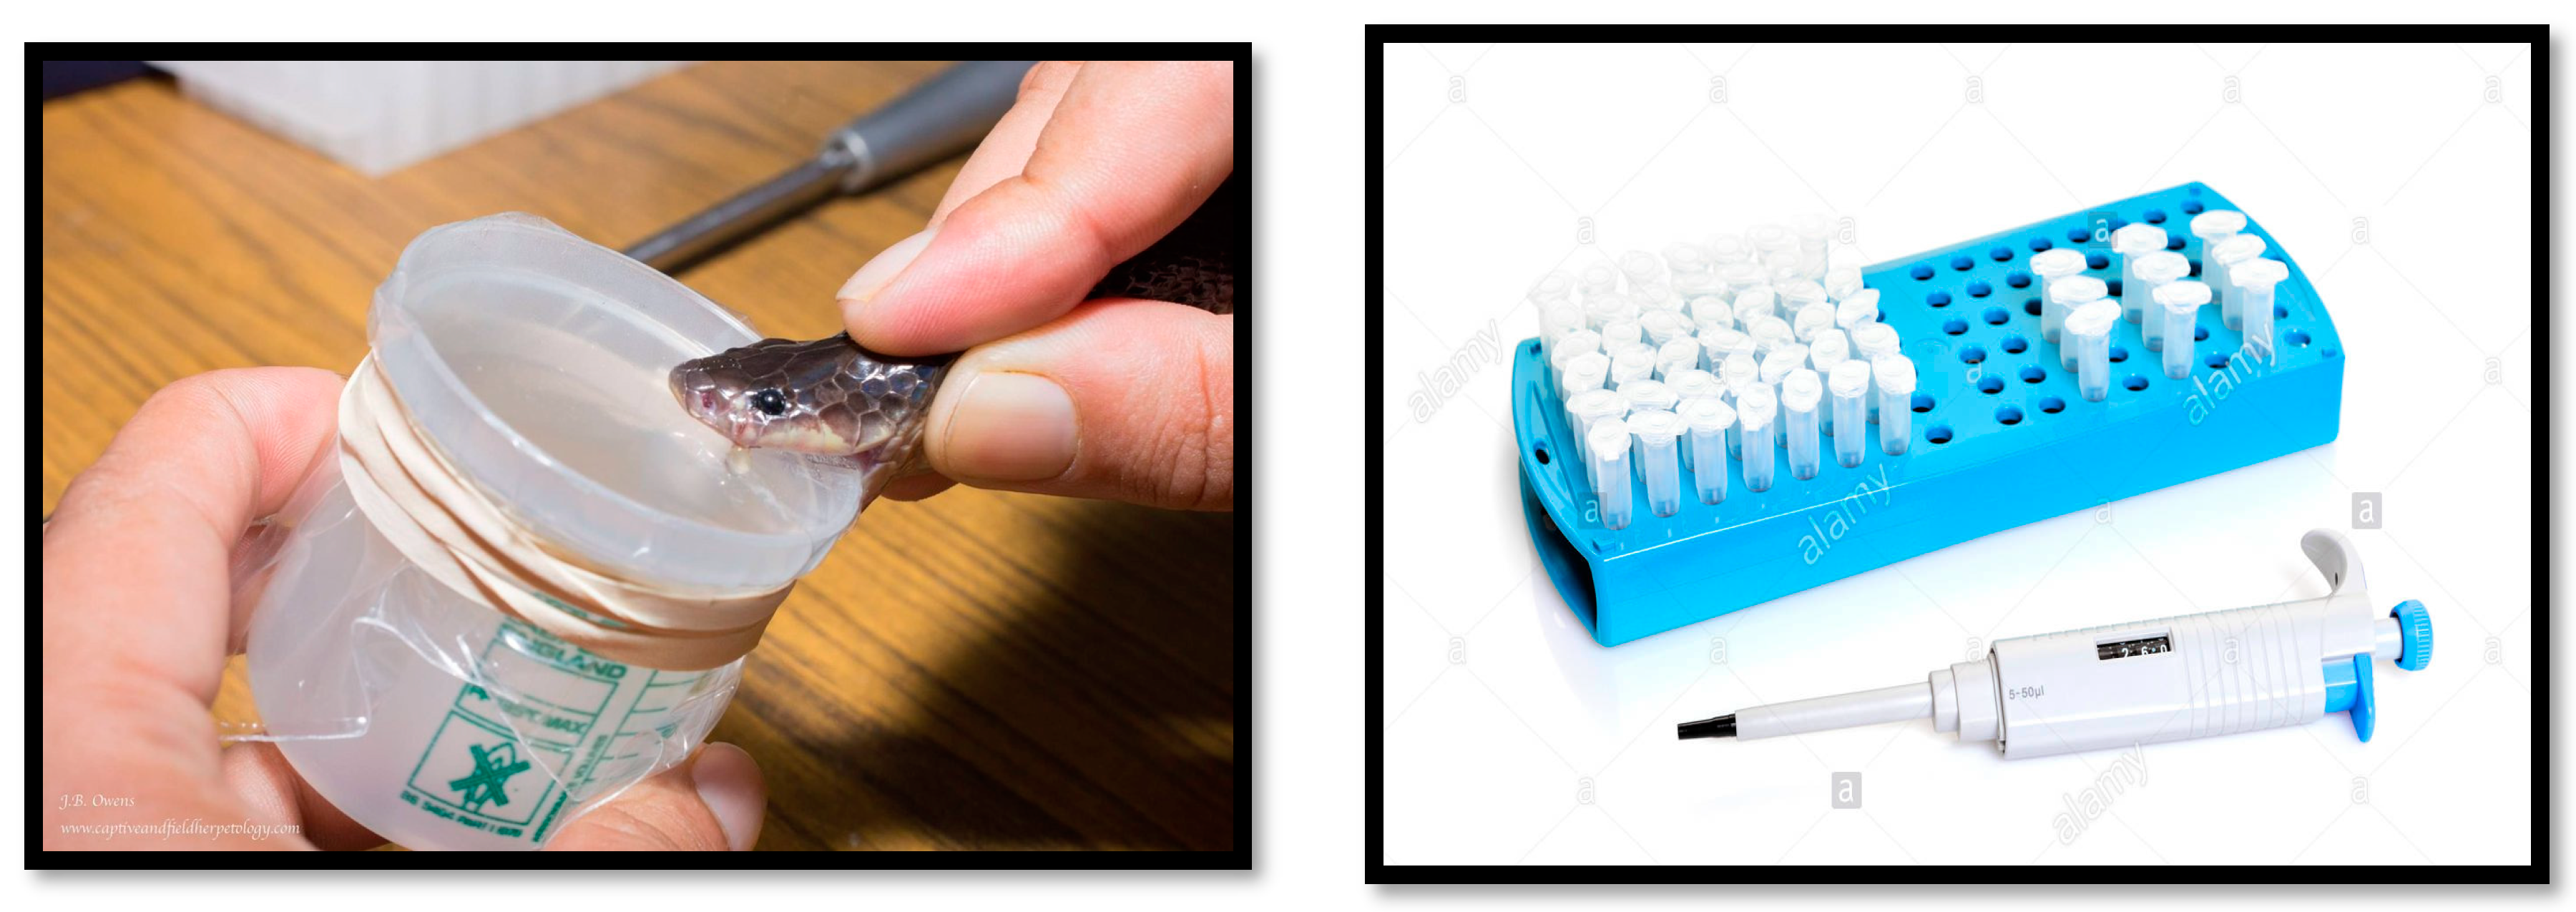
Figure 17.
Determination of Reactive Oxygen Species (ROS).
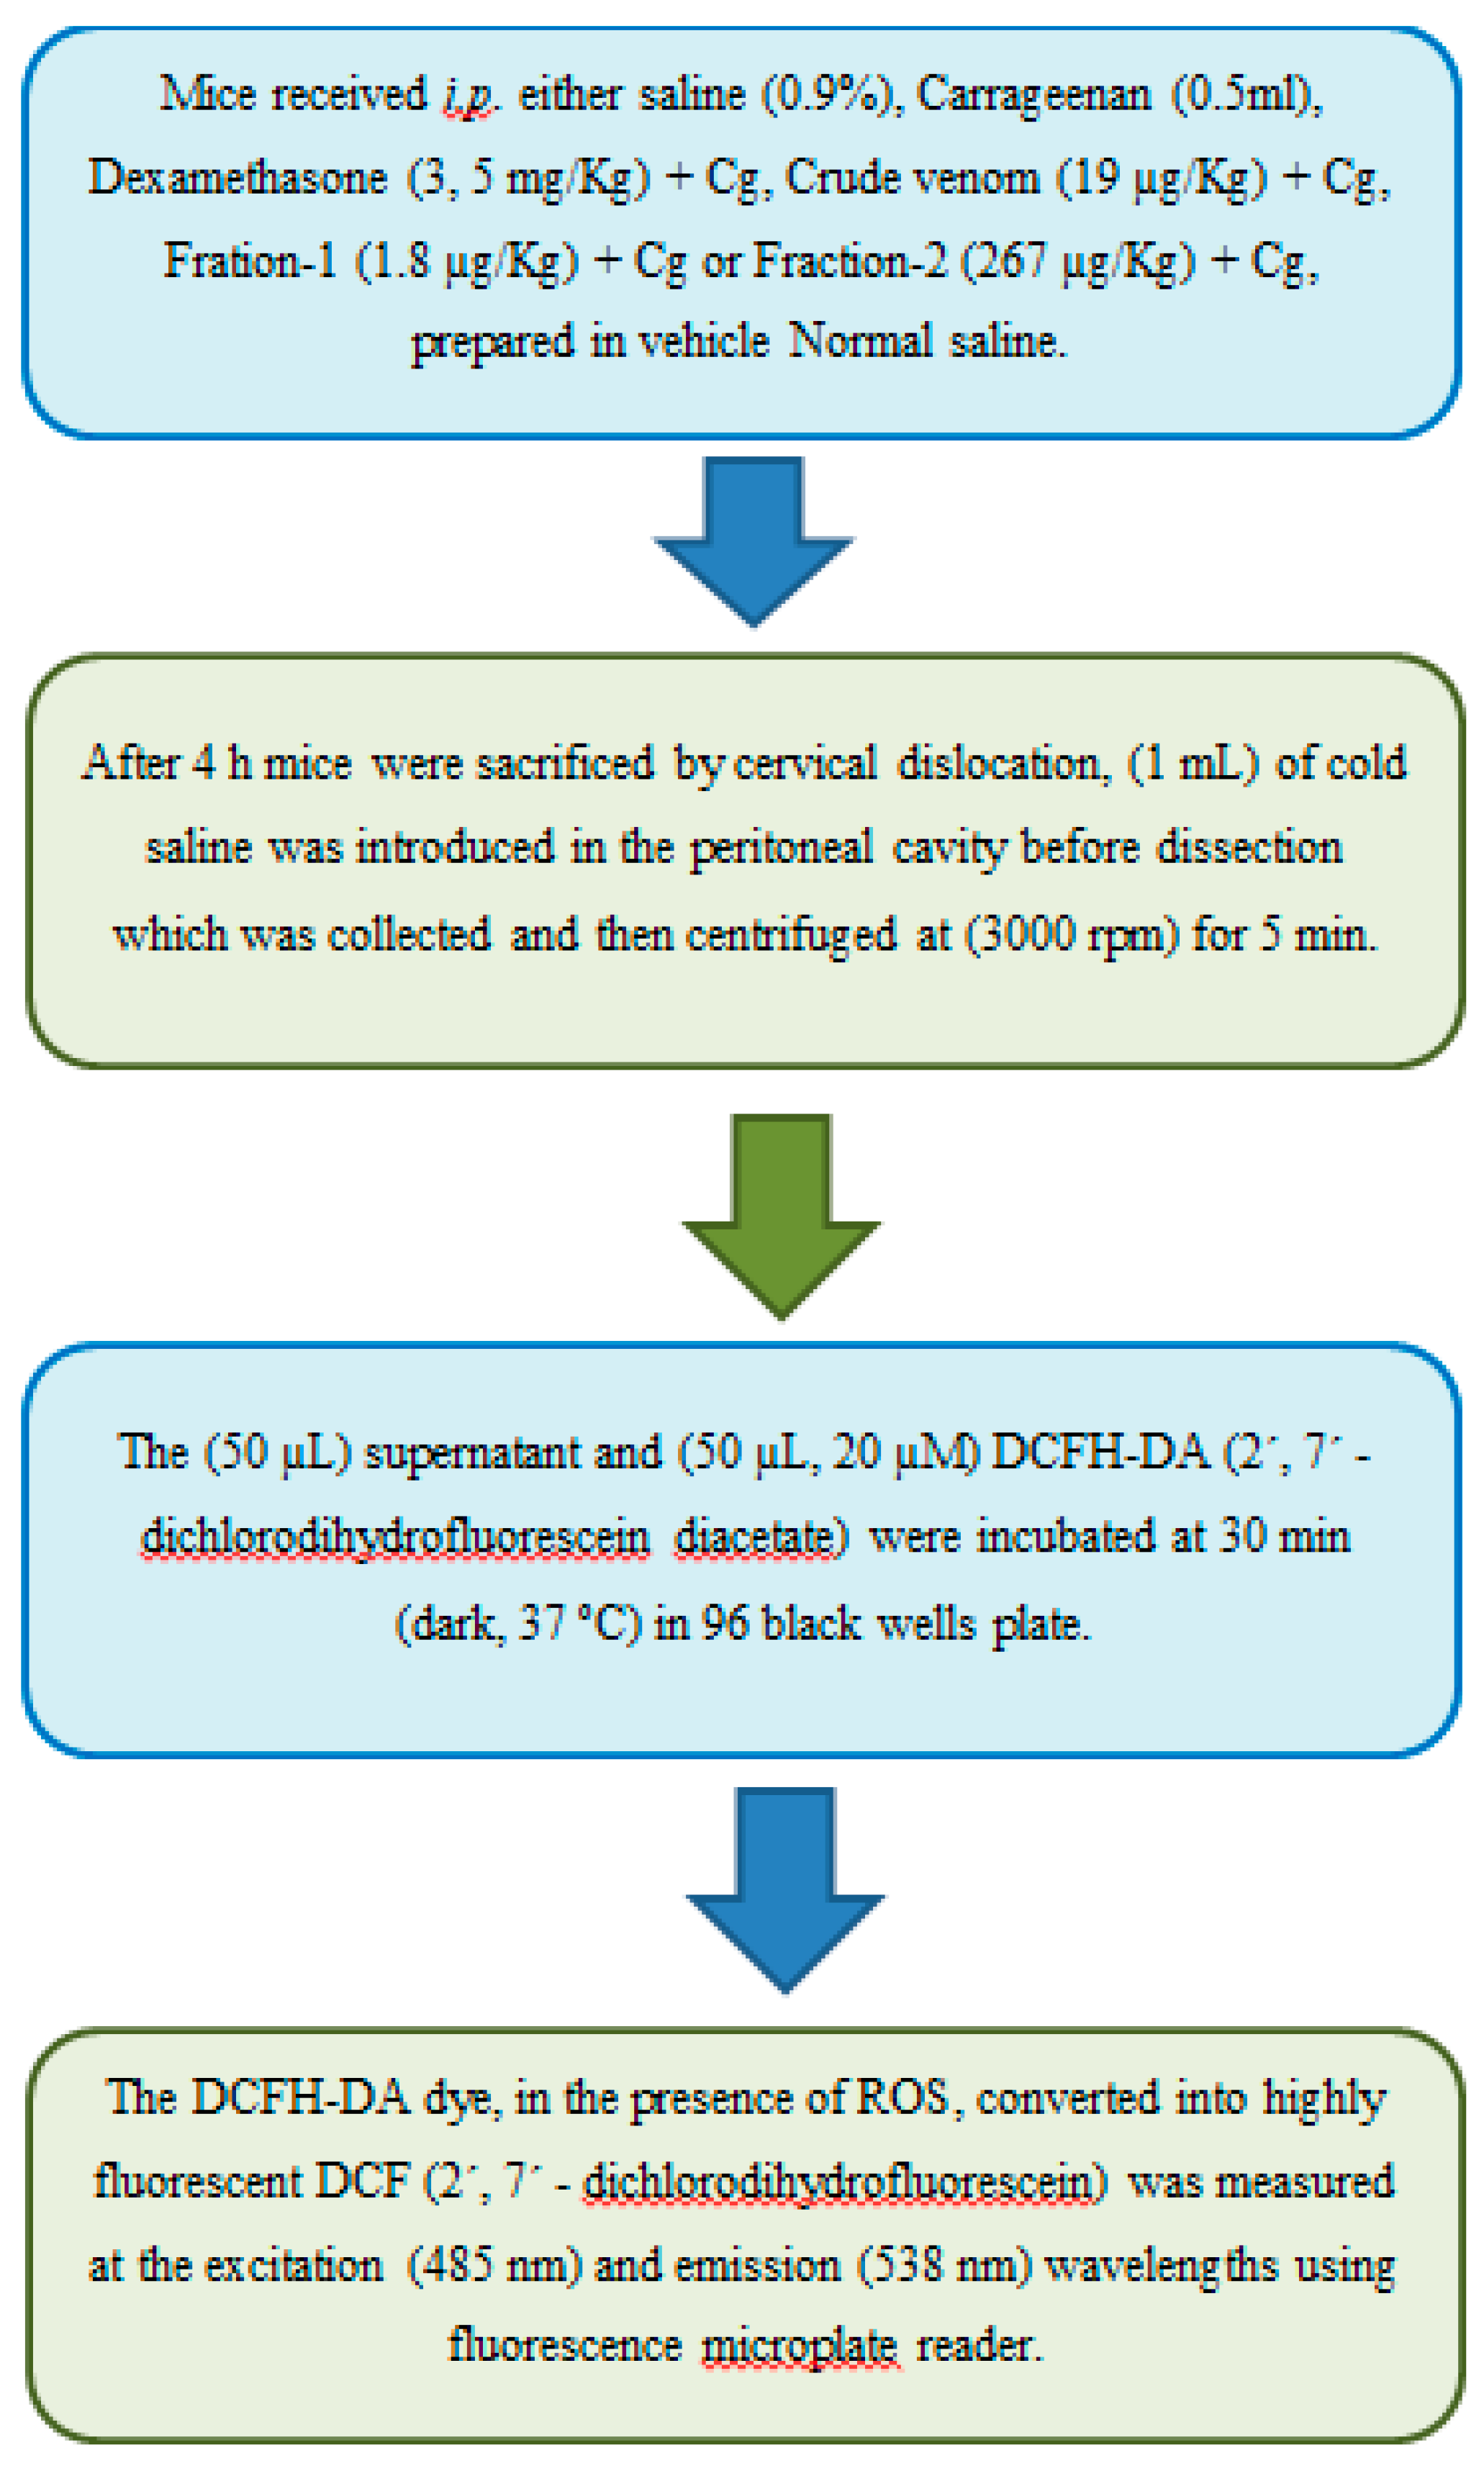
Figure 18.
Determination of Tumor Necrosis Factor-α (TNF-α).
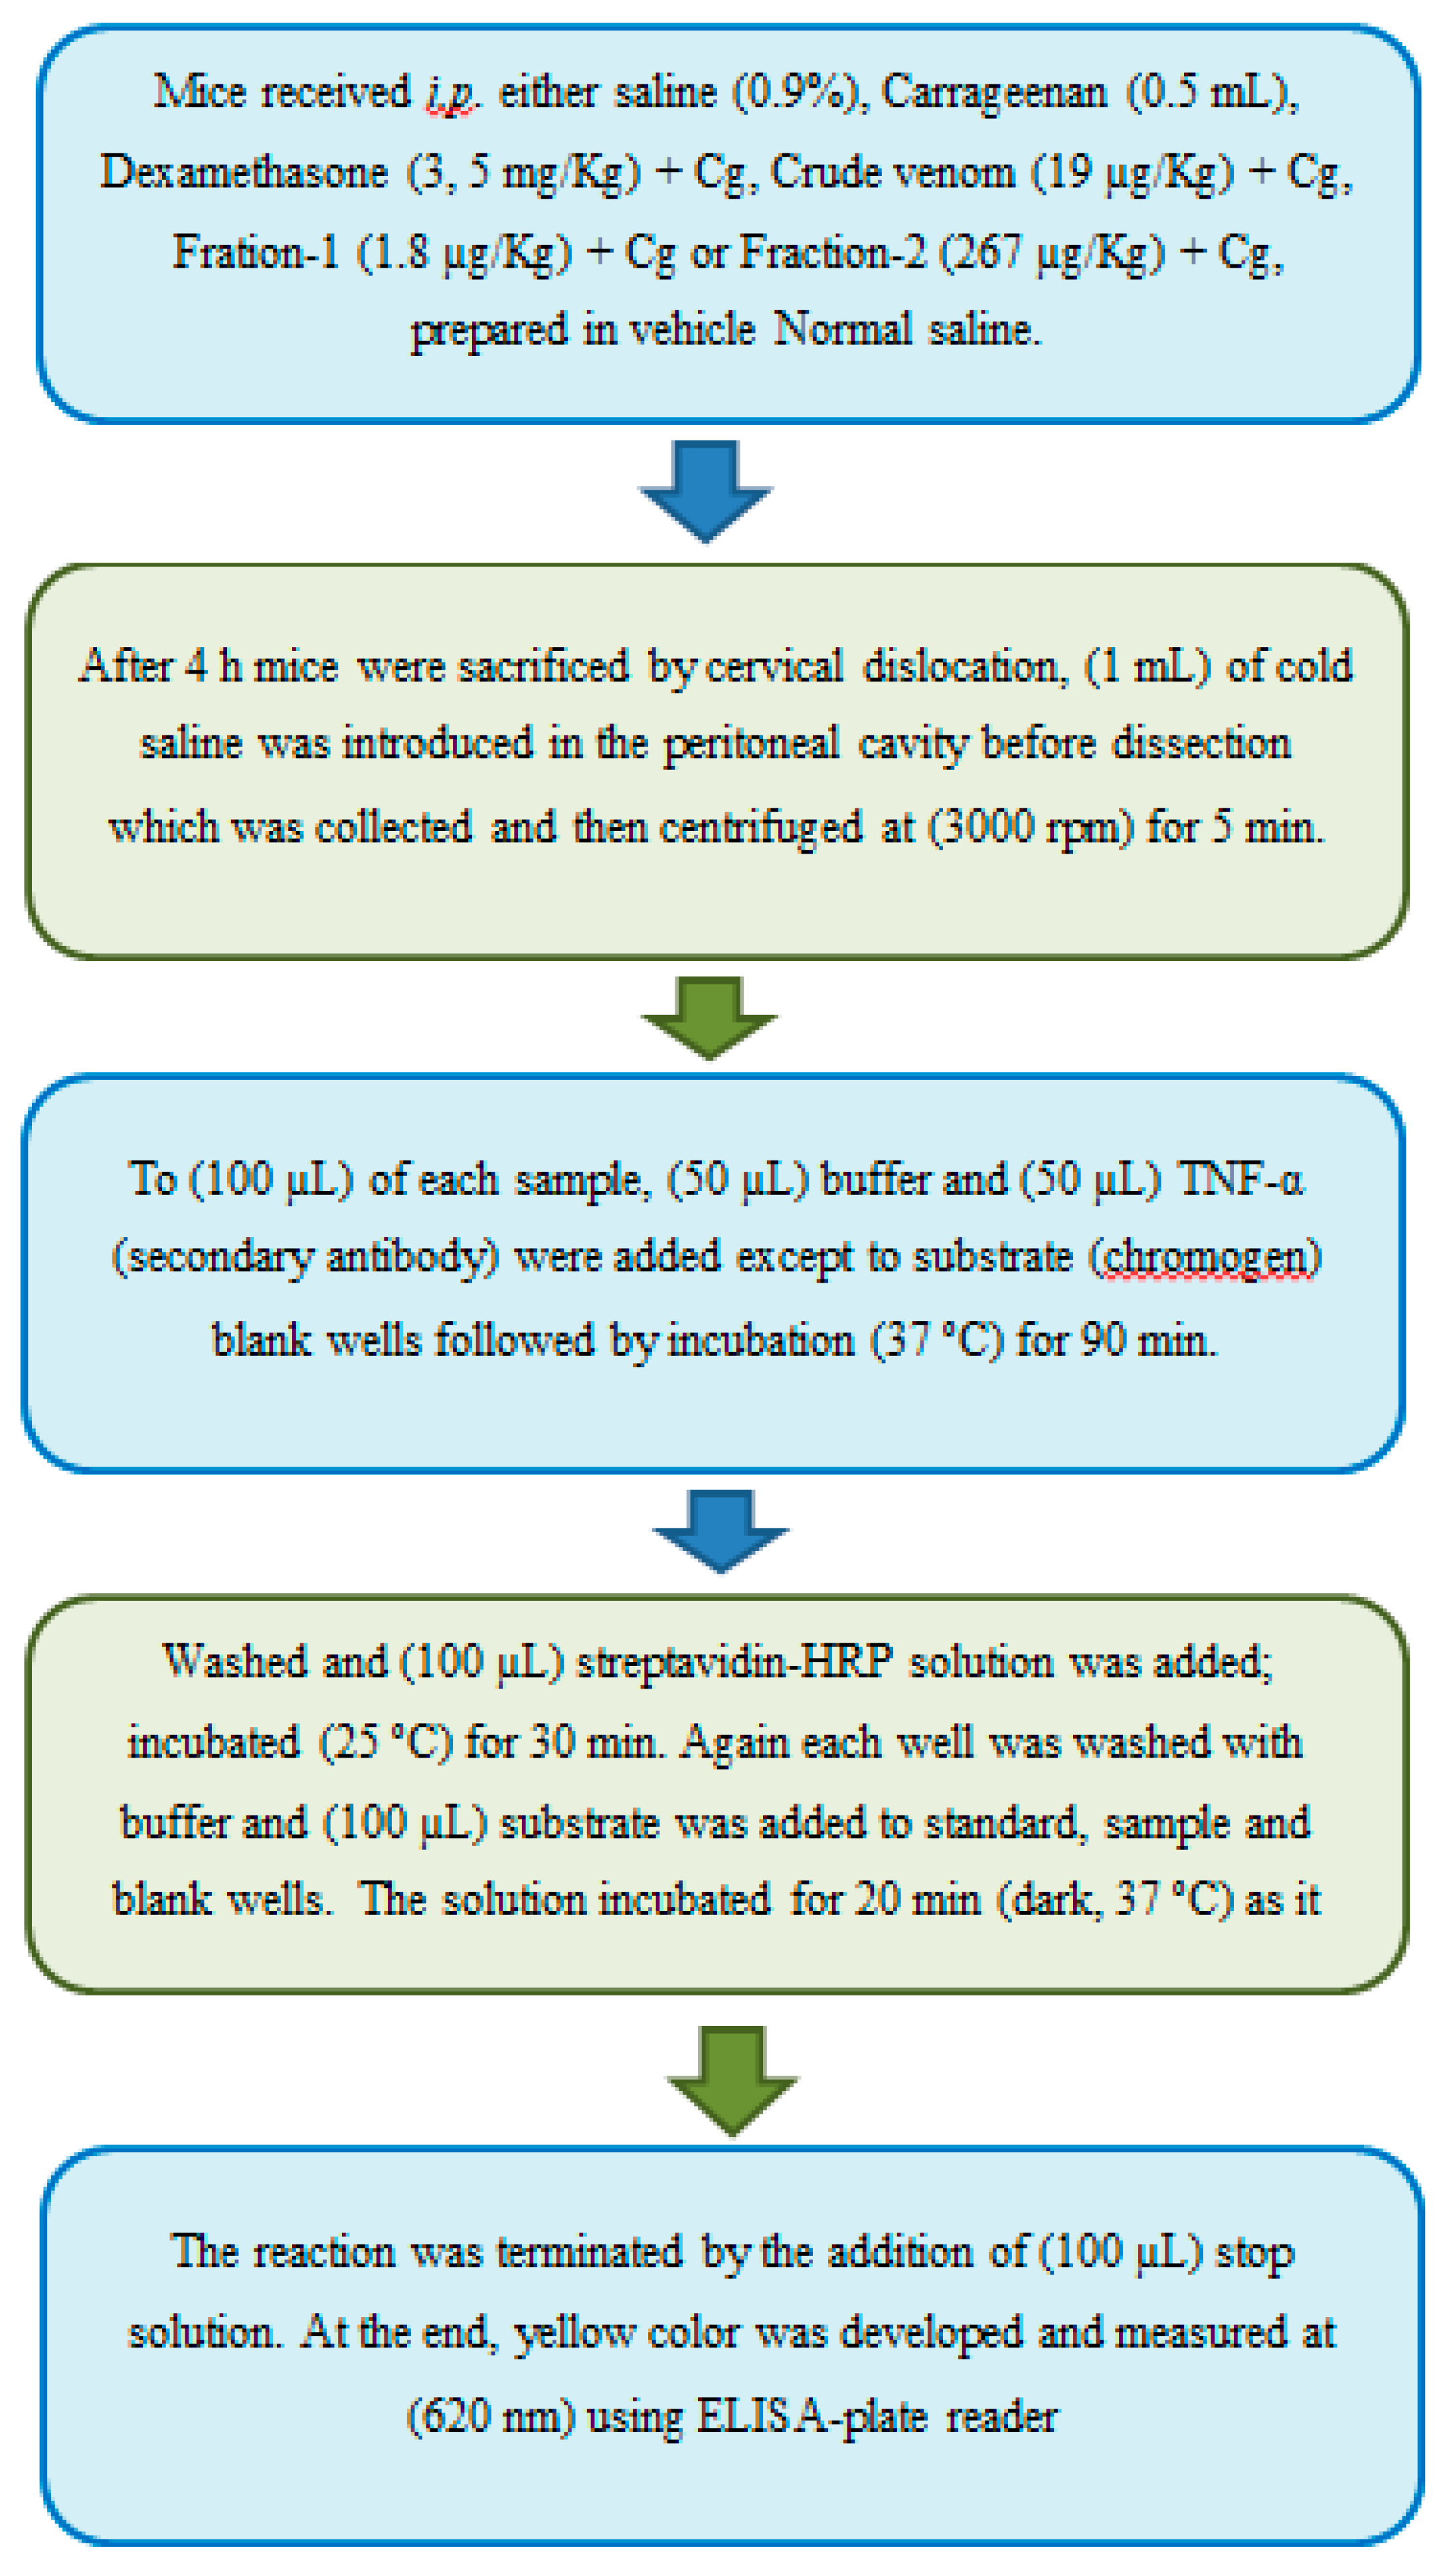
Figure 19.
Determination of Interleukin-1β (IL-1β).
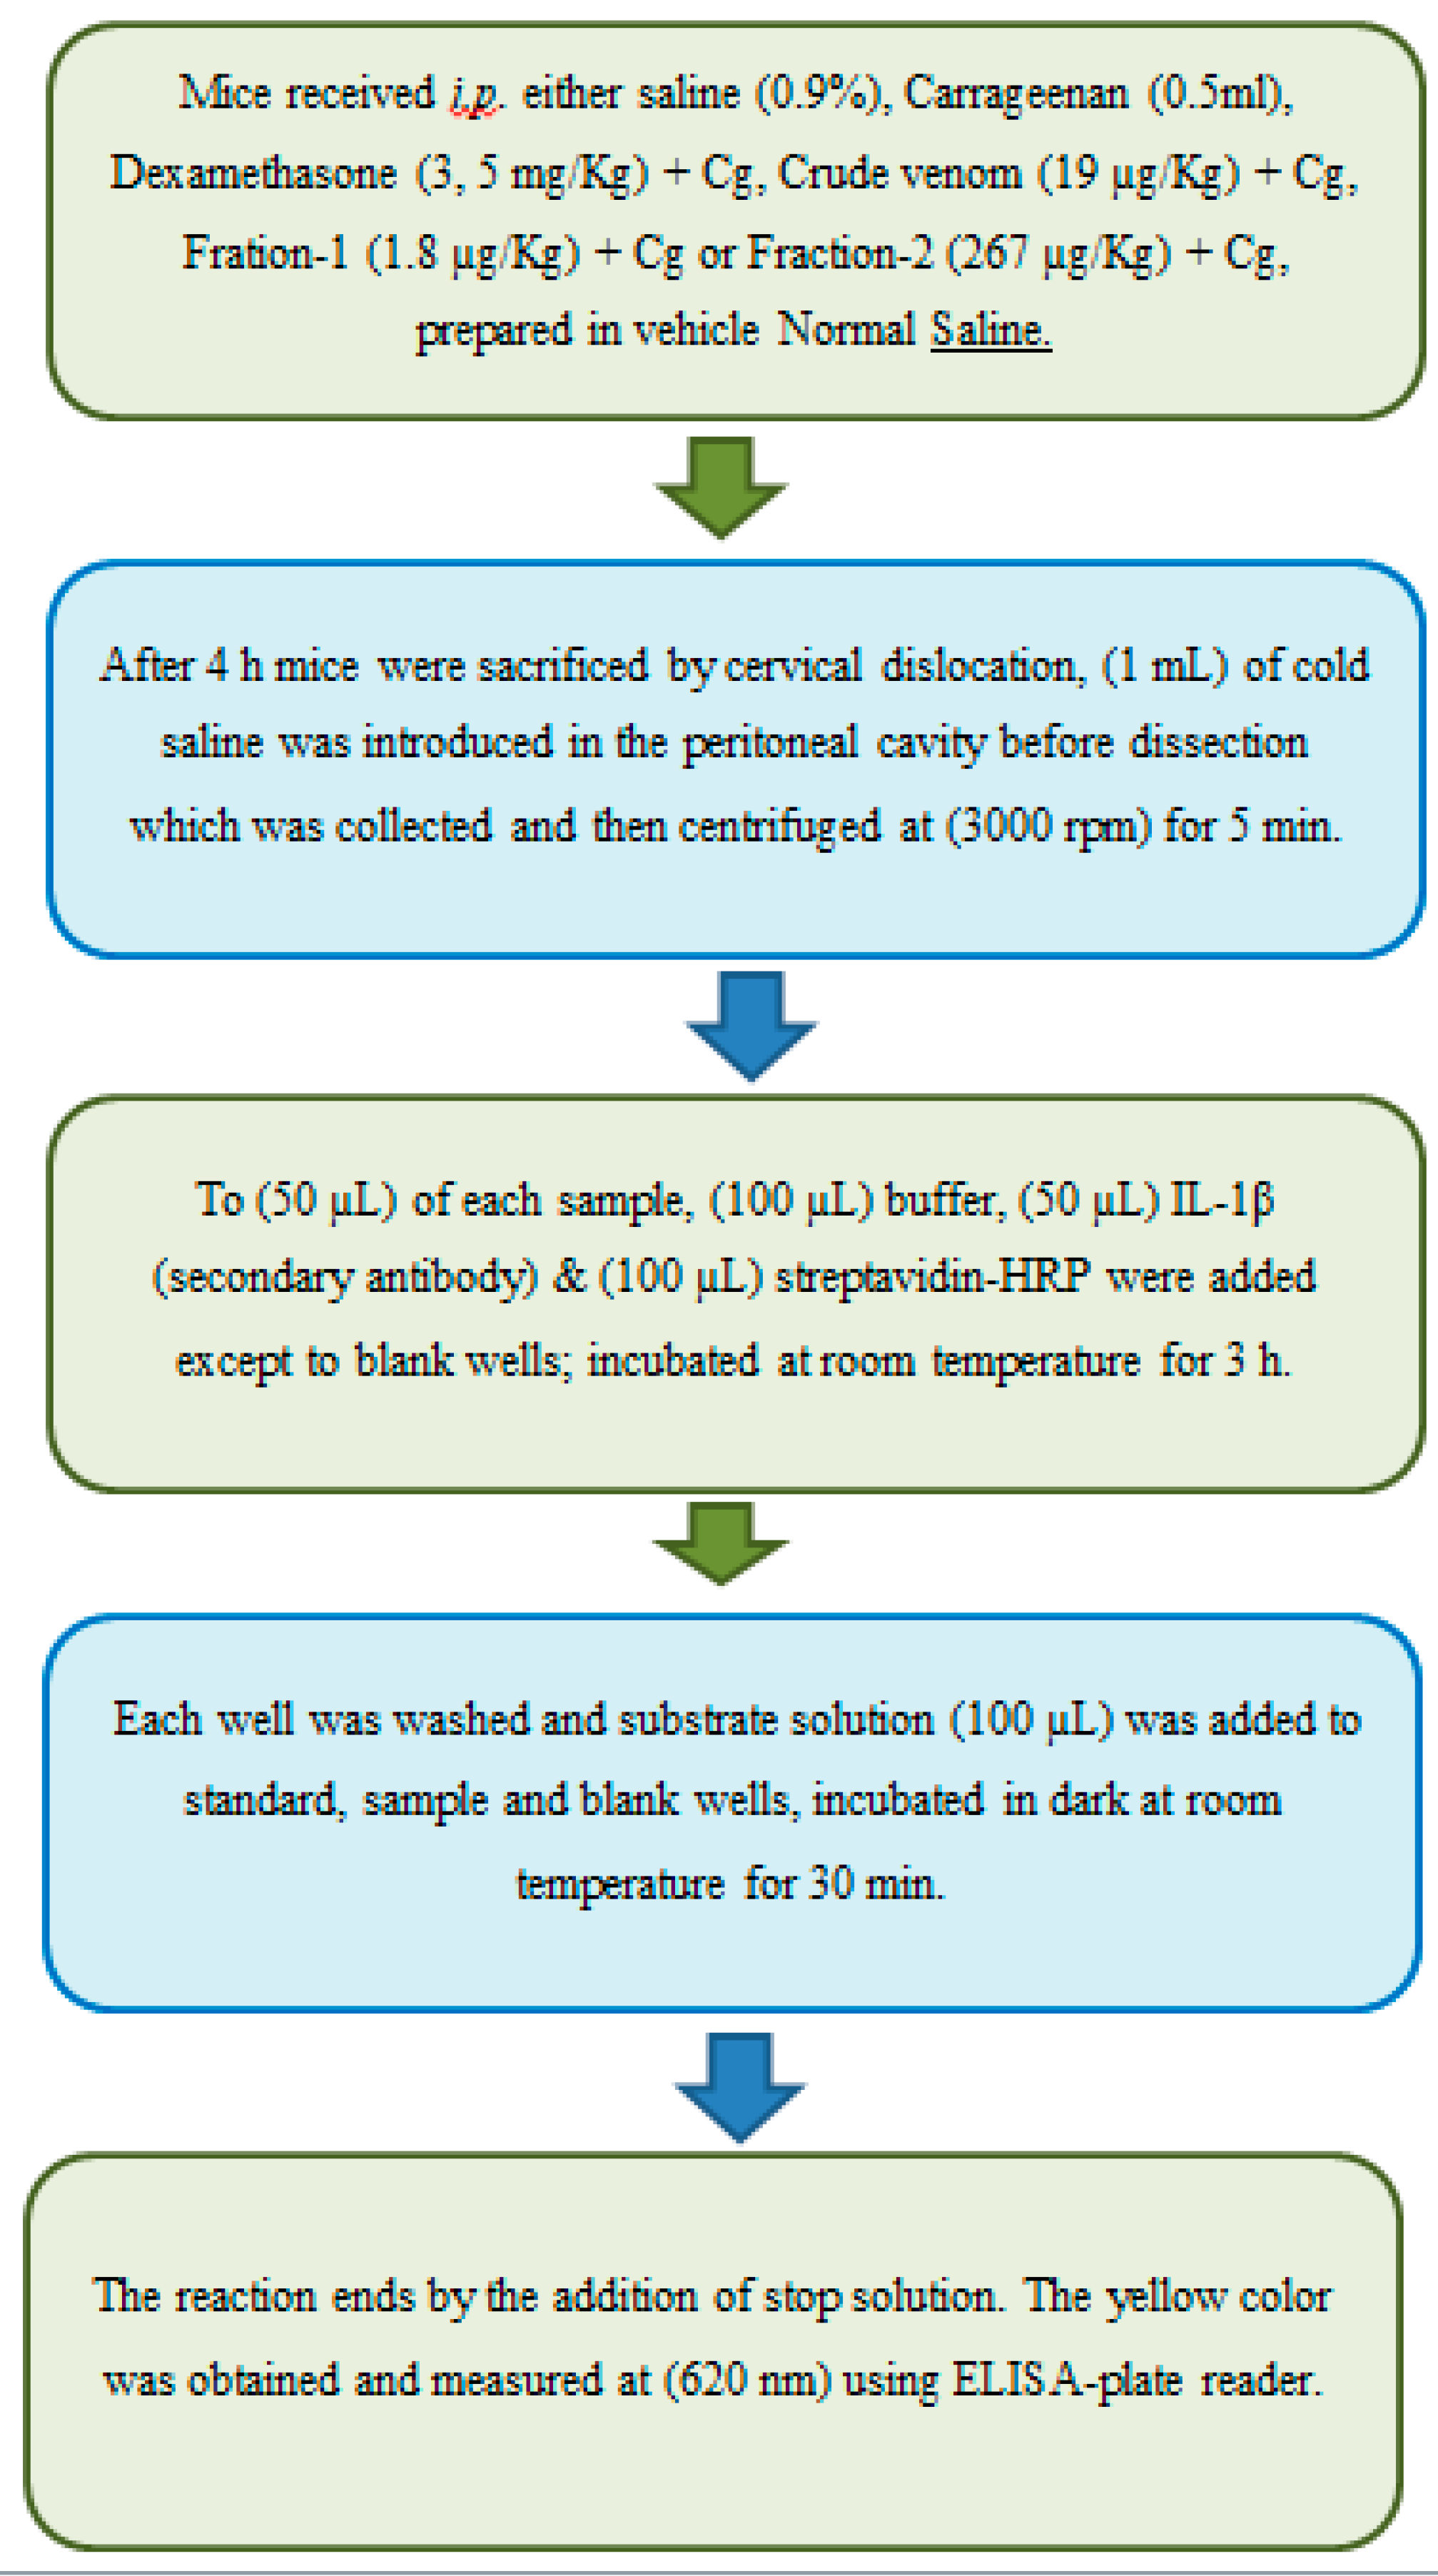

Table 1.
Protein estimation of Crude venom, Fraction-1 and Fraction-2 by Nano drop Method.
| S.NO. | Groups | Protein Concentration in a Sample (mg/mL) |
|---|---|---|
| 1- | Total Pooled Venom | 110 |
| 2- | Crude Venom (Diluted 10x) | 9.8 |
| 3- | Fraction-1 | 90.3 |
| 4- | Fraction-2 | 0.81 |
| 5- | Standard (BSA) | 2 |
Table 2.
Crude Venom LD50 determination by Karber’s Method.
| Groups | Dose (µg/Kg) | Dose difference (a) | No. of animals (n=8) | No. of Death | Mean Mortality (b) | Product (a X b) |
|---|---|---|---|---|---|---|
| 1. | 27 | - | 8 | 1 | - | - |
| 2. | 30 | 3 | 8 | 2 | 1.5 | 4.5 |
| 3. | 33 | 3 | 8 | 3 | 2.5 | 7.5 |
| 4. | 40 | 7 | 8 | 8 | 5.5 | 38.5 |
| 5. | 47 | 7 | 8 | 8 | 8 | 56 |
| 6. | 50 | 3 | 8 | 8 | 8 | 24 |
| 7. | 53 | 3 | 8 | 8 | 8 | 24 |
| ∑= 154.5 |
Table 3.
Fraction-1 LD50 determination by Karber’s Method.
| Groups | Dose (µg/Kg) | Dose difference (a) | No. of animals (n=8) | No. of Death | Mean Mortality (b) | Product (a X b) |
|---|---|---|---|---|---|---|
| 1. | 5 | - | 8 | 2 | - | - |
| 2. | 6 | 1 | 8 | 3 | 2.5 | 2.5 |
| 3. | 7.3 | 1.3 | 8 | 4 | 3.5 | 4.6 |
| 4. | 8.3 | 1 | 8 | 6 | 5 | 5 |
| 5. | 13.2 | 4.9 | 8 | 8 | 7 | 34.3 |
| 6. | 15 | 1.8 | 8 | 8 | 8 | 14.4 |
| 7. | 17 | 2 | 8 | 8 | 8 | 16 |
| 8. | 21 | 4 | 8 | 8 | 8 | 32 |
| 9. | 30 | 9 | 8 | 8 | 8 | 72 |
| ∑= 180.8 |
Table 4.
Fraction-2 LD50 determination by Karber’s Method.
| Groups | Dose (µg/Kg) | Dose difference (a) | No. of animals (n=8) | No. of Death | Mean Mortality (b) | Product (a X b) |
|---|---|---|---|---|---|---|
| 1. | 333 | - | 8 | 4 | - | - |
| 2. | 500 | 167 | 8 | 6 | 5 | 835 |
| 3. | 667 | 167 | 8 | 8 | 7 | 1169 |
| 4. | 1000 | 333 | 8 | 8 | 8 | 2664 |
| 5. | 1333 | 333 | 8 | 8 | 8 | 2664 |
| 6. | 1667 | 334 | 8 | 8 | 8 | 2672 |
| 7. | 2000 | 333 | 8 | 8 | 8 | 2664 |
| 8. | 2666 | 666 | 8 | 8 | 8 | 5328 |
| ∑= 17996 |
Table 5.
Effect of Crude venom and it’s Fraction on mice during acute toxicity study.
| S.No# | Groups | Body weight (gm.) (n=5) | Dose (ug/kg) | Mortality (n = 5) |
|---|---|---|---|---|
| 1. | Crude Venom | 23.5 ± 0.5 | 27 | 1/5 |
| 24.3 ± 0.5 | 25.5 | 0/5 | ||
| 25.5 ± 0.4 | 19 | 0/5 | ||
| 2. | Fraction-1 | 22 ± 0.6 | 9.5 | 0/5 |
| 25.7 ± 0.6 | 8.3 | 3/5 | ||
| 26.6 ± 0.7 | 6 | 2/5 | ||
| 28.4 ± 0.3 | 5 | 1/5 | ||
| 27.6 ± 0.2 | 3.7 | 0/5 | ||
| 3. | Fraction-2 | 24.5 ± 0.6 | 500 | 3/5 |
| 22.5 ± 0.5 | 333 | 1/5 | ||
| 24.5 ± 0.5 | 267 | 0/5 | ||
| 25.2 ± 0.5 | 200 | 0/5 | ||
| 4. | Control | 25 ± 0.6 | 0.1mL N/S | 0/5 |
Table 6.
Hematological evaluation for Acute Toxicity of crude venom and its fractions on mice samples.
Table 6.
Hematological evaluation for Acute Toxicity of crude venom and its fractions on mice samples.
| CBC Profile | |||||
|---|---|---|---|---|---|
| S.NO | Groups | Hb (g/dl) | RBC (10e12/L) | WBC (10e9/L) | PLT (10e9L) |
| 1. | Crude (27 µg/kg) | 13.2 ± 0.38*** | 8.2 ± 0.35** | 3.2 ± 0.38ns | 486.3 ± 3.17ns |
| 2. | Fraction-1 (5 µg/kg) | 21.1 ± 0.43*** | 13.3 ± 0.32*** | 15.1 ± 0.17*** | 600 ± 3.46** |
| 3. | Fraction-2 (333 µg/kg) | 13.1 ± 0.31*** | 8.7 ± 0.17** | 11.6 ± 0.34*** | 654.7 ± 22.6*** |
| 4. | Control | 7.8 ± 0.37 | 5.2 ± 0.63 | 3.7 ± 0.32 | 507 ± 6.35 |
Table 7.
Biochemical evaluation for Acute Toxicity of crude venom and its fractions on mice samples.
Table 7.
Biochemical evaluation for Acute Toxicity of crude venom and its fractions on mice samples.
| Biochemical Parameters | |||||
|---|---|---|---|---|---|
| S.NO | Groups | AST (U/L) | ALT (U/L) | Cr. (mg/dl/l) | BUN (mg/dl) |
| 1. | Crude (27ug/kg) | 640.7 ± 2.6*** | 46 ± 1.7ns | 0.45 ± 0.03ns | 9.4 ± 0.17ns |
| 2. | Fraction-1 (5ug/kg) | 762.7 ± 2.3*** | 83 ± 1.1*** | 0.51 ± 0.03* | 15.4 ± 0.32*** |
| 3. | Fraction-2 (333ug/kg) | 462 ± 3.9*** | 68.7 ± 1.4*** | 0.47 ± 0.02ns | 14.4 ± 0.12*** |
| 4. | Control | 387.6 ± 7.5 | 52.7 ± 2.6 | 0.38 ± 0.01 | 9.1 ± 0.11 |
Table 8.
Effect of Crude venom and it’s Fraction on mice during Sub-acute toxicity study.
| S.No# | Groups | Body weight (gm.) | Dose (ug/kg) | Mortality (n = 5) |
|---|---|---|---|---|
| 1. | Crude Venom | 24.3 ± 0.5 | 25.5 | 3/5 |
| 25.5 ± 0.6 | 19 | 0/5 | ||
| 22 ± 0.5 | 9.5 | 0/5 | ||
| 2. | Fraction-1 | 28.4 ± 0.4 | 5 | 4/5 |
| 27.6 ± 0.3 | 3.7 | 3/5 | ||
| 26.9 ± 0.2 | 1.8 | 0/5 | ||
| 3. | Fraction-2 | 22.5 ± 0.9 | 333 | 3/5 |
| 24.5 ± 0.5 | 267 | 0/5 | ||
| 25.2 ± 0.6 | 200 | 0/5 | ||
| 4. | Control | 25 ± 0.7 | 0.1 mL N/S | 0/5 |
Table 9.
Hematological evaluation for Sub-Acute Toxicity of crude venom and its fractions on mice samples.
Table 9.
Hematological evaluation for Sub-Acute Toxicity of crude venom and its fractions on mice samples.
| CBC Profile | |||||
|---|---|---|---|---|---|
| S.NO | Groups | Hb (g/dl) | RBC (10e12/L) | WBC (10e9/L) | PLT (10e9/L) |
| 1. | Crude (19 µg/kg) | 12.8 ± 0.20** | 8.6 ± 0.51* | 13.7 ± 0.26*** | 654.7 ±33* |
| 2. | Fraction-1 (1.8 µg/kg) | 22.8 ± 0.14*** | 17 ± 0.17*** | 16.3 ± 0.26*** | 715 ± 39 ** |
| 3. | Fraction-2 (267 µg/kg) | 8.8 ± 2.0ns | 6.6 ± 0.76ns | 11.9 ± 0.29*** | 793 ± 9.41*** |
| 4. | Control | 8.5 ± 0.17 | 5.87 ± 0.52 | 4.6 ± 0.56 | 487.7 ± 41 |
Table 10.
Biochemical evaluation for Sub-Acute Toxicity of crude venom and its fractions on mice samples.
Table 10.
Biochemical evaluation for Sub-Acute Toxicity of crude venom and its fractions on mice samples.
| Biochemical Parameters | |||||
|---|---|---|---|---|---|
| S.NO | Groups | AST (U/L) | ALT (U/L) | Creatinine (mg/dl/l) | BUN (mg/dl) |
| 1. | Crude (19ug/kg) | 749 ± 10.6*** | 84 ± 2.11*** | 0.38 ± 0.01ns | 8.3 ± 0.11*** |
| 2. | Fraction-1 (1.8ug/kg) | 277.3 ± 5.4*** | 56.3 ± 0.90ns | 0.44 ± 0.01ns | 10.5 ± 0.11** |
| 3. | Fraction-2 (267ug/kg) | 642.6 ± 4.6*** | 92 ± 1.73*** | 0.41 ± 0.01ns | 8.43 ± 0.09*** |
| 4. | Control | 394.3 ± 4.8 | 55.7 ± 2.40 | 0.41 ± 0.01 | 9.7 ± 0.18 |
Disclaimer/Publisher’s Note: The statements, opinions and data contained in all publications are solely those of the individual author(s) and contributor(s) and not of MDPI and/or the editor(s). MDPI and/or the editor(s) disclaim responsibility for any injury to people or property resulting from any ideas, methods, instructions or products referred to in the content. |
© 2024 by the authors. Licensee MDPI, Basel, Switzerland. This article is an open access article distributed under the terms and conditions of the Creative Commons Attribution (CC BY) license (http://creativecommons.org/licenses/by/4.0/).
Copyright: This open access article is published under a Creative Commons CC BY 4.0 license, which permit the free download, distribution, and reuse, provided that the author and preprint are cited in any reuse.


