Submitted:
07 March 2024
Posted:
07 March 2024
You are already at the latest version
Abstract
Alternative fertilizations are essential to minimize the deteriorating effects of chemical fertilizers on soil and water quality/health. Accordingly, the present work investigated the effects of combined organic-inorganic fertilization (COIF) on wheat and rice yields, soil nutrients, and soil Cd accumulation. Hence, seven different treatments were set up: control (CK); conventional fertilization (CF); optimized fertilization (OF); organic fertilizer replacing 25% (T1) and 50% (T2) of OF; and organic nitrogen (N) replacing 25% (M1) and 50% (M2) of OF-N. Overall, significant increases occurred in the yields of COIF crops. Compared with the CF, the highest wheat and rice yields happened in M1 treatment (approximately by18.5%) (P < 0.05). COIF slightly alleviated soil acidification, and improved the cation exchange capacity (CEC) of the study soils. Besides, COIF treatments significantly increased the contents of total phosphorus, total potassium, available phosphorus, and available potassium by 6.35 to 16.9 %, 3.17 to 10.9 %, 5.53 to 28.7 %, and 2.6 to 12 %, respectively (P <0.05). Nevertheless, negligible increases took place in Cd content of COIF soils compared with the CK. Altogether, our results concluded on 25% replacement of OF-N by organic N (M1) to effectively improve the fertility/ecological sustainability of the study soils.
Keywords:
conventional fertilization
; solid cow manure
; crop quality
; soil nutrients
; ecological risk
1. Introduction
Chemical fertilization has a major contribution to the large-scale agricultural production of China [1]. Over the past few decades, chemical fertilization of Chinese croplands has increased both in rate and frequency due to the rapid population growth, agricultural development, and the increasing demand for food [2]. In accordance, the China’s fertilizer consumption has reached about 59.84 million tons by 2016 [3]. Despite the encouraging effects of chemical fertilizers on soil productivity/crop growth, excessive fertilization might cause serious environmental problems threatening the quality of soil and water [4,5,6,7,8]. As such, large chemical fertilization can adversely effect soil microbial/enzyme properties/activities along with soil hardening, soil acidification, and nutrient leaching [4]. Besides, long-term chemical inputs threat the sustainable agricultural development via reducing the nutrients’ use efficiency/deteriorating soil fertility, and imposing non-point source pollution [4,5,6,7]. For instance, long-term over N fertilization stimulated soil acidification and salinization in greenhouse vegetable soils of Shandong, North China, and Zhejiang, East China, due to the nitrification reactions that lowered pH [8]. High soil acidity and salinity caused by excessive N application increased the transfer of cadmium (Cd) from soil to the wheat grains in Anhui Anthrosol, East China [9]. Similar fertilization schemes reduced the bacterial diversity and altered the bacterial community composition of north eastern Chinese black soils within two successive crop seasons [10]. These findings emphasize the necessity of the substitution of chemical fertilizers with the organic amendments, that in turn cause less environmental degradations and contribute to the soil health and quality [11,12,13]. A two-year in situ applications of peat and farmyard manure increased the contents of topsoil (0—30 cm) organic matter and total/available nutrients in a calcareous alkaline soil in Northern Croatia [11]. Likewise, Gao et al. [12] found that long-term (16-year) combined application of manure and chemical fertilizers enhanced soil fertility and provided a healthier ecosystem for microbial diversity/population compared with chemical fertilization alone in the Inner Mongolia Autonomous Region, North China. Du et al. [13] also suggested that the partial replacement of chemical fertilizer with manure increased the formation of macro-aggregates, soil carbon storage, and soil productivity in an arid gravel field of Northwest China. Consistently, Shan [14] showed that a 20% reduction of N application to a Zhejiang paddy field, East China, not only maintained crop yield, but also it alleviated soil acidification. In a recent review, Wang et al. [15] reviewed the challenges of biochar application for the remediation of heavy metals’ contaminated soils. Hence, several workers suggested the co-application of chemical N and manure/organic amendments to achieve optimal crop yield and to improve soil physiochemical and biological properties [13,16]. However, partial replacement of chemical N with organic amendment might also minimize the adverse ecological impacts of sole application of organic or inorganic fertilizers. It is also worth noting that various organic amendments and their substitution rates may have different effects/efficiencies on soil qualities and crop growth. This is of particular importance in large-scale/diverse agricultural production systems that take place in China. Thus, the present field trial was carried out in Feidong County, Anhui Province, East China, to explore the effects of co-application of chemical N fertilizer and solid cow manure on: 1) the yields of wheat and rice and their grains’ quality, 2) total and available contents of soil phosphorus (P) and potassium (K), and 3) soil ecological quality/risk via assessing the total and available contents of Cd in soils. The results of this study are hoped to provide an alternative/sufficient fertilization scheme for the farmers and the stakeholders to maintain/maximize crop productivity/soil fertility and to minimize the bioavailability of toxic metals in farmland soils.
2. Materials and Methods
2.1. Study area
Feidong County (117 ° 38 ′ 17 ″ E, 32 ° 12 ′ 99 ″ N), a major agricultural region in Anhui Province, East China, was selected for this study. This area has a subtropical humid monsoon climate with a mean annual temperature and precipitation of 15.5 ℃ and 879 mm, respectively. The total cultivated land in Feidong County is about 76700 ha, and the major soil types are paddy soils and yellow cinnamon soils. Table 1 presents the basic physical and chemical properties of the study paddy soils. Winter wheat-summer rice rotation is the main cropping system in the study area. In this study, wheat (Guohong No. 9) was planted on November 10, 2021 and harvested on May 31, 2022; and rice (Fengliang Youxiang No.1) was planted on July 10, 2022, and harvested on October 21, 2022. The fertilization schemes were in accordance to the local management practices. Further, the disease control management via pesticides and herbicides, irrigation rate/frequency, and the application of other agrochemicals were all consistent with the local operations during both wheat and rice cultivations. Table 2 and Table 3 summarize the details of fertilization schemes in different treatments under both wheat and rice cultivations, respectively.
2.2. Experimental design
Solid cow manure was selected as the organic fertilizer in this study, with the available contents of N, P, and K of 1.7, 1.16, and 1.26%, respectively. The manure contents of mercury (0.111 mg kg−1), chromium (18 mg kg−1), cadmium (0.52 mg kg−1), lead (12.3 mg kg−1), and arsenic (0.88 mg kg−1) meet the standards of the Ministry of Agriculture and Rural Affairs of China (Organic Fertilizer) (NY/T525-2021) (China Agricultural Publishing House 2012) [18].
The present study employed a randomized complete block design with seven treatments, including control (CK); conventional fertilization scheme (CF) with the N, P, and K application rates of 181.5, 112.5, and 112.5 kg ha−1, respectively, for wheat, corresponding to 150, 67.5, and 67.5 kg ha−1, respectively, for rice; optimized fertilization (OF) with the N, P, and K application rates of 191.4, 75, and 78.75 kg ha−1, respectively, for wheat, corresponding to 210, 60, and 90 kg ha−1, respectively, for rice; organic fertilizer replacing 25% of OF (T1), with solid cow manure applications of 2815 (wheat) and 3088 kg ha−1 (rice) and replacing 25% of OF-N, -P, and -K; organic fertilizer replacing 50% of OF (T2), with solid cow manure applications of 5629 (wheat) and 6176 (rice) kg ha−1 and replacing 50% of OF-N, -P, and -K contents; organic N replacing 25% of OF-N (M1), with solid cow manure applications of 2815 (wheat) and 3088 kg ha−1 (rice) and replacing 25% of OF-N, both of P and K remained unchanged; organic N replacing 50% of OF-N (M2), with solid cow manure of 5629 (wheat) and 6176 (rice) kg ha−1 and replacing 50% of OF-N, both of P and K remained unchanged (Table 2 and Table 3). All treatments were replicated three times. Overall, 21 experimental plots were set up for this study in October 2021. Each plot had 5m (width) × 6m (length) dimensions (30 m2), The plot ridges were stacked with cement to block/prevent surface runoff.
2.3. Plant sample collection and analyses
For each treatment, the number of effective panicles and the grains per panicle were measured/counted at three different replicates within an area of 1 m2 prior to the harvest. Then after, panicles were harvested at the maturity stage. The collected samples were washed thoroughly with ultrapure water, and oven-dried at 105 ℃ for 30 min, and then dry again to the constant weight at 70 ℃. The panicles were then threshed manually, and the grains were air-dried to ∼13% moisture content to determine the crop yields. Three samples of 1000 filled grains from each plot were randomly selected, then weighed to determine the 1000-grain weight.
Kjeldahl method was used to determine the grain protein contents following grain N measurements. In accordance, oven-dried grains were digested with concentrated H2SO4 in the presence of CuSO4·5H2O-K2SO4 as the catalyst. Then, the concentrations of grain N were measured by an automatic Kjeldahl N analyser (SKD-800, Shanghai Peiou Analytical Instrument Co., Ltd.) following the national food safety standard method formulated by China (GB5009.5-2016). Finally, the grain protein contents were calculated by multiplying the N contents by the conversion coefficients of 5.7 and 5.95 for wheat and rice, respectively.
2.4. Soil sample collection and analyses
At the sites of plant samples, we also collected the rhizosphere soil samples (0—20 cm). The collected soil samples were air-dried and sieved (2 and 0.149 mm) for the subsequent measurements. Soil pH was measured at a soil: water ratio of 1:2.5 via pH meter (STARTER 3100); soil cation exchange capacity (CEC) was determined by a rapid barium chloride-sulfuric acid method; soil available P (AP) and total P (TP) were determined using molybdenum blue calorimetry (ZENit-700P atomic absorption spectrophotometer) after soil extraction via 0.5M NaHCO3 and soil digestion with acid-perchloric acid-sulfuric, respectively; soil available K (AK) and total K (TK) were determined via flame photometer (fp640 Shanghai INESA Scientific Instruments Co.,Ltd) after soil extraction with 1N NH4OAc (pH:7) and soil digestion with NaOH followed by 1:1 HCl and 1:3 H2SO4, respectively. Graphite furnace–flame spectrophotometer (iCE 3500 Thermo, Thermo Fisher Scientific Ltd.) was used to determine the total and available contents of soil Cd after soil extraction by acid digestion with aqua regia-perchloric acid mixture and leaching with DTPA extractant, respectively.
2.5. Data Analysis
The mean and the standard deviations of the raw data were calculated using Microsoft Excel 2016. SPSS 22.0 (IBM Corporation, NY, USA) was used to analyze the significant differences, correlations, and the linear fitting of the data. All the graphs were plotted with Origin 2017C (OriginLab Inc, Northampton, MA).
3. Results
3.1. Crop yield
The indicators of wheat and rice yields under different treatments are shown in Table 4 and Table 5, respectively. Overall, increases happened in the components of both crops with the combined application of organic and inorganic fertilizers (COIF). For instance, during the wheat season, T1 and M1 treatments significantly increased the effective panicle numbers by 18.7 and 24.1%, respectively, compared with the CF, corresponding to 12.8 and 22.6% for rice season (P < 0.05). From Table 4 and Table 5, higher crop yields happened via the replacement of chemical N by organic N than the replacement of chemical fertilizer by organic fertilizer, especially for M1. In accordance, the highest wheat (5200 kg ha−1) and rice (7900 kg ha−1) grain yields happened in M1, both 18.5% higher than CF (P < 0.05). The highest grains per panicle happened in T2 wheat (40.4) and M1 rice (143), 18.8 and 13.5% higher than the CF, respectively (P < 0.05). Nevertheless, for both crops, no significant differences occurred among COIF and CF soils in their contents of 1000-grain weight.
3.2. Crop grain protein
Figure 1 illustrates the protein contents of crop grains for the different treatments. Considering CF as the reference, insignificant increases happened in the protein contents of wheat grains as follows: M1 (15.71%) > M2 (13.17%) > T1 (10.39%) > T2 (7.01%), corresponding to significant increases in the protein contents of rice grains in the order of M1 (7.40%) > T1 (4.67%) > T2 (3.85%) > M2 (3.55%). In accordance, higher protein contents occurred at the manure replacement rate of 25% than 50%, although the differences were insignificant.
3.3. Soil pH and CEC
Figure 2 shows the contents of soil pH and cation exchange capacity (CEC) under different treatments. Apparently, the lowest pH values happened in CF treatments for both wheat (7.91) and rice (8.03) crops. The CK treatments had generally the highest pH values of 8.14 and 8.18 for wheat and rice soils, respectively (Figure 2a and b). As also can be seen, slight increases of 2 to 2.52% happened in soil pH of manure amended treatments compared with the CF treatment during wheat season (Figure 2a), corresponding to 1 to 1.62% for rice (Figure 2b). Unlike pH values, the lowest and the highest CEC contents took place in CK and manure amended soils, respectively (Figure 2a and b). Accordingly, the CEC contents of wheat and rice CK treatments were 20.5 and 20.6 cmol kg−1, respectively (Figure 2a and b). Further, the highest CEC contents happened in wheat T2 (24.3 cmol kg−1) and rice M2 (25 cmol kg−1) soils, 15 and 15.7% higher than the corresponding CF soils, respectively (Figure 2a and b).
3.4. Total and available P in soil
Figure 3 shows the total and available P contents of soils under different treatments. In accordance, compared with CF, significant increases happened in the TP contents of T2, M1, and M2 treatments during the wheat season ranging from 12.5 to 16.9% (P < 0.05) (Figure 3a). Herein, insignificant increases of 4.76 and 6.35% took place in OF and T1 soil TP contents, respectively, compared with CF. Similarly, compared with CF, significant increases appeared in the TP contents of rice T1, T2, M1, and M2 ranging from 13.6 to 22.7% (P < 0.05) (Figure 3b). Consistent with the soil TP contents, T2, M1, and M2 treatments significantly increased the wheat soil AP contents ranging from 16.2 to 28.7% compared with CF (P < 0.05) (Figure 3a). Similarly, OF and T1 caused insignificant increases in wheat soil AP contents by 5.94 and 5.53%, respectively, compared with the CF. In addition, T1, T2, M1, and M2 treatments significantly increased the AP contents of rice soils by 14.6, 22.2, 27, and 31%, respectively, compared with the CF (P < 0.05) (Figure 3b).
3.5. Total and available K in soil
Figure 4 illustrates the contents of soil total K (TK) and available K (AK) under different treatments. As can be seen, significant increases happened in TK contents of T2, M1, and M2 during the wheat season by 7.56, 5.24, and 10.9%, respectively, compared with the CF (P < 0.05) (Figure 4a). Herein, OF and T1 caused insignificant increases in TK by 1.03 and 3.17%, respectively, compared with the CF (P < 0.05) (Figure 4a). It is also worth mentioning that wheat M2, M1, and T2 treatments had significant differences in their TK contents (P < 0.05). For rice season, compared with the CF, the TK contents of T1, T2, M1, and M2 significantly increased by 5.43, 8.74, 10.4, and 14.4%, respectively (P < 0.05) (Figure 4b). Consistent with the TK results, significant increases occurred in soil available K (AK) contents in T2, M1, and M2 treatments during the wheat season by 7.30, 5.22, and 12%, respectively, compared with the CF (P < 0.05) (Figure 4a). Herein, T1 caused an insignificant increase in AK content by 2.6%. Correspondingly, compared with CF, the AK contents of rice T1, T2, M1, and M2 significantly increased by 6.77, 11.2, 10.8, and 16.1%, respectively (P < 0.05) (Figure 4b).
3.6. Soil ecological risk
Figure 5 illustrates the total and available contents of Cd in soils under different treatments. In accordance, slight increases happened in soil total Cd contents of both wheat and rice manure amended soils compared with the non-manure amended soils. Compared with the CF, the total Cd contents of wheat T1, T2, M1, and M2 soils increased by 2.43, 3.89, 3.41, and 4.37%, respectively (Figure 5a), corresponding to 0.93, 2.09, 1.63, and 2.56%, respectively, for rice season (Figure 5b). Similar to the total Cd contents, negligible increases occurred in topsoil Cd availability with increasing the rate of manure replacement (Figure 5a and b). Accordingly, compared with the CF treatment, the DTPA-Cd contents of wheat T1, T2, M1, and M2 soils increased by 1.59, 2.03, 2.46, and 3.47%, respectively (Figure 5a), corresponding to 0.85, 1.28, 1.42, and 1.99%, respectively, during the rice season (Figure 5b).
4. Discussion
4.1. Crop yield
Our findings in regard to the enhancing effects of COIF on crop yields are in line with the observations of Kalkhajeh et al. [19], who found increases in the components of rice yield with the co-application of straw and chemical N. Others suggested that an appropriate combination of organic and inorganic fertilizers increases the crop yield via increasing the number of spikelets and improving the photosynthetic characteristics [20,21]. Manure application can improve soil organic matter/fertility, as well as the soil physiochemical and biological properties with subsequent increases in soil TN [22]. Higher effective panicle numbers and grain yields in ~ 25% manure replacement than ~ 50% [23] might attribute to the relatively lower release of inorganic nutrients with increasing the rate of organic fertilization in T2 and M2 [24]. This can lead to an insufficient soil nutrient supply during the early tillering and elongation of both crops, resulting in the late ripening and declining the yield. Unlike, nutrients in chemical fertilizers are readily available for the plants [25]. Nevertheless, no significant differences happened in1000-grain weight among the different treatments that might attribute to the short duration of this experiment [19].
4.2. Crop grain protein
Previous works suggested that organic fertilizers can improve the removal/absorption of N and K by crops, justifying the higher protein contents in manure amended crops’ grains [7].
Others found that reductions happened in the grain protein content of crops following the replacement of inorganic fertilizer with manure [26,27]. These contradictory results might be explained by the variations in N supply and removal. For instance, in this study, the highest protein contents took place in M1 treatment for both wheat and rice grains. This might be attributed to the optimum N availability that, in turn, has an encouraging effect on the protein production by crop grains [28]. This is in line with the results of Qu et al. [29], who found increases in the protein content of wheat grains via 25% or 30% replacement of inorganic fertilizer with manure. It is also worth mentioning that the increasing trend of the protein contents of manure amended grains was consistent with the indicators of wheat yield (e.g., grain yield and effective panicle number).
4.3. Soil pH and CEC
Overall, our results revealed slight increases in both soil pH and CEC contents after the partial replacement of chemical fertilizer with solid cow manure. Over N application via CF might lead to the nitrification reactions, resulting in lower base saturation/alkalinity and subsequently reducing soil pH [30]. Unlike, the replacement of organic fertilizers can effectively inhibit soil acidification via increasing the soil pH buffering capacity [31]. The latter happens via the addition of base ions [32], ammonification of organic N, and decarboxylation of organic anions consuming protons to release CO2 during OM decomposition [33], and the formation of organic-aluminum complex that reduces the effective aluminum content in soil solution. However, negligible increases in soil pH might attribute to the short duration of this field trial, while significant encouraging effects can be obtained via longer manure application. Soil CEC refers to the total amount of various cations that can be adsorbed by the soil colloids. It is an important basis for evaluating soil fertility capacity, and for soil environmental capacity and or pollutant migration and transformation [34]. Apparently, higher CEC values happened with increasing the rate of manure replacement, corresponding to the increasing of soil pH value (Figure 2) [35]. Besides, manure application enhances soil organic matter. The latter increases soil organic C stock, and finally soil CEC.
4.4. Total and available P and K in soil
Overall, our resulted revealed that an increase in the proportion of manure application caused a higher increase in soil TP contents for both crops (P <0.05) (Figure 3a and b), that is consistent with the findings of Yang et al. [36]. These results can be justified by the higher P sorption capacity of manure-amended soils, increasing soil TP contents [37,38]. Likewise, higher TP contents of T1, T2, M1, and M2 soils than OF soils might also attribute to their higher P sorption capacity brought by manure application.
Similar observations happened in terms of the contents of soil AP contents among the different treatments (P <0.05) (Figure 3a and b). This is in line with the results of Jing et al. [39], who found that changes in AP contents are consistent with those of TP and both increased with increasing the proportion rate of organic fertilizers. However, organic amendments increase soil OM content. The latter increases the soil labile P pool and P dissolution, increasing soil P availability [40]. Organic fertilization also stimulates the activities of soil microorganisms and phosphatase, accelerating the rate of mineralization [41]. Besides, organic fertilization, particularly in long term, can improve soil physiochemical properties, that in turn contribute to/stimulate the mineralization of organic matters in the soil [42,43].
Our observations on the significant effects of COIF treatments on TK contents in both wheat and rice soils were in agreement with the findings of Nguyen et al. [44] CF (P < 0.05) (Figure 4a and b). Because co-application of organic and inorganic fertilizers causes a higher rate of K conversion than the chemical fertilization alone [45]. This can also explain the increases in TK content that took place with increasing the rate of manure replacement [46]. Likewise, higher increases occurred in AK contents of manure amended rice and wheat soils compared with the CF (P < 0.05) (Figure 4a and b). Previous works have suggested that recycling of organic K is the major pathway of plant K. This justifies the increased AK with increasing the rate of manure replacement [47,48]. Similar observations happened in Jiří et al. [49]. In addition, increases in organic fertilization stimulate/improve the microbial conversion of organic K into inorganic K.
4.5. Soil ecological risk
Our results suggested slight increases in soil total and available Cd contents with increasing the rate of manure replacement. Previous studies have shown that organic fertilizers, particularly livestock and poultry manures, are major sources of heavy metals including Cd [50,51]. Hence, long-term continuous manure application might increase the Cd content in soil, posing potential ecological risks. Besides, higher Cd content of manure-amended treatments might also attribute to the high buffering capacity of the study soils [52,53]. Similar observations were reported by Wang et al. [54] and Guan et al. [55]. Nevertheless, the ecological risk of combined organic-inorganic fertilization (COIF) was small due to the slight increases of Cd accumulation in COIF amended soils.
5. Environmental implications
Taking into account the current fertilization schemes that is practiced in typical wheat-rice rotation system in China, it is essential to optimize/reduce the rate of chemical fertilization. Our findings revealed that partial replacement of chemical fertilizers by different rates of solid cow manure, as alternative strategies, not only improved crop productivity but also enhanced the contents of total and available P and K in the study soils. Apparently, large inputs of readily available N and P via chemical fertilization lead to their excessive accumulation in the soil, increasing their potential surface/subsurface leaching to the adjusting water bodies, degrading water quality via eutrophication [11,56]. This, in particular, can be stimulated via the anaerobic condition during rice cultivation, that in turn enhances P dissolution by the reduction of metal oxides/hydroxides [57]. However, the effect of soil acidification on soil P mobilization can be partially neutralized via manure application [31,32]. In addition, manure application/organic amendments increase the contents of base cations in agricultural soils [32]. The latter contribute to the larger soil P holding capacity and availability for plant removal/growth [11]. Likewise, manure fertilization can also improve soil aggregation, that in turn increases the soil water holding capacity, resulting in less irrigation water volume and frequency. Further, manure application reinforces the mutual relationship between soil aggregation and organic C storage. In other words, manure driven organic C is a major cementation material that binds the smaller soil particles to form soil aggregates. Besides, soil aggregates are the major storage sites for the accumulation of organic C fractions, protecting them against microbial decomposition [58,59]. Nevertheless, manure application slightly increased soil total and available Cd, threatening soil quality/health and food safety. This effect can be triggered via longer manure fertilization to the study paddy soils. Hence, practical pre-treatment measures should be taken into consideration to eliminate Cd and other toxic metals from the solid cow manure prior to its field application.
6. Future research needs
Despite the significant findings of this study with respect to the effects of partial replacement of chemical fertilizer with solid cow manure on soil fertility and health/quality, the following issues still merit further attention:
- Particle size distribution and chemical composition are the two major factors of animal manures affecting the soil holding capacities of different nutrients. Hence, future works should pay special attention to the effects of these two parameters on soil CEC both for top and subsoil layers. This, in particular, calls for long-term in situ trials for the completion of microbial decomposition of manure.
- Despite the well-documentation of the effects of manure application on P accumulation in the study COIF amended paddy soils (0—20 cm), future research should investigate the spatiotemporal subsurface leaching of both organic/inorganic and dissolved/particulate soil P in relation to the long term and the rate of soil cow manure application [60].
- It is of major importance to study the effects of co-application of manure and chemical fertilizers on crop yield qualities in longer periods of time [19].
7. Conclusions
The present field trial concludes on the effects of combined organic-inorganic fertilization (COIF) on crop quality, soil fertility, and the ecological risk. Our results revealed that COIF caused significant increases in the yields of wheat and rice compared with the conventional and optimized fertilization schemes. Crop yields increased with increasing the substitution rate of chemical fertilizer with solid cow manure, the highest yield happened at the manure replacement rate of 25%. Besides, crop quality components were higher in COIF treatments than other fertilization schemes. For instance, higher protein contents occurred at the manure replacement rates of 25% than 50%. In addition, increases took place in soil CEC contents with increasing the rate of manure application. Likewise, higher contents of total and available P and K happened in COIF soils than other soils. Herein, the replacing effect of organic N was higher than that of manure replacing chemical fertilizers. However, insignificant increases happened in soil total and available Cd contents of manure amended soils, indicating the negligible ecological risk of COIF fertilization schemes.
Author Contributions
Conceptualization, H. Hu and Y. K. Kalkhajeh; methodology, J. Yu, C. Zhang, and X. Wang; formal analysis, J. Yu, C. Zhang, X. Wang and H. Li; writing—original draft preparation, J. Yu and H. Li; writing—review and editing, H. Hu and Y. K. Kalkhajeh.
Funding
This work was financially supported by the National “13th Five Year Plan” Water Pollution Control and Treatment Science and Technology Major Project (2017ZX07603-02-02), and Ministry of Agriculture Green Planting and Breeding Recycling Pilot Project (KJ2022287).
Conflicts of Interest
We wish to confirm that there are no known competing financial interests or personal relationships that could have influenced this work and its outcome.
References
- Hu D, Chen Y, Hu M. Industrial value chain model and big data application for developing green agriculture in China. J. Phys. Conf. Ser. 2021; 1883 (1): 012117. [CrossRef]
- Orner KD, Smith SJ, Breunig HM, et al. Fertilizer demand and potential supply through nutrient recovery from organic waste digest ate in California. Water. Res. 2021; 206: 117717. [CrossRef]
- National Bureau of Statistics of the People’s Republic of China. China Statistical Yearbook; CN, 2017.
- Zhong Y, Yan W, Shangguan Z. Impact of long-term N additions upon coupling between soil microbial community structure and activity, and nutrient-use efficiencies. Soil. Biol. Biochem. 2015: 92: pp. 151-159. [CrossRef]
- Dong L, Wang J, Shen M, et al. Biochar combined with nitrogen fertilizer affects soil properties and wheat yield in medium-low-yield farmland. Soil. Use. Manag. 2022; 38(1): pp. 584—595. [CrossRef]
- Sun L, Yu Y, Petropoulos E, et al. Long-term manure amendment sustains black soil biodiversity by mitigating acidification induced by chemical N fertilization. Microorganisms. 2023; 11(1): 64. [CrossRef]
- He H, Peng M, Lu W, et al. Commercial organic fertilizer substitution increases wheat yield by improving soil quality. Sci. Total. Environ. 2022; 851: 158132. [CrossRef]
- Han J, Luo Y, Yang L, et al. Acidification and salinization of soils with different initial pH under greenhouse vegetable cultivation. J. Soils. Sediments. 2014; 14(10): pp. 1683–1692. [CrossRef]
- Ata-Ul-Karim ST, Cang L, Wang, Y, et al. Interactions between nitrogen application and soil properties and their impacts on the transfer of cadmium from soil to wheat (Triticum aestivum L.) grain. Geoderma. 2020; 357: 113923. [CrossRef]
- Zhou J., Jiang X., Wei D, et al. Consistent effects of nitrogen fertilization on soil bacterial communities in black soils for two crop seasons in China. Sci. Rep. 2017; 7(1), 3267. [CrossRef]
- Kalkhajeh YK, Huang B, Hu W, et al. Phosphorus saturation and mobilization in two typical Chinese greenhouse vegetable soils. Chemosphere. 2017; 172: pp. 316-324. [CrossRef]
- Gao RP, Duan Y, Zhang J, et al. Effects of long-term application of organic manure and chemical fertilizer on soil properties and microbial communities in the agro-pastoral ecotone of North China. Front. Environ. Sci. 2022; 10: 1665. [CrossRef]
- Du SP, Ma ZM, Chen J, et al. Effects of organic fertilizer proportion on the distribution of soil aggregates and their associated organic carbon in a field mulched with gravel. Sci. Rep. 2022; 12(1): 11513. [CrossRef]
- Shan A, Pan J, Kang KJ, et al. Effects of straw return with N fertilizer reduction on crop yield, plant diseases and pests and potential heavy metal risk in a Chinese rice paddy: A field study of 2 consecutive wheat-rice cycles. Environ. Pollut. 2021; 288:117741. [CrossRef]
- Wang YY, Liu YD, Zhang WH, et al. Stabilization of heavy metal-contaminated soils by biochar: Challenges and recommendations. Sci. Total. Environ. 2020; 729:139060. [CrossRef]
- Iqbal A, Ali I, Yuan PL, et al. Combined application of manure and chemical fertilizers alters soil environmental variables and improves soil fungal community composition and rice grain yield. Front. Microbiol. 2022: 13:856355. [CrossRef]
- Wang Q, Yang S, Zheng M, et al. Effects of Vegetable Fields on the Spatial Distribution Patterns of Metal (loid) s in Soils Based on GIS and Moran’s I. Int. J. Environ. Res. Public. Health. 2019; 16(21): 4095. [CrossRef]
- Ministry of Agriculture of the People’s Republic of China. Organic fertilizer; NY 525-2012, CN, 2012.
- Kalkhajeh YK, He Z, Yang X, et al. Co-application of nitrogen and straw-decomposing microbial inoculant enhanced wheat straw decomposition and rice yield in a paddy soil. J. Agric. Food. Res. 2021; 4:100134. [CrossRef]
- Yang C, Du WB, Zhang LL, et al. Effects of sheep manure combined with chemical fertilizers on maize yield and quality and spatial and temporal distribution of soil inorganic Nitrogen. Complexity. 2021; 1—10. [CrossRef]
- Wei QQ., GOU J.L., ZHANG M., ZHANG B.X., RAO Y., XIAO H.G. Nitrogen reduction combined with organic materials can stabilize crop yield and soil nutrients in winter rape seed and maize rotation in yellow soil. Sustainability. 2021; 14(12). [CrossRef]
- WEI QQ, Gou JL, Zhang M, et al. Nitrogen reduction combined with organic materials can stabilize crop yield and soil nutrients in winter rape seed and maize rotation in yellow soil. Sustainability. 2021; 14 (12): 7183. [CrossRef]
- Gao HZ, Xi YJ, Wu XP, et al. Partial substitution of manure reduces nitrous oxide emission with maintained yield in a winter wheat crop. J. Environ. Manage. 2023; 326: 116794. [CrossRef]
- Lin SF, Pi YJ, Long DY, et al. Impact of organic and chemical Nitrogen fertilizers on the crop yield and fertilizer use efficiency of soybean — Maize intercropping systems. Agriculture. 2022; 12(9): 1428. [CrossRef]
- Xiao ZL, Gu HZ, Wu H, et al. Effects of planting density, levels, and forms of Nitrogen application on the yield and Nitrogen utilization of wheat following rice in East China. Agronomy. 2022; 12(11): 2607. [CrossRef]
- Wang GL, Zhang JH, Wang SH, et al. Effects of chemical fertilizer nitrogen substitution by biogas slurry on yield, quality and growth characteristics of winter wheat. J. Agric. Resour. Environ. 2018; 35: 467–475. (in Chinese). [CrossRef]
- Han Y, Lv FL, Lin XD, et al. Crop yield and nutrient efficiency under organic manure substitution fertilizer in a double cropping system: A 6-year field experiment on an anthrosol. Agronomy. 2022; 12(9): 2047. [CrossRef]
- BROWN B.D., PETRIE S. Irrigated hard winter wheat response to fall, spring, and late season applied nitrogen. Field. Crops. Res. 96, 260–268, 2006. [CrossRef]
- Qu H, Zhao BQ, Chen YH, et al. Effect of long-term fertilization on wheat quality and yield in grey desert soil. Plant. Nutr. Fertil. 2004; 10: 12–17. (In Chinese). [CrossRef]
- Han J, Luo Y, Yang L, et al. Acidification and salinization of soils with different initial pH under greenhouse vegetable cultivation. J. soils. sediments. 2014; 14: pp. 1683-1692. [CrossRef]
- Shi RY, Liu ZD, Li Y, et al. Mechanisms for increasing soil resistance to acidification by long-term manure application. Soil. Tillage. Res. 2019; 185: 77-84. [CrossRef]
- Cai ZJ, Wang BR, Xu MG, et al. Intensified soil acidification from chemical N fertilization and prevention by manure in an 18-year field experiment in the red soil of southern China. J. Soils. Sediments. 2015; 15(2): pp. 260—270. [CrossRef]
- Kong CX, Xu JM, Tang CX, et al. Differences in carbon and nitrogen mineralization in soils of differing initial pH induced by electrokinesis and receiving crop residue amendments. Soil. Biol. Biochem. 2013; 67: pp. 70—84. [CrossRef]
- Khorshidi M, Lu N. Intrinsic Relation between Soil Water Retention and Cation Exchange Capacity. J. Geotech. Geoenviron. Eng. 2016; 143(4): 04016119. [CrossRef]
- Zhang Y, Yang S, Fu M, et al. Sheep manure application increases soil exchangeable base cations in a semi-arid steppe of Inner Mongolia. J. Arid. Land. 2015; 7: pp. 361-369. [CrossRef]
- Yang XY, Ren WD, Sun BH, et al. Effects of contrasting soil management regimes on total and labile soil organic carbon fractions in a loess soil in China. Geoderma. 2012; 177/178: pp. 49-56. [CrossRef]
- Ma XZ, Wu ZJ, Chen LJ, et al. Effect of long-term fertilization on the phosphorus content of black soil in Northeast China. Acta. Agric. Scand. Section B. Soil. Plant. Sci. 2014; 63(2): pp. 156-161. [CrossRef]
- Li XP, Liu CL, Zhao H, et al. Similar positive effects of beneficial bacteria, nematodes and earthworms on soil quality and productivity. Appl. Soil. Ecol. 2018; 130: pp. 202-208. [CrossRef]
- Jing H, Qaswar M, Khan MN, et al. Long-term application of chemical and organic fertilizers over 35 years differentially affects interannual variation in soil inorganic Phosphorus fractions in acidic paddy soil. Eurasian. Soil. Sci. 2021; 54(5): pp. 772-782. [CrossRef]
- Waqas A, Huang J, Liu KL, et al. Changes in phosphorus fractions associated with soil chemical properties under long-term organic and inorganic fertilization in paddy soils of southern China. PLoS ONE. 2019; 14(5): e0216881. [CrossRef]
- Song WF, Shu AP, Liu JA, et al. Effects of long-term fertilization with different substitution ratios of organic fertilizer on paddy soil. Pedosphere. 2022; 32(4): pp. 637-648. [CrossRef]
- Parham JA, Deng SP, Da HN, et al. Long-term cattle manure application in soil. II. Effect on soil microbial populations and community structure. Biol. Fertil. Soils, 2003; 38(4): pp. 209-215. [CrossRef]
- Ye DH, Liu D, Li TX, et al. Phosphorus accumulation characteristics in Polygonum hydropiper and rhizosphere properties affected by poultry manure application. Appl. Soil. Ecol. 2018; 131: pp. 12-21. [CrossRef]
- Nguyen TT, Sasaki Y, Kakuda KI, et al. Comparison of paddy soil fertility under conventional rice straw application versus cow dung compost application in mixed crop–livestock systems in a cold temperate region of Japan. Soil. Sci. Plant. Nutr. 2020; 66 (1), pp. 106-115. [CrossRef]
- Gosal SK, Gill GK, Sharma S, et al. Soil nutrient status and yield of rice as affected by long-term integrated use of organic and inorganic fertilizers. J. Plant. Nutr. 2017; 41(4): pp. 539-544. [CrossRef]
- Hashim M, Dhar S, Vyas AK, et al. SINGH C.B. Yield trends and changes in physico-chemical properties of soil in maize-wheat cropping system under integrated nutrient management. J. Environ. Biol. 2107; 38(5): pp. 727-734. [CrossRef]
- Xu MG, Li DC, Li JM, et al. Effects of organic manure application combined with chemical fertilizers on nutrients absorption and yield of rice in Hunan of China. Sci. Agric. Sin. 2008; 41(10): pp. 3133–3139. [CrossRef]
- Li Y, Sun CP, Jing YP, et al. Effect of long-term application of organic manure on soil fertility and nitrate-N transport in fluvo-aquic soil. J Agro-Environ Sci. 2017; 36(7): pp. 1386–1394. (In Chinese). [CrossRef]
- Balík J, Kulhánek M, Černý J, et al. Potassium fractions in soil and simple K balance in long-term fertilising experiments. Soil. Water. Res. 2020: 15 (4): pp. 211—219. [CrossRef]
- Xu YL, Jin ZL, Liu TX, et al. Effects of long-term fertilization practices on heavy metal cadmium accumulation in the surface soil and rice plants of double-cropping rice system in Southern China. Ecol. Environ. Sci. 2018; 25(20): pp. 19836-19844. (In Chinese). [CrossRef]
- Hussain B, Li J, Ma Y, et al. A Field evidence of Cd, Zn and Cu accumulation in soil and rice grains after long-term (27 years) application of swine and green manures in a paddy soil. Sustainability. 2021; 13(4): 2404. [CrossRef]
- Li SH, Zeng XB, Li LF, et al. Distribution characteristics of heavy metals in soil profile of facility vegetable fields. J Appl Ecol. 2010; 21 (9): pp. 2397-2402. (In Chinese).
- Zhen, H., Jia, L., Huang, C, et al. Long-term effects of intensive application of manure on heavy metal pollution risk in protected-field vegetable production. Environ. Pollut. 2020; 263:114552. [CrossRef]
- Wang Q, Zhang J, Zhao B, et al. The influence of long-term fertilization on cadmium (Cd) accumulation in soil and its uptake by crops. Environ. Sci. Pollut. Res. 2014; 21(17): pp. 10377-10385. [CrossRef]
- Guan DX, Sun FS, Yu GH, et al. Total and available metal concentrations in soils from six long-term fertilization sites across China. Environ. Sci. Pollut. Res. 2018; 25(31): pp. 31666-31678. [CrossRef]
- Kalkhajeh YK, Huang B, Hu W, 2021. Impact of preferential flow pathways on phosphorus leaching from typical plastic shed vegetable production soils of China. Agric. Ecosyst. Environ. 2021; 307: 107218. [CrossRef]
- Zhang S, Yang X, Hsu LC, et al. 2021. Soil acidification enhances the mobilization of phosphorus under anoxic conditions in an agricultural soil: Investigating the potential for loss of phosphorus to water and the associated environmental risk. Sci. Total. Environ. 2021; 793:148531. [CrossRef]
- Ma S, Kan Z, Qi J, et al. Effects of straw return mode on soil aggregates and associated carbon in the north China plain. Agronomy. 2020; 10(1): 61. [CrossRef]
- Song J, Huang J, Gao JS, et al. Effects of green manure planted in winter and straw returning on soil aggregates and organic matter functional groups in double cropping rice area. J. Appl. Ecol. 2021; 32(2): pp. 564-570. [CrossRef]
- Kalkhajeh YK, Huang B, SØRENSEN H, et al. Phosphorus accumulation and leaching risk of greenhouse vegetable soils in Southeast China. Pedosphere, 2021; 31(5): pp. 683-693. [CrossRef]
Figure 1.
Protein contents of wheat (a) and rice (b) grains under different treatments. Values are the means with standard deviations shown by vertical bars (n = 3). CK: control; CF: conventional fertilization; OF: optimized fertilization; T1: organic fertilizer replacing 25% of OF; T2: organic fertilizer replacing 50% of OF; M1: organic N replacing 25% of OF-N; M2: organic N replacing 50% of OF-N.
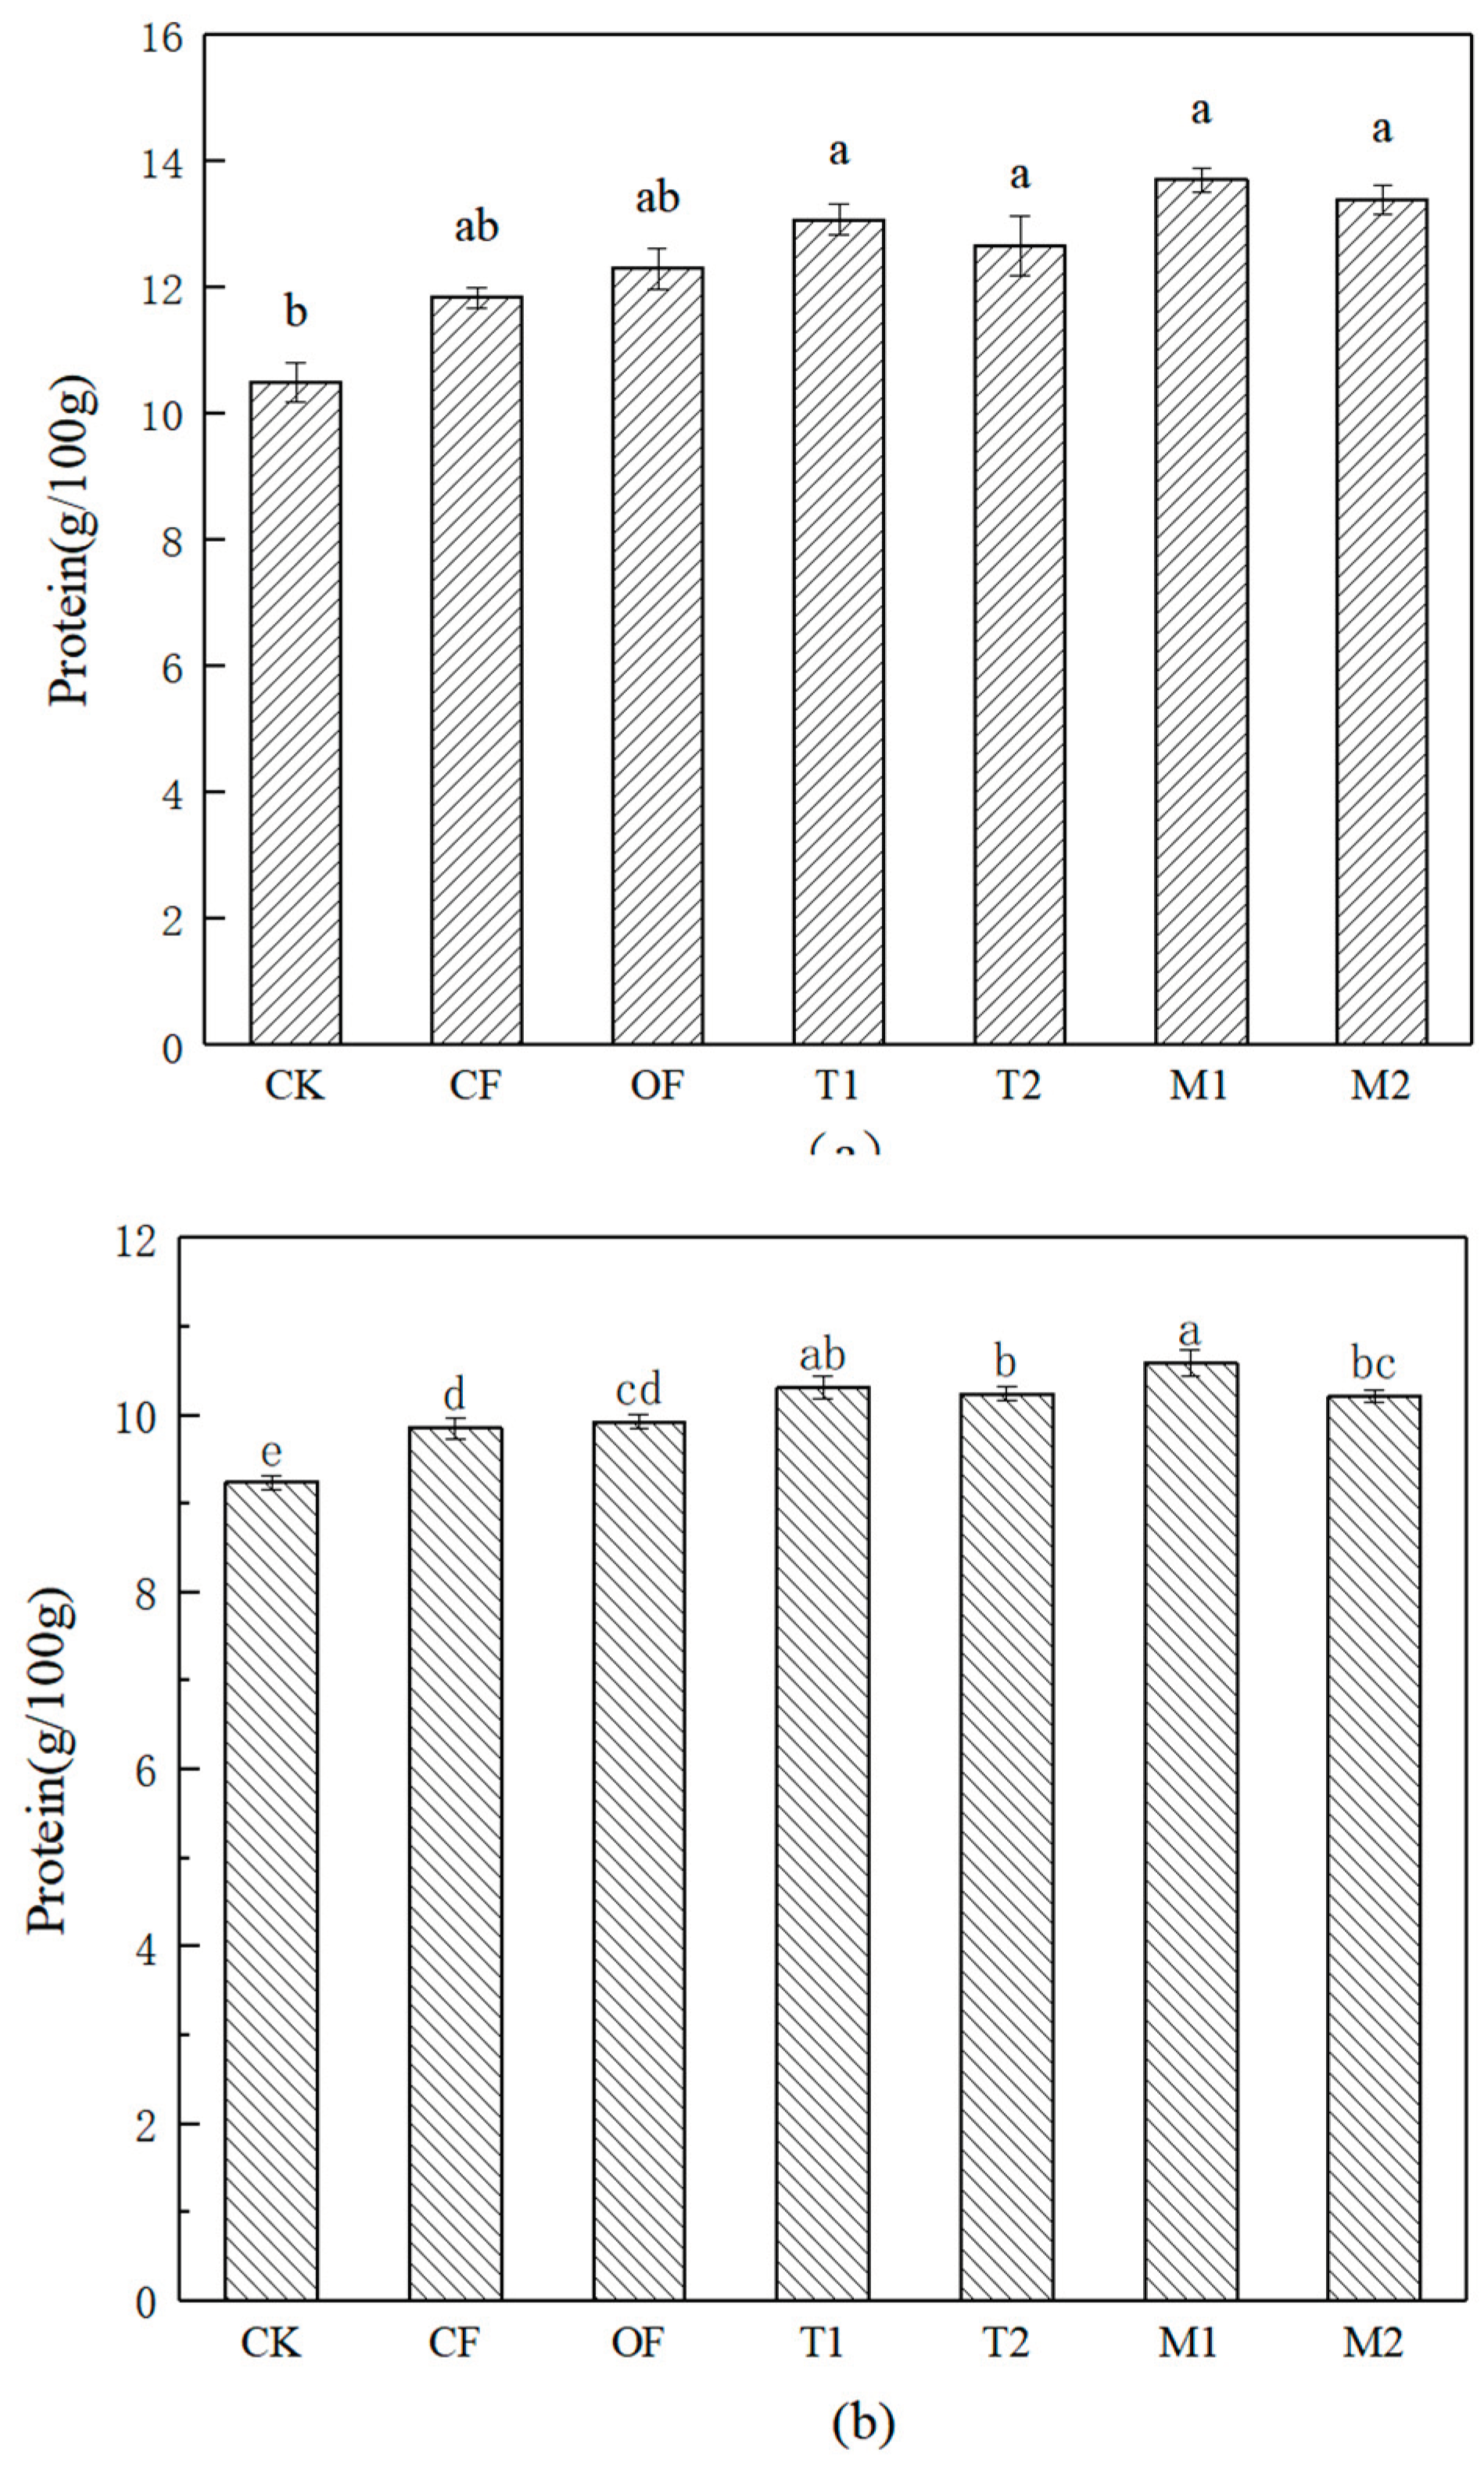
Figure 2.
Soil pH and CEC contents in wheat (a) and rice (b) seasons under different treatments. Values are the means with standard deviations shown by vertical bars (n = 3). CK: control; CF: conventional fertilization; OF: optimized fertilization; T1: organic fertilizer replacing 25% of OF; T2: organic fertilizer replacing 50% of OF; M1: organic N replacing 25% of OF-N; M2: organic N replacing 50% of OF-N.
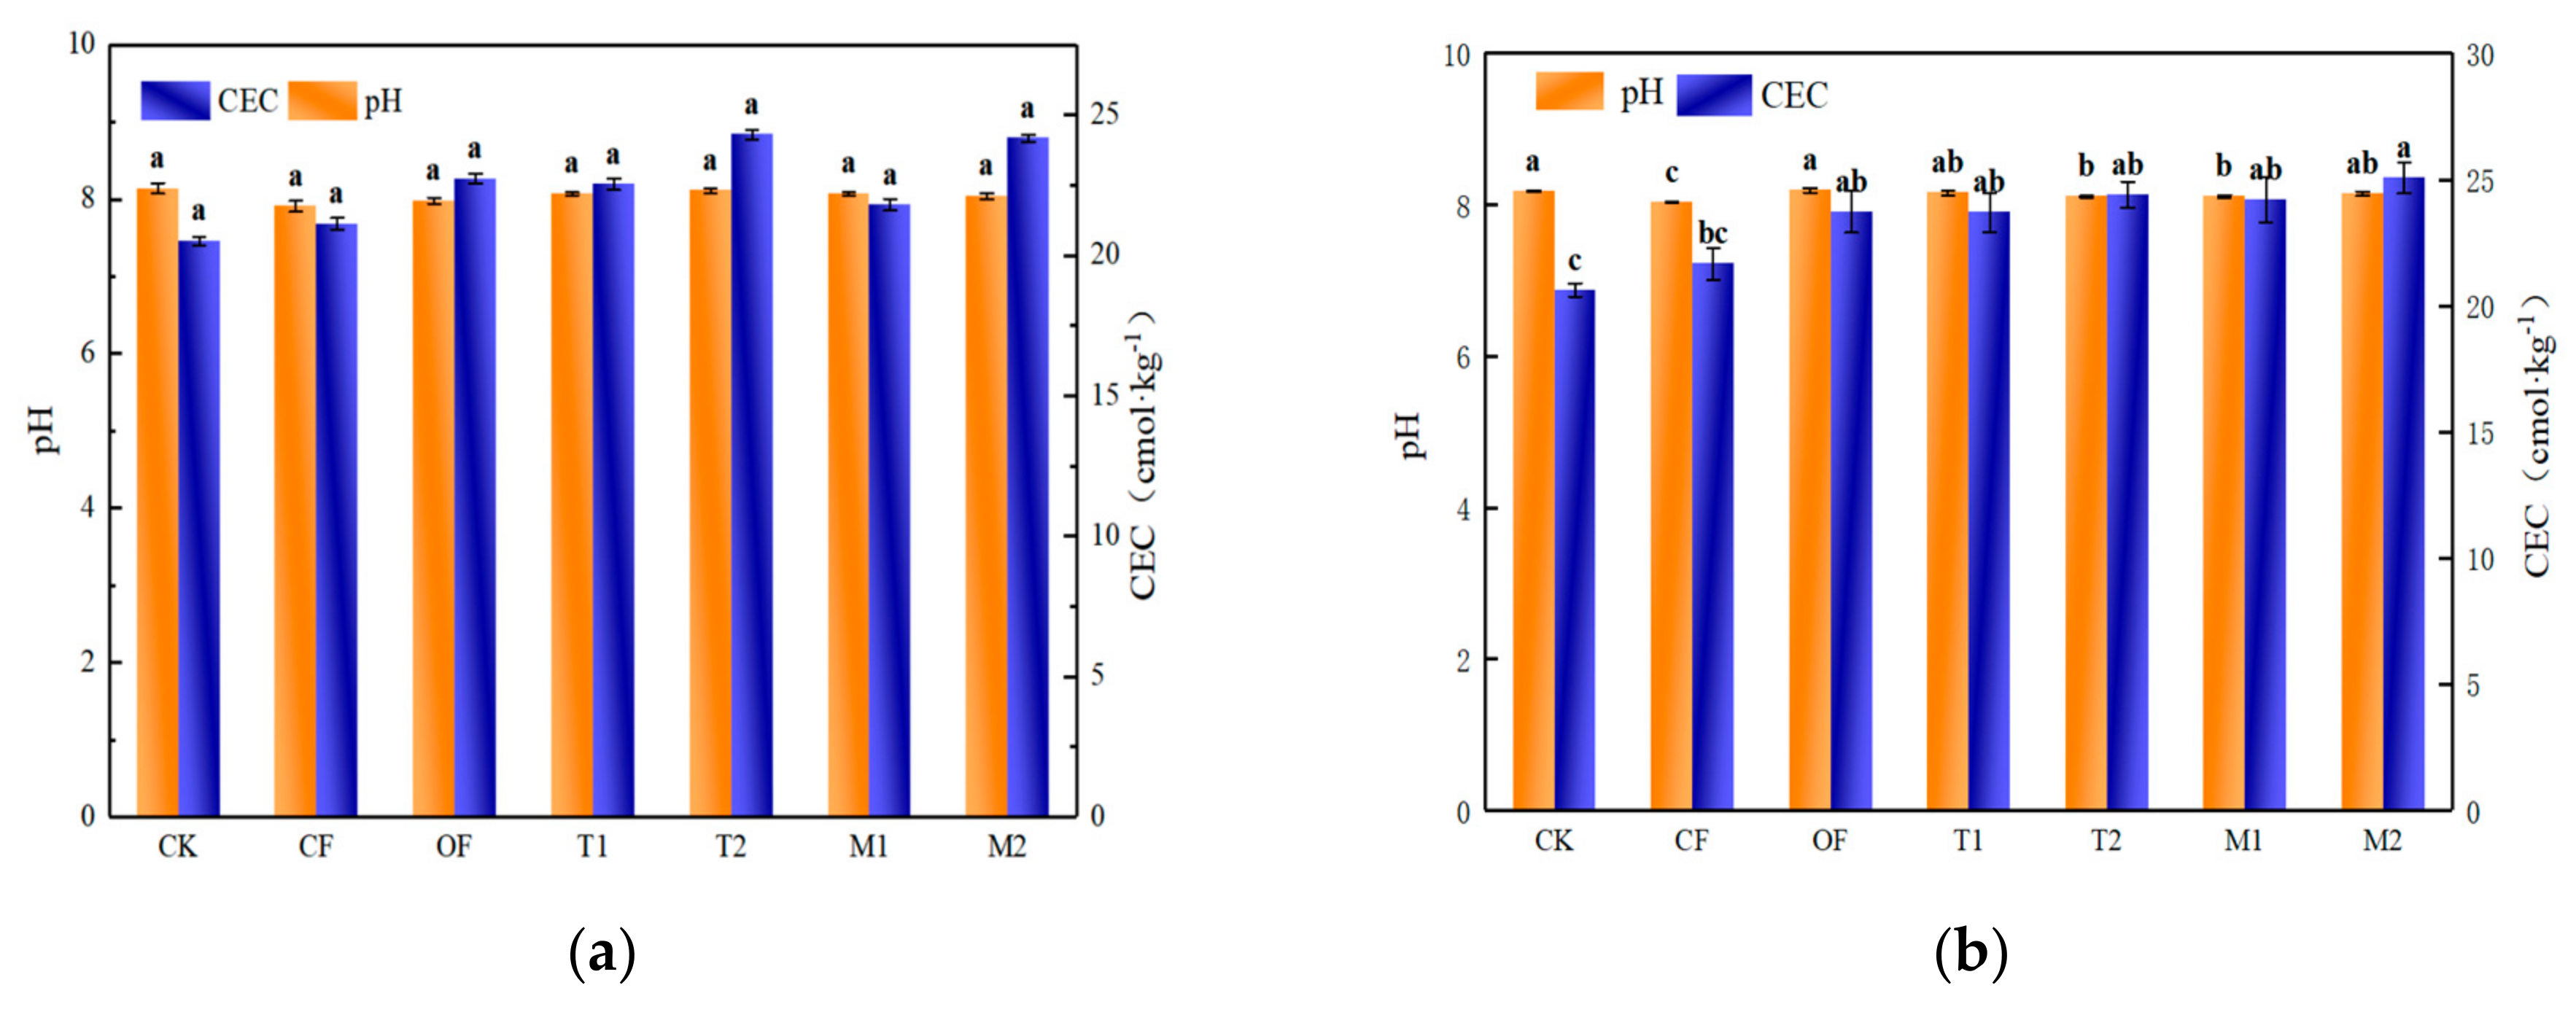
Figure 3.
Soil TP and AP contents in wheat (a) and rice (b) seasons under different treatments. Values are the means with standard deviations shown by vertical bars (n = 3). CK: control; CF: conventional fertilization; OF: optimized fertilization; T1: organic fertilizer replacing 25% of OF; T2: organic fertilizer replacing 50% of OF; M1: organic N replacing 25% of OF-N; M2: organic N replacing 50% of OF-N.

Figure 4.
Soil TK and AK contents in wheat (a) and rice (b) seasons under different treatment conditions. Values are the means with standard deviations shown by vertical bars (n = 3). CK: control; CF: conventional fertilization; OF: optimized fertilization; T1: organic fertilizer replacing 25% of OF; T2: organic fertilizer replacing 50% of OF; M1: organic N replacing 25% of OF-N; M2: organic N replacing 50% of OF-N.
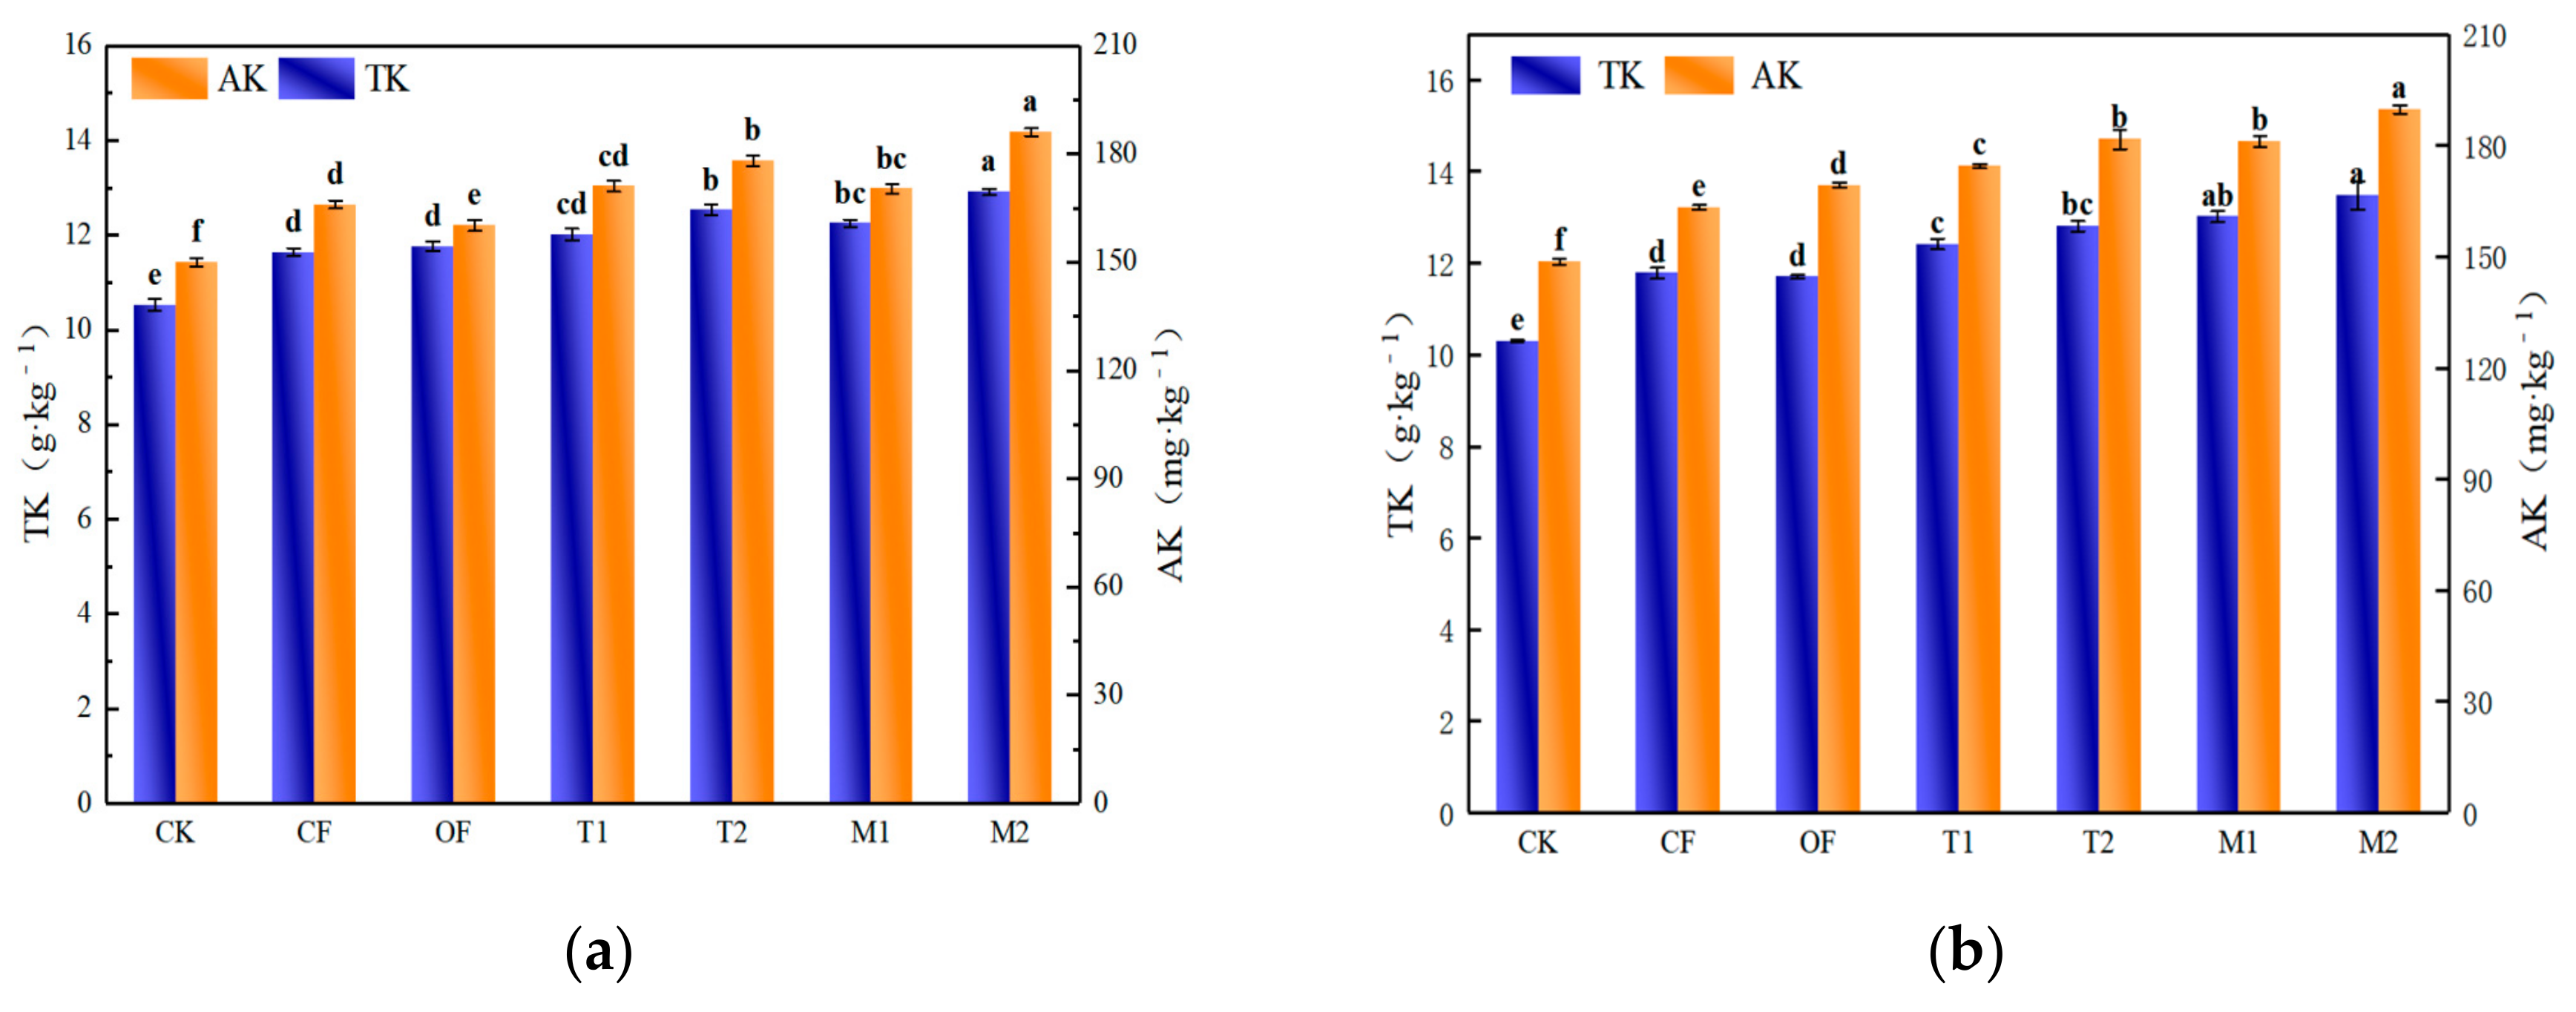
Figure 5.
Total Cd and DTPA-Cd contents in wheat (a) and rice (b) seasons under different treatment conditions. CK: control; CF: conventional fertilization; OF: optimized fertilization; T1: organic fertilizer replacing 25% of OF; T2: organic fertilizer replacing 50% of OF; M1: organic N replacing 25% of OF-N; M2: organic N replacing 50% of OF-N.
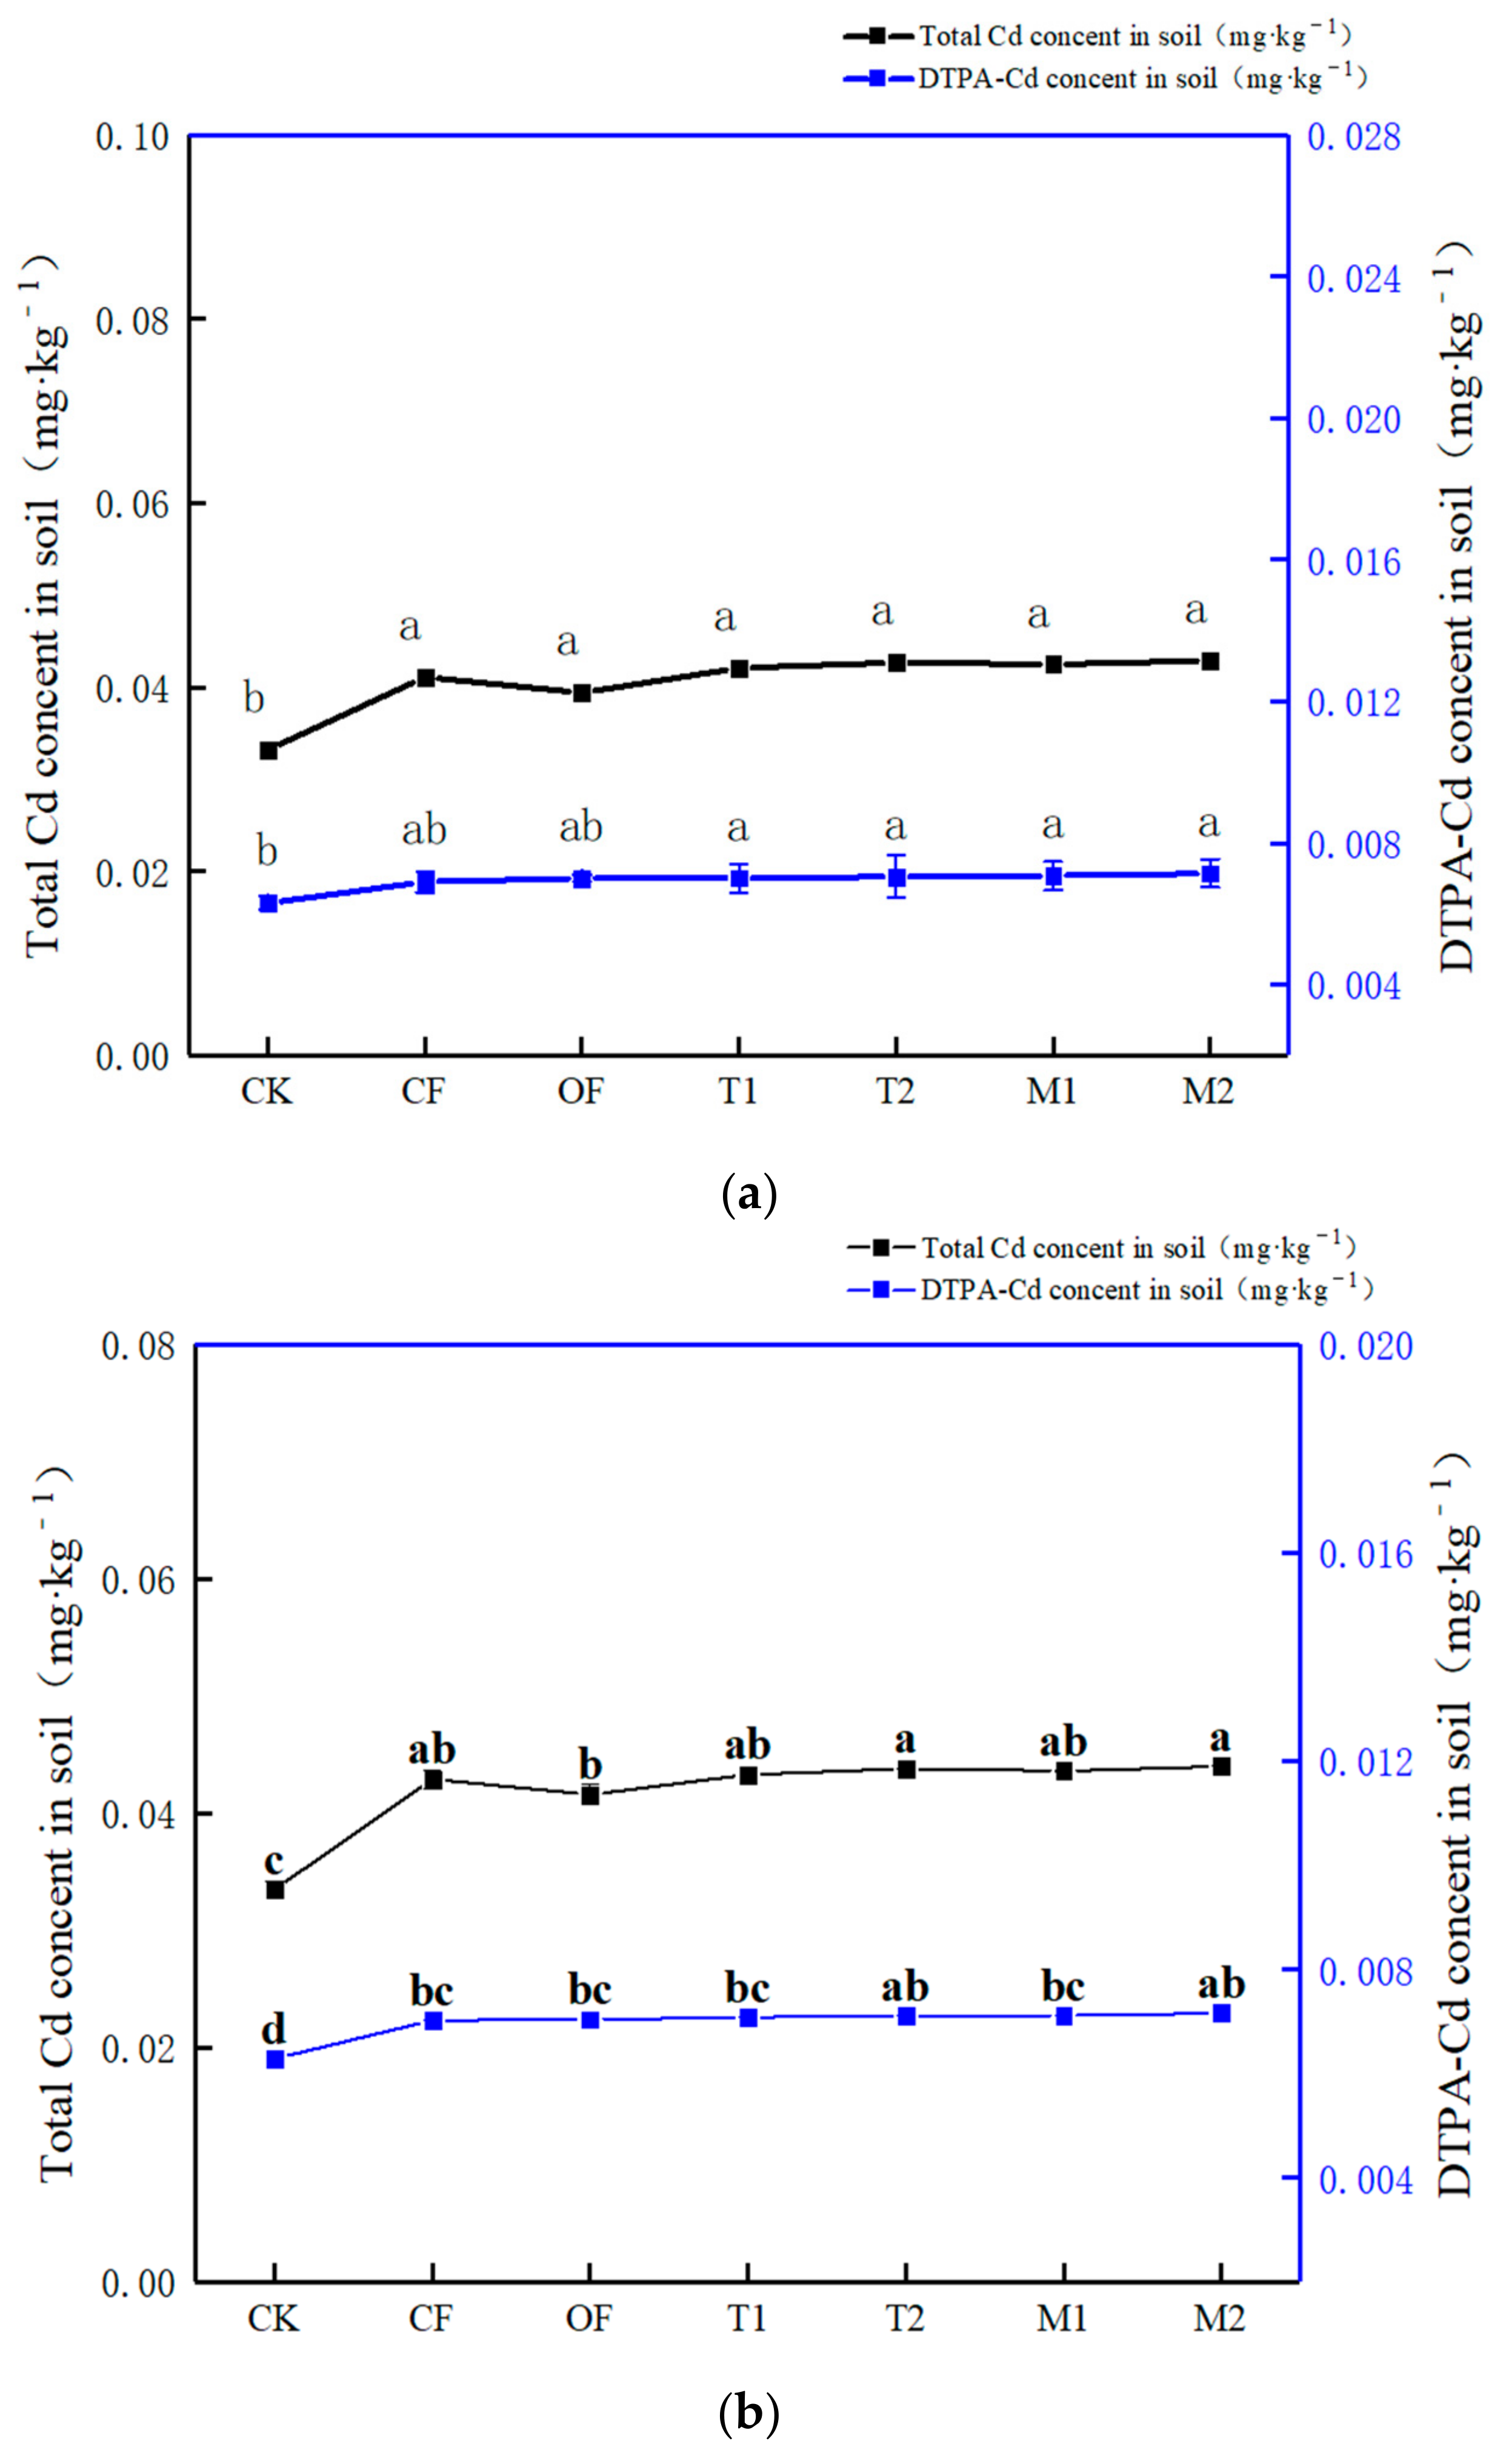

Table 1.
Physical and chemical properties of Feidong paddy soils.
| pH | CEC (cmol kg−1) |
TP (g kg−1) |
AP (mg kg−1) |
TK (g kg−1) |
AK (mg kg−1) |
Total Cd (mg kg−1) |
DTPA Cd (mg kg−1) |
|---|---|---|---|---|---|---|---|
| 7.52 | 23.1 | 0.31 | 16 | 8.89 | 157 | 0.033 | 0.006 |
CEC: cation exchange capacity; TP: total phosphorus; AP: available phosphorus; TK: total potassium; AK: available potassium; Cd: cadmium; DTPA: diethylenetriamine pentaacetate.
Table 2.
Fertilizer types and dosages for different treatments in the wheat season (kg ha−1).
| Treatment | Organic fertilizer | Urea | Superphosphate | Potassium chloride | Converted to major nutrients | |||||
|---|---|---|---|---|---|---|---|---|---|---|
| Base fertilizer | Topdressing | Base fertilizer | Topdressing | Base fertilizer | Topdressing | N | P2O5 | K2O | ||
| CK | 0 | 0 | 0 | 0 | 0 | 0 | 0 | 0 | 0 | 0 |
| CF | 0 | 237 | 158 | 937 | 0 | 187.5 | 0 | 181.5 | 112.5 | 112.5 |
| OF | 0 | 249.6 | 166.4 | 625 | 0 | 131 | 0 | 191.4 | 75 | 78.75 |
| T1 | 2815 | 187.2 | 124.8 | 353 | 0 | 72.1 | 0 | 191.4 | 75 | 78.75 |
| T2 | 5629 | 124.8 | 83.2 | 81 | 0 | 13 | 0 | 191.4 | 75 | 78.75 |
| M1 | 2815 | 187.2 | 124.8 | 625 | 0 | 131 | 0 | 191.4 | 107.6 | 114.2 |
| M2 | 5629 | 124.8 | 83.2 | 625 | 0 | 131 | 0 | 191.4 | 140.29 | 149.7 |
CK: control; CF: conventional fertilization; OF: optimized fertilization; T1: organic fertilizer replacing 25% of OF; T2: organic fertilizer replacing 50% of OF; M1: organic N replacing 25% of OF-N; M2: organic N replacing 50% of OF-N.
Table 3.
Fertilizer types and dosages for different treatments in the rice season (kg ha−1).
| Treatment | Organic fertilizer | Urea | Superphosphate | Potassium chloride | Converted to major nutrients | |||||
|---|---|---|---|---|---|---|---|---|---|---|
| Base fertilizer | Topdressing | Base fertilizer | Topdressing | Base fertilizer | Topdressing | N | P2O5 | K2O | ||
| CK | 0 | 0 | 0 | 0 | 0 | 0 | 0 | 0 | 0 | 0 |
| CF | 0 | 196 | 130 | 562.5 | 0 | 112.5 | 0 | 150 | 67.5 | 67.5 |
| OF | 0 | 274 | 183 | 500 | 0 | 150 | 0 | 210 | 60 | 90 |
| T1 | 3088 | 205 | 137 | 201.5 | 0 | 85 | 0 | 210 | 60 | 90 |
| T2 | 6176 | 137 | 92 | 0 | 0 | 20 | 0 | 210 | 72 | 90 |
| M1 | 3088 | 205 | 137 | 500 | 0 | 150 | 0 | 210 | 96 | 129 |
| M2 | 6176 | 137 | 92 | 500 | 0 | 150 | 0 | 210 | 132 | 168 |
CK: control; CF: conventional fertilization; OF: optimized fertilization; T1: organic fertilizer replacing 25% of OF; T2: organic fertilizer replacing 50% of OF; M1: organic N replacing 25% of OF-N; M2: organic N replacing 50% of OF-N.
Table 4.
The effects of different replacement rates of organic fertilizer on wheat yield.
| Treatment | Effective panicle number per m2 (× 104 ha−1) |
Grains per panicle (No) | 1000-grain weight (g) | Grain yield (kg ha−1) |
|---|---|---|---|---|
| CK | 268 ± 13.3d | 30 ± 0.75e | 41.8 ± 0.25a | 3800 ± 82.3f |
| CF | 294 ± 5.25cd | 34 ± 0.34d | 42.1 ± 0.25a | 4390 ± 80.1e |
| OF | 385 ± 24.6a | 38.2 ± 1.39ab | 41.8 ± 0.28a | 5300 ± 63.7a |
| T1 | 349 ± 8.36ab | 34 ± 0.38d | 42.5 ± 0.40a | 4970 ± 73.8bc |
| T2 | 284 ± 13.8cd | 40.4 ± 0.52a | 42.2 ± 0.18a | 4670 ± 81.8d |
| M1 | 365 ± 11.9ab | 35.6 ± 0.46cd | 41.5 ± 0.30a | 5200 ± 84.6ab |
| M2 | 324 ± 13.5bc | 36.6 ± 0.64bc | 42.5 ± 0.32a | 4860 ± 81.8cd |
CK: control; CF: conventional fertilization; OF: optimized fertilization; T1: organic fertilizer replacing 25% of OF; T2: organic fertilizer replacing 50% of OF; M1: organic N replacing 25% of OF-N; M2: organic N replacing 50% of OF-N. Numbers followed by the different lowercase letters in the same column are significantly different at P < 0.05.
Table 5.
The effects of different replacement rates of organic fertilizer on rice yield.
| Treatment | Effective spike (106 ha−1) |
Grains per panicle (No) | 1000-grain weight (g) | Grain yield (kg ha−1) |
|---|---|---|---|---|
| CK | 1.99 ± 0.08d | 121 ± 3.11d | 24.1 ± 0.25d | 6220 ± 90d |
| CF | 2.34± 0.04c | 126 ± 1.29c | 24.6 ± 0.25bcd | 6670 ± 50c |
| OF | 2.37 ± 0.08c | 132 ± 2.63bc | 24.5 ± 0.28cd | 6840 ± 140c |
| T1 | 2.64 ± 0.07ab | 135 ± 1.76bc | 25.2 ± 0.18abc | 7520 ± 50ab |
| T2 | 2.57 ± 0.09bc | 132 ± 3.30bc | 25.4 ± 0.28ab | 7380 ± 50b |
| M1 | 2.87 ± 0.10a | 143 ± 1.99a | 25.5 ± 0.32a | 7900 ± 220a |
| M2 | 2.68 ± 0.03ab | 139 ± 2.43b | 24.6 ± 0.30bcd | 7710 ± 150ab |
CK: control; CF: conventional fertilization; OF: optimized fertilization; T1: organic fertilizer replacing 25% of OF; T2: organic fertilizer replacing 50% of OF; M1: organic N replacing 25% of OF-N; M2: organic N replacing 50% of OF-N. Numbers followed by the different lowercase letters in the same column are significantly different at P < 0.05.
Disclaimer/Publisher’s Note: The statements, opinions and data contained in all publications are solely those of the individual author(s) and contributor(s) and not of MDPI and/or the editor(s). MDPI and/or the editor(s) disclaim responsibility for any injury to people or property resulting from any ideas, methods, instructions or products referred to in the content. |
© 2024 by the authors. Licensee MDPI, Basel, Switzerland. This article is an open access article distributed under the terms and conditions of the Creative Commons Attribution (CC BY) license (https://creativecommons.org/licenses/by/4.0/).
Copyright: This open access article is published under a Creative Commons CC BY 4.0 license, which permit the free download, distribution, and reuse, provided that the author and preprint are cited in any reuse.


