Submitted:
06 March 2024
Posted:
08 March 2024
You are already at the latest version
Abstract
Background: Visual acuity (VA) assessments are crucial in ophthalmology but traditionally rely on in-clinic evaluations. The emergence of telemedicine has spurred interest in creating dependable self-administered VA tests for use beyond standard clinical environments. This study evaluates the practicality and validity of a self-administered Near VA card test against traditional Snellen and Rosenbaum Pocket Vision Screener (RPVS) methods for home monitoring and enhancing clinical workflow.
Methods: In a cross-sectional study a near VA card (Hadassah Self-Visual Acuity Screener-HSVA) was developed with written and videotaped instructions for self-use. Patients with a minimal best corrected VA (BCVA) of 1.0 LogMAR in at least one eye were recruited from Ophthalmology and Optometry clinics. Outcomes included mean BCVA difference between the self-administered and those obtained by the examiner, and correlations among BCVA values obtained by Snellen, RPVS, HSVA and previous distance BCVA according to the patient electronic medical records.
Results: A total of 275 participants (mean age: 42.5±19.4 years, range: 18-89 years, 47% female) were included. Test-retest reliability analysis for the HSVA demonstrated very good correlation and repeatability (n=38 patients.; Rs=1.0, P
Keywords:
Visual acuity
; near chart
; self-assessment
; development
; validation
1. Introduction:
Home monitoring and self-testing are a major current focus in medicine. The COVID-19 pandemic prompted the integration of telemedicine into ophthalmology practice, known as teleophthalmology [1], whereby healthcare providers had to adapt creative approaches to ensure effective diagnosis and treatment while safeguarding patients and medical staff [2]. Remote assessment of visual function is an important area of research that requires the development of home-based, patient-oriented technologies [3].
Remote patient monitoring, facilitated by home-based systems, holds the potential to enhance accessibility to healthcare services and improve patient outcomes across a wide range of ocular conditions, mainly in patients with chronic eye conditions or lack of access to office-based examination. Additionally, home monitoring can enhance the quality of care, leading to improved outcomes and reduced healthcare costs [4].
Visual acuity (VA) is a fundamental measure of visual function in clinical practice [5]. This is the initial test that is performed in the clinic [6] that gives an indication of refractive error, media abnormalities, macular function, and integrity of the visual pathways [7]. The Snellen chart, featuring standardized black symbols on a white background, is commonly used to measure VA in ophthalmology [7]. Snellen charts may be used at distance (6 meters) or near (40 cm) [8,9]. It is important to recognize that impaired near vision can have a significant impact on quality of life, similar to the effects of decreased distance vision [10]. Furthermore, there is a strong correlation between distance VA and near VA [11,12], as measured with the Rosenbaum Pocket Vision Screener (RPVS), which is a commonly used Snellen-based near card in ophthalmology practice [3].
Various digital tools have emerged in recent years to monitor patients’ VA [13] including smartphone-based applications such as V@home [14], Peek Acuity [15], GoCheck Kids [1], Sightbook [16], TreC Oculistica [17], the web-based index test [18], the Pocket Vision Screener [19], self-administered tests as Early Treatment Diabetic Retinopathy Study (ETDRS) home VA test [2] and the Accustat® [20] and even the first smart TV-based VA test, the Democritus Digital Visual Acuity Test (DDiVAT) [21]. However, though a low mean difference between digital tools to the standard charts and clinical equivalence indication was previously reported, the wide 95% limits of agreement revealed lower precision of the digital self-assessments, especially in patients with decreased VA [22]. Moreover, in technologically challenged populations, digital tools may not be effective.
The necessity to develop a new VA card test for self-use and home-monitoring stems from the limitations observed in both traditional in-clinic assessments and existing digital tools for VA measurement. Traditional methods, such as the Snellen and RPVS, require in-person visits to healthcare facilities, posing challenges for individuals with mobility issues, chronic conditions, or those residing in remote areas. Digital tools, despite their innovation, have shown variability in precision, particularly in patients with reduced VA, and may not be accessible or user-friendly for all populations, especially those with technological limitations. The COVID-19 pandemic further underscored the importance of remote healthcare capabilities, including teleophthalmology, emphasizing the need for reliable, non-digital, self-administered VA tests. The “Hadassah Self-Visual Acuity Screener” (HSVA) was thus developed to address these gaps, offering a practical solution for consistent, accurate home-based VA monitoring and reducing dependency on clinical visits, thereby enhancing healthcare accessibility and efficiency.
The objective of this study was to create and validate a user-friendly non-digital Near VA card test, the HSVA, that will enable card-based, self-monitoring of VA. This may be particularly effective for patients living in peripheral areas with limited availability to medical service or patients with chronic or recurring eye diseases, reducing the need for formal, medical staff-based VA testing during clinic visits and improving patient flow.
2. Methods:
2.1. Setting:
Institutional cross-sectional study
2.2. Participants:
This study received approval from the institutional Helsinki committee of Hadassah Medical Center (study#: HMO-21-152) and the IRB committee of Hadassah Academic College (study#: HAC-220). Prior to participation, all patients were provided with a clear explanation of the study’s objectives and procedures, and they provided written informed consent. All data was coded and analyzed anonymously.
A cohort of individuals who visited the ophthalmology and optometry clinics, as well as their accompanying individuals, were approached to take part in this study. Patients with ocular or systemic pathologies were included since we aimed to assess the feasibility of usage in the HSVA for self-monitoring VA of patients with chronic eye diseases. Exclusion criteria encompassed patients with a best-corrected visual acuity (BCVA) lower than 1.0 LogMAR (0.1 decimal) in the better seeing eye, pregnant women, those who refused to participate, and individuals who could not sign the consent form.
2.3. Development of the visual acuity near chart
A novel card that was termed the “Hadassah Self-Visual Acuity Screener” (HSVA) was developed to facilitate near visual acuity assessment (Figure 1). The dimensions of the optotypes were designed to measure the range of VA which is not covered by the RPVS chart. The RPVS was designed to be compatible with the Snellen chart proportion of each optotype at each line adjusted to working distance of 35.56 cm [23], yet does not contain all the current Snellen lines acuities (0.3, 0.7, 0.9 decimal units). In order to address significant gaps between adjacent lines, particularly noticeable in the smaller sized numbers, supplementary lines were introduced in the HSVA card. These additional lines were determined by calculating the average size between each pair of rows on the RPVS chart. Additionally, a column of corresponding decimal units VA was incorporated alongside each row (on 0.3 decimal font size), simplifying the conversion of near visual acuity test results into their distance equivalents. Lastly, the reverse side of the card featured a user-friendly flow-chart (on 0.4 decimal font size) accompanied by written instructions to assist self-testing. Patients with worse VA who could not read the flow chart were instructed to watch the videotaped instructions.
2.3.1. Procedure
During the near test, participants were provided with instructions to wear their habitual reading glasses if they were aged 40 years or older. For participants under the age of 40, if applicable, they were instructed to wear their distance glasses, and each eye was measured separately, with the occlusion of the untested eye. All tests were taken in standardized conditions (dim lighting, computerized Snellen chart calibrated at 6m and near tests were done at 40cm). Overall of 253 patients were recruited at ophthalmology clinics of Hadassah Medical Center and additional 22 at optometry clinics of Hadassah Academic College. To assess the repeatability of the new VA card, 38 patients underwent testing twice with a one- week interval using the Snellen chart, RPVS, and the HSVA. The BCVA of 237 additional patients was measured by ophthalmic technicians using these three tests. Among these patients, 67 individuals received oral instructions and a guiding video for self-test with HSVA card, and their self-VA results were compared to the examination results conducted by a masked ophthalmic technician, who was unaware of their self-test results and examined them individually. To minimize possible variability among examiners, all tests were conducted by a professional eye clinic team, after training the examiners according to a structured protocol. Data on the visual acuity measured in the past months (up to 12 months) by Snellen was available for 87 patients from the cohort and was extracted from the electronic medical records. These previous VA measurements were correlated with the results obtained in the current study.
2.4. Outcome measures
The mean adjusted difference in BCVA (LogMAR units) tested using the HSVA card between the self-administered and those obtained by a masked ophthalmic technician was used to assess accuracy of self-testing. Correlation tests were used to compare the VA values obtained by the Snellen, RPVS, HSVA, and previous clinic vision tests.
2.5. Sample Size Calculation
An initial pilot study performed in 49 participants tested using the distance Snellen chart and the HSVA revealed a sensitivity of 0.85 and a specificity of 0.95 for up to 2 lines of difference between these charts. Assuming a mean difference of 0.021 LogMAR between the office Snellen BCVA and the home self-test of near BCVA [3], precision of 0.10, confidence interval of 0.95 and prevalence of 0.50, a sample size of 109 patients was determined sufficient for a statistically significant comparison of the two methods of VA measurement (Arifin WN. Sample size calculator).
2.6. Statistical analysis
Data normality was tested using the Kolmogorov Smirnov test, and due to non-normally distributions, non-parametric tests were used. All VAs were converted to LogMAR for analysis. Only the right eye of all study participants was included in the analysis [24] due to high correlation between VA of both eyes, and if the right eye of a patient had VA lower than 1.0 LogMAR, in such case the left eye was included. The comparison of the mean visual acuity results of the Snellen, RPVS and HSVA were analyzed using the Wilcoxon test. Also, the self-test HSVA and the result obtained by ophthalmic technician and the VA extracted from the medical records, were analyzed by Wilcoxon test. Bonferroni correction was used for post hoc analysis and multiple comparisons Spearman and Intra-class correlation coefficient (ICC) were applied. Bland and Altman analysis (95% limits of agreement) was used to assess agreement between HSVA and RPVS charts. A linear hierarchical regression was applied to predict the Snellen and the RPVS acuities by the HSVA test, using univariate analysis as well as multivariate analysis while adjusting for age as a confounder. A statistically significant result was considered as p < 0.05 in a two-tailed test. The analysis was performed using SPSS software (IBM SPSS Statistics, Version 27.0, Chicago, IL, US, Armonk, NY, US: IBM Corp).
2.7. Power Analysis
A study including 38 patients for the repeatability tests yielded a power of 83% with α=0.05. For agreement calculation between the visual acuity tests, a sample of 240 participants provided a power of 99% with α=0.05. And 67 patients that were self-tested by the HSVA and were also examined by a masked clinician, provided a power of 91% with α=0.05 (calculated by G*Power calculator version 3.1.9.7).
3. Results
A total of 275 participants were included, with a mean age of 42.5±19.4 years (range 18-89 years) and 110 (47%) of them were women. LogMAR VA ranged between 0.0 to 1.0, with a mean distance VA of 0.15±0.21.
3.1. Test-retest reliability:
Test-retest reliability analysis was done on 38 patients (27 women, 71%, mean age: 28.2±10.9 years) that were tested twice with a one- week interval on the Snellen, RPVS and the HSVA charts. Similar values were recorded for the two repeated tests of each chart (P>0.05), with very good correlations and repeatability (range: Rs=0.99 to Rs=1.0, P<0.001; Table 1).
3.2. Accuracy:
Comparison between the new HSVA test and conventional clinical (reference) tests revealed mean distance BCVA (LogMAR) of an additional 237 participants (140 women,59%, mean age: 42.2±19.4 years) with the Snellen chart (0.15±0.22) were different from RPVS (0.10±0.0; P=0.001) and HSVA (0.09±0.0; P=0.001). Yet, no statistically significant difference was found between the mean RPVS and HSVA results (p=0.10). The ICC of the HSVA to the Snellen chart was 0.33 (Table 2).
3.3. Agreement between HSVA and RPVS charts:
Bland and Altman analysis (95% limits of agreement) was performed to assess the agreement between the HSVA and the RPVS cards. When analyzing the linear regression line of the Bland and Altman scatter plot, the HSVA and RPVS values demonstrated no difference of proportional bias of scatter dots above and below the mean difference line for VA (P=1.0; Figure 2).
3.4. Self-test HSVA:
Comparison of the mean HSVA self-test VA (n=67 patients, 39 women, 58%, mean age: 49.6±20.1 years) to the HSVA obtained by a masked ophthalmic technician revealed similar values (0.10±0.20 and 0.09±0.19, respectively; P=0.17), a very good agreement (Rs=0.87, P<0.001) and ICC of 0.96. (Table 3)
3.5. Self-test vs. electronic medical records:
The distance VA results of 87 patients as documented in their Electronic Medical Records (EMR) in the year prior their participation in the study were compared with the HSVA results obtained by an ophthalmic technician, and in 26 of the patients self-tested VA values were also obtained (Table 4). Results showed that similar VA values were recorded using the Snellen distance charts in previous clinic visits and using the near HSVA by a technician (P=0.12). However, a difference was noted between the distance VA extracted from EMR and the near self-test (P=0.04).
3.6. Prediction analysis:
Table 5 demonstrates the linear hierarchical regression that was applied to predict the Snellen distance and the RPVS near acuities by the results obtained by the HSVA test. On univariate analysis, age predicts the near RPVS VA result (β=0.35, p=0.003; R²=0.13) as well as the distance Snellen VA (β=0.26, p=0.02; R²=0.07. On multivariate analysis, while adjusting for age, the model revealed that HSVA results obtained by a technician predicts on relatively high accuracy the RPVS result (β=0.91, p=0.001; R²=0.88), while the self-test HSVA can predict the distance Snellen VA result (β=0.93, p=0.01; R²=0.36).
4. Discussion:
Here we report the development and validation of a novel near visual acuity (VA) card test that enables self-monitoring against two gold-standard charts. The main distinctive features of this card are the decimal units that are displayed next to each row, which facilitate the conversion of near VA test results into their distance equivalents, the additional lines compared to the standard cards, especially for the smaller-sized numbers that correspond to better VA, and the flow-chart that guides the patients for self-administration of this test.
The HSVA test showed good test-retest reliability, accuracy and agreement of VA assessment with the near RPVS values. These results are consistent with previous studies that reported similar distributions of Jaeger scores and mean LogMAR equivalents between the standard Jaeger test and a new near method (Philippine peso bill) [25]. A recent systematic review of 17 publications that included studies on 13 different digital tools provided a current overview of digital tools for remotely assessing visual function that can be used without assistance of a healthcare professional and evaluated their accuracy. A low mean difference between digital visual acuity assessments and reference charts was reported suggesting clinical equivalence [22].
In the current study, the HSVA test demonstrated moderate correlation with the distance Snellen chart results, but it also demonstrated that the self-test in this card could accurately predict the distance Snellen VA result. This finding are supported by a previous study showing high correlation between the VA measured with near vision digital self-test and the office Snellen acuity test [3]. Wolffsohn and collegues reported a high correlation between distance VA measured with the distance Bailey-Lovie chart, and the near VA measured by the near Bailey-Lovie chart, and the Practical Near Acuity Chart (PNAC), which uses a single paragraph with three simple related words on each line, especially when the patient did not have ocular pathology and the test was performed with high contrast [12]. A similar conclusion was reported by another study that showed good repeatability when comparing distance visual acuity to near visual acuity with a small difference (of half a line) [26]. These results indicate that it is feasible to use a near VA test and extrapolate its results to distance VA.
A key finding of this study was the high correlation between self-test VA by the HSVA and the results obtained by a masked ophthalmic technician. The new HSVA test card was designed to enable patients to self-assess their visual acuity and detect any significant changes that require urgent consultation with an ophthalmologist. Chen and colleagues have recently reported an ICC of 0.94, indicating a strong positive correlation between at-home VA measured with the Accustat® near vision digital self-test and the office Snellen test [20]. Similar findings were found even when patients performed self-testing on an ETDRS chart compared with an in-office test [27]. Xian et al. have also reported good agreement between a mobile application-based VA self-test program and conventional VA tests [28]. Another web-based test was also found to be a valid tool for remotely assessing VA, even when performed independently by patients at home [18]. Even when performing the VA test on a smart TV, there were non-significant VA differences compared with a standard ETDRS test, suggesting that it can be used for accurate VA self-assessment in telemedical settings, both for normal and low-vision patients [21]. A systematic review concerning the utilization of digital instruments for VA assessment revealed a diminished accuracy in digital self-assessments [22]. However, Thirunavukarasu and colleagues have conducted an extensive review, concluding that remote self-administered VA tests show potential. They suggest that further pragmatic trials are necessary to substantiate their implementation in specific contexts, which could enhance the utility of these tests for patient-led or non-specialist assessments. Such deployment could significantly contribute to teleophthalmology, facilitate non-specialist eye evaluations, improve pre-consultation triage, and support autonomous, long-term vision monitoring [13].
The overall high agreement between the HSVA self-test results and the results obtained by the masked examiner suggests that the instructions provided on the back of the card in simple language, along with basic guidance from a clinician at the clinic, allows the self-tested patients to obtain valid results. Near VA methods can facilitate self-monitoring of VA even if there is a discrepancy of one or two lines or 4-7 letters between the self-test results and the results measured by the examiner or to the distance test [2,3,27].
Based on the correspondence between near and distance VA, several tools for near VA assessment were developed for clinical use [29], including apps for self-measurement of VA [30] and a self-test card [31], and their results were found to be suitable and effective for monitoring changes in VA. Hence, the HSVA, which demonstrated consistent results with good repeatability, and was tested in the current study on patients from tertiary ophthalmology clinics, including patients with various eye pathologies, could serve for self-monitoring to detect changes in VA, particularly in patients with chronic eye diseases that are under recurrent treatment (such as patients receiving repeated intravitreal injections of anti-VEGF medications). The HSVA simplify the use of self-VA test with the written and videotaped instructions, the additional lines in the better VA sized numbers and the decimal units next to each row give this test several advantages that are not exist in other printed VA cards.
One of the limitations of this study is the fact that it was developed as a printed version, rather than a digital one. In an era where there are emerging technologies for digital tests and smartphone-based applications to assess visual acuity, it might seem more natural to create another digital tool. However, there are populations that are technologically challenged, such as elderly people with chronic eye conditions, or populations who do not own smartphones due to economic or religious reasons. Thus, to avoid bias and exclusion of potential populations and to maintain the simplicity of the test, it was developed as a non-digital version. Furthermore, as long as the self-administered at home test follows a standardized protocol, it is equivalent to a standard technician-administered VA test in the clinic in the examined population [2]. There is a broad agreement that both smartphone apps and printable materials assessing VA are easy, intuitive to use for patients and also reliable for clinicians [17].
Additionally, although the Early Treatment Diabetic Retinopathy Study (ETDRS) chart is regarded as a more reliable measure, the present study employed the Snellen chart for comparative purposes. This approach is customary in the validation of novel VA charts, where the Snellen chart is utilized as a reference [13]. Furthermore, despite the absence of a standardized protocol for employing Jaeger notation in contemporary near reading cards [32], this metric was adopted due to its continued clinical acceptance and widespread use in numerous countries for daily visual assessment [25].
Another limitation of the HSVA chart is the moderate correlation between the results of the near HSVA test and the results of the standard distance test. A high correlation between these two tests would imply that they are interchangeable, which would be advantageous for clinical practice as an accurate alternative for the standard distance test that can be performed by the patient independently.
However, this study aimed to demonstrate a good agreement between the HSVA and the widely accepted near test with the RPVS, as well as close similarity between the self-test results and the results obtained at the clinic. Accuracy was indeed identified for these two parameters suggesting that substantial VA change (> 2 ETDRS lines) would be identified by both the near and the far test [18]. Finally, Self-administered VA tests may extend their utility beyond the field of ophthalmology, finding relevance in primary care, emergency medicine, and neurology. Further investigation is warranted to delineate the feasible applications of remote VA assessments. While in-person evaluations remain paramount for exhaustive ophthalmological examinations, remote VA testing could enhance healthcare delivery and alleviate pressures on constrained clinical resources, particularly when integrated with other nascent digital health technologies. Validated self-administered VA tests hold promise in enhancing teleophthalmology services, facilitating pre-consultation triage, enabling long-term visual monitoring, and supporting the assessment and documentation of ocular conditions by non-specialists.
5. Conclusions:
In this study we developed and validated a new card for self-test monitoring of near VA. The HSVA incorporates decimal units which are absent in the standard near cards, as well as additional lines to assess high levels of VA, and simple instructions and a video guide for self-testing. Moreover, the study evaluated the agreement of the card with an existing near test and the patient’s self-testing ability, and therefore it can be applied in clinical settings, but with caution that it does not fully represent distance VA. In addition, the study was conducted on participants in a tertiary clinic who represent a wide range of patients with visual impairments, including patients with various eye pathologies, so it may suggest generalizability to healthy subjects in the community. This test may be useful for many patients with chronic eye conditions or limited access to office-based examinations.
Author Contributions
Conceptualization, H.B, E.B, J.L and I.C; Methodology, H.B, E.B, J.L and I.C ; Software, H.B; Formal Analysis, H.B.; Resources, H.B. and I.C; Investigation, M.G, S.A, Y.M, R.H, A.B, and S.S; Data Curation, M.G, S.A, Y.M, R.H, A.B, and S.S; Validation, H.B, E.B, J.L and I.C; Writing – Original Draft Preparation, H.B; Writing – Review & Editing, I.C, J.L. E.B; Project Administration, A.B. Supervision: H.B and I.C. All authors read and approved the final manuscript.
Funding
This research received no specific grant from any funding agency in the public, commercial, or not-for-profit sectors.
Institutional Review Board Statement
This study received approval from the institutional Helsinki committee of Hadassah Medical Center (study#: HMO-21-152) and the IRB committee of Hadassah Academic College (study#: HAC-220).
Informed Consent Statement
Prior to participation, all patients were provided with a clear explanation of the study’s objectives and procedures, and they provided written informed consent. All data was coded and analyzed anonymously.
Data Availability Statement
The datasets generated and/or analyzed during the current study are available from the corresponding author on reasonable request. Additional details regarding the research materials, including the development and instructions for the Hadassah Self-Visual Acuity Screener (HSVA), can also be provided upon request. All data is stored in accordance with ethical guidelines and privacy regulations to ensure the confidentiality and integrity of participant information.
Acknowledgments
The authors thank Dinah Paritzky for proof reading.
Conflicts of Interest
The authors declare no financial disclosures in this study. All authors declare their Consent for publication this manuscript.
Abbreviations:
VA – Visual Acuity
RPVS - Rosenbaum Pocket Vision Screener
HSVA - Hadassah Self-Visual Acuity Screener
BCVA – Best Corrected Visual Acuity
ICC - Intra-class correlation coefficient
ETDRS - Early Treatment Diabetic Retinopathy Study
DDiVAT - Democritus Digital Visual Acuity Test
PNAC - Practical Near Acuity Chart
References
- E. Silverstein, J. S. Williams, J. R. Brown, E. Bylykbashi, and S. S. Stinnett, “Teleophthalmology: Evaluation of Phone-based Visual Acuity in a Pediatric Population,” Am J Ophthalmol, vol. 221, pp. 199–206, 2021. [CrossRef]
- J. Siktberg et al., “Validation of a Standardized Home Visual Acuity Test for Teleophthalmology,” Ophthalmology Science, vol. 1, no. 1, p. 100007, 2021. [CrossRef]
- E. P. Chen et al., “Remote vision testing of central retinal acuity and comparison with clinic-based Snellen acuity testing in patients followed for retinal conditions,” Digit Health, vol. 9, pp. 1–7, 2023. [CrossRef]
- N. M. Holekamp, “Moving from Clinic to Home: What the Future Holds for Ophthalmic Telemedicine,” Am J Ophthalmol, vol. 187, pp. xxviii–xxxv, 2018. [CrossRef]
- A. Arditi and R. Cagenello, “On the Statistical Reliability of Letter-Chart Visual Acuity Measurements,” Invest Ophthalmol Vis Sci, vol. 34, no. 1, pp. 120–129, 1993.
- J. W. H. H Kenneth Walker, W Dallas Hall, Clinical Methods: The History, Physical, and Laboratory Examinations - PubMed, 3rd editio. Boston: Butterworths, 1990.
- D. M. G. Harrison F. Daiber, Visual Acuity. Treasure Island (FL): StatPearls Publishing, 2023.
- R. Hetherinton, “The Shellen Chart as a test of visual acuity,” Psychol Forsch, vol. 357, pp. 349–357, 1954. [CrossRef]
- D. Caltrider, A. Gupta, and K. Tripathy, Evaluation Of Visual Acuity. StatPearls Publishing, Treasure Island (FL), 2021.
- R. R. A. Bourne et al., “Magnitude, temporal trends, and projections of the global prevalence of blindness and distance and near vision impairment : a systematic review and meta-analysis,” Lancet Glob Health, vol. 5, no. (9), pp. e888–e897, 2017. [CrossRef]
- A. L. C. J S Wolffsohn, “The practical near acuity chart (PNAC) and prediction of visual ability at near.” 2000. [CrossRef]
- A. L. C. J S Wolffsohn, “The practical near acuity chart (PNAC) and prediction of visual ability at near - PubMed,” Ophthalmic & physiological optics, vol. 20, no. 2, pp. 90–7, 2000. [CrossRef]
- A. J. Thirunavukarasu, R. Hassan, A. Limonard, and S. V. Savant, “Accuracy and reliability of self-administered visual acuity tests: Systematic review of pragmatic trials,” PLoS One, vol. 18, no. 6, p. e0281847, Jun. 2023. [CrossRef]
- X. Han et al., “Development and Validation of a Smartphone-Based Visual Acuity Test (Vision at Home),” vol. 8, no. 4, 2019. [CrossRef]
- A. Bastawrous et al., “Development and Validation of a Smartphone-Based Visual Acuity Test (Peek Acuity) for Clinical Practice and Community-Based Fieldwork,” JAMA Ophthalmol, vol. 133, no. (8), pp. 930–7, 2015. [CrossRef]
- D. M. Do Gyun Kim, Aaron D Webel, Mark S Blumenkranz, Yonguk Kim, Ji Ho Yang, Seung Young Yu, Hyung Woo Kwak, Daniel Palanker, Brian Toy, “A Smartphone-Based Near-Vision Testing System: Design, Accuracy, and Reproducibility Compared With Standard Clinical Measures,” Ophthalmic Surg Lasers Imaging Retina, vol. 53, no. 2, pp. 79–84, 2022. [CrossRef]
- E. Racano, G. Malfatti, R. Pertile, R. D. Site, F. Romanelli, and A. Nicolini, “A novel smartphone App to support the clinical practice of pediatric ophthalmology and strabismus: the validation of visual acuity tests,” Eur J Pediatr, 2023. [CrossRef]
- J. Claessens, J. Van Egmond, J. Wanten, N. Bauer, R. Nuijts, and R. Wisse, “The Accuracy of a Web-Based Visual Acuity Self-assessment Tool Performed Independently by Eye Care Patients at Home: Method Comparison Study,” JMIR Form Res, vol. 7, 2023. [CrossRef]
- M. Raja, D. Ramamurthy, K. Srinivasan, and L. S. Varadharajan, “Development of Pocket Vision Screener and its effectiveness at screening visual acuity deficits,” Indian J Ophthalmol, vol. 62, no. (12), pp. 1152–5, 2014. [CrossRef]
- E. P. Chen et al., “Remote vision testing of central retinal acuity and comparison with clinic-based Snellen acuity testing in patients followed for retinal conditions,” Digit Health, vol. 9, Jan. 2023. [CrossRef]
- G. Labiris et al., “Development and Validation of the First Smart TV-Based Visual Acuity Test: A Prospective Study,” Healthcare (Basel), vol. 10, no. 11, 2022. [CrossRef]
- J. L. J. Claessens, J. R. Geuvers, S. M. Imhof, and R. P. L. Wisse, “Digital Tools for the Self-Assessment of Visual Acuity: A Systematic Review,” Ophthalmol Ther, vol. 10, no. 4, pp. 715–730, 2021. [CrossRef]
- M. L. Rubin and C. Horton, “Warning on inaccurate Rosenbaum cards for testing near vision,” Surv Ophthalmol, vol. 42, no. 2, 1997. [CrossRef]
- R. A. Armstrong, “Statistical guidelines for the analysis of data obtained from one or both eyes,” Ophthalmic & physiological optics, pp. 7–14, 2013. [CrossRef]
- L. J. Briones, J. P. Gomez, and E. F. Leuenberger, “The Philippine Peso Bill as an Alternative Near Visual Acuity Chart in Filipino Eyes: A Pilot Study,” Clin Ophthalmol, vol. 16, pp. 3437–3445, 2022. [CrossRef]
- P. Cho and G. C. Woo, “Repeatability of the Waterloo Four-Contrast LogMAR Visual Acuity chart and Near Vision Test card on a group of normal young adults,” Ophthalmic & physiological optics, vol. 24, no. 5, pp. 427–435, 2004. [CrossRef]
- T. A. Chen, J. Li, J. M. Schallhorn, and C. Q. Sun, “Comparing a Home Vision Self-Assessment Test to Office-Based Snellen Visual Acuity,” Clinical ophthalmology, vol. 15, pp. 3205–3211, 2021. [CrossRef]
- Y. Xian, Y. Ye, F. Liu, X. Zhou, and J. Zhao, “Agreement between a mobile applet-based visual acuity self-test program and the conventional method for distance and near visual acuity tests,” Clin Exp Ophthalmol, vol. 51, no. 2, pp. 112–121, 2023. [CrossRef]
- D. A. Rosser, D. A. H. Laidlaw, and I. E. Murdoch, “The development of a ‘reduced logMAR’ visual acuity chart for use in routine clinical practice,” Br J Ophthalmol, vol. 85, no. 4, pp. 432–436, 2001. [CrossRef]
- C. J. Brady, A. O. Eghrari, and A. B. Labrique, “Smartphone-Based Visual Acuity Measurement for Screening and Clinical Assessment,” JAMA, vol. 314, no. 24, pp. 2682–2683, 2015. [CrossRef]
- M. D. Cooke et al., “An innovative visual acuity chart for urgent and primary care settings: validation of the Runge near vision card,” Eye (Lond), vol. 33, no. 7, pp. 1104–1110, 2019. [CrossRef]
- “The Jaeger Notation Debate - Precision Vision.” Accessed: Feb. 23, 2024. [Online]. Available: https://precision-vision.com/the-jaeger-notation-debate/.
Figure 1.
The Hadassah Self-Visual Acuity Screener (HSVA). ©Hadassah Medical Organization, 2022.
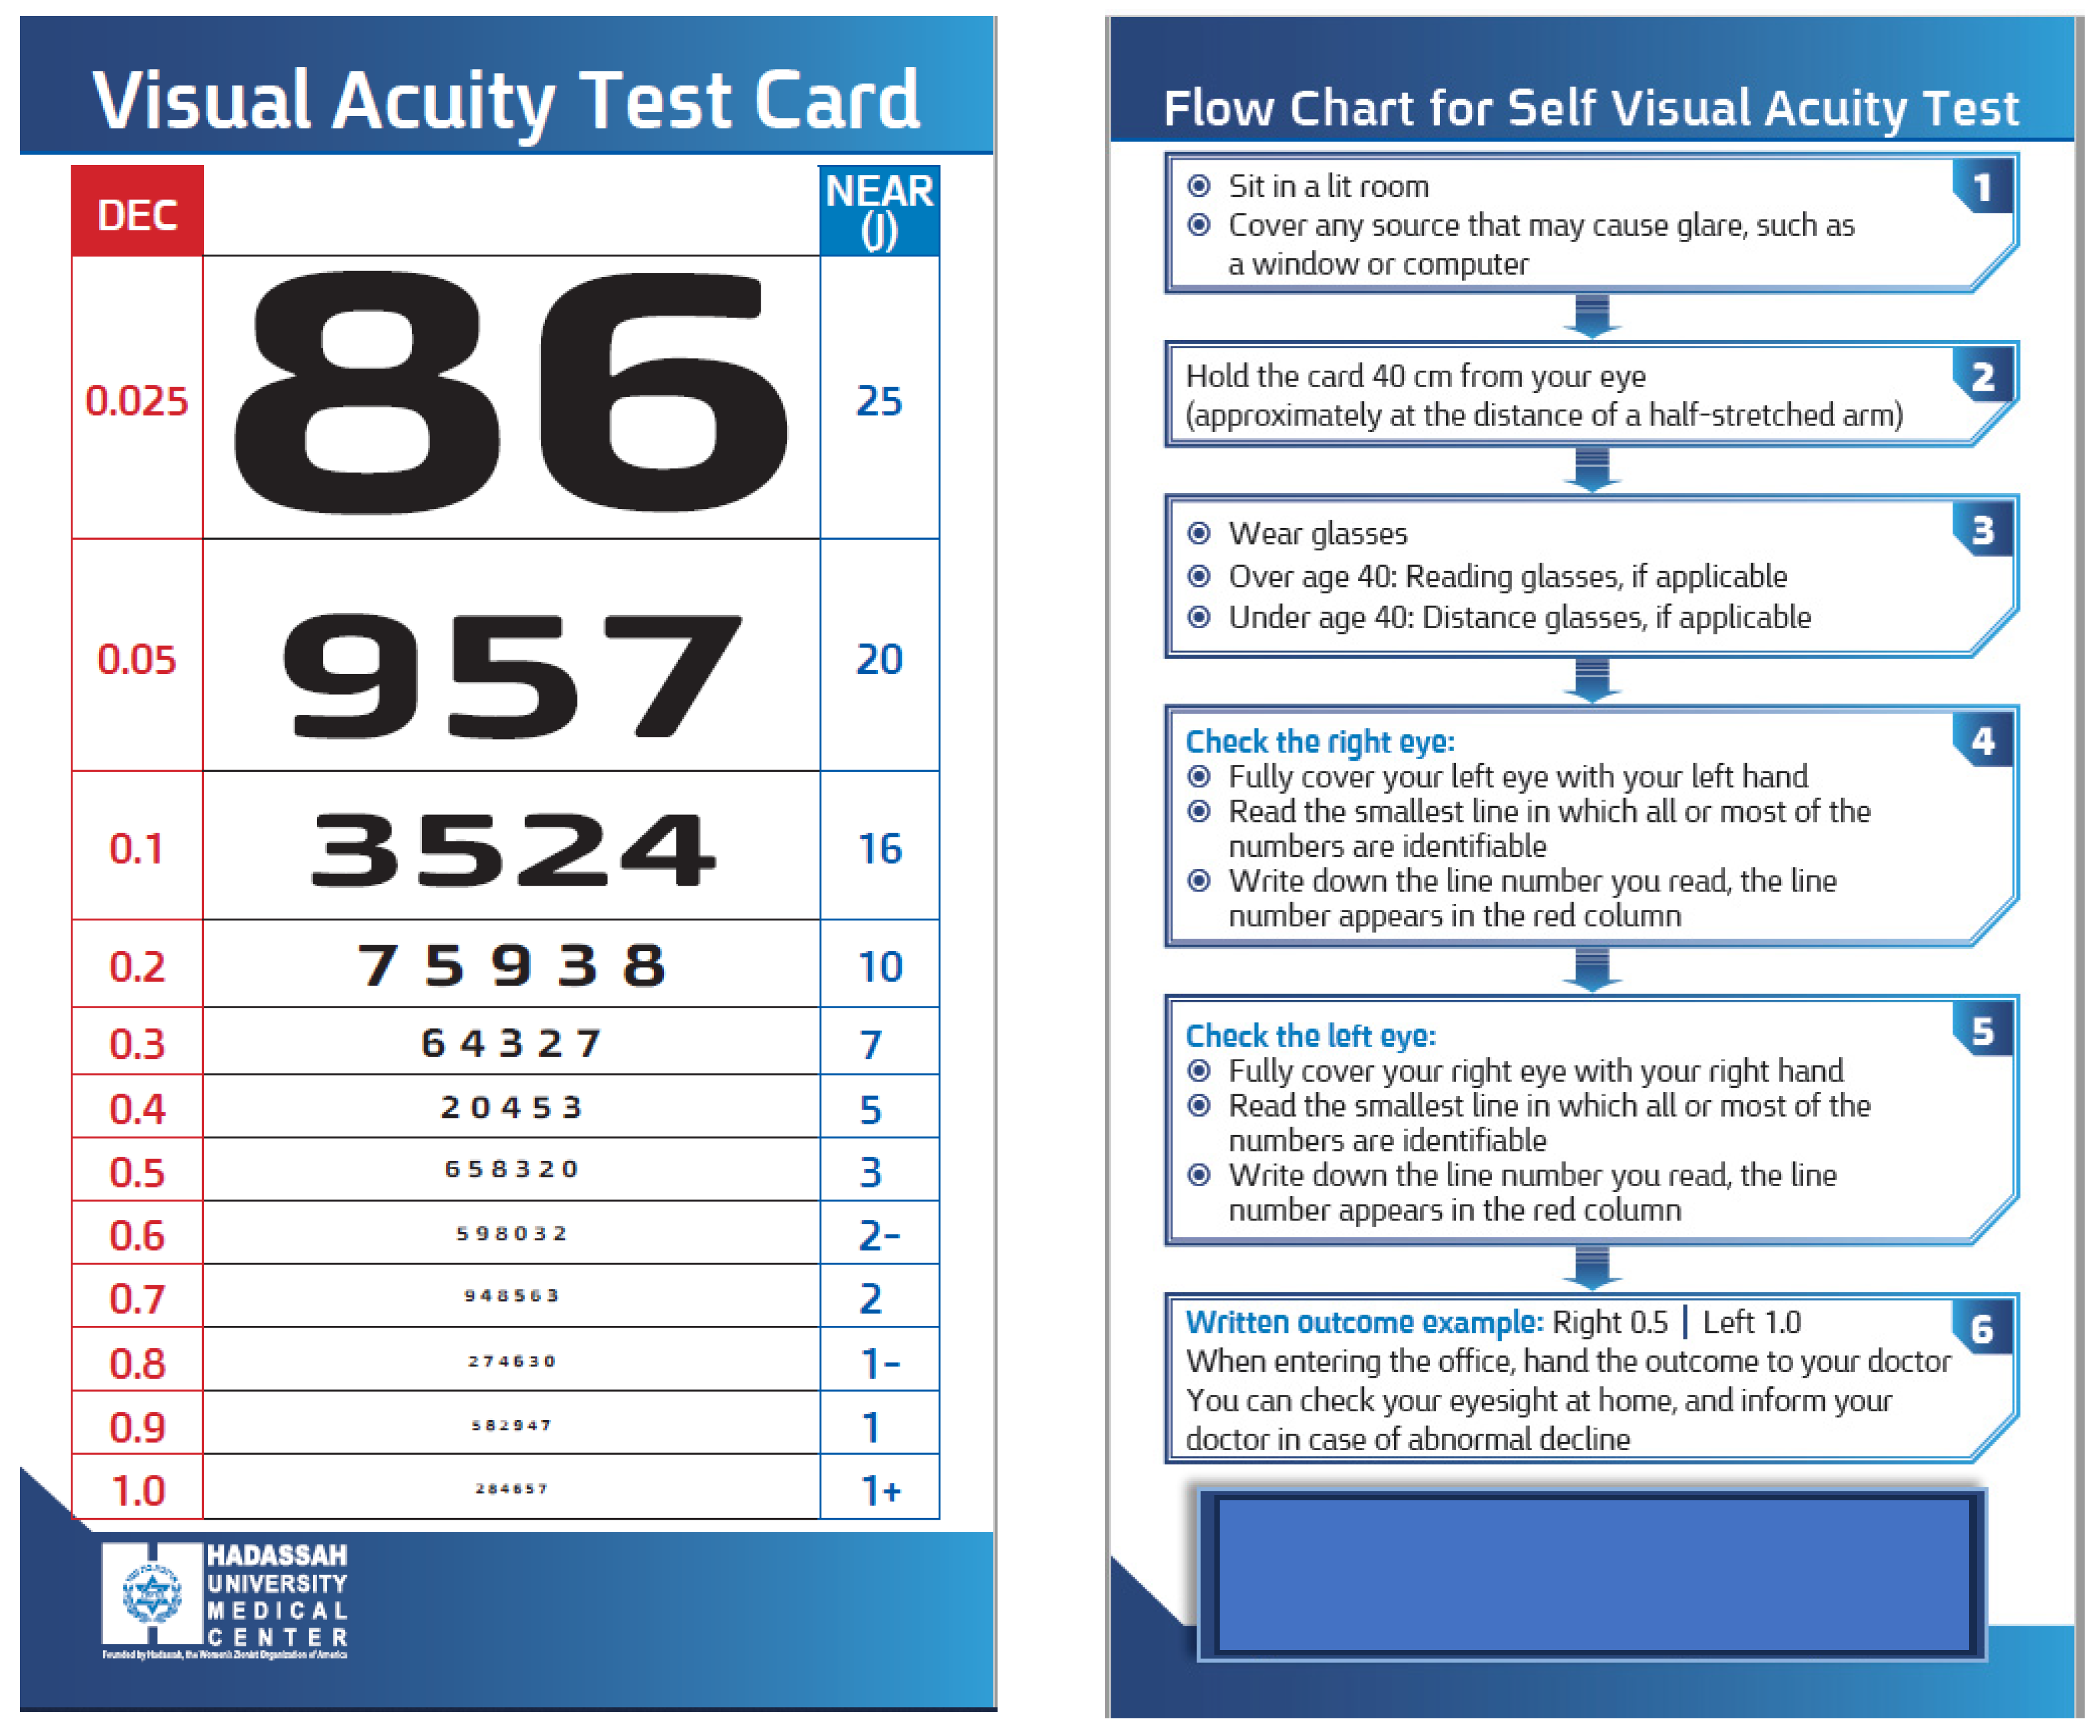
Figure 2.
Bland and Altman agreement analysis of the RPVS and HSVA charts for near visual acuity. 95% limits of agreement. LogMAR units. RPVS= Rosenbaum Pocket Vision Screener; HSVA= Hadassah Self-Visual Acuity Screener. No significant difference between these charts (P=0.10).
Figure 2.
Bland and Altman agreement analysis of the RPVS and HSVA charts for near visual acuity. 95% limits of agreement. LogMAR units. RPVS= Rosenbaum Pocket Vision Screener; HSVA= Hadassah Self-Visual Acuity Screener. No significant difference between these charts (P=0.10).
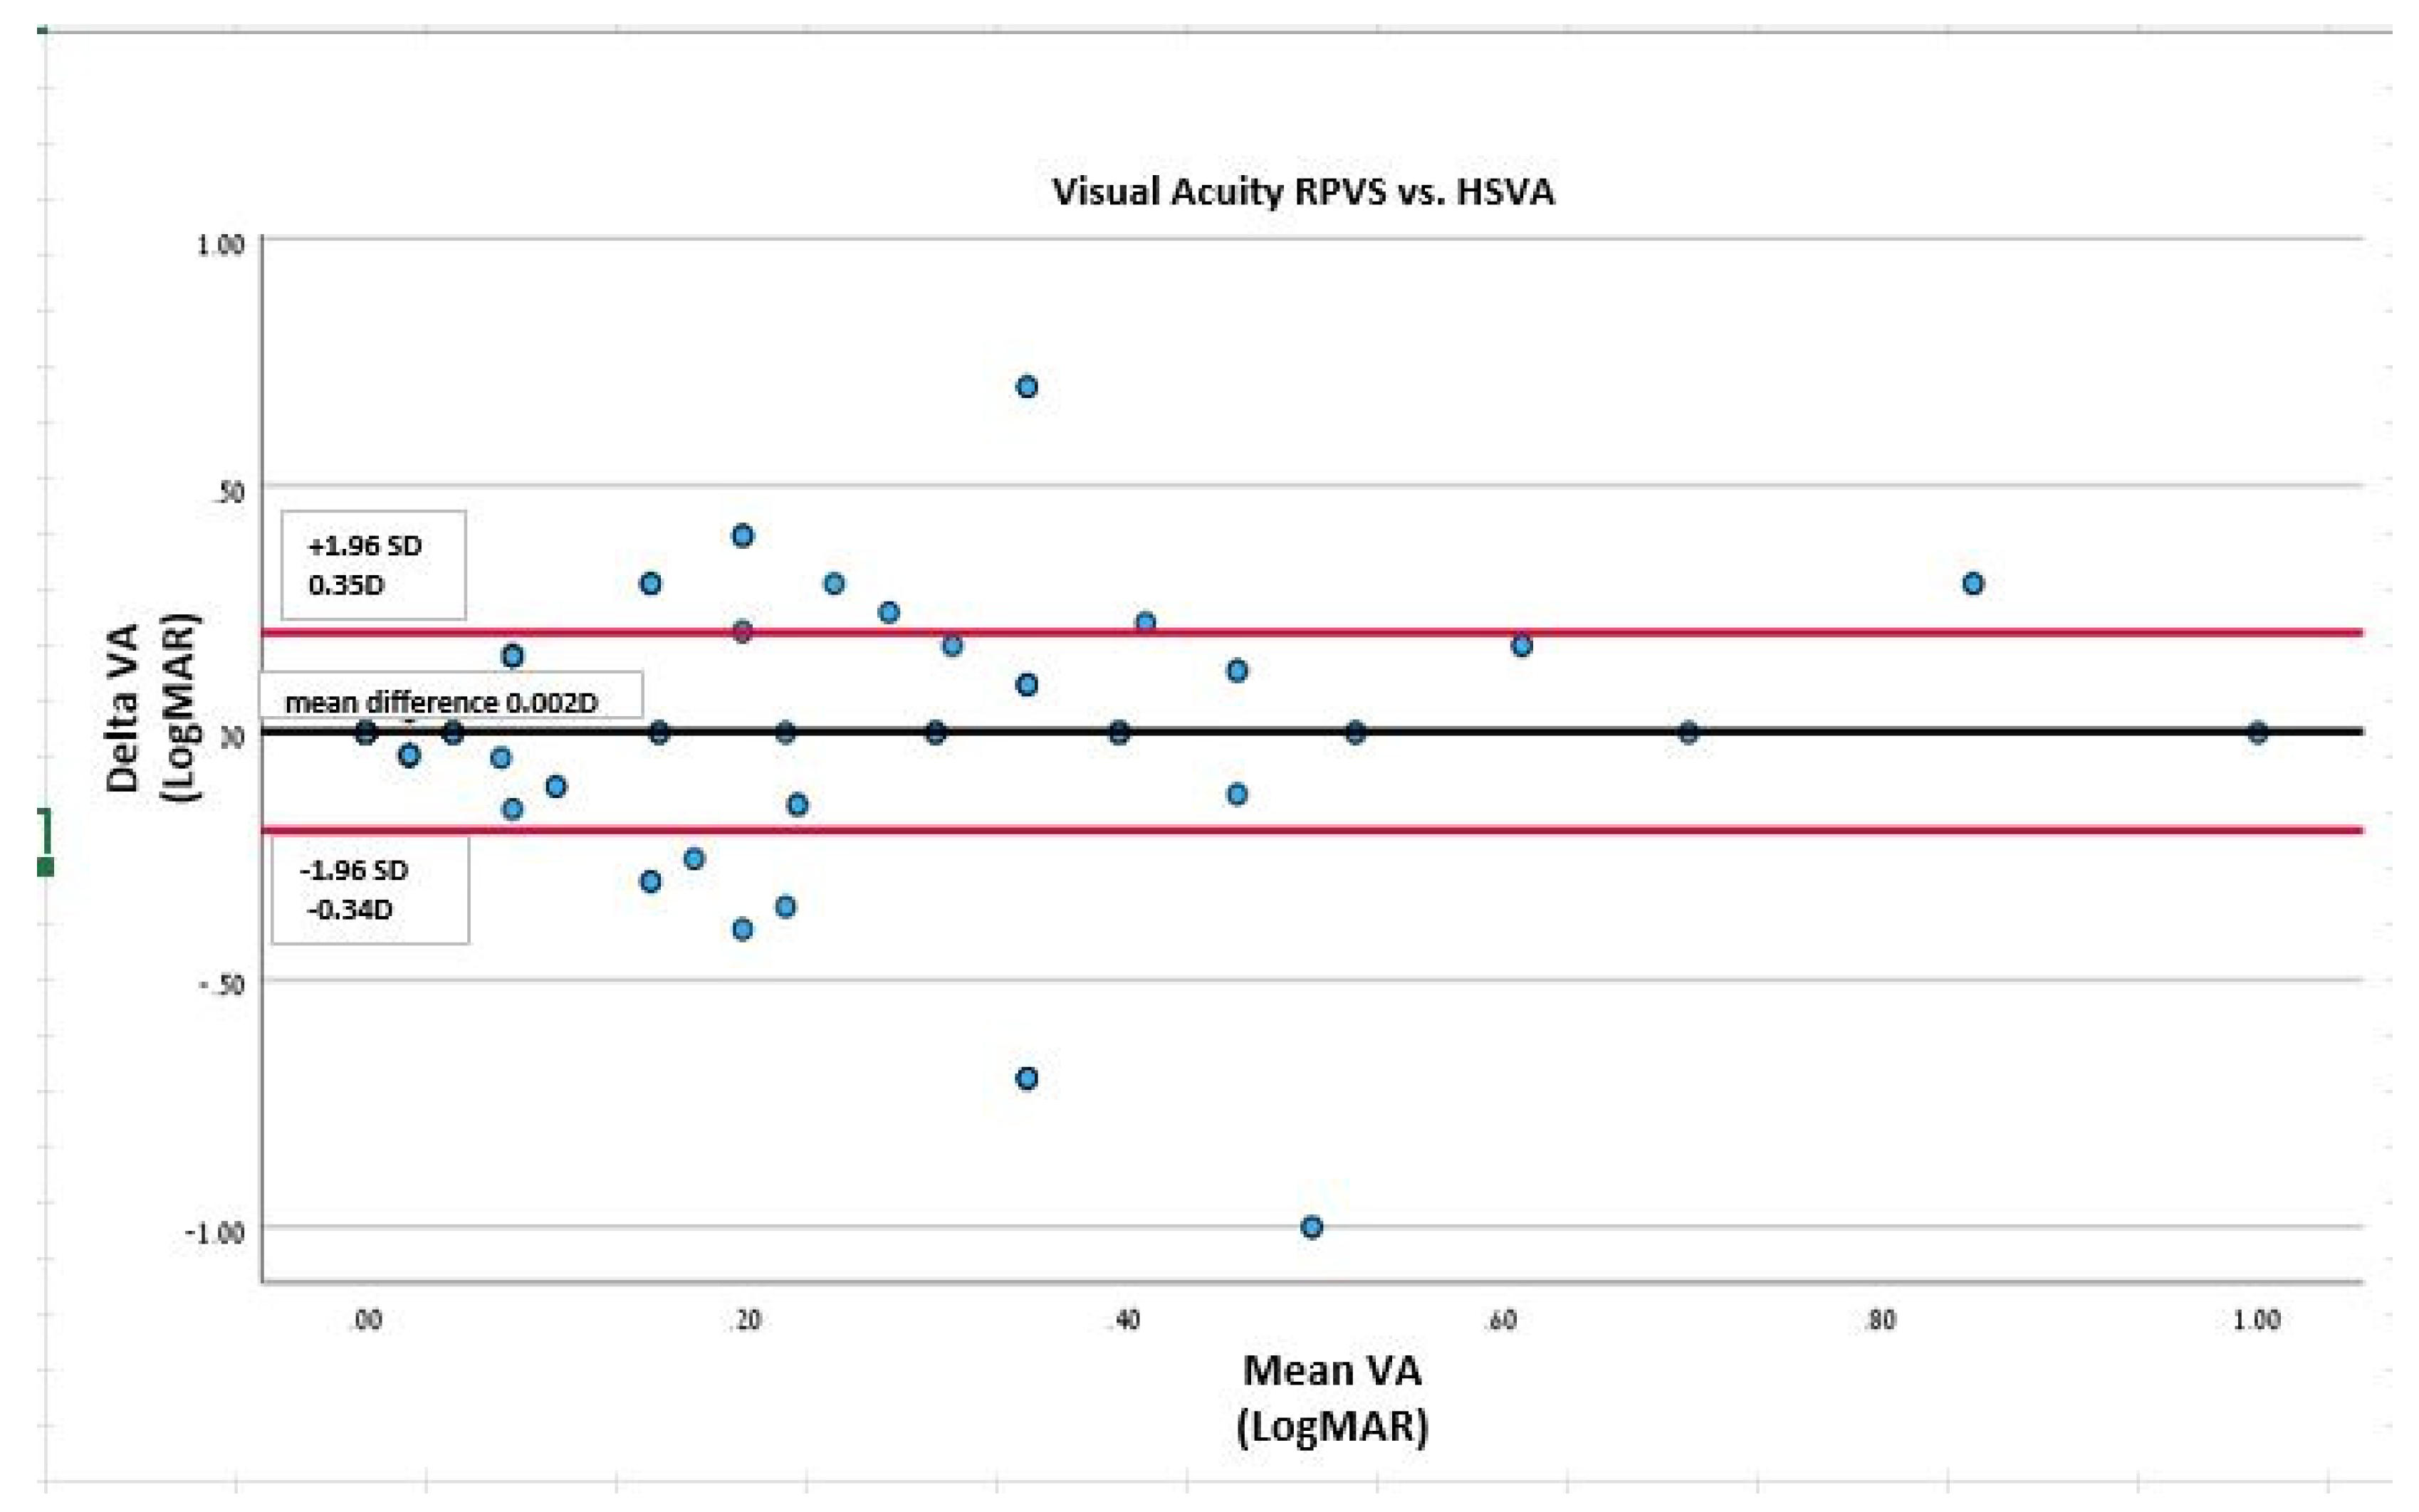

Table 1.
Repeatability analysis of two repeated tests on the Snellen, RPVS and HSVA visual acuity charts (N=38).
Table 1.
Repeatability analysis of two repeated tests on the Snellen, RPVS and HSVA visual acuity charts (N=38).
| Visual Acuity Chart | Mean | Median | SD | P* | Spearman (Rs) | P |
|---|---|---|---|---|---|---|
| Snellen -1st test | 0.06 | 0.0 | 0.19 | 0.14 | 0.99 | <0.001 |
| Snellen – 2nd test | 0.04 | 0.0 | 0.14 | |||
| RPVSb -1st test | 0.02 | 0.0 | 0.11 | 1.0 | 1.0 | <0.001 |
| RPVSb – 2nd test | 0.02 | 0.0 | 0.11 | |||
| HSVAc -1st test | 0.02 | 0.0 | 0.11 | 1.0 | 1.0 | <0.001 |
| HSVAc – 2nd test | 0.02 | 0.0 | 0.11 |
*Wilcoxon test. LogMAR units. bRPVS= Rosenbaum Pocket Vision Screener; cHSVA= Hadassah Self-Visual Acuity Screener.
Table 2.
Comparison of the VA testing results by the Snellen, RPVS and HSVA charts (N=237).
| Visual Acuity Chart | Mean | Median | SD | P* |
|---|---|---|---|---|
| Snellen | 0.15 | 0.1 | 0.22 | Snellen-RPVS: 0.001 |
| RPVSb | 0.10 | 0.0 | 0.19 | Snellen-HSVA: 0.001 |
| HSVAc | 0.09 | 0.0 | 0.20 | RPVS-HSVA: 0.10 |
* Wilcoxon test. LogMAR units. bRPVS= Rosenbaum Pocket Vision Screener; cHSVA= Hadassah Self-Visual Acuity Screener.
Table 3.
Comparison of the visual acuity obtained by self-testing and by an ophthalmic technician using the HSVA card (N=67).
Table 3.
Comparison of the visual acuity obtained by self-testing and by an ophthalmic technician using the HSVA card (N=67).
| Test method | Mean | Median | SD | P* | Spearman (Rs) | P | ICC |
|---|---|---|---|---|---|---|---|
| Self-test | 0.10 | 0.0 | 0.20 | 0.17 | |||
| Masked examiner | 0.09 | 0.0 | 0.19 | 0.87 | <0.001 | 0.96 |
* Wilcoxon test. LogMAR units.
Table 4.
Comparison of the near HSVA and the distance Snellen visual acuity extracted from electronic medical records (N=87).
Table 4.
Comparison of the near HSVA and the distance Snellen visual acuity extracted from electronic medical records (N=87).
| Visual Acuity Chart | Mean | Median | SD | P* | P* |
|---|---|---|---|---|---|
| Snellen (medical records) | 0.24 | 0.1 | 0.31 | 0.12 | |
| HSVA by examiner | 0.18 | 0.0 | 0.27 | 0.04 | |
| Self-test HSVA (N=26) | 0.19 | 0.05 | 0.27 |
*Tested by Wilcoxon test. LogMAR units. HSVA= Hadassah Self-Visual Acuity Screener.
Table 5.
Linear hierarchical regression for visual acuity of RPVS and Snellen charts using the HSVA card by a self-test and by examiner (N=67).
Table 5.
Linear hierarchical regression for visual acuity of RPVS and Snellen charts using the HSVA card by a self-test and by examiner (N=67).
| Near RPVS VA | Distance Snellen VA | ||||||
|---|---|---|---|---|---|---|---|
| B (SEB) | β | P | B(SEB) | β | P | ||
| Model I | age | 0.004 (0.001) | 0.35 | 0.003 | 0.011 (0.07) | 0.26 | 0.02 |
| F | 9.5 | 0.003 | 5.1 | 0.02 | |||
| R² | 0.13 | 0.07 | |||||
| Model II | age | 0.001 (0.00) | 0.08 | 0.06 | 0.001 (0.001) | 0.09 | 0.37 |
| HSVA by examiner | 0.13 (0.18) | 0.91 | 0.001 | -0.50(0.45) | -0.40 | 0.27 | |
| HSVA Self-test | -0.24(0.17) | -0.22 | 0.15 | 1.10(0.43) | 0.93 | 0.01 | |
| F | 156.9 | 0.001 | 11.6 | 0.001 | |||
| R² | 0.88 | 0.36 | |||||
VA=visual acuity; RPVS= Rosenbaum Pocket Vision Screener; bHSVA= Hadassah Self-Visual Acuity Screener.
Disclaimer/Publisher’s Note: The statements, opinions and data contained in all publications are solely those of the individual author(s) and contributor(s) and not of MDPI and/or the editor(s). MDPI and/or the editor(s) disclaim responsibility for any injury to people or property resulting from any ideas, methods, instructions or products referred to in the content. |
© 2024 by the authors. Licensee MDPI, Basel, Switzerland. This article is an open access article distributed under the terms and conditions of the Creative Commons Attribution (CC BY) license (http://creativecommons.org/licenses/by/4.0/).
Copyright: This open access article is published under a Creative Commons CC BY 4.0 license, which permit the free download, distribution, and reuse, provided that the author and preprint are cited in any reuse.


