
Submitted:
05 March 2024
Posted:
06 March 2024
You are already at the latest version
Abstract
This article examines the diagnosis of the Agricultural Innovation System (SIA) in the department of Tolima, Colombia, as part of a project led by the Colombian Ministry of Agriculture and Rural Development and the Technological University of Pereira (TUP), which also evaluated the National Agricultural Innovation System (NAIS) in regions such as Chocó, Bolívar, and Meta. A methodology was used that involved a survey with 58 questions on a Likert scale to 300 participants, evaluated with congruence and relevance indexes, identifying key variables in the operation of the Agricultural Innovation System (AIS). A survey was also applied to actors of the National Innovation System for Higher Education in Agriculture, A survey was also applied to map the participating actors in the regional agricultural innovation systems of Tolima to identify gaps in extension, innovation, development, sustainability, ICT, education and training. Among the conclusions, it stands out that the associativity subsystem presents the lowest lag and is close to a score of two on the scale of gaps, evaluation carried out among the five subsystems including extension, ICT, environmental aspects, and pub-lic policy. The department of Tolima shows low performance in innovation and ICT, while the extension is less lagging. In Chaparral there is a general lag, with innovation being the worst evaluated subsystem. Rovira obtains high scores in most subsystems, although innovation and ICT have lower scores. At the national and regional levels, innovation is low, and articulation among NARS actors is insufficient, which highlights the need to promote good practices, strategies, and projects.
Keywords:
Systems of Innovation
; National Agricultural Innovation System
; gaps
; Innovation and Development (R&D)
; training
; ICT
; sustainability
1. Introduction
Agricultural Innovation Systems (AIS) and National Agricultural Innovation Systems (NARS) play a crucial role in economic and social development at the local and national levels in the agricultural sector because through the use of products, processes, and practices they promote innovation processes with social or economic relevance [1] through a network of actors, institutions and policies, boost and improve productivity, enhance competitiveness, generate a positive impact on various sectors [2] thus contributing to the closing of gaps. To close these gaps and promote the sustainable development of the agricultural sector, it is essential to implement initiatives that foster innovation in local production systems.
Several initiatives in different studies and projects demonstrate the importance of fostering innovation in local productive systems to achieve sustainable economic growth at the local and national levels. The Cuban experience of Innovative Production Systems and Arrangements demonstrates that fostering innovation in local systems through policies and interactive learning is crucial for sustainable economic growth at the local and national levels [3]; knowledge management in the agricultural sector becomes relevant, as observed in the case of the Local Agricultural Innovation System of Pinar del Río [4]; likewise, technological innovation to reduce losses in the fishing and aquaculture industry becomes relevant, as evidenced in the FTT-Thiaroye technique and the Hermosillo Coast, Sonora, a Regional Agricultural Innovation System is proposed to boost growth, sustainability, and food security [5].
These initiatives highlight the importance of promoting innovation in agricultural and aquaculture systems through collaboration, technology development, stakeholder dialogue, and practical application of knowledge to achieve sustainable development and food security at the local and national levels. For the Colombian context, the diagnosis of the National Agricultural Innovation System (NARS) in departments such as Bolívar, Chocó, Meta, and Tolima emphasize the need to map relationships and articulations between the actors involved to close gaps and promote the comprehensive development of the NARS.
For the achievement of these purposes, this article is structured in several thematic sections. First, a theoretical framework is presented that reviews the literature on worldwide case studies related to the Agricultural Innovation System (NAIS) to identify strategies, good practices, and relevant projects that promote the development of the system. First, a theoretical framework is presented that reviews the literature on worldwide case studies related to the Agricultural Innovation System (NAIS) to identify strategies, good practices, and relevant projects that drive the development of the system Secondly, the methodology used to carry out the NARS diagnosis is described. Subsequently, the results obtained in the diagnosis are presented, highlighting some general findings on the behavior of the system and, in particular, of the department of Tolima. Finally, the discussions and conclusions are presented, in which the aspects evaluated in the general diagnosis and the department of Tolima are analyzed to understand the differences and similarities between the systems and to examine the particular situation of the department. In addition, the possible causes of these differences and coincidences are addressed and the impact they have on the implementation of development strategies and policies in the department is assessed.
2. Literature review on SIA
Authors like List [6] and Leontief [7] introduced the first approaches to the Innovation System by addressing National Production Systems, relevant to understanding agricultural dynamics in specific regions, but did not focus directly on the NARS. Freeman [8], Lundvall [9], Nelson [10,11] and Metcalfe [12] focused their studies on the systemic approach to innovation at the national level, recognizing the importance of collaborative work and the interactions between economic and institutional structure, which can be applied to the NARS in Bolivar, Chocó, Meta and Tolima. to promote innovation in the agricultural sector. Concerning the theories of the SIthis offers several schools of thought that can be valuable for analyzing and improving the NARS in the mentioned regions, such as, for example, the evolutionary economics of Nelson and Winter [11] serves to understand the evolution of agricultural technology and innovation over time; Nelson's institutional economics Nelson [10] may result useful for analyzing the role of institutions in the diffusion of agricultural innovation, while the new regional economies may allow the study of interactions between regions in terms of agricultural innovation and economic development [13]; the perspectives provided by learning economics approaches [14] [9], the economics of innovation [15] and network theory [16] prove valuable for a deeper understanding of innovation processes and interactions in the NARS context.
In Colombia, NARS promotes agricultural innovation through policies, programs, and projects that enhance competitiveness, quality of life, and food security by involving a wide range of participants and stimulating the formation of innovation networks Law 1876 [17]. Regional Innovation Systems (RIS) provide a detailed and contextualized view of innovation processes in a region [9], [18] considering particularities to identify strengths and weaknesses, develop appropriate strategies, and foster collaboration. among actors for innovation and sustainable development [19].
The Sector Innovation System (SIS) complements the National and Regional Innovation Systems by focusing on innovation within a specific sector, examining actors, dynamics, and relationships to improve competitiveness and productivity [20]. Understanding these systems is vital for diagnosing agricultural systems in Colombia, highlighting historical and contemporary approaches that enrich the perspective on regional agricultural innovation.
Estrategies, good practices, and relevant projects in the global scope of the Agricultural Innovation Systems (AIS)
This section presents strategies, best practices, and relevant projects within the global scope of the Agricultural Innovation Systems (AIS), analyzing R&D, training, extension, and sustainability subsystems that could contribute to closing the gaps in the proposed diagnosis. It begins with the strategies highlighted. Authors such as Nederlof [21] highlight the effectiveness of learning coalitions multifactor solving local institutional problems; Koutsouris [22] highlights how intermediaries bridge cognitive, informational, and managerial gaps in the SIA; Sseguya [23] provide the importance of relationships and trust in sources for access to agricultural information in Uganda [24] stress the relevance of innovation in SIA governance for agricultural productivity and sustainability; Klerkx & Nettle [25] point out how the intermediaries and the network facilitators catalyze the co-production of innovation in the dairy sector in the Netherlands and Australia; Kilelu [26] emphasize the usefulness of adaptive intermediaries and platforms to address innovation co-evolution; Kingiri [27] highlights the essential gender perspective in agricultural innovations. These authors, among others, contribute to enriching the diagnosis of the NARS, offering key insights so drive innovation and sustainable development in these regions.
Good practices are enriched by the contribution of various authors who address multiple aspects of agricultural innovation. In such a direction, Douthwaite & Hoffecker [28] highlight the need for a Theory of Change to plan and evaluate alternative pathways in agricultural research, addressing the complexity of agricultural aquatic systems in Zambia and the Philippines; Pigford [29] advocate integrating ecological and agricultural innovation systems perspectives into sustainable agricultural innovation to achieve transitions to more sustainable systems; Spendrup & Fernqvist [30] highlight the importance of improving access to agricultural information in Kenya and encouraging the adoption of sustainable practices such as agroforestry through simple practices and subsidies; Cofré-Bravo [31] highlight the adaptation of agricultural innovation support networks as key to meeting farmers' needs and achieving soft skills and ambidexterity; Kamara [32] identify cognitive drivers and barriers in the adoption of Agricultural Information Systems in the rice industry through the Theory of Planned Behavior.
Concerning relevant projects, various studies contribute to the understanding of agricultural innovation from different approaches: Fielke [33] highlight the importance of reflective monitors in the success of co-innovation projects in the primary sector in New Zealand. Clarkson [34] employs the Theory of Change to assess the impact of the Shamba Shape Up television program in promoting agricultural sustainability through agricultural communication and extension; Vom Broke [35] detail how the impact evaluation of the Sorghum Participatory Sorghum Improvement program shows how research strengthens individual and collective capacities to innovate in agricultural technologies; Barzola [36] explore multi-actor platforms (MSPs) as collaborative networks that achieve different levels of innovation according to objectives and proposed activities. Studies such as RiceAdvice in Africa address essential aspects of agricultural innovation, from practical tools in sub-Saharan regions to innovation platforms in cocoa production in Ghana and accountability in digital agricultural R&D in Australia [37].
Case studies on AIS and NARS
Case studies on AIS and NARS at the global level have also become available tools for identifying good practices, strategies, and projects understanding challenges, and generating recommendations, thus contributing to improving the implementation of agricultural innovation systems and promoting sustainable rural development. In Table 1. Case Studies on SIA in the worldwide sphere, some cases are highlighted, identifying the actors involved, the problems they address, and the functioning of these systems, which are very useful for the closing of gaps in the context of the department of Tolima.
The review and analysis of research studies and case studies presented arrange important conclusions about the agricultural innovation system in different geographical contexts. Each study addresses specific challenges of the agricultural sector in its country, highlighting the relevance of innovation as a key tool to address problems such as rural decline, poverty, unsustainability, pollution, and low crop productivity. The results highlight the need to strengthen the rural innovation system in China, the transition towards sustainability in Spain with the active participation of farmers, distributors, and cooperatives, the crucial role of social networks in agricultural innovation in India, and the importance of urban agriculture in México as part of the ecological or agricultural infrastructure, in addition, the relevance of smart agriculture in Colombia and the need for mixed approaches and methods to address the complexity of the agricultural innovation system is underscored. The consideration of these aspects is of great importance for future research on practices, projects, and strategies that promote sustainability and agricultural development at both regional and national levels.
3. Methodology
This diagnosis is structured in four phases which aim to promote agricultural innovation and development in different municipalities, as shown in Table 2 Objectives and phases proposals, which detail the actions to be carried out.
In the first phase of the framework project, four pilots were executed in four departments for a total of eight municipalities to identify and collect information from the Agricultural Production Units (UPAs), this paper presents the results from one of the departments in two municipalities. Pilot instruments were designed to collect data that laid the basis for project implementation. A questionnaire which can be found in Annex 1, entitled "Information Collection Instrument" was prepared to diagnose the National Agricultural Innovation System (NARS). The questionnaire consists of four parts covering information on producers, farms, associativity, and coordination between agricultural sector institutions. The objective was to obtain data on production, institutional support, formation of associative groups, transformation, production, and marketing of agricultural products.
The second phase focused on analyzing the distinctive characteristics of each municipality, such as its geographic location, population, territorial dispersion, productive chain, organic production, and focus on reducing carbon emissions. An analysis of the existing gaps in access to ICTs in the pilots was also carried out to identify possible improvements in this area.
The third phase of the project focused on identifying and coordinating the various actors involved in the generation and implementation of knowledge in agricultural science, technology, and innovation. The objective is to contribute to closing gaps and fostering social participation by collecting information and analyzing information through the mapping of actors and variables relevant to sustainable agricultural development. Secondary sources such as Scopus, Google Scholar, and stakeholders' web pages were used to analyze the level of relationships and collaboration patterns among them. The relationship and articulation of actors in the National Agricultural Innovation System (NARS) in four departments were evaluated using secondary information and surveys. In addition, stakeholder interviews were conducted to identify specific recommendations for closing gaps in a given field. Statistical software R and RStudio were used for data analysis.
Finally, in the fourth phase, the results obtained throughout the implemented pilots were consolidated. A final document will be generated containing the conclusions and specific recommendations for each pilot, to effectively promote innovation and growth in the agricultural sector of each municipality involved. The results obtained are presented below.
4. Results
In the framework project, eight municipalities with populations ranging from 5,100 to 50,370 inhabitants were analyzed. San Juan Nepomuceno and Santa Rosa del Surin Bolívar, as well as Juradó and San José del Palmar in Chocó, have outstanding differences in population. San Juan Nepomuceno shows an urban trend in Bolivar, while the municipalities of Chocó have a mainly rural distribution. Cabuyaro in Meta stands out for having an average of 23 hectares per farm, while Tolima, Chaparral, and Rovira have an average of less than 8.5 hectares. Juradó in Chocó has the smallest amount of land with 3.9 hectares per property. Cabuyaro and Santa Rosa del Sur have the largest cultivated areas, while the municipalities of Chocó have the smallest cultivated area, with Juradó being the lowest with only one hectare due to fishing.
In terms of production lines, cattle ranching prevails in Cabuyaro and Vista Hermosa, tuna and catfish fishing in Juradó, cocoa farming in Santa Rosa del Sur, San José de Palmar, Vista Hermosa, and Chaparral, and yam farming in San Juan Nepomuceno. Water use varies in the municipalities analyzed: Aljibe in Santa Rosa del Sur, rainwater in Juradó, and water from natural sources in Rovira, Vista Hermosa, and San José del Palmar. Family labor is important in all municipalities, especially in Juradó and Santa Rosa del Sur. Membership in agricultural producer organizations is common in most municipalities, except in San José del Palmar, Chaparral, and Cabuyaro. Formalization of agricultural collective figures is high in Vista Hermosa and Rovira, and lower in San José del Palmar and Cabuyaro. The altitude varies significantly, from five meters above sea level in Juradó to 1489 meters in Rovira.
In terms of land tenure, most of the properties are owned in Juradó, San José del Palmar, Cabuyaro, Vista Hermosa, and Rovira. Participation in socio-environmental programs is low in general, but participation in Vista Hermosa in illicit crop substitution programs, in Santa Rosa del Sur in productive alliances, and Rovira in associations stands out.
Indicators in subsystems for user classification
A statistical model was developed in RStudio to analyze the indicators of the National Agricultural Innovation System (SNIA) in a survey involving the departments of Chocó, Bolívar, Meta, and Tolima. Five subsystems were studied through surveys to describe the classification of users: assistance, associativity, ICT, environment, and public policy. The information was systematized in Excel and subsequently in the programming software for statistical analysis RStudio.
As shown in Figure 1, the result shows that associativity is the category with the lowest lag by achieving a score close to two on the gap scale. The results on technical assistance highlight the orientation on productive cycles in Q64 with a rating scale of 2.3. Formalization in the registration of machinery has the lowest score with 1.2. The category of policy public stands out, where respect for land use obtained the best rating with 2.7.
As shown in Figure 2, land use in Tolima complies with the guidelines of the land use plan (Q26) in the dimensions analyzed in the public policy subsystem, obtaining a score of 3.3. However, in the area of the ICT subsystem, the dimensions evaluated show lower evidence for the department of Tolima, around 1.5 points.
As can be seen in the following Figure 3, associativity is the highest-rated subsystem in Chaparral (Tolima). The promotion of associative production scored 2.3 points. Participation in training programs on NARS-related topics (Q43) was the least valued condition in the ICT subsystem.
Concerning the municipality of Rovira the ICT subsystem in the municipality of Rovira (Tolima) as can be seen in Figure 4, received higher scores than most of the other municipalities studied in the sample. Actions for the promotion of research (Q34) and building a culture of innovation (Q38) received ratings above 2 points. The environmental category obtained lower scores within the municipality. The water study (Q69) received a rating of 1.2.
In Table 3, it shows the scores obtained in different user classification subsystems for each municipality. Variability is observed in the scores in each category, indicating differences in the performance of the municipalities in terms of technical assistance, associativity, environmental and public policy. Some municipalities such as Cabuyaro and Rovira show higher scores overall, while San José del Palmar obtains lower scores in several categories. This suggests the existence of gaps and aspects for improvement actions by each municipality concerning these subsystems.
NARS subsystem indicators
Concerning the NARS subsystem indicators, the results as shown in Figure 5, showed that Chocó had the lowest indicators, while Meta had the highest values. No department obtained an average score higher than 2 in the subsystems evaluated, which indicates the presence of gaps concerning the NARS subsystems and a tendency towards low scores. The results are shown in radar graphs as shown in the following figure entitled Grouping subsystems (national), to visualize the level of progress in each subsystem in each department and municipality analyzed. This reveals gaps in the five grouping subsystems, including extension, R&D, training, sustainability, innovation, and ICT, with the promotion of associativity being a prominent aspect. In Tolima, low performance is observed in all subsystems, with the Innovation and ICT subsystem lagging the farthest behind. The use of ICT shows the best performance, while participation in R&D processes has the lowest rating in the department. The Extension subsystem is the least behind but still has gaps to overcome.
As shown in Figure 6, the lowest score was obtained for the presence of people related to R&D processes, with 1.2 points. In the extension subsystem, the promotion of associativity received the highest rating, with 2.7 points. In the R&D subsystem, productive transformation through social promotion obtained an outstanding score of 2.2. In the sustainability category, the application of sustainable models and agroforestry practices obtained the highest scores, with 48 and 75 points, respectively.
As can be seen in Figure 7, Grouping Subsystems - Chaparral, the municipality of Chaparral is lagging in all the conditions analyzed, with scores between 1 and 2 in each of the subsystems studied. The extension subsystem is the best rated, with 1.7 points, while the innovation subsystem received the lowest rating, with 1.4 points. Only the extension and R&D subsystems have conditions above two points.
As shown in Figure 8, the municipality of Rovira in Tolima recorded a score of two for all subsystems, except for the Innovation and ICT subsystem, which was rated an average of 1.4. Promotion of extension service (Q25) and associativity (Q27) recorded the best scores with 2.7 and 3 for the extension subsystem. Likewise, sustainability and training scored around two in most of the conditions evaluated.
Table 4, shows the NARS gaps grouped by municipality. The Innovation and ICT subsystem is the one with the lowest values in each of the departments analyzed. While Extension is the best-rated subsystem in Tolima. The sustainability subsystem registers the lowest lag in Bolivar, being surpassed in Chocó by the sustainability subsystem. In the department of Meta, the lowest rating corresponds to the training subsystem. In the municipalities, the promotion of associativity and the availability of extension services stand out, as well as the favorable image of the profile of extensionists.
In Table 5, it presents the gap report for each question for each department. In the gap analysis grouped by subsystems, the municipalities San Juan Nepomuceno and Santa Rosa del Sur in Bolivar describe a lower performance in the Innovation and ICT subsystem. The same trend is observed in San José del Palmar in Chocó, Vista Hermosa and Cabuyaro in Meta, and Chaparral and Rovira in Tolima. Juradó in Chocó describes a lower indicator in the Innovation and Development (R&D) subsystem.
Annex 1, called "Information Collection Instrument", shows how the results corresponding to each of the indicators from 23 to 78 in various regions were obtained. At the national level, the indicators vary in a range from 1.31 to 2.72. The highest values are found in indicators 26 and 27, related to sustainability innovation and ICT, respectively. In the department of Bolivar, the indicators range between 1.21 and 2.82. Indicator 27, which refers to ICT, registers the highest value, while indicator 23 has the lowest value. In the case of Chocó, indicator values range from 1.01 to 2.75. Indicator 27, related to ICT, shows the highest value, while indicator 23 has the lowest value. In the department of Meta, the indicators range from 1.21 to 2.98. Indicator 26, which refers to sustainability and innovation, presents the highest value, while Indicator 23 has the lowest value. In Tolima, the values of the indicators range between 1.29 and 3.28. Indicator 26, related to sustainability and innovation, registers the highest value, while indicator 64 has the lowest value. In general, it can be observed that the indicators vary in each region and that there are significant differences between departments. The indicators related to sustainability and innovation and ICTs are the ones with the highest values in general.
Stakeholder mapping
Table 6, presents a detailed analysis of the key actors in the agricultural and rural sectors in Colombia, addressing aspects such as training, extension organizations, project executors, and collaborations, providing a complete view of their contribution to sustainable development and innovation, among other issues.
Weighting matrix and gaps in the articulation of SNCTI actors in the regions
Concerning the matrix of weighting and gaps in the articulation of SNCTI actors in the regions, it is found as shown in Table 7, that, when analyzing the variable of collaboration in scientific articles, the following values were obtained in co-authorship over the population: Tolima (0.00001493), Meta (0.00001328), Bolivar (0.00000235) and Chocó (0.00000364). In the above example, Tolima has the best result by population for the variable collaboration in scientific article writing, so it is assigned the maximum score which is 5.
According to the analysis of gaps in the relationships between the actors of the National Science, Technology, and Innovation System in the field of agriculture: findings of the weighting matrix, Tolima leads in the relationship between SNCTI actors in agricultural issues, followed by Meta, Chocó, and Bolívar. Common gaps include the lack of collaboration in industrial protection via patents, scarcity of Technoparks, and the absence of Technology Transfer Offices in the departments. Specific gaps include the low publication of scientific articles in Bolívar and Chocó and limited dynamics in projects registered with the Rural Development Agency in Bolívar. In terms of financing resource management, Tolima and Bolivar have a low performance, while Meta has a moderate performance. In addition, Bolivar and Chocó have a low performance in agricultural associations and the presence of indigenous reserves is minimal in Bolivar and Meta. Bolivar has the lowest performance in research groups recognized by Minciencias in agriculture and related fields.
Table 8, shows the main gaps identified in the department of Tolima about four aspects: extension, R&D, sustainability, training and innovation, and ICT. For each aspect, the average and mode of the assigned scores are presented. The gaps corresponding to each aspect are identified, such as the lack of technical assistance in the productive units, the absence of people involved in R&D&I activities and strategic alliances, the lack of active participation in the development of innovation-based sustainability, the lack of knowledge of education and training projects, and the lack of people involved in R&D&I activities and strategic alliances. In addition, the highest score achieved in each aspect is indicated, such as the presence of technical assistance and people involved in R&D&I activities and strategic alliances.
In Figure 9, a series of questions related to the National Agricultural Innovation System (NARS) were evaluated. These questions have been scored and an ideal state represented by score 4 has been established. The following is a summary highlighting the NARS questions along with their rating and ideal status. This analysis provides an overview of the current situation of the NARS and allows the identification of areas for improvement or gaps.
This analysis provides a clear and concise understanding of the areas requiring attention and improvement concerning the questions assessed. In this, we have identified and evaluated various gaps related to the topic in question. These gaps are reflected by acute ratings for each question, where states 1 to 3 indicate the presence of a gap.
5. Discussion
The discussion in this article reveals significant findings for understanding and enhancing the National Agricultural Innovation System (NARS) in the Department of Tolima, Colombia. The analysis of the discrepancies and convergences between the general diagnosis and the specific context of Tolima in terms of challenges in the agricultural sector underscores the importance of addressing the unique problems of each region and recognizing the local particularities that influence development strategies. The identification of gaps and challenges in the agricultural sector in Tolima is distinguished by its dependence on external inputs and the lack of coordination between academia and government.
In line with the literature on Agricultural Innovation Systems (AIS) and National Agricultural Innovation Systems (NARS), the fundamental importance of collaboration, dialogue, and technology development as crucial drivers for innovation and sustainable development in the sector is underlined. Experiences in different countries, such as Cuba, India, and Mexico, provide valuable lessons on how collaboration among diverse stakeholders, adaptation to local needs and focus on specific areas of innovation can have a positive impact on food security and development. rural.
The use of the Regional Innovation Systems (RIS) and the Sector Innovation System (SIS) as tools to improve competitiveness and productivity at the national and regional agricultural level demonstrates how strategies, good practices, and projects can be implemented and adjusted to address particular challenges. of each territory.
6. Conclusions
The results of the survey in Tolima indicate that extension is a critical aspect of the functioning of the Agricultural Innovation System (SIA), and significant gaps were found in this area. Other relevant variables were identified and strategies and recommendations compiled from various sources are proposed to close these gaps in the five subsystems analyzed in the producer survey. These sources include Garcia's master's thesis (2019), research on sustainability and sustainable innovation systems</t0/>, and studies and manuals on innovation.
The analysis of gaps in the National System of Agricultural Science, Technology, and Innovation reveals that Tolima leads the relations, with Meta, Chocó, and Bolívar. Common gaps are identified such as lack of collaboration in industrial protection, scarcity of Technoparks, and absence of Technology Transfer Offices. Specific gaps include low publication of scientific articles in Bolívar and Chocó, limited dynamics in projects of the Rural Development Agency in Bolívar, and low performance of Bolívar in research groups recognized by Minciencias in agriculture.
About the National Agricultural Research and Technological Development Subsystem, it is recommended that research capabilities in agricultural innovation be strengthened, prioritizing the conservation of knowledge, avoiding the brain drain, and promoting systematic technology transfer to small and medium-sized producers. Research should be focused on the needs and agricultural vocation of the region, with a long-term holistic vision and continuity in state policies. In addition, it is suggested to establish mechanisms to manage and disseminate the knowledge generated, as well as to investigate strategies to improve Research and Development and the adoption of knowledge by primary producers.
Concerning the National Training and Education System for Agricultural Innovation, it is recommended to strengthen and develop educational programs in different areas, including middle, technical, university, and non-formal, as well as high-quality virtual programs to train primary producers and their families. The importance of social capital is highlighted and it is suggested to invest in training and development of human talent aligned with regional interests and challenges. It is necessary to improve the articulation between the actors of the system and increase dissemination and networking through education and training projects and programs.
For the National Agricultural Extension Subsystem, it is essential to create favorable spaces and platforms that foster interaction and synergy between primary farmers, researchers, and other actors of the National Agricultural Innovation System (NARS), adding value at all levels of the agricultural production chain. The need to increase dissemination and improve coordination among stakeholders through projects, plans, and training and education programs is highlighted.
Given the processes of innovation -ICT we suggest taking advantage of the capacities of institutions at the national and regional levels to provide training in innovation and new business models to the actors of the National Agricultural Innovation System (SNIA, for its acronym in Spanish). In addition, it is recommended to expand the articulation through projects and collaborations with universities, technology development centers, technology parks, innovative companies, and incubators, to strengthen collaboration and promote innovation in the NARS.
To promote a sustainable National Agricultural Innovation System (NARS), it is recommended to focus on eco-innovation and green innovation, promoting sustainable, socially and environmentally responsible practices. In addition, it is suggested to establish intermediary entities and create a hub for agricultural innovation to facilitate interaction and mediation among the actors in the system.
References
- Agencia de Desarrollo Rural. (2021). Plan Integral de Desarrollo Agropecuario y Rural con enfoque Territorial – Departamentos de Tolima, Chocó, Bolívar y Meta.
- Alaie, S. A. (2020). Conocimiento y aprendizaje en el sistema de innovación hortícola: un caso del valle de Cachemira en la India. Revista Internacional de Estudios de Innovación, 4(4), 116-133. [CrossRef]
- Alcázar Quiñones, A. T. (2017). Metodología "Arreglos y Sistemas Productivos Innovativos Locales" en municipios cubanos. Retos de la Dirección, 11(2), 198-212. DOI http://scielo.sld.cu/scielo.php?script=sci_arttext&pid=S2306-91552017000200013&lng=es&tlng=pt.
- Barzola Iza, CL , Dentoni, D. y Omta, OSWF (2020). The influence of Multi-Stakeholder Platforms on farmers' innovation and rural development in emerging economies: A systematic literature review Journal of Agribusiness in Developing and Emerging Economies, vol. 10 N° 1, págs. 13-39. [CrossRef]
- Benítez, Odio, M., Martínez Robaina, A., Herrera Gallo, M., Páez Fernández, P. L., del Busto Concepción, A. (2020). "Estrategia para implementar la gestión del conocimiento en el Sistema de Innovación Agropecuario Local". Coodes, 45-56. Disponible en: http://coodes.upr.edu.cu/index.php/coodes/article/view/267.
- Cofré-Bravo, G., Klerkx, L. y Engler, A. (2019). Combinaciones de vínculos, puentes y vinculaciones de capital social para la innovación agrícola: cómo los agricultores configuran diferentes redes de apoyo. Revista de Estudios Rurales , 69 , 53-64.
- Clarkson, G., Garforth, C., Dorward, P., Mose, G., Barahona, C., Areal, F., & Dove, M. (2018). Can the TV makeover format of edutainment lead to widespread changes in farmer behavior and influence innovation systems? Shamba Shape Up in Kenya. Land Use Policy, 76, 338-351. [CrossRef]
- Dieleman, H. (2019). Enfoque de Sistema de Innovación para la Agricultura Urbana: Estudio de Caso de la Ciudad de México. Innovaciones en Agricultura Sostenible, 79-102. [CrossRef]
- DNP. (2020). Índice de desarrollo de las TIC regionales para Colombia. Consultado a través de https://www.dnp.gov.co/DNPN/Documents/Indice%20de%20desarrollo%20de%20las%20TIC%20regional%20para%20Colombia.pdf.
- Dosi, G. (1988). The Nature of the Innovation Process. In G. Dosi, C. Freeman, R. Nelson, G. Silverberg, & L. Soete (Eds.), Technical Change and Economic Theory (pp. 221-238). London: Pinter.
- Douthwaite, B., & Hoffecker, E. (2017). Towards a complexity-aware theory of change for participatory research programs working within agricultural innovation systems. Agricultural systems, 155, 88-102. [CrossRef]
- FAO. (2015). La técnica de procesamiento FTT-Thiaroye, una innovación para la reducción de pérdidas poscosecha en la pesca y la acuicultura. Documento presentado en el Primer Congreso Internacional sobre Prevención de la Pérdida de Alimentos, 2015, Roma. (también disponible en http://www.fao.org/food-loss-reduction/news/details/es/c/369935/).
- Fielke, S. J., Nelson, T., Blackett, P., Bewsell, D., Bayne, K., Park, N., ... & Small, B. (2017). Hitting the bull's-eye: the role of a reflexive monitor in New Zealand Agricultural Innovation Systems. In 12th European International Farming Systems Association (IFSA) Symposium, Social and technological transformation of farming systems: Diverging and converging pathways, 12-15 July 2016, Harper Adams University, Newport, Shropshire, UK (pp. 1-13). International Farming Systems Association (IFSA) Europe. [CrossRef]
- Foray, D., & Lundvall, B. - A. (1996). The Knowledge-based Economy: From the Economics of Knowledge to the Learning Economy. Paris: Employment and Growth in the Knowledge-based Economy.
- Freeman, C. (1987). Technology policy and economic performance: Lessons from Japan, London, Pinter Publishers.
- Giagnocavo, C., de Cara-García, M., González, M., Juan, M., Marín-Guirao, J. I., Mehrabi, S., ... & Crisol-Martínez, E. (2022). Reconectar a los agricultores con la naturaleza a través de transiciones agroecológicas: nichos interactivos y experimentación y el papel de los sistemas de innovación y conocimiento agrícola. Agricultura, 12(2), 137. [CrossRef]
- Hakansson, H. (1987). Industrial technology development: A network approach. Journal of Product Innovation Management, 4 (2), 163-165.
- Kamara, L. I., Dorward, P., Lalani, B., & Wauters, E. (2019). Unpacking the drivers behind the use of the Agricultural Innovation Systems (AIS) approach: The case of rice research and extension professionals in Sierra Leone. Agricultural Systems, 176, 102673. [CrossRef]
- Klerkx, L., & Nettle, R. (2013). Achievements and challenges of innovation co-production support initiatives in the Australian and Dutch dairy sectors: a comparative study. Food policy, 40, 74-89. [CrossRef]
- Klerkx, L., & Engler, A. (2019). Combinaciones de vínculos, puentes y vinculaciones de capital social para la innovación agrícola: cómo los agricultores configuran diferentes redes de apoyo. Revista de Estudios Rurales, 69, 53-64.
- Kingiri, A. N. (2013). A review of innovation systems framework as a tool for gendering agricultural innovations: Exploring gender learning and system empowerment. The Journal of Agricultural Education and Extension, 19(5), 521-541. [CrossRef]
- Koutsouris, A. (2012). Facilitating Agricultural Innovation Systems: A Critical Realist Approach. Studies in Agricultural Economics, 114(1316-2016-102761), 64-70. [CrossRef]
- Leontief, W. W. (1941). The structure of the American economy, 1919-1929: An empirical application of equilibrium analysis. Harvard University Press.
- Ley 1876 de 2017. Por medio de la cual se crea el Sistema Nacional de Innovación Agropecuaria y se dictan otras disposiciones. 29 de diciembre de 2017.
- List, F. (1841). The national system of political economy. Vernon Press.
- Lundvall, B. A., & Johnson, B. (1994). Sistemas nacionales de innovación y aprendizaje institucional. Comercio exterior, 44(8), 695-704.
- Malerba, F. (2005). Sectoral system of innovation: a framework for linking innovation to the knowledge base, structure, and dynamics of sectors. Economics of Innovation and New Technology, 14(1-2), 63-82.
- Metcalfe, J. S. (1995). Technology systems and technology policy in an evolutionary framework. Cambridge Journal of Economics, 19(1), 25-46. [CrossRef]
- Moreddu, C. , & Van Tongeren, F. (2013). Improving agricultural productivity sustainably at a global level: the role of agricultural innovation policies. EuroChoices, 12(1), 8-14. [CrossRef]
- Nederlof, E. S. , Röling, N., & Van Huis, A. (2007). Pathway for agricultural science impact in West Africa: lessons from the Convergence of Sciences program. International Journal of Agricultural Sustainability, 5(2-3), 247-264. [CrossRef]
- Nelson, R. R. (Ed.). (1993). National innovation systems: a comparative analysis. Oxford University Press on Demand.
- Nelson, R. R., & Winter, S. G. (1982). The Schumpeterian tradeoff revisited. The American Economic Review, 72(1), 114-132.
- Organización de las Naciones Unidas para la Alimentación y la Agricultura (2015). El estado mundial de la agricultura y la alimentación: la innovación en la agricultura familiar. Roma, Italia: FAO. Recuperado de: http://www.fao.org/3/a-i4040s.pdf.
- Organización para la Cooperación y Desarrollo Económico (2013). Sistemas de innovación agrícola: un marco para analizar el papel del gobierno. Publicaciones de la OCDE. Recuperado de: https://www.oecd.org/publications/agricultural-innovation-systems-9789264200593-en.htm.
- Padilla-Pérez, R. , Vang, J., & Chaminade, C. (2009). Regional innovation systems in developing countries: integrating micro and meso-level capabilities. En B.-Å. Lundvall, K. J. Joseph, C.
- Pigford, A. A. E. , Hickey, G. M., & Klerkx, L. (2018). Beyond agricultural innovation systems? Exploring an agricultural innovation ecosystems approach for niche design and development in sustainability transitions. Agricultural systems, 164, 116-121. [CrossRef]
- Plataforma de Agricultura Tropical (2017). Marco Común sobre el Desarrollo de Capacidades para los Sistemas de Innovación Agrícola: Antecedentes Conceptuales. CAB Internacional, Wallingford, Reino Unido. Doi: Recuperado de: http://www.fao.org/in-action/tropical-agriculture-platform/commonframework/es/.
- Poti, S. , & Joy, S. (2022). Plataformas digitales para conectar actores en el espacio agtech: conocimientos sobre el desarrollo de plataformas a partir de la investigación de acción participativa en KisanMitr. Revista de investigación empresarial india, 14(1), 65-83. Revista de investigación empresarial india, vol. 14 núm. 1, págs. 65-83. [CrossRef]
- Quintero, S. , Giraldo, D. P., & Garzón, W. O. (2022). Análisis de los Patrones de Especialización de un Sistema de Innovación Agropecuaria: Un Estudio de Caso sobre la Cadena Productiva del Banano (Colombia). Sustentabilidad, 14(14), 8550. [CrossRef]
- Robledo, J. (2010). Introducción a la Gestión Tecnológica. Medellín: Universidad Nacional de Colombia Sede Medellín.
- Spendrup, S. , & Fernqvist, F. (2019). Innovation in agri-food systems–a systematic mapping of the literature. International Journal on Food System Dynamics, 10(5), 402-427. [CrossRef]
- Sseguya, H. , Mazur, R., Abbott, E., & Matsiko, F. (2012). Information and communication for rural innovation and development: context, quality, and priorities in southeast Uganda. The Journal of Agricultural Education and Extension, 18(1), 55-70. [CrossRef]
- Storper, M. (1995). Regional technology coalitions are An essential dimension of national technology policy. Research Policy, 24, 895 - 911.
- Vom Brocke, K., Kondombo, C. P., Guillet, M., Kaboré, R., Sidibé, A., Temple, L., & Trouche, G. (2020). Impact of participatory sorghum breeding in Burkina Faso. Agricultural Systems, 180, 102775. [CrossRef]
- Yin, X., Chen, J., & Li, J. (2022). Sistema de innovación rural: Revitalizar el campo para un desarrollo sostenible. Revista de Estudios Rurales, 93, 471-478. [CrossRef]
- Zossou, E., Saito, K., Assouma-Imorou, A., Ahouanton, K., & Tarfa, B. D. (2021). Participatory diagnostic for scaling a decision support tool for rice crop management in northern Nigeria. Development in Practice, 31(1), 11-26. [CrossRef]
Figure 1.
Grouping subsystems – National. Source: Own elaboration with the RStudio tool.
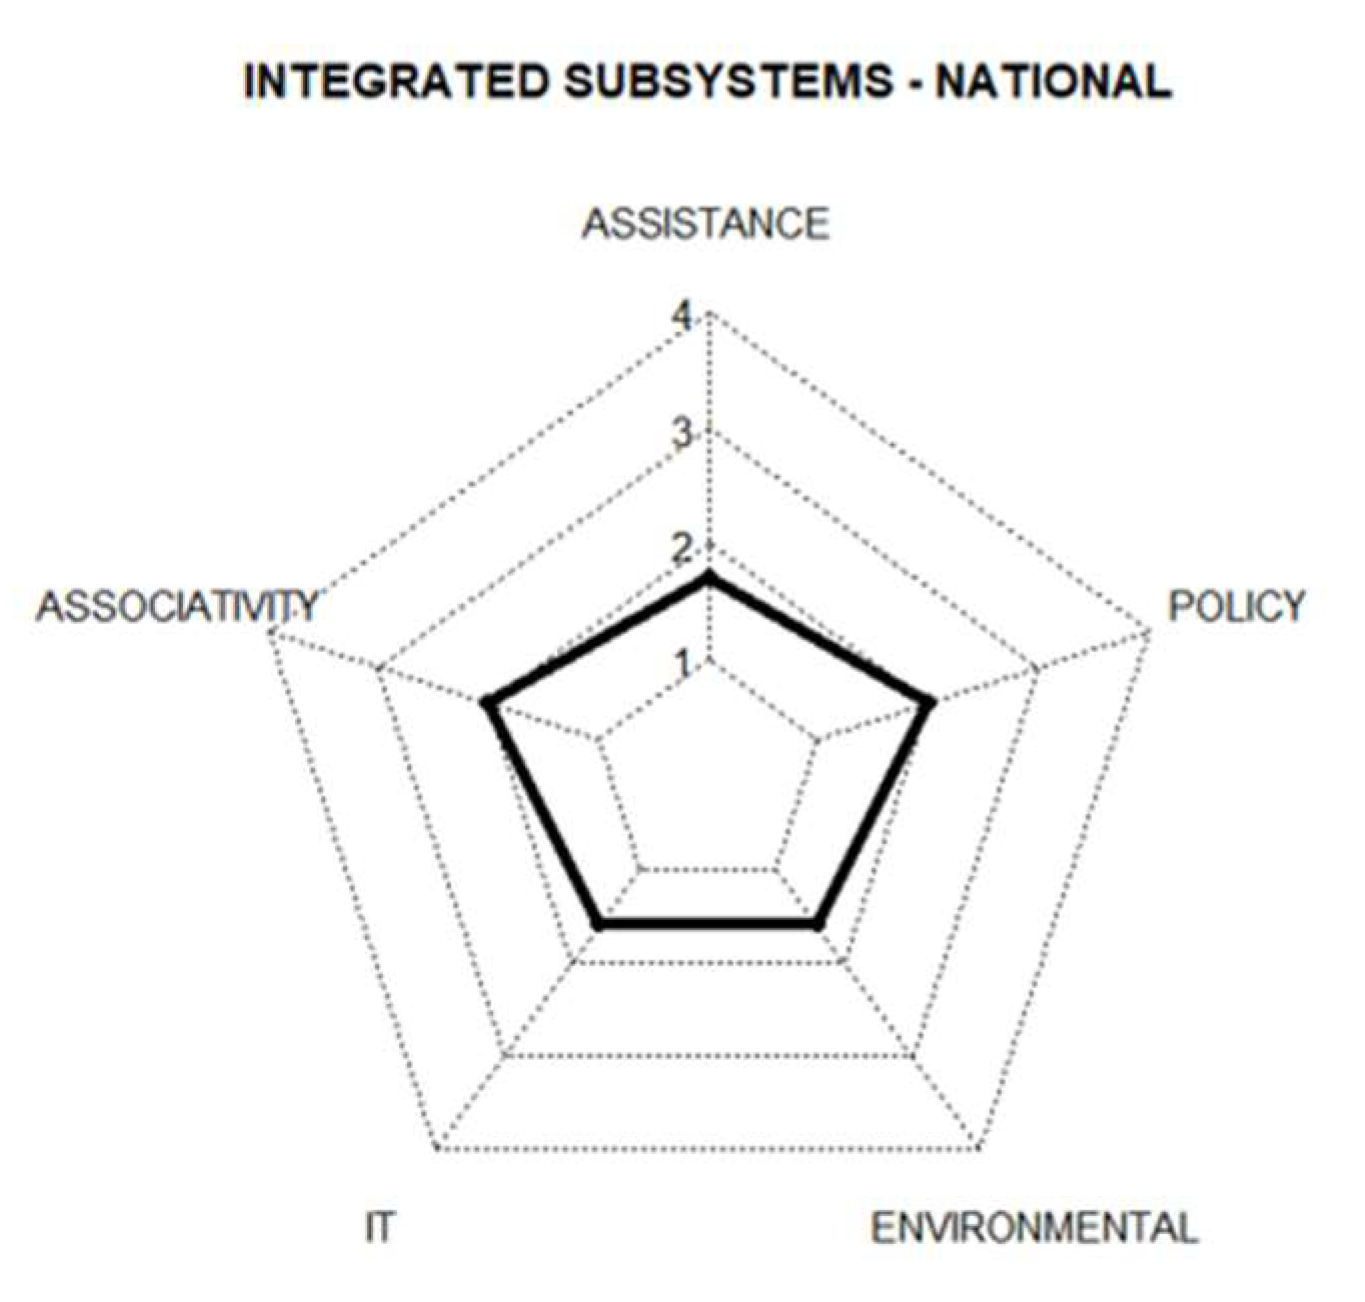
Figure 2.
Grouping subsystems – Tolima. Source: Own elaboration with the RStudio tool.
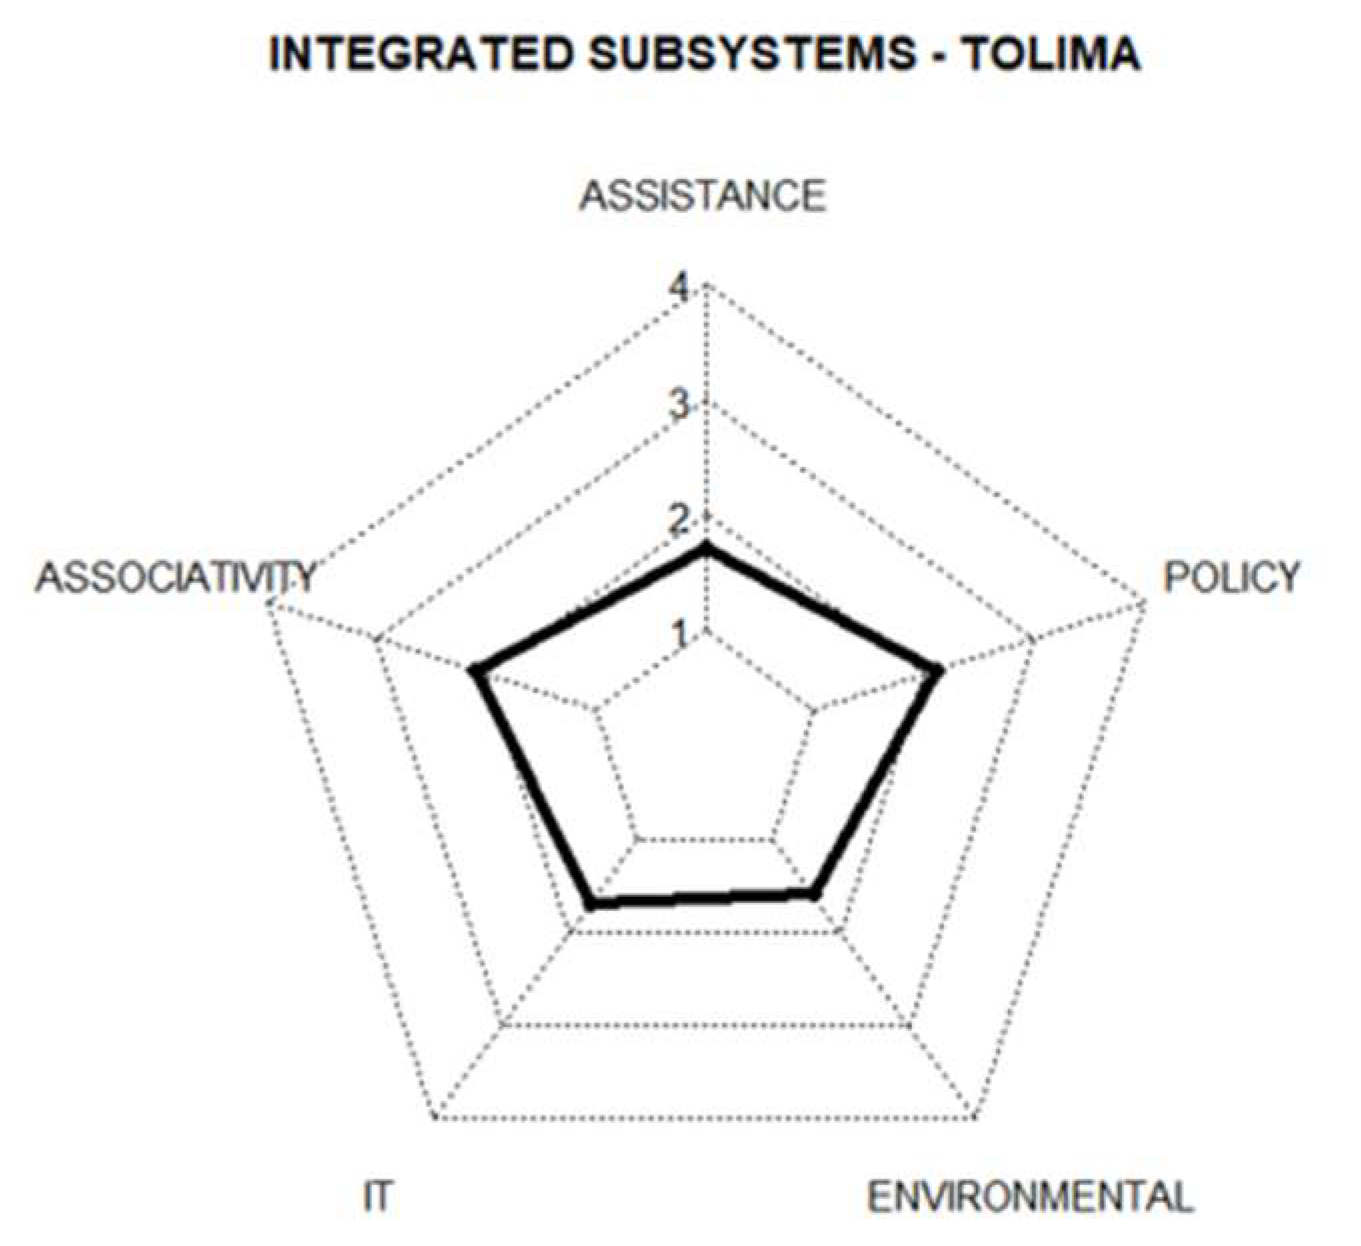
Figure 3.
Grouping Subsystems – Chaparral. Source: Own elaboration with the RStudio tool.
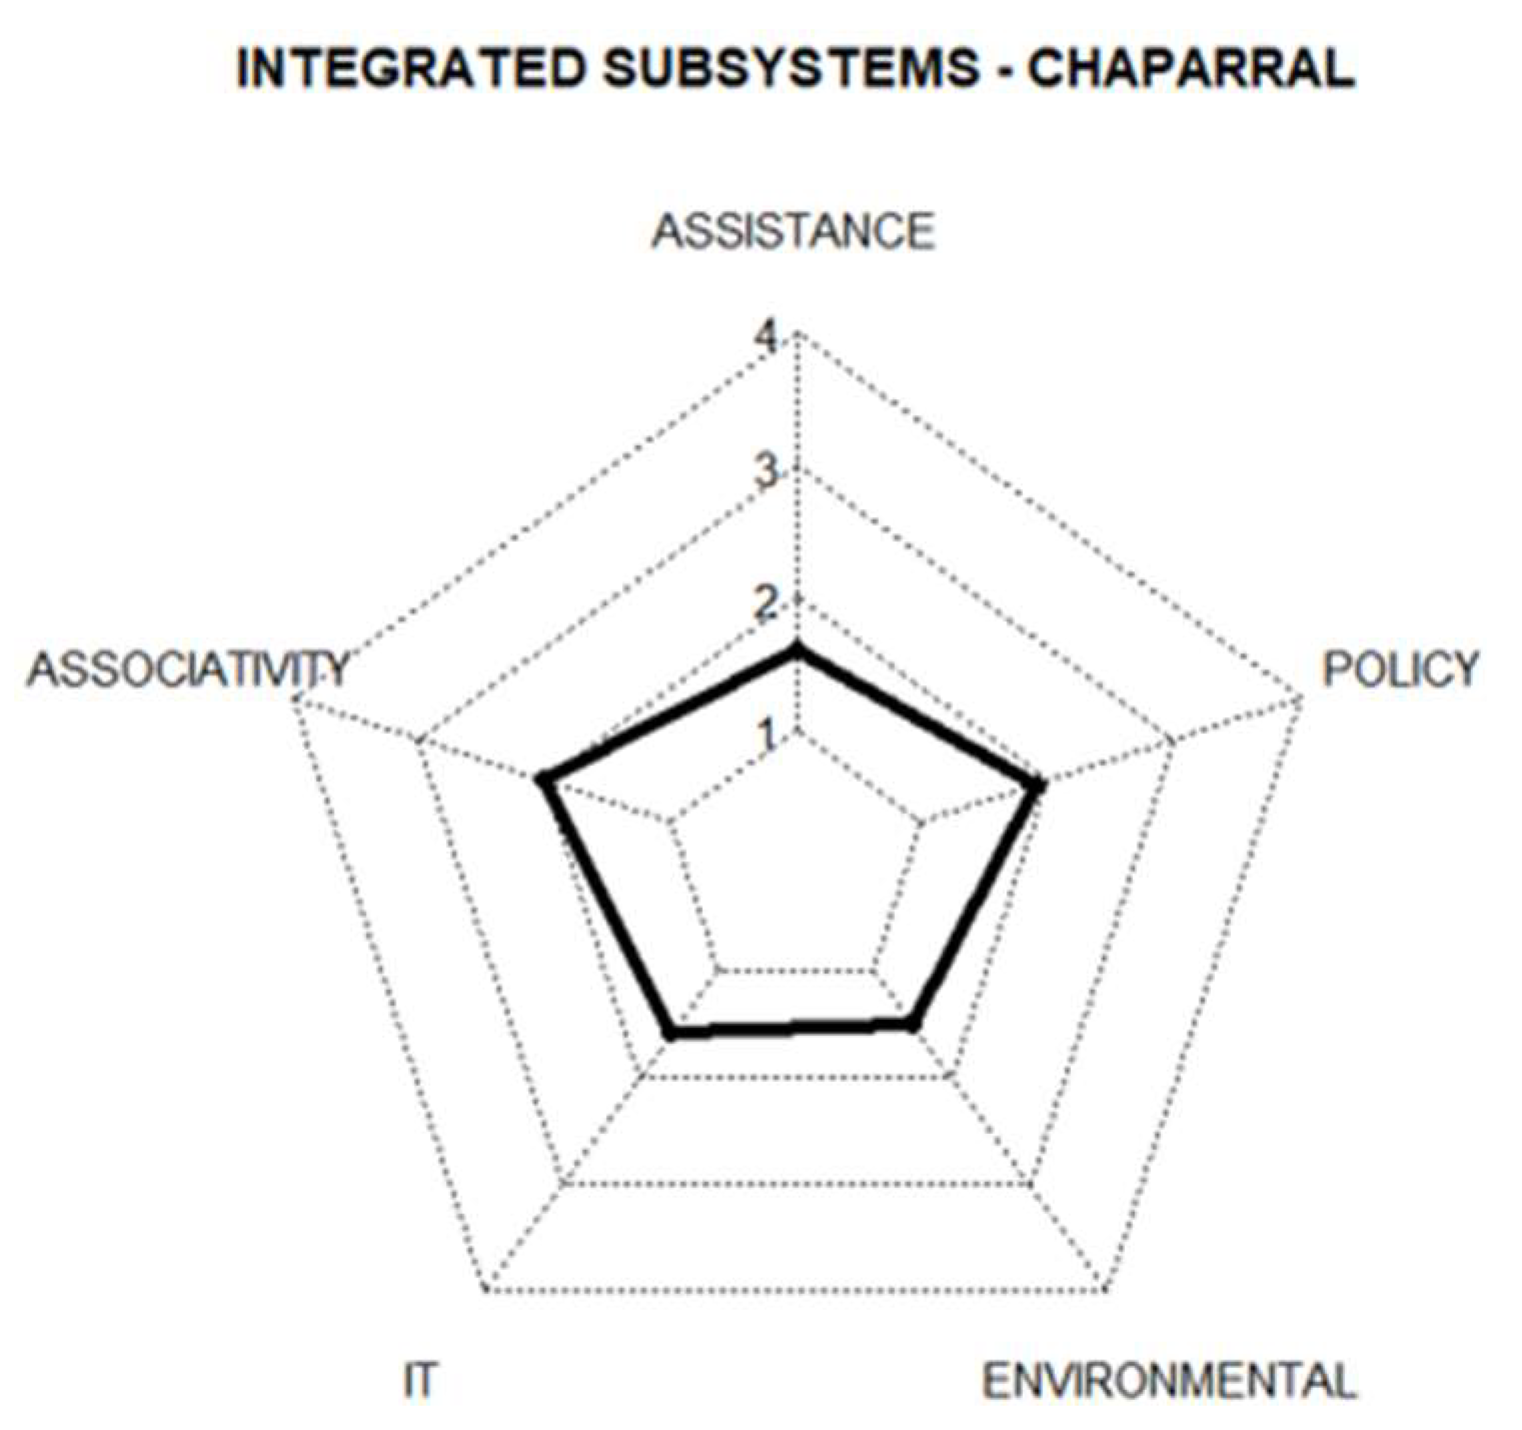
Figure 4.
Grouping subsystems – Rovira. Source: Own elaboration with the RStudio tool.
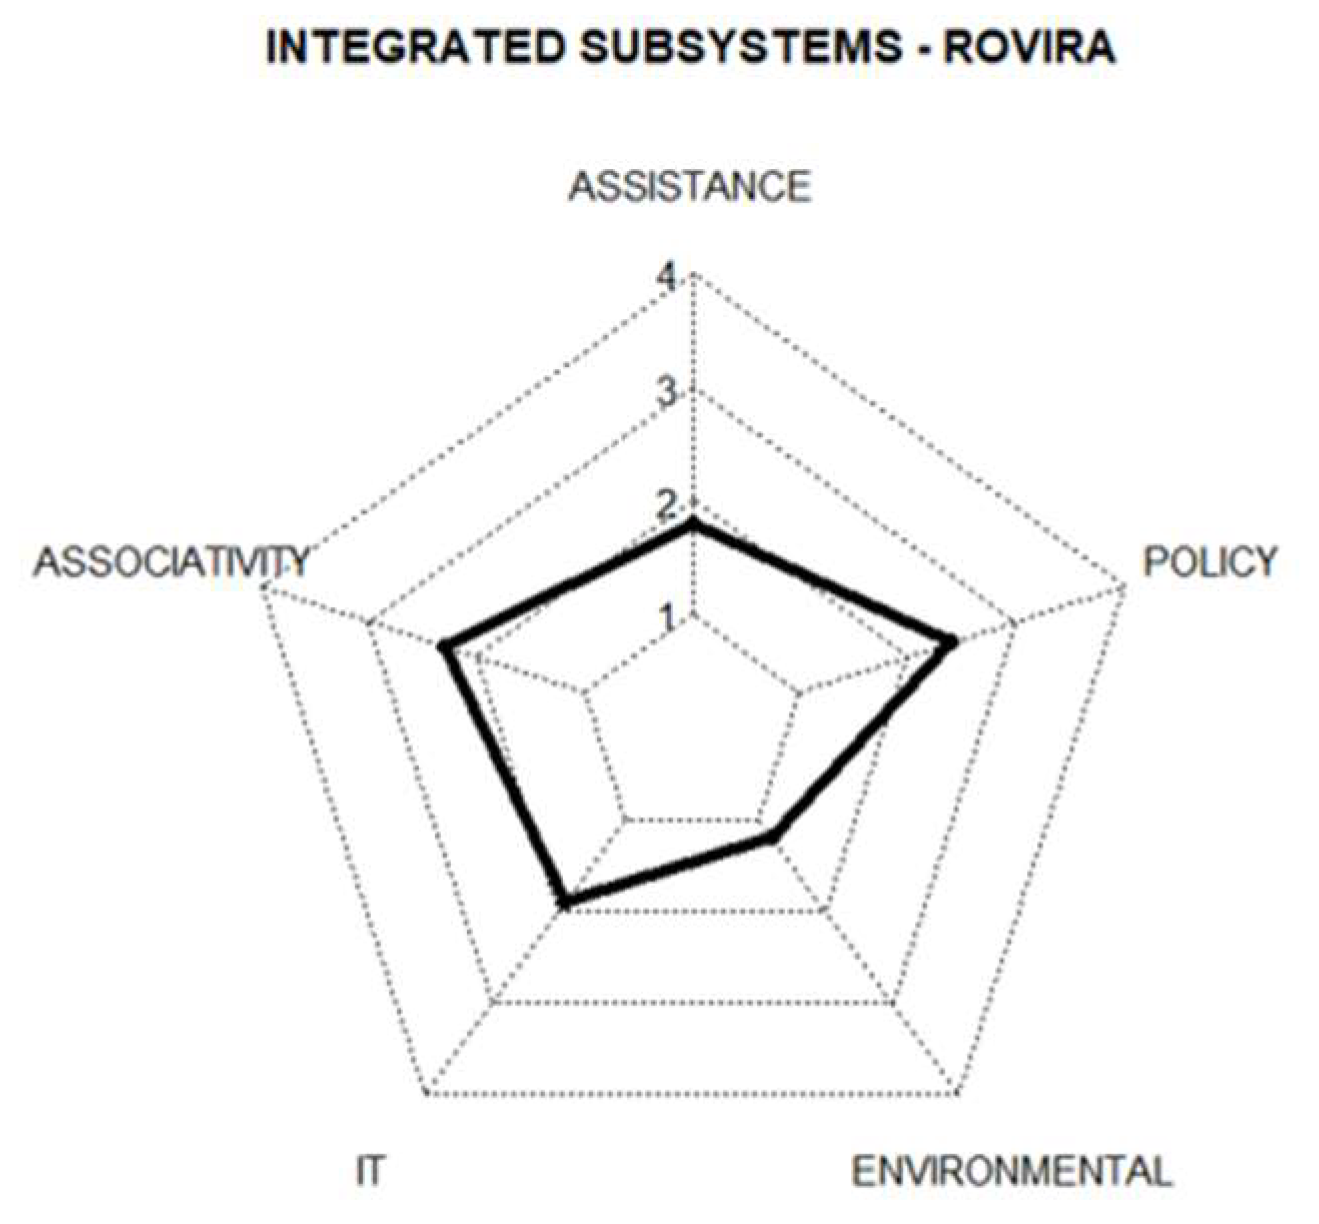
Figure 5.
Grouping Subsystems – National. Source: Own elaboration with the RStudio tool.
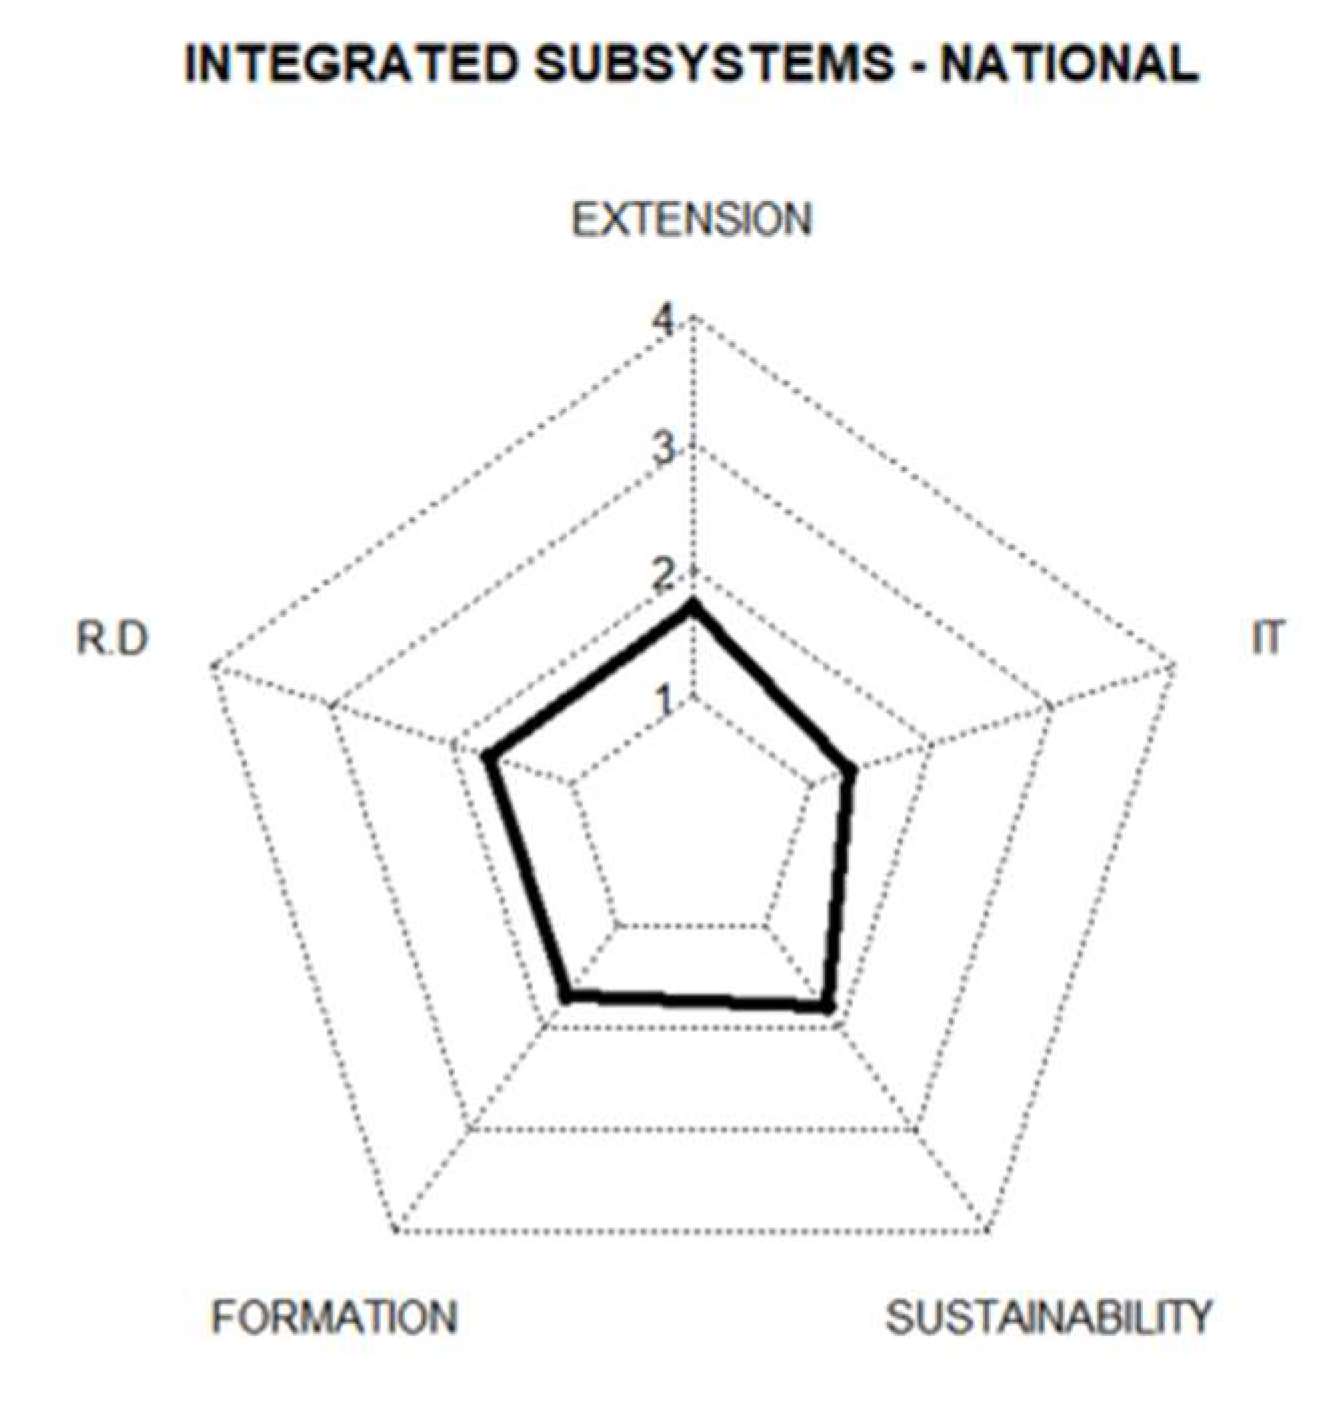
Figure 6.
Grouping subsystems – Tolima. Source: Own elaboration with the RStudio tool.
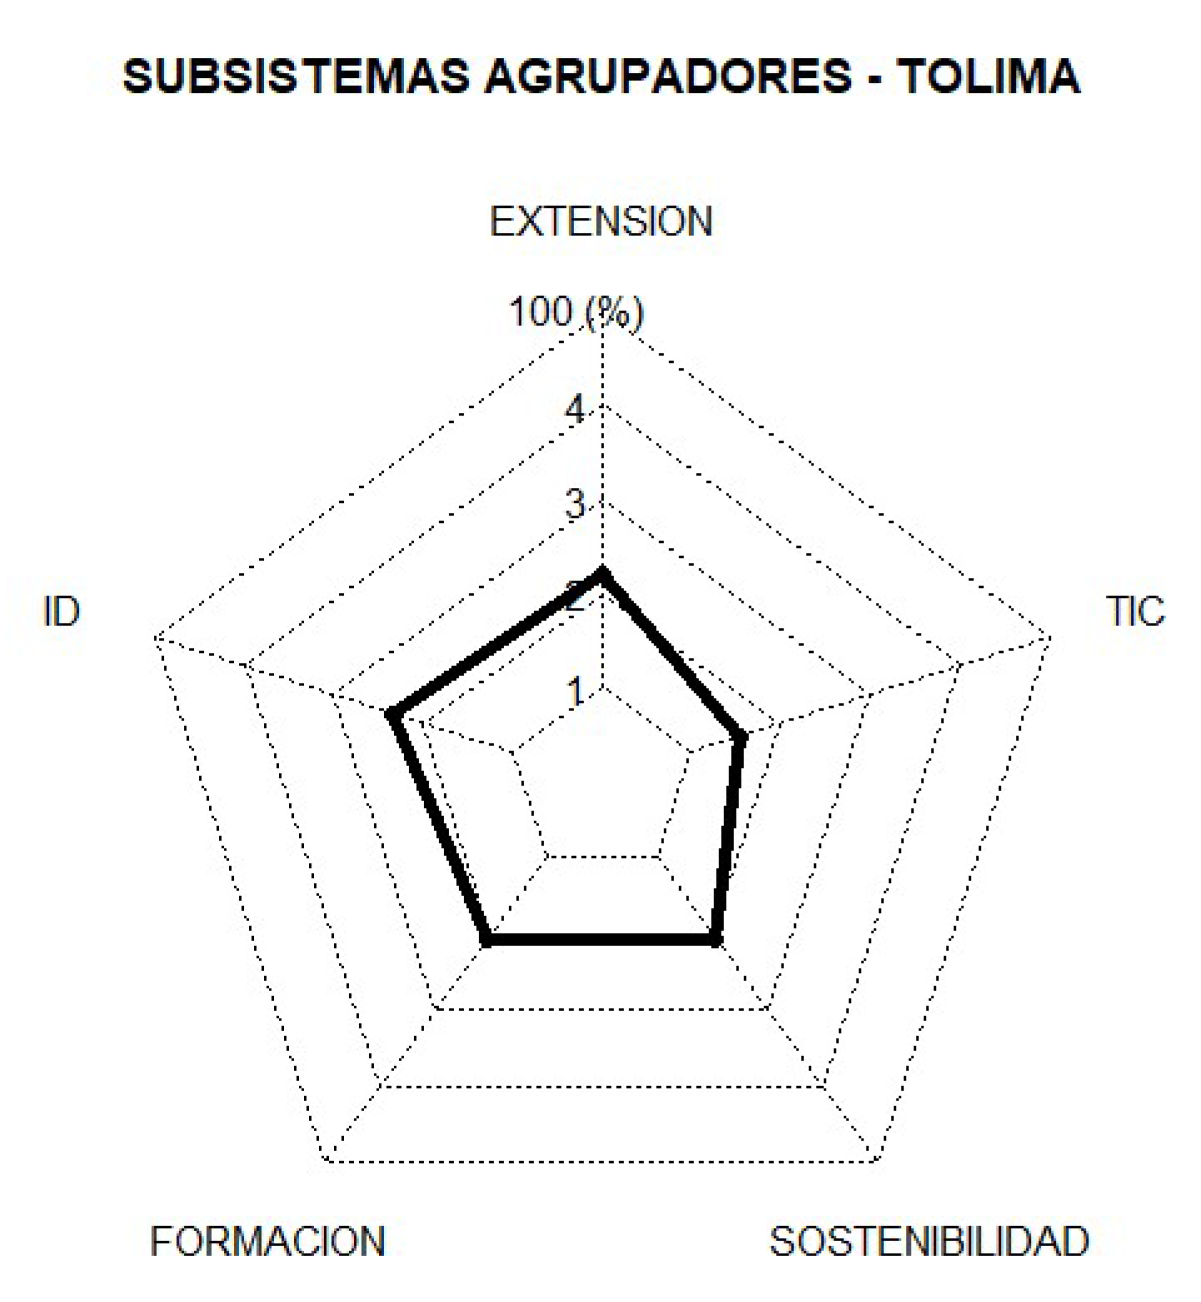
Figure 7.
Grouping sub-systems – Chaparral. Source: Own elaboration with the RStudio tool.
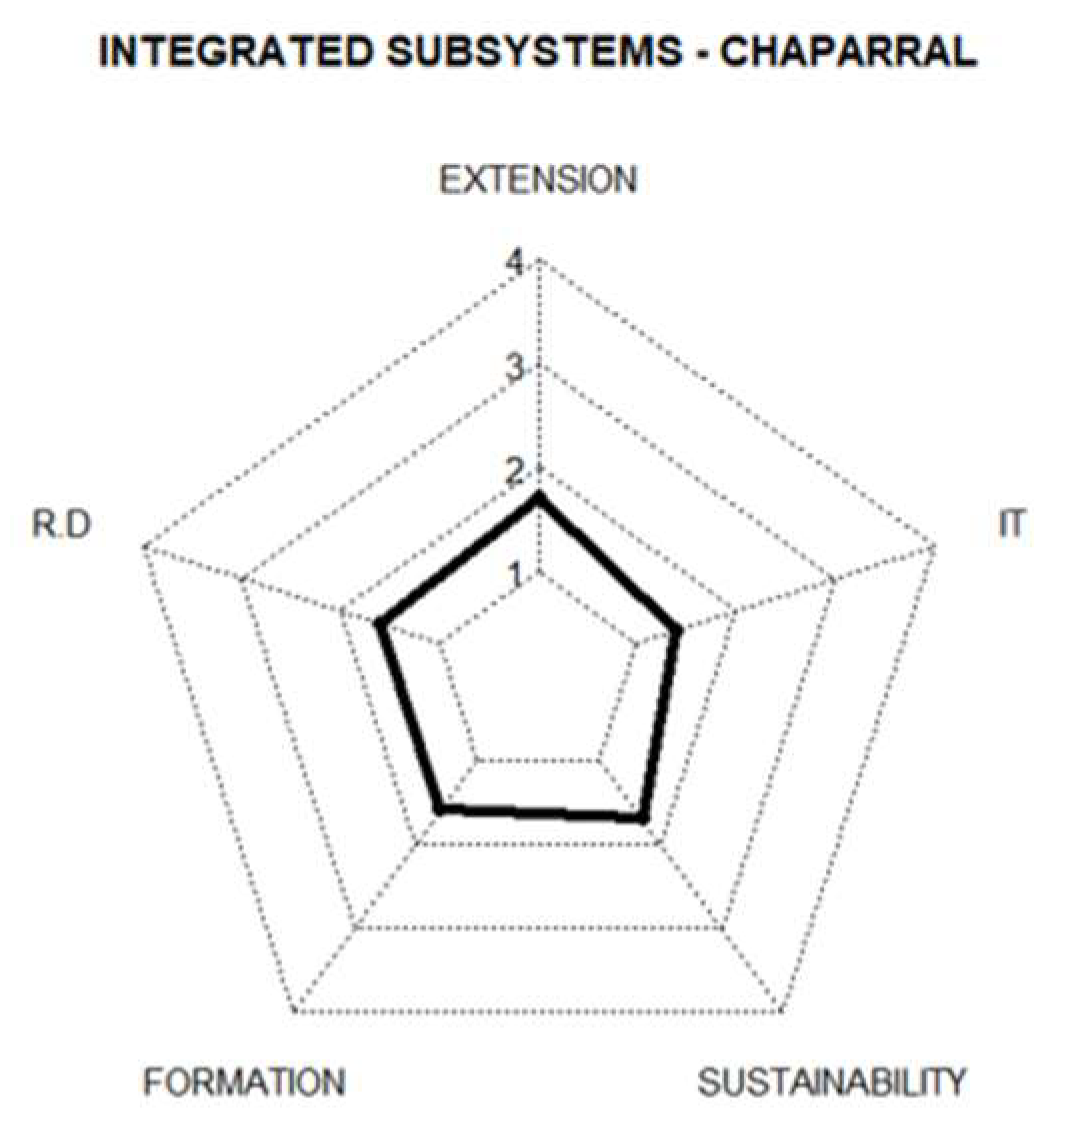
Figure 8.
Grouping subsystems – Rovira. Source: Own elaboration with the RStudio tool.
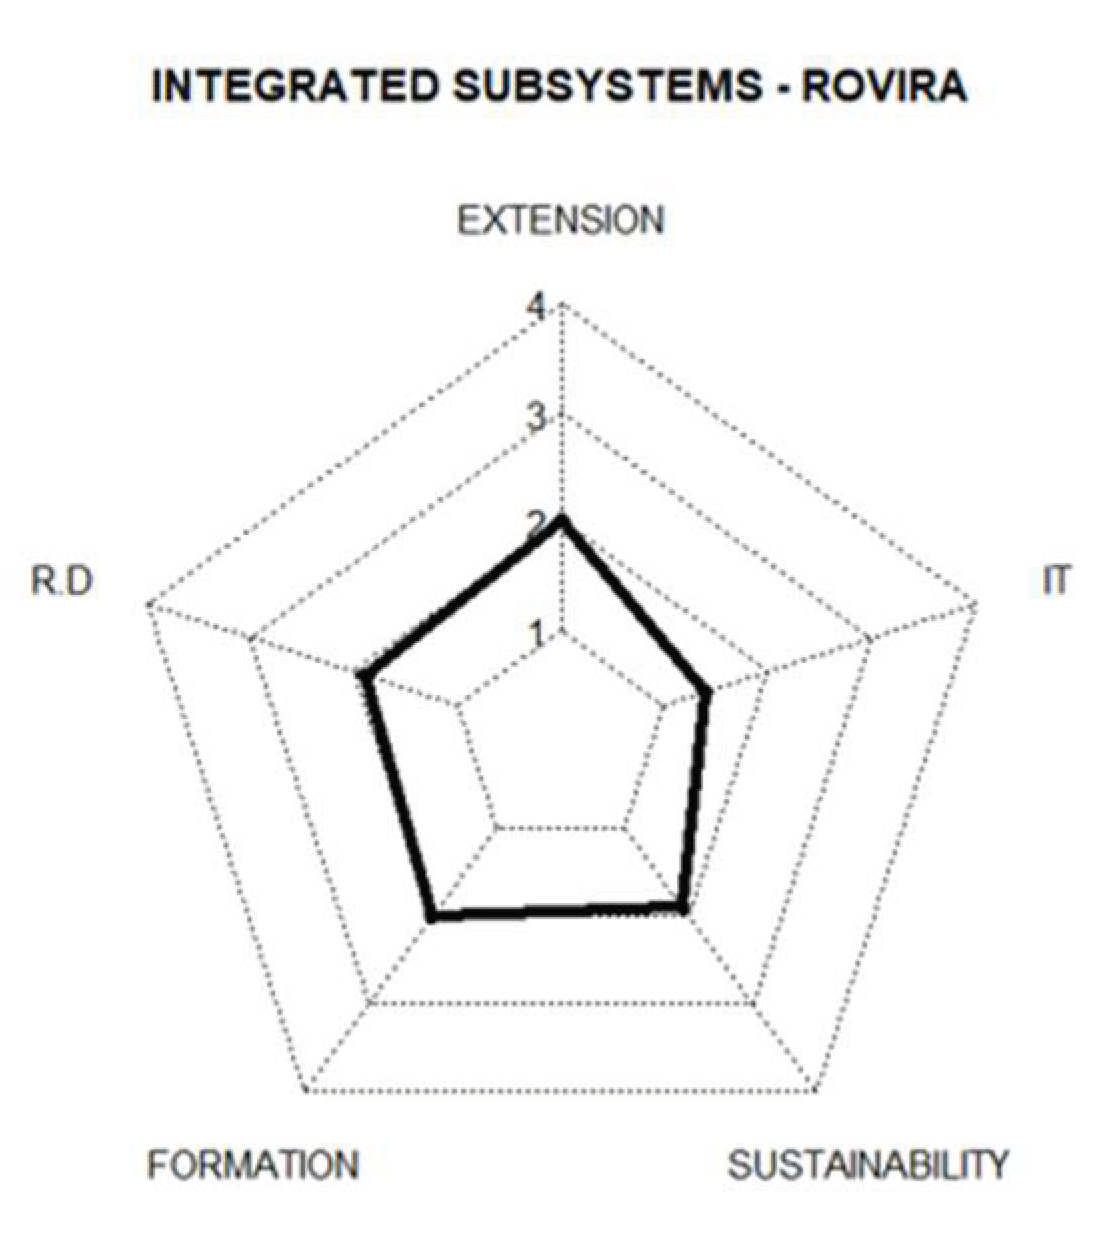
Figure 9.
Gaps identified in the NARS of the department of Tolima - Colombia. Source: Own preparation.
Figure 9.
Gaps identified in the NARS of the department of Tolima - Colombia. Source: Own preparation.
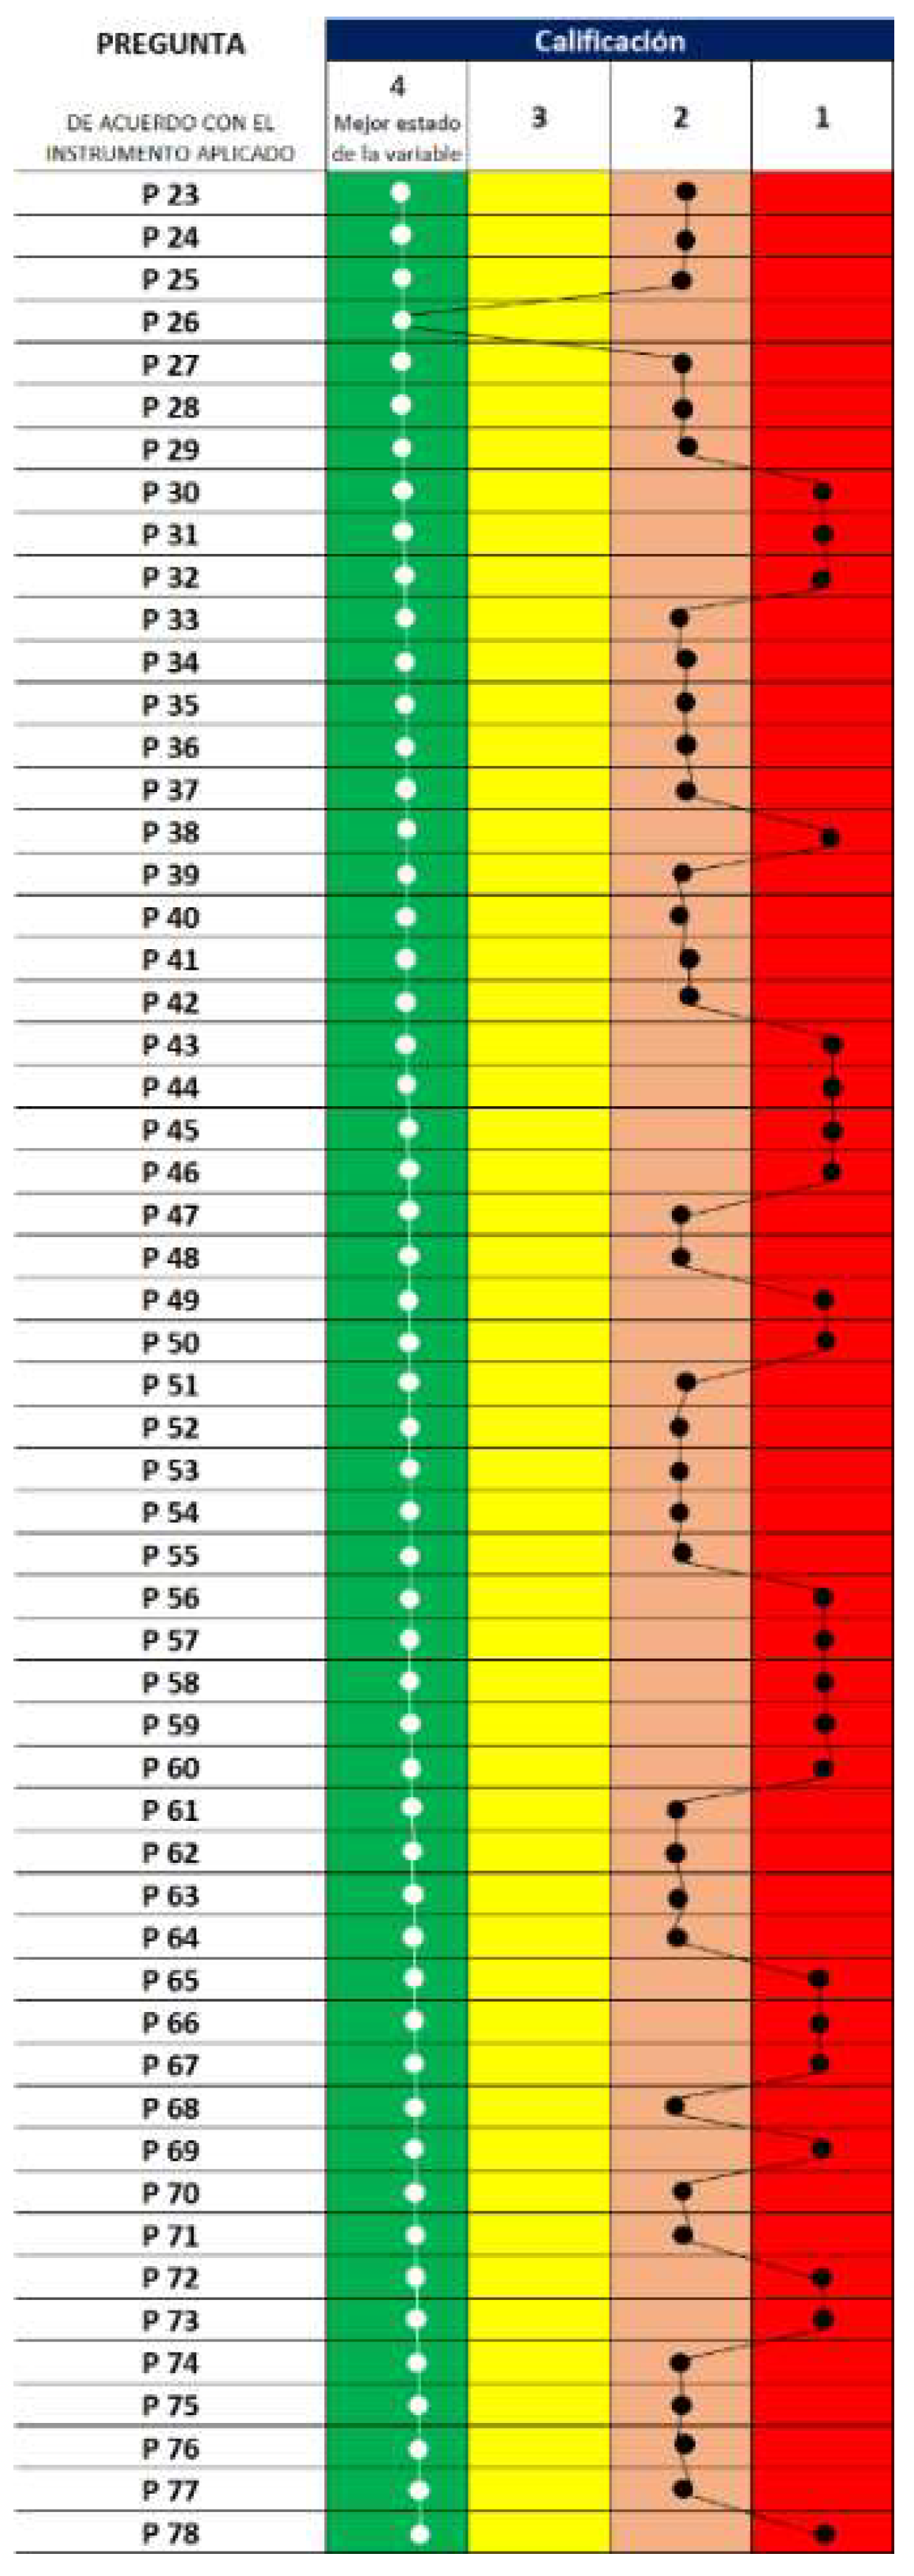

Table 1.
Case Studies on AIS in the worldwide scope.
| Description | Problem addressed | Actors involved | How does the innovation system work? |
|---|---|---|---|
| China compares rural and urban innovation systems and proposes a theoretical structural model of rural innovation systems [37] | Rural decline, poverty, unsustainability, poor land management, etc. | Government, congress, public sector, nonprofit companies, etc. | The study examines previous theories, proposes a three-dimensional model, and points out the challenges to strengthening rural innovation, contributing to national development and rural revitalization. In addition, it uses mixed methods to analyze niche activities in intensive greenhouse agriculture and promote the transition to sustainability through conceptual frameworks and farm management approaches. |
| Explores the processes of transition to sustainability in agriculture through four niche initiatives in the greenhouse sector [38]. | Sustainability, resource depletion, pollution, etc. | Farmers, distributors, cooperatives, processors, etc. | This article uses mixed methods to analyze four case studies in the intensive agriculture system of Almeria, employing diverse conceptual frameworks and multi-stakeholder approaches to explore activity niches. It uses Gliessman's five levels of agroecology framework as a guide for the transition to sustainability in the agri-food system. |
| Social networks play a key role in agricultural innovation by providing farmers with information, knowledge, and resources to boost their innovation efforts, while formal institutions advise on techniques and technologies for apple crops in the Kashmir Valley, India [39]. | Apple tree canker disease, productivity, sustainability | Government organizations, advisors, farmers, policymakers, businesses, traders, processors, transporters, input suppliers, regulatory agencies, extension services, service providers, and civil societies are involved in the agricultural context. | This study collected primary and secondary data from a variety of sources, including focus group discussions and specialized literature, to explore the actors and processes of knowledge generation in the agricultural system. It also provides a platform for future studies on informal innovations and social networks in different aspects of horticulture and the analysis of interactions between informal and formal actors in the innovation and sustainability system. |
| Air pollution, drought, urban heating, energy expenditure, extreme temperature fluctuations inside buildings, and poor or contaminated soils [40]. In Mexico | Urban agriculture in Mexico City is analyzed as an innovation system that includes boundaries, dynamics, institutions, knowledge, and learning cultures, being an integral part of the ecological infrastructure for urban sustainability and resilience, where vertical and rooftop gardens play an important role in the greening of cities. | Institutions, industries, government, NGOs, private companies, households, start-up companies of young academic graduates | Between 2007 and 2012, the Mexico City government invested US$6 million in 2,800 urban agriculture projects, benefiting 15,700 inhabitants and supporting 3,000 families with rooftop gardens and green roofs on schools and government buildings, thus fostering small-scale, sustainable urban agriculture in the city. |
| Smart agriculture improves efficiency and sustainability through technologies such as IoT and drones. This study in Antioquia, Colombia, analyzes the banana chain and simulates interactions between actors to develop technological capabilities and address productivity and sustainability problems [41]. In Colombia. | Low productivity of banana crops, unsustainable crops | Agents, explorers, intermediaries, and exploiters | This paper presents an agent-based model that simulates interactions and learning in a competitive environment, representing demands as opportunities for innovation. The model is structured in five procedures that include the construction of offers, decision rules, and the local learning process, allowing one to observe the specialization patterns and accumulation of capabilities of competing agents. |
| This article analyzes the role of digital platforms, using the case study of KisanMitr, in connecting and facilitating the agricultural innovation and entrepreneurship ecosystem [42] In India. | Sustainability in pandemic | Governments and farmers | Digital platforms can be the backbone of integrated agricultural innovation systems, but it is important to keep the focus on farmers, foster mutual engagement, and address potential governance issues to have a meaningful impact. |
Source: Own elaboration based on the authors referenced inside the table.
Table 2.
Objectives and proposed phases .
| Phase | Shares |
|---|---|
| 1 | -Manage and execute four pilots in 8 municipalities (2 for each pilot). - Identify and collect information from the UPA (Agricultural Production Units) - Identify and collect information from the UPAs (Agricultural Production Units). -Prioritization of municipalities. -Design pilot instruments for data collection. -Implement pilots |
| 2 | - Identify distinctive characteristics of each municipality (geographic location, population, territorial dispersion, productive chain, organic production, focus on carbon emissions reduction. -Analyze gaps in access to ICTs in the pilots. |
| 3 | - Identify and articulate actors that generate and implement knowledge in agricultural science, technology, and innovation. -Closing of gaps and spaces for social participation. -Information gathering and analysis with mapping of actors and variables. |
| 4 | -Generate a final document with conclusions and recommendations for each pilot implemented. |
Source: Own elaboration.
Table 3.
Gaps in user classification by municipality.
| MUNICIPALITY | TECHNICAL ASSISTANCE | ASSOCIATIVITY | ICTs | ENVIRONMENTAL | PUBLIC POLICY |
|---|---|---|---|---|---|
| SAN JUAN NEPOMUCENO | 1,445844905 | 2,168874172 | 1,454746137 | 1,311258278 | 1,390728477 |
| SANTA ROSA DEL SUR | 1,825591398 | 2,043333333 | 1,728888889 | 1,855555556 | 2,252380952 |
| JURADÓ | 1,52660243 | 2,214285714 | 1,536796537 | 1,443181818 | 2,305194805 |
| SAN JOSÉ DEL PALMAR | 1,45655914 | 1,533333333 | 1,26 | 1,356666667 | 1,366666667 |
| CABUYARO | 2,129462366 | 1,94 | 2,12 | 1,851666667 | 2,31047619 |
| VISTAHERMOSA | 1,549677419 | 1,916666667 | 1,345555556 | 1,441666667 | 1,86 |
| CHAPARRAL | 1,635913978 | 2,013333333 | 1,551111111 | 1,477222222 | 1,885714286 |
| ROVIRA | 1,841505376 | 2,276666667 | 1,897777778 | 1,166666667 | 2,402857143 |
Source: Own elaboration.
Table 4.
NAIS grids grouped by municipality.
| MUNICIPALITY | EXTENSION | I+D | TRAINING | SUSTAINABILITY | INNOVATION AND ICTs |
|---|---|---|---|---|---|
| BOLÍVAR | |||||
| SAN JUAN NEPOMUCENO | 1,189042745 | 1,498896247 | 1,448675497 | 1,700662252 | 1,221192053 |
| SANTA ROSA DEL SUR | 2,076363636 | 1,9 | 1,463333333 | 2,107333333 | 1,476 |
| CHOCÓ | |||||
| JURADÓ | 1,989964581 | 1,649350649 | 1,998376623 | 1,792207792 | 1,161038961 |
| SAN JOSÉ DEL PALMAR | 1,131515152 | 1,254074074 | 1,275 | 1,566666667 | 1,078666667 |
| TOLIMA | |||||
| CABUYARO | 2,209090909 | 2,221481481 | 2,231666667 | 2,148 | 1,785333333 |
| VISTAHERMOSA | 1,38969697 | 1,400740741 | 1,698333333 | 1,702 | 1,225333333 |
| META | |||||
| CHAPARRAL | 1,704848485 | 1,551111111 | 1,55 | 1,655333333 | 1,333333333 |
| ROVIRA | 2,025454545 | 1,991851852 | 2,041666667 | 1,994666667 | 1,366666667 |
Source: Own elaboration.
Table 5.
Gaps per question by department.
| MUNICIPALITY | P 23 | P24 | P25 | P26 | P27 | P28 | P29 | P30 |
|---|---|---|---|---|---|---|---|---|
| NATIONAL | 1,312863 | 1,637344 | 2,145228 | 2,701245 | 2,715353 | 2,053112 | 1,629876 | 1,636515 |
| BOLÍVAR | 1,395349 | 1,664452 | 1,903654 | 2,408638 | 2,817276 | 2,431894 | 1,408638 | 1,604651 |
| CHOCÓ | 1,009868 | 1,174342 | 2,082237 | 2,144737 | 2,746711 | 1,565789 | 1,391447 | 1,401316 |
| META | 1,21 | 1,816667 | 2,2 | 2,983333 | 2,646667 | 2,06 | 1,916667 | 1,83 |
| TOLIMA | 1,64 | 1,9 | 2,396667 | 3,276667 | 2,65 | 2,16 | 1,806667 | 1,713333 |
| P31 | P32 | P33 | P34 | P35 | P36 | P37 | P38 | |
| NATIONAL | 1,568465 | 2,020747 | 1,747718 | 1,73029 | 1,870539 | 1,745228 | 1,848133 | 1,808299 |
| BOLÍVAR | 1,44186 | 1,860465 | 1,54485 | 1,531561 | 1,647841 | 1,724252 | 1,564784 | 2,179402 |
| CHOCÓ | 1,552632 | 2,332237 | 1,901316 | 1,582237 | 1,851974 | 1,161184 | 1,769737 | 1,309211 |
| META | 1,673333 | 2,11 | 1,773333 | 1,983333 | 1,906667 | 1,863333 | 2,203333 | 1,813333 |
| TOLIMA | 1,606667 | 1,776667 | 1,77 | 1,826667 | 2,076667 | 2,24 | 1,856667 | 1,936667 |
| P39 | P40 | P41 | P42 | P43 | P44 | P45 | P46 | |
| NATIONAL | 1,777593 | 1,908714 | 1,712863 | 2,024066 | 1,321162 | 1,302075 | 1,612448 | 1,321992 |
| BOLÍVAR | 1,372093 | 1,684385 | 1,700997 | 1,92691 | 1,20598 | 1,189369 | 1,774086 | 1,202658 |
| CHOCÓ | 1,789474 | 1,957237 | 1,559211 | 1,960526 | 1,026316 | 1,006579 | 1,098684 | 1,049342 |
| META | 1,986667 | 2,12 | 1,75 | 2,09 | 1,446667 | 1,45 | 1,86 | 1,55 |
| TOLIMA | 1,963333 | 1,873333 | 1,843333 | 2,12 | 1,61 | 1,566667 | 1,723333 | 1,49 |
| 47 | 48 | 49 | 50 | 51 | 52 | 53 | 54 | |
| NATIONAL | 1,907884 | 1,841494 | 1,583402 | 1,559336 | 2,082158 | 2,123651 | 1,66971 | 1,73195 |
| BOLÍVAR | 2,046512 | 1,657807 | 1,923588 | 1,568106 | 2,604651 | 2,395349 | 1,754153 | 1,674419 |
| CHOCÓ | 1,940789 | 1,700658 | 1,154605 | 1,279605 | 1,779605 | 2,203947 | 1,444079 | 1,615132 |
| META | 1,943333 | 1,963333 | 1,823333 | 1,823333 | 2,173333 | 2,153333 | 1,613333 | 1,903333 |
| TOLIMA | 1,7 | 2,046667 | 1,436667 | 1,57 | 1,773333 | 1,74 | 1,87 | 1,736667 |
| 55 | 56 | 57 | 58 | 59 | 60 | 61 | 62 | |
| NATIONAL | 1,627386 | 1,164315 | 1,437344 | 1,19668 | 1,242324 | 1,610788 | 2,050622 | 2,106224 |
| BOLÍVAR | 1,332226 | 1 | 1,614618 | 1,136213 | 1,209302 | 1,780731 | 1,900332 | 2,20598 |
| CHOCÓ | 1,424342 | 0,967105 | 1,026316 | 1,013158 | 1,055921 | 1,539474 | 2,243421 | 1,759868 |
| META | 1,78 | 1,406667 | 1,656667 | 1,42 | 1,48 | 1,563333 | 2,07 | 2,3 |
| TOLIMA | 1,976667 | 1,286667 | 1,456667 | 1,22 | 1,226667 | 1,56 | 1,986667 | 2,163333 |
| P63 | P64 | P65 | P66 | P67 | P68 | P69 | P70 | |
| NATIONAL | 2,229876 | 2,26971 | 1,40332 | 1,562656 | 1,517012 | 1,786722 | 1,19668 | 1,752697 |
| BOLÍVAR | 2,425249 | 2,481728 | 1,428571 | 1,388704 | 1,182724 | 1,421927 | 1,026578 | 1,923588 |
| CHOCÓ | 2,101974 | 2,328947 | 1,154605 | 1,638158 | 1,503289 | 1,950658 | 1,072368 | 1,493421 |
| META | 2,263333 | 2,16 | 1,673333 | 1,656667 | 1,853333 | 2,056667 | 1,436667 | 1,586667 |
| TOLIMA | 2,13 | 2,106667 | 1,36 | 1,566667 | 1,53 | 1,716667 | 1,253333 | 2,01 |
| P71 | P72 | P73 | P74 | P75 | P76 | P77 | P78 | |
| NATIONAL | 1,99751 | 1,379253 | 1,628216 | 1,985892 | 1,950207 | 1,502905 | 2,458921 | 1,721992 |
| BOLÍVAR | 1,887043 | 1,096346 | 1,827243 | 1,933555 | 1,817276 | 1,518272 | 2,48505 | 1,212625 |
| CHOCÓ | 1,914474 | 1,611842 | 1,355263 | 1,9375 | 1,944079 | 1,075658 | 2,404605 | 1,710526 |
| META | 2,09 | 1,5 | 1,763333 | 1,963333 | 2,013333 | 1,596667 | 2,793333 | 2,32 |
| TOLIMA | 2,1 | 1,306667 | 1,57 | 2,11 | 2,026667 | 1,826667 | 2,153333 | 1,646667 |
Source: Own elaboration.
Table 6.
A detailed analysis of the key players in the agricultural and rural sector in Colombia.
| Aspect to be assessed | Result analysis |
| 1) Programs for training and universities related to agriculture | The regional innovation systems mapping analysis highlights the concentration of institutions and educational programs in environmental issues and agribusiness, especially in Bolivar and Meta, which implies a strategic focus on sustainable development, collaboration with industry, and specialized training, with the presence of several institutions in Tolima. |
| 2) Main agricultural extension organizations and implementers of agricultural, agro-industrial, and environmental projects | In the analysis of agricultural extension organizations in four departments, Bolívar stands out with 42.20% of the 109 organizations identified due to its size and number of municipalities. In Tolima and Chocó, AGROSAVIA and the Universidad Nacional are leading agricultural and agroindustrial projects, and in Tolima PROTABACO SAS and UNISARC also stand out as executors, with UNISARC focusing on academic areas of rural development and agricultural sciences. |
| 3) Departmental Agenda for Competitiveness and Innovation ADCI - Tolima | In 2020, in Tolima, priority was given to several agricultural and cross-cutting projects, such as value-added coffee, 4.0 technology in livestock, cocoa, and fish agribusiness, as well as initiatives in renewable energy, tertiary roads, competitiveness and innovation, and a technology development center. There is also mention of a dairy agroindustrial facility project in Roncesvalles and Cajamarca. |
| 4) Maps of territorial stakeholders linked to agricultural and rural development | In agricultural and rural development in Tolima, the territorial actors include various components and entities, from the Sectional Council for Agricultural Development to universities, producer associations, and governmental entities such as National Parks, CORTOLIMA, the Governor's Office, and other institutions. |
| 5) Relationship of actors in the agricultural R&D subsystem in the departments of Chocó, Meta, Tolima, and Bolivar. | According to the Departmental Competitiveness Index Tolima, Bolívar, Meta and Chocó [43] have low positions in competitiveness and R&D&I, occupying positions 11 and 12 respectively. Given this, it is crucial to promote projects that drive innovation in the agricultural sector, involving key stakeholders according to the UNCTAD framework and Law 1876 [17]. |
| 6) Research collaboration: Co-authorships and alliances | The territorial distribution of research indexed in Scopus was analyzed, using co-authorships in 42 scientific articles, with Tolima accounting for 47.61% and Meta for 33.33%, and the collaboration of the Nataima Research Center Agrosavia with several institutions in 5 related publications stands out. with agriculture. |
| 7) Exploration of relationships in agricultural patents registered in Colombia | The Lens Patents database was used to analyze the relationships in Colombian agricultural patents utilizing keyword search equations, obtaining 50 registered patents. Although there were no collaborative patents in the four departments studied, institutional relationships and international collaborations were found in the ownership of agricultural patents in Colombia. |
| 8) Analysis of project profiles registered with the Rural Development Agency [44]- | In the analysis of project profiles registered with the Rural Development Agency during 2020, Tolima leads with 44.44% participation, followed by Meta with 22.22%. The livestock sector is prominent in the profiles (13.46%), followed by coffee and poultry (9.61%). Stakeholders include small producers, indigenous reserves, Afro-descendant families, production chains, and families, showing collaboration in the formulation of the profiles. |
| 9) Projects under implementation and executed financed by various sources | The analysis of projects executed and to be executed with various sources of financing shows that Tolima leads in comparison with Chocó and Bolívar, addressing areas such as planting material, genetic improvement, sanitary management, soil and water management, and geographic information systems, with frequent participation of entities such as AGROSAVIA, UNAL, CIB, Universidad del Tolima, UTP, PROTABACO SAS and UNISARC, among others. |
| 10) Optimizing the relationship between financing and government in the General Royalties System | The analysis of the relationship of entities and territories with the General Royalties System as a source of financing in Agriculture and CTeI reveals that Chocó and Bolívar have the best relationship, with more than 440 thousand and 417 billion Colombian pesos, respectively, while Tolima has the lowest relationship, with 191 billion. Tolima leads the execution of projects financed by the SGR in Agriculture and Rural Development, addressing issues such as rural housing, coffee, livestock, cocoa, sanitary units, and fish farming. |
| 11) Overview of SGR resources for CTeI | Regarding SGR resources for CTeI, the outstanding relationship of the two departments with the SGR's CTeI Fund stands out: Bolivar leads with 29 projects (31.52%) and Tolima follows with 27 projects (29.34%) of the 92 projects financed. |
| 12) Public investment projects financed with resources from the General Royalties System - SGR (2022) | The financing resources of the SGR's CTeI Fund for the 4 Departments are observed with Bolivar leading (44.18%) and Chocó (29.63%). In Tolima, projects CTeIare being executed with $130,268,736,977, focusing on training, the Sheep and Goat Chain, CyTCapacities, and Cocoa, with outstanding participation of the Government, the University of Tolima and Agrosaviain their execution. It is also noted that the SGR's CTeI Fund has helped finance Tolima projects in different agricultural products, such as avocado, and coffee, among others. |
| 13) Analysis of associations, cooperatives, agricultural, and related foundations in the regions. | In the analysis of associations, cooperatives, agricultural foundations, and similar in the region, Meta leads in associativity with 294 entities (39.72% of the total), followed by Tolima with 242 organizations (72.43% of the four territories). In Tolima, associations predominate (92.56%), and there is a greater presence of foundations compared to Meta. |
| 14) Analysis of the relationship between associations or cooperatives and other entities | The news analysis shows that the relationship between associations and cooperatives has been mainly with state entities such as the Ministries of Agriculture and Rural Development, Governors' Offices, ICBF, and Mayors' Offices, as well as with NGOs and foundations for knowledge transfer, training, productivity improvement, certification. food supply, dissemination of results, and financing. |
| 15) Analysis of cluster initiatives (agricultural and related) in the regions of interest | A cluster is a geographic concentration of companies and entities related to similar activities, intending to foster competitive cooperation to improve quality, reduce costs, and increase productivity and profitability. Bolivar, Meta, and Tolima have 2 registered agricultural clusters, while Chocó has none. The initiatives arise from the Regional Commission for Competitiveness and Innovation with the support of the Chambers of Commerce. In the department of Tolima, there is information on a cluster initiative registered for the cocoa agrifood chain and an initiative for the specialty coffee subsector. |
| 16) Cabildos and Indian Reservations | The Cabildos and reservations are forms of association that legally represent indigenous communities, and the reservations are territorial divisions that guarantee ownership over customary inhabited territories. Of these, 251 were identified in the four Departments, with Chocó standing out with 55.4% and Tolima with 32.6% of the communities grouped. |
| 17) Relationships between research groups and institutions in Colombia - agro and related groups in the regions | According to the database of the Ministry of Science Technology and Innovation of Colombia, in the call for recognition of research groups (Call 833 of 2018) between 2018 and 2019, 20 groups were identified in the 4 territories analyzed in the area of agriculture and related areas. The department of Meta has the most recognized groups (10), followed by Tolima (8) and Chocó (2), while Bolívar reports no groups in these areas. Groups such as the Agroforestry Livestock Systems Research Group of the University of Tolima and Conservation Agriculture for Low Tropic Soils of Agrosavia Meta show opportunities for collaboration in the science, technology, and innovation system. |
| 18) Technoparks in the regions and Technology Transfer Offices OTRIS | In the regions analyzed (Chocó, Bolívar, Tolima, and Meta), only one Tecnoparque SENA was found in the Department of Tolima, and no technology transfer offices or corporations were found in any of the territories. Although some universities have Research Results Transfer Offices (OTRIS), they focus on internal transfer. Despite the lack of OTRIS, the regions can access services from other nearby OTRIS, such as Reddi in Cali, CONNECT in Bogota, OTRI Estratégica de Oriente in Bucaramanga and CIENTECH in Barranquilla. |
Table 7.
Gaps in the relationships between the actors of the National Science, Technology, and Innovation System in the field of agriculture: findings from the weighting matrix.
Table 7.
Gaps in the relationships between the actors of the National Science, Technology, and Innovation System in the field of agriculture: findings from the weighting matrix.
| 1. Collaboration Articles scientific articles | |||||
| Department | Population |
No. Articles co-authorship |
No. Articles in.Co-authorship Co-authorship about population. |
Score max.Score max. |
Score Co-authorships articles |
| Tolima | 1.339.998 | 20 | 0,00001493 | 5 | 5,00 |
| Meta | 1.053.871 | 14 | 0,00001328 | 5 | 4,45 |
| Bolívar | 2.130.000 | 5 | 0,00000235 | 5 | 0,79 |
| Chocó | 549.225 | 2 | 0,00000364 | 5 | 1,22 |
| 1. Collaboration Patents | |||||
| Department | Population |
No. Patents collaboration |
No. Patents in Collaboration with the Population | Score max.Score max. |
Score patents in collaboration |
| Tolima | 1.339.998 | 0 | 0,00000000 | 5 | 0,00 |
| Meta | 1.053.871 | 0 | 0,00000000 | 5 | 0,00 |
| Bolívar | 2.130.000 | 0 | 0,00000000 | 5 | 0,00 |
| Chocó | 549.225 | 0 | 0,00000000 | 5 | 0,00 |
| 2. Profiles of projects enrolled 2020 Agency of Development Rural | |||||
| Department | Population | No. Profiles of projects enrolled >2020 Agency of Development Rural |
No. Profiles of projects registered. 2020 Agency de Development Rural about population |
Score max.Score max. |
Score profiles of projects registered projects |
| Tolima | 1.339.998 | 24 | 0,00001791 | 5 | 5,00 |
| Meta | 1.053.871 | 12 | 0,00001139 | 5 | 3,18 |
| Bolívar | 2.130.000 | 10 | 0,00000469 | 5 | 1,31 |
| Chocó | 549.225 | 8 | 0,00001457 | 5 | 4,07 |
| 3. Resources from financing SGR Fund from Agriculture and Development Rural | |||||
| Department | Population |
Resources de Financing SGR Funding from Agriculture and rural development |
Resources of SGR financing Funding from Agriculture and Development Rural population |
Score max.Score max. | Score profiles of projects registered projects |
| Tolima | 1.339.998 | $61.110.810.603 | $45.605 | 5 | 0,53 |
| Meta | 1.053.871 | $180.529.116.126 | $171.301 | 5 | 1,98 |
| Bolívar | 2.130.000 | $115.850.589.338 | $54.390 | 5 | 0,63 |
| Chocó | 549.225 | $238.007.380.716 | $433.351 | 5 | 5,00 |
| 4. Resources obtained from the CTeI Fund of the SGR by the Department | |||||
| Department | Population |
Recursos obtenidos del Fondo de CTeI del SGR por Department |
Recursos obtenidos del Fondo de CTeI del SGR por Departamento Overpopulation |
Score max.Score max. | Score profiles of projects registered projects |
| Tolima | 1.339.998 | $130.268.736.977 | $97.216 | 5 | 1,32 |
| Meta | 1.053.871 | $48.500.999.471 | $46.022 | 5 | 0,62 |
| Bolívar | 2.130.000 | $301.768.778.749 | $141.675 | 5 | 1,92 |
| Chocó | 549.225 | $202.385.840.265 | $368.493 | 5 | 5,00 |
| 5. Agricultural and related associations, cooperatives, foundations | |||||
| Department | Population | Asociaciones, cooperativas y fundaciones agrícolas | Asociaciones, cooperativas y fundaciones agrícolas about population. | Score max.Score max. | Puntaje Asociaciones, cooperativas y fundaciones agrícolas |
| Tolima | 1.339.998 | 242 | 0,0001806 | 5 | 3,24 |
| Meta | 1.053.871 | 294 | 0,0002790 | 5 | 5,00 |
| Bolívar | 2.130.000 | 153 | 0,0000718 | 5 | 1,29 |
| Chocó | 549.225 | 51 | 0,0000929 | 5 | 1,66 |
| 6. Agricultural and related cluster initiatives | |||||
| Department | Population | Iniciativas Clúster (agrícolas y afines) | Iniciativas Clúster (agrícolas y afines) sobre población | Score max.Score max. |
Puntaje iniciativas Clúster (agrícolas y afines) |
| Tolima | 1.339.998 | 2 | 0,0000015 | 5 | 3,93 |
| Meta | 1.053.871 | 2 | 0,0000019 | 5 | 5,00 |
| Bolívar | 2.130.000 | 2 | 0,0000009 | 5 | 2,47 |
| Chocó | 549.225 | 0 | 0,0000000 | 5 | 0,00 |
| 7. Cabildos and Indigenous reserves | |||||
| Department | Population | Cabildos and Indigenous reserves | Cabildos and Indigenous reserves about population. | Score max.Score max. | Score Cabildos and Indigenous reserves |
| Tolima | 1.339.998 | 82 | 0,0000612 | 5 | 1,21 |
| Meta | 1.053.871 | 20 | 0,0000190 | 5 | 0,37 |
| Bolívar | 2.130.000 | 10 | 0,0000047 | 5 | 0,09 |
| Chocó | 549.225 | 139 | 0,0002531 | 5 | 5,00 |
| 8. No. Research groups in agriculture and related areas | |||||
| Department | Population | No. Grupos de Investigación en agricultura y afines | No. Grupos de Investigación en agricultura y afines about population. | Score max.Score max. |
Score No. Grupos de Investigación en agricultura y afines |
| Tolima | 1.339.998 | 8 | 0,0000060 | 5 | 3,15 |
| Meta | 1.053.871 | 10 | 0,0000095 | 5 | 5,00 |
| Bolívar | 2.130.000 | 0 | 0,0000000 | 5 | 0,00 |
| Chocó | 549.225 | 2 | 0,0000036 | 5 | 1,92 |
| 9. Technoparks | |||||
| Department | Population | No. Technoparks. |
No. Technoparks. about population. |
Score max.Score max. | Score Technoparks |
| Tolima | 1.339.998 | 1 | 0,0000007 | 5 | 5,00 |
| Meta | 1.053.871 | 0 | 0,0000000 | 5 | 0,00 |
| Bolívar | 2.130.000 | 0 | 0,0000000 | 5 | 0,00 |
| Chocó | 549.225 | 0 | 0,0000000 | 5 | 0,00 |
| 10. Offices of Transfer Technological and Results of Research OTRIS. | |||||
| Department | Population | Offices from Transfer Technological OTRIS |
Offices of Transfer Technology OTRIS about population. |
Score max.Score max. |
Score Offices de Transfer Technological OTRIS |
| Tolima | 1.339.998 | 0 | 0,0000000 | 5 | 0,00 |
| Meta | 1.053.871 | 0 | 0,0000000 | 5 | 0,00 |
| Bolívar | 2.130.000 | 0 | 0,0000000 | 5 | 0,00 |
| Chocó | 549.225 | 0 | 0,0000000 | 5 | 0,00 |
| Results variable assessment of relationship System National of CTeI on Agriculture and related | |||||
| Department | Weightingaverage | ||||
| Tolima | 2,58 | ||||
| Meta | 2,33 | ||||
| Chocó | 2,17 | ||||
| Bolívar | 0,77 | ||||
Source: Own Source.
Table 8.
Tolima - Main gaps obtained.
| 1. TOLIMA. - Main gaps obtained | ||||
|---|---|---|---|---|
| Extension | I+D | Sustainability | Training | Innovation and ICTs |
|
Technical assistance from a private individual/state/guild to provide agricultural extension services to their productive units. AVERAGE: 1.7 MODE: 1 |
Presence of people directly involved in R&D processes. AVERAGE: 1.2 MODE: 1 |
Participation in the development of innovation-based sustainability. AVERAGE: 1.6 MODE: 1 |
Projects that through planning, implementation, financing, and evaluation of training and qualification actions directly implement the R&D&I process in the productive unit. AVERAGE: 1.5 MODE: 1 |
People directly involved in R&D&I activities. |
| GAP: Does not have technical assistance in its productive unit. | GAP: Your production unit has NO people directly involved in R&D&I activities and in establishing strategic alliances with interest groups. | GAP: No active participation of stakeholders in the development of sustainability based on innovation. | GAP: No knowledge of projects related to training and capacity building. | GAP: There are NO people directly involved in R&D and innovation activities and in establishing strategic alliances with |
|
HIGHEST RATING: It has technical assistance from the following three actors/agents: individuals/state/guilds to provide agricultural extension services to their production unit. |
HIGHEST QUALIFICATION: The production unit has people directly involved in R&D&I activities and is establishing strategic alliances with interest groups. | HIGHEST RATING: Active stakeholder participation in the development of innovation-based sustainability is present and sufficient. | MAXIMUM QUALIFICATION: Knows the projects and considers that they have planned, implemented, financed, and evaluated training and capacity-building actions that directly impact the R&D&I process in its productive unit. | HIGHEST RATING: There are people directly involved in R&D&I activities and establishing strategic alliances with interest groups. |
Disclaimer/Publisher’s Note: The statements, opinions and data contained in all publications are solely those of the individual author(s) and contributor(s) and not of MDPI and/or the editor(s). MDPI and/or the editor(s) disclaim responsibility for any injury to people or property resulting from any ideas, methods, instructions or products referred to in the content. |
© 2024 by the authors. Licensee MDPI, Basel, Switzerland. This article is an open access article distributed under the terms and conditions of the Creative Commons Attribution (CC BY) license (http://creativecommons.org/licenses/by/4.0/).
Copyright: This open access article is published under a Creative Commons CC BY 4.0 license, which permit the free download, distribution, and reuse, provided that the author and preprint are cited in any reuse.


