Submitted:
05 March 2024
Posted:
05 March 2024
You are already at the latest version
Abstract
Queuosine (Q) is a modification of the wobble base of tRNA harboring GUN antico-dons with roles in decoding accuracy and efficiency. Its synthesis is complex with mul-tiple enzymatic steps and several pathway intermediates can be salvaged. The only two transporter families known to salvage Q precursors are QPTR/COG1738 and QrtT/QueT. Analysis of the distribution of known Q synthesis and salvage genes in human gut and oral microbiota genomes have suggested that more transporter fami-lies remained to be found and that Q precursor exchanges must occur within the struc-tured microenvironments of the mammalian host. Using physical clustering and fu-sion-based association with Q salvage genes, candidate genes for missing transporters were identified and five were tested experimentally by complementation assays in Escherichia coli. Three genes encoding transporters from three different Pfam families, a Ureide permease (PF07168) from Acidobacteriota bacterium, a Hemolysin III family pro-tein (PF03006) from Bifidobacterium breve, and a Major Facilitator Superfamily protein (PF07690) from Bartonella henselae, were found to allow the transport of both preQ0 and preQ1 in this heterologous system. This work suggests that many transporter families can evolve to transport Q precursors reinforcing the concept of transporter plasticity.
Keywords:
Queuosine
; queuine
; transporter
; tRNA
; salvage
; biogeography
; phylogenomic
1. Introduction
Queuosine (Q), is a modification found at the wobble base (position 34) of tRNAs that decode NAC/U codons in most bacteria and eukaryotes. Although its role in decoding accuracy and efficiency has been well established, the effects of Q vary with the specific codon and organism, and these differences are not fully understood (1). In addition, recent studies have shown that this modification could also play regulatory roles in virulence and oxidative stress in bacteria by affecting the translation efficiency of specific genes enriched for specific codons (1) .
Only bacteria can synthesize Q de novo in a complex pathway that was recently extensively reviewed [Figure 1 and (1) ]. In short, GTP is the precursor molecule and, therein, its first step is shared with the tetrahydrofolate (THF) synthesis pathway. Four additional enzymes (QueD, QueE, QueC, and QueF) are required to make the 7-aminomethyl-7-deazaguanine (preQ1) precursor base that is exchanged with the guanine at position 34 of target tRNAs by tRNA-guanine (34) transglycosylase (bTGT). Additional tailoring enzymes (QueA, and QueG or QueH) finish the synthesis of Q on the tRNA molecule. Both preQ1 and its direct precursor 7-cyano-7-deazaguanine (preQ0) can be salvaged from the environment, with some bacteria relying only on the salvage route due to a lack of preQ0/preQ1 synthesis enzymes. The queuine (q) base can also be salvaged directly in some pathogenic bacteria, as well as in all eukaryotes. In these organisms, the TGT enzyme has changed substrate specificity from preQ1 to q. Sources of the q base are products of tRNA hydrolysis (Q, Q-3’MP, and Q-5’MP), and specific nucleoside hydrolases are required to liberate the q base from these precursors. Two, QueK and Qng1, have been experimentally characterized thus far. These enzymes are members of unrelated protein families and harbor different substrate specificities [Figure 1 and (2,3)]. We recently discovered an indirect q salvage pathway in which a queuine lyase (QueL) enzyme regenerates a preQ1 intermediate that can then be used by canonical bTGT (2).
Like other purine derivatives, Q precursors (preQ0, preQ1, q, and Q) require specific transporters to be imported into the cell. Only two such transporter families have been characterized to date: the QPTR, formerly named YhhQ, family, and the QueT/QrtT subgroups of the Energy-coupling Factor (ECF)–type transporters [see review in (1)]. Substrate specificity differences have been observed between members of both transporter families. For example, QPTR from E. coli transports preQ1 and preQ0 but not q (4), while QPTR from Chlamydia trachomatis transports q but not preQ1 or preQ0 (2). Similarly, one QrtT from Clostridioides difficile only transports preQ1, while the other transports preQ1, q, and Q (2). However, the genes encoding Q precursor transporters have yet to be identified in most organisms, including all eukaryotes.
Recent studies have reinforced the importance of Q as a micronutrient (5,6), particularly for optimal brain function (7,8) and mitochondrial stress responses (9). However, how the human host competes with organisms of the microbiome for Q precursors is poorly understood. Different members of the microbiome can generate Q de novo or act as preQ1/preQ0/Q scavengers (2,10), hence it is possible that competition between sympatric organisms could be observed for Q as it has been for B vitamins (11,12). Moreover, Q supplementation does lead to an increased level of α-diversity of intestinal microbiota (13). The role of Q in microbiome composition, as well as the amount of Q produced and utilized by the gut microbiota, might affect the health of the host, as suggested by recent studies (14,15). However, to construct an accurate model of Q exchange in the microbiome, all Q metabolism genes—including all missing transporters—must be identified, particularly in phyla most prevalent in the human gut and other specific microbial niches. Finally—as recent metagenomic and single-cell sequencing analyses have revealed regarding the temporal and spatial heterogeneity of bacterial communities inhabiting humans (16,17)—understanding the holistic biogeography of Q metabolism is critical to discerning how it may shape microbial communities and, therein, the emergent health of their hosts.
This study focuses on the reconstruction of Q metabolism for species of the gut and oral microbiome to evaluate the importance of Q precursor exchanges in these ecological niches and estimate the prevalence of unidentified Q precursor transporters. We then use a pipeline described in Figure 2 that combines comparative genomics and experimental techniques to identify and characterize missing transporter genes applied to the Q salvage pathway.
2. Results and Discussion
2.1. Q Makers and Users Are Spatially Distributed in the Human Gut and Oral Microbiomes
Previous reconstructions of Q pathways of human microbiota used only de novo pathway genes and were restricted to a limited number of reference organisms (2,10). To predict the importance of Q exchanges for different niches of the human microbiome, we analyzed the presence-absence patterns of all known Q synthesis and salvage genes in 13,027 species of the gut microbiome (dataset S1) and 8,547 species of the oral microbiome (dataset S2).
In terms of Q synthesis, species of the gut microbiome fall within two major classes: one enriched in Q makers, mainly Proteobacteria that encode a full biosynthetic pathway (bottom half of the tree in Figure 3); another enriched in Q precursor-users composed mainly of Actinobacteria and Firmicutes (synonym Bacillota) lacking QueDECF proteins but still encoding TGT, the signature enzyme of the pathway (top half of the tree in Figure 3). The types of salvage can be further specified within either class. For example, most Actinobacteria are predicted to salvage q as they lack QueA and QueH/QueG, whereas most Synergistales species are predicted to salvage preQ1/preQ0 bases. Additionally, it is clear that not all transporter genes have been identified as many organisms predicted to salvage Q precursors lack homologs of QPTR or QueT/QrtT, a pattern seen quite strikingly in Propionibacteriales.
With this quite granular dataset in hand, we could set out to map Q metabolism on spatial species distribution maps (Figure 4). For example, Q users would be expected to be more abundant in the lower region of the gastrointestinal tract, such as the small intestine where food is digested and may release Q precursors. Most species in the large intestine lack queDECF genes, instead harboring q salvage genes (QueKL) and transporters (Figure 4a), supporting our hypothesis.
Within each region of the gut, the host tissues, mucus layers, and luminal spaces present distinct habitats, leading to phylogenetic heterogeneity along the transverse axis of the gastrointestinal tract. We speculated that Q precursors could influence microbial organization at the micro-scale like gradients of oxygen, AMPs, immune factors, and mucus density (17). Indeed, in the mouse colon, members of the Ruminococcaceae, Lachnospiraceae and Lactobacilli families are generally found as cecal crypt residents (18), these species generally lack Q synthesis genes (Figure 4b). On the other hand, the loose outer mucus layer is colonized by commensals, including mucolytic bacteria, such as Akkermansiaceae (19) and some Bacteroides species (20), of which can typically synthesize Q (Figure 4b). Therefore, a gradient of Q precursors may be present decreasing from the outer to the inner mucus layers, and likely plays a role in shaping the composition of respective microbial communities.
In the oral microbiome, the establishment of dental plaques is a sequential process starting with early colonizing species, such as Streptococcus, that cling to the tooth surface using specialized adhesins. Among early colonizing species, there appears to be no clear preference of Q salvage or Q synthesis with examples like Streptococcus gordonii and Streptococcus sanguinis being salvagers, Streptococcus mitis encoding the full Q biosynthetic pathway, and the Actinomyces not utilizing Q at all (21) (Figure 5 and dataset 2). As the dental plaque develops, defined structures, microenvironments, and special organized collections of oral bacteria and yeast species begin to take shape, largely driven by the formation of extracellular matrices and biofilm species diversity, providing surfaces for other organisms to colonize(16). The presence of oxygen correlates with Q utilization preferences, where oxygen-replete environments in the interior of the plaque show enrichments of Q precursor consumers (e.g. Leptotrichia, Capnocytophaga, and Fusobacterium) and organisms that do not utilize Q, including Candida species. Communities that colonize the exterior of the plaque are more likely to be composed of Q synthesizers and genera with mixed Q acquisition strategies. Organic acids produced by acidogenic organisms accumulate to form low-pH microenvironments within plaque layers. These acids can either encourage the growth of other acidophilic organisms or foster organisms that metabolize organic acids (22). Streptococcus mutans is a key acid-producer and is also a Q synthesizer. After the founding of an acidic environment, species that can tolerate low pH like the Lactobacilli can colonize the plaque and primarily rely on the importation of Q precursors (Figure 5). Alternatively, the acid metabolizing Veillonella species can help neutralize pH and are predominantly Q synthesizers. The dental plaque offers unique insights into synergism and competition between microorganisms, and, here, it is illustrated that Q precursors may be another resource that these species exchange and compete for.
2.2. Identification of Q Precursor Transporter Candidates through Comparative Genomics
Fusion and physical clustering analyses are powerful tools to identify missing genes in bacteria (26). We hence used several of these strategies to identify missing Q precursor transporters. We first looked for protein fusions of transporter domains with TGT (see Methods). Three different transporter domains were identified as having fusions with TGT (Table S1). One was the known preQ1/preQ0 transporter, QPTR (PF02592/COG1738/IPR003744). The other two were found to be transporters unique to different Tsukamurella species. Of these, Tpau_0550 (UniProt: D5USC3), belonged to the Major Facilitator Superfamily (MFS-1, PF07690), and the second was found to be a member of the MMPL family (PF03176), Tpau_4044 (UniProt: D5UNC0).
To complement the first, a second approach was implemented independently, in parallel for the identification of putative Q precursor transporters. Specifically, this analysis examined the physically clustering of Q salvage signature genes, namely TGT, Qng1, and QueK (see pipeline described in Figure S1). Here, we used the Gene Neighborhood Network (GNN) tool of the Enzyme Function Initiative (EFI) suite (27) to survey neighbors of the targeted signature genes among bacteria. With this, 51 diverse transporter families were identified as potential candidates (Table S2). Because it was expected that organisms requiring Q salvage would likely necessitate the transport of Q precursors, these candidates were sorted using scores determined by each protein’s Q pathway profile as derived through comparative genomic analyses. Candidates with high scores (z-score ≥ 1) included known Q precursor transporters QPTR (PF02592) and QrtT (PF12822), as well as tentatively novel Q-relevant transporter families. Specifically, these new high-scoring candidates were as follows: the MMPL family (PF03176), Haemolysin-III (PF03006), Fusaric acid resistance protein-like (PF13515), Sugar transporter-Major Facilitator Superfamily (PF00083-PF07690) and some other ABC transporter family member (PF00005) (Table S2). A majority of these candidates were members of large transporter superfamilies with highly diverse subgroups that, historically, have been notoriously difficult to annotate.
To narrow the list of candidates and to visually explore their physical clustering with Q salvage genes, we constructed protein Sequence Similarity Networks (SSNs) using EFI-EST (EFI-Enzyme Similarity Tool) (27) for the TGT, Qng1, and QueK protein families, coloring the sequence nodes based on the predicted Q pathway profile of the encoding organism and the presence of the 51 transporter candidates identified (Figure 6). Physical clustering between signature genes and transporter candidates occurred across each SSN generated (yellow nodes), confirming that organisms able to synthesize Q de novo may also encode transporters to salvage precursors as previously observed in E. coli (4) (red-circled yellow nodes). Among the clusters in which transporters are present, we focused on those of organisms that are expected to require a q salvage pathway (blue and dark green circled nodes, 12 clusters boxed in Figure 6) and calculated the percentage of occurrence for each transporter candidate within that cluster. QPTR (PF02592) and QrtT (PF12822) dominated 5 out of the 7 clusters in which they were present (Figure 7). MFS superfamily members (PF07690) were observed in two-thirds of the examined clusters, especially dominating clusters 7 and 10. Ureide permease (UPS, PF07168) that overshadowed all other candidate families of cluster 8 was prioritized for the same reason. Many organisms expected to require q salvage for Q synthesis were not found to encode a transporter that clusters with TGT, Qng1 or QueK (blue and dark green circled open nodes), suggesting the possibility that other candidates have yet to be identified. Based on the physical clustering and predicted metabolic requirement of Q salvage, this analysis generated a final list of 10 candidates (Table 1) (Figure S2 and Table S3).
2.3. Members of Three Transporters Superfamilies Can Evolve to Transport PreQ0 and PreQ1
Having identified ten different candidate families, we selected five of them to target for experimental validation (Table 1). This was accomplished by expressing candidate transporter genes in strains of E. coli that are auxotrophic for preQ0/preQ1 due to the deletion of, both, the queD gene and that of QPTR, the latter of which results in an inability to transport either precursor. We found that the expression of members of three out of the five families tested was able to complement, both, the preQ0 and preQ1 transporter deficiencies of an E. coli QPTR queD double-deletion strain (Figure 8a and Figure S3). In follow-up of these findings, we found that preQ1 could be transported even when present at low concentrations (5 nM) (Figure S4), suggesting that the expressed clones were encoded with preQ1 transporters of a particularly high affinity. However, it should be noted that the actual Km values of each still require proper estimation.
Interestingly, Q pathway reconstructions were unable to predict that the MFS proteins of Bartonella henselae and Bifidobacterium breve would transport preQ1/preQ0, as they lack queA or queG/H genes (Figure 8b and dataset S3). We have previously shown that the B. henselae QPTR and TGT proteins preferred preQ1 as a substrate (28), and that the preQ1 found in tRNA suggested that preQ1 and not Q was the final deazapurine modification present in tRNAs this organism (28). The importance of the preQ1 modification is reinforced by the discovery that a second preQ1 transporter of the MFS family is present adjacent of tgt in this organism (Figure S2). In the case of B. breve, our results suggest that preQ1 is transported and inserted into tRNA by a canonical bacterial TGT enzyme. However, further experiments are needed to check if the Q pathway terminates here for this organism or whether another family of enzymes has yet to be discovered that may catalyze this remaining step. Finally, the Acidobacteriota UPS transporter candidate gene found encoded next to qng1 was observed to transport preQ0/preQ1. This was not expected as Qng1 is only known to cleave the q base of Q or that of Q-MP precursors. Using a genetic set up previously implemented to validate q and Q transporters of different pathogenic bacteria (2), it seems that this UPS transporter does not transport Q, instead only transporting q at very high, physiologically improbable concentrations (Figure S5).
2.4. Tentative Identification of PreQ1 Transporters Subgroups in Three Transporters Superfamilies
The three new experimentally validated preQ1/preQ0 transporter genes presented by this work are members of notably large superfamilies, making it very difficult to confidently propagate any such annotations. Therefore, we opted to construct SSNs in an attempt to identify the potential isofunctional members of the preQ1-specific transporter subgroup of these families.
HlyIII (IPR004254/PF03006) is a family of ~48,000 proteins with a wide variety of annotated functions. Previous analysis of the family resolved several subgroups, including PAQR1 and PAQR2 (29). PAQR1 consists of only eukaryotic proteins and includes the originally identified adiponectin receptor of mammals [(29) and Figure 9a]. In contrast, PAQR2 consists of both bacterial and eukaryotic proteins (Figure 9a). The bacterial homologs are frequently annotated as 'hemolysin III', but, as it concerns any experimental validation, the functions of members of this PAQR2 subgroup remain unknown (29). The B. breve HlyIII member found to transport preQ0/preQ1 is part of this larger PAQR2 subgroup (Figure 9a). Further analysis, here, of the proteins linked by similarity to the experimentally validated B. breve preQ1 transporter implies that only a subset (circled in Figure 9b and listed in Table S4) are likely to share this function, as most of the HlyIII proteins of surrounding subclusters originate from organisms that do not encode TGT (black circled nodes in Figure 9b).
The ureide permease (IPR009834/PF07168) identified here is a family of ~2,000 proteins thought to transport a wide spectrum of oxo-derivative heterocyclic nitrogen compounds, including allantoin, uric acid, and xanthine (30–32). The UPS member found to transport preQ0/preQ1 in Acidobacteriota bacterium (A0A2V9U0M9) separates well from other UPS members that have been characterized in plants (Figure 10a). In this case, we can confidently propagate this annotation to the defined subset of UPS proteins indicated in Figure 11b and listed in Table S4. However, this annotation should be spread no further as, again, many UPS proteins in the other subclusters are from organisms that do not encode TGT proteins (black circled nodes in Figure 10b).
The Major Facilitator Superfamily (IPR011701/PF07690) (MFS) examined here is a family with more than 4 million members, representing the largest family of secondary transporters with members originating everywhere, from Archaea to Homo sapiens (33,34). Many of the characterized MFS subgroups transporting a variety of compounds were found to separate well in the initial SSN (Figure S6). However, because of the family’s size, it was only possible to sample its entirety for our analyses (1/100 sequences at every node) and, as a result, lacked the necessary resolution to confidently predict members expected to be isofunctional with that of the B. henselae MFS transporter found to transport preQ0/preQ1, even if we had been able to extract the subgroup (circled in Figure S6 insert) of sequences only from genomes also encoding TGT (blue circled nodes in Figure S6 and Table S4).
3. Conclusions
Phylogenomic analyses of Q synthesis and salvage genes of select microbiome species from across the modeled biogeographical landscape do suggest that Q precursors (preQ1, preQ0, q and Q) can be added to the list of small molecules that shape microbiome community composition at the species level, as well as those that may contribute to the ultimate health of the host (35). With this, Queuosine and its precursors should be added to the list of metabolites profiled in future microbiome studies.
It is well-established that plasticity drives the evolution of novel transporters from existing ones (36–40), but our results also show that very different transporters can evolve to transport the same preQ1 molecule. Indeed, the five experimentally validated preQ1 transporters are members of four different transporter superfamilies according to the TCDB database (41) classification: the Vitamin Uptake Transporter (VUT) Family (TC# 2.A.88), the Major Facilitator Superfamily (MFS; TC# 2.A.1), the Hemolysin III (Hly III) Family (TC# 1 .C.113), and the Drug/Metabolite Transporter (DMT) Superfamily (TC# 2.A.7). The bioinformatic analyses we performed here suggest that many more may remain to be discovered and/or validated, including the other candidates we identified that have not yet been tested.
This convergent evolution of members of different transporter families to transport the same molecule seems to be a recurrent evolutionary scenario, as that previously seen for members of the bacterial Solute Binding Protein superfamily (42). To further explore how common cases of convergent evolution among transporters may truly be, we used the new “molecule” search feature of the TCDB database (41), examining the number of different transporter families known to transport the common nucleobases and B vitamins (Figure 11 and Table S5). With this, it was observed that all molecules analyzed could be transported by members of at least three and up to 11 superfamilies.
Finally, this work reiterates the difficulty of predicting the substrate specificity of transporters based just on sequence similarity and the need to combine comparative genomics with experimental validation to functionally annotate this functional group. Systematic efforts to screen transporter substrate specificity are being implemented (43–45). These will need to be combined with specialized transporter annotation capture and propagation tools to generally improve the current transporter databases (41,46).
4. Materials and Methods
4.1. Human Gut Microbiome Analysis
In brief, 3632, 5387, and 4644 bacterial and archaeal genomes were retrieved from the BIOML (47), GMbC (48), and Unified Human Gastrointestinal Genome (UHGG)(49), respectively. We retrieved 10 near-universal and single-copy ribosomal protein families (L2, L3, L4, L5, L6, L14, L16, L18, S3, and S8) using Diamond v0.8 (with BLASTx parameters: -more-sensitive -e 0.000001 -id 35 -query-cover 80) (50). Each ribosomal protein family was aligned independently using MUSCLE v5.1 (51), trimmed using BMGE v1.12 (parameters: -t AA -g 0.95 -m BLOSUM30) (52), and concatenated using Seaview v4.751 (53). The phylogenetic tree was reconstructed using FastTree v2.1 (parameters: -lg -gamma 20) (54), and was visualized, modified in iTOL v6.8 (https://itol.embl.de/) (55). For better visualization, Orders with less than 10 genomes were hidden or merged. The presence of Q pathway genes was determined using tBLASTn (56) with thresholds of 20% and 1e-10 for identity and E-value, respectively. The identifiers of query proteins of the Q pathway are listed in Table S6. The presence-absence pattern was visualized using an in-house program available at https://github.com/vdclab/published_scripts.
4.2. Human Oral Microbiome Analysis
The tree of human oral microbiome was adapted from the genomic tree version 10.1 of 8,622 genomes in the expanded Human Oral Microbiome Database v3.1 (https://www.homd.org/). The tree was visualized and modified in iTOL (55). For better visualization, Orders with less than 10 genomes are hidden or merged. The presence of Q pathway genes was determined using BLASTp (56)with thresholds of 20% and 1e-10 for identity and E-value, respectively.
4.3. Comparative Genomics and Sequence Similarity Networks (SSNs)
All bacterial fusion proteins of transporters and TGT were retrieved using the “similar architecture” tool of CDD (NCBI) (57), and with the “advanced search” tool of UniProt (58) (query: "Queuine tRNA-ribosyltransferase" AND (length:[500 TO 2000]) AND (taxonomy_id:2) AND transporter).
The classification of the different types of Q pathway profiles (eg. de novo synthesis, q direct or indirect q salvage) in any given taxonomic id (dataset 3), was based on the presence and absence of QueD, QueE, QueC, QueF, TGT, QueA, QueG/H proteins (as described in Figure 1). The presence of these proteins was inferred from the InterPro annotations in the corresponding genomes (59) using the InterPro family IDs listed in Table S6. These Q pathway profile characteristics were then used to color the node borders in the SSNs when stated.
As illustrated in Figure S1, SSNs were generated using the Enzyme Function Initiative (EFI) analytic suite (27) and visualized using Cytoscape (3.10.1) (60). Sequences for each family, including IPR019438 (Qng1), IPR004803 (TGT), IPR023186 (QueK), IPR009834 (Ureide permease), IPR011701(MFS), and IPR004254 (AdipoR/Haemolysin-III-related), were retrieved using the “Family” option of EFI-EST (EFI Enzyme Similarity Tool). The initial SSN was generated with an alignment score cutoff set such that each connection (edge) represented a sequence identity above 40%. The specific node coloring patterns are given in the figure legends. More stringent SSNs were then created by gradually increasing the alignment score cutoff in small increments (usually by 5 AS units). This process was repeated until clusters were homogeneous in color. Edges were drawn between nodes with a BLAST E-value over the cutoff (alignment score threshold) as indicated in each SSN. The genomic neighborhoods were analyzed using EFI-GNT (Genome Neighborhood Tool) with minimal co-occurrence filter set to 0 (27). For neighborhood selection, the Pfam family of transporter candidates were selected with a median distance to TGT, QueK, or Qng1 of no more than 2 and with a physical clustering ratio of more than 0.2% of total family members with recognized neighbors. The information on genomic regions was retrieved using EFI-GNT (27) and the gene neighborhood diagram was created using Gene Graphics (61). The Transporter Classification Database (41) was used to further classify transporter families.
4.4. Strains, Media, and Growth Conditions
All strains and plasmids used in this study are listed in Table S7. LB medium (tryptone 10 g/L, yeast extract 5 g/L, sodium chloride 5 g/L) was routinely used for E. coli strain growth at 37°C. The medium was solidified using 15 g/L of agar. As needed, kanamycin (50 µg/mL), ampicillin (100 µg/mL), and chloramphenicol (25 µg/mL) were added. In the presence of exogenous Q precursors as previously described (2,4), cells were cultured in M9-defined medium containing 1% glycerol (Thermo Fisher Scientific, Waltham, MA, USA). After cells reached an optical density at 600 nm (OD600nm) of 0.1-0.2, 0.2% arabinose was added to induce the expression of genes under the PBAD promoter. After cells reached an OD600nm of 0.2, DMSO, preQ0, preQ1, q, or Q were added. The transport reaction was stopped at time points of 30 or 60 min after supplementing with DMSO or different Q precursors by placing samples on melting ice and then centrifuging, followed by tRNA extraction. Q was purchased from Epitoire (Singapore), q from Santa Cruz Biotechnology, and preQ1, preQ0 from (Sigma-Aldrich).
4.3. Construction of E. coli Strains and Plasmids
The genes encoding the candidate transporter proteins listed in Table 1 were chemically synthesized (without optimization) in pTWIST_Kan vectors (all DNA sequences are given in Table S8). The Bifidobacterium breve Hly_III, Bacteroides henselae MFS, Corynebacterium propinquum MmpL, Winogradskyella and Bacteroides dorei YgjP encoding genes were directly subcloned from the corresponding pTWIST constructs into the EcoRI and HindIII sites of pBAD24 (62). The Chryseobacterium piperi YgjP encoding gene was directly subcloned from the corresponding pTWIST construct into the EcoRI and PstI sites of pBAD24. The Acidobacteriota bacterium (Ac_UPS) gene was amplified from the pTWIST clones using the following primer pairs (F_Ac_DMT_NheI_PBAD24/R_Ac_DMT_XbaI_PBAD24, and then cloned into the NheI and XbaI sites of pBAD24. E. coli transformations were performed using the CaCl2 chemical transformation procedure (63). Transformants were selected on LB agar supplemented with ampicillin. The clones were validated through Sanger sequencing and PCR analyses with the appropriate primer pairs. All primers used in this study are listed in Table S9.
4.4. Q detection Assay
Cells were harvested by centrifugation at 16,000 x g for 2 minutes at 4°C. Immediately after pelleting, the cells were resuspended in 1 mL of Trizol (Thermo Fisher Scientific, Waltham, MA, USA). According to the manufacturer's instructions, small RNA was extracted with the PureLink miRNA Isolation kit (Thermo Fisher Scientific, Waltham, MA, USA). 25 μL of RNase-free water was used to elute the purified RNAs. Quantification of prepared tRNA was performed using a Nanodrop 1000 spectrophotometer. We loaded 500 ng of tRNAs per well on a denaturing 8 M urea, 8% polyacrylamide gel containing 0.5% 3-(Acrylamido) phenylboronic acid (APB) (Sigma-Aldrich) after resuspending in a 2X RNA Loading Dye (NEB). Migration was performed in 1X TAE running buffer, using a BioRad Mini-PROTEAN system, run in a stirred ice bath at 120 constant volts. tRNAs were transferred onto a Biodyne B precut nylon membrane (Thermo Scientific) with a BioRad Trans-Blot SD semi-dry transfer cell apparatus at 10 V for 15 minutes. The membrane was UV irradiated in a UV crosslinker (Fisher FB-UVXL-1000) at a preset UV energy dosage of 120 mJ/cm2. The North2South Chemiluminescent Hybridization and Detection Kit (Thermo) was used to detect tRNAAsp. As the DIG Easy Hyb (Roche) drastically reduces the background noise, it was used as the initial membrane-blocking buffer instead of the North2South kit's membrane-blocking buffer. Hybridization was done at 61°C, using the specific biotinylated primer for tRNAAspGUC (5’ biotin-CCCTGCGTGACAGGCAGG 3’ for E. coli) added to a final concentration of 50 ng/mL. The blot was visualized by the iBright™ Imaging Systems.
Supplementary Materials
The following supporting information can be downloaded at the website of this paper posted on Preprints.org. Table S1: Candidate transporters from fusion searches in the UniProt database. Table S2: Candidates transporter from GNN analysis of TGT, Qng1, and QueK families. Table S3: Gene neighborhood information. Table S4: UniProt identifiers for predicted preQ1 transporter subgroups of the PF07168, PF03006, and PF07690 families. Table S5: Transporter families involved in the transport of bases and vitamins collected from https://www.tcdb.org/. Table S6: ID of query Q pathway proteins. Table S7: Strains and plasmids used in this study. Table S8: Information for synthesized genes. Table S9: Oligonucleotides used in this study. Dataset S1: Count of Q pathway genes in genomes of human gut microbiome collected from BIOML, GMbC, and UHGG. Dataset S2: Count of Q pathway genes in the genomes of human oral microbiome that collected in https://www.homd.org/. Dataset S3: Q pathway profile in given taxon based on Q synthesis and salvage proteins in UniProt database. Figure S1: The schematic representation of the comparative genomics analyses used in this study. Figure S2: Examples of physical clustering of transporter genes with the Q pathway genes. Figure S3: YgjP of Winogradskyella sp. (Wi), Bacteroides dorei (Bd), and Chryseobacterium piperi (Cpi) and MMPL of Corynebacterium propinquum (Cpr) do not transport preQ1. Figure S4: Acidobacteriota bacterium (Ac) UPS, Bifidobacterium breve (Bb) HlyIII, and Bartonella henselae (Bh) MFS salvage preQ1 at low concentrations. Figure S5: UPS of Acidobacteriota bacterium (Ac) cannot transport Q even at high concentrations but can transport q only at very high concentrations. Figure S6: SSN of the MFS family (IPR011701 /PF07690).
Author Contributions
Conceptualization, VdC-L and YY.; methodology, YY, SQ and PK ; software, YY.; validation, SQ and PK.; investigation, YY, SQ, MM and MJ; data curation, SQ and YY; writing—original draft preparation, VdC-L , SQ and YY.; writing—review and editing, VdC-L , SQ, YY, MM and MJ.; visualization, YY and SQ.; supervision, VdC-L.; project administration, VdC-L.; funding acquisition, VdC-L. All authors have read and agreed to the published version of the manuscript.
Funding
This research and the APC were funded by the National Institute of General Medical Sciences, grant number GM70641.
Data Availability Statement
The original contributions presented in the study are included in the article/supplementary material, further inquiries can be directed to the corresponding author/s.
Acknowledgments
We thank Colbie J. Reed for the critical reading of the manuscript. We thank Peter C. Dedon for giving access to unpublished datasets.
Conflicts of Interest
The authors declare no conflicts of interest.
References
- de Crécy-Lagard V, Hutinet G, Cediel-Becerra JD, Yuan Y, Zallot R, Chevrette MG, et al. Biosynthesis and function of 7-deazaguanine derivatives in bacteria and phages. Microbiol Mol Biol Rev. 2024, 0, e00199-23. [CrossRef]
- Yuan Y, Zallot R, Grove TL, Payan DJ, Martin-Verstraete I, Šepić S, et al. Discovery of novel bacterial queuine salvage enzymes and pathways in human pathogens. Proc Natl Acad Sci U S A. 2019, 116, 19126–19135. [Google Scholar] [CrossRef]
- Hung SH, Elliott GI, Ramkumar TR, Burtnyak L, McGrenaghan CJ, Alkuzweny S, et al. Structural basis of Qng1-mediated salvage of the micronutrient queuine from queuosine-5′-monophosphate as the biological substrate. Nucleic Acids Res. 2023, 51, 935–951. [Google Scholar] [CrossRef]
- Zallot R, Yuan Y, de Crécy-Lagard V. The Escherichia coli COG1738 member YhhQ is involved in 7-cyanodeazaguanine (preQ₀) Transport. Biomolecules. 2017, 7, 12. [Google Scholar]
- Ames, BN. Prolonging healthy aging: Longevity vitamins and proteins. Proc Natl Acad Sci U S A. 2018, 115, 10836. [Google Scholar] [CrossRef]
- Varghese S, Cotter M, Chevot F, Fergus C, Cunningham C, Mills KH, et al. In vivo modification of tRNA with an artificial nucleobase leads to full disease remission in an animal model of multiple sclerosis. Nucleic Acids Res. 2017, 45, 2029–2039.
- Cirzi C, Dyckow J, Legrand C, Schott J, Guo W, Perez Hernandez D, et al. Queuosine-tRNA promotes sex-dependent learning and memory formation by maintaining codon-biased translation elongation speed. EMBO J. 2023, 42, 112507. [Google Scholar] [CrossRef]
- Skolnick SD, Greig NH. Microbes and monoamines: potential neuropsychiatric consequences of dysbiosis. Trends Neurosci. 2019, 42, 151–163. [Google Scholar] [CrossRef]
- Rashad S, Al-Mesitef S, Mousa A, Zhou Y, Ando D, Sun G, et al. Translational response to mitochondrial stresses is orchestrated by tRNA modifications. bioRxiv. 2024 Jan 1;2024.02.14.580389.
- Díaz-Rullo J, González-Pastor JE. tRNA queuosine modification is involved in biofilm formation and virulence in bacteria. Nucleic Acids Res. 2023, 51, 9821–9837. [Google Scholar] [CrossRef] [PubMed]
- Magnúsdóttir S, Ravcheev D, de Crécy-Lagard V, Thiele I. Systematic genome assessment of B-vitamin biosynthesis suggests co-operation among gut microbes. Front Genet. 2015, 6, 148. [Google Scholar]
- Rodionov DA, Arzamasov AA, Khoroshkin MS, Iablokov SN, Leyn SA, Peterson SN, et al. Micronutrient requirements and sharing capabilities of the human gut microbiome. Front Microbiol. 2019, 10, 1316. [Google Scholar]
- Yan F, Xiang S, Shi L, Zhu X. Synthesis of queuine by colonic gut microbiome via cross-feeding. Food Front. 2023, 1–14.
- Kesh K, Mendez R, Mateo-Victoriano B, Garrido VT, Durden B, Gupta VK, et al. Obesity enriches for tumor protective microbial metabolites and treatment refractory cells to confer therapy resistance in PDAC. Gut Microbes. 2022, 14, 2096328. [Google Scholar] [CrossRef]
- Varriale L, Coretti L, Dipineto L, Green BD, Pace A, Lembo F, et al. An outdoor access period improves chicken cecal microbiota and potentially increases micronutrient biosynthesis. Front Vet Sci. 2022, 9, 904522. [Google Scholar] [CrossRef]
- Mark Welch JL, Rossetti BJ, Rieken CW, Dewhirst FE, Borisy GG. Biogeography of a human oral microbiome at the micron scale. Proc Natl Acad Sci U S A. 2016, 113, E791–800. [Google Scholar]
- McCallum G, Tropini C. The gut microbiota and its biogeography. Nat Rev Microbiol. 2024, 22, 105–118. [Google Scholar] [CrossRef] [PubMed]
- Mondragón-Palomino O, Poceviciute R, Lignell A, Griffiths JA, Takko H, Ismagilov RF. Three-dimensional imaging for the quantification of spatial patterns in microbiota of the intestinal mucosa. Proc Natl Acad Sci U S A 2022, 119, e2118483119. [Google Scholar] [CrossRef]
- Derrien M, Van Baarlen P, Hooiveld G, Norin E, Müller M, de Vos WM. Modulation of mucosal immune response, tolerance, and proliferation in mice colonized by the mucin-degrader Akkermansia muciniphila. Front Microbiol. 2011, 2, 166. [Google Scholar]
- Yasuda K, Oh K, Ren B, Tickle TL, Franzosa EA, Wachtman LM, et al. Biogeography of the intestinal mucosal and lumenal microbiome in the Rhesus macaque. Cell Host Microbe. 2015, 17, 385–391. [Google Scholar] [CrossRef] [PubMed]
- Bowen WH, Burne RA, Wu H, Koo H. Oral biofilms: pathogens, matrix, and polymicrobial interactions in microenvironments. Trends Microbiol. 2018, 26, 229–242. [Google Scholar] [CrossRef] [PubMed]
- Sangha JS, Barrett P, Curtis TP, Métris A, Jakubovics NS, Ofiteru ID. Effects of glucose and lactate on Streptococcus mutans abundance in a novel multispecies oral biofilm model. Microbiol Spectr. 2024, 0, e03713–23. [Google Scholar]
- Pereira FC, Berry D. Microbial nutrient niches in the gut. Environ Microbiol. 2017, 19, 1366–1378. [Google Scholar] [CrossRef] [PubMed]
- Gorkiewicz G, Moschen A. Gut microbiome: a new player in gastrointestinal disease. Virchows Archiv. 2018, 472, 159–172. [Google Scholar] [CrossRef] [PubMed]
- Clarke G, Sandhu K V. , Griffin BT, Dinan TG, Cryan JF, Hyland NP. Gut reactions: breaking down xenobiotic–microbiome interactions. Pharmacol Rev. 2019, 71, 198–224. [Google Scholar] [CrossRef] [PubMed]
- Henry CS, Lerma-Ortiz C, Gerdes SY, Mullen JD, Colasanti R, Zhukov A, et al. Systematic identification and analysis of frequent gene fusion events in metabolic pathways. BMC Genomics. 2016, 17, 473. [Google Scholar]
- Zallot R, Oberg N, Gerlt JA. The EFI web resource for genomic enzymology tools: leveraging protein, genome, and metagenome databases to discover novel enzymes and metabolic pathways. Biochemistry. 2019, 58, 4169–4182. [Google Scholar] [CrossRef]
- Quaiyum S, Yuan Y, Sun. Giuanxin, Ratnayakec RMM, Hutinet G, Dedon PC, et al. Queuosine salvage in Bartonella henselae Houston 1: a unique evolutionary path". BioRxiv. 2023;2023.12.05.570228.
- Pei J, Millay DP, Olson EN, Grishin N V. CREST - a large and diverse superfamily of putative transmembrane hydrolases. Biol Direct. 2011, 6, 37. [Google Scholar]
- Desimone M, Catoni E, Ludewig U, Hilpert M, Schneider A, Kunze R, et al. A novel superfamily of transporters for allantoin and other oxo derivatives of nitrogen heterocyclic compounds in Arabidopsis. Plant Cell. 2002, 14, 847–856. [Google Scholar] [CrossRef]
- Schmidt A, Baumann N, Schwarzkopf A, Frommer WB, Desimone M. Comparative studies on ureide permeases in Arabidopsis thaliana and analysis of two alternative splice variants of AtUPS5. Planta. 2006, 224, 1329–1340. [Google Scholar] [CrossRef]
- Schmidt A, Su YH, Kunze R, Warner S, Hewitt M, Slocum RD, et al. UPS1 and UPS2 from Arabidopsis mediate high affinity transport of uracil and 5-fluorouracil. J Biol Chem. 2004, 279, 44817–44824. [Google Scholar] [CrossRef]
- Sauve S, Williamson J, Polasa A, Moradi M. Ins and outs of rocker switch mechanism in major facilitator superfamily of transporters. Membranes (Basel). 2023, 13, 462. [Google Scholar] [CrossRef]
- Quistgaard EM, Löw C, Guettou F, Nordlund P. Understanding transport by the major facilitator superfamily (MFS): structures pave the way. Nat Rev Mol Cell Biol. 2016, 17, 123–132. [Google Scholar] [CrossRef]
- Donia MS, Fischbach MA. Small molecules from the human microbiota. Science (1979). 2015, 349, 1254766.
- Krypotou E, Evangelidis T, Bobonis J, Pittis AA, Gabaldón T, Scazzocchio C, et al. Origin, diversification and substrate specificity in the family of NCS1/FUR transporters. Mol Microbiol. 2015, 96, 927–950. [Google Scholar] [CrossRef]
- Jørgensen ME, Xu D, Crocoll C, Ernst HA, Ramírez D, Motawia MS, et al. Origin and evolution of transporter substrate specificity within the NPF family. Elife 2017, 6, e19466. [CrossRef]
- Kourkoulou A, Pittis AA, Diallinas G. Evolution of substrate specificity in the Nucleobase-Ascorbate Transporter (NAT) protein family. Microb Cell. 2018, 5, 280–292. [Google Scholar] [CrossRef] [PubMed]
- Gournas C, Athanasopoulos A, Sophianopoulou V. On the evolution of specificity in members of the yeast amino acid transporter family as parts of specific metabolic pathways. Int J Mol Sci. 2018, 19, 1398. [Google Scholar] [CrossRef] [PubMed]
- Teichmann L, Chen C, Hoffmann T, Smits SHJ, Schmitt L, Bremer E. From substrate specificity to promiscuity: hybrid ABC transporters for osmoprotectants. Mol Microbiol. 2017, 104, 761–780. [Google Scholar] [CrossRef]
- Saier MH, Reddy VS, Moreno-Hagelsieb G, Hendargo KJ, Zhang Y, Iddamsetty V, et al. The Transporter Classification Database (TCDB): 2021 update. Nucleic Acids Res. 2021, 49, D461–7. [Google Scholar] [CrossRef] [PubMed]
- Cerna-Vargas JP, Sánchez-Romera B, Matilla MA, Ortega Á, Krell T. Sensing preferences for prokaryotic solute binding protein families. Microb Biotechnol. 2023, 16, 1823–1833. [Google Scholar] [CrossRef] [PubMed]
- Stanchev LD, Møller-Hansen I, Lojko P, Rocha C, Borodina I. Screening of Saccharomyces cerevisiae metabolite transporters by 13C isotope substrate labeling. Front Microbiol. 2023, 14, 1286597. [Google Scholar]
- Pochini L, Galluccio M. Heterologous (Over) Expression of human SoLute Carrier (SLC) in yeast: a well-recognized tool for human transporter function/structure studies. Life. 2022, 12, 1206. [Google Scholar] [CrossRef] [PubMed]
- Fernández, Rico-Jiménez, Ortega, Daddaoua, García García, Martín-Mora, et al. Determination of ligand profiles for Pseudomonas aeruginosa Solute Binding Proteins. Int J Mol Sci. 2019, 20, 5156. [Google Scholar] [CrossRef] [PubMed]
- Elbourne LDH, Tetu SG, Hassan KA, Paulsen IT. TransportDB 2.0: a database for exploring membrane transporters in sequenced genomes from all domains of life. Nucleic Acids Res. 2017, 45, D320–4. [Google Scholar] [CrossRef] [PubMed]
- Poyet M, Groussin M, Gibbons SM, Avila-Pacheco J, Jiang X, Kearney SM, et al. A library of human gut bacterial isolates paired with longitudinal multiomics data enables mechanistic microbiome research. Nat Med. 2019, 25, 1442–1452. [Google Scholar] [CrossRef] [PubMed]
- Groussin M, Poyet M, Sistiaga A, Kearney SM, Moniz K, Noel M, et al. Elevated rates of horizontal gene transfer in the industrialized human microbiome. Cell. 2021, 184, 2053–2067. [Google Scholar] [CrossRef]
- Almeida A, Nayfach S, Boland M, Strozzi F, Beracochea M, Shi ZJ, et al. A unified catalog of 204,938 reference genomes from the human gut microbiome. Nat Biotechnol. 2021, 39, 105–114. [Google Scholar] [CrossRef]
- Buchfink B, Xie C, Huson DH. Fast and sensitive protein alignment using DIAMOND. Nat Methods. 2015, 12, 59–60. [Google Scholar] [CrossRef]
- Edgar, RC. MUSCLE: multiple sequence alignment with high accuracy and high throughput. Nucleic Acids Res. 2004, 32, 1792–1797. [Google Scholar] [CrossRef]
- Criscuolo A, Gribaldo S. BMGE (Block Mapping and Gathering with Entropy): a new software for selection of phylogenetic informative regions from multiple sequence alignments. BMC Evol Biol 2010, 10, 210. [Google Scholar]
- Gouy M, Guindon S, Gascuel O. SeaView Version 4: A multiplatform graphical user interface for sequence alignment and phylogenetic tree building. Mol Biol Evol 2010, 27, 221–224. [Google Scholar] [CrossRef] [PubMed]
- Price MN, Dehal PS, Arkin AP. FastTree 2 – Approximately maximum-likelihood trees for large alignments. PLoS One. 2010, 5, e9490. [Google Scholar]
- Letunic I, Bork P. Interactive tree of life (iTOL) v5: An online tool for phylogenetic tree display and annotation. Nucleic Acids Res. 2021, 49, W293–W296. [Google Scholar] [CrossRef]
- Altschul SF, Madden TL, Schaffer AA, Zhang J, Zhang Z, Miller W, et al. Gapped BLAST and PSI-BLAST: a new generation of protein database search programs. Nucleic Acids Res. 1997, 25, 3389–3402. [Google Scholar] [CrossRef] [PubMed]
- Marchler-Bauer A, Derbyshire MK, Gonzales NR, Lu S, Chitsaz F, Geer LY, et al. CDD: NCBI’s conserved domain database. Nucleic Acids Res. 2015, 43, D222–6. [Google Scholar] [CrossRef] [PubMed]
- Bateman A, Martin MJ, Orchard S, Magrane M, Ahmad S, Alpi E, et al. UniProt: the Universal Protein Knowledgebase in 2023. Nucleic Acids Res. 2023, 51, D523–31. [Google Scholar] [CrossRef]
- Paysan-Lafosse T, Blum M, Chuguransky S, Grego T, Pinto BL, Salazar GA, et al. InterPro in 2022. Nucleic Acids Res. 2023, 51, D418–27. [Google Scholar] [CrossRef]
- Shannon P, Markiel A, Ozier O, Baliga NS, Wang JT, Ramage D, et al. Cytoscape: a software environment for integrated models of biomolecular interaction networks. Genome Res. 2003, 13, 2498–2504. [Google Scholar] [CrossRef]
- Harrison KJ, de Crécy-Lagard V, Zallot R. Gene Graphics: A genomic neighborhood data visualization web application. Bioinformatics. 2018, 34, 1406–1408. [Google Scholar] [CrossRef]
- Guzman LM, Belin D, Carson MJ, Beckwith J. Tight regulation, modulation, and high-level expression by vectors containing the arabinose PBAD promoter. J Bacteriol. 1995, 177, 4121–4130. [Google Scholar] [CrossRef] [PubMed]
- Green R, Rogers EJ. Transformation of chemically competent E. coli. In Methods in Enzymology; Academic Press Inc., 2013; pp. 329–336.
Figure 1.
Bacterial Q de novo and salvage pathways. Q de novo synthesis pathway is depicted with enzymes are shown in red. Indirect and direct q salvage pathways are depicted with enzymes are shown in green and blue, respectively. Possible degradation and phosphorylation pathways are shown in dashed arrows. The ECF transporters include 4 subunits. Only the substrate-specific transmembrane (S) component (QueT/QrtT) is labeled.
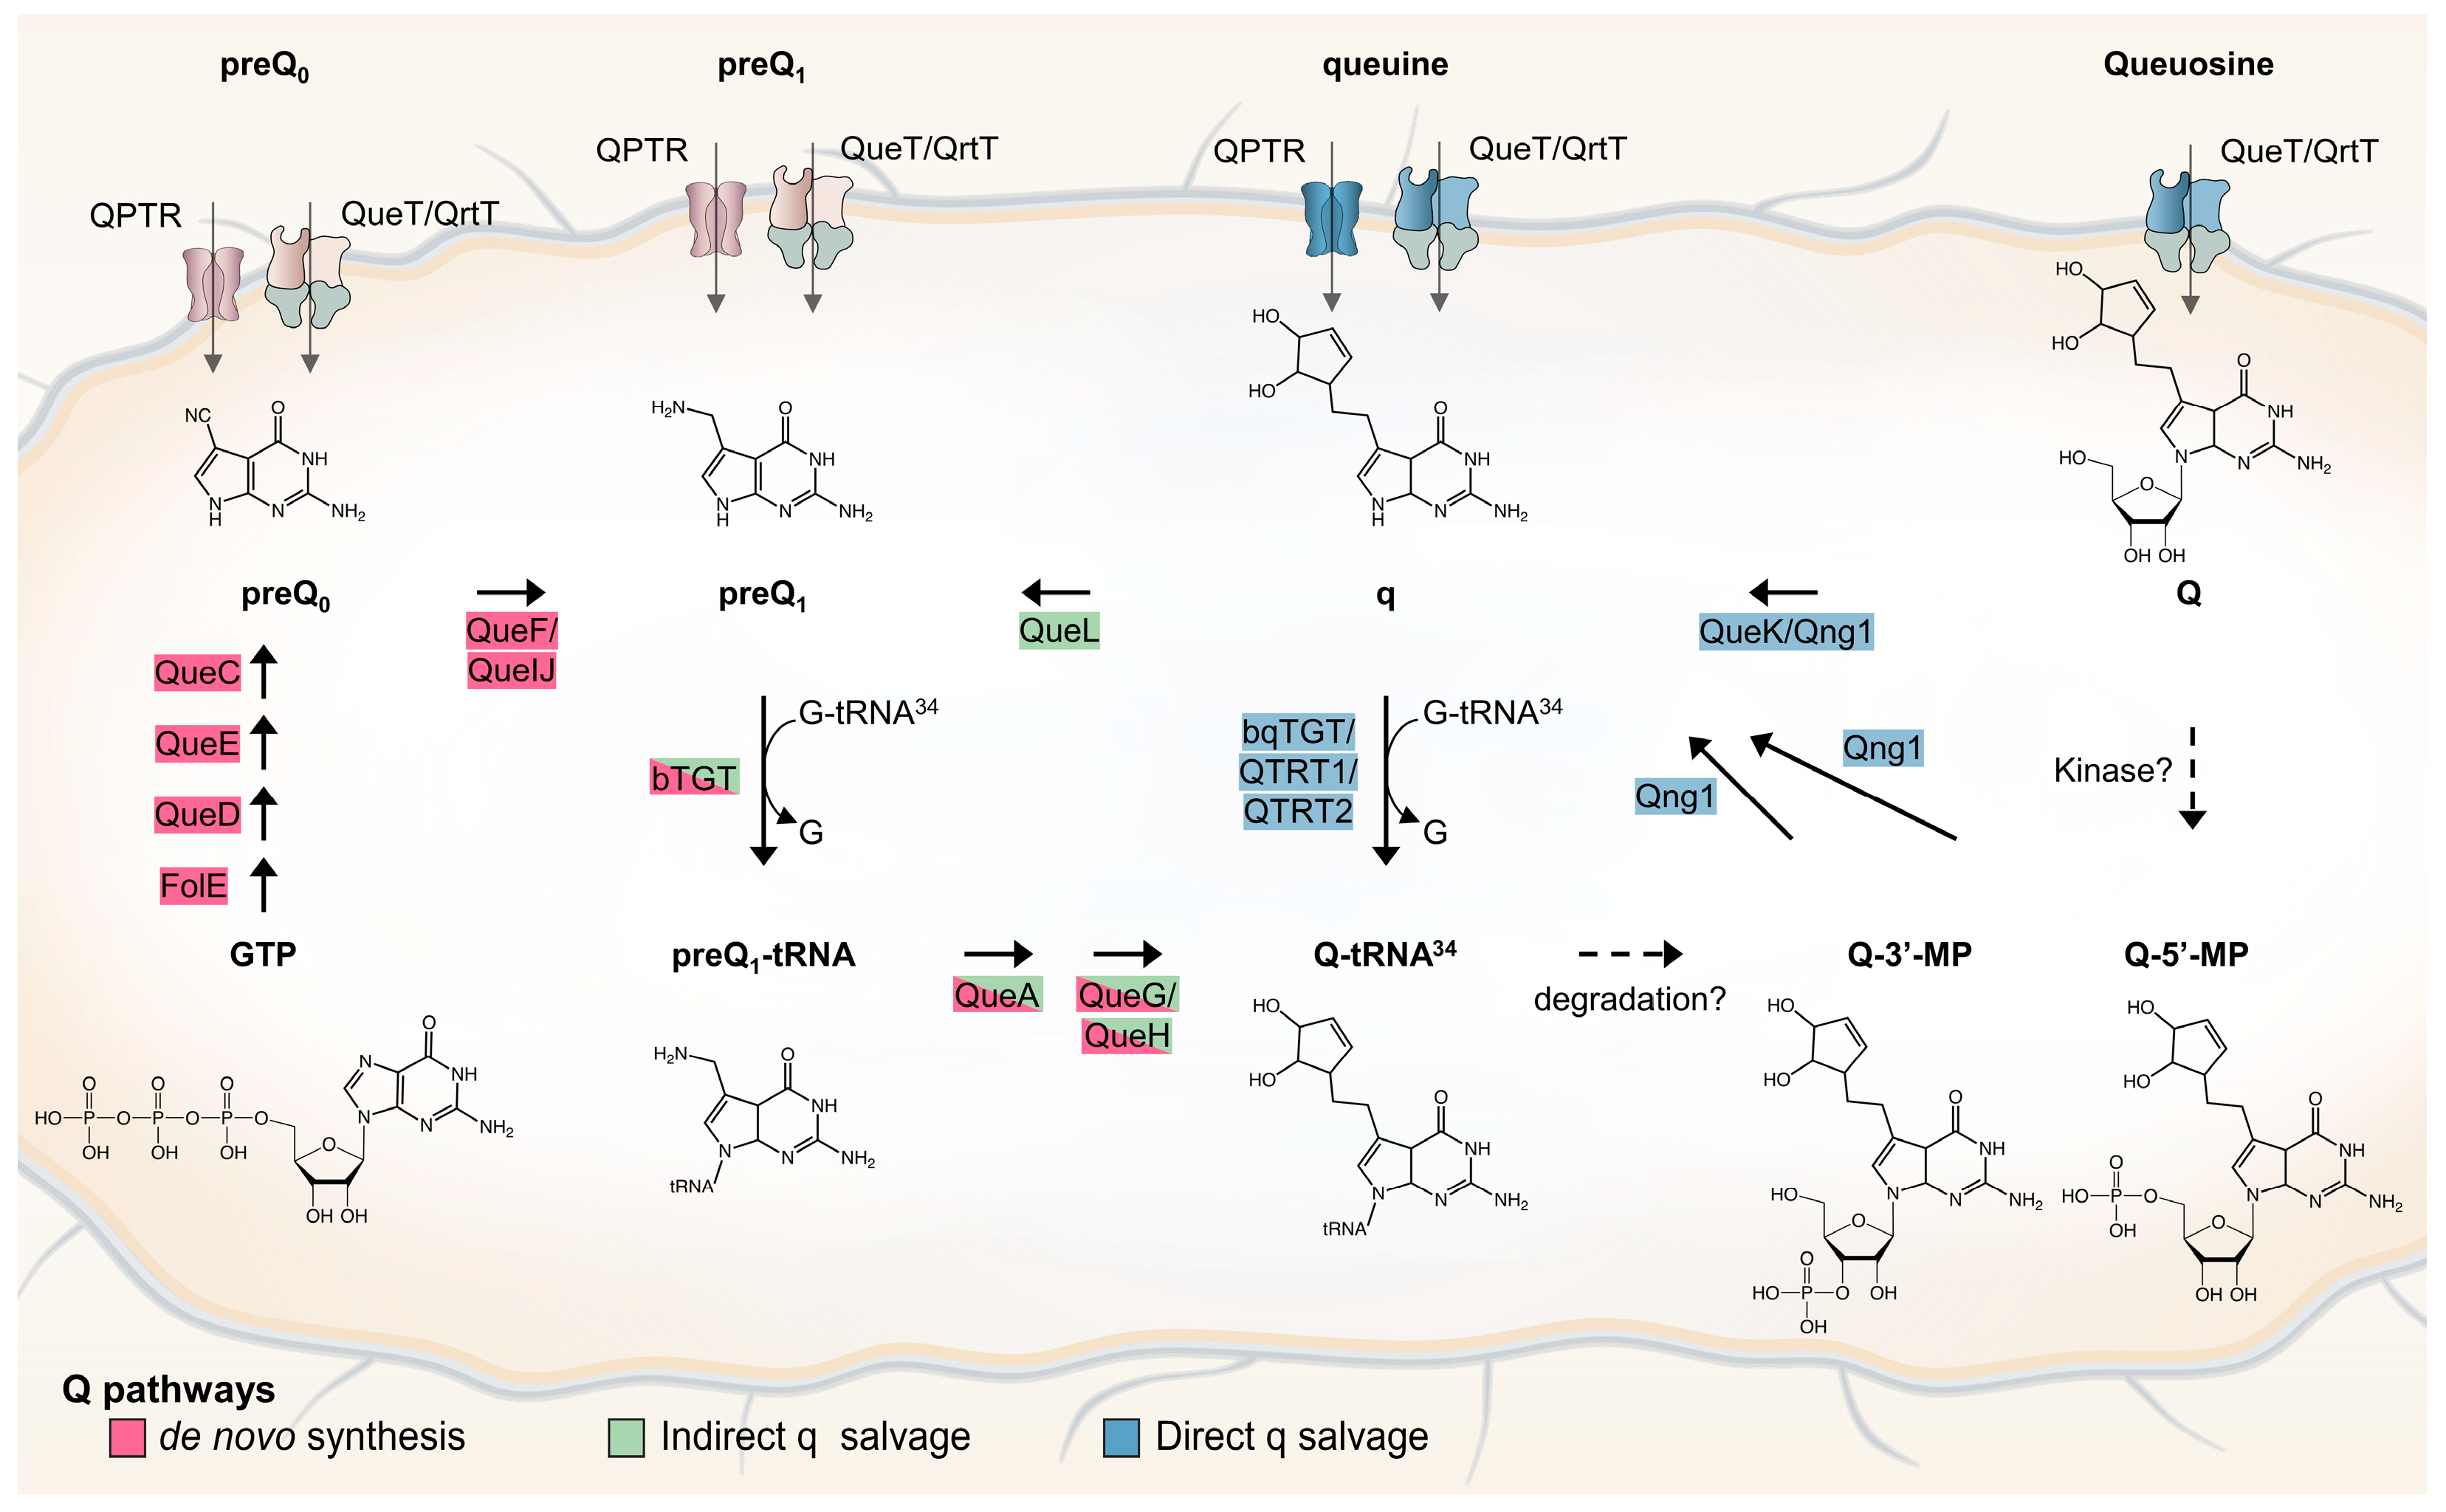
Figure 2.
Schematic representation of a comparative genomics-driven approach to identify novel Q transporters. (1) Identification of knowledge gaps in metabolic pathways, e.g. missing Q precursor transporters; (2) Construction of SSNs for signature enzymes in Q pathways, e.g. E6 (TGT) and E9 (Qng1/QueK); (3) Investigation of genomic neighbors and fusions for Pfam families of the query signature enzyme; (4) Generation of candidates; (5) Expression of candidates in engineered E. coli strains lacking the indigenous Q precursor transporter; (6) Detection, quantification, and localization of Q-tRNA using various technologies. Enzymes in the Q biosynthesis pathway are represented by E1 to E9. Among them, E6 (TGT) and E9 (hydrolases) are the signature enzymes of q salvage.
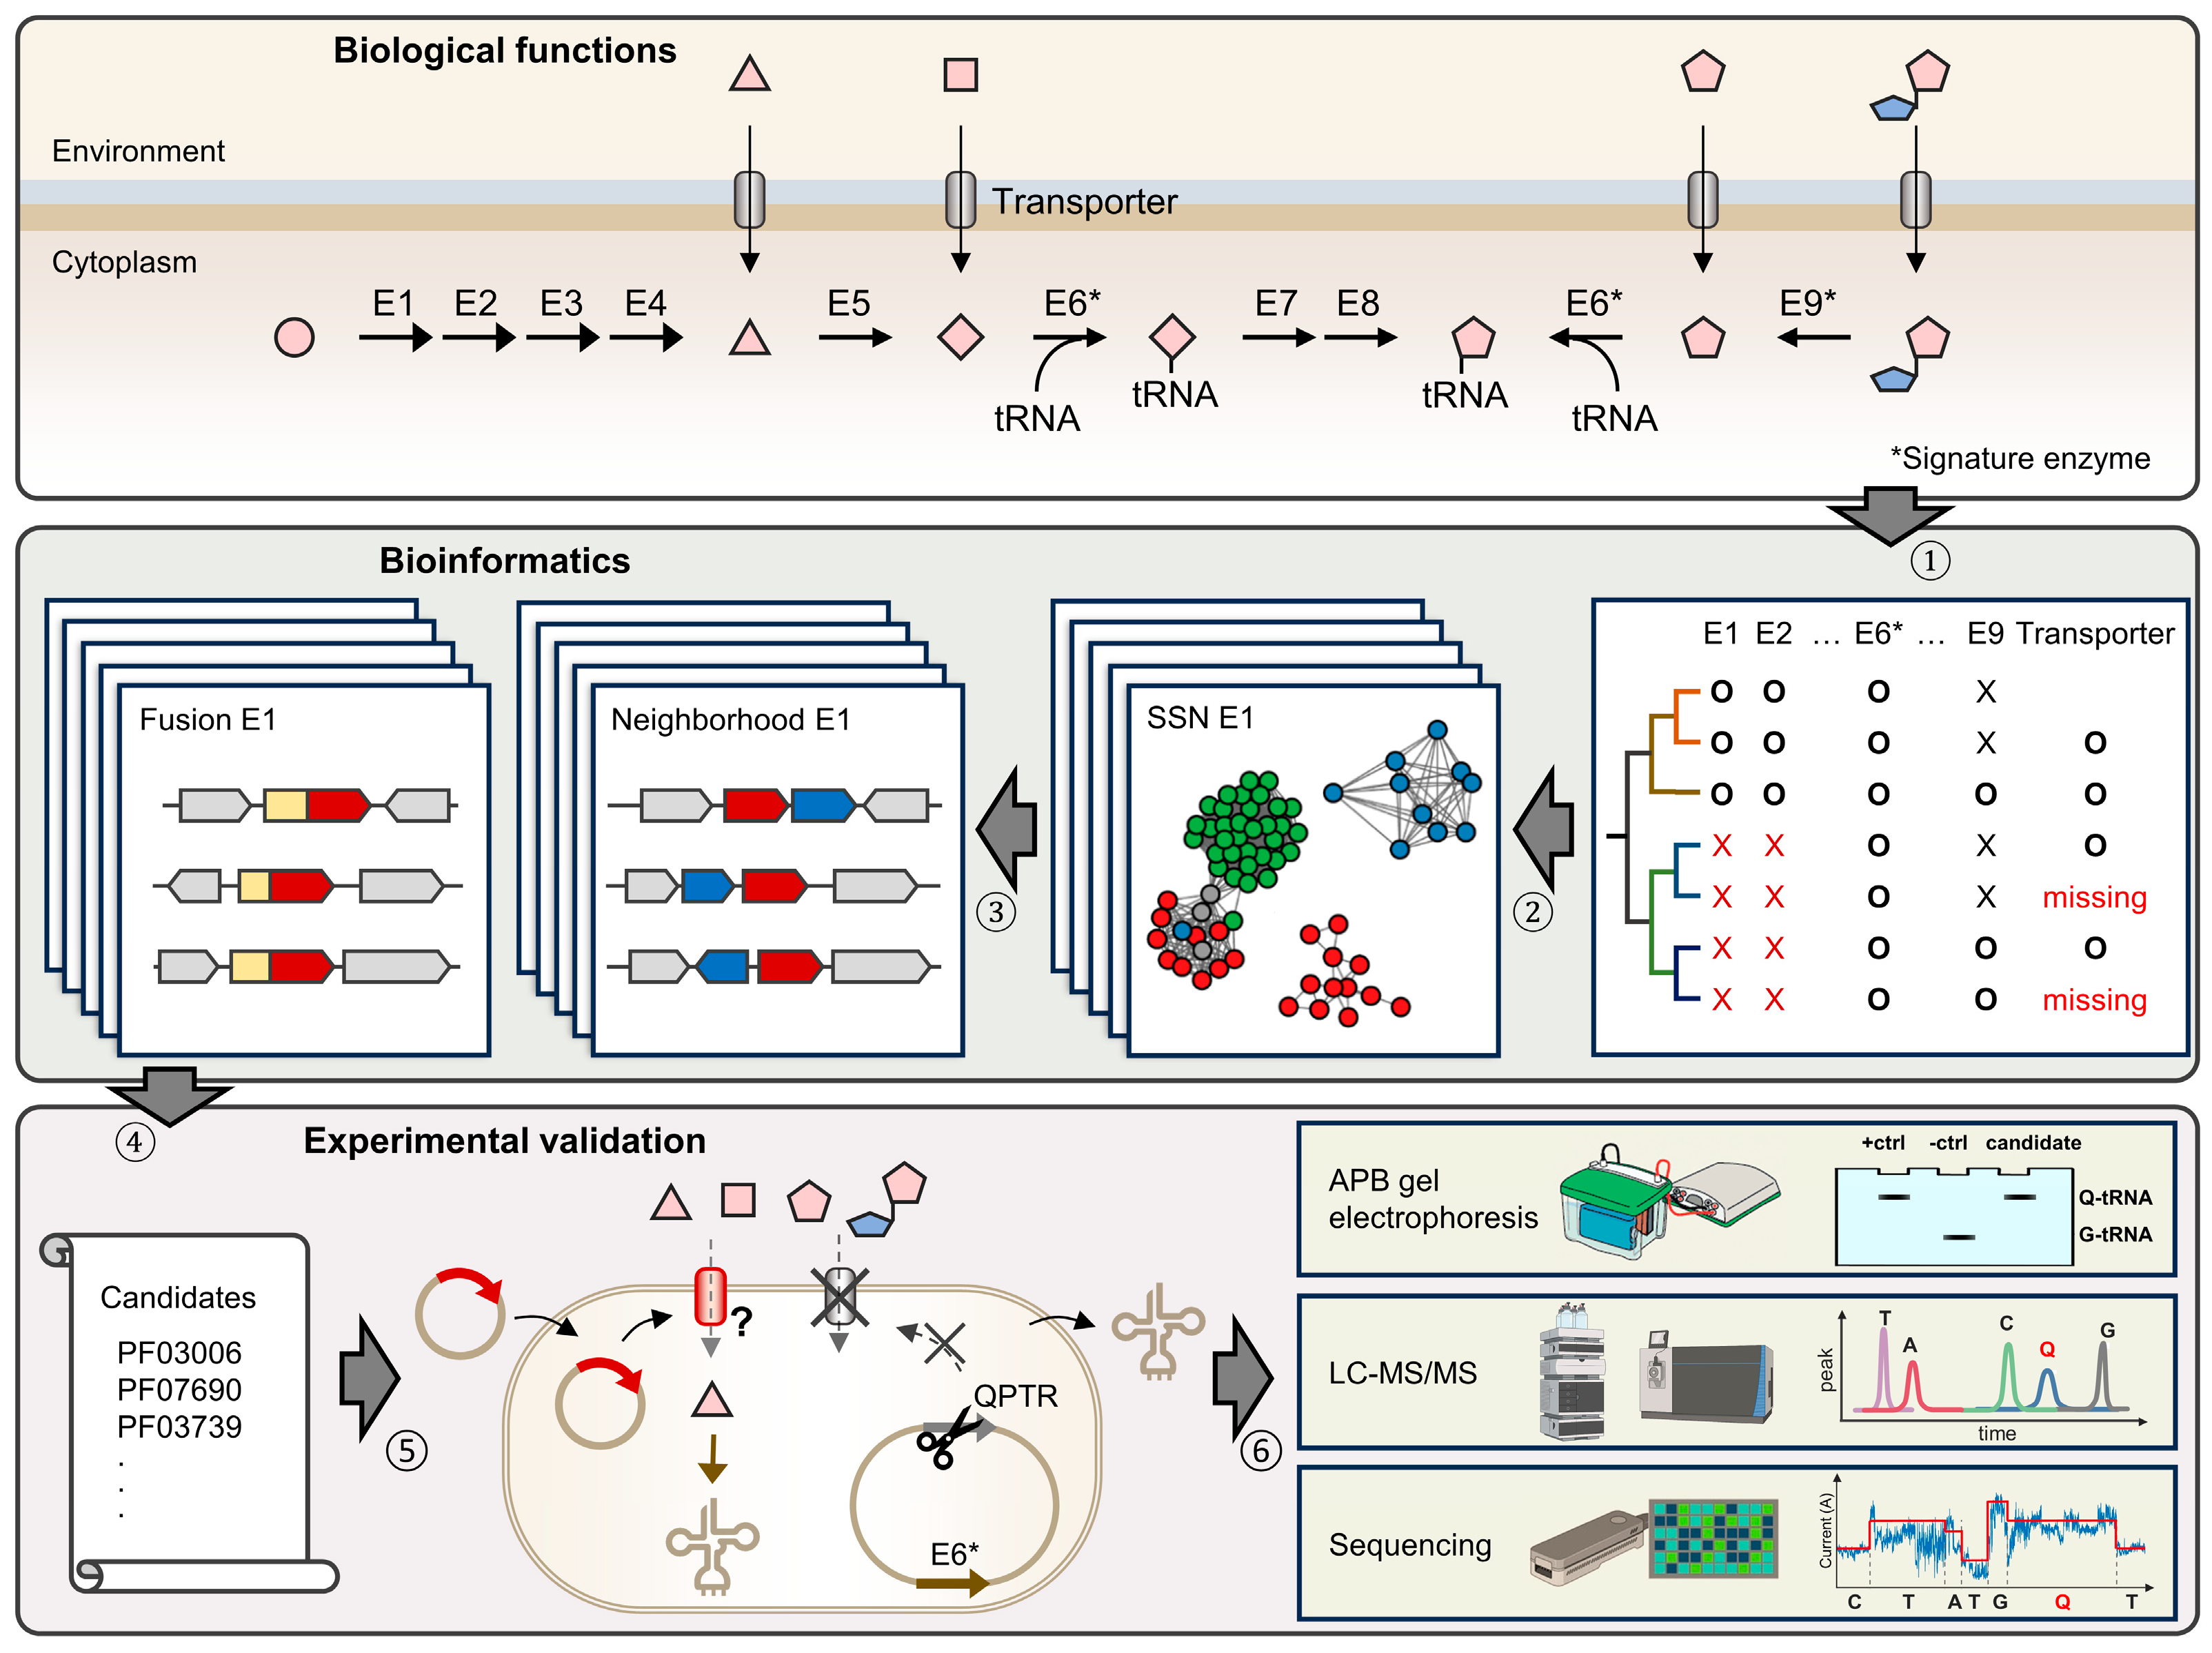
Figure 3.
Distribution of Q pathway proteins in human gut microbiome. The ML tree of concatenated ribosomal proteins of human gut microbiome genomes. The presence of Q pathway proteins in each taxon unit is indicated by red. For better visualization, orders with less than 10 genomes are hidden or merged.
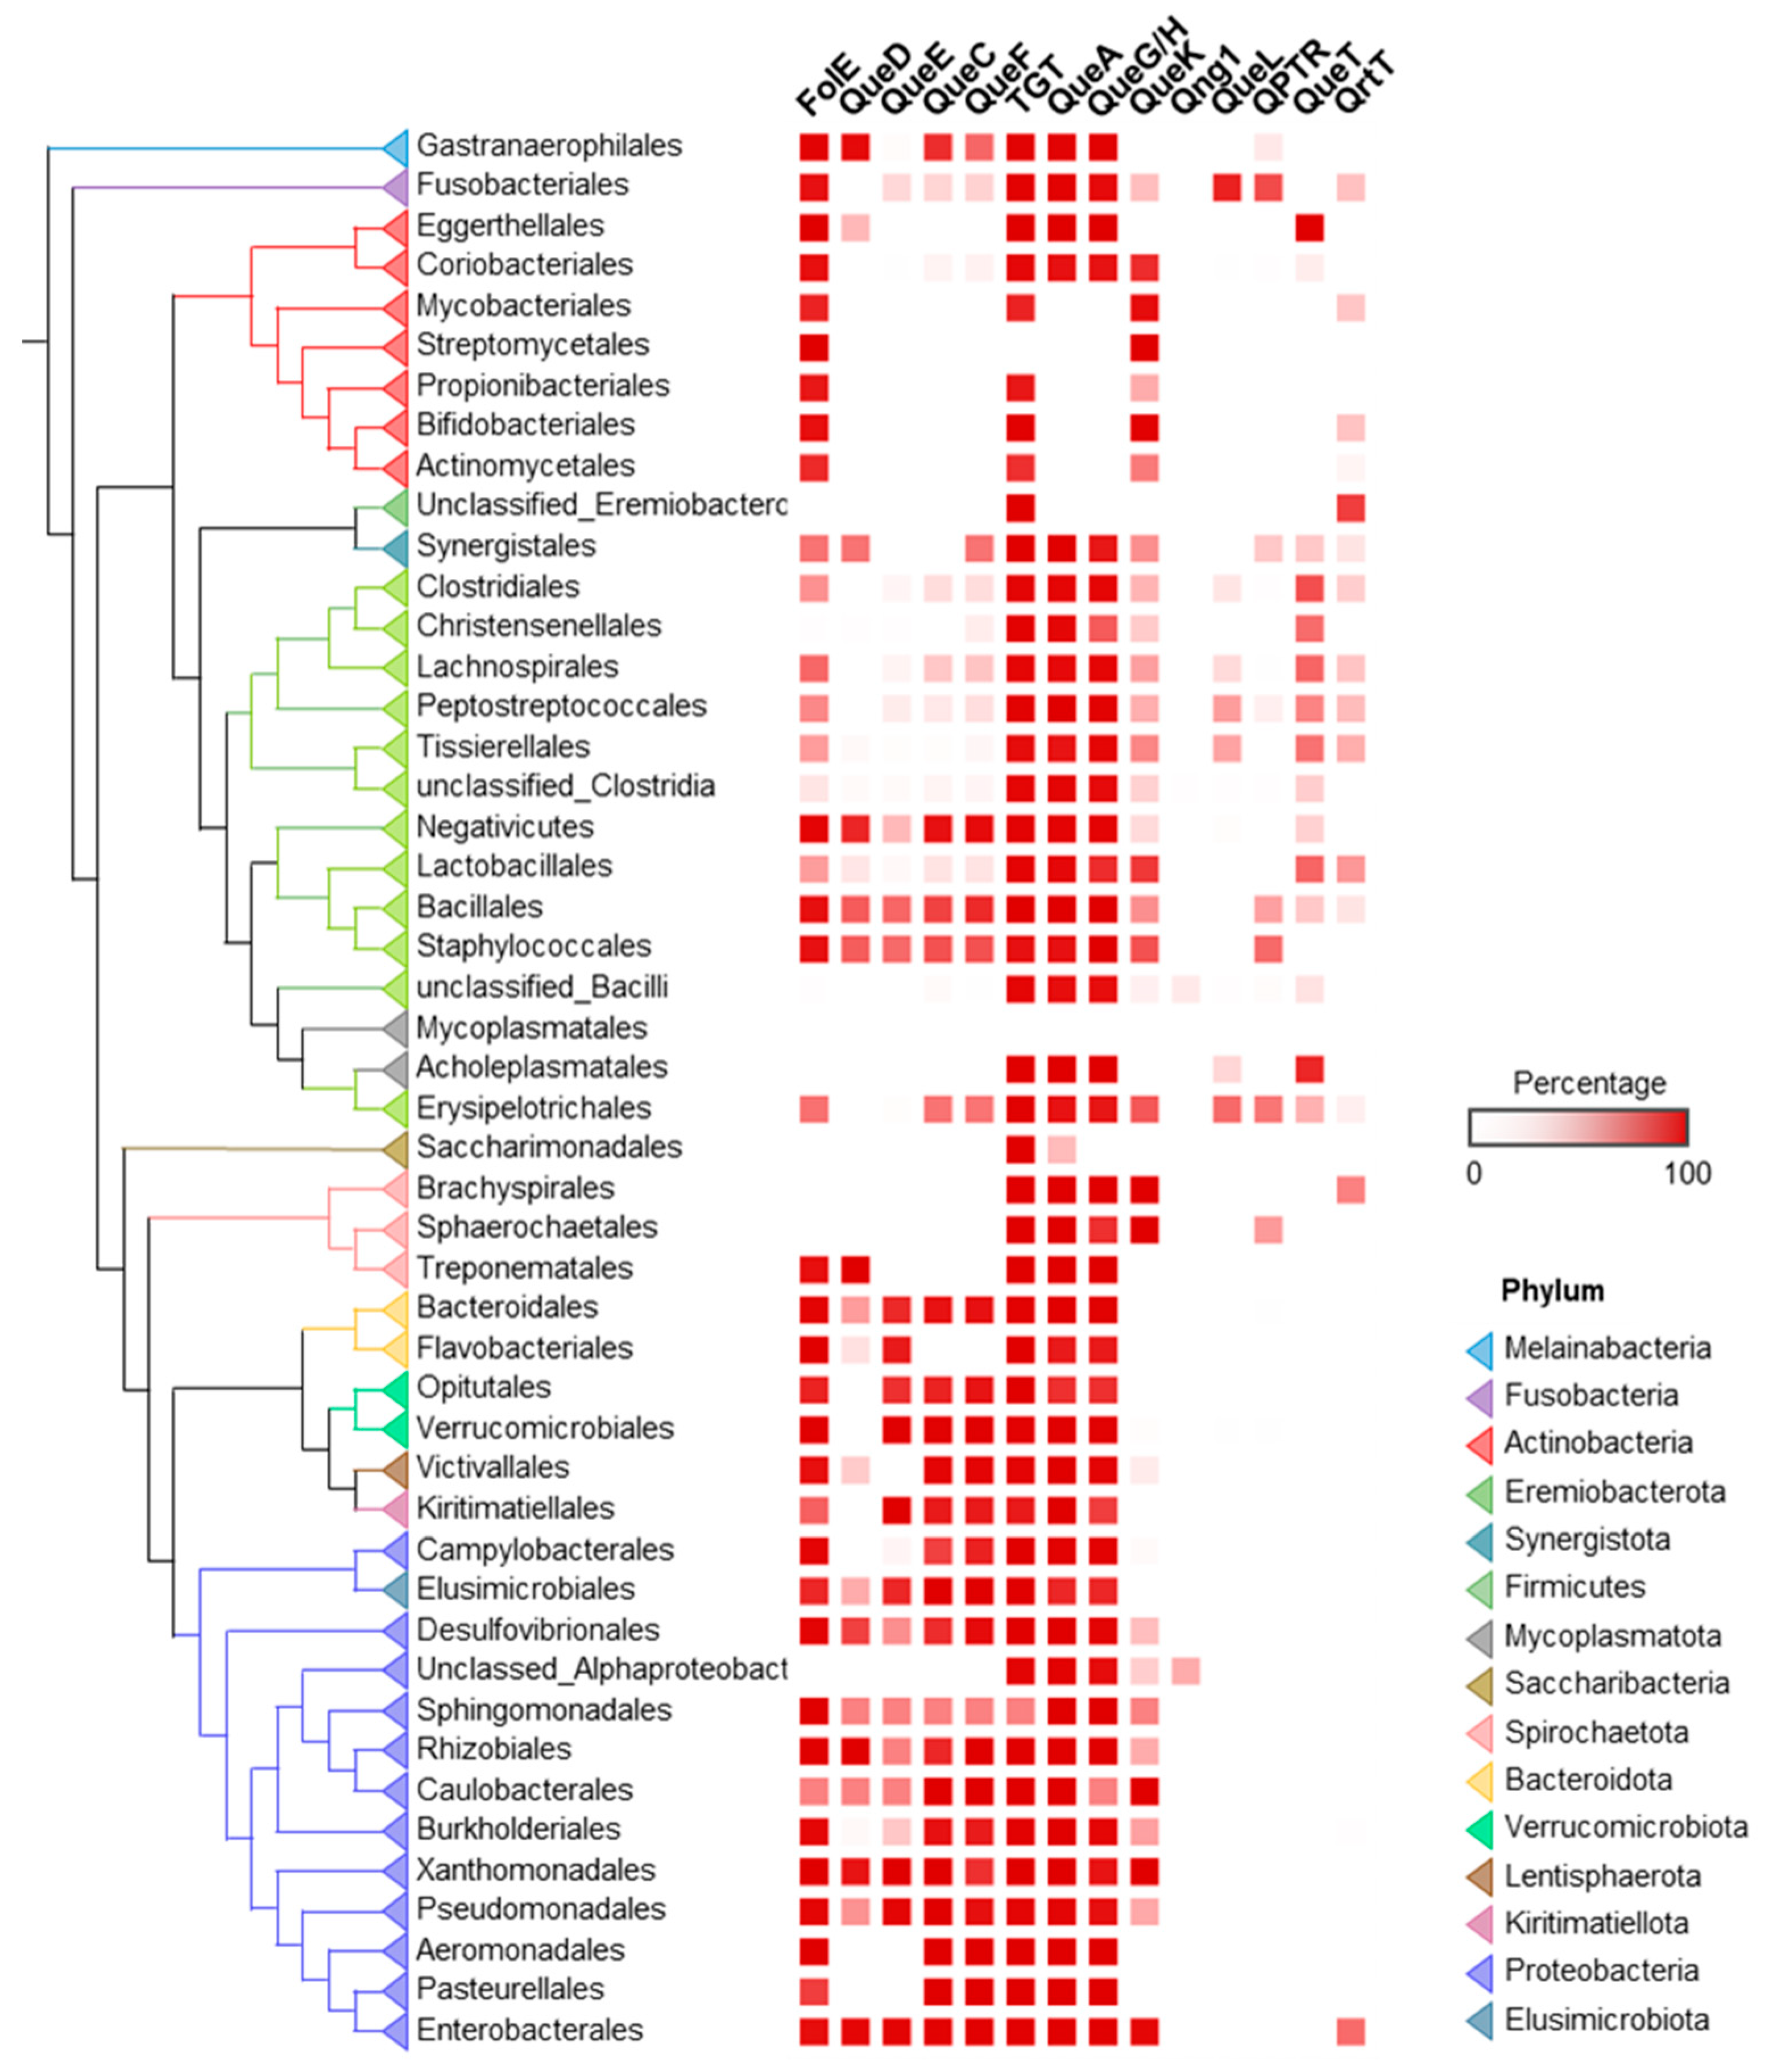
Figure 4.
The colonization and spatial organization of Q pathways in the gut microbiota. (a) Distribution of bacterial composition and Q pathway proteins along the longitudinal axis of the human gut. (b) Bacterial compositions vary along the transverse axis of the mouse gut. The spatial distribution of gut microbiome was adapted from references (23–25) with permissions.
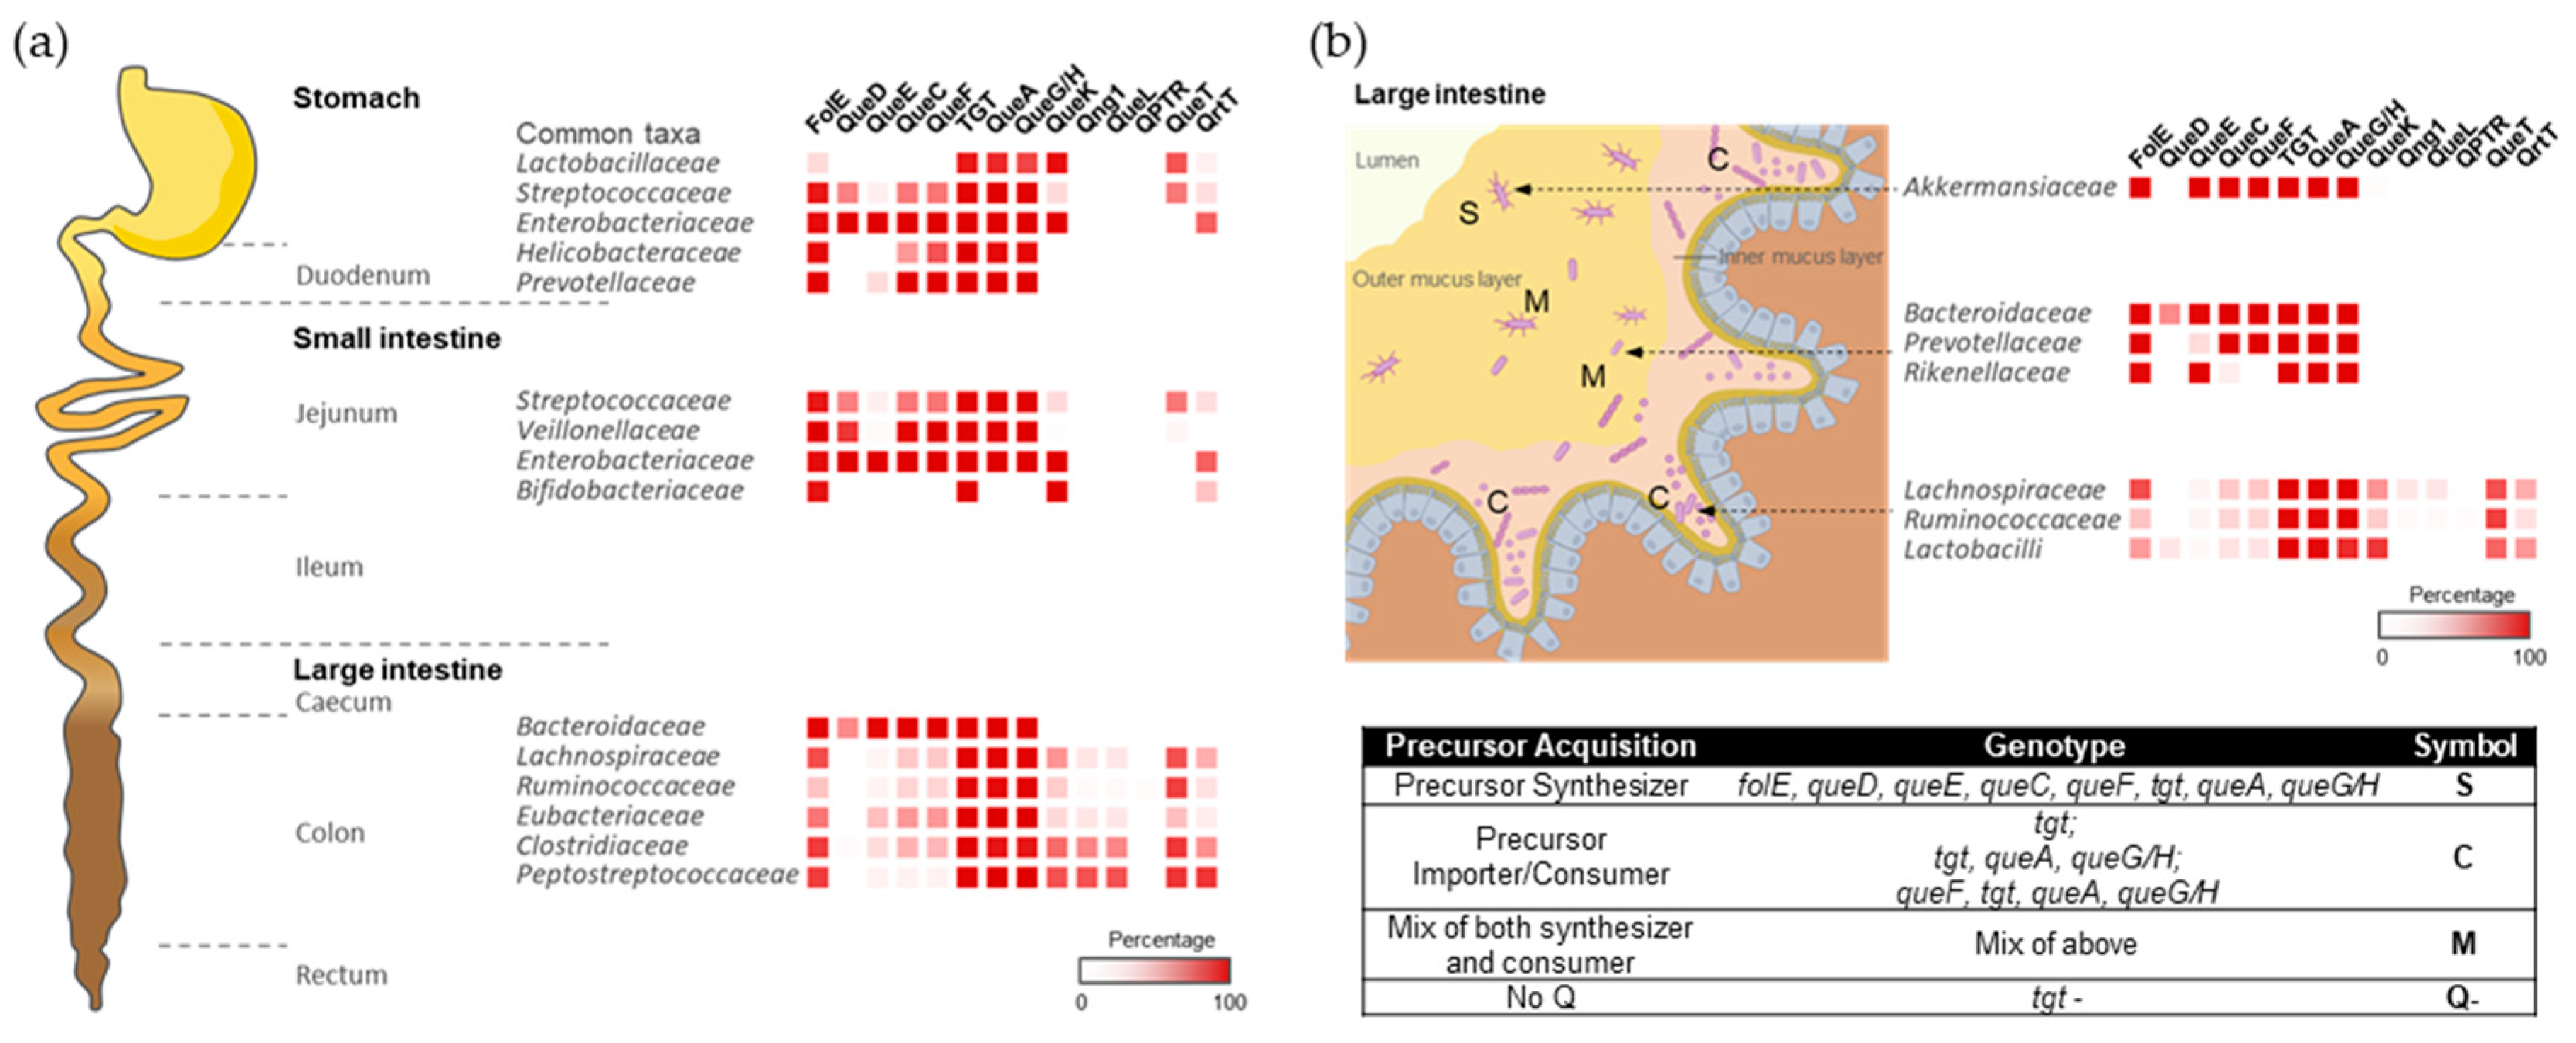
Figure 5.
Distribution and the spatial colonization of Q pathway proteins in the human oral microbiota. (a) Distribution of Q pathway proteins in the human oral microbiome. (b) Spatial organization of Q pathways in the human oral tooth microbiota. Aggr. is short for Aggregatibacter. Adapted from (16) with permission.
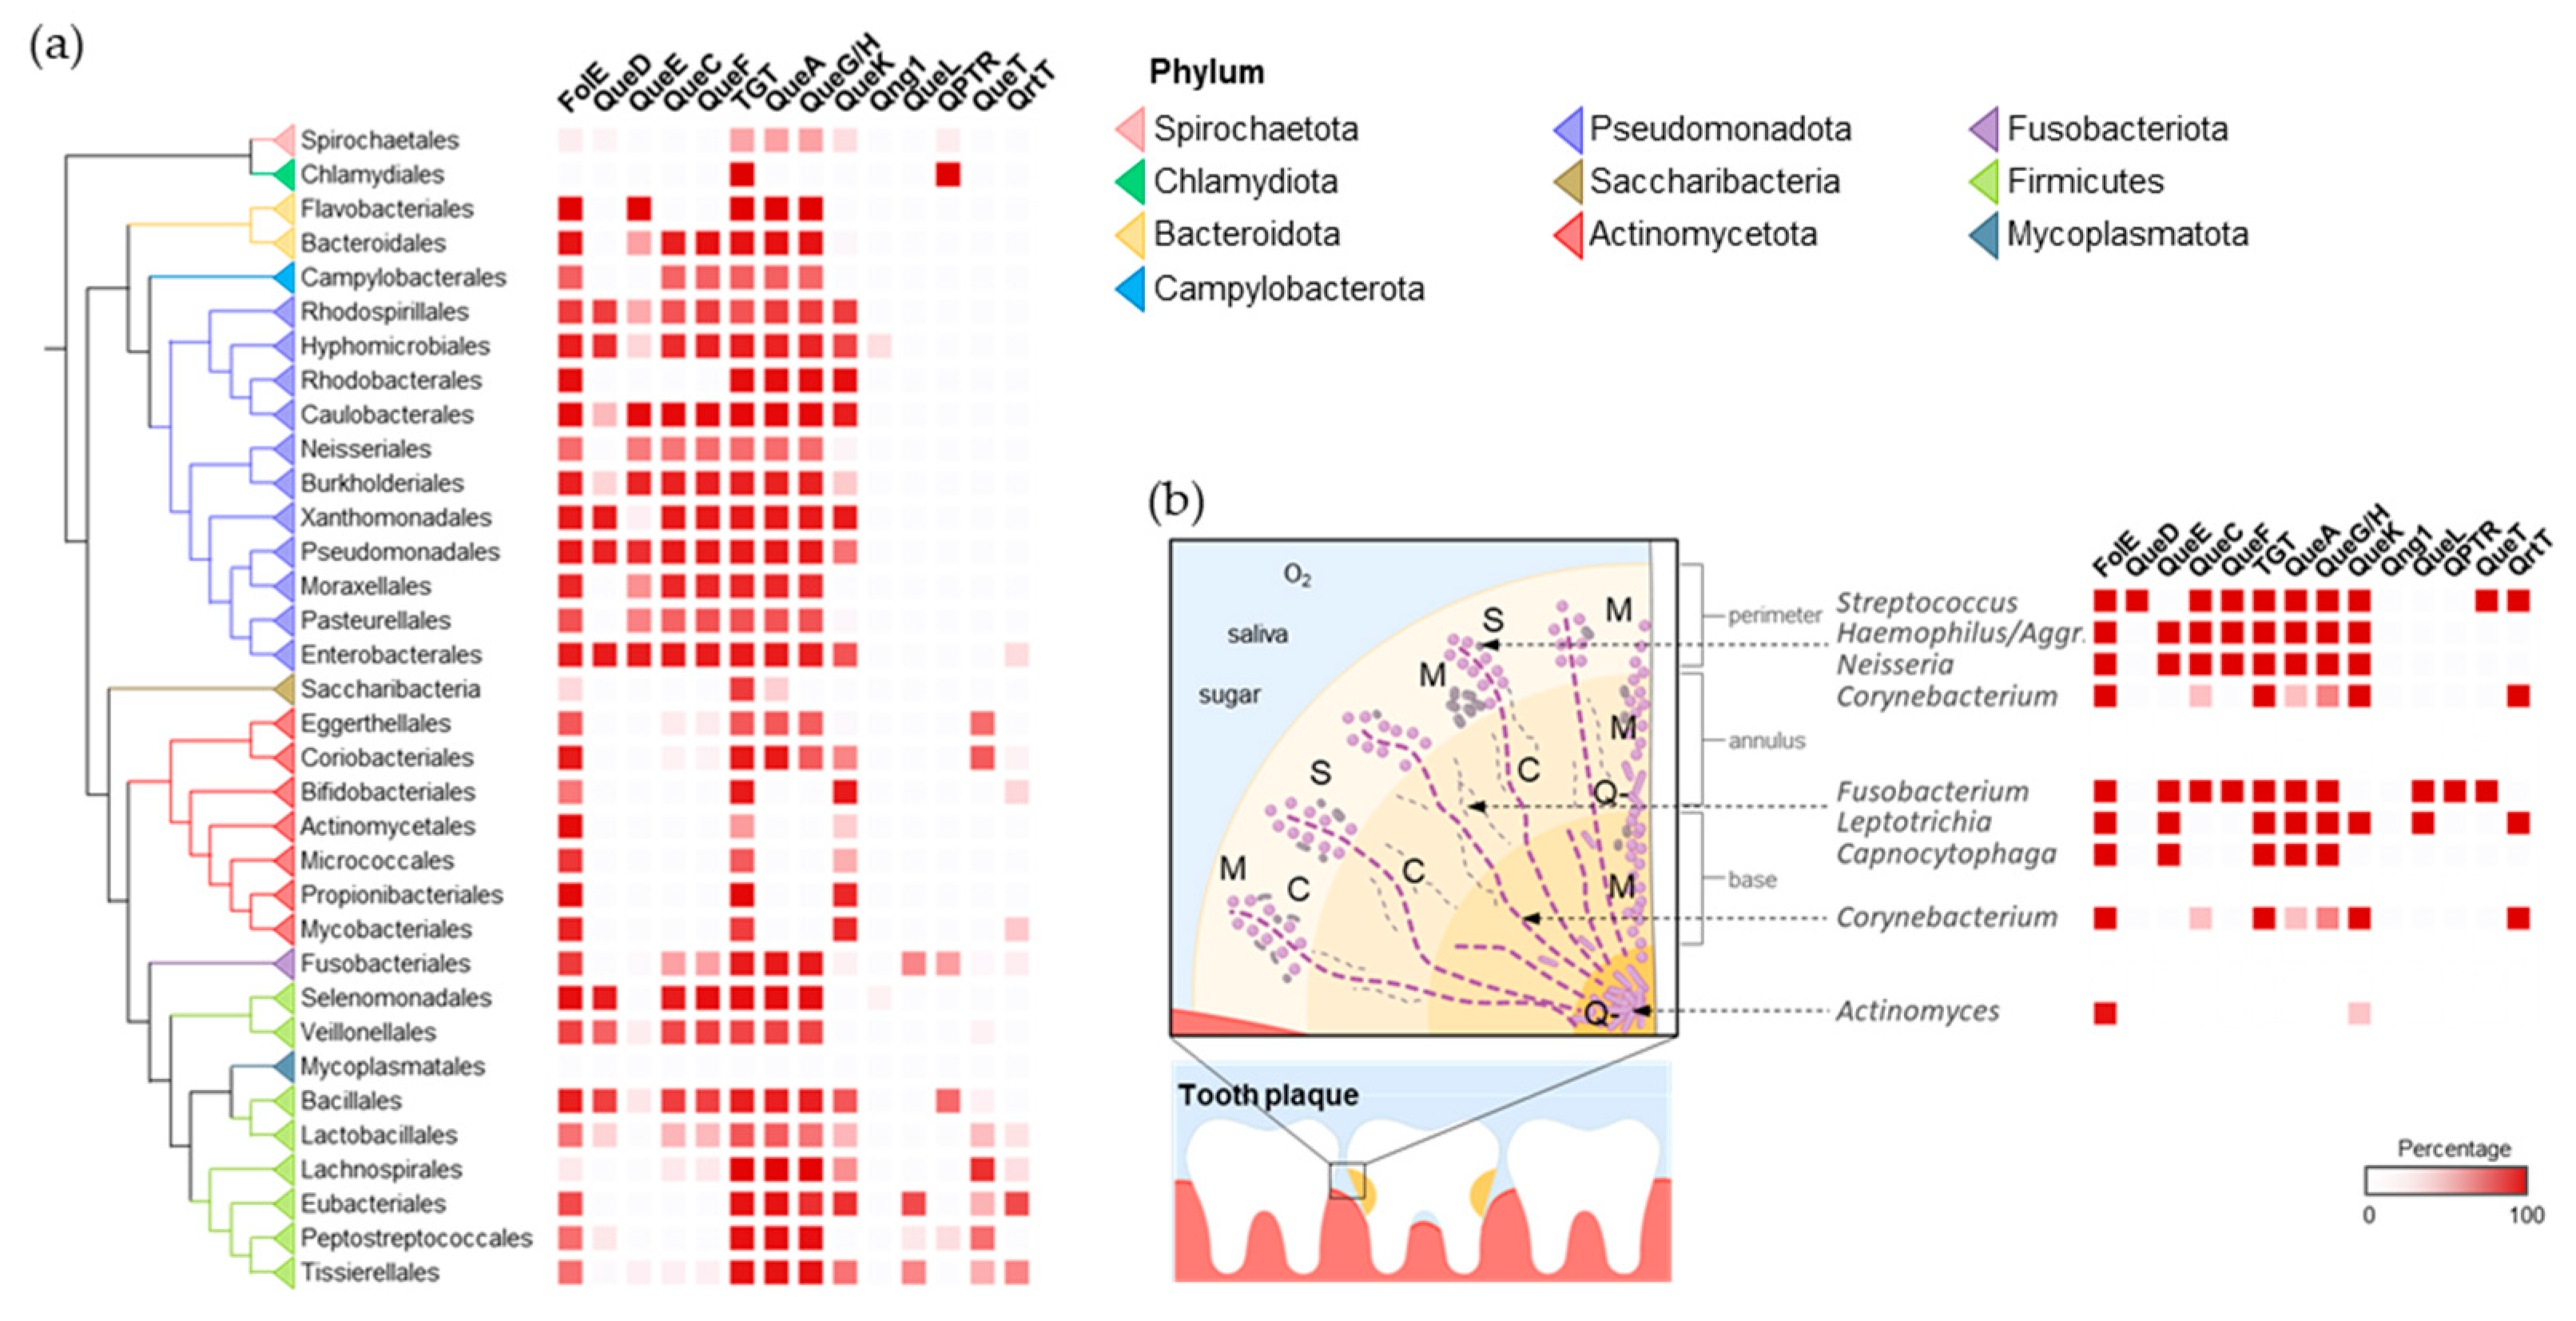
Figure 6.
SSNs of TGT, Qng1 and QueK proteins. (a) Each node in the network represents one or multiple TGT proteins that share > 90% identity. An edge (represented as a line) is drawn between two nodes with a BLAST E-value cutoff of better than 10–135 (alignment score threshold of 135). (b) Each node in the network represents one Qng1 protein. An edge is drawn between two nodes with an alignment score > 90. (c) Each node in the network represents one or multiple QueK proteins that share no less than 90% identity. An edge is drawn between two nodes with alignment score >90. The nodes are circled based on the presence/absence of the other Q synthesis genes in the corresponding species. Species that do not encode TGT are circled in gray. For better visualization, the solitary nodes and small clusters are hidden. Nodes are in filles color when candidate transporters are present in the gene neighborhood (distance ≤ 3) or fused. Boxed clusters are analyzed further in Figure 7.
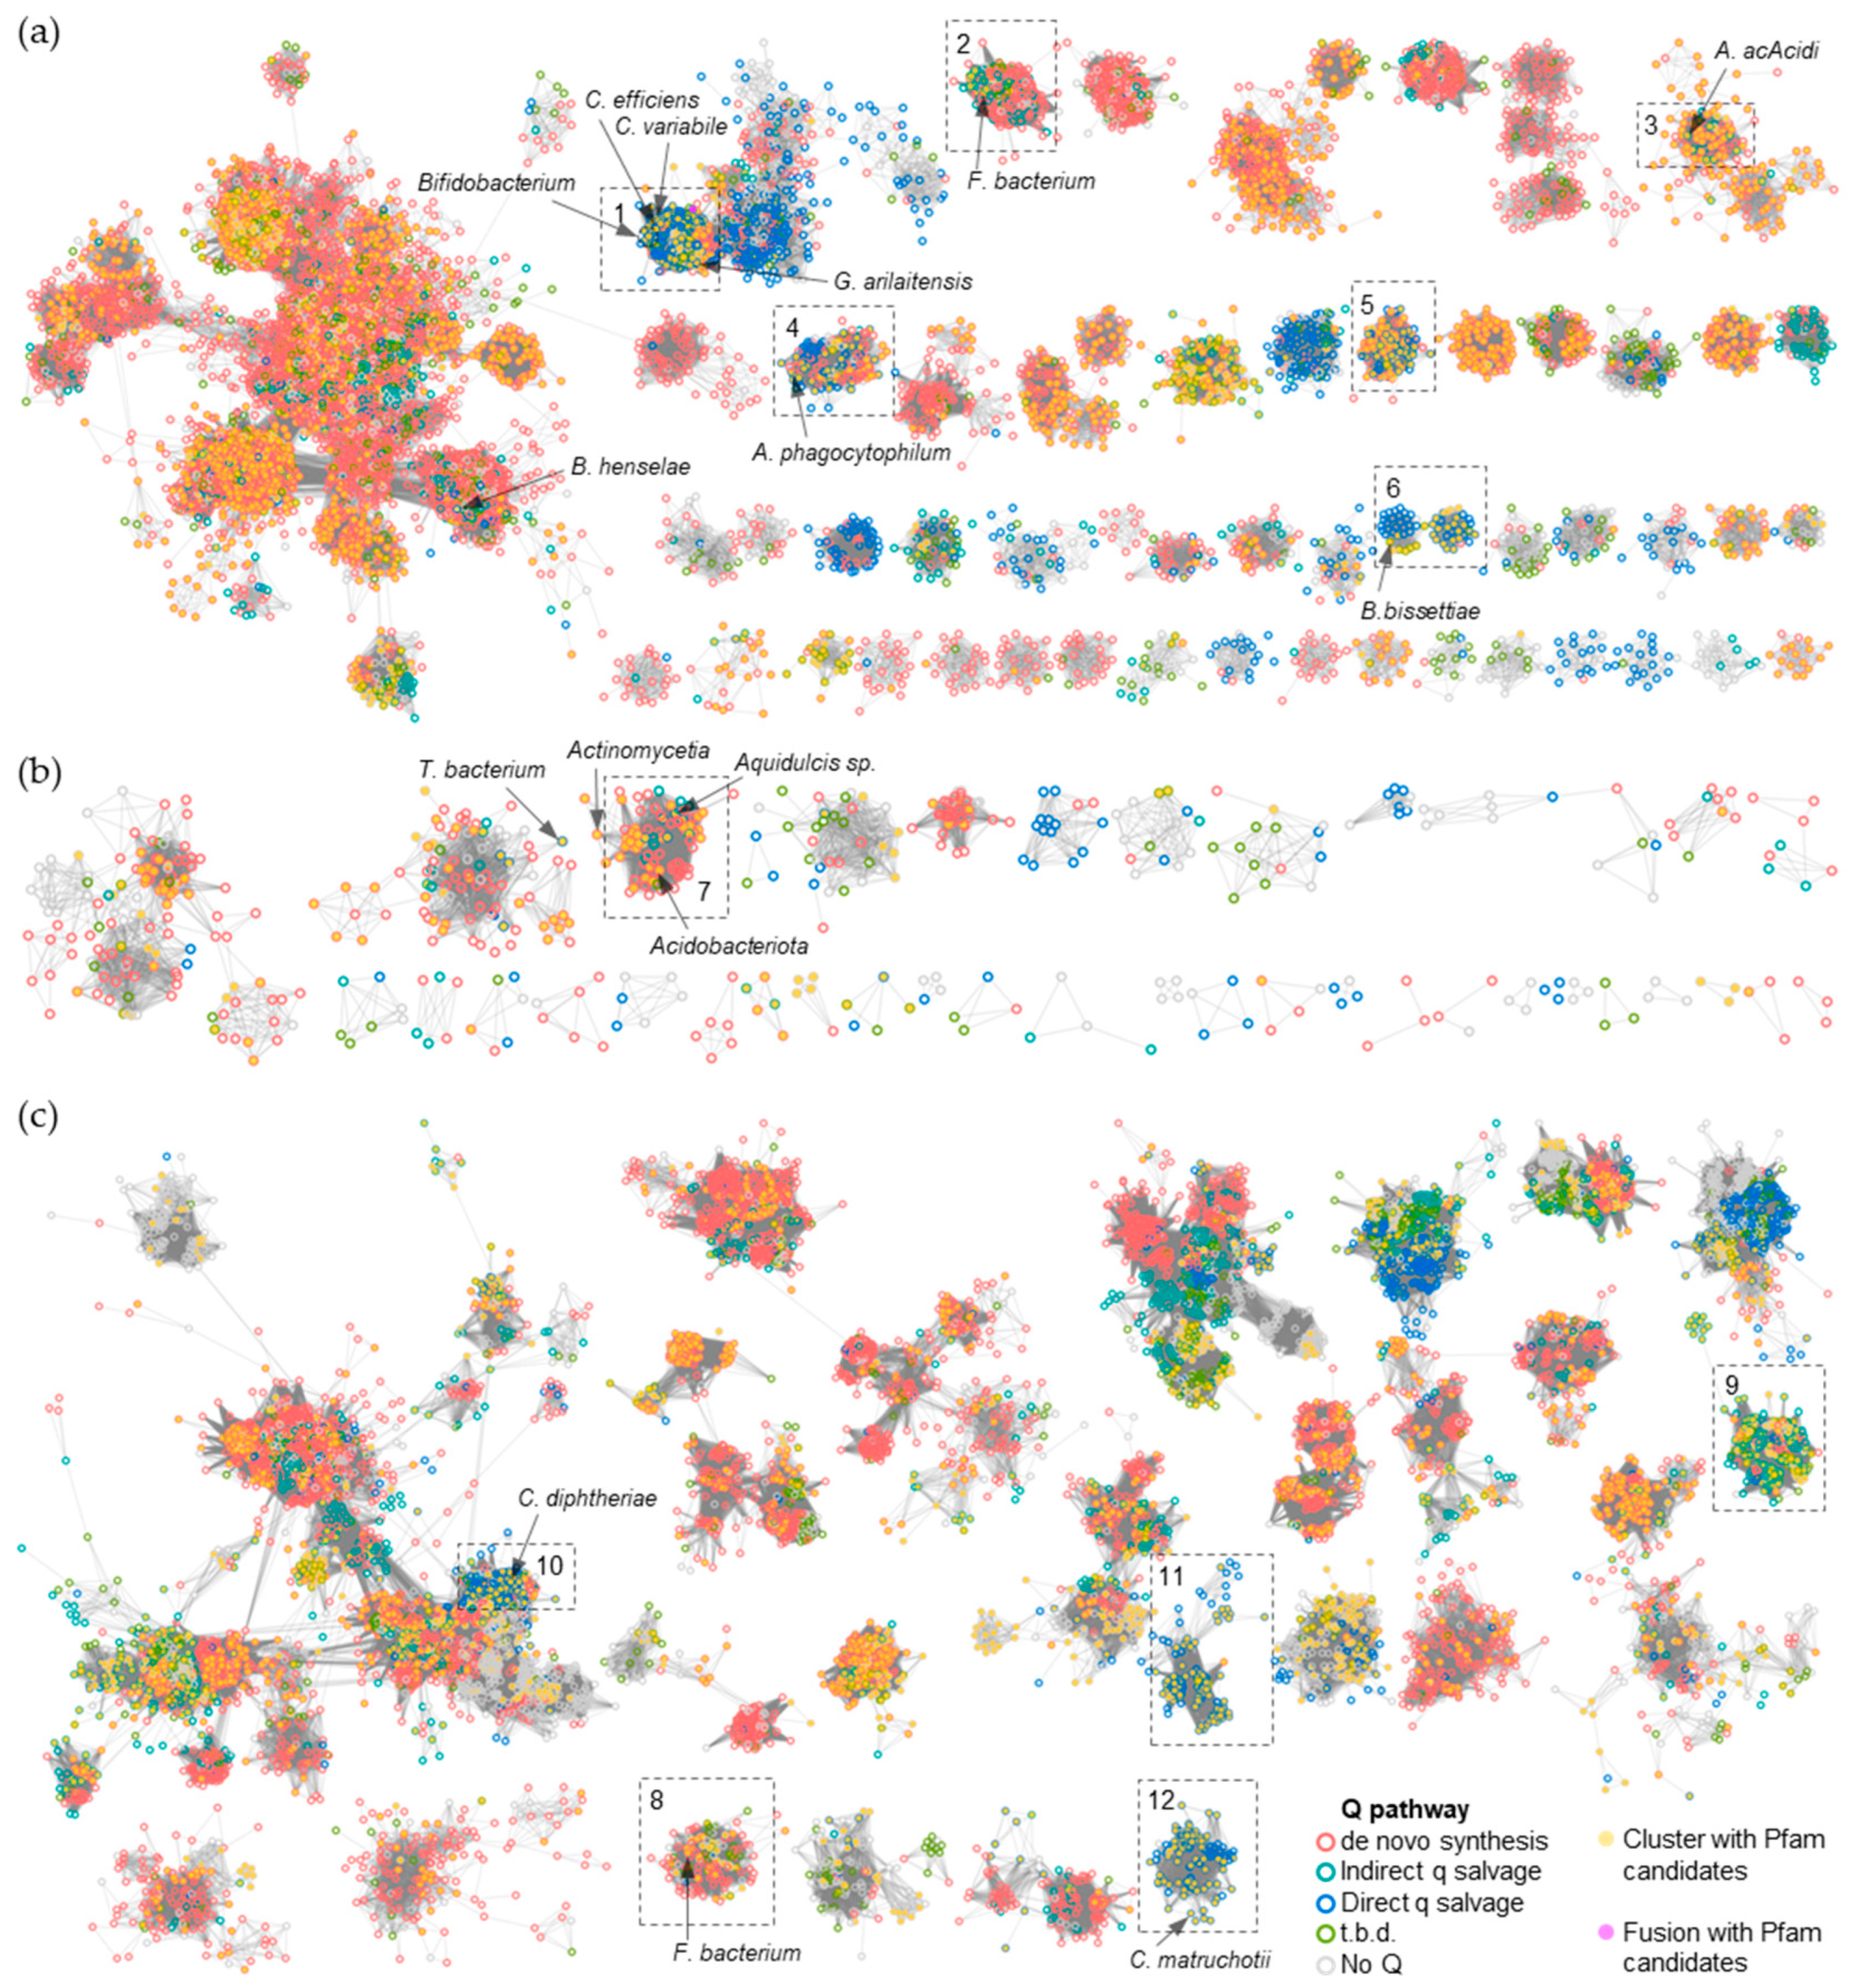
Figure 7.
Enrichments of specific Pfam transporter families clustering with Q salvage genes. For each boxed cluster in Figure 6 (numbered 1 to 12), all transporter candidates present in each cluster (yellow nodes in the boxed cluster in Figure 6) were extracted and the percentage of candidate members of specific Pfam families was plotted for each cluster.
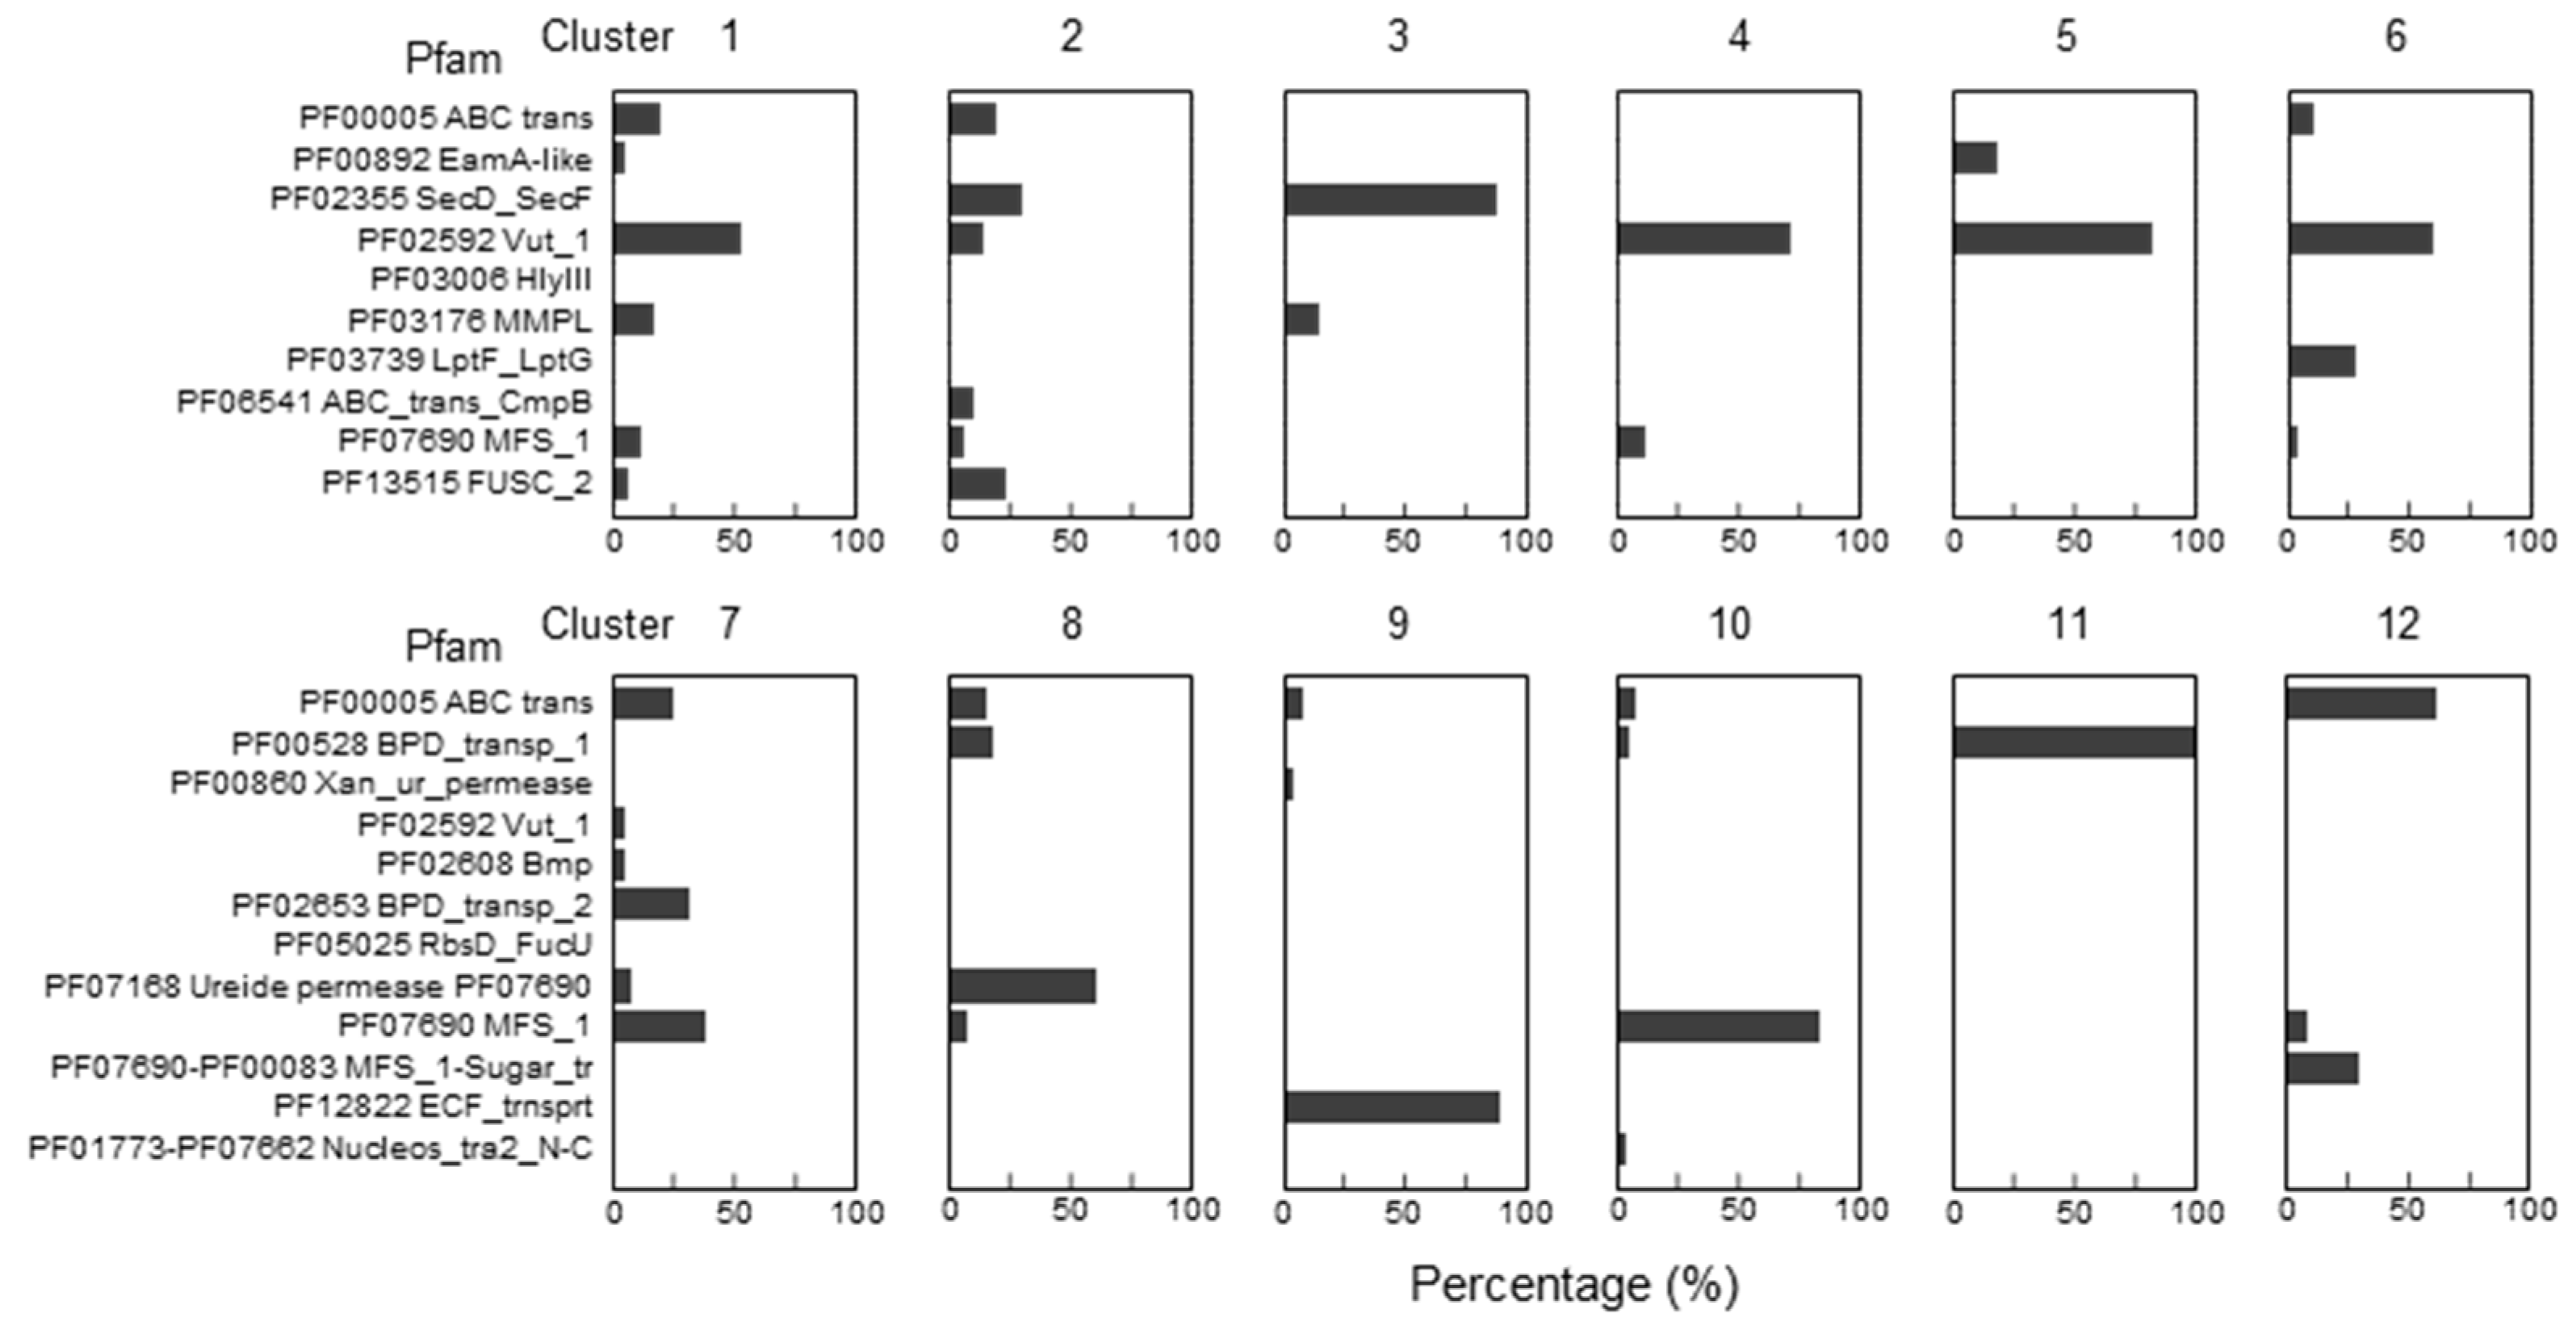
Figure 8.
Experimental validation of preQ0/preQ1 transport activity. (a) tRNAs were extracted from WT, tgt, or E. coli queD-yhhQ/-QPTR double deletion mutants expressing the candidate MFS, Hly III, and UPS transporter genes respectively from Bartonella heneselae (Bh), Bifidobacterium breve (Bb) and Acidobacteriota bacterium (Ac) listed in Table 1, grown in minimal media in the presence of exogenous preQ1 or preQ0. Detection of Q-tRNAAspGUC was performed using the APB detection assay described in the method section where Q-modified tRNAs migrate slower than unmodified tRNAs. (b) The presence of Q pathway genes in the organisms encoding the transporters tested in (a), data extracted from dataset S3.
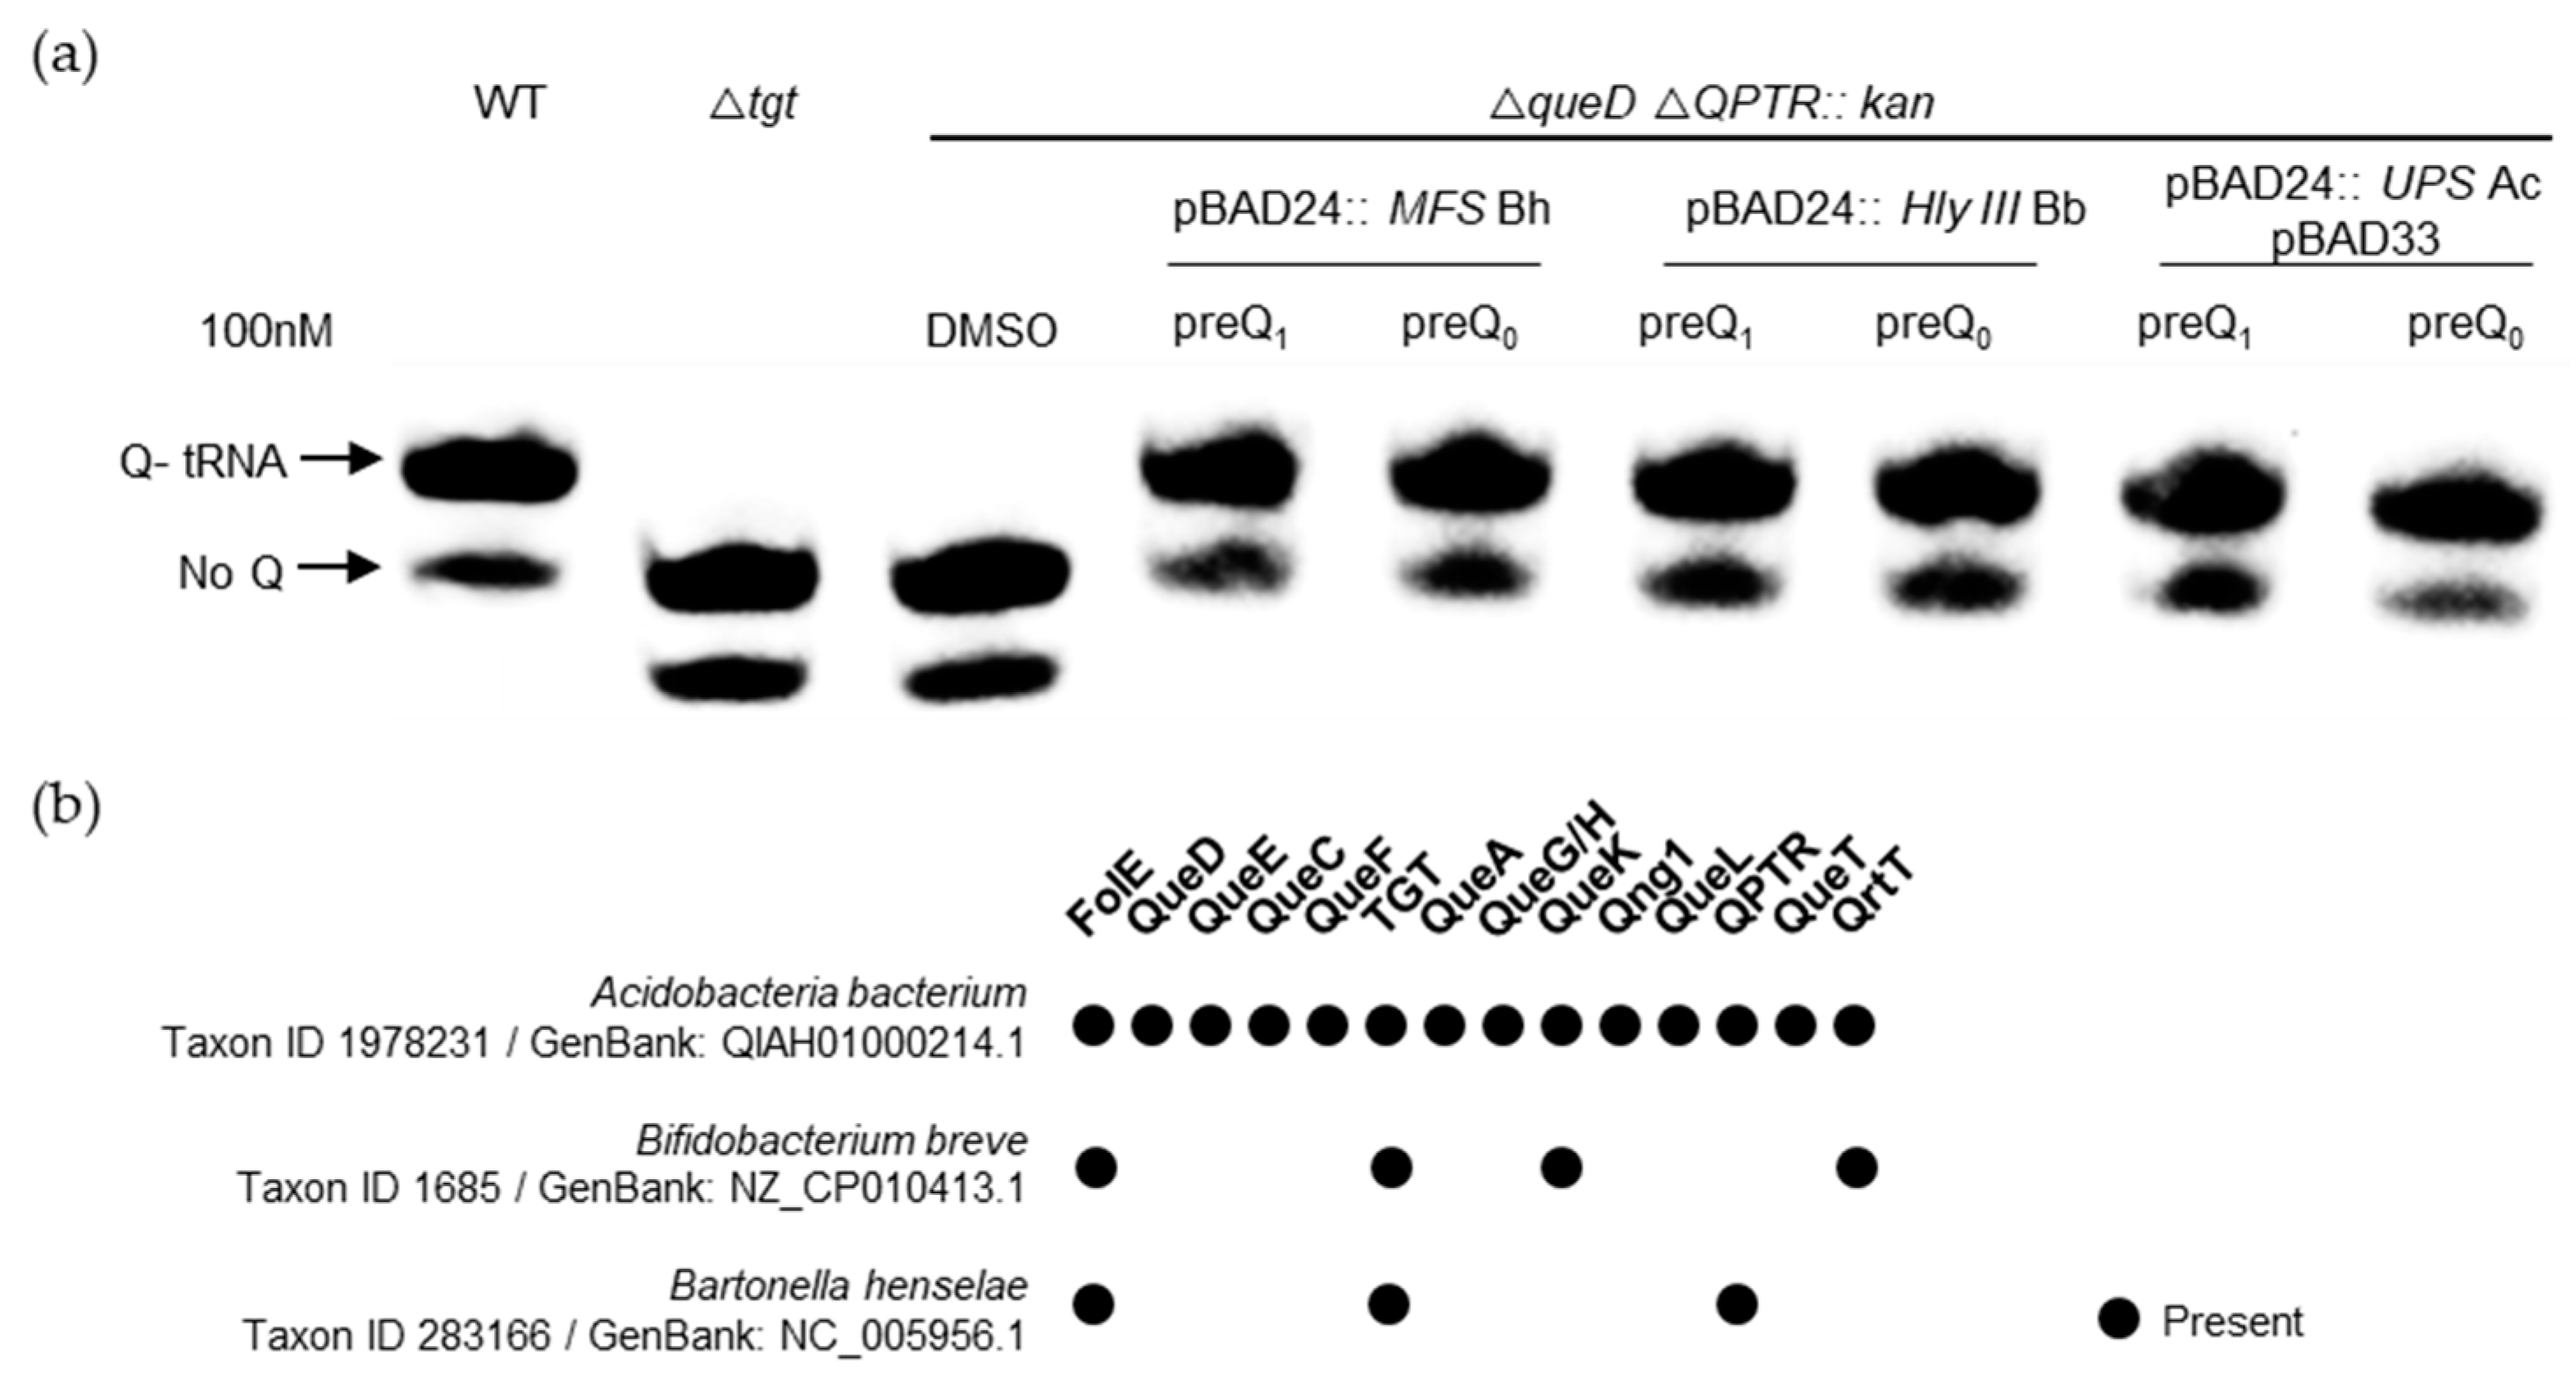
Figure 9.
SSN of HlyIII family (IPR004254/PF03006). (a) Each node in the network represents one or multiple HlyIII proteins that share no less than 50% identity. An edge (represented as a line) is drawn between two nodes with a BLAST E-value cutoff of better than 10–45 (alignment score threshold of 45). Node borders were colored by superkingdom. The PAQR groups as classified in (29) and Bifidobacterium HlyIII proteins encoded by genes that is next to tgt are colored. The HlyIII members connected to the preQ1 transporter in B. breve were further analyzed (boxed). b) Each node in the network represents one HlyIII protein connected to the preQ1 transporter in B. breve (A0A0M3T8W5) as boxed in (a). An edge is drawn between two nodes with an alignment score better than 65. For better visualization, the solitary nodes and small clusters are hidden. Node boarders were colored by the presence (blue) or absence (black) of TGT.
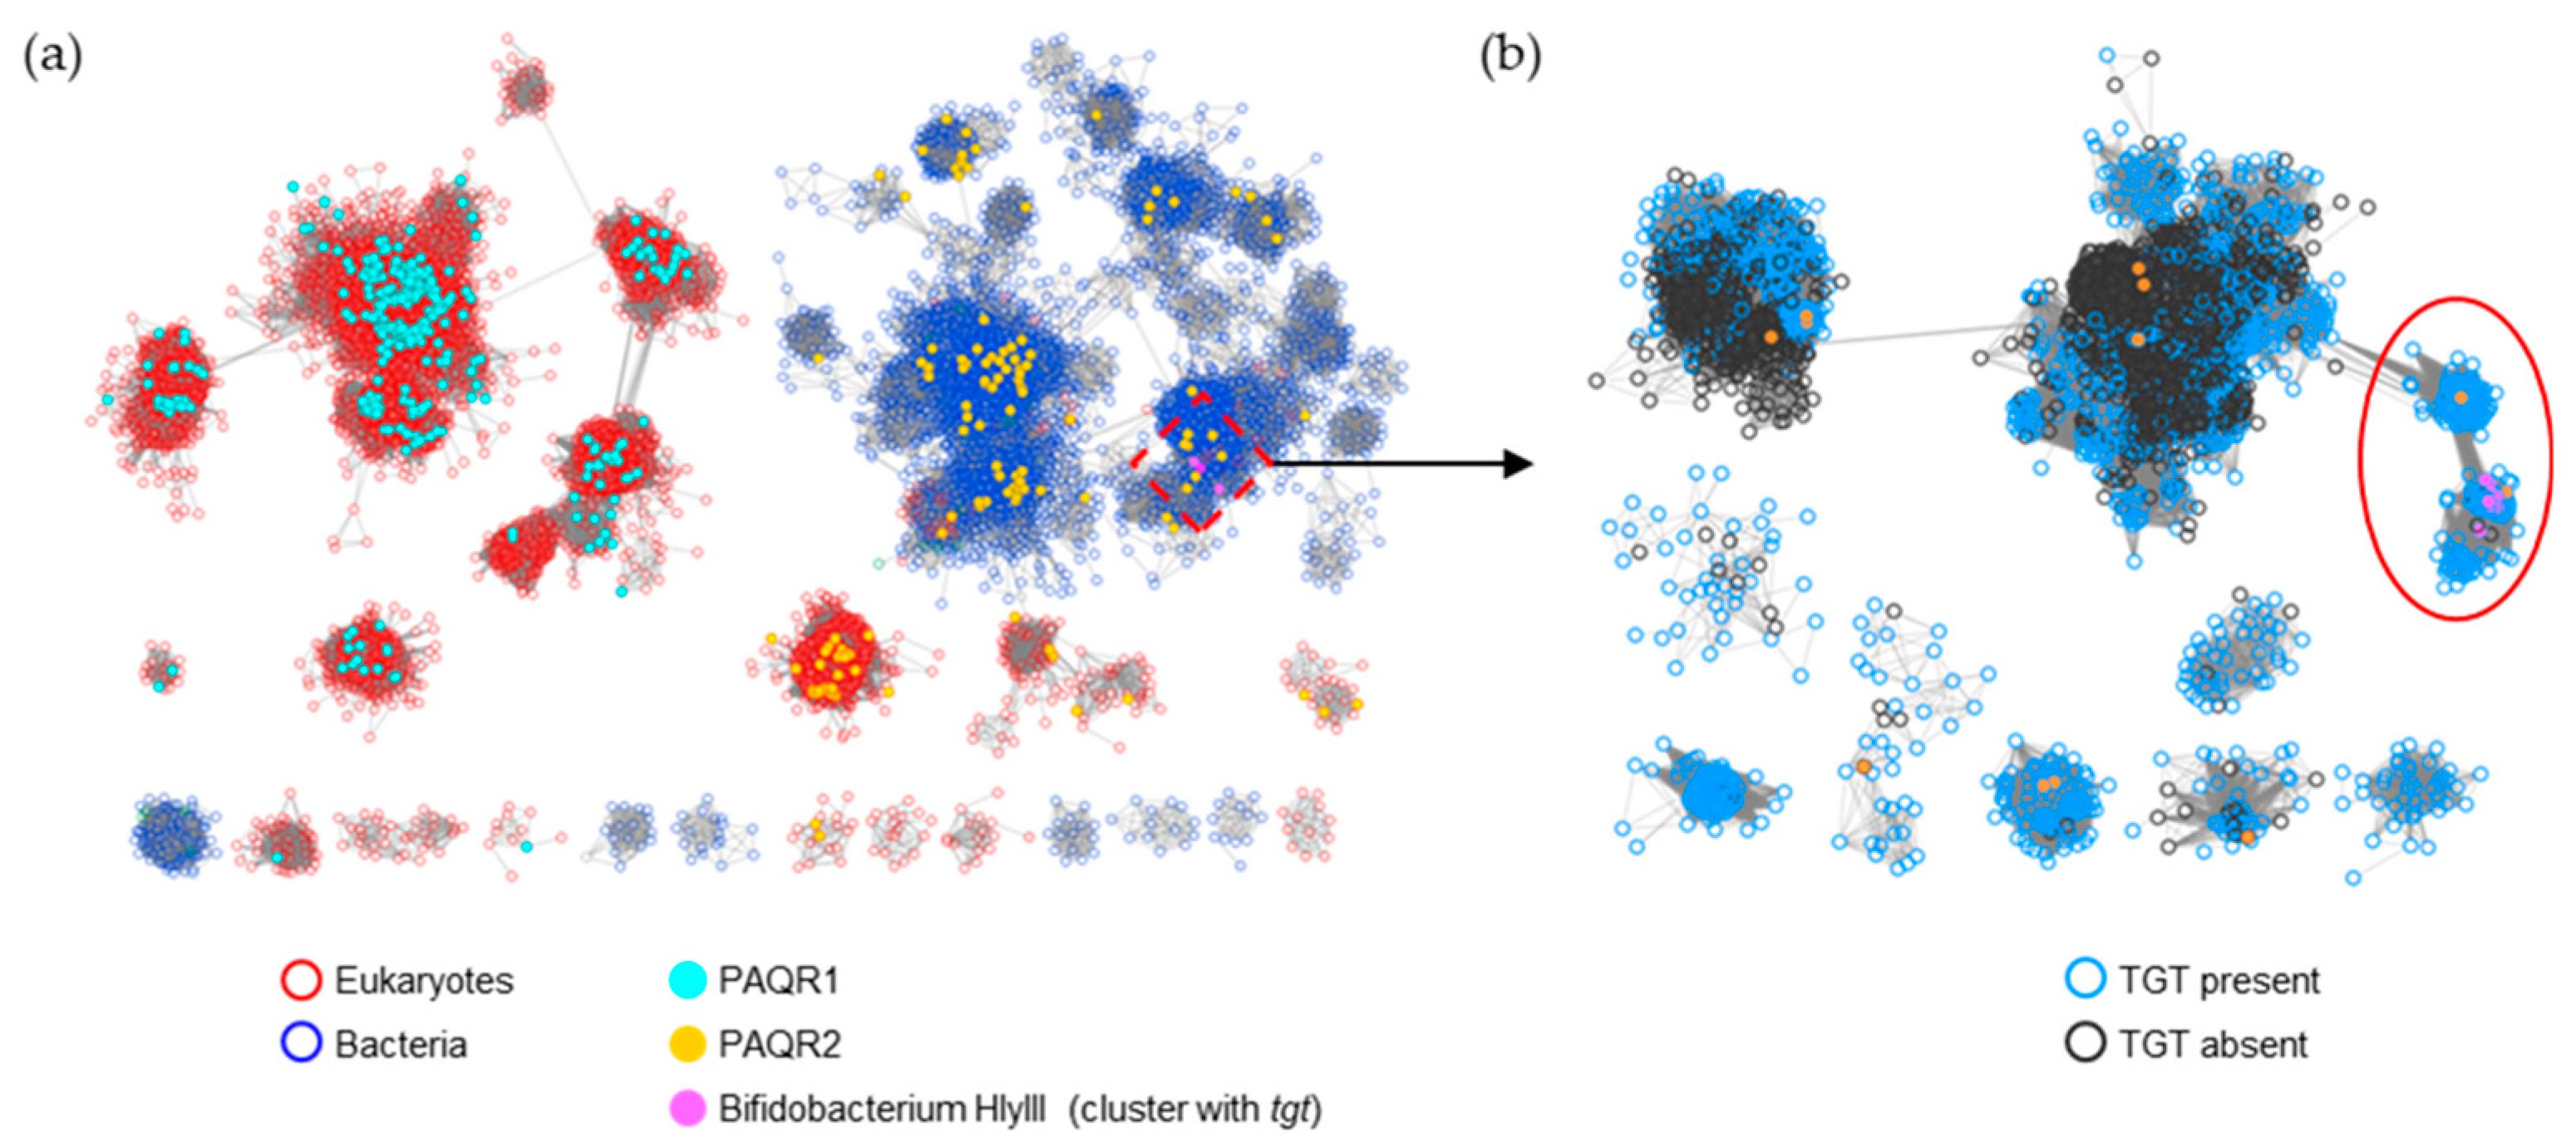
Figure 10.
SSN of the Ureide permease family (IPR009834/PF07168). (a) Each node in the network represents one ureide permease protein. An edge (represented as a line) is drawn between two nodes with a BLAST E-value cutoff of better than 10–30 (alignment score threshold of 30). Node boarders were colored by superkingdom. Members that share no less 90% identity with curated ureide permeases in Uniprot database were colored in orange. Nodes encoded by genes that cluster with queK-like genes are colored in pink. The UPS members connected to preQ1 transporter in Acidobacteriota bacterium (boxed) were further analyzed. (b) Each node in the network represents one UPS protein connected to preQ1 transporter in Acidobacteriota bacterium (A0A2V9U0M9) boxed in (a). An edge is drawn between two nodes with an alignment score better than 100. Node borders were colored by the presence (blue) or absence (black) of TGT.
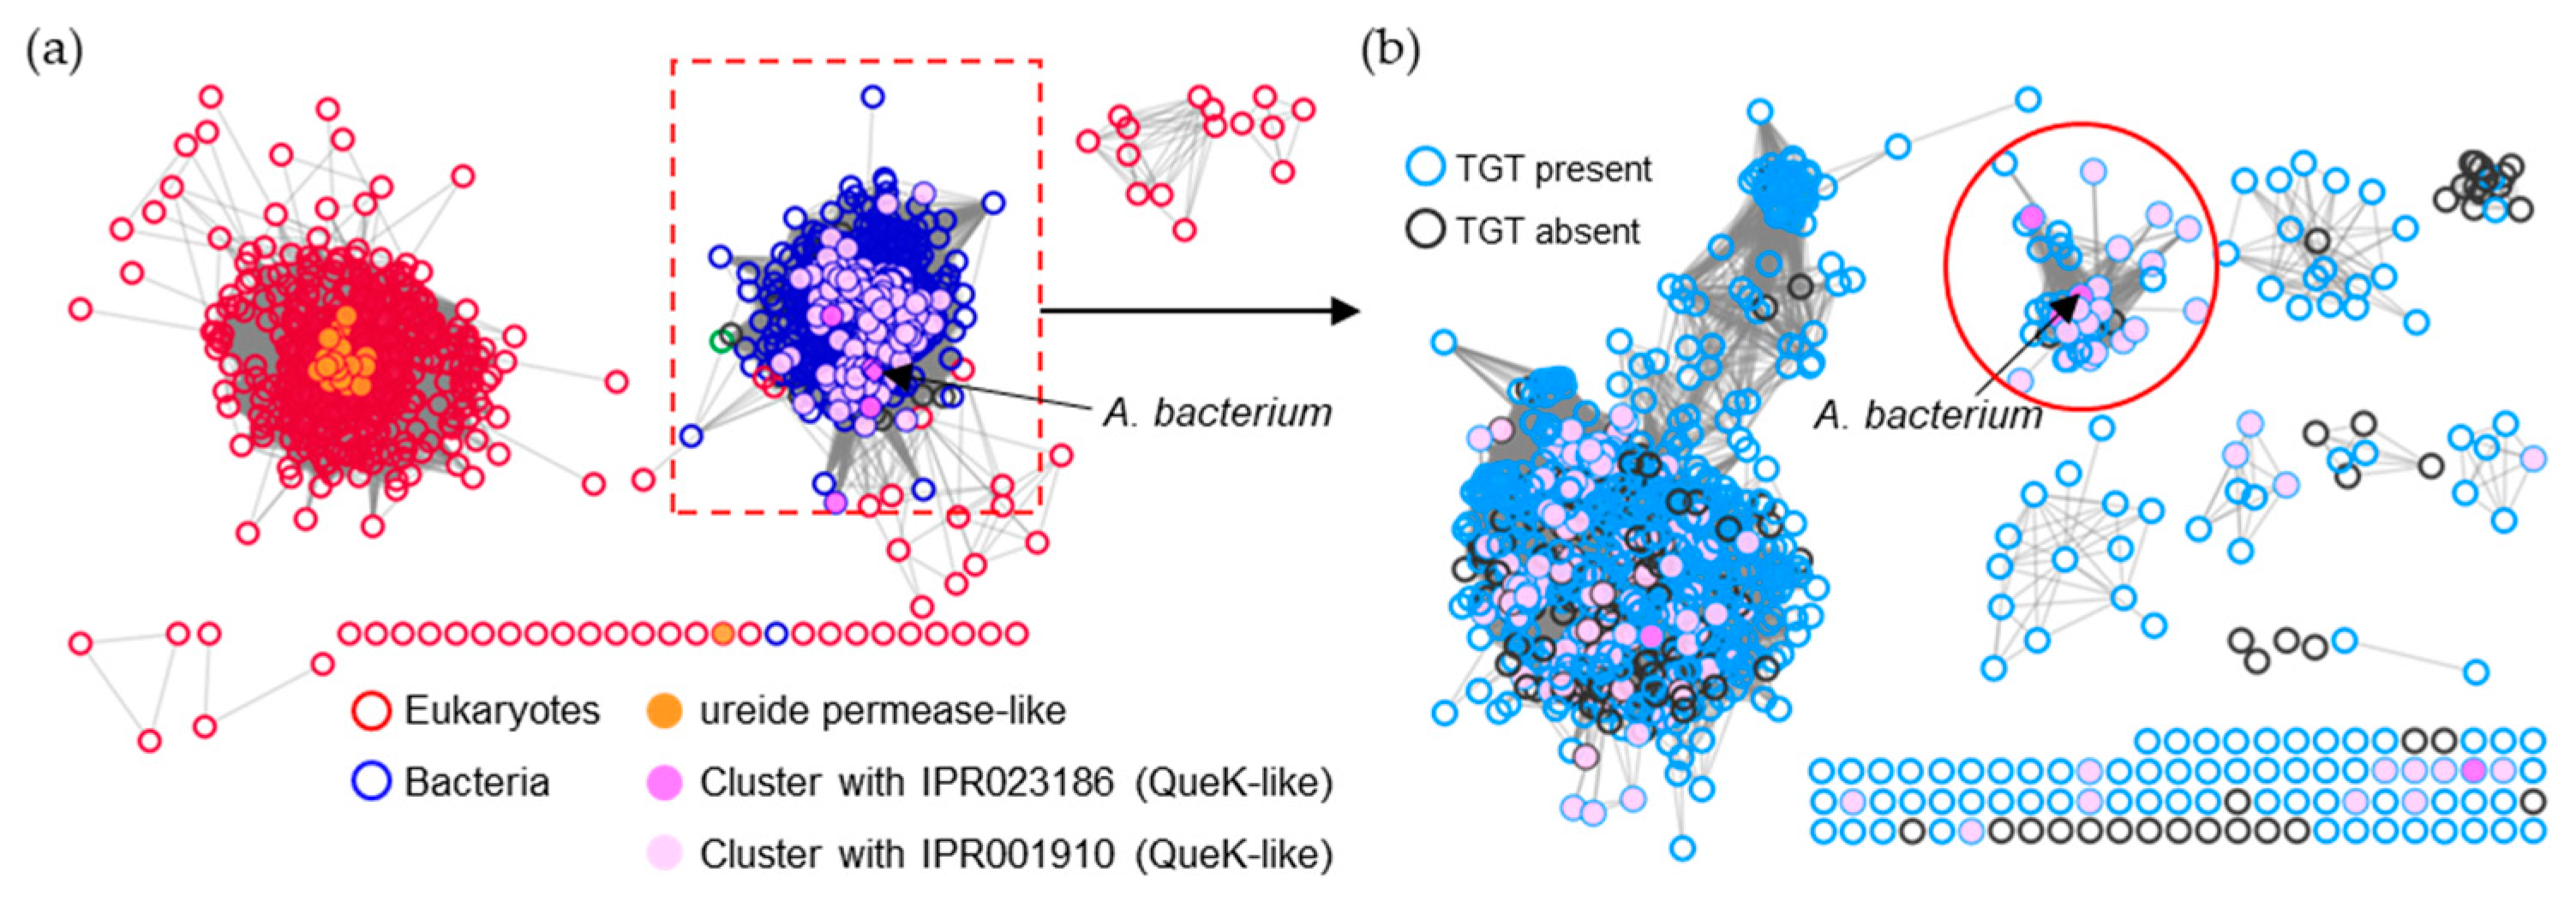
Figure 11.
The composition of TC class for the common bases and B vitamins (summarization of Table S5). Data was retrieved for the indicated substrates using the Substrate Search Tool of the Transporter Classification Database (https://www.tcdb.org/).
Figure 11.
The composition of TC class for the common bases and B vitamins (summarization of Table S5). Data was retrieved for the indicated substrates using the Substrate Search Tool of the Transporter Classification Database (https://www.tcdb.org/).
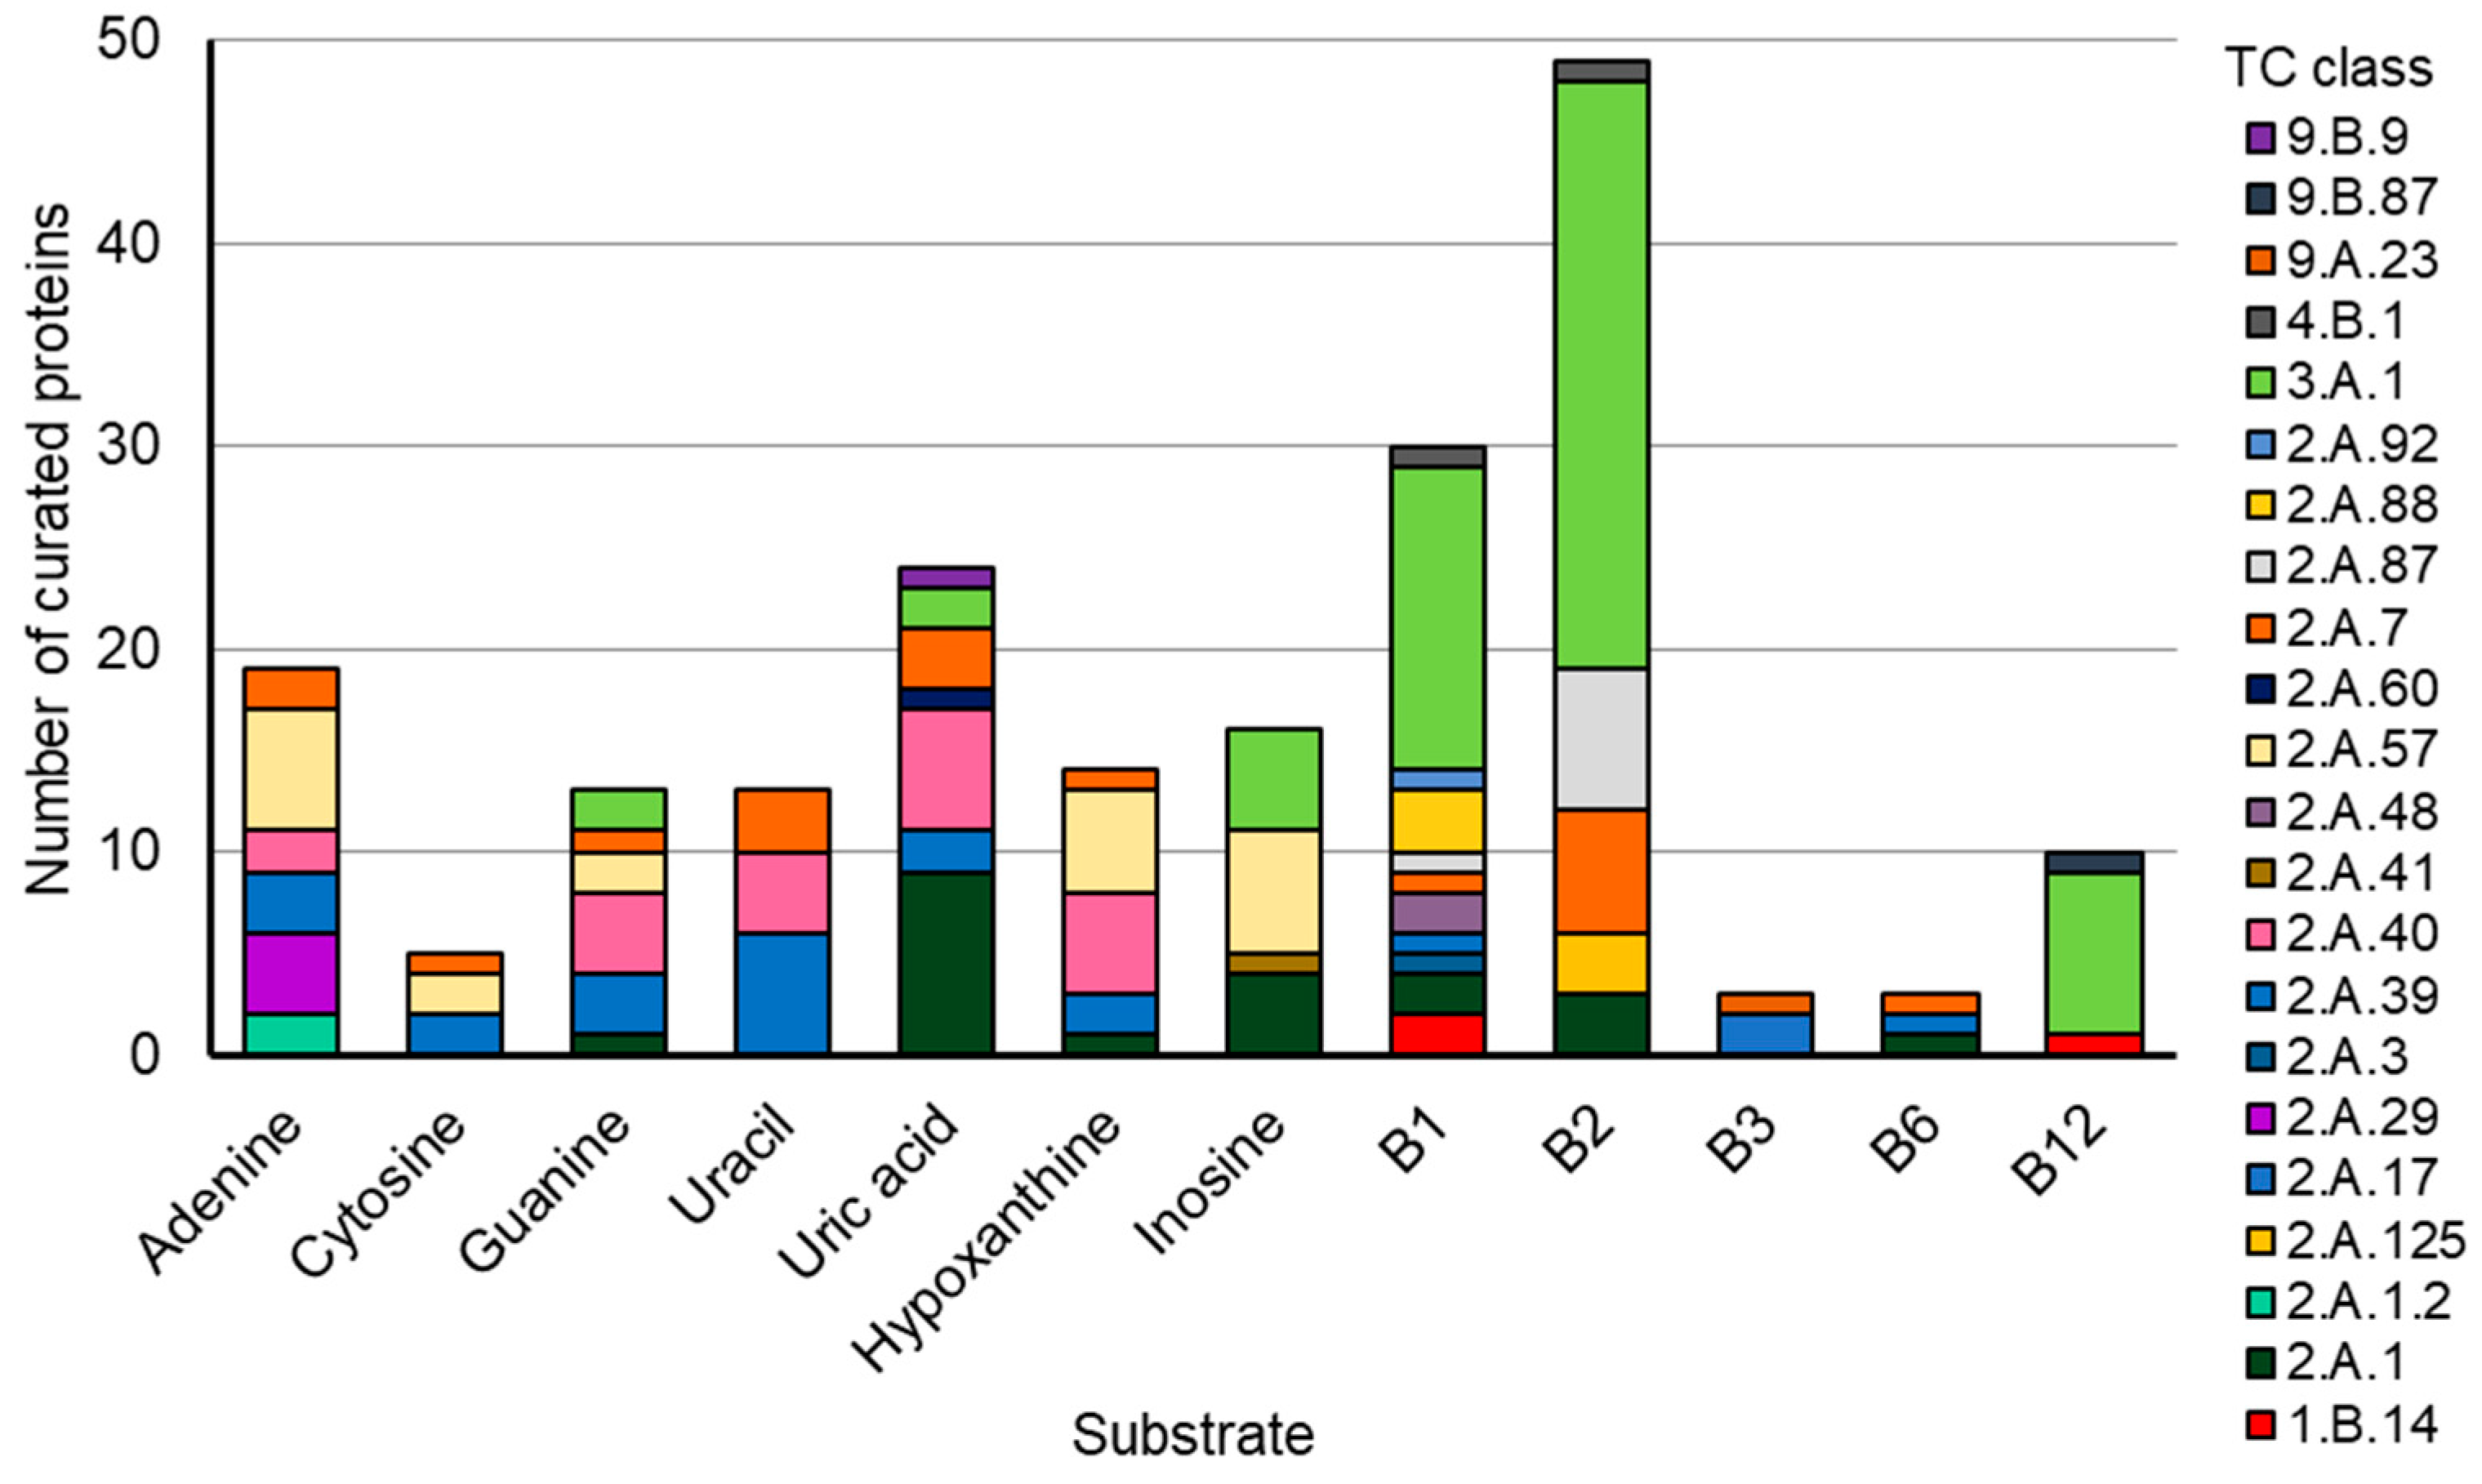

Table 1.
Top Q precursor transporter candidates.
| Pfam | Description | Experimentally tested candidates (species and accession number) |
| PF07690 | Major Facilitator Superfamily (MFS_1) | Bartonella henselae (A0A0H3LX18) (Bh_MFS) |
| PF03176 | MMPL family (MMPL) | Corynebacterium propoinquum (0A2W5NLC3) |
| PF03006 | Haemolysin-III related (Hly_III) | Brevibacterium breve (A0A0M3T8W5) (Bb_HlyII) |
| PF13515 | Fusaric acid resistance protein-like (FUSC_2) |
Not tested |
| PF00892 | EamA-like transporter family (EanA) | Not tested |
| PF02355 | Protein export membrane protein (SecD/SecF) |
Not tested |
| PF03739 | Lipopolysaccharide export system permease (LptF/LptG) |
Winogradskyella sp. (A0A024FC69) Chryseobacterium piperi (A0A086BN18) Bacteroides (Phocaeicola) dorei (A0A076J562) |
| PF06541 | Putative ABC-transporter type IV (ABC_trans_CmpB) | Not tested |
| PF07168 | Ureide permease (UPS) | Acidobacteriota bacterium (A0A2V9U0M9) (Ac_UPS) |
| PF00005 | ABC transporter (ABC_tran) | Not tested |
Disclaimer/Publisher’s Note: The statements, opinions and data contained in all publications are solely those of the individual author(s) and contributor(s) and not of MDPI and/or the editor(s). MDPI and/or the editor(s) disclaim responsibility for any injury to people or property resulting from any ideas, methods, instructions or products referred to in the content. |
© 2024 by the authors. Licensee MDPI, Basel, Switzerland. This article is an open access article distributed under the terms and conditions of the Creative Commons Attribution (CC BY) license (http://creativecommons.org/licenses/by/4.0/).
Copyright: This open access article is published under a Creative Commons CC BY 4.0 license, which permit the free download, distribution, and reuse, provided that the author and preprint are cited in any reuse.


