
Submitted:
04 March 2024
Posted:
05 March 2024
You are already at the latest version
Abstract
Elevated circulating triglyceride levels have been linked to an increased risk of diabetes, although the precise mechanisms remain unclear. This study aimed to investigate whether low-density lipoprotein (LDL) cholesterol, homeostatic model assessment (HOMA) for insulin resistance, and C-reactive protein served as mediators in this association across a sample of 18,435 US adults. Mediation analysis was conducted using the PROCESS Version 4.3 Macro for SPSS. Simple medi-ation analysis revealed that all three potential mediators played a role in mediating the associa-tion. However, in the parallel mediation analysis, where all three mediators were simultaneously included, HOMA for insulin resistance remained a significant mediator (indirect effect coefficient, 0.47; 95% confidence interval [CI], 0.43—0.52; p < 0.05) after adjusting for all tested confounding factors. Conversely, LDL cholesterol (indirect effect coefficient, -0.13; 95% CI, -0.31—0.05; p > 0.05) and C-reactive protein (indirect effect coefficient, 0.01; 95% CI, -0.003—0.02; p > 0.05) ceased to be significant mediators. HOMA for insulin resistance accounted for 49% of the association between triglycerides and diabetes. In conclusion, HOMA for insulin resistance was the dominant mediator underlying the association between triglycerides and diabetes. Therefore, reducing triglyceride levels may hold promise for improving insulin sensitivity in diabetic patients.
Keywords:
insulin resistance
; lipoprotein
; diabetes
; mediation analysis
1. Introduction
The prevalence of diabetes is on the rise, currently affecting 11.6% of the US population [1]. Diabetes stands as a significant contributor to blindness, kidney failure, heart attacks, stroke, and lower limb amputation [2], ranking as the eighth leading cause of death in the US, with approximately 103,000 deaths per year attributed to it [1]. The economic burden of diabetes care weighs heavily on society, with direct medical costs estimated at $306.6 billion per year in the US alone [1]. Thus, understanding the pathogenesis of the disease and developing new preventative and therapeutic strategies are imperative.
A plethora of studies suggests that higher triglyceride levels may promote the development and progression of diabetes. Elevated triglycerides correlate with increased diabetes prevalence [3,4,5], incidence [6,7], and mortality [8]. Notably, a genetic study revealed that alleles associated with higher triglycerides heightened the risk of diabetes [9]. Moreover, fenofibrate, a triglyceride-lowering medication, demonstrated glucose-lowering effects in diabetic mice [10], hinting at a potential causal link between higher triglycerides and diabetes.
However, the precise mechanism bridging triglycerides and diabetes remains elusive. Low-density lipoprotein (LDL) cholesterol [11], insulin resistance [12,13], and inflammation [14,15] emerge as potential players in elucidating this association.
The association between high triglycerides and elevated LDL cholesterol in elderly individuals hints at a possible involvement of LDL cholesterol [16]. Mechanistically, the triglyceride-rich particle very low-density lipoprotein (VLDL) can form LDL through delipidation [17]. Epidemiological evidence suggests a link between high triglycerides and insulin resistance, as evidenced by positive associations with the homeostatic model assessment (HOMA) for insulin resistance in diverse populations worldwide, including the US [8], South Korea [18], and China [19,20]. Likewise, inflammation might contribute to the triglyceride-diabetes nexus. High triglycerides can increase inflammation [11,21] and pose a risk for pancreatitis [22]. Furthermore, triglycerides correlate positively with C-reactive protein [23,24], a well-established inflammatory marker [25].
Nevertheless, questions linger: Do LDL cholesterol, insulin resistance, and inflammation indeed mediate the association between triglycerides and diabetes? If so, to what extent do they mediate this link? The current study aimed to address these questions by examining a large group of US adults who participated in the National Health and Nutrition Examination Survey (NHANES) from 1988 to 2014.
2. Materials and Methods
2.1. Study participants
This study included participants from NHANES III (1988-1994) and the subsequent eight cycles of NHANES from 1999 to 2014. The inclusion criteria included age of ≥ 20 years and the presence of the following data: fasting triglycerides, LDL cholesterol, HOMA for insulin resistance, and C-reactive protein. This resulted in a group of 19,111 participants. The following participants were excluded: those without blood hemoglobin A1c (HbA1c, n = 43), body mass index (n = 226), or systolic blood pressure (n = 407). Therefore, the remaining 18,435 participants were included in the final analysis.
2.2. Exposure variable
The exposure variable of this study was fasting serum triglycerides. The blood was collected from participants with a fasting time between 8.0 and 23.9 hours [8]. The concentrations of triglycerides in the serum were measured enzymatically by using a series of coupled reactions in which triglycerides were hydrolyzed to produce glycerol [26]. Glycerol was then phosphorylated and oxidized to produce H2O2. The resulting H2O2 was then converted by peroxidase to form a color product that was measured spectrophotometrically at the wavelength of 500 nm.
2.3. Outcome variable
The outcome variable of this study was diabetes, defined by a range of criteria, including: a fasting plasma glucose level of 126 mg/dL or higher, an HbA1c level in whole blood of 6.5% or higher, a 2-hour oral glucose tolerance test result of 200 mg/dL or higher, the use of hypoglycemic medications, or self-reported diagnosis of diabetes [27].
2.4. Candidate mediators
2.4.1. LDL cholesterol
2.4.2. HOMA for insulin resistance
HOMA for insulin resistance was calculated using the following formula [30]: (serum insulin in µU/mL X plasma glucose in mmol/L)/22.5. Fasting plasma glucose and serum insulin were directly retrieved from the NHANES website, and they were measured using the following methods:
The levels of glucose in the plasma were measured using the hexokinase-mediated reaction method as described previously [31]. Briefly, hexokinase converted glucose to glucose-6-phosphate. In the presence of nicotinamide adenine dinucleotide (NAD), glucose-6-phosphate dehydrogenase oxidized glucose-6-phosphate to 6-phosphogluconate, in which process, NAD was converted to reduced nicotinamide adenine dinucleotide (NADH). The NADH levels increased proportional to the glucose concentration and were measured spectrophotometrically at 340 nm [32].
Insulin levels in the serum were measured by an immunoenzymometric assay [33]. Briefly, insulin was captured by binding with a non-labeled monoclonal antibody immobilized on a magnetic solid phase, and the captured insulin then bound with another enzyme-labeled monoclonal antibody. The magnetic beads containing insulin and bound enzyme-labeled monoclonal antibodies were incubated with 4-methylumbelliferyl phosphate, a fluorogenic substrate. The fluorescence intensity produced at a certain reaction time was proportional to the insulin concentration in the serum.
2.4.3. C-reactive protein
C-reactive protein in the serum was measured by latex-enhanced nephelometry [34]. Briefly, a dilute solution of the serum sample was mixed with latex particles coated with mouse monoclonal anti-C-reactive protein antibodies. C-reactive protein present in the test sample formed an antigen-antibody complex with the latex particles. Light scattering, measured by a nephelometric procedure after 6 min, was proportional to the concentration of C-reactive protein present in the serum.
2.5. Confoundig covariables
The details of confounding covariables were described in previous publications [5,35]. The list included age, sex, ethnicity, body mass index, education, poverty-income ratio, survey periods, physical activity, alcohol consumption, smoking, systolic blood pressure, total cholesterol, HDL cholesterol, and family history of diabetes. Among these variables, age, body mass index, systolic blood pressure, total cholesterol, and HDL cholesterol were continuous variables.
2.6. Statistical Analyses
Data were presented as number and percentage for categorical variables, median and interquartile range for not normally distributed continuous variables, or mean and standard deviation for normally distributed continuous variables to describe the participants’ characteristics [36]. Differences among categorical variables were analyzed using Pearson's chi-square test [37]. Differences in continuous variables were analyzed using one-way ANOVA and Kruskal Wallis one-way ANOVA for normally distributed and not normally distributed variables, respectively [38].
The association between triglycerides and diabetes was analyzed using binary logistic regression [39], with or without adjustment for confounding factors. The mediation analysis was conducted using PROCESS Version 4.3 Macro for SPSS [40], a regression path analysis modeling tool that was accessible via the processmacro website [41]. At the first stage, a simple mediation analysis was conducted (Figure 1A), in which the three candidate mediators (LDL cholesterol, HOMA for insulin resistance, and C-reactive protein) were put into the model separately to investigate the individual mediation effects on the association between triglycerides and diabetes. Secondly, the parallel mediation analysis was employed (Figure 1B), in which all three candidate mediators were simultaneously put into the model.
The association coefficients a (between the triglycerides and the tested mediator) and b (between the tested mediator and diabetes) were generated by mediation analysis (Figure 1). The direct effect (c’) was the association coefficient between triglycerides and diabetes in the presence of the tested mediator(s). The indirect effect, or mediation effect was calculated by multiplying a and b (a x b). The 95% confidence interval (CI) was generated using the Bootstrapping method [42] with 5000 samples to assess the significance of the mediating effects [43]. The mediation effect (a x b) was regarded as significant (p <0.05) if the 95% CI did not encompass zero [44]. The proportion mediated (PM) was calculated using the formula a x b/(a x b + c’) and it provided an estimate of the extent to which the association between triglycerides and diabetes was accounted for by the pathway through the tested mediator [45].
Triglycerides, HOMA for insulin resistance, C-reactive protein, body mass index, systolic blood pressure, total cholesterol, and HDL cholesterol were natural log-transformed to improve the data distribution before being put into the regression analysis and mediation analysis models [46]. The null hypothesis was rejected for two-sided values of p < 0.05. All analyses were performed using SPSS version 27.0 (IBM SPSS Statistics for Windows, Armonk, NY, IBM Corporation).
3. Results
3.1. General characteristics
This study included 18,435 US adult participants including 2550 individuals with diabetes. The participants had a mean (standard deviation) age of 49 (19) years. Individuals with higher fasting triglycerides had a higher prevalence of diabetes. Higher triglycerides were accompanied by higher levels of LDL cholesterol, HOMA for insulin resistance, C-reactive protein, body mass index, systolic blood pressure, and total cholesterol, as well as lower levels of HDL cholesterol. Those with higher triglycerides were older and had less education and income (Table 1).
3.2. Association of triglycerides with diabetes diagnosis
A 1-natural-log-unit increase in triglycerides was associated with a 2.54-fold higher risk of diabetes (odds ratio, OR, 2.54; 95% CI, 2.23-2.89; p <0.001; Model 5, Table 2) after adjustment for risk factors except for the tested mediators (i.e., LDL cholesterol, HOMA for insulin resistance, and C-reactive protein). After further adjustment for these three tested mediators, a 1-natural-log-unit increase in triglycerides remained associated with a higher risk of diabetes (OR, 1.88; 95% CI, 1.48-2.37; p <0.001; Model 9, Table 2). This suggested that if LDL cholesterol, HOMA for insulin resistance, or C-reactive protein mediated the association between triglycerides and diabetes in subsequent analyses, the mediation would be partial rather than complete [47].
3.3. Mediation analyses of the association of triglycerides with diabetes
The mediation coefficients of LDL cholesterol, HOMA for insulin resistance, and C-reactive protein for the association between triglycerides and diabetes are listed in Table 1. When LDL cholesterol, HOMA for insulin resistance and C-reactive protein were added as single mediator in the mediation analysis (simple mediation), all of the three tested mediators were found to play a role in mediating the association between triglycerides and diabetes (Figure 2). HOMA for insulin resistance was the dominant mediator (indirect effect coefficient, 0.84; 95% CI, 0.79—0.90; p <0.05) which accounted for 76% of the association. However, LDL cholesterol negatively mediated the association by 10% (Figure 2).
When LDL cholesterol, HOMA for insulin resistance and C-reactive protein were added simultaneously as mediators in the same model (parallel mediation analysis), in the absence of adjustment for confounding factors, only HOMA for insulin resistance and LDL cholesterol mediated the association between triglycerides and diabetes (Figure 3). HOMA for insulin resistance remained to be the dominant mediator which accounted for 76% of the association, whereas LDL cholesterol negatively mediated the association by 8% (Figure 3). After further adjustment for all the tested confounding factors, only HOMA for insulin resistance mediated the association between triglycerides and diabetes (indirect effect coefficient, 0.47; 95% CI, 0.43—0.52; p <0.05), accounting for 49% of the association (Table 3 & Figure 4).
4. Discussion
Utilizing a robust sample of US adults (n = 18,435), this study revealed that HOMA for insulin resistance partially mediated the association between fasting triglycerides and diabetes, explaining 49% of the association after adjusting for confounding factors. Notably, HDL cholesterol and C-reactive protein did not exhibit significant mediation effects.
It has been well-known that triglycerides are positively associated with insulin resistance in humans [8,18,19,20], which is affirmed by the current study. Consistently, pharmacological interventions, such as fenofibrate alone or in combination with omega-3 fatty acids, improve insulin sensitivity in individuals with hypertriglyceridemia [48]. However, the precise mechanism linking triglycerides to insulin resistance remains elusive. Proposed mechanisms include impediments to glucose transport [49], hindrance of glucose oxidation [50], and decreased glycogen synthesis [51], collectively resulting in diminished cellular response to insulin.
Insulin resistance mediated 49% of the association between triglycerides and diabetes. Approximately 55% of type 2 diabetes patients exhibit elevated triglyceride levels (> 150 mg/dL) [52]. Thus, reducing triglycerides could hold therapeutic promise in enhancing insulin sensitivity, an avenue yet to be recognized by the American Diabetes Association [53]. Further research is needed to establish the role of lowering triglycerides in glycemic control.
High triglycerides have been implicated in inflammation [11,21], as evidenced by positive associations with C-reactive protein [23,24] and pancreatitis risk [54,55]. In addition, pharmacologically lowering triglycerides decreases circulating levels of inflammatory markers including C-reactive protein and fibrinogen [48]. Yet, C-reactive protein failed to contribute significantly to the association between triglycerides and diabetes in this study, suggesting that inflammation might not play a significant role in high-triglyceride-induced diabetes. Higher triglycerides have been shown to be positively associated with other inflammatory markers including interleukin 6 (IL-6) [56] and fibrinogen [25,48]. Therefore, exploration into the mediating roles of other inflammatory markers like interleukin 6 (IL-6) and fibrinogen remains warranted.
Elevated triglycerides often coexist with high LDL cholesterol in elderly individuals, possibly due to the conversion of VLDL to LDL [17]. Interestingly, after adjustment, LDL cholesterol marginally diminished the association between triglycerides and diabetes by 14%, albeit not reaching statistical significance. The competing effect of LDL cholesterol against triglycerides has been reported previously. For example, a 1-natural-log increase in triglycerides was significantly associated with an increased risk of coronary heart disease mortality (relative risk, 1.86; 95% CI, 1.12-3.08) in male participants with lower LDL cholesterol (<160 mg/dL) [57]; however the associated risk was no longer significant (relative risk, 1.13; 95% CI, 0.64-1.98) in those with higher LDL cholesterol (≥160 mg/dL).
The underlying reasons for LDL cholesterol's slight competition with triglycerides in diabetes risk remain unclear. It's plausible that LDL cholesterol exerts an opposing effect on diabetes compared to triglycerides. Indeed, statin therapy, which lowers LDL cholesterol, has been associated with a 26% increase in the risk of new-onset diabetes [58,59], while fenofibrate, a triglyceride-lowering agent, demonstrated glucose-lowering effects in mice with type 2 diabetes [10].
Strengths of this study include its sizable sample and adjustment for various confounding factors, including body mass index, systolic blood pressure, total cholesterol, and HDL cholesterol. However, its reliance on US participants may limit generalizability to other populations.
5. Conclusions
This study suggests that HOMA for insulin resistance is the primary mediator linking triglycerides and diabetes. Consequently, reducing triglyceride levels could play a pivotal role in enhancing insulin sensitivity among diabetic patients, thereby contributing to glycemic control.
Author Contributions
Conceptualization, Y.W.; formal analysis, Y.W.; data curation, Y.W., Y.F.; writing—original draft preparation, Y.W.; writing—review and editing, Y.W., Y.F., M.V.; visualization, Y.W.; funding acquisition, Y.W. All authors have read and agreed to the published version of the manuscript.
Funding
Y.W. was supported by a grant from the National Health and Medical Research Council of Australia (1062671).
Institutional Review Board Statement
The study was conducted in accordance with the Declaration of Helsinki, and approved by the NHANES Institutional Review Board. Approval Code: NHANES Protocol #98-12, #2005-06, and #2011-17.
Informed Consent Statement
All participants provided written informed consent. The participants’ records were anonymized before being accessed by the author.
Data Availability Statement
All data in the current analysis are publicly available on the NHANES website (https://www.cdc.gov/nchs/nhanes/index.htm).
Acknowledgments
None.
Conflicts of Interest
The author declares no conflicts of interest.
References
- American Diabetes Association. Statistics About Diabetes. Available online: https://diabetes.org/about-diabetes/statistics/about-diabetes (accessed on 28 February 2024).
- World Health Organization. Key facts-Diabetes. 2023. Available online: https://www.who.int/news-room/fact-sheets/detail/diabetes (accessed on 28 February 2024).
- Al-Mawali, A.; Al-Harrasi, A.; Jayapal, S.K.; Morsi, M.; Pinto, A.D.; Al-Shekaili, W.; Al-Kharusi, H.; Al-Balushi, Z.; Idikula, J. Prevalence and risk factors of diabetes in a large community-based study in the Sultanate of Oman: STEPS survey 2017. BMC Endocr. Disord. 2021, 21, 42. [Google Scholar] [CrossRef] [PubMed]
- Urrutia, I.; Martín-Nieto, A.; Martínez, R.; Casanovas-Marsal, J.O.; Aguayo, A.; Del Olmo, J.; Arana, E.; Fernandez-Rubio, E.; Castaño, L.; Gaztambide, S. Incidence of diabetes mellitus and associated risk factors in the adult population of the Basque country, Spain. Sci. Rep. 2021, 11, 3016. [Google Scholar] [CrossRef] [PubMed]
- Wang, Y.; Fang, Y.; Magliano, D.J.; Charchar, F.J.; Sobey, C.G.; Drummond, G.R.; Golledge, J. Fasting triglycerides are positively associated with cardiovascular mortality risk in people with diabetes. Cardiovasc. Res. 2023, 119, 826–834. [Google Scholar] [CrossRef] [PubMed]
- Klimentidis, Y.C.; Chougule, A.; Arora, A.; Frazier-Wood, A.C.; Hsu, C.H. Triglyceride-Increasing Alleles Associated with Protection against Type-2 Diabetes. PLoS Genet. 2015, 11, e1005204. [Google Scholar] [CrossRef] [PubMed]
- Fujihara, K.; Sugawara, A.; Heianza, Y.; Sairenchi, T.; Irie, F.; Iso, H.; Doi, M.; Shimano, H.; Watanabe, H.; Sone, H.; et al. Utility of the triglyceride level for predicting incident diabetes mellitus according to the fasting status and body mass index category: the Ibaraki Prefectural Health Study. J Atheroscler Thromb 2014, 21, 1152–1169. [Google Scholar] [CrossRef] [PubMed]
- Wang, Y. Higher fasting triglyceride predicts higher risks of diabetes mortality in US adults. Lipids Health Dis. 2021, 20, 181. [Google Scholar] [CrossRef] [PubMed]
- Lee, K.H.; Kim, O.Y.; Lim, H.H.; Lee, Y.J.; Jang, Y.; Lee, J.H. Contribution of APOA5-1131C allele to the increased susceptibility of diabetes mellitus in association with higher triglyceride in Korean women. Metabolism 2010, 59, 1583–1590. [Google Scholar] [CrossRef]
- Araki, M.; Nakagawa, Y.; Oishi, A.; Han, S.I.; Kumagai, K.; Ohno, H.; Mizunoe, Y.; Iwasaki, H.; Sekiya, M.; Matsuzaka, T.; et al. The Peroxisome Proliferator-Activated Receptor α (PPARα) Agonist Pemafibrate Protects against Diet-Induced Obesity in Mice. Int. J. Mol. Sci. 2018, 19, 2148. [Google Scholar] [CrossRef]
- Yuan, G.; Al-Shali, K.Z.; Hegele, R.A. Hypertriglyceridemia: its etiology, effects and treatment. CMAJ 2007, 176, 1113–1120. [Google Scholar] [CrossRef]
- Koyama, K.; Chen, G.; Lee, Y.; Unger, R.H. Tissue triglycerides, insulin resistance, and insulin production: implications for hyperinsulinemia of obesity. American Journal of Physiology-Endocrinology and Metabolism 1997, 273, E708–E713. [Google Scholar] [CrossRef]
- Howard, B.V. Insulin resistance and lipid metabolism. Am. J. Cardiol. 1999, 84, 28j–32j. [Google Scholar] [CrossRef] [PubMed]
- Kraaijenhof, J.M.; Stroes, E.S.G. Inflammatory Effects of Triglycerides: Relevant or Redundant? JACC Basic Transl Sci 2023, 8, 476–478. [Google Scholar] [CrossRef]
- Liu, Q.K. Triglyceride-lowering and anti-inflammatory mechanisms of omega-3 polyunsaturated fatty acids for atherosclerotic cardiovascular risk reduction. J. Clin. Lipidol. 2021, 15, 556–568. [Google Scholar] [CrossRef]
- Grundy, S.M. Hypertriglyceridemia, atherogenic dyslipidemia, and the metabolic syndrome. Am. J. Cardiol. 1998, 81, 18b–25b. [Google Scholar] [CrossRef]
- Packard, C.J.; Boren, J.; Taskinen, M.R. Causes and Consequences of Hypertriglyceridemia. Front. Endocrinol. (Lausanne) 2020, 11, 252. [Google Scholar] [CrossRef]
- Park, S.Y.; Cho, Y.J.; Lee, S.R.; Chung, H.; Jeong, K. Triglyceride is a useful surrogate marker for insulin resistance in Korean women with polycystic ovary syndrome. Yonsei Med. J. 2015, 56, 785–792. [Google Scholar] [CrossRef] [PubMed]
- Liu, Y.; Du, M.; Gan, Y.; Bao, S.; Feng, L.; Zhang, J. Triglyceride Induced Metabolic Inflammation: Potential Connection of Insulin Resistance and Recurrent Pregnancy Loss. Front. Endocrinol. (Lausanne) 2021, 12, 621845. [Google Scholar] [CrossRef] [PubMed]
- Ma, M.; Liu, H.; Yu, J.; He, S.; Li, P.; Ma, C.; Zhang, H.; Xu, L.; Ping, F.; Li, W.; et al. Triglyceride is independently correlated with insulin resistance and islet beta cell function: a study in population with different glucose and lipid metabolism states. Lipids Health Dis. 2020, 19, 121. [Google Scholar] [CrossRef]
- Nordestgaard, B.G.; Varbo, A. Triglycerides and cardiovascular disease. The Lancet 2014, 384, 626–635. [Google Scholar] [CrossRef]
- Zhang, Q.; Xu, Q.; Zhu, Q.; Zhu, L.; Pan, C.; Chen, J.; Liu, J.; Deng, D.; Chen, W.; Chen, C. Association between serum triglyceride level and severity of acute biliary pancreatitis. Pancreatology 2024. [Google Scholar] [CrossRef]
- Ahmad, I.; Zhan, M.; Miller, M. High prevalence of C-reactive protein elevation with normal triglycerides (100-149 mg/dL): are triglyceride levels below 100 mg/dL more optimal in coronary heart disease risk assessment? Am. J. Med. Sci. 2005, 329, 173–177. [Google Scholar] [CrossRef] [PubMed]
- Katsuki, A.; Sumida, Y.; Urakawa, H.; Gabazza, E.C.; Murashima, S.; Nakatani, K.; Yano, Y.; Adachi, Y. Increased oxidative stress is associated with serum levels of triglyceride, insulin resistance, and hyperinsulinemia in Japanese metabolically obese, normal-weight men. Diabetes Care 2004, 27, 631–632. [Google Scholar] [CrossRef] [PubMed]
- Amezcua-Castillo, E.; González-Pacheco, H.; Sáenz-San Martín, A.; Méndez-Ocampo, P.; Gutierrez-Moctezuma, I.; Massó, F.; Sierra-Lara, D.; Springall, R.; Rodríguez, E.; Arias-Mendoza, A.; et al. C-Reactive Protein: The Quintessential Marker of Systemic Inflammation in Coronary Artery Disease-Advancing toward Precision Medicine. Biomedicines 2023, 11, 2444. [Google Scholar] [CrossRef]
- Lipid Laboratory Johns Hopkins. Triglycerides. Laboratory Procedure Manual. NHANES 2005-2006. Available online: https://wwwn.cdc.gov/nchs/data/nhanes/2005-2006/labmethods/trigly_d_met_triglyceride_h717.pdf.
- American Diabetes Association. Classification and Diagnosis of Diabetes: Standards of Medical Care in Diabetes-2019. Diabetes Care 2019, 42, S13–s28. [Google Scholar] [CrossRef] [PubMed]
- NHANES. Cholesterol - LDL & Triglycerides. Available online: https://wwwn.cdc.gov/Nchs/Nhanes/2009-2010/TRIGLY_F.htm (accessed on 1 March 2023).
- Friedewald, W.T.; Levy, R.I.; Fredrickson, D.S. Estimation of the concentration of low-density lipoprotein cholesterol in plasma, without use of the preparative ultracentrifuge. Clin. Chem. 1972, 18, 499–502. [Google Scholar] [CrossRef] [PubMed]
- Matthews, D.R.; Hosker, J.P.; Rudenski, A.S.; Naylor, B.A.; Treacher, D.F.; Turner, R.C. Homeostasis model assessment: insulin resistance and beta-cell function from fasting plasma glucose and insulin concentrations in man. Diabetologia 1985, 28, 412–419. [Google Scholar] [CrossRef]
- Wang, Y.; Fang, Y. Postabsorptive homeostasis model assessment for insulin resistance is a reliable biomarker for cardiovascular disease mortality and all-cause mortality. Diabetes Epidemiology and Management 2021, 6, 100045. [Google Scholar] [CrossRef]
- Gunter, E.W.; Lewis, B.G.; Koncikowski, S.M. Laboratory Procedures Used for the Third National Health and Nutrition Examination Survey (NHANES III), 1988-1994. Available online: https://wwwn.cdc.gov/nchs/data/nhanes3/manuals/labman.pdf.
- NHANES. Immunoenzymometric Assay TOSOH AIA-900 Chemistry Analyzer. Laboratory Procedure Manual 2014. Available online: https://wwwn.cdc.gov/nchs/data/nhanes/2013-2014/labmethods/INS_H_MET_INSULIN.pdf.
- University of Washington Medical Center. C-Reactive Protein, Laboratory Procedure Manual. Available online: https://wwwn.cdc.gov/nchs/data/nhanes/2009-2010/labmethods/CRP_F_met.pdf (accessed on 1 February 2023).
- Wang, Y.; Fang, Y.; Witting, P.K.; Charchar, F.J.; Sobey, C.G.; Drummond, G.R.; Golledge, J. Dietary fatty acids and mortality risk from heart disease in US adults: an analysis based on NHANES. Sci. Rep. 2023, 13, 1614. [Google Scholar] [CrossRef]
- Jungo, K.T.; Meier, R.; Valeri, F.; Schwab, N.; Schneider, C.; Reeve, E.; Spruit, M.; Schwenkglenks, M.; Rodondi, N.; Streit, S. Baseline characteristics and comparability of older multimorbid patients with polypharmacy and general practitioners participating in a randomized controlled primary care trial. BMC Fam. Pract. 2021, 22, 123. [Google Scholar] [CrossRef]
- Wang, Y. Stage 1 hypertension and risk of cardiovascular disease mortality in United States adults with or without diabetes. J. Hypertens. 2022, 40, 794–803. [Google Scholar] [CrossRef]
- Qian, T.; Sun, H.; Xu, Q.; Hou, X.; Hu, W.; Zhang, G.; Drummond, G.R.; Sobey, C.G.; Charchar, F.J.; Golledge, J.; et al. Hyperuricemia is independently associated with hypertension in men under 60 years in a general Chinese population. J. Hum. Hypertens. 2021, 35, 1020–1028. [Google Scholar] [CrossRef]
- Wang, Y.; Zhang, W.; Qian, T.; Sun, H.; Xu, Q.; Hou, X.; Hu, W.; Zhang, G.; Drummond, G.R.; Sobey, C.G.; et al. Reduced renal function may explain the higher prevalence of hyperuricemia in older people. Sci. Rep. 2021, 11, 1302. [Google Scholar] [CrossRef] [PubMed]
- Preacher, K.J.; Hayes, A.F. Asymptotic and resampling strategies for assessing and comparing indirect effects in multiple mediator models. Behav. Res. Methods 2008, 40, 879–891. [Google Scholar] [CrossRef]
- Hayes, A.F. The PROCESS macro for SPSS, SAS, and R. Available online: https://processmacro.org/index.html (accessed on 21 February 2024).
- DiCiccio, T.J.; Efron, B. Bootstrap confidence intervals. Statistical Science 1996, 11, 189–228. [Google Scholar] [CrossRef]
- Li, L.; Zhong, H.Y.; Xiao, T.; Xiao, R.H.; Yang, J.; Li, Y.L.; Yao, Q.; Chen, X.J. Association between self-disclosure and benefit finding of Chinese cancer patients caregivers: the mediation effect of coping styles. Support. Care Cancer 2023, 31, 684. [Google Scholar] [CrossRef] [PubMed]
- Soares, M.J.; Calton, E.K.; Pathak, K.; Zhao, Y. Hypothesized pathways for the association of vitamin D status and insulin sensitivity with resting energy expenditure: a cross sectional mediation analysis in Australian adults of European ancestry. Eur. J. Clin. Nutr. 2022, 76, 1457–1463. [Google Scholar] [CrossRef]
- Ananth, C. Proportion mediated in a causal mediation analysis: how useful is this measure? BJOG 2019, 126, 983. [Google Scholar] [CrossRef]
- Wang, Y. Definition, prevalence, and risk factors of low sex hormone-binding globulin in US adults. J Clin Endocrinol Metab 2021, 106, e3946–e3956. [Google Scholar] [CrossRef]
- Gunzler, D.; Chen, T.; Wu, P.; Zhang, H. Introduction to mediation analysis with structural equation modeling. Shanghai Arch Psychiatry 2013, 25, 390–394. [Google Scholar] [CrossRef]
- Koh, K.K.; Oh, P.C.; Sakuma, I.; Lee, Y.; Han, S.H.; Shin, E.K. Vascular and metabolic effects of omega-3 fatty acids combined with fenofibrate in patients with hypertriglyceridemia. Int. J. Cardiol. 2016, 221, 342–346. [Google Scholar] [CrossRef]
- Shulman, G.I. Cellular mechanisms of insulin resistance. J. Clin. Invest. 2000, 106, 171–176. [Google Scholar] [CrossRef] [PubMed]
- Jensen, C.B.; Storgaard, H.; Holst, J.J.; Dela, F.; Madsbad, S.; Vaag, A.A. Insulin secretion and cellular glucose metabolism after prolonged low-grade intralipid infusion in young men. J Clin Endocrinol Metab 2003, 88, 2775–2783. [Google Scholar] [CrossRef] [PubMed]
- Phielix, E.; Begovatz, P.; Gancheva, S.; Bierwagen, A.; Kornips, E.; Schaart, G.; Hesselink, M.K.C.; Schrauwen, P.; Roden, M. Athletes feature greater rates of muscle glucose transport and glycogen synthesis during lipid infusion. JCI insight 2019, 4, e127928. [Google Scholar] [CrossRef]
- Bruckert, E.; Baccara-Dinet, M.; Eschwege, E. Low HDL-cholesterol is common in European Type 2 diabetic patients receiving treatment for dyslipidaemia: data from a pan-European survey. Diabet. Med. 2007, 24, 388–391. [Google Scholar] [CrossRef] [PubMed]
- ElSayed, N.A.; Aleppo, G.; Aroda, V.R.; Bannuru, R.R.; Brown, F.M.; Bruemmer, D.; Collins, B.S.; Hilliard, M.E.; Isaacs, D.; Johnson, E.L.; et al. 9. Pharmacologic Approaches to Glycemic Treatment: Standards of Care in Diabetes—2023. Diabetes Care 2022, 46, S140–S157. [Google Scholar] [CrossRef] [PubMed]
- Garg, R.; Rustagi, T. Management of Hypertriglyceridemia Induced Acute Pancreatitis. Biomed Res Int 2018, 2018, 4721357. [Google Scholar] [CrossRef]
- Yang, A.L.; McNabb-Baltar, J. Hypertriglyceridemia and acute pancreatitis. Pancreatology 2020, 20, 795–800. [Google Scholar] [CrossRef]
- Piché, M.E.; Lemieux, S.; Weisnagel, S.J.; Corneau, L.; Nadeau, A.; Bergeron, J. Relation of high-sensitivity C-reactive protein, interleukin-6, tumor necrosis factor-alpha, and fibrinogen to abdominal adipose tissue, blood pressure, and cholesterol and triglyceride levels in healthy postmenopausal women. Am. J. Cardiol. 2005, 96, 92–97. [Google Scholar] [CrossRef]
- Criqui, M.H.; Heiss, G.; Cohn, R.; Cowan, L.D.; Suchindran, C.M.; Bangdiwala, S.; Kritchevsky, S.; Jacobs, D.R.; O'Grady, H.K.; Davis, C.E. Plasma Triglyceride Level and Mortality from Coronary Heart Disease. New England Journal of Medicine 1993, 328, 1220–1225. [Google Scholar] [CrossRef]
- Sattar, N.; Preiss, D.; Murray, H.M.; Welsh, P.; Buckley, B.M.; de Craen, A.J.; Seshasai, S.R.; McMurray, J.J.; Freeman, D.J.; Jukema, J.W.; et al. Statins and risk of incident diabetes: a collaborative meta-analysis of randomised statin trials. Lancet 2010, 375, 735–742. [Google Scholar] [CrossRef]
- Ridker, P.M.; Danielson, E.; Fonseca, F.A.H.; Genest, J.; Gotto, A.M.; Kastelein, J.J.P.; Koenig, W.; Libby, P.; Lorenzatti, A.J.; MacFadyen, J.G.; et al. Rosuvastatin to Prevent Vascular Events in Men and Women with Elevated C-Reactive Protein. New England Journal of Medicine 2008, 359, 2195–2207. [Google Scholar] [CrossRef] [PubMed]
Figure 1.
Mediation analysis models. A, Simple mediation. LDL cholesterol, HOMA for insulin resistance or C-reactive protein was added as single mediator for the association of triglycerides with diabetes. B, Parallel mediation. In this analysis, LDL cholesterol, HOMA for insulin resistance, and C-reactive protein were added simultaneously to assess their mediation effects on the association of triglycerides with diabetes. a, association coefficient between triglycerides and the tested mediator; b, association coefficient between the tested mediator and diabetes; c’, also known as direct effect, referring to the association coefficient between triglycerides and diabetes in the presence of the tested mediator (simple mediation) or all tested mediators (parallel mediation); CRP, C-reactive protein; DM, diabetes; HOMA-IR, homeostasis model assessment for insulin resistance; LDL-C, low-density lipoprotein cholesterol; TG, triglycerides. This figure was partly generated using Servier Medical Art, provided by Servier, licensed under a Creative Commons Attribution 3.0 unported license. .
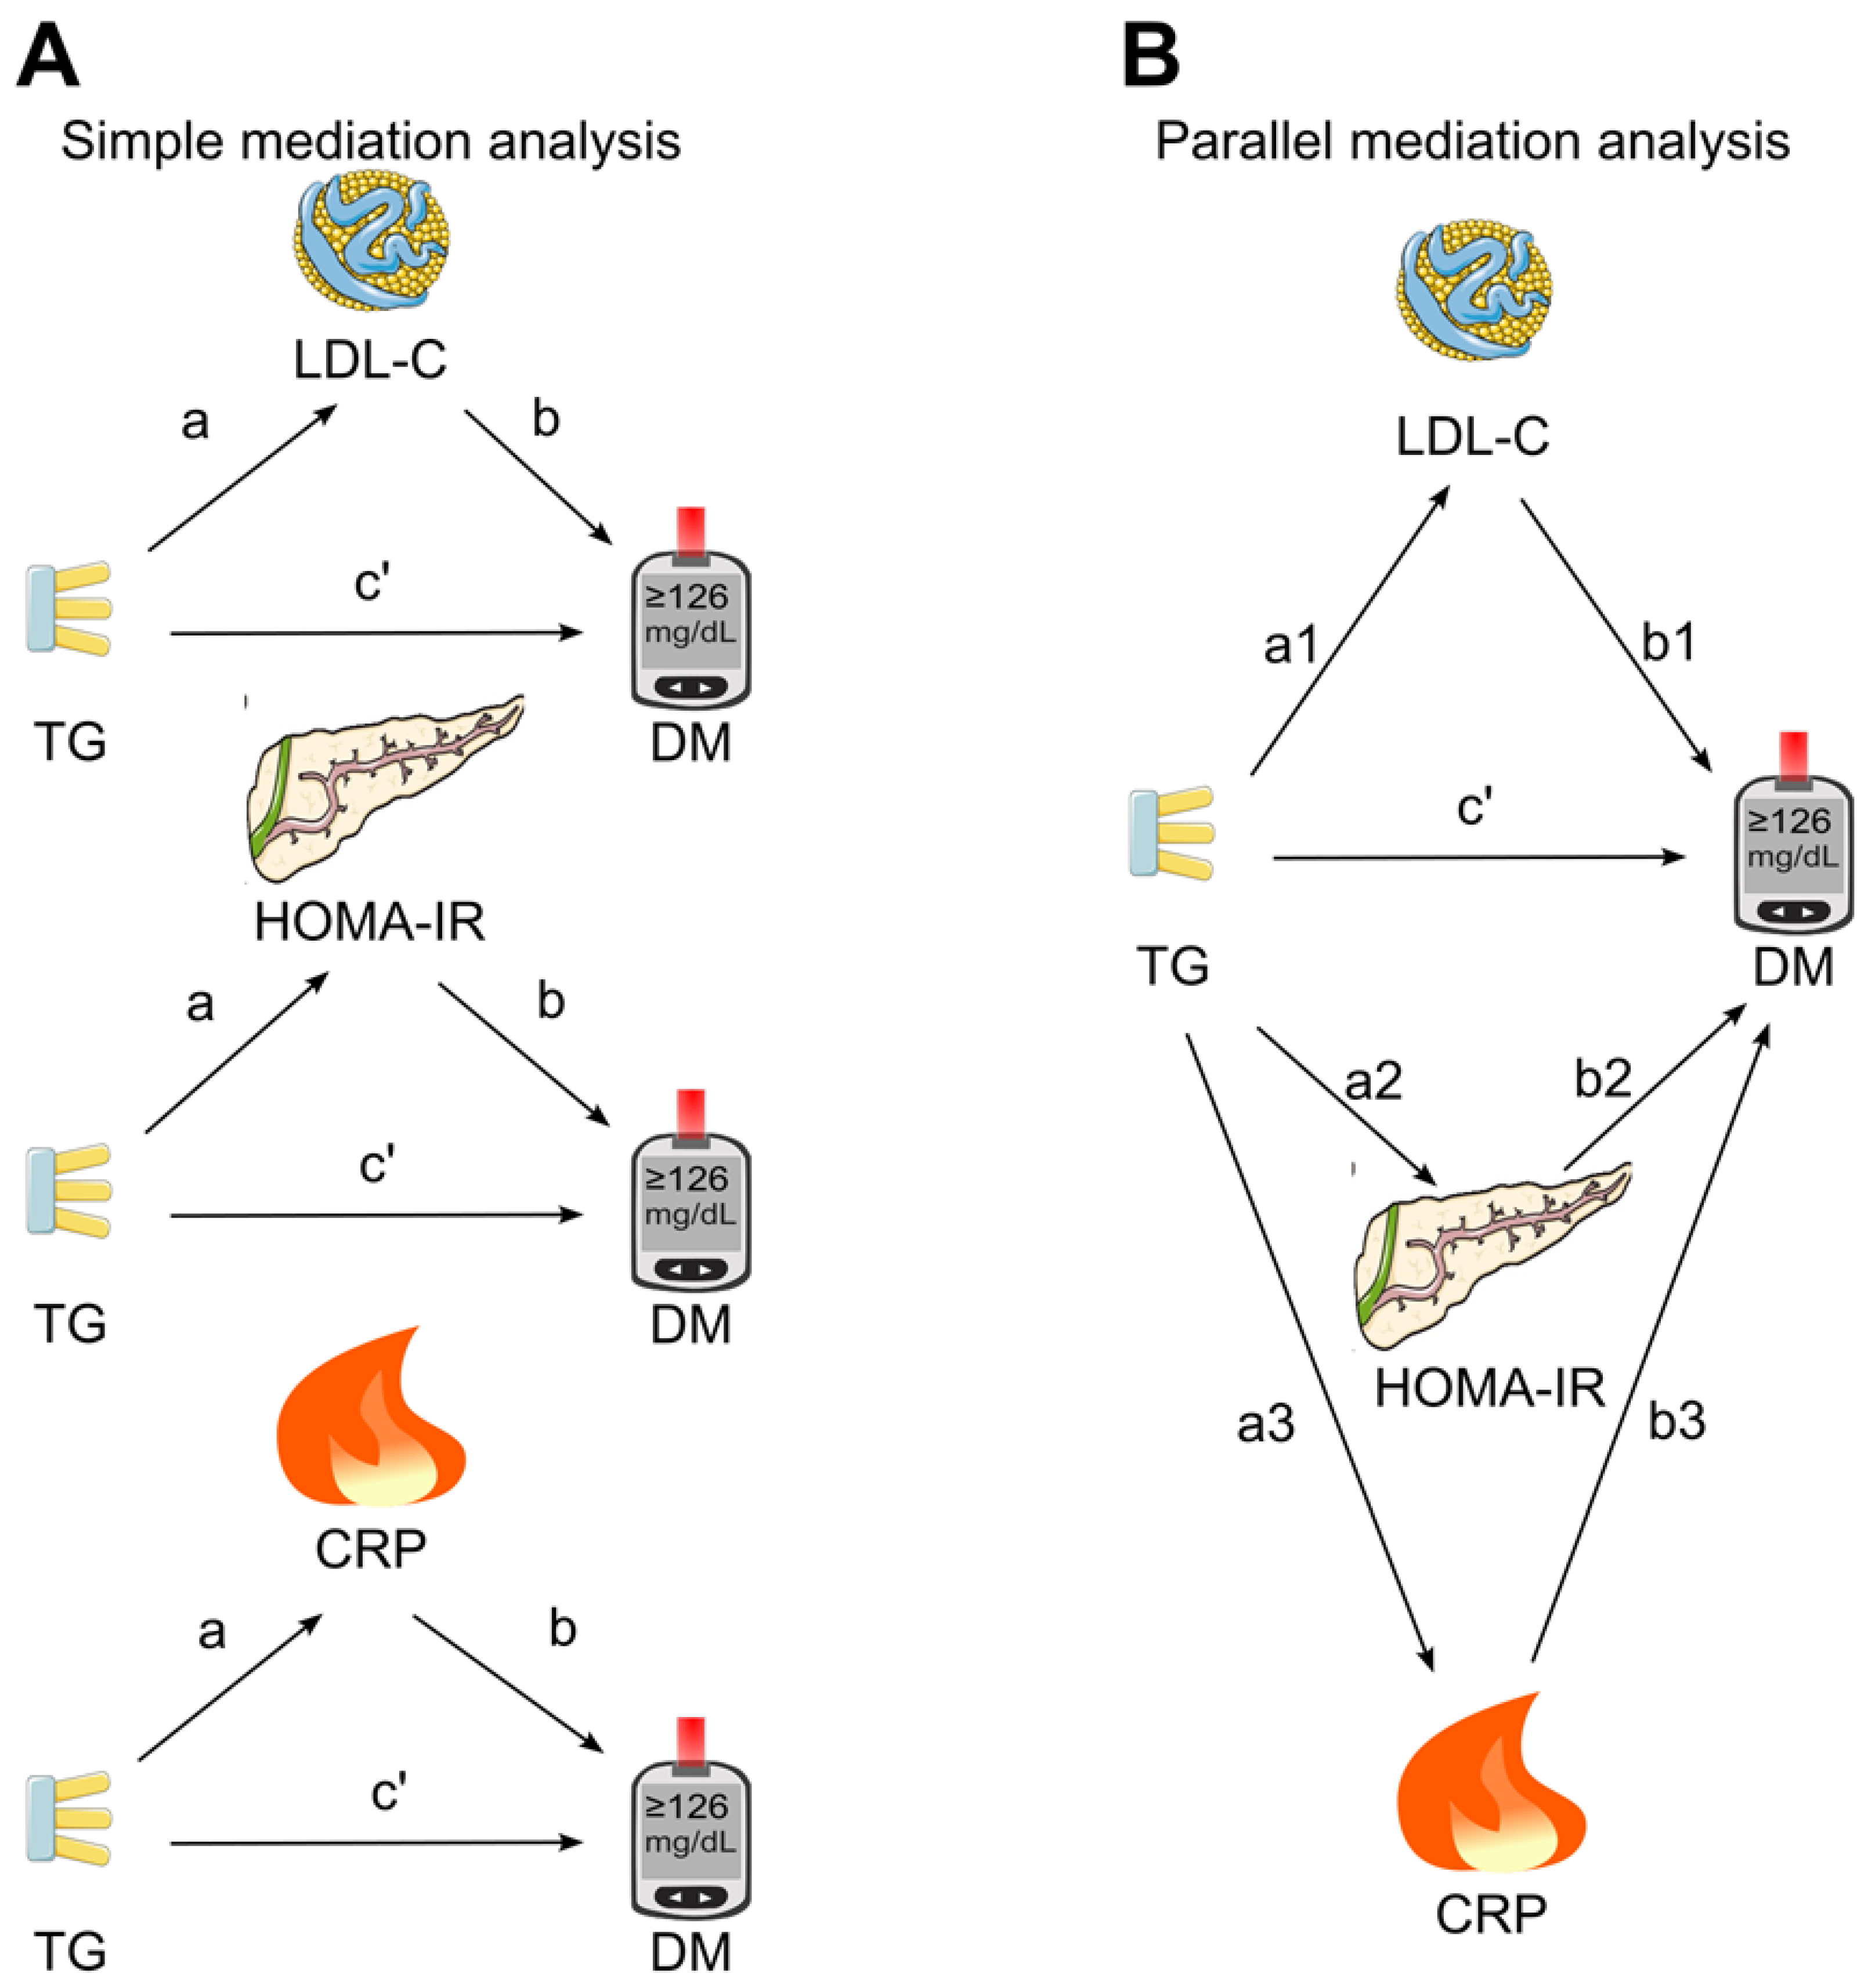
Figure 2.
Simple mediation analysis. LDL cholesterol, HOMA for insulin resistance, or C-reactive protein was added as single mediator for the association of triglycerides with diabetes. a, association coefficient between triglycerides and the tested mediator; b, association coefficient between the tested mediator and diabetes; c’, association coefficient between triglycerides and diabetes in the presence of the tested mediator; CI, confidence interval; CRP, C-reactive protein; DM, diabetes; HOMA-IR, homeostasis model assessment for insulin resistance; LDL-C, low-density lipoprotein cholesterol; TG, triglycerides. Green tick=yes. This figure was partly generated using Servier Medical Art, provided by Servier, licensed under a Creative Commons Attribution 3.0 unported license. .
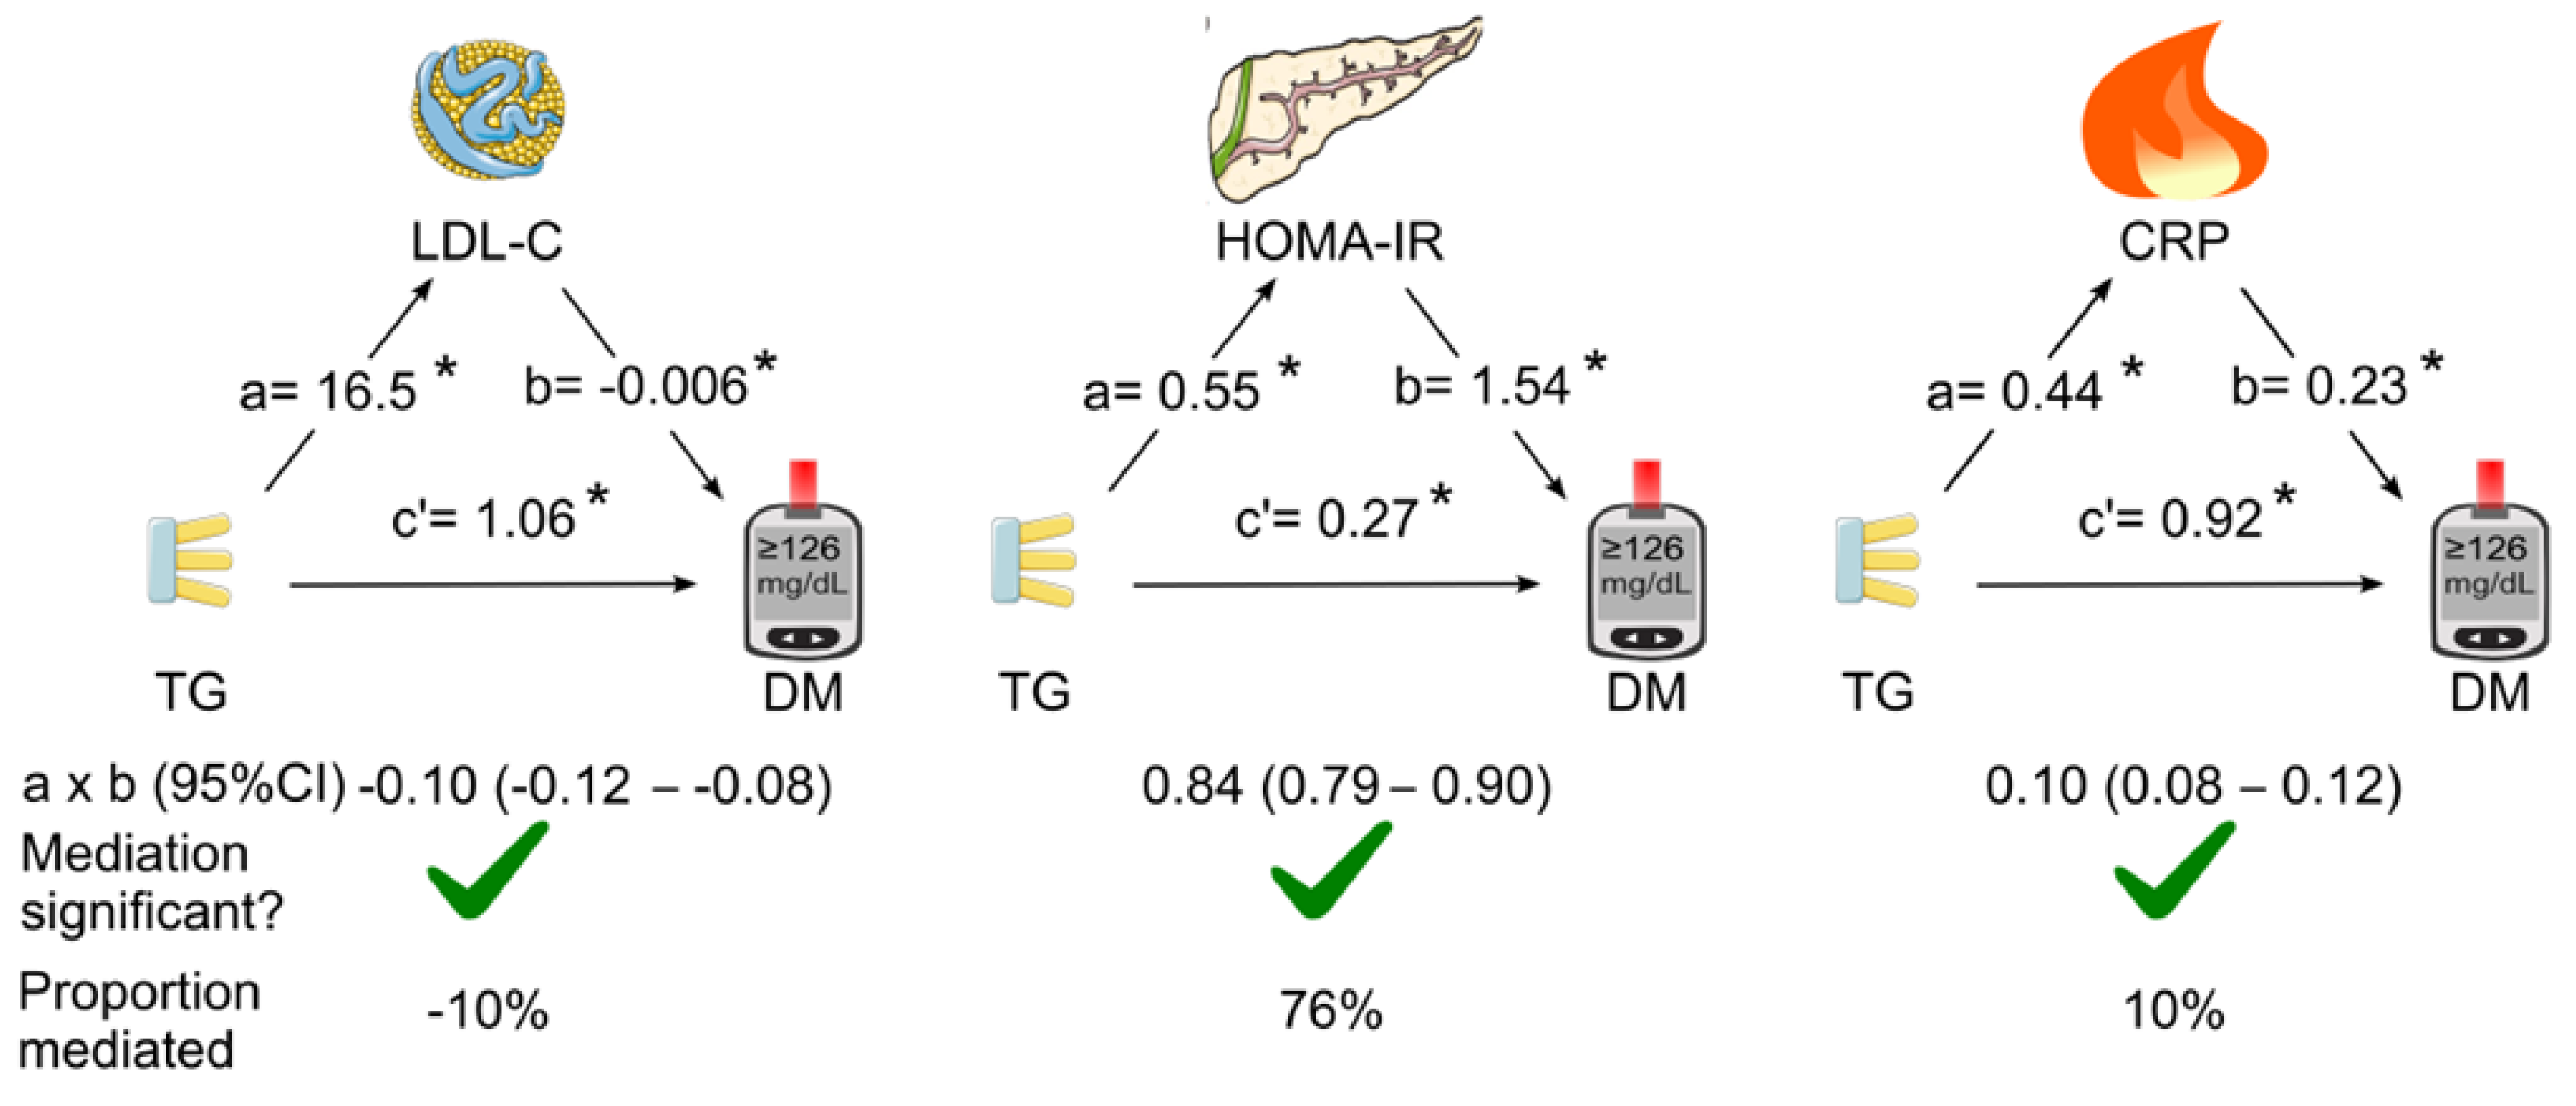
Figure 3.
Unadjusted parallel mediation analysis. LDL cholesterol, HOMA for insulin resistance, and C-reactive protein were added as parallel mediators for the association of triglycerides with diabetes without adjustment for confounding factors. a, association coefficient between triglycerides and the tested mediator; b, association coefficient between the tested mediator and diabetes; c’, association coefficient between triglycerides and diabetes in the presence of all the tested mediators; CI, confidence interval; CRP, C-reactive protein; DM, diabetes; HOMA-IR, homeostasis model assessment for insulin resistance; LDL-C, low-density lipoprotein cholesterol; TG, triglycerides. Green tick = yes. Red cross = no. This figure was partly generated using Servier Medical Art, provided by Servier, licensed under a Creative Commons Attribution 3.0 unported license. .
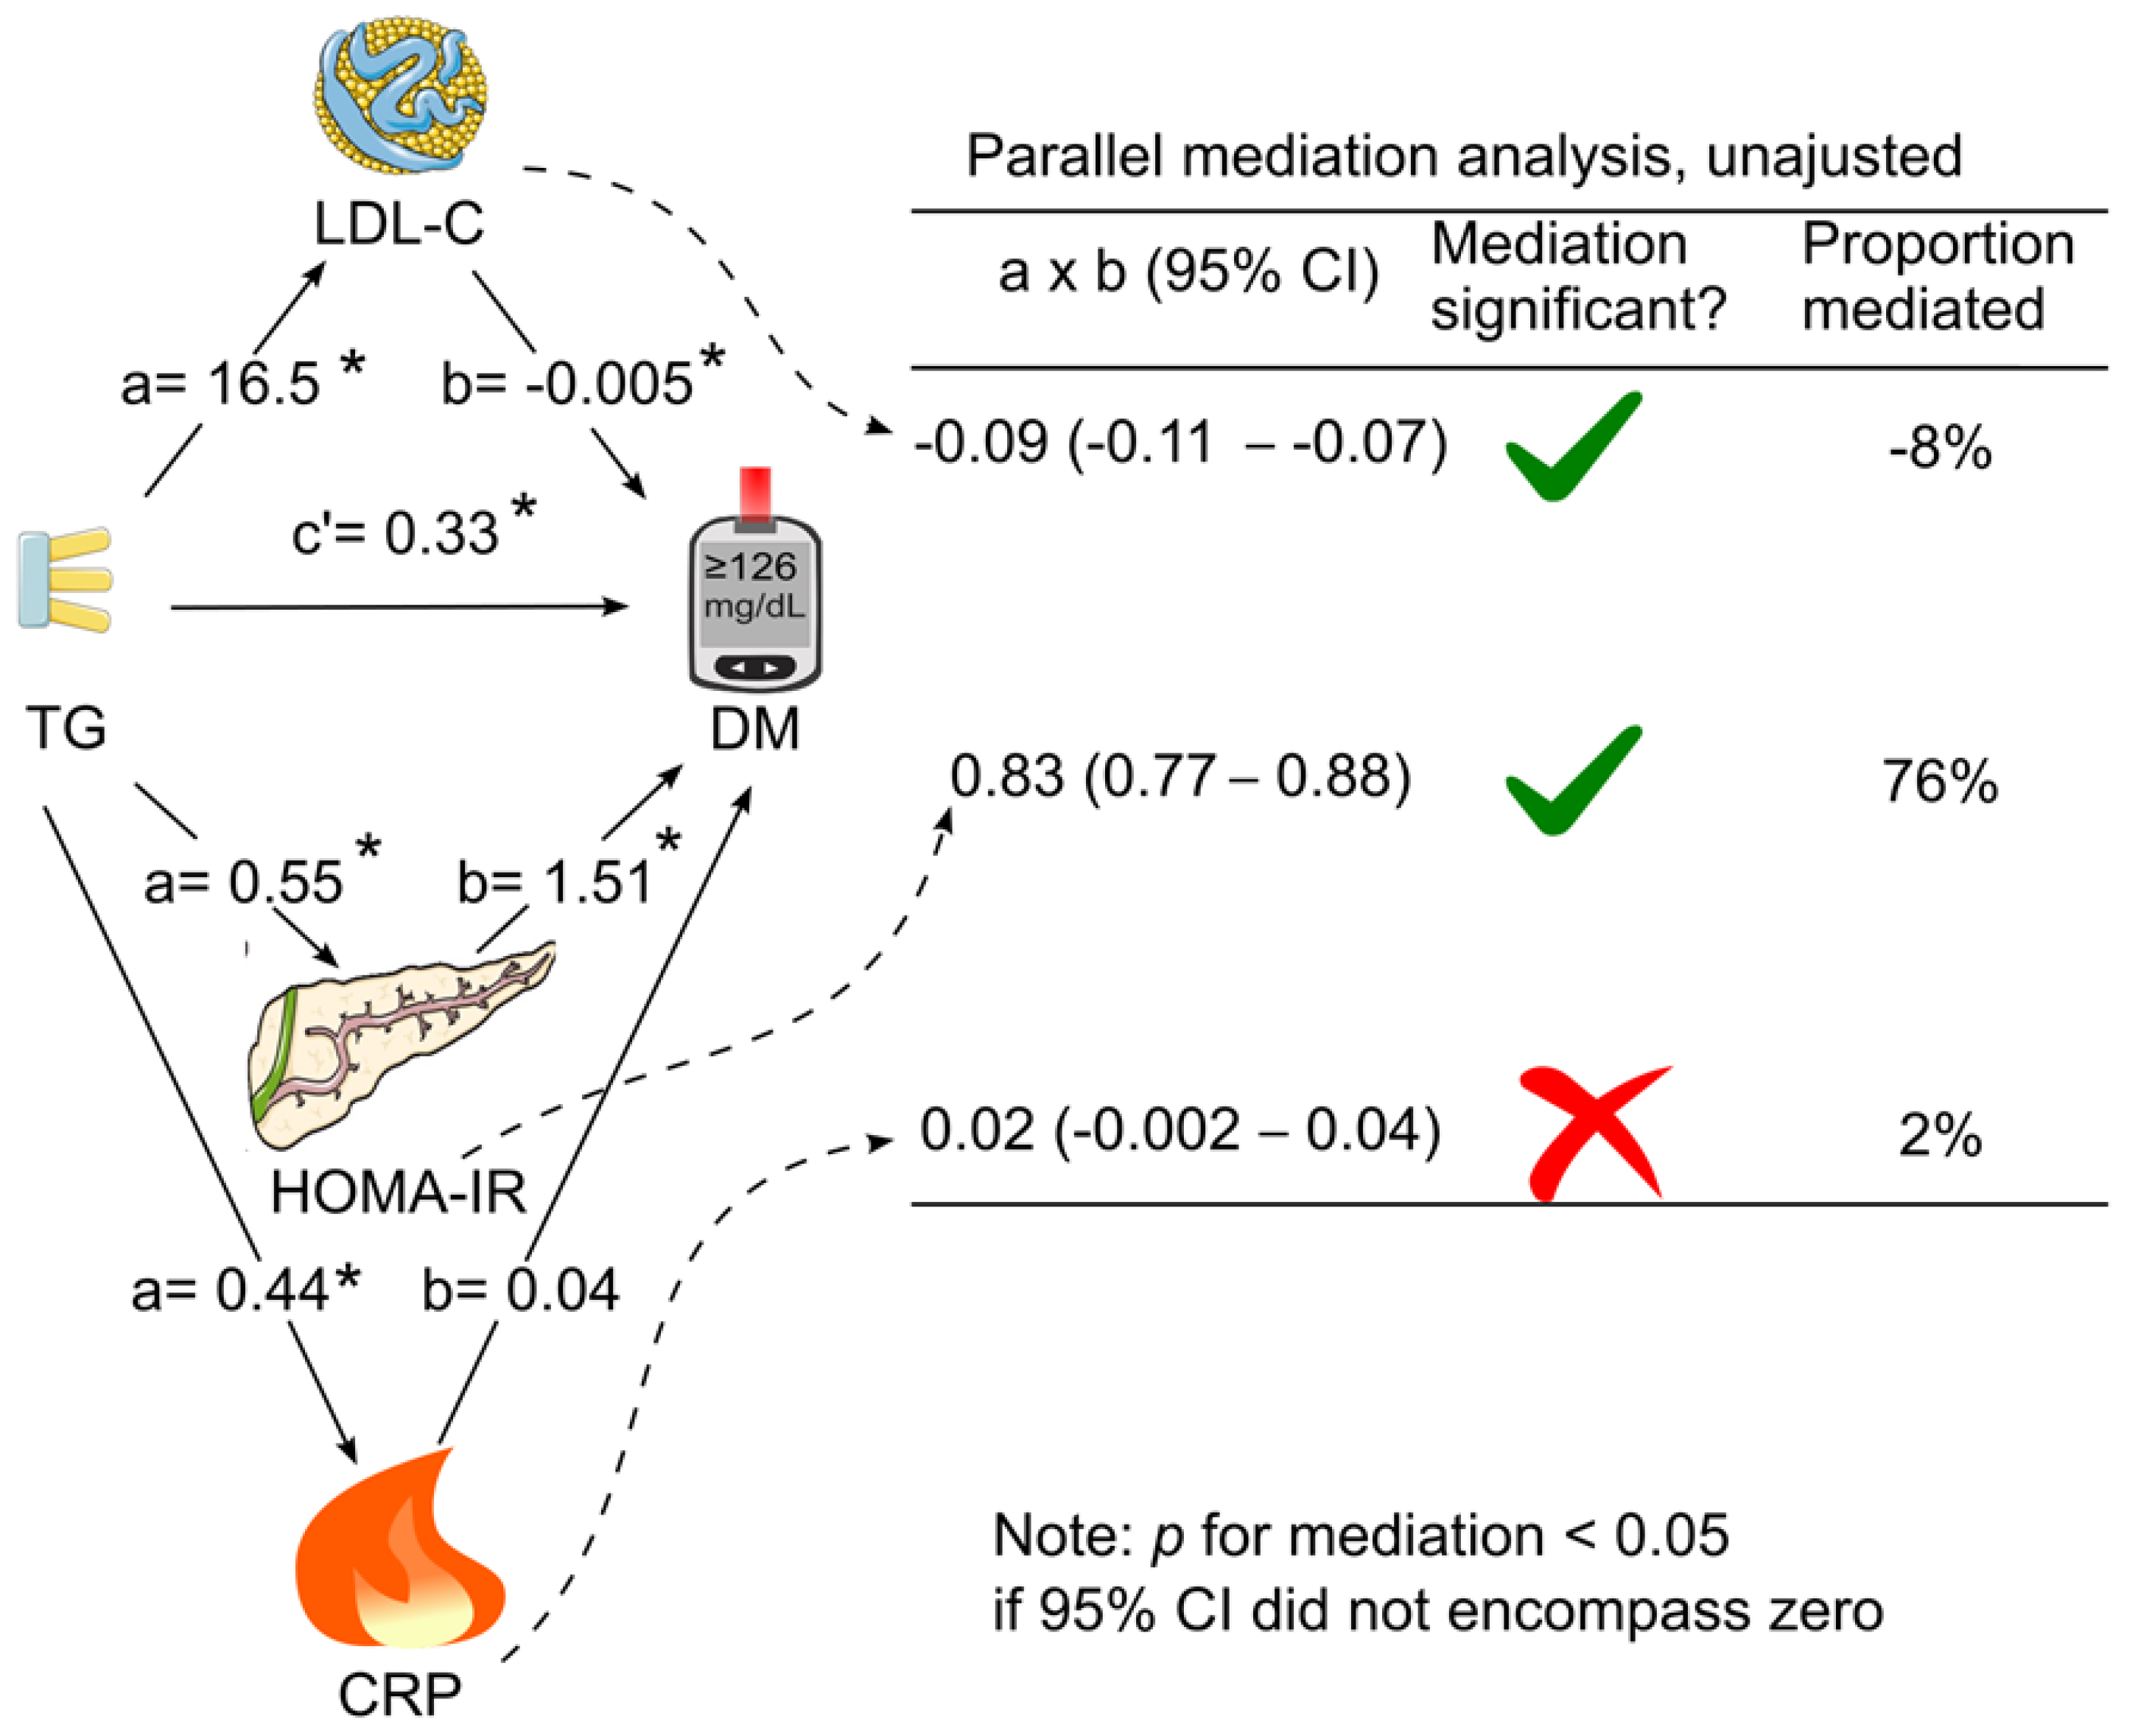
Figure 4.
Parallel mediation analysis with adjustment for confounding factors. LDL cholesterol, HOMA for insulin resistance, and C-reactive protein were added simultaneously as parallel mediators for the association of triglycerides with diabetes with adjustment for confounding factors. The analysis was adjusted for age, sex, ethnicity, body mass index, poverty-income ratio, education, physical activity, alcohol consumption, smoking status, survey period, systolic blood pressure, total cholesterol, HDL cholesterol, and family history of diabetes. a, association coefficient between triglycerides and the tested mediator; b, association coefficient between the tested mediator and diabetes; c’, association coefficient between triglycerides and diabetes in the presence of the tested mediators; CI, confidence interval; CRP, C-reactive protein; DM, diabetes; HOMA-IR, homeostasis model assessment for insulin resistance; LDL-C, low-density lipoprotein cholesterol; TG, triglycerides. Green tick = yes. Red cross = no. This figure was partly generated using Servier Medical Art, provided by Servier, licensed under a Creative Commons Attribution 3.0 unported license. .
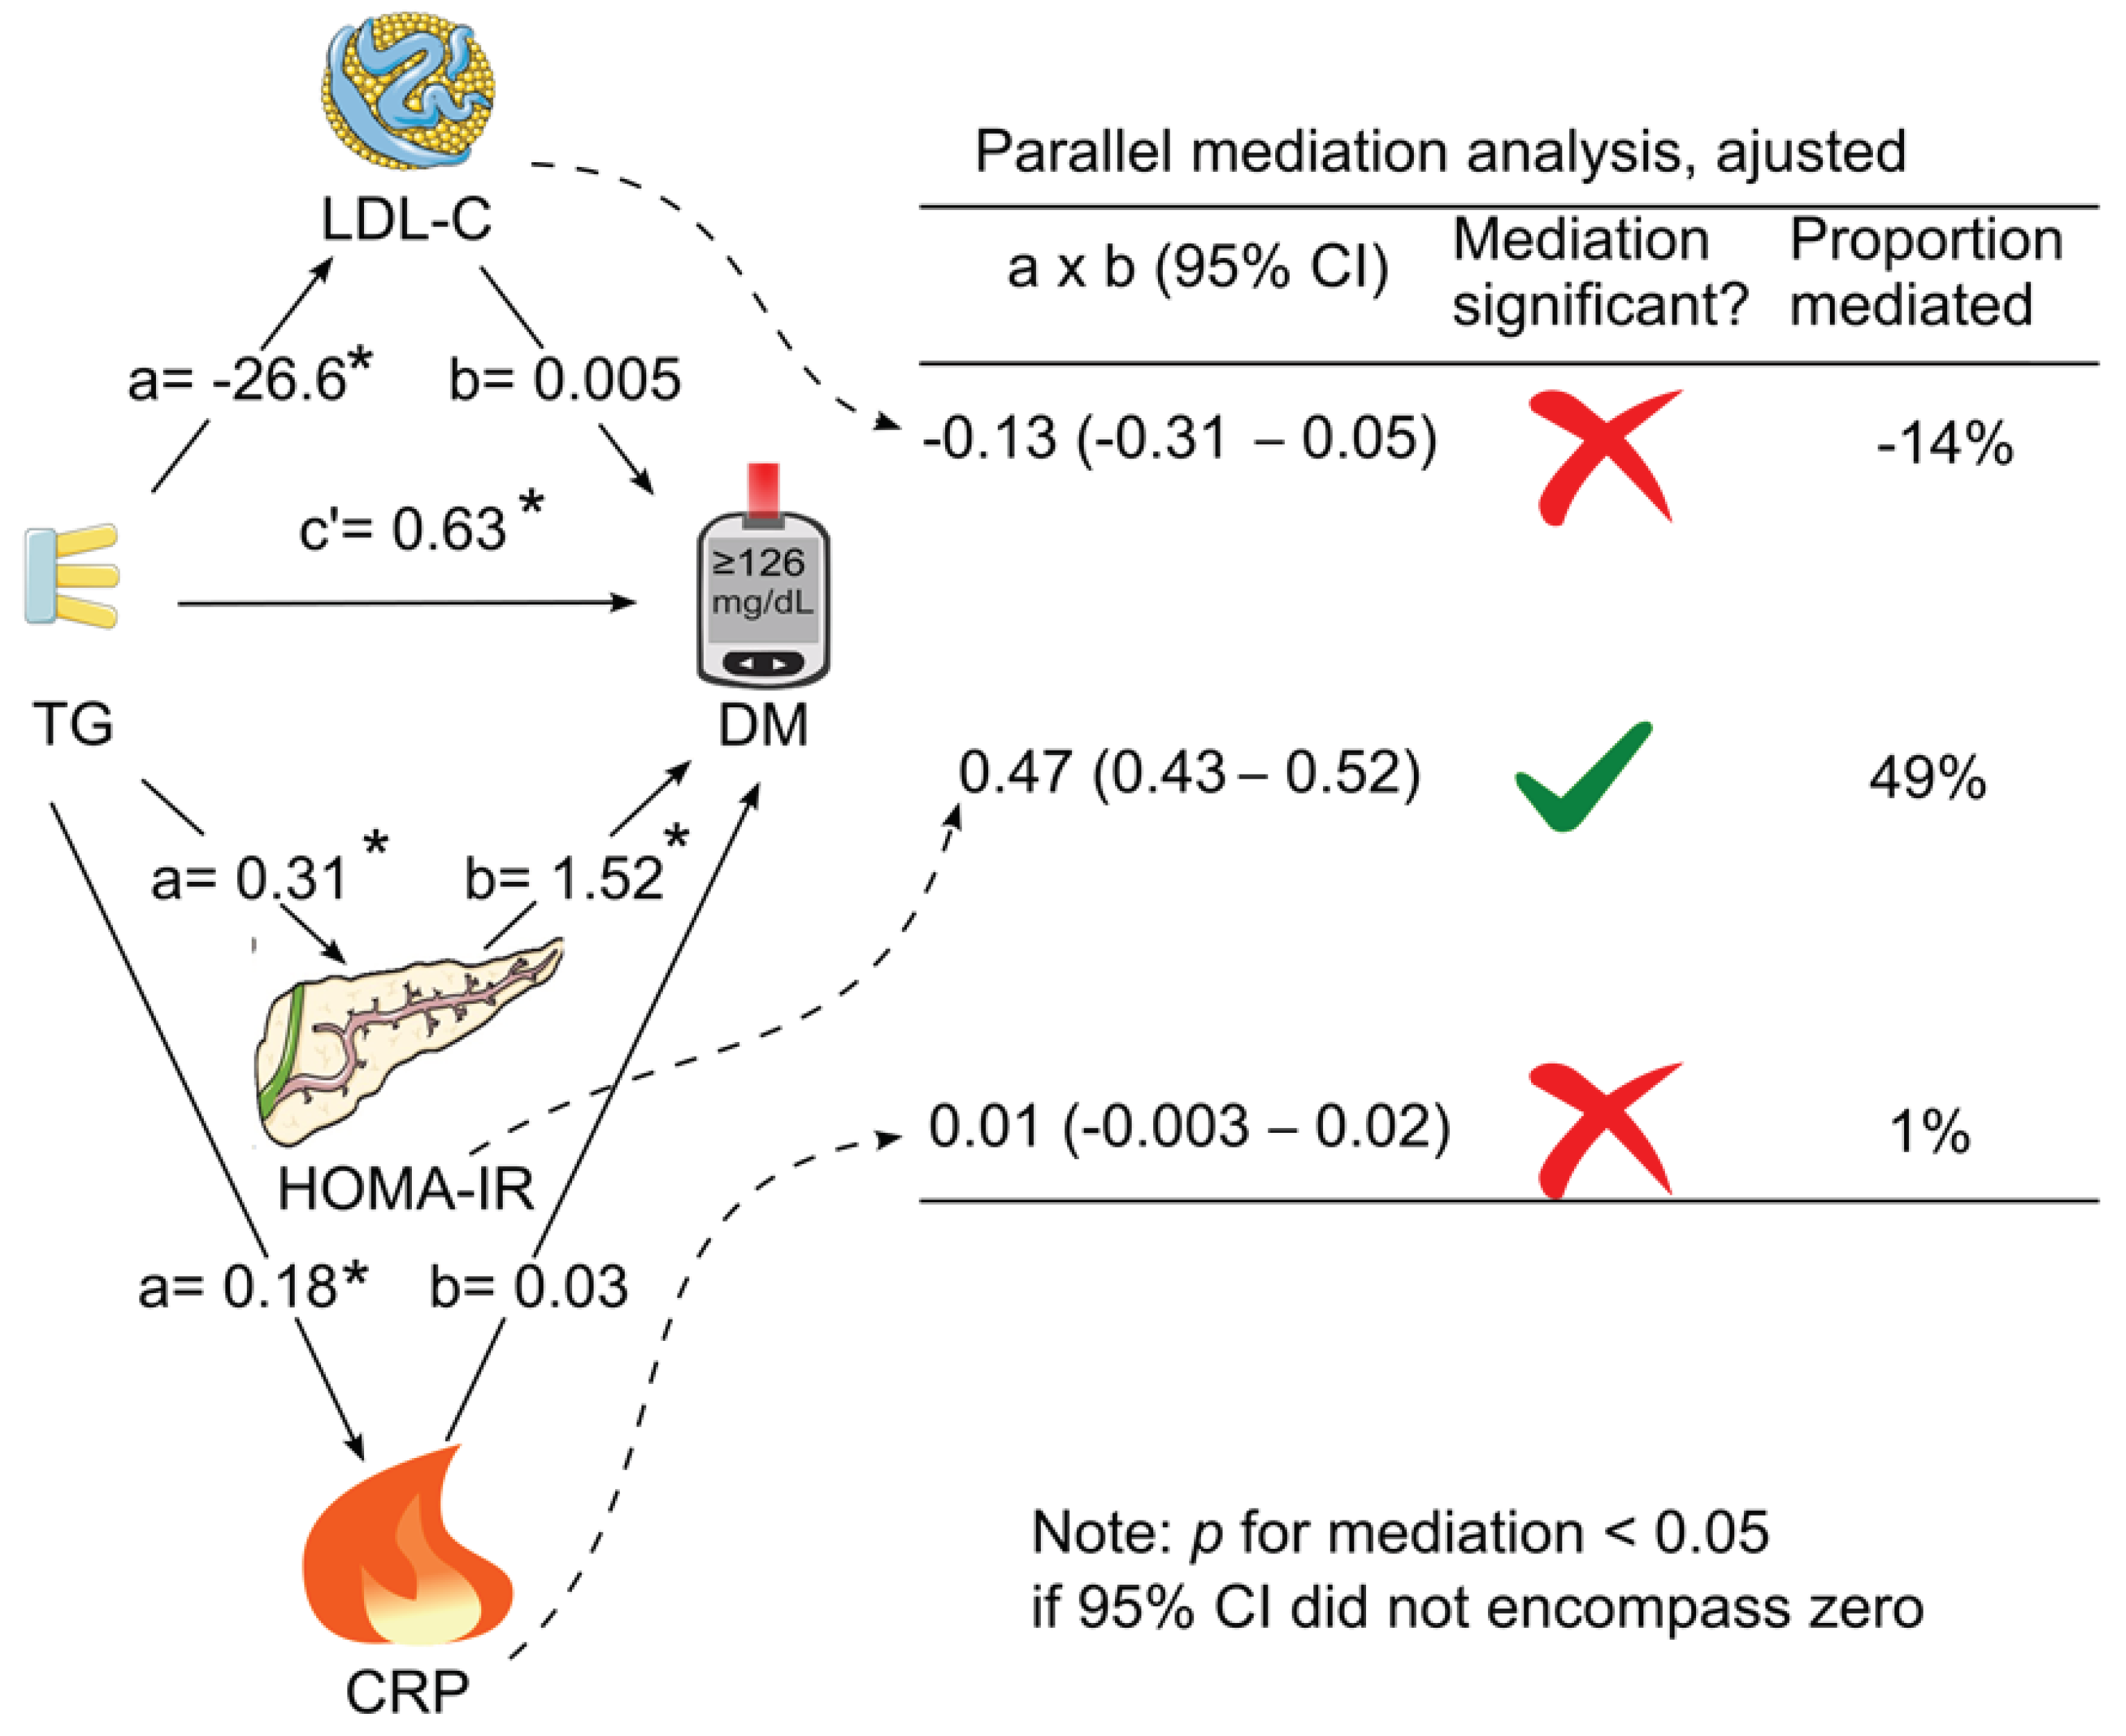

Table 1.
Characteristics of the 18,435 participants, stratified according to observed quartiles of triglycerides.
Table 1.
Characteristics of the 18,435 participants, stratified according to observed quartiles of triglycerides.
| Quartile 1 | Quartile 2 | Quartile 3 | Quartile 4 | Overall | p value | |
| Sample size | 4738 | 4569 | 4523 | 4605 | 18,435 | NA |
| Diabetes, n (%) | 320 (6.8) | 519 (11.4) | 698 (15.4) | 1013 (22.0) | 2550 (13.8) | <0.001 |
| Triglycerides, mg/dL, median (IQR) | 63 (53—72) | 95 (87—104) | 134 (123—147) | 210 (183—255) | 112 (79—162) | <0.001 |
| LDL cholesterol, mg/dL, mean (SD) | 107.5 (32.2) | 121.4 (34.2) | 129.3 (36.1) | 129.5 (40.5) | 121.8 (37.0) | <0.001 |
| HOMA-IR, median (IQR) | 1.6 (1.1—2.5) | 2.1 (1.4—3.2) | 2.6 (1.7—4.1) | 3.3 (2.2—5.4) | 2.3 (1.5—3.7) | <0.001 |
| CRP, mg/dL, median (IQR) | 0.21 (0.09—0.30) | 0.21 (0.14—0.42) | 0.21 (0.18—0.55) | 0.26 (0.21—0.60) | 0.21 (0.15—0.47) | <0.001 |
| Glucose, mg/dL, median (IQR) | 93 (88—100) | 96 (90—104) | 99 (92—108) | 101 (93—113) | 97 (90—106) | <0.001 |
| Insulin, uU/mL, median (IQR) | 7.1 (5.1—10.2) | 8.5 (6.0—12.8) | 10.4 (7.2—15.5) | 12.7 (8.8—19.1) | 9.4 (6.4—14.4) | <0.001 |
| HbA1c, %, median (IQR) | 5.3 (5.0—5.6) | 5.4 (5.1—5.7) | 5.4 (5.1—5.8) | 5.5 (5.2—5.9) | 5.4 (5.1—5.7) | <0.001 |
| BMI, kg/m2, median (IQR) | 24.9 (21.9—28.8) | 26.4 (23.3—30.3) | 27.9 (24.6—31.8) | 29.0 (26.0—32.9) | 27.1 (23.8—31.2) | <0.001 |
| SBP, mm Hg, median (IQR) | 115 (107—127) | 120 (110—133) | 123 (113—137) | 125 (114—139) | 121 (111—134) | <0.001 |
| HDL cholesterol, mg/dL, median (IQR) | 58 (49—70) | 53 (44—63) | 48 (41—58) | 43 (36—52) | 50 (42—62) | <0.001 |
| Total cholesterol, mg/dL, median (IQR) | 178 (156—202) | 194 (170—219) | 204 (180—232) | 217 (191—246) | 197 (171—226) | <0.001 |
| Age, y, mean (SD) | 43 (18) | 49 (19) | 52 (18) | 52 (18) | 49 (19) | <0.001 |
| Sex (male), n (%) | 2004 (42.3) | 2174 (47.6) | 2194 (48.5) | 2333 (50.7) | 8705 (47.2) | <0.001 |
| Ethnicity, n (%) | ||||||
| Non-Hispanic white | 1930 (40.7) | 2161 (47.3) | 2251 (49.8) | 2362 (51.3) | 8704 (47.2) | <0.001 |
| Non-Hispanic black | 1637 (34.6) | 1055 (23.1) | 725 (16.0) | 487 (10.6) | 3904 (21.2) | |
| Hispanic | 1030 (21.7) | 1213 (26.5) | 1400 (31.0) | 1613 (35.0) | 5256 (28.5) | |
| Other | 141 (3.0) | 140 (3.1) | 147 (3.3) | 143 (3.1) | 571 (3.1) | |
| Education, n (%) | ||||||
| < High School | 1269 (26.8) | 1460 (30.2) | 1564 (34.6) | 1805 (39.2) | 6098 (33.1) | <0.001 |
| High School | 1224 (25.8) | 1190 (26.0) | 1201 (26.6) | 1207 (26.2) | 4822 (26.2) | |
| > High School | 2236 (47.2) | 1906 (41.7) | 1743 (38.5) | 1585 (34.4) | 7470 (40.5) | |
| Unknown | 9 (0.2) | 13 (0.3) | 15 (0.3) | 8 (0.2) | 45 (0.2) | |
| Poverty-income ratio, n (%) | ||||||
| < 130% | 1226 (25.9) | 1175 (25.7) | 1188 (26.3) | 1350 (29.3) | 4939 (26.8) | <0.001 |
| 130%-349% | 1752 (37.0) | 1722 (37.7) | 1781 (39.4) | 1718 (37.3) | 6973 (37.8) | |
| ≥ 350% | 1358 (28.7) | 1256 (27.5) | 1200 (26.5) | 1131 (24.6) | 4945 (26.8) | |
| Unknown | 402 (8.5) | 416 (9.1) | 354 (7.8) | 406 (8.8) | 1578 (8.6) | |
| Physical activity, n (%) | ||||||
| Active | 1385 (29.2) | 1234 (27.0) | 1056 (23.3) | 1033 (22.4) | 4708 (25.5) | <0.001 |
| Insufficiently active | 1921 (40.5) | 1801 (39.4) | 1863 (41.2) | 1802 (39.1) | 7387 (40.1) | |
| Inactive | 1431 (30.2) | 1531 (33.5) | 1602 (35.4) | 1767 (38.4) | 6331 (34.3) | |
| Unknown | 1 (0) | 3 (0.1) | 2 (0) | 3 (0.1) | 9 (0) | |
| Alcohol consumption, n (%) | ||||||
| 0 drink/week | 762 (16.1) | 838 (18.3) | 880 (19.5) | 931 (20.2) | 3411 (18.5) | <0.001 |
| < 1 drink/week | 1060 (22.4) | 1071 (23.4) | 1038 (22.9) | 1012 (22.0) | 4181 (22.7) | |
| 1-6 drinks/week | 1115 (23.5) | 958 (21.0) | 879 (19.4) | 806 (17.5) | 3758 (20.4) | |
| ≥ 7 drinks/week | 611 (12.9) | 630 (13.8) | 572 (12.6) | 588 (12.8) | 2401 (13.0) | |
| Unknown | 1190 (25.1) | 1072 (23.5) | 1154 (25.5) | 1268 (27.5) | 4684 (25.4) | |
| Smoking status, n (%) | ||||||
| Past smoker | 963 (20.3) | 1111 (24.3) | 1009 (22.3) | 1048 (22.8) | 4131 (22.4) | <0.001 |
| Current smoker | 963 (20.3) | 1114 (24.4) | 1259 (27.8) | 1414 (30.7) | 4750 (25.8) | |
| Nonsmoker | 2808 (59.3) | 2343 (51.3) | 2252 (49.8) | 2140 (46.5) | 9543 (51.8) | |
| Unknown | 4 (0.1) | 1 (0) | 3 (0.1) | 3 (0.1) | 11 (0.1) | |
| Family history of diabetes, n (%) | ||||||
| Yes | 2012 (42.5) | 1926 (42.2) | 1973 (43.6) | 2229 (48.4) | 8140 (44.2) | <0.001 |
| No | 2615 (55.2) | 2561 (56.1) | 2471 (54.6) | 2298 (49.9) | 9945 (53.9) | |
| Unknown | 111 (2.3) | 82 (1.8) | 79 (1.7) | 78 (1.7) | 350 (1.9) |
Abbreviations: BMI, body mass index; CRP, C-reactive protein; HbA1c, hemoglobin A1c; HDL, high-density lipoprotein; HOMA-IR, homeostatic model assessment for insulin resistance; IQR, interquartile range; LDL, low-density lipoprotein; n, number; NA, not applicable; SBP, systolic blood pressure; SD, standard deviation.
Table 2.
Natural log-transformed triglycerides and risk for diabetes in 18,435 participants.
| Models | Odds ratio | 95% CI | p value |
| Model 1 | 2.69 | 2.47—2.93 | <0.001 |
| Model 2 | 2.60 | 2.36—2.86 | <0.001 |
| Model 3 | 2.18 | 1.97—2.42 | <0.001 |
| Model 4 | 2.58 | 2.28—2.93 | <0.001 |
| Model 5 | 2.54 | 2.23—2.89 | <0.001 |
| Model 6 (Model 5 + LDL-C) | 2.95 | 2.37—3.68 | <0.001 |
| Model 7 (Model 5 + HOMA-IR) | 1.61 | 1.40—1.85 | <0.001 |
| Model 8 (Model 5 + CRP) | 2.55 | 2.24—2.90 | <0.001 |
| Model 9 (Model 5 + LDL-C + HOMA-IR + CRP) | 1.88 | 1.48—2.37 | <0.001 |
CI, confidence interval; CRP, C-reactive protein; HOMA-IR, homeostatic model assessment for insulin resistance; LDL-C, low-density lipoprotein cholesterol. Model 1: Not adjusted; Model 2: Adjusted for age, sex, and ethnicity; Model 3: Adjusted for factors in Model 2 plus body mass index, poverty-income ratio, education, physical activity, alcohol consumption, smoking status, and survey period; Model 4: Adjusted for factors in Model 3 plus systolic blood pressure, total cholesterol, and HDL cholesterol; Model 5: Adjusted for factors in Model 4 plus family history of diabetes.
Table 3.
Association coefficients of LDL cholesterol, HOMA for insulin resistance, and C-reactive protein for mediating the association between triglycerides and diabetes.
Table 3.
Association coefficients of LDL cholesterol, HOMA for insulin resistance, and C-reactive protein for mediating the association between triglycerides and diabetes.
| Tested mediators |
a (95% CI) | b (95% CI) | Direct effect, c’ (95% CI) |
Indirect (mediation) effect a x b (95% CI) |
|---|---|---|---|---|
| Unadjusted simple mediation 1 | ||||
| LDL-C | 16.5 (15.5—17.5)* | -0.006 (-0.007—-0.005) * | 1.06 (0.98—1.15) * | -0.10 (-0.12—-0.08) * |
| HOMA-IR | 0.55 (0.53—0.57) * | 1.54 (1.46—1.61) * | 0.27 (0.17—0.37) * | 0.84 (0.79—0.90) * |
| CRP | 0.44 (0.41—0.47) * | 0.23 (0.19—0.27) * | 0.92 (0.83—1.00) * | 0.10 (0.08—0.12) * |
| Unadjusted parallel mediation 2 | ||||
| LDL-C | 16.5 (15.5—17.5) * | -0.005 (-0.007—-0.004) * | 0.33 (0.23—0.43) * | -0.09 (-0.11—-0.07) * |
| HOMA-IR | 0.55 (0.53—0.57) * | 1.51 (1.43—1.59) * | 0.83 (0.77— 0.88) * | |
| CRP | 0.44 (0.41—0.47) * | 0.04 (-0.001—0.09) | 0.02 (-0.002—0.04) | |
| Adjusted parallel mediation 3 | ||||
| LDL-C | -26.6 (-26.9—-26.3) * | 0.005 (-0.001—0.011) | 0.63 (0.40—0.86) * | -0.13 (-0.31—0.05) |
| HOMA-IR | 0.31 (0.29—0.33) * | 1.52 (1.42—1.61) * | 0.47 (0.43—0.52)* | |
| CRP | 0.18 (0.14—0.22) * | 0.03 (-0.02—0.09) | 0.01 (-0.003—0.02) | |
Abbreviations: a, association coefficient between triglycerides and the tested mediator; b, association coefficient between the tested mediator and diabetes; c’, also known as direct effect, referring to the association coefficient between triglycerides and diabetes in the presence of the tested mediator (simple mediation) or all the tested mediators (parallel mediation); CI, confidence interval; CRP, C-reactive protein; HOMA-IR, homeostasis model assessment for insulin resistance; LDL-C, low-density lipoprotein cholesterol. 1 LDL cholesterol, HOMA for insulin resistance, or C-reactive protein was added as single mediator in the mediation analysis. The analysis was unadjusted. 2 LDL cholesterol, HOMA for insulin resistance, and C-reactive protein were added simultaneously as parallel mediators in the mediation analysis. The analysis was unadjusted. 3 LDL cholesterol, HOMA for insulin resistance, and C-reactive protein were added simultaneously as parallel mediators in the mediation analysis. The analysis was adjusted for age, sex, ethnicity, body mass index, poverty-income ratio, education, physical activity, alcohol consumption, smoking status, survey period, systolic blood pressure, total cholesterol, HDL cholesterol, and family history of diabetes. *, p < 0.05
Disclaimer/Publisher’s Note: The statements, opinions and data contained in all publications are solely those of the individual author(s) and contributor(s) and not of MDPI and/or the editor(s). MDPI and/or the editor(s) disclaim responsibility for any injury to people or property resulting from any ideas, methods, instructions or products referred to in the content. |
© 2024 by the authors. Licensee MDPI, Basel, Switzerland. This article is an open access article distributed under the terms and conditions of the Creative Commons Attribution (CC BY) license (http://creativecommons.org/licenses/by/4.0/).
Copyright: This open access article is published under a Creative Commons CC BY 4.0 license, which permit the free download, distribution, and reuse, provided that the author and preprint are cited in any reuse.


