Submitted:
27 February 2024
Posted:
29 February 2024
You are already at the latest version
Abstract
This study delves into the intricate interplay of economic growth components, specifically focusing on Consumption and investment in Saudi Arabia from 2000 to 2022. Employing vector error correction models and cointegration techniques, we analyze the short- and long-term dynamics within the relationship of Consumption, investment, and economic growth. Granger causality analysis is also used to discern these pivotal variables' causal connections. Our empirical analysis reveals a persistent long-term cointegration relationship among the variables, underscoring the enduring nature of their interdependency. Furthermore, our findings highlight Consumption and investment's statistically significant positive impact on economic growth. Notably, the short-term analysis unveils a stable model characterized by an annual adjustment to equilibrium of 100%.Moreover, the Granger causality study demonstrates unidirectional causal linkages between Consumption, investment, and economic growth. These findings hold substantial implications for policy formulation in Saudi Arabia. Policymakers must grasp the ramifications of burgeoning prosperity and evolving private consumption patterns on future environmental outcomes. Achieving sustainable long-term results necessitates equal emphasis on bolstering private Consumption and fostering other facets of economic growth.
Keywords:
Gross Domestic Product (GDP)
; Consumption
; Investment
; Saudi Arabia
1. Introduction
The rate of increase in a country's GDP is one of the most commonly used measures of economic growth or wealth expansion [1]. Two essential macroeconomic components closely associated with any economy are Consumption and investment. Researchers initiated the process of estimating, through econometric analysis, the numerical correlation between Consumption and income while also considering and accounting for other presumed causal factors. Keynes's theory focuses on aggregate Consumption as a cornerstone in increasing GDP. He argues that one thing that affects economic activity is household consumption expenditure, especially in the long term [2]. The contribution of total expenditure in an economy, which encompasses household and public expenditures, is pivotal in driving economic growth. Consumption is a particularly significant factor among the key components of GDP. Since consumption cutbacks in the private or public sector would reduce the firms' revenues, tax revenues from direct and indirect taxes will eventually decrease [3]. It is widely recognized that the expansion of overall Consumption has played a crucial role in propelling economic growth within Saudi Arabia. The growth in final consumption expenditure has been remarkable – it was three times higher in 2022 compared to 2000, as shown in Figure 1.
Investment is any economic activity that involves supplying and combining resources to produce goods and services, leading to higher output and economic growth. When crowding out is considered, private and public investments are likely complementary economic activities that require more resources to boost output and GDP. However, Keynes contended that for a country to amass wealth and consequently attain economic advancement, a level of effective demand that aligns with full employment must exist. This implies that when a nation seeks to enhance its GDP, it should prioritize and encourage investment and consumption to the greatest extent possible.
Saudi Arabia is oil-dependent, contributing 87% of budget revenues, 90% of export earnings, and 42% of the nation’s GDP [5]. By Vision 2030, Saudi Arabia has constructed its framework based on three primary themes, each encompassing distinct goals slated to be accomplished by 2030. A thriving economy is the cornerstone of Vision 2030, which concerns developing investment mechanisms to unlock promising economic sectors, promote economic diversification, and generate job opportunities. Besides, raise the share of nonoil exports in nonoil GDP from 16 to 50%.
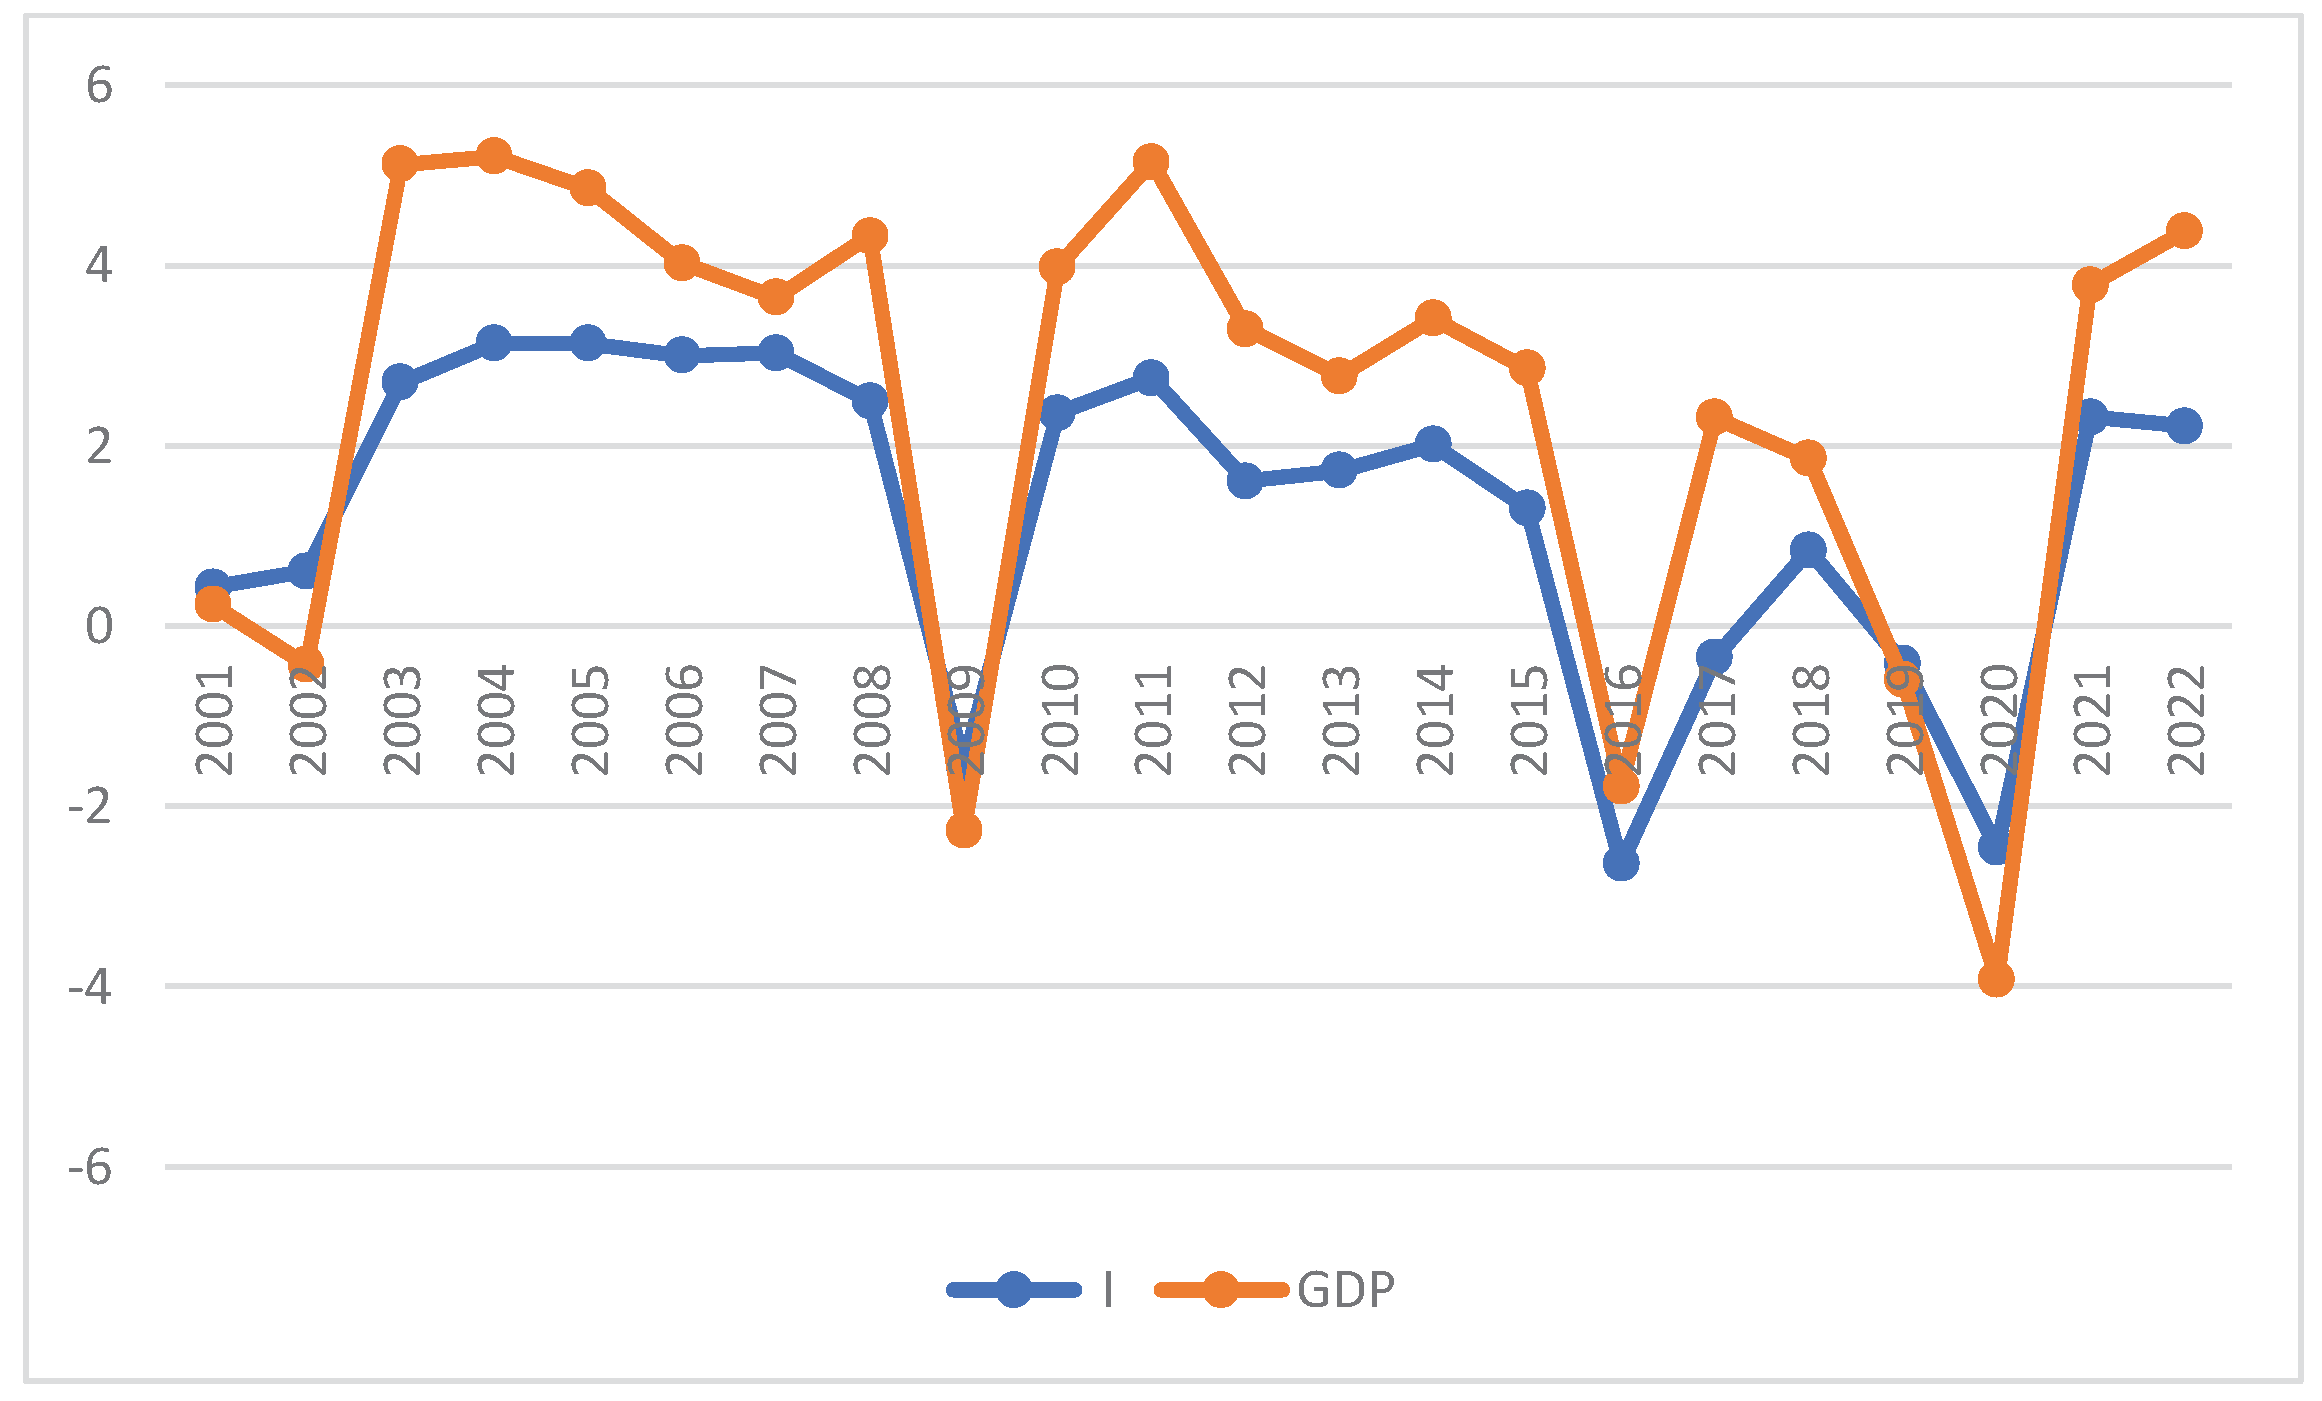
Figure 2.
Saudi Share of Investment in GDP (2000 - 2022), (Unit: Million, Currency: Riyals) [4]. Source: Saudi Central Bank – statistical reports. Statistical Report (sama.gov.sa).
Figure 2.
Saudi Share of Investment in GDP (2000 - 2022), (Unit: Million, Currency: Riyals) [4]. Source: Saudi Central Bank – statistical reports. Statistical Report (sama.gov.sa).
The uniqueness of this study is based on the fact that it is the inaugural research endeavour to explore the leading role of Saudi private Consumption as a driving force of other economic growth components (i.e., investment, government expenditure, and trade balance). The study is organized as follows: Section two (2) presents a related literature review. Section three (3) comprises a model specification and the data employed to examine the correlation between economic growth, Consumption, and investment in Saudi Arabia. Section 4 presents the findings and their subsequent analysis. Subsequently, Section 5 provides an overview of the conclusion and the potential implications for policymakers.
2. Related Literature
2.1. Gross Domestic Product (GDP)
Several research endeavours have investigated the factors that affect Saudi GDP [6]. Examined the relationship between oil production and economic growth using time-series data of Saudi Arabia from 1971 to 2010. Results show that oil revenues have a positive impact on real Gross Domestic Product (RGDP) in both the short and the long runs, and this positive relationship holds for different model specifications. The nonoil GDP of Saudi Arabia continues to maintain an impressive level, while the role of oil GDP in the overall GDP growth exhibits significant volatility and instability. Other studies stressed the importance of diversification of Saudi GDP [7]. Investigate the impact of major macroeconomic variables (e.g. private investment, public investment) on nonoil GDP in the oil-based Saudi Arabia. The results show that past nonoil GDP shocks strongly affect current nonoil GDP in the short term. Moreover, a surge in public investment increases nonoil GDP in both the short- and long-run, while a negative private investment shock reduces nonoil GDP in both the short- and long-run. Furthermore, positive (negative) oil production shocks also increase the nonoil GDP in the short- and long-run. Using the nonparametric causality-in-quantile approach, the study found that causality-in-the mean and causality-in-the variance emanating from the four explanatory variables vary across the quantiles. Finally, non-oil GDP does not cause these macroeconomic variables. [8] examined the link between oil and nonoil GDP in Saudi Arabia. Autoregressive distributed lag (ARDL) cointegration examines linkages among variables. ARDL results confirm the long-term cointegration between nonoil GDP and oil rent, thus implying that oil rent-seeking strategies still exist in Saudi Arabia. Furthermore, the short-term dynamics confirmed the impact of oil rent over the nonoil GDP. The ARDL results led to analyses of asymmetric effects. The NARDL model estimated and confirmed the symmetric effect of the oil rent on nonoil GDP.
On the other hand, [9] investigate whether the high economic growth rates achieved by the Central and Eastern European (CEE) countries are based either on Consumption or on investments, considering many exogenous factors that impact economic growth and how these factors can contribute to the employment process in the CEE economies to stress if these trends of economic growth and employment are sustainable in the long run. The results show that private Consumption positively affects economic growth in the short run. Besides, public spending strongly and negatively correlates with economic growth, while the net export weakly impacts the CEE region's economic growth. The impact of domestic investments on economic growth is weaker in the CEE area than the impact of both private and public spending. However, they are positively correlated with economic growth. Both direct and portfolio investments exert an influence on the long-term GDP [10]. On 25 April 2016, Saudi Arabia introduced its 2030 Vision to diversify the economy and decrease the nation's reliance on oil. Furthermore, the implementation of various initiatives by the government has facilitated the transformation of the private sector into the foremost driving force behind the economy. A total of thirteen initiatives were initiated under the 2030 Vision. These programs aimed to enhance human resources and foster economic growth by attracting foreign investments and facilitating business operations. [11]find that Saudi GDP can be estimated by scientific and technical journal articles, and predicted GDP behaves as an observed one with quite a difference in values, which the impact of other economic factors on GDP can explain.
2.2. Investment and Economic Growth
Theoretical and statistical studies have shown a relationship between investment and GDP. Based on the Keynesian perspective, investment depends on the marginal efficiency of capital as an expectation in terms of monetary value. That is to say, saving never acts as a source of investment and never deviates from investment, so S=I [12]. Nevertheless, as [13] argued, Foreign Direct Investment (FDI) plays a significant role in ensuring the country's GDP behaviour, taking the country towards a trade surplus destination and removing unemployment by creating jobs. However, FDI contributes to economic growth only when a sufficient absorptive capability of advanced technologies is available in the host economy [14]. Furthermore, the Saudi economy experienced a higher inflow of FDI during the global financial crisis due to economic stability [15].
[12] investigate the relationship between saving and investment and the mechanism of the way they influence the GDP. The results show a unidirectional causality running from private savings to private investment. However, an ambiguous relationship between investment and GDP at both aggregate and private levels is missing.
On the contrary, [16] presents a different perspective, asserting that not only does FDI play a significant role in driving economic development, but domestic investment (both public and private) can also be a crucial causal factor in fostering economic growth and generating employment opportunities. Their research examines the causal connections between domestic capital investment, foreign direct investment, and GDP in Saudi Arabia from 1970 to 2015. The results uncover several noteworthy patterns. Over the long term, there is a negative bidirectional causality between the growth of nonoil GDP and FDI and between the growth of nonoil GDP and domestic capital investment. Moreover, a bidirectional causality is observed between FDI and domestic capital investment.
Interestingly, in the short run, FDI hurts domestic capital investment, while domestic capital investment negatively influences FDI in the long run. Additionally, financial development and trade openness positively affect the inflow of FDI and domestic capital investment in the long term. However, numerous investigations [17,18,19,20,21,22,23,24,25] have agreed that foreign direct investment (FDI) can augment the GDP through overflow effects. These effects encompass the introduction of novel technologies, accumulation of capital, expansion of exports, and the fostering of human capital. In contrast, several research studies have indicated that FDI can have a detrimental impact on the GDP of certain nations. For instance, [26,27,28,29] found evidence supporting this claim. A different study [30] concluded that domestic investment, FDI, imports, exports, or labour do not influence the long-term economic growth in Nigeria. One potential explanation for this paradox is that the effectiveness of FDI depends on the host country's initial conditions. These conditions include the host country's absorptive capacity and the level of complementarity between domestic investment and FDI [16].
2.2. Consumption Expenditure and GDP
Low- and middle-income countries tend to exhibit a stronger relationship between Consumption and GDP than high-income countries. This is attributed to high-income countries allocating a greater proportion of their capital towards investment and research and development endeavours [31]. It is widely agreed upon that economic growth in developing nations is primarily driven by Consumption rather than investment. This is primarily because the private consumption share of GDP in these economies typically falls between 70% and 75% [32]. Over the past decades, there has been a consistent increase in the ratio of Consumption to GDP in Saudi Arabia. However, the conventional neoclassical theory of constrained optimization, which forms the basis of the consumption function, fails to adequately explain this significant rise according to standard models. The concept of aggregate Consumption is perceived as the outcome of two distinct historical processes. Predetermined and regulated decisions primarily characterize the first process, while the second involves flexible choices made with an understanding of uncertainty. These choices aim to embrace new intermediate rules related to consuming innovative goods and services. A similar [33] examined the consumption ratio to GDP in the United States. The research presented a different viewpoint in which the overall expenditure on Consumption predominantly results from the population's adoption of widely accepted principles within an intricate economic framework. The data substantiates that the proportion of Consumption about GDP has increased due to the spread of a 'consumerism culture' during the period following the war, and it is now reaching its threshold, carrying significant implications for both macroeconomics and society.
In the previous century, the discussion surrounding the factors that impact aggregate Consumption played a pivotal role in shaping the field of macroeconomics in subsequent years. Keynesian economists emphasized the significance of the multiplier in maintaining stability, as well as the marginal propensity to consume, which increases during economic downturns and reverts to a proportional average propensity to consume during upturns. However, some economists who shared Friedman's perspective faced difficulties incorporating the consumption function into neoclassical micro-foundations, particularly in constructing permanent income as an adaptive expectation. In modern macroeconomics, the neoclassical representation of consumption behaviour is widely embraced [34]. Nevertheless, the economy is viewed as a complex system that is not deterministic, predictable, or mechanistic but process-dependent, organic, and constantly evolving [35]. As a complex system, it is argued that the economy must exhibit a certain degree of order to function. Much of consumption expenditure is influenced by prior commitments to behavioural rules. Individuals tend to repurchase similar goods and services, replace durable goods with similar models at comparable real prices, and fulfil contractual obligations that have not yet expired [33]. Likewise, Consumption will encompass an 'entrepreneurial' element, wherein individuals seize the opportunities that arise amidst favourable uncertainty [36].
[37] has identified three significant aggregate consumption behaviours: habit formation, rule-of-thumb consumption, and the complementarity of government consumption in private utility. The study's findings are as follows:
- 1)
- The presence of habit formation in Consumption is evident, indicating that individuals continue their consumption patterns based on past behaviour.
- 2)
- Approximately 38% of consumers adhere to the rule of thumb, which suggests that they consume their current income without considering other factors. This behaviour is particularly prominent in the period preceding the emergence of mobile money in the 2000s.
- 3)
- The study also reveals that public Consumption complements private Consumption in an Edgeworth-Pareto sense. This implies that an increase in government consumption can positively impact aggregate demand through a channel of positive marginal utility. Additionally, it suggests that a higher proportion of Consumption in GDP corresponds to a lower proportion in other sectors of the macroeconomy. In addition, a study was carried out by [38] to investigate the relationship between private Consumption and different variables and its influence on the economic growth of 52 Asian countries/territories. This research provides evidence in favour of the hypothesis that economic growth in Asia is driven by Consumption. It is worth mentioning that the study considered the distinctive features of Asian economies, including their impressive global competitiveness, substantial savings rates, and significant public expenditure. Adoption rates have demonstrated steady growth over the course of several decades, both in Saudi Arabia and the United States. This upward trend is evident in the expanding proportion of the GDP allocated to consumption expenditures, as noted by [33]. Consumer confidence, fueled by economic stability, serves as a driving force behind this phenomenon. Notably, it plays a significant and positive role in stimulating expenditures, particularly for durable and semi-durable goods as well as services, as highlighted by [39]. Furthermore, embracing positive uncertainty can facilitate the integration of novel types of goods and services, paving the way for implementing innovative ideas, capabilities, and skills.
On the other hand, regarding sustainability issues, Saudi Consumption can be classified into two bold categories: first, goods and services, which can be treated by recycling. This section has no major and/or controllable drawbacks to environmental pollution. Second, is energy consumption, where the hazards towards the planet (gas emission) increase. According to the study conducted by [40], it is evident that China's rapid economic growth has led to a significant increase in energy consumption. However, despite this growth, the improvements in energy efficiency and the reduction in environmental impact from energy consumption have not kept pace. Similarly, [6] discovered that the domestic oil consumption in Saudi Arabia's industrial sector has had a detrimental impact on both the short-term and long-term GDP. The persistent conflict between the economy, energy sector, and air quality protection remains a pressing issue, primarily due to Saudi Arabia's heavy reliance on fossil fuel energy sources. Furthermore, the challenges associated with implementing effective environmental protection measures continue to persist.
3. Model Specification, Data, and Econometric Methodology
3.1. Model Specification
The following models examine the dynamic relationship between Household consumption, government expenditure, Investment, Trade Balance (X-M), and Saudi Arabia's real Gross Domestic Product (GDP). The models used to investigate this relationship are:
RGDP = C + I + G + NX
RGDPit = α + Cit + I + Git + (X – M) it
RGDPit = α0 + α1 Cit + α2 Iit + α3 Git + α4(X-M) +εit
After taking the log, the model becomes
where RGDPit represents real gross domestic product, which is a dependent variable. Independent variables include household consumption (Cit), investment (I), government expenditure (Git), and net exports (NX), given by the difference between the exports and imports (X – M). The error term εit is subject to the conventional statistical characteristics.
Ln RGDPcit = α0+ α1Ln Cit + α2 Ln Iit+ α3 Ln Git + α4 Ln (X-M)it
3.2. Data Analysis
The analysis in this study was conducted using data obtained from the official Saudi Central Bank open portal data. The variables used in the study were defined in detail using information from the World Bank. To carry out the analysis, the researcher utilized the EViews 12 software, renowned for its versatility and user-friendly features. This software effectively streamlines the tasks of data organization, visualization, and analysis.
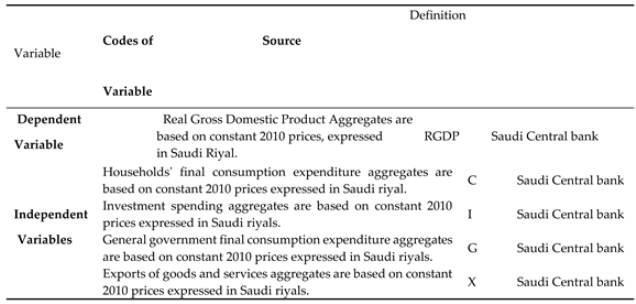
Definition of the Variables (World Bank).
1. Economic growth (RGDP): RGDP, which stands for Real Gross Domestic Product, is the research's dependent variable. It serves as a comprehensive measure that considers inflation and accurately depicts the overall worth of goods and services generated by the Saudi Arabian economy in the year 2010. This metric is expressed in prices from a reference year and is widely recognized as constant-price, inflation-adjusted, or constant-Saudi Riyal (SR).
2. Private Final consumption expenditure (C): Denoted as (C), Household final consumption expenditure, also known as private Consumption, refers to the total value of goods and services acquired by households, encompassing durable products. This measure excludes the purchase of dwellings but incorporates imputed rent for owner-occupied dwellings. Additionally, it encompasses payments and fees made to governments in order to obtain permits and licenses. Notably, this indicator incorporates the expenditures of nonprofit institutions serving households, even if they are reported separately by the country.
3. Investment spending (I): Denoted as I, gross fixed capital formation is a measure that accounts for investments made in a country's economy using constant local currency. This measure is based on aggregates calculated using constant 2010 prices and expressed in SR. Gross fixed capital formation encompasses various types of investments, such as land improvements, purchases of plant, machinery, and equipment, as well as the construction of infrastructure like roads, railways, schools, offices, hospitals, residential dwellings, and commercial and industrial buildings. Additionally, according to the 2008 System of National Accounts (SNA), net valuables acquisitions are also considered part of capital formation.
4. General government final consumption expenditure (G): Denoted as G, the general government final consumption expenditure is determined using constant local currency. This encompasses all current expenses made by the government for the acquisition of goods and services, including employee compensation. Additionally, it comprises a significant portion of the funds allocated towards national defence and security. However, it does not encompass military expenditures contributing to government capital formation.
5. Exports of goods and services(X): Denoted as X, exports are measured in a consistent local currency, SR. The aggregates are calculated using constant 2010 prices and are expressed in SR. The exports of goods and services encompass the total value of all goods and various market services provided to other countries. This includes the value of merchandise, freight, insurance, transportation, travel, royalties, license fees, and other services such as communication, construction, financial, information, business, personal, and government services. However, it does not include compensation of employees, investment income (previously referred to as factor services), and transfer payments.
6. Imports of goods and services (M): Denoted as (M), these are the imports of goods and services measured in a consistent local currency, specifically the Saudi riyal. The aggregates are computed using constant 2010 prices and are expressed in SR. Imports of goods and services encompass the total monetary value of all goods and other market services procured from the international community. This includes the value of merchandise, freight, insurance, transportation, travel, royalties, license fees, and other services such as communication, construction, financial, information, business, personal, and government services. However, it does not include compensation of employees and investment income, previously referred to as factor services, nor does it include transfer payments.
3.3. Econometric Methodology
This research utilizes various econometric methodologies to tackle the unique obstacles presented by time series data, causality, and cointegration.

Table 1.
Description of Variables and Sources of Data.
 |
The dynamic ordinary least squares (DOLS) estimation method, the Johansen cointegration test, and the error correction model (ECM) are among the econometric techniques available for analysis. These methodologies are highly appropriate when examining the long-term associations, short-term dynamics, and causal connections between the expenditure components and the RGDP in Saudi Arabia.
Dynamic Ordinary Least Squares (DOLS):
DOLS, or Dynamic Ordinary Least Squares, is a statistical technique employed to estimate parameters in dynamic regression models involving time series data with potential integration. This method is particularly popular in the analysis of cointegrated time series, as highlighted by [41].
The general formula for DOLS is:
where
∆Yt = α + β1∆Xt + εt
- ∆Yt is the dependent variable at time t;
- ∆Xt The independent variable(s) exist at time t.
- α is the intercept;
- β is/are the coefficient(s) of the independent variable(s);
- εt is the error term at time t.
Johansen cointegration test
The Johansen cointegration test is a pivotal statistical tool in exploring the presence of cointegration among a set of time series variables, indicating enduring relationships among them. Primarily utilized in econometrics, this method involves the estimation of a vector autoregressive (VAR) model followed by conducting likelihood ratio tests to assess the model's validity.
The equation for the Johansen cointegration test is as follows:
where:
Δyt=Πyt−1+Γ1Δyt−1+Γ2Δyt−2……..+ΓpΔyt−p+ϵt
- Δyt represents the differenced vector of time series variables at time t.
- Π is the matrix of cointegration coefficients.
- Γi is matrices of adjustment coefficients.
- p is the lag length of the VAR model.
- ϵt is the error term.
The Error Correction Model (ECM)
The error correction model (ECM) is a theoretical framework for examining the short-term and long-term interactions among variables in a cointegrated relationship. The fundamental formula of ECM is:
where:
∆Yt = α + β1(∆Yt − 1 − β2∆Xt − 1) + γ∆Xt + δ1∆Yt − 1 + δ2∆Xt − 1 + εt
∆Yt: short-term dependent variable changes at time “t”.
∆Xt: Short-term variations in the independent variable(s) at time point "t"
α: The intercept term indicates the constant effect on the dependent variable.
β1: The coefficient quantifies the rate at which the adjustment or correction mechanism operates, specifically in response to deviations from the long-term equilibrium observed in the preceding period.
β2: The coefficient linked to the lagged difference in the independent variable(s) is employed to correct deviations from the equilibrium state.
γ: The primary adjustment in the coefficient of the independent variable indicates the immediate impact of changes in the independent variable on the dependent variable. δ1: The lagged first difference coefficient in the dependent variable is responsible for capturing any persistence or autocorrelation.
δ2: The coefficient of the lagged first difference in the independent variable(s) accounts for potential persistence or autocorrelation effects.
εt: The error term denotes the unaccounted variability in the dependent variable during time "t".
4. Results and Discussion
4.1. Descriptive Statistics
Table 2 displays descriptive statistics for the variables, encompassing maximum, minimum, mean, standard deviation (Std. Dev.), and coefficient of variation (CV). Additionally, it includes the average ratio of the natural logarithm of C from 2000 to 2022, which is approximately 13.3%, with a standard deviation of 0.28. As for Ln I, its average is around 13%, with a standard deviation of 0.53. These statistics collectively suggest that the model is largely stable.
Table 3 displays the correlation matrix, which indicates that private Consumption has the highest positive association with RGDP (0.233), followed by Government expenditure (G) (0.226), Net Trade Balance (X-M) (0.137), and Investment (0.022), respectively. The outcomes hold considerable worth for understanding the structure of Saudi RGDP and uncovering the most influential factors in real economic growth in our model from another side.
4.2. Results of DOLS
This study employed the Ordinary Least Squares (OLS) estimation method to analyze the model and assess the relationship between Saudi households' Consumption, investment, and Real Gross Domestic Product (RGDP). As depicted in Table 4, the positive and statistically significant coefficient of Ln C (t-Statistic = 3.4425, Prob. = 0.0412) suggests a robust positive correlation between Household Consumption and RGDP. This implies that an increase in aggregate Consumption is likely to lead to an elevation in RGDP, indicating a potential link between economic growth and heightened Consumption, consistent with the findings of [9].
Furthermore, although the coefficient for Ln G is positively associated, it is not statistically significant (t-Statistic = 0.2408, Prob = 0.8252), indicating that government expenditure may not have substantially impacted Saudi RGDP during the study period. Conversely, evidence of a negative relationship between Investment (I) and RGDP in Saudi Arabia is apparent, as indicated by the highly significant negative coefficient for Ln I (t-Statistic = -3.992, Prob. = 0.0282). Therefore, it can be inferred that domestic investment did not significantly influence Saudi Arabia's RGDP during this period.
Moreover, based on Table 4, the coefficient for Ln (X-M) is negative and highly statistically significant (t-Statistic = -3.6028, Prob. = 0.0367), suggesting that the balance of trade (i.e., net exports and imports) had a detrimental effect on Saudi RGDP during the study period.
Table 4 presents an R-squared value of 0.9099, indicating that the model explains approximately 91% of the variation in RGDP. The adjusted R-squared of 0.4294 considers the number of variables in the model.
Overall, the results demonstrate a nuanced relationship between Real Gross Domestic Product and expenditure components in Saudi Arabia, with certain variables exhibiting positive effects (i.e., C & G). In contrast, others display negative effects (i.e., I & (X-M)).
4.3. Result of Unit Root Test
As per Table 6, the unit root (ADF) test indicates that all series were non-stationary at a significance level of 0.05, as evidenced by the p-values. If the t-statistics for the ADF test of the variables C, G, I, and X-M fail to surpass the critical values at the 5% level, it suggests non-stationarity in their level forms. Subsequently, after taking the first difference, all variables were observed to become stationary, with a p-value below 0.05.
Table 5.
The unit root (ADF) test.
 |
Upon analysis of Table 6, it becomes evident that lag two emerges as the optimal choice for a VAR model, denoted by asterisks across the Final Prediction Error (FPE), Akaike Information Criterion (AIC), and Hannan-Quinn Information Criterion (HQ) columns. The Table encompasses several criteria, including log likelihood (LogL), sequential modified LR (LR), FPE, AIC, Schwarz information criterion (SC), and HQ, facilitating the identification of the suitable lag order for the VAR model.
4.4. Cointegration Test Results
4.4.1. Results of Johansen Cointegration test
The Johansen cointegration test is instrumental in uncovering the long-term relationships among the examined variables. Hence, cointegration analysis is pivotal for investigating stable associations between Ln RGDP, Ln C, Ln G, Ln I, and Ln (X-M) across periods. Criteria such as the Akaike Information Criterion (AIC) and Schwarz Criterion (SC) were utilized to determine the lag length that best fits the model. These criteria aided in model selection and were computed based on the estimation of an unconstrained Vector Autoregressive (VAR) model using the first differences of the variables. The analysis outcomes indicate that the model's most optimal lag length is one. Additionally, Table 7 illustrates that one significant cointegration equation exists at the 5% level.
We test the short-run model with the lag of ECT as an independent model. As shown in Table 8, the negative sign and significance of ECT (-1) imply that adjustment of the model will be possible. The coefficient of ECT (-1) is 1.00, which shows the speed of adjustment toward equilibrium. Therefore, the model is stable in the short run accordingly. Likewise, Table 9 indicates the stationary of ECT at level (i.e. rejection H0). Hence, cointegration and a stable long-run relationship between the model constructs exist (Prob = 0.0045 < 0.05).
The results of the Johansen cointegration test are important for extracting further analyses and conducting conclusions about the dynamics of Saudi RGDP and expenditure component factors.
Based on Table 9, it appears that private consumption and government expenditure positively impact Saudi real GDP in the long run. At the same time, ECT does not yield a statistically significant result for investment and trade balance (i.e. net value of exports and imports), on average, citrus paribus.
To sum up, the null hypothesis of no cointegration is rejected against the alternative of the cointegration relationship in the model.
4.2. Results of Granger Causality Tests
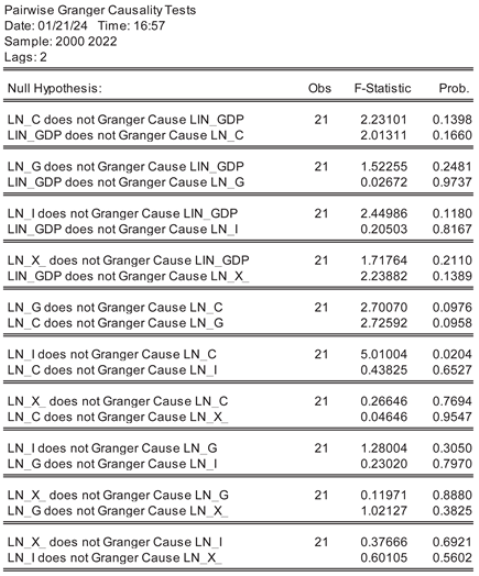
The causal relationship between the relevant factors used in this study is shown in Table 11. The results are summarized as follows:
- -
- C → RDGP rejection of H0 (i.e. causality relationship exists). This suggests that there is a statistically significant unidirectional causal relationship between C and RGDP. This means that changes in household consumption can cause significant variations in RGDP Saudi Arabia.
- -
- G → RGDP rejection of H0 (i.e. causality relationship exists). A unidirectional causal relationship from G to RGDP has been observed, indicating that fluctuations in Government expenditure have a substantial impact on the Saudi Real GDP.
- -
- I → RGDP rejection of H0 (i.e. causality relationship exists). Investment exhibits a statistically significant unidirectional causal relationship to RGDP. Changes in G has a significant impact on RGDP in Saudi Arabia.
- -
- (X-M) → RGDP rejection of H0 (i.e. causality relationship exists). A statistically significant unidirectional causal relationship exists between the net trade balance (i.e. exports- imports) and Real GDP. Changes in the trade balance have a significant impact on the Saudi RGDP.
5. Conclusions and Policy Implications
In summary, our research delves into the intricate relationship between Real Gross Domestic Product (RGDP), private Consumption, and investment within the Saudi Arabian context spanning from 2000 to 2022. Through a comprehensive analysis employing diverse statistical methodologies, our study has yielded significant insights with profound implications for the nation's future progress. Key findings include:
- The determination of substantial long-term cointegration among the variables indicates a stable relationship between expenditure components in gross domestic products and real gross domestic products.
- Unveiling a positive correlation between household consumption and RGDP: Our analysis highlights a significant association between private Consumption (C) and RGDP, suggesting that an increase in private consumption corresponds to a rise in RGDP.
- Discovery of the Saudi RGDP model's short-term stability and an annual correction rate of 100%, indicating a dynamic tendency towards equilibrium.
- Granger causality analysis reveals the presence of unidirectional causal links between Private Consumption and RGDP, underscoring private Consumption as a driving force behind RGDP. Moreover, it highlights the dynamic interplay between private Consumption and RGDP in Saudi Arabia.
Top of Form
Policy implications for Saudi sustainable development
The findings of this study have important policy implications for Saudi sustainable development as follows:
- A well-rounded approach to development that acknowledges the role of private Consumption as a driver for real gross domestic product is crucial. Policymakers must give equal importance to both the enhancement of private Consumption and other components of RGDP in order to guarantee sustainable long-term outcomes.
- Given the apparent paradox between the sustainable development objectives of economic expansion and safeguarding the environment, it becomes crucial for policymakers to comprehend the influence of increasing prosperity and simultaneous shifts in private consumption habits on forthcoming environmental consequences.
- Investment plays a dominant role in economic growth globally, unlike Saudi RGDP; this possibly refers to contingent depending on the initial circumstances, which encompass the ability to absorb and the level of compatibility between local investments and foreign direct investments. Policymakers need comprehensive strategies and regulations to promote this sector, especially no-oil investments.
In summary, the interrelationship between Consumption, investment and economic growth in Saudi Arabia is complex and dynamic. This research ensures the priority of private Consumption as a driving force for fostering economic development. These findings are expected to contribute to interpreting the power of the Saudi economy and provide valuable insights for policymakers to secure sustainable development and researchers to conduct seminal studies as well.
Future research directions:
1. According to the results outlined in this article, numerous potential paths for future investigation arise:
- As private Consumption has been a driving force for economic growth in Saudi Arabia for the last two decades, it is stressed to analyze the structure of consumption function; further research may conduct a thorough analysis to clarify which factors are predominantly accountable for the observed relationships.
- Regarding the coupled relationship between private Consumption and pollution, further research can investigate the impacts of Saudi private Consumption on the environment.
- Different Gulf region countries can be analyzed to identify variations in the relationship between economic growth and private Consumption. By conducting comparative analyses, it is possible to uncover regional disparities and gain insights into the interplay between these factors. This approach can provide valuable information regarding best practices and lessons that can be applied to Saudi Arabia.
Funding
This research received no external funding.
Conflicts of Interest
The author declares no conflicts of interest regarding the publication of this paper.
References
- Petrakis, P. E. (2020). Theoretical Approaches to Economic Growth and Development: An Interdisciplinary Perspective. Athens: Palgrave Macmillan. [CrossRef]
- Pratama, H. P., Syaparuddin, S., & Emilia, E. Determinants of economic growth regencies/cities in Jambi Province with dynamic panel data approach. Jurnal Perspektif Pembiayaan Dan Pembangunan Daerah 2022, 10, 311–324.
- ALPER, A. The relationship of economic growth with Consumption, investment, unemployment rates, saving rates and portfolio investments in developing countries. Gaziantep University Journal of Social Sciences 2018, 17, 980–987. [Google Scholar] [CrossRef]
- Saudi Central Bank – statistical reports. Statistical Report (sama.gov.sa).
- Sayed, M. N., & Alayis, M. M. H. The Nature of the Relationship between GDP and Energy Consumption in Saudi Arabia. International Journal of Business and Management 2019, 14.
- Alkhathlan, K. A. Contribution of oil to the economic growth of Saudi Arabia. Applied Economics Letters 2013, 20, 343–348. [Google Scholar] [CrossRef]
- Mensi, W., Shahzad, S. J. H., Hammoudeh, S., & Al-Yahyaee, K. H. Asymmetric impacts of public and private investments on the nonoil GDP of Saudi Arabia. International Economics 2018, 156, 15–30.
- Alabdulwahab, S. The linkage between oil and nonoil GDP in Saudi Arabia. Economies 2021, 9, 202. [Google Scholar] [CrossRef]
- Radulescu, M., Serbanescu, L., & Sinisi, C. I. Consumption vs Investments for stimulating economic growth and employment in the CEE Countries–a panel analysis. Economic research-Ekonomska istraživanja 2019, 32, 2329–2352.
- Albulescu, C. T. Do Foreign Direct and Portfolio Investments Affect Long-term Economic Growth in Central and Eastern Europe? Procedia Economics and Finance 2015, 23, 507–512. [Google Scholar] [CrossRef]
- Amirat, A., & Zaidi, M. Estimating GDP growth in Saudi Arabia under the government's Vision 2030: a knowledge-based economy approach. Journal of the Knowledge Economy 2020, 11, 1145–1170.
- Alrasheedy, A., & Alaidarous, H. The Relationship between Saving and Investment: The Case of Saudi Arabia. International Journal of Economics and Finance 2019, 11, 10–5539.
- Rahman, M. N. DYNAMICS OF FOREIGN DIRECT INVESTMENT IN SAUDI ARABIAN ECONOMY. Academy of Entrepreneurship Journal 2021, 27, 1–16. [Google Scholar]
- Borensztein, E., De Gregorio, J., & Lee, J. W. How does a foreign direct investment affect economic growth? Journal of International Economics 1998, 45, 115–135.
- Samargandi, N., A. Alghfais, M., & AlHuthail, H. M. Factors in Saudi FDI inflow. SAGE Open 2022, 12, 21582440211067242.
- Belloumi, M., & Alshehry, A. The impacts of domestic and foreign direct investments on economic growth in Saudi Arabia. Economies 2018, 6, 18.
- Elsadig, Musa A. Are the FDI inflow spillover effects on Malaysia's economic growth input-driven? Economic Modelling 2012, 29, 1498–504. [CrossRef]
- Moses, Ekperiware C. Oil and nonoil FDI and economic growth in Nigeria. Journal of Emerging Trends in Economics and Management Sciences 2011, 2, 333–43.
- Akinlo, A. Enisan. Foreign direct investment and economic growth in Nigeria: An empirical investigation. Journal of Policy Modeling 2004, 26, 627–39. [CrossRef]
- Eller, Markus, Peter R. Haiss, and Katharina Steiner. 2005. Foreign Direct Investment in the Financial Sector: The Growth Engine for Central and Eastern Europe? Europa Institute Working Paper No. 69. Vienna: Vienna University of Economics and Business Administration.
- Ridzuan, Abdul Rahim, Nor Asmat Ismail, and Abdul Fatah Che Hamat. Does Foreign Direct Investment Successfully Lead to Sustainable Development in Singapore? Economies 2017, 5, 29. [CrossRef]
- Omonkhanlen, Enisan A. Foreign direct investment and its effect on the Nigerian economy. Business Intelligence Journal 2011, 4, 253–61.
- Tintin, C. (2012). Does foreign direct investment spur economic growth and development? A comparative study. Paper presented at The 14th Annual European Trade Study Group Conference, Leuven, Belgium, September 13–15.
- Hussain, Mohammed E., & Mahfuzul Haque. Foreign Direct Investment, Trade, and Economic Growth: An Empirical Analysis of Bangladesh. Economies 2016, 4, 7.
- Choi, Yoon Jung, and Jungho Baek. Does FDI Really Matter to Economic Growth in India? Economies 2017, 5, 20. [CrossRef]
- Durham, J. Benson. Absorptive capacity and the effects of foreign direct investment and equity foreign portfolio investment on economic growth. European Economic Review 2004, 84, 285–306.
- Meschi, E. (2006). FDI and growth in MENA countries: An empirical analysis. Paper presented at The Fifth International Conference of the Middle East Economic Association, Sousse, Tunisia, March 10–12.
- Lensink, R., & Oliver Morrissey. Foreign Direct Investment: Flows, Volatility, and the Impact on Growth. Review of International Economics 2006, 14, 478–93.
- Adams, S. Foreign Direct investment, domestic investment, and economic growth in Sub-Saharan Africa. Journal of Policy Modeling 2009, 31, 939–49. [Google Scholar] [CrossRef]
- Bakari, S., Mabrouki, M., & Othmani, A. The six linkages between foreign direct investment, domestic investment, exports, imports, labour force and economic growth: new empirical and policy analysis from Nigeria. Journal of Smart Economic Growth 2018, 3, 25–43.
- Diacon, P. E., & Maha, L. G. The relationship between income, Consumption and GDP: A time series, cross-country analysis. Procedia Economics and Finance 2015, 23, 1535–1543. [CrossRef]
- Mishra, P. K. Dynamics of the relationship between real consumption expenditure and economic growth in India. Indian Journal of Economics & Business 2011, 10, 541–551. [Google Scholar]
- Foster, J. The US consumption function: a new perspective. J Evol Econ 31, 773–798 (2021). [CrossRef]
- Laidler DEW (2010). Lucas, Keynes, and the crisis. Journal of the History of Economic Thought (JHET) 32: pp. 39–62.
- Arthur WB (2014). Complexity and the economy. Cambridge University Press, Cambridge.
- El Quaoumi K, Le Masson P, Weil B, Un A. Testing the evolutionary theory of household consumption behaviour in the case of novelty – a product characteristics approach. J Evol Econ 2018, 28, 437–460.
- Francois, J. N. (2023). Habits, Rule-of-Thumb Consumption and Useful Public Consumption in Sub-Saharan Africa: Theory and New Evidence.
- Kim, H. S. Patterns of economic development: Correlations affecting economic growth and quality of life in 222 countries. Politics & Policy 2017, 45, 83–104. [Google Scholar]
- Mynaříková, L., & Pošta, V. The effect of consumer confidence and subjective well-being on consumers' spending behaviour. Journal of Happiness Studies 2023, 24, 429–453.
- Zhang, X., Wu, L., Zhang, R., Deng, S., Zhang, Y., Wu, J., ... & Wang, L. Evaluating the relationships among economic growth, energy consumption, air emissions and environmental protection investment in China. Renewable and Sustainable Energy Reviews 2013, 18, 259–270.
- Mohammed, M.; Abdel-Gadir, S. Unveiling the Environmental–Economic Nexus: Cointegration and Causality Analysis of Air Pollution and Growth in Oman. Sustainability 2023, 15, 16918. [Google Scholar] [CrossRef]
Figure 1.
Saudi Share of Consumption in GDP (2000 - 2022), (Unit: Million, Currency: Riyals) [4]. Source: Saudi Central Bank – statistical reports. Statistical Report (sama.gov.sa).
Figure 1.
Saudi Share of Consumption in GDP (2000 - 2022), (Unit: Million, Currency: Riyals) [4]. Source: Saudi Central Bank – statistical reports. Statistical Report (sama.gov.sa).
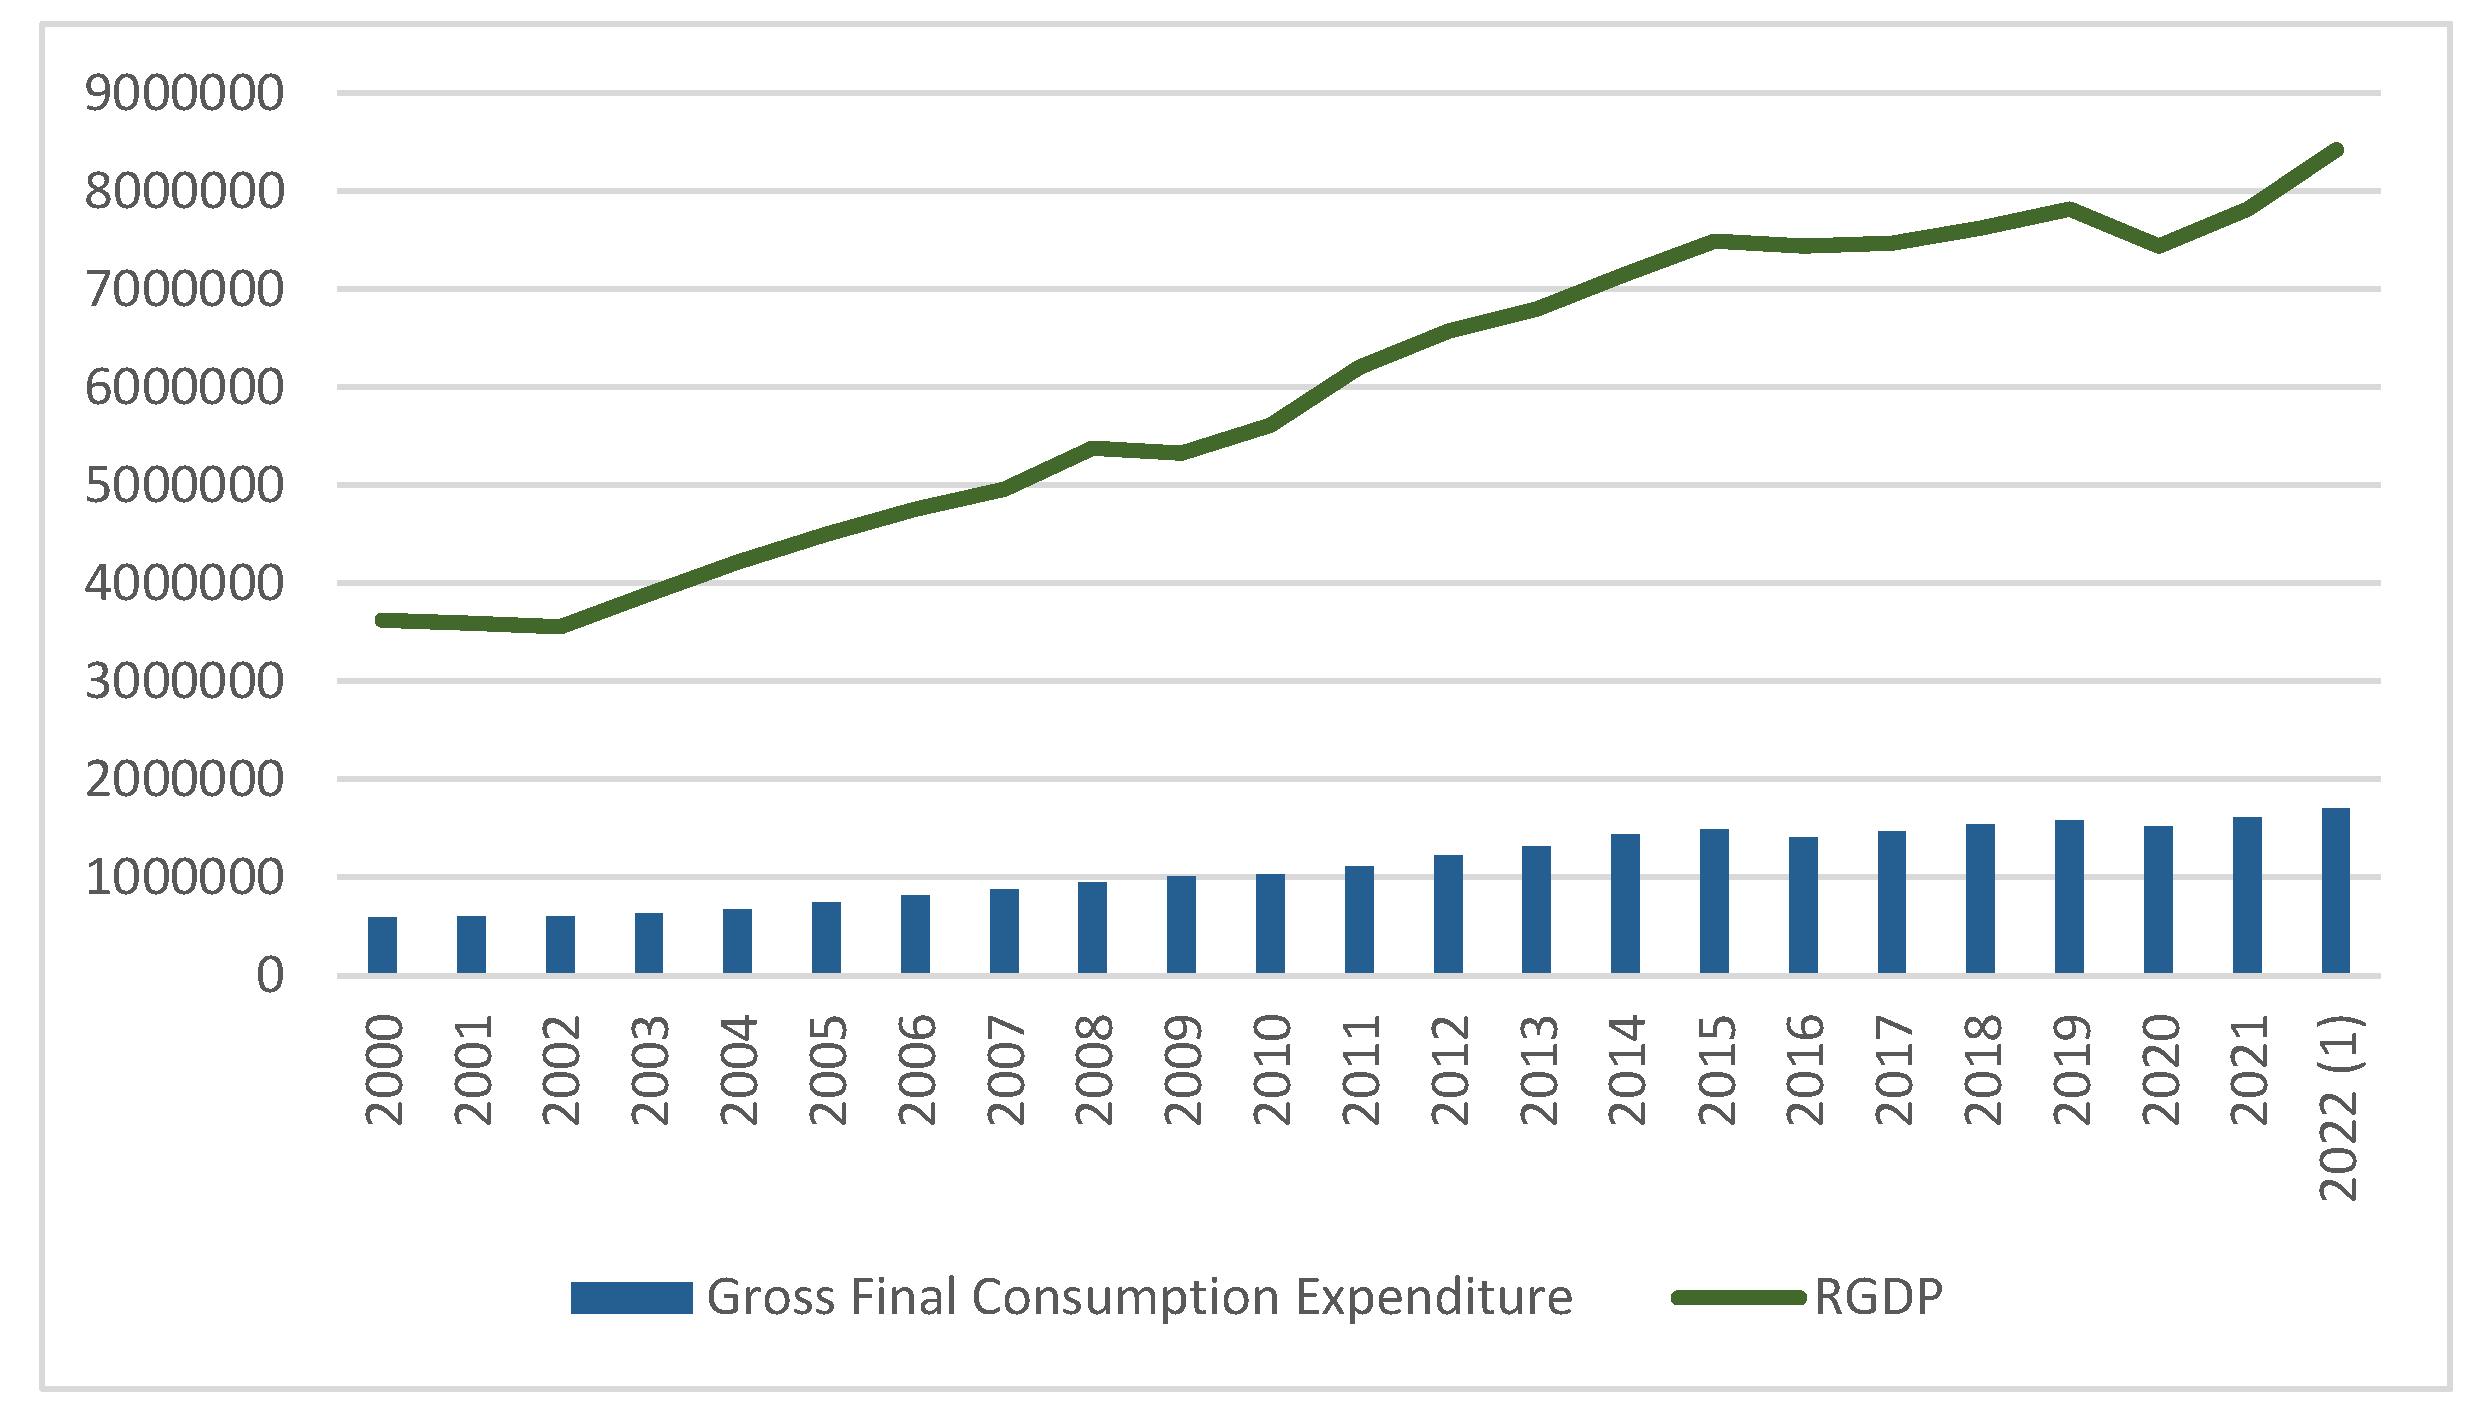
Table 2.
Descriptive Statistics of the Model Variables.
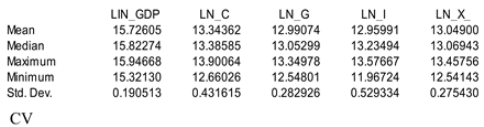 |
Table 3.
Correlation Matrix for the Model Variables.
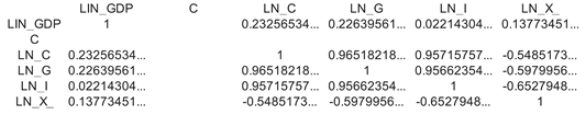 |
Table 4.
DOLS estimate of RGDP.
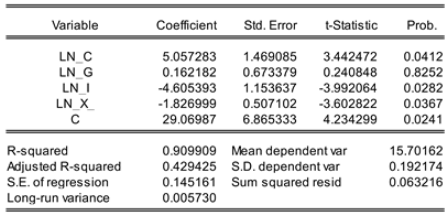 |
Table 6.
Criteria for Selecting VAR Lag Length.
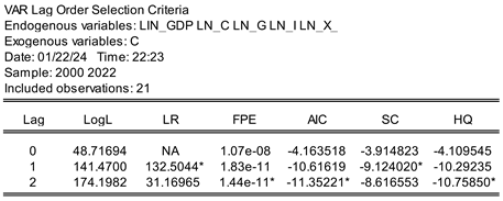 |
Table 7.
Johansen Cointegration Test: E-views 12 Output.
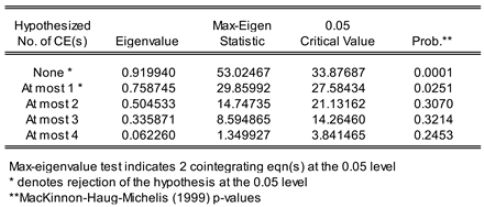 |
Table 8.
Short-run Error Correction Term.
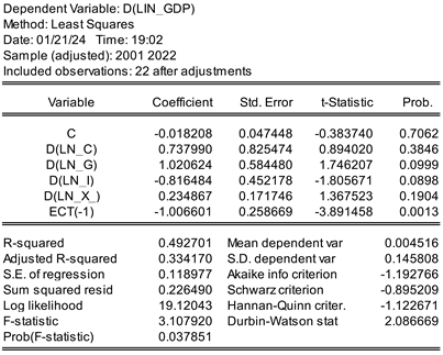 |
Table 9.
Error Correction Model (LONG RUN).
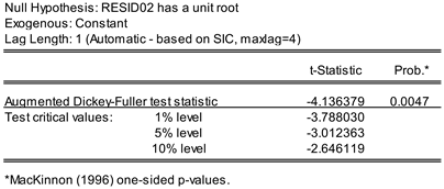 |
Table 10.
normalized cointegration Coefficient.
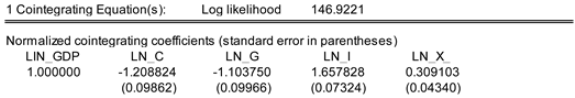 |
Table 11.
Granger Causality Tests.
 |
Disclaimer/Publisher’s Note: The statements, opinions and data contained in all publications are solely those of the individual author(s) and contributor(s) and not of MDPI and/or the editor(s). MDPI and/or the editor(s) disclaim responsibility for any injury to people or property resulting from any ideas, methods, instructions or products referred to in the content. |
© 2024 by the authors. Licensee MDPI, Basel, Switzerland. This article is an open access article distributed under the terms and conditions of the Creative Commons Attribution (CC BY) license (http://creativecommons.org/licenses/by/4.0/).
Copyright: This open access article is published under a Creative Commons CC BY 4.0 license, which permit the free download, distribution, and reuse, provided that the author and preprint are cited in any reuse.


