Submitted:
28 February 2024
Posted:
29 February 2024
You are already at the latest version
Abstract
Fluorescent bioprobes are invaluable tools for visualizing live cells and deciphering complex biological processes by targeting intracellular biomarkers without disrupting cellular functions. In addition to protein-binding concepts, fluorescent probes utilize various mechanisms, including membrane, metabolism, and gating-oriented strategies. This study introduces a novel fluorescent mechanism distinct from existing ways. Here, we developed a B-cell selective probe, CDrB, with unique transport mechanisms. Through SLC-CRISPRa screening, we identified two transporters, SLCO1B3 and SLC25A41, by sorting out populations exhibiting higher and lower fluorescence intensities, respectively, demonstrating contrasting activities. We confirmed that SLCO1B3, with comparable expression levels in T and B cells, facilitates the transport of CDrB into cells, while SLC25A41, overexpressed in T lymphocytes, actively exports CDrB. The observation suggests that SLC25A41 plays a crucial role in discriminating between T and B lymphocytes. Furthermore, it reveals the potential for reversible localization of SLC25A41 to demonstrate its distinct activity. This study is the first report to unveil a novel strategy of SLC by exporting the probe. We anticipate that this research will open up new avenues for developing fluorescent probes.
Keywords:
Fluorescent carbohydrate library
; High-throughput phenotypic screening
; Gating-Oriented Live-cell Distinction
; Solute carrier
; B cell specific probe
1. Introduction
Discriminating between cell types is a crucial step in understanding complex biological events. While antibodies are commonly used to differentiate cell types, their recognition is limited to surface markers. In contrast, fluorescent small molecules can easily penetrate cells without causing significant disruption and can detect intracellular biomarkers. Motivated by identification of the vast array of potential targets by using fluorescent chemicals, our group has established Diversity-Oriented Fluorescence Library (DOFL) to extend the scope of detection [1]. Through this initiative, we have made substantial contributions to the field, having developed over 30 bioprobes (Figure 1). Conventionally, fluorescent probe development focused on binding to proteins, a method we termed Protein-Oriented Live-cell Discrimination (POLD)[2,3]. Throughout the procedure, the protein-binding system encountered the limitations in explaining the journey of fluorescent molecules, particularly in the absence of protein partners[4]. As an alternative approach, we have shifted and expanded our perspectives to a novel strategy. We realized that some probes can target molecules outside of cells by staining carbohydrates (Carbohydrate-Oriented Live-cell distinction: COLD) [5,6] or membrane (Lipid-Oriented Live-cell Distinction: LOLD). The representative example of LOLD is CDgB, exhibiting selectivity to B over T cells based on membrane flexibility[7]. Furthermore, we found that other probes can serve as substrates for specific enzymes, acting as turn-on sensors. This mechanism, termed Metabolism-Oriented Live-cell Distinction (MOLD)[8,9], offers different perspectives. In addition to these mechanisms, we have explored a distinct strategy involving transporters that do not require specific partners inside the cells. Considering the wide range of substrates transferred by transporters, it would be plausible to consider them as potential gating partners for selective probes. Transporters are broadly classified into solute carrier (SLC) and ATP-Binding Cassette (ABC) families. SLC transporters primarily facilitate the uptake of small molecules into cells (pump in), while ABC transporters are responsible for exporting substrates to the extracellular space (pump out). Leveraging transporter-dependent mechanisms, we have developed several selective bioprobes [10,11,12,13,14,15], the mechanisms reliant on transporters uncovered have not fully encompassed all transporter pools yet.
This article presents a newly elucidated fluorescent strategy stands apart from the existing concepts. To identify this novel mechanism, we firstly screened compounds in murine spleen, leading to the elicitation of CDrB, which effectively distinguished B from T cells. Through SLC-CRISPRa screening, we identified a unique SLC transporter, SLC25A41 that can pump out CDrB, along with SLCO1B3, transporting CDrB into cells. In addition, we validated that SLC25A41 could be a biomarker for T lymphocytes compared to SLCO1B3 which is pervasive in both T and B cells. Moreover, we newly proposed that SLC25A41 could be reversibly located to properly expel its substrate.
2. Materials and Methods
Animal experiment
Our research complies with all relevant ethical guidelines. All animal experimental protocols were performed in compliance with the Guidelines for the Pohang University of Science and Technology (POSTECH) Animal Care and Use committee (Approval No. POSTECH-2023-0060). All the mice are maintained in the animal facility of Pohang University of Science and Technology (POSTECH) Biotech Center in accordance with the Institutional Animal Care and Use Committee of POSTECH. All the animal experiments were performed according to the recommended guidelines.
Lymphocyte preparation
Six to eight weeks old male wild-type C57BL/6 mice were purchased from Pohang University of Science and Technology. To acquire the murine lymphocytes spleen and bone marrow, tissues were firstly harvested and homogenized. Then, red blood cells were removed by using RBC lysis buffer (Thermo Fisher Scientific, Rockford IL, USA). After washing the sample, the cell pellet was resuspended in in RPMI1640 Medium (with 2.5 g/mL glucose, Gibco) containing 10% Heat-Inactivated Fetal Bovine Serum (Gibco) and 1% Penicillin Streptomycin (WELGENE).
Flow cytometry-based screening
The splenocytes were resuspended in the RPMI1640 Medium (with 2.5 g/mL glucose, Gibco) containing 10% Heat-Inactivated Fetal Bovine Serum (Gibco) and 1% Penicillin Streptomycin (WELGENE). Then splenocytes were seeded into 5 mL tubes (2x10⁵/tube) and incubated with library compounds at concentration of 1 uM. After 1 h, the samples were read by S3e cell sorter (Bio-Rad, S3e cell sorter, California, USA). All experimental procedure of flow cytometry and cell sorting was conducted by S3e cell sorter (Bio-Rad, California, USA). Data analysis was performed using flowJo software (BD, Franklin Lakes, NJ, USA). Lymphocytes were analyzed by FSC vs SSC gating.
Isolation of B cells and T cells
The single cells were collected from the spleen, and they were lysed by RBC lysis buffer (Thermo Fisher Scientific, Rockford IL, USA). The collected cells were then incubated with biotinylated monoclonal antibodies for 15 min at 4℃. To isolate B and T cells, Mouse B Lymphocyte Set-DM (BD Bioscience Co., Franklin Lakes, NJ, USA) and Mouse T Cell Enrichment Set-DM (BD Bioscience Co., Franklin Lakes, NJ, USA) were used respectively. The cells were washed with 1X BD IMag™ Buffer (10X buffer is diluted with deionized water, BD Bioscience Co., Franklin Lakes, NJ, USA) and then were centrifuged (1500 rpm, 5 min). Then, BD IMag™ Streptavidin Particle Plus – DM (BD Bioscience Co., Franklin Lakes, NJ, USA) were added to cells bearing biotinylated antibodies. After 30 min, the tube containing the labelled cell suspension was placed within the magnetic field of the BD IMagnet™ (BD Bioscience Co., Franklin Lakes, NJ, USA) with IMag buffer.
Generation of SLC-CRISPRa pools
CRISPR-SLCa pools were generated based on the previous method1. HeLa cells (ATCC® CCL-2TM) were transfected with dCas9-VPR and purified by using G418 antibiotic (Invitrogen, 500 ug/ml). Then dCas9-VPR HeLa cells were infected by lentiviral library plasmids to stably overexpress the 3800 sgRNA libraries, generating the SLC-CRISPRa pools. Then puromycin (2 μg/mL) was added to purify the transfected cells. To keep the heterogeneity of the SLC-CRISPRa pools, more than 1.52 × 10⁶ cells were seeded for further subculture.
FACS
SLC-CRISPRapools were incubated with CDrB (0.5 μM) for 30 min. Then Trypsin-EDTA (Welgene) was used when detaching the CRISPR-SLCa pools. For the screening, the live singlets of the cell population showing the 3% brightest/dimmest population for CRISPR-SLCa respectively were sorted out using S3e cell sorter (Bio-Rad, California, USA). The population of sorted cells were expanded by culturing for next round screening until the enrichment reached around 80%.
RT-PCR
The total RNA was extracted using RNeasy Mini Kit (QIAGEN Inc., 74106), and the amount and quality were measured by Nanodrop 2000 (Thermo Scientific). cDNA was synthesized with a High Capacity cDNA Reverse Transcription Kit (Applied Biosystems) according to the instruction. The qRT-PCR was carried out by TB Green™ Premix Ex Taq™ II (Tli RNaseH Plus) Kit (TaKaRa). The reactions were run on a qTOWER3 Real-time PCR system (Analytic Jena) with the following cycles: 10 min at 95°C, and 40 cycles of 15 s at 95°C and 1min at 55°C.The experiment was repeated three times individually. No data were excluded from the analyses. The data was collected by qPCRsoft 4.0 (analytic jena). The designed primers for human slc25a41 were: F-5’- CTGGAAGTGGATAACAAGGAGGC-3’ and R-5’-GGTGAAGTTCGTCTTGGAGGAG-3’; human slco1b3 were: F-5’-GGATGGACTTGTTGCAGTTG-3’ and R-5’-TTAGTTGGCAGCAGCATTGT-3’; human β-actin were: F-5’-GGATGCAGAAGGAGATCACTG-3’ and R-5’-CGATCCACACGGAGTACTTG-3’; mouse slc25a41 were F-5’-TGACTCTACGCAGAACTGGC-3’ and R-5’-GACCTTCATGAAGTTGGGGG-3’; mouse slco1b2 were F-5’-TGGAAGGCATAGGGTAGGCGGT-3’ and R-5’-TGGGCAGCTTTGCTTGGATGCT-3’; and mouse GAPDH were: F-5’- TGTCCGTCGTGGATCTGAC-3’ and R-5’- CCTGCTTCACCACCTTCTTG-3’.
Chemical materials and general methods for CDrB synthesis
All used compounds and solvents were purchased from Alfa Aesar (Haverhill, MA, USA), Sigma Aldrich (St. Louis, MO, USA), Combi-Blocks (San Diego, USA), TCI (Tokyo, Japan), and Samchun Chemicals (Seoul, Republic of Korea). All the chemicals were directly used without further purification. MERCK silica gel 60 (230-400 mesh, 0.040-0.063 mm) was used for normal-phase column chromatography. The optical properties were performed with SpectraMax M2e spectrophotometer (Molecular Devices) in 96 well plate (clear bottom) and QS high-precision cuvette. The relative fluorescence quantum yield method was selected, and sulforhodamine 101 (Φ = 0.9) was utilized as the standard. The quantum yield equation was calculated by equation (1). For analytical characterization of CDrB HPLC (Agilnet, 1260 series) with a DAD (diode array detector) and a single quadrupole mass spectrometer (Aglient, 6100 series, ESI) were used. Eluents (A: H2O with 0.1% formic acid (FA), B: MeCN with 0.1% FA) and Zorbax SB-C18 column (2.1 x 50 mm, 1.8 μm particle size, 80 Å pore size) were used. High-performance liquid chromatography (HPLC) was utilized on Prep. HPLC (Shimadzu) with a PDA detector with a C18(2) Luna column (5 μm, 250 mm × 21.2 mm, 100 Å). A gradient elution of 20% B to 65% B for 15 min, and then 65% B to 99% B for 52 min was used at flow rate of 15 mL/min (solvent A: H2O; B: MeOH). 1H and 13C NMR spectra were obtained from Brucker AVANCE III HD 850.
Φfi =(Fi/Fs)(f s/f i)(ni/ns)2•Φfs
Where Φfi and Φfs represented the fluorescence quantum yield of sample and standard, respectively. F represented the area under curve of the fluorescence spectrum (from 550 to 800 nm), n represented the refractive index of the solvent, and f represented the absorption factor (f = 1 – 10–A, where A represented the absorbance) at the excitation wavelength selected for sample and standard.
Synthesis of CDrB
The reaction followed the below procedure. 6-amino-6-deoxy-D-glucose (36.8 mg, 205.2 μmole), BODIPY fluorophore (30 mg, 64.8 μmole), HATU (78 mg, 205.2 μmole), DIEA (59.5 μL, 342 μmole) were dissolved in DMF (20 mL), stirring for 12 h, and the mixture was acidified with 1 M HCl, and extracted three times with DCM. The collected mixture was washed twice with brine, dried over Na2SO4, filtered, and concentrated in vacuo. The residue was prufied via silica gel chromatography using a gradient of MeOH:DCM=1:40 to 1:20 with 1% AcOH. Then High-performance liquid chromatography (HPLC) was utilized on Prep. HPLC (Shimadzu) with a PDA detector with a C18(2) Luna column (5 μm, 250 mm × 21.2 mm, 100 Å). A gradient elution of 20% B to 65% B for 15 min, and then 65% B to 99% B for 52 min was used at flow rate of 15 mL/min (solvent A: H2O; B: MeOH). After purification, purple solid was obtained (11.6 mg, 30%). 1H NMR (850 MHz, Methanol-d4) δ 7.55 (d, J = 8.1 Hz, 2H), 7.46 (d, J = 16.4 Hz, 2H), 7.34 (d, J = 16.4 Hz, 2H), 6.97 (d, J = 8.5 Hz, 2H), 6.85 (s, 1H), 6.18 (s, 1H), 5.11 (d, J = 2.89 Hz, H1α), 4.66-4.62 (m, H2α, H1β), 4.15 (s, 1H), 4.01 (s, 1H), 3.94 (s, 2H), 3.85 (s, 3H), 3.81 (s, 1H), 3.76 (s, 1H), 3.73 (s, 1H), 3.70 (s, 1H) , 3.69 (s, 1H), 3.63 (s, 1H), 3.59, 1H), 2.59-2.50 (m, 13H). 13C NMR (214 MHz, Methanol-d4) δ 173.57, 172.27, 160.72, 153.17, 152.65, 143.02, 140.98, 140.19, 135.85, 135.46, 131.24, 129.37, 128.44, 121.23, 117.91, 116.31, 114.04, 101.84, 75.19, 73.61, 72.58, 70.63, 66.47, 62.82, 62.02, 61.26, 54.44, 37.60, 36.40, 23.47, 22.83, 15.62, 15.55, 15.28. LC-MS (ESI) [M+Na]+, m/z calcd for C30H36BF2N3NaO7 622.2, found: 622.2.
3. Results
3.1. Eliciting B cell selective probe
We established a complex screening system using murine spleen to elicit a probe. Then, we made it as single cells of splenocytes, and incubated them with Luminescent-Carbohydrate (LC) library[10]. After 1 h, the stained cells were read by flow cytometry, and extracted numeric values from graphs were calculated by stain index equation (Figure 2A). The analyzed data was plotted in one-dimensional graph, and observed one compound that had the highest stain index among 80 compounds (Figure 2B, C). This molecule consisted of a glucose conjugated with a red fluorophore at 6-position, dubbed as CDrB (Compound Designation red B) (Figure 2D). To confirm the selectivity, splenocytes, composed of B cells (~70%) and T lymphocytes (~30%), were co-stained with CDrB after adding anti-CD3, T cell antibody (Figure 2E). The result revealed that CDrB strongly stained B lymphocytes possessing a higher stain index of 2.8 compared to a previously reported probe, CDgB (SI;1.25)[7]. To scrutinize the selectivity of CDrB independent of an environment, T and B lymphocytes were isolated by magnetic-activated cell sorting from murine spleens, respectively (Figure 2F). Then each cell population was incubated with CDrB for 1 h. It showed that CDrB brightly visualized B lymphocytes 3-fold more than T cells.
3.2. CDrB selective mechanism identification
Inspired by the selectivity, we carried out the SLC-CRISPRa system, overexpressing each individual SLC transporter. This library consisted of 10 single guide RNAs (sgRNAs) corresponding to 380 transporters, resulting in a total of 3,800 variants. After staining the library with CDrB, we iteratively sorted out 3-5% of the brighter populations until enrichment (Figure S1)[4]. Moreover, we picked out 3-5% of dimmer cell groups in a novel attempt (Figure S2), hypothesizing that they might offer new insights into SLC transporters. Clear shifts were observed compared to the unsorted pools in both sorting methodologies. Then, DNA sequences were analyzed using next generation sequencing (NGS). Surprisingly, we found enriched SLC targets, SLCO1B3 (99.9%) from the brighter sorting and SLC25A41 (94.3%) from the dimmer enrichment (Figure 3A).
3.3. CDrB selective mechanism validation
To verify if these transporters are indeed gating targets of CDrB, single cell cloning was conducted. After the process, clones exhibiting the highest expression levels of the target transporters were selected (Figure S3, S4). Then, CDrB stained slco1b3- and slc25a41-overexpressing clones confirmed that the results were consistent with the CRISPR screening data. The brightest signal was observed in slco1b3-cloned cells, while the slc25a41-overexpressing clone showed the dimmest intensity of CDrB compared to control cells (Figure 3B-3D). We further investigated whether these results could be extrapolated to the actual model of T and B lymphocytes. We firstly isolated T and B lymphocytes by magnetic-activated cell sorting (MACS) and assessed the expression levels of target transporters. Interestingly, slco1b3 expression did not display significant differences between B and T cells (Figure 3E), whereas slc25a41, a mitochondrial carrier, was predominantly expressed in T over B lymphocytes (Figure 3F). This result suggested that SLC25A41 could be a potential gate for CDrB to differentiate T and B lymphocytes. To ensure clarity, we confirmed that CDrB localized in mitochondria in control cells (SLC-CRISPRa pools). The outcome implies that CDrB firstly transports through SLCO1B3, a plasma membrane transporter, and ultimately reaches mitochondria, but CDrB can be exported when encountering SLC25A41 overexpressing cells, such as T lymphocytes.
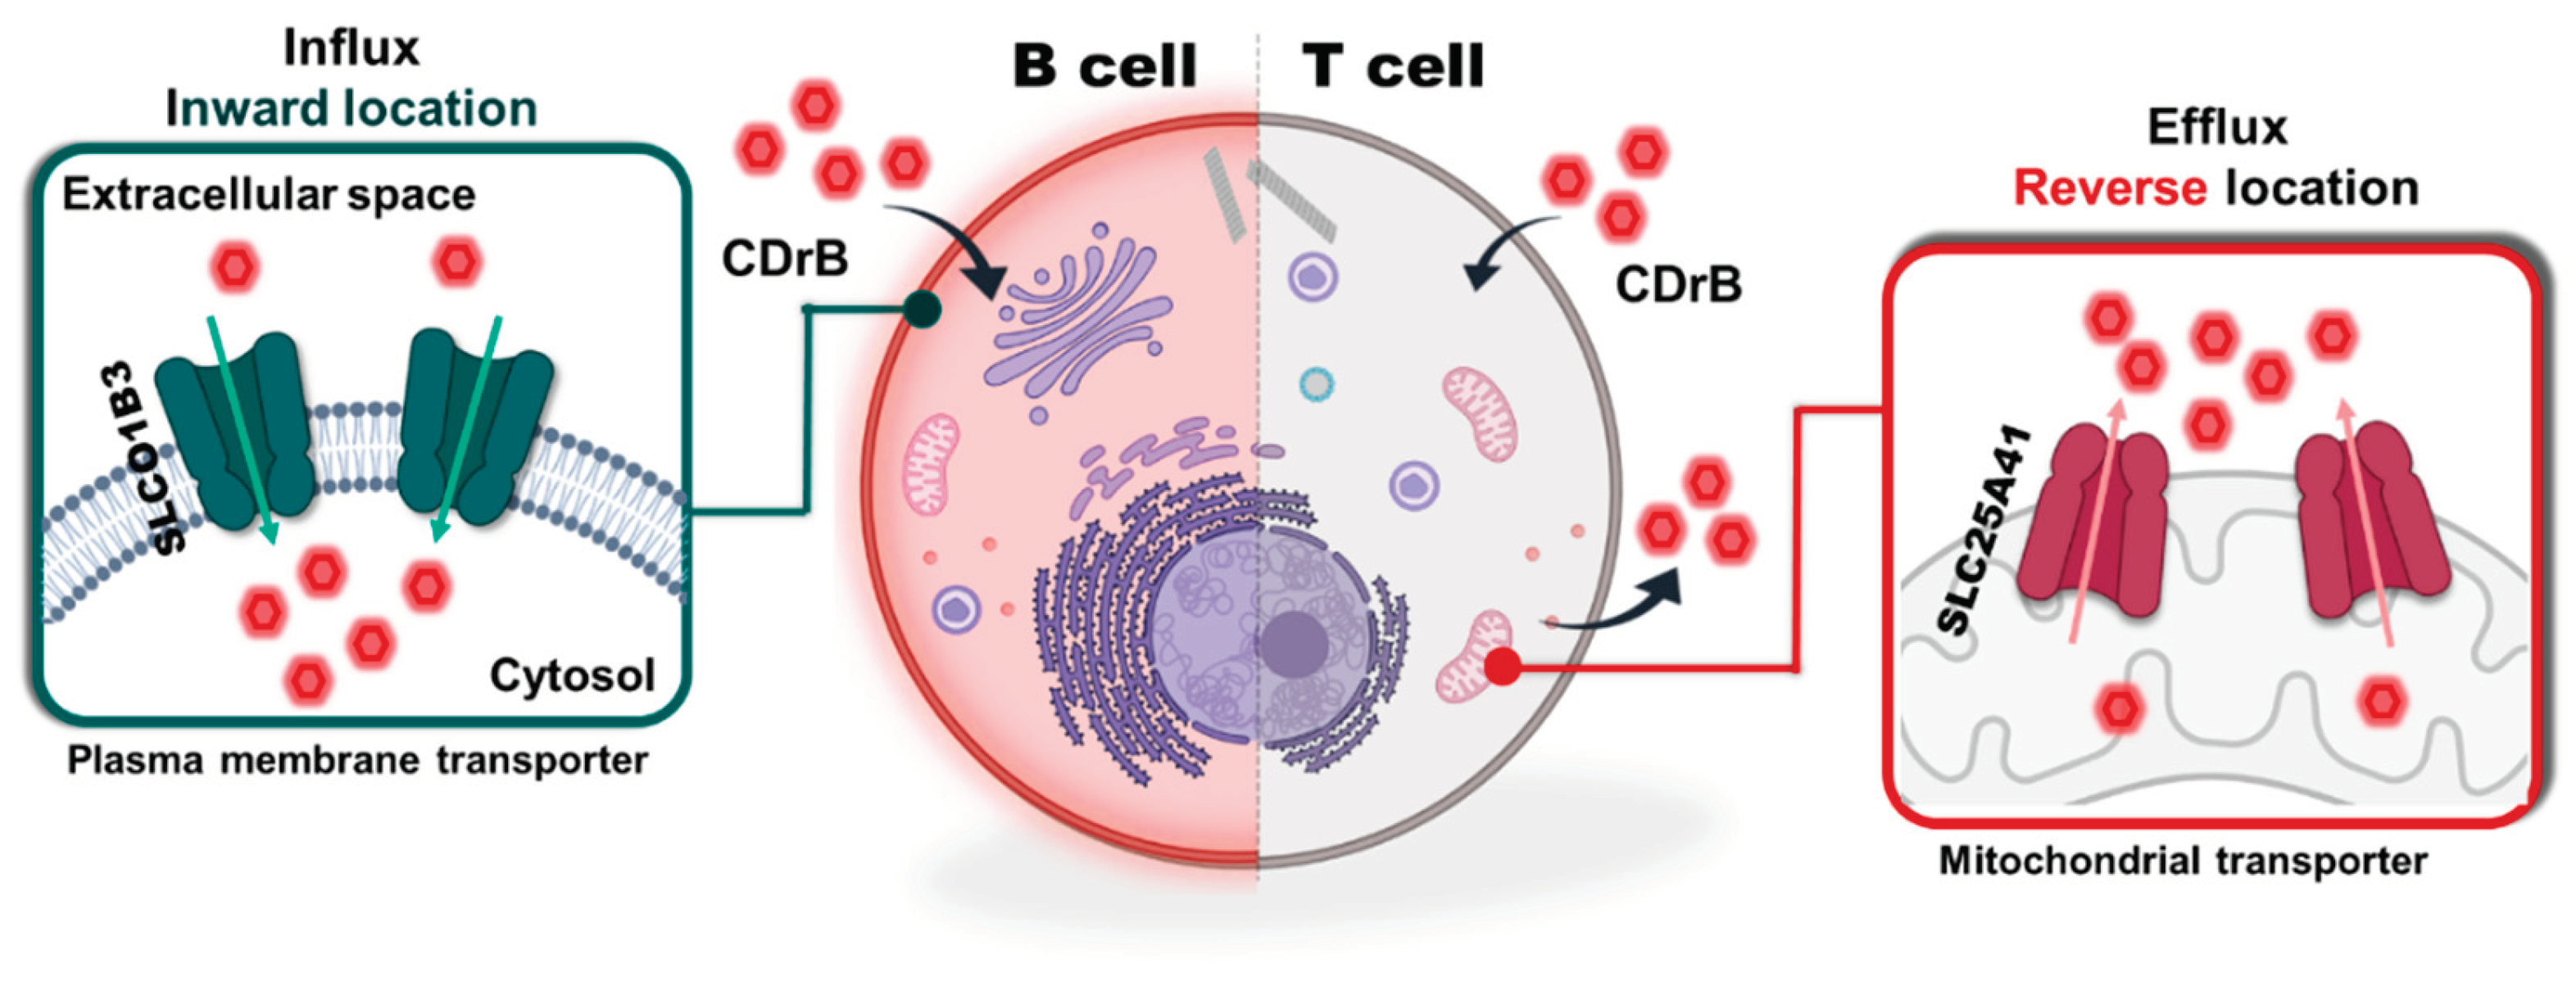
3.4. Proposed mechanism of CDrB
Through systematic screening of SLC-CRISPRa using two different approaches, we determined that CDrB could serve as a substrate for both SLCO1B3 and SLC25A41. In the case of SLCO1B3 overexpressing cells, CDrB was observed to accumulate within the cells (B cell), indicating that SLCO1B3 functions as an influx transporter with an inward location. However, cells highly expressing SLC25A41 (T cells), even those with SLCO1B3, showed a weak signal of CDrB, suggesting the export of CDrB with reversible localization, again termed as CDrB, Compound Designation reversible B (Figure 4). This mechanism represents a unique capability of SLC transporters to actively pump out their substrates with a reversible location. Moreover, CDrB identifies as a clear substrate that pumps out from SLC25A41, opening the door to in-depth exploration of Gating-Oriented Live-cell distinction strategy.
4. Discussion
In this study, we presented a novel strategy of B cell selective probe, CDrB. Using systematic SLC-CRISPRa screening, we identified two transporters, SLCO1B3 and SLC25A41, employing distinct approaches. SLCO1B3-overexpressing cells exhibited the brightest CDrB signal, while the intensity was weakest in SLC25A41-cloned cells. These findings suggested that SLCO1B3 facilitates CDrB transport into cells, whereas SLC25A41 actively exports CDrB. The contrasting activities suggest that SLC25A41 may reversibly locate to effectively pump out CDrB. This study represents the first report of SLC transporter expelling a fluorescent probe, with implications as a biomarker of T lymphocytes. We believe that this discovery provides new perspectives into the development of fluorescent probes.
Supplementary Materials
The following supporting information can be downloaded at the website of this paper posted on Preprints.org.
Author Contributions
Conceptualization, H.Cho and Y.-T.Chang.; Methodology, H.Cho and Y.-T.Chang.; Validatoin, H.Cho.; Investigation, H.Cho.; N.-K.Hong.; Writing, H.Cho. Y.-T.Chang.; Visualization, H.Cho.; N.-K.Hong.; Supervision, Y.-T.Chang.; Project Administration, Y.-T.Chang.; Funding Acquisition, Y.-T.Chang.
Funding
This research was supported by the Institute for Basic Science (IBS) (IBS-R007-A1 to Y.-T.C), Basic Science Research Institute Fund (2021R1A6A1A10042944 to Y.-T.C), and the National Research Foundation of Korea (NRF) grant funded by the Korea government (MSIT) (2023R1A2C300453411 to Y.-T. C). H.C. is grateful for financial support from Hyundai Motor Chung Mong-Koo foundation.
Institutional Review Board Statement
The animal study protocol was approved by the Pohang University of Science and Technology (POSTECH) (Approval No. POSTECH-2023-0060, approved on May, 12th, 2023).
Data Availability Statement
The data presented in this study are available on request from the first author (H.Cho).
Conflicts of Interest
The authors declare no conflicts of interest.
References
- Yun, S.W.; Kang, N.Y.; Park, S.J.; Ha, H.H.; Kim, Y.K.; Lee, J.S.; Chang, Y.T. Diversity oriented fluorescence library approach (DOFLA) for live cell imaging probe development. Acc Chem Res 2014, 47, 1277–1286. [Google Scholar] [CrossRef] [PubMed]
- Kim, J.J.; Lee, Y.A.; Su, D.; Lee, J.; Park, S.J.; Kim, B.; Jane Lee, J.H.; Liu, X.; Kim, S.S.; Bae, M.A.; et al. A Near-Infrared Probe Tracks and Treats Lung Tumor Initiating Cells by Targeting HMOX2. J Am Chem Soc 2019, 141, 14673–14686. [Google Scholar] [CrossRef] [PubMed]
- Lee, Y.A.; Kim, J.J.; Lee, J.; Lee, J.H.J.; Sahu, S.; Kwon, H.Y.; Park, S.J.; Jang, S.Y.; Lee, J.S.; Wang, Z.; et al. Identification of Tumor Initiating Cells with a Small-Molecule Fluorescent Probe by Using Vimentin as a Biomarker. Angew Chem Int Ed Engl 2018, 57, 2851–2854. [Google Scholar] [CrossRef] [PubMed]
- Park, S.J.; Kim, B.; Choi, S.; Balasubramaniam, S.; Lee, S.C.; Lee, J.Y.; Kim, H.S.; Kim, J.Y.; Kim, J.J.; Lee, Y.A.; et al. Imaging inflammation using an activated macrophage probe with Slc18b1 as the activation-selective gating target. Nat Commun 2019, 10, 1111. [Google Scholar] [CrossRef] [PubMed]
- Kwon, H.Y.; Liu, X.; Choi, E.G.; Lee, J.Y.; Choi, S.Y.; Kim, J.Y.; Wang, L.; Park, S.J.; Kim, B.; Lee, Y.A.; et al. Development of a Universal Fluorescent Probe for Gram-Positive Bacteria. Angew Chem Int Ed Engl 2019, 58, 8426–8431. [Google Scholar] [CrossRef] [PubMed]
- Lee, S.C.; Kang, N.Y.; Park, S.J.; Yun, S.W.; Chandran, Y.; Chang, Y.T. Development of a fluorescent chalcone library and its application in the discovery of a mouse embryonic stem cell probe. Chem Commun (Camb) 2012, 48, 6681–6683. [Google Scholar] [CrossRef] [PubMed]
- Kwon, H.Y.; Kumar Das, R.; Jung, G.T.; Lee, H.G.; Lee, S.H.; Berry, S.N.; Tan, J.K.S.; Park, S.; Yang, J.S.; Park, S.; et al. Lipid-Oriented Live-Cell Distinction of B and T Lymphocytes. J Am Chem Soc 2021, 143, 5836–5844. [Google Scholar] [CrossRef] [PubMed]
- Kim, B.; Fukuda, M.; Lee, J.Y.; Su, D.; Sanu, S.; Silvin, A.; Khoo, A.T.T.; Kwon, T.; Liu, X.; Chi, W.; et al. Visualizing Microglia with a Fluorescence Turn-On Ugt1a7c Substrate. Angew Chem Int Ed Engl 2019, 58, 7972–7976. [Google Scholar] [CrossRef] [PubMed]
- Gao, M.; Lee, S.H.; Park, S.H.; Ciaramicoli, L.M.; Kwon, H.Y.; Cho, H.; Jeong, J.; Chang, Y.T. Neutrophil-Selective Fluorescent Probe Development through Metabolism-Oriented Live-Cell Distinction. Angew Chem Int Ed Engl 2021, 60, 23743–23749. [Google Scholar] [CrossRef] [PubMed]
- Cho, H.; Kwon, H.Y.; Sharma, A.; Lee, S.H.; Liu, X.; Miyamoto, N.; Kim, J.J.; Im, S.H.; Kang, N.Y.; Chang, Y.T. Visualizing inflammation with an M1 macrophage selective probe via GLUT1 as the gating target. Nat Commun 2022, 13, 5974. [Google Scholar] [CrossRef] [PubMed]
- Cho, H.; Kwon, H.Y.; Lee, S.H.; Lee, H.G.; Kang, N.Y.; Chang, Y.T. Development of a Fluorescent Probe for M2 Macrophages via Gating-Oriented Live-Cell Distinction. J Am Chem Soc 2023, 145, 2951–2957. [Google Scholar] [CrossRef] [PubMed]
- Gao, M.; Lee, S.H.; Das, R.K.; Kwon, H.Y.; Kim, H.S.; Chang, Y.T. A SLC35C2 Transporter-Targeting Fluorescent Probe for the Selective Detection of B Lymphocytes Identified by SLC-CRISPRi and Unbiased Fluorescence Library Screening. Angew Chem Int Ed Engl 2022, 61, e202202095. [Google Scholar] [CrossRef] [PubMed]
- Miyamoto, N.; Go, Y.H.; Ciaramicoli, L.M.; Kwon, H.Y.; Kim, H.S.; Bi, X.; Yu, Y.H.; Kim, B.; Ha, H.H.; Kang, N.Y.; et al. Target identification of mouse stem cell probe CDy1 as ALDH2 and Abcb1b through live-cell affinity-matrix and ABC CRISPRa library. RSC Chem Biol 2021, 2, 1590–1593. [Google Scholar] [CrossRef] [PubMed]
- Kim, B.; Feng, S.; Yun, S.W.; Leong, C.; Satapathy, R.; Wan, S.Y.; Chang, Y.T. A Fluorescent Probe for Neural Stem/Progenitor Cells with High Differentiation Capability into Neurons. Chembiochem 2016, 17, 2118–2122. [Google Scholar] [CrossRef] [PubMed]
- Hirata, N.; Nakagawa, M.; Fujibayashi, Y.; Yamauchi, K.; Murata, A.; Minami, I.; Tomioka, M.; Kondo, T.; Kuo, T.F.; Endo, H.; et al. A chemical probe that labels human pluripotent stem cells. Cell Rep 2014, 6, 1165–1174. [Google Scholar] [CrossRef] [PubMed]
Figure 1.
The selective staining mechanism of fluorescent probes. Fluorescent probes broadly have five strategies. Protein-Oriented Live-cell Distinction (POLD); Carbohydrate-Oriented Live-cell Distinction (COLD); Lipid-Oriented Live-cell Distinction (LOLD); Metabolism-Oriented Live-cell Distinction (MOLD); Gating-Oriented Live-cell Distinction (GOLD). This figure is created with BioRender.com.
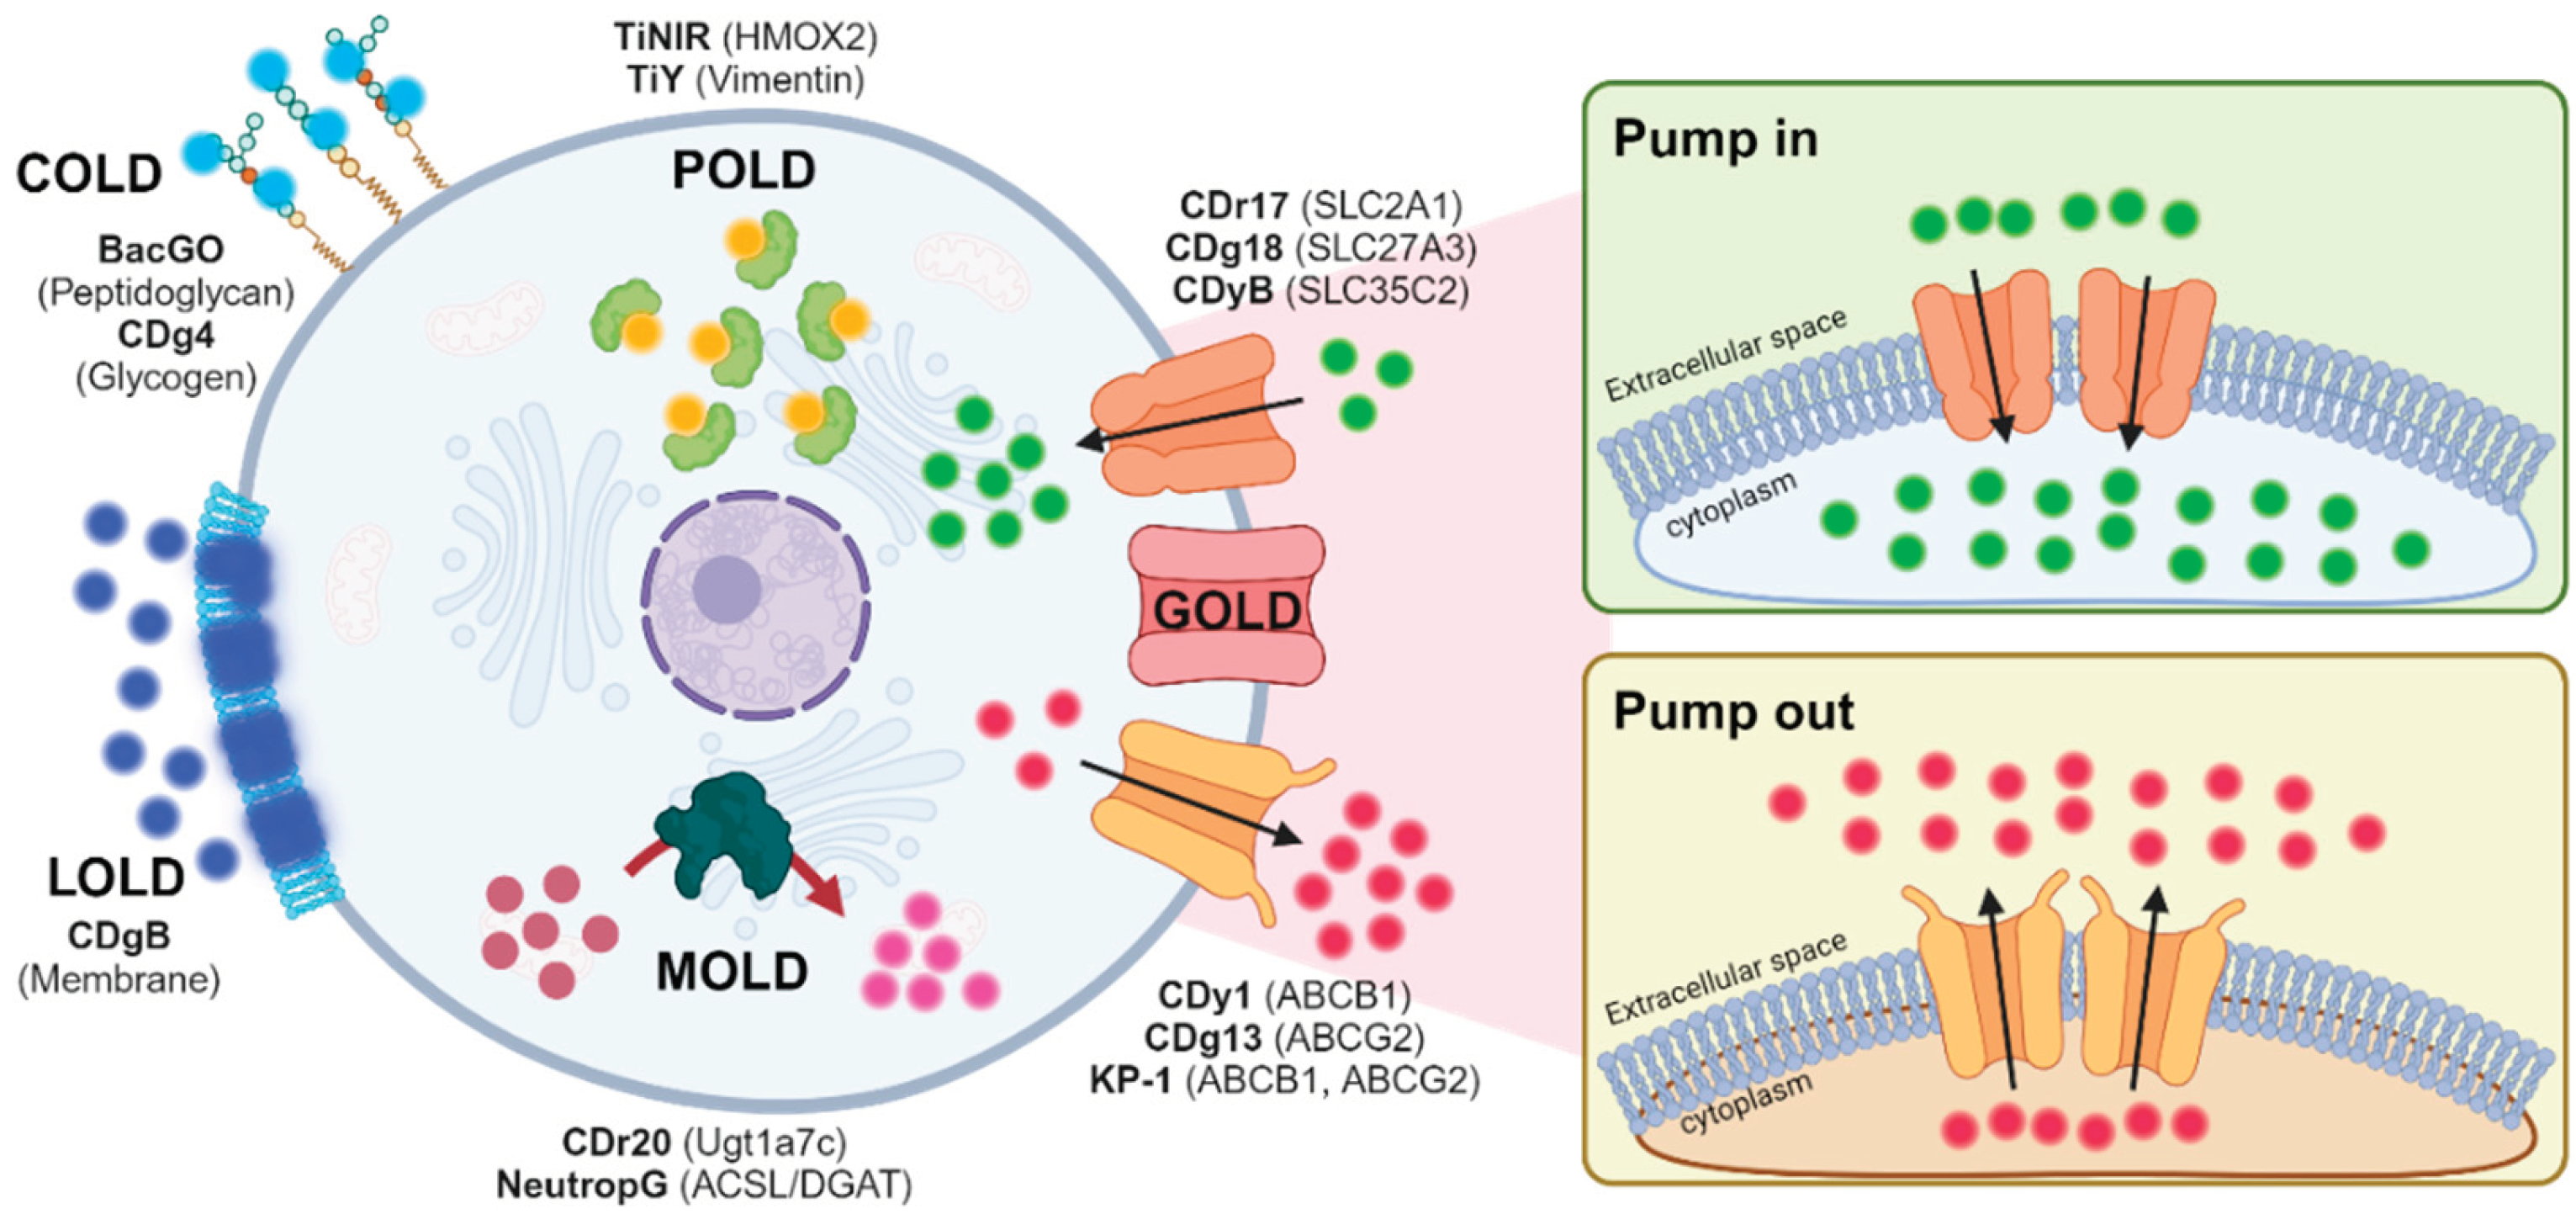
Figure 2.
Development of B cell selective probe. A) The schematic view of flow cytometry-based screening. B) The analyzed results. C) CDrB structure. D) T cell antibody (CD3) showed negative correlation with CDrB signal. E, F) The isolated T and B lymphocytes from murine spleen incubated with CDrB, and it showed B cell selectivity. Figure 2A iscreated with BioRender.com.
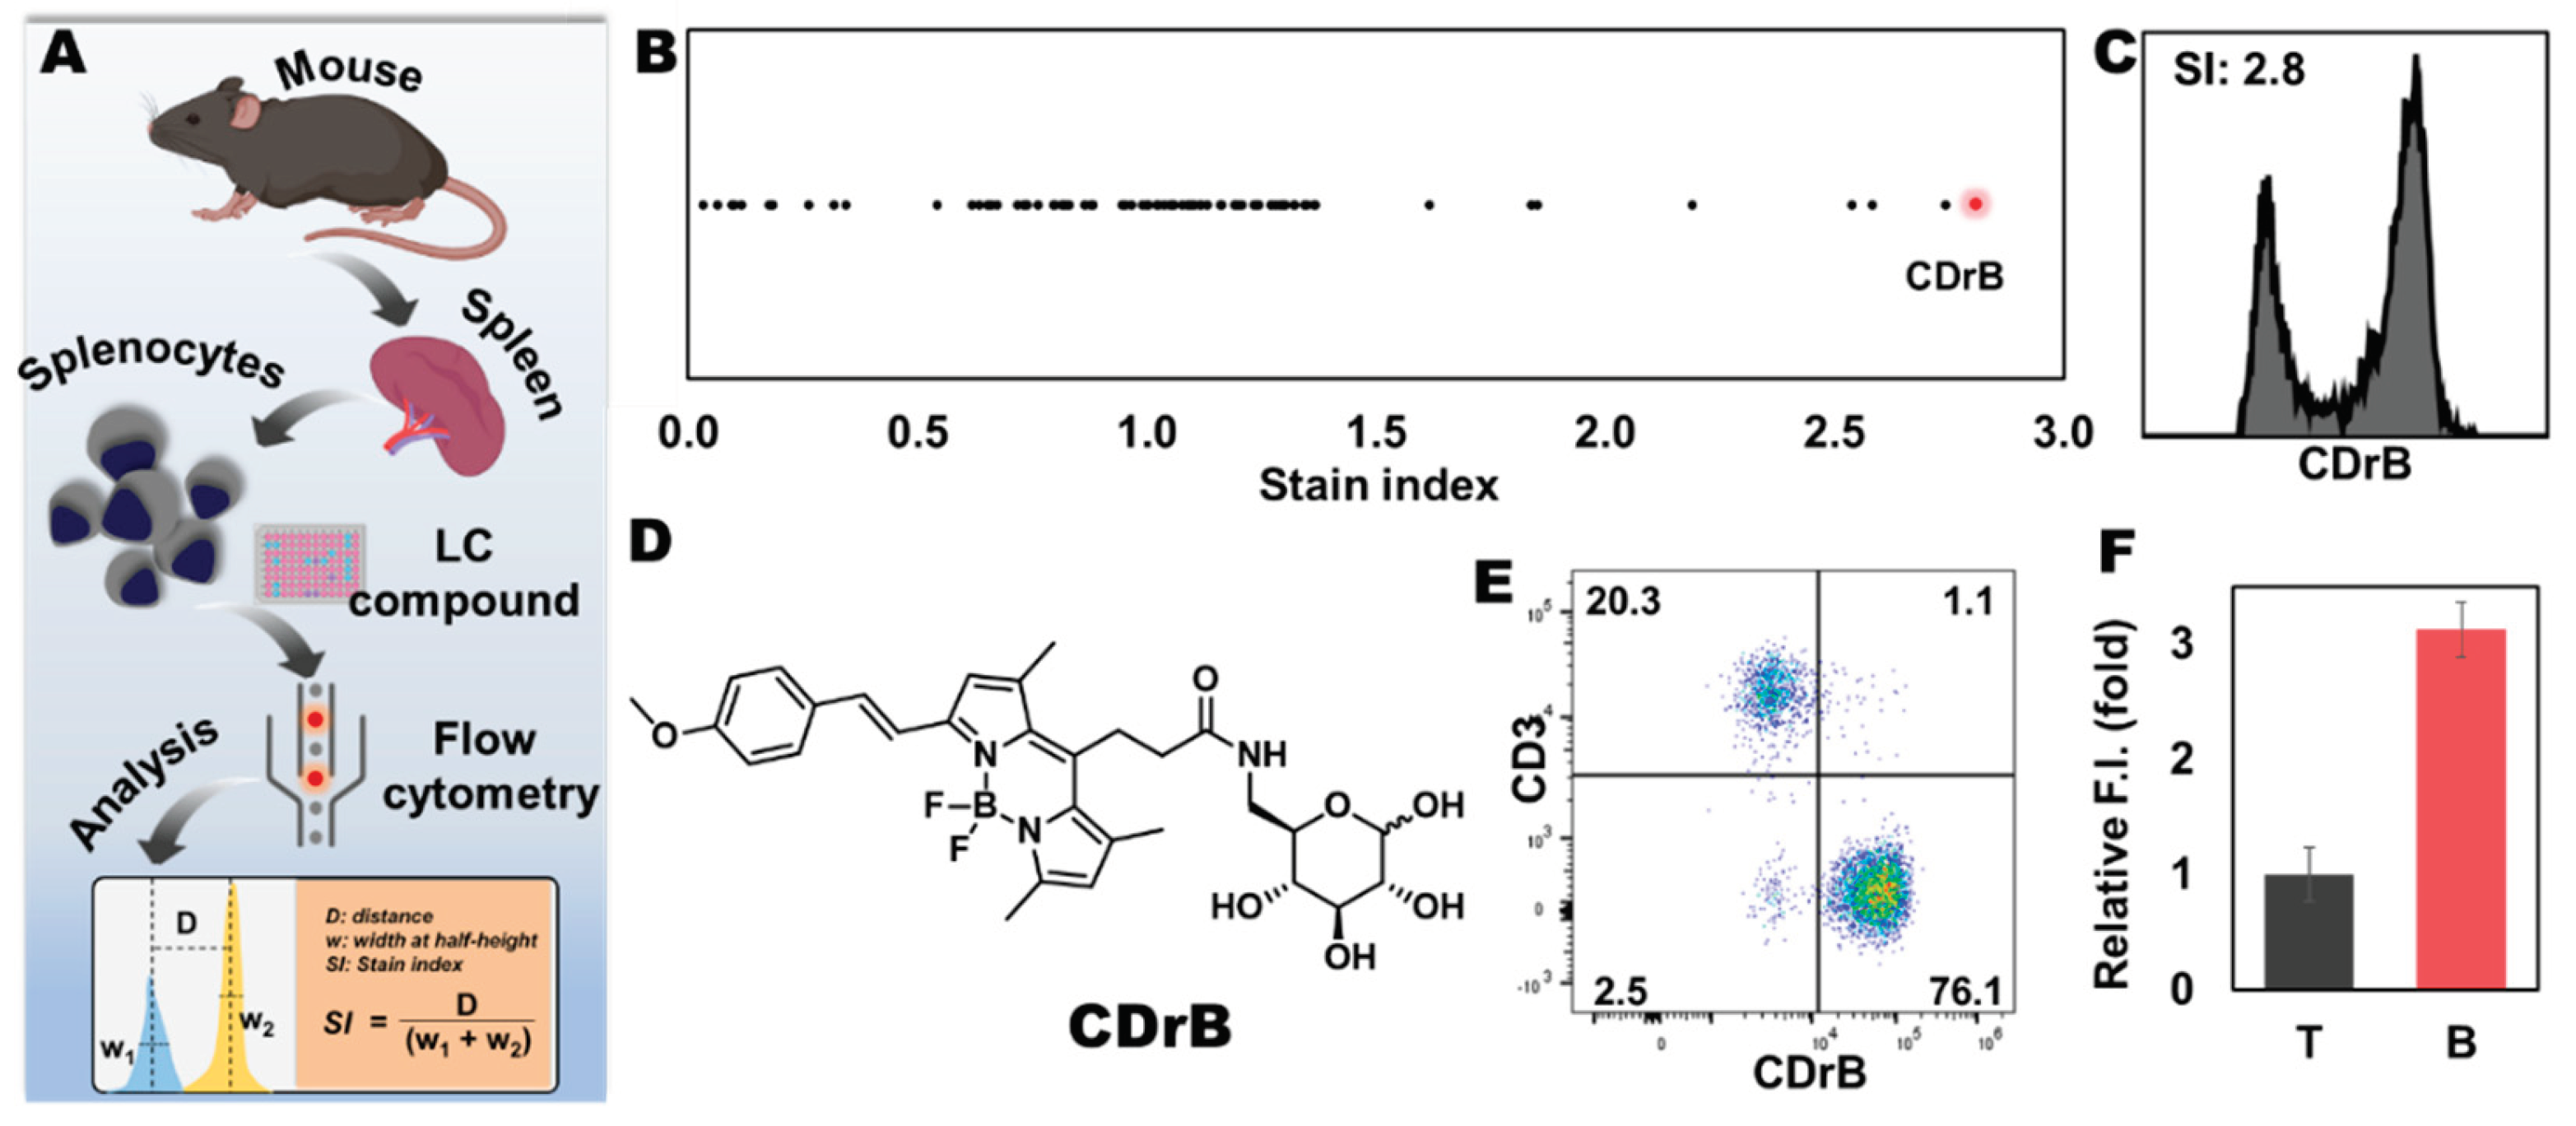
Figure 3.
Transporter identification and validation through CRISPRa-SLC screening. A) The schematic process of CRISPRa-SLC screening. B) Fluorescent images from cloned cells stained by CDrB. mRNA expression levels of target transporters in cloned cells: C) slco1b3 and D) slc25a41. The expression levels of candidate transporters in isolated T and B cells: E) slco1b3 and F) slc25a41. Figure 3A is creaed with BioRender.com.
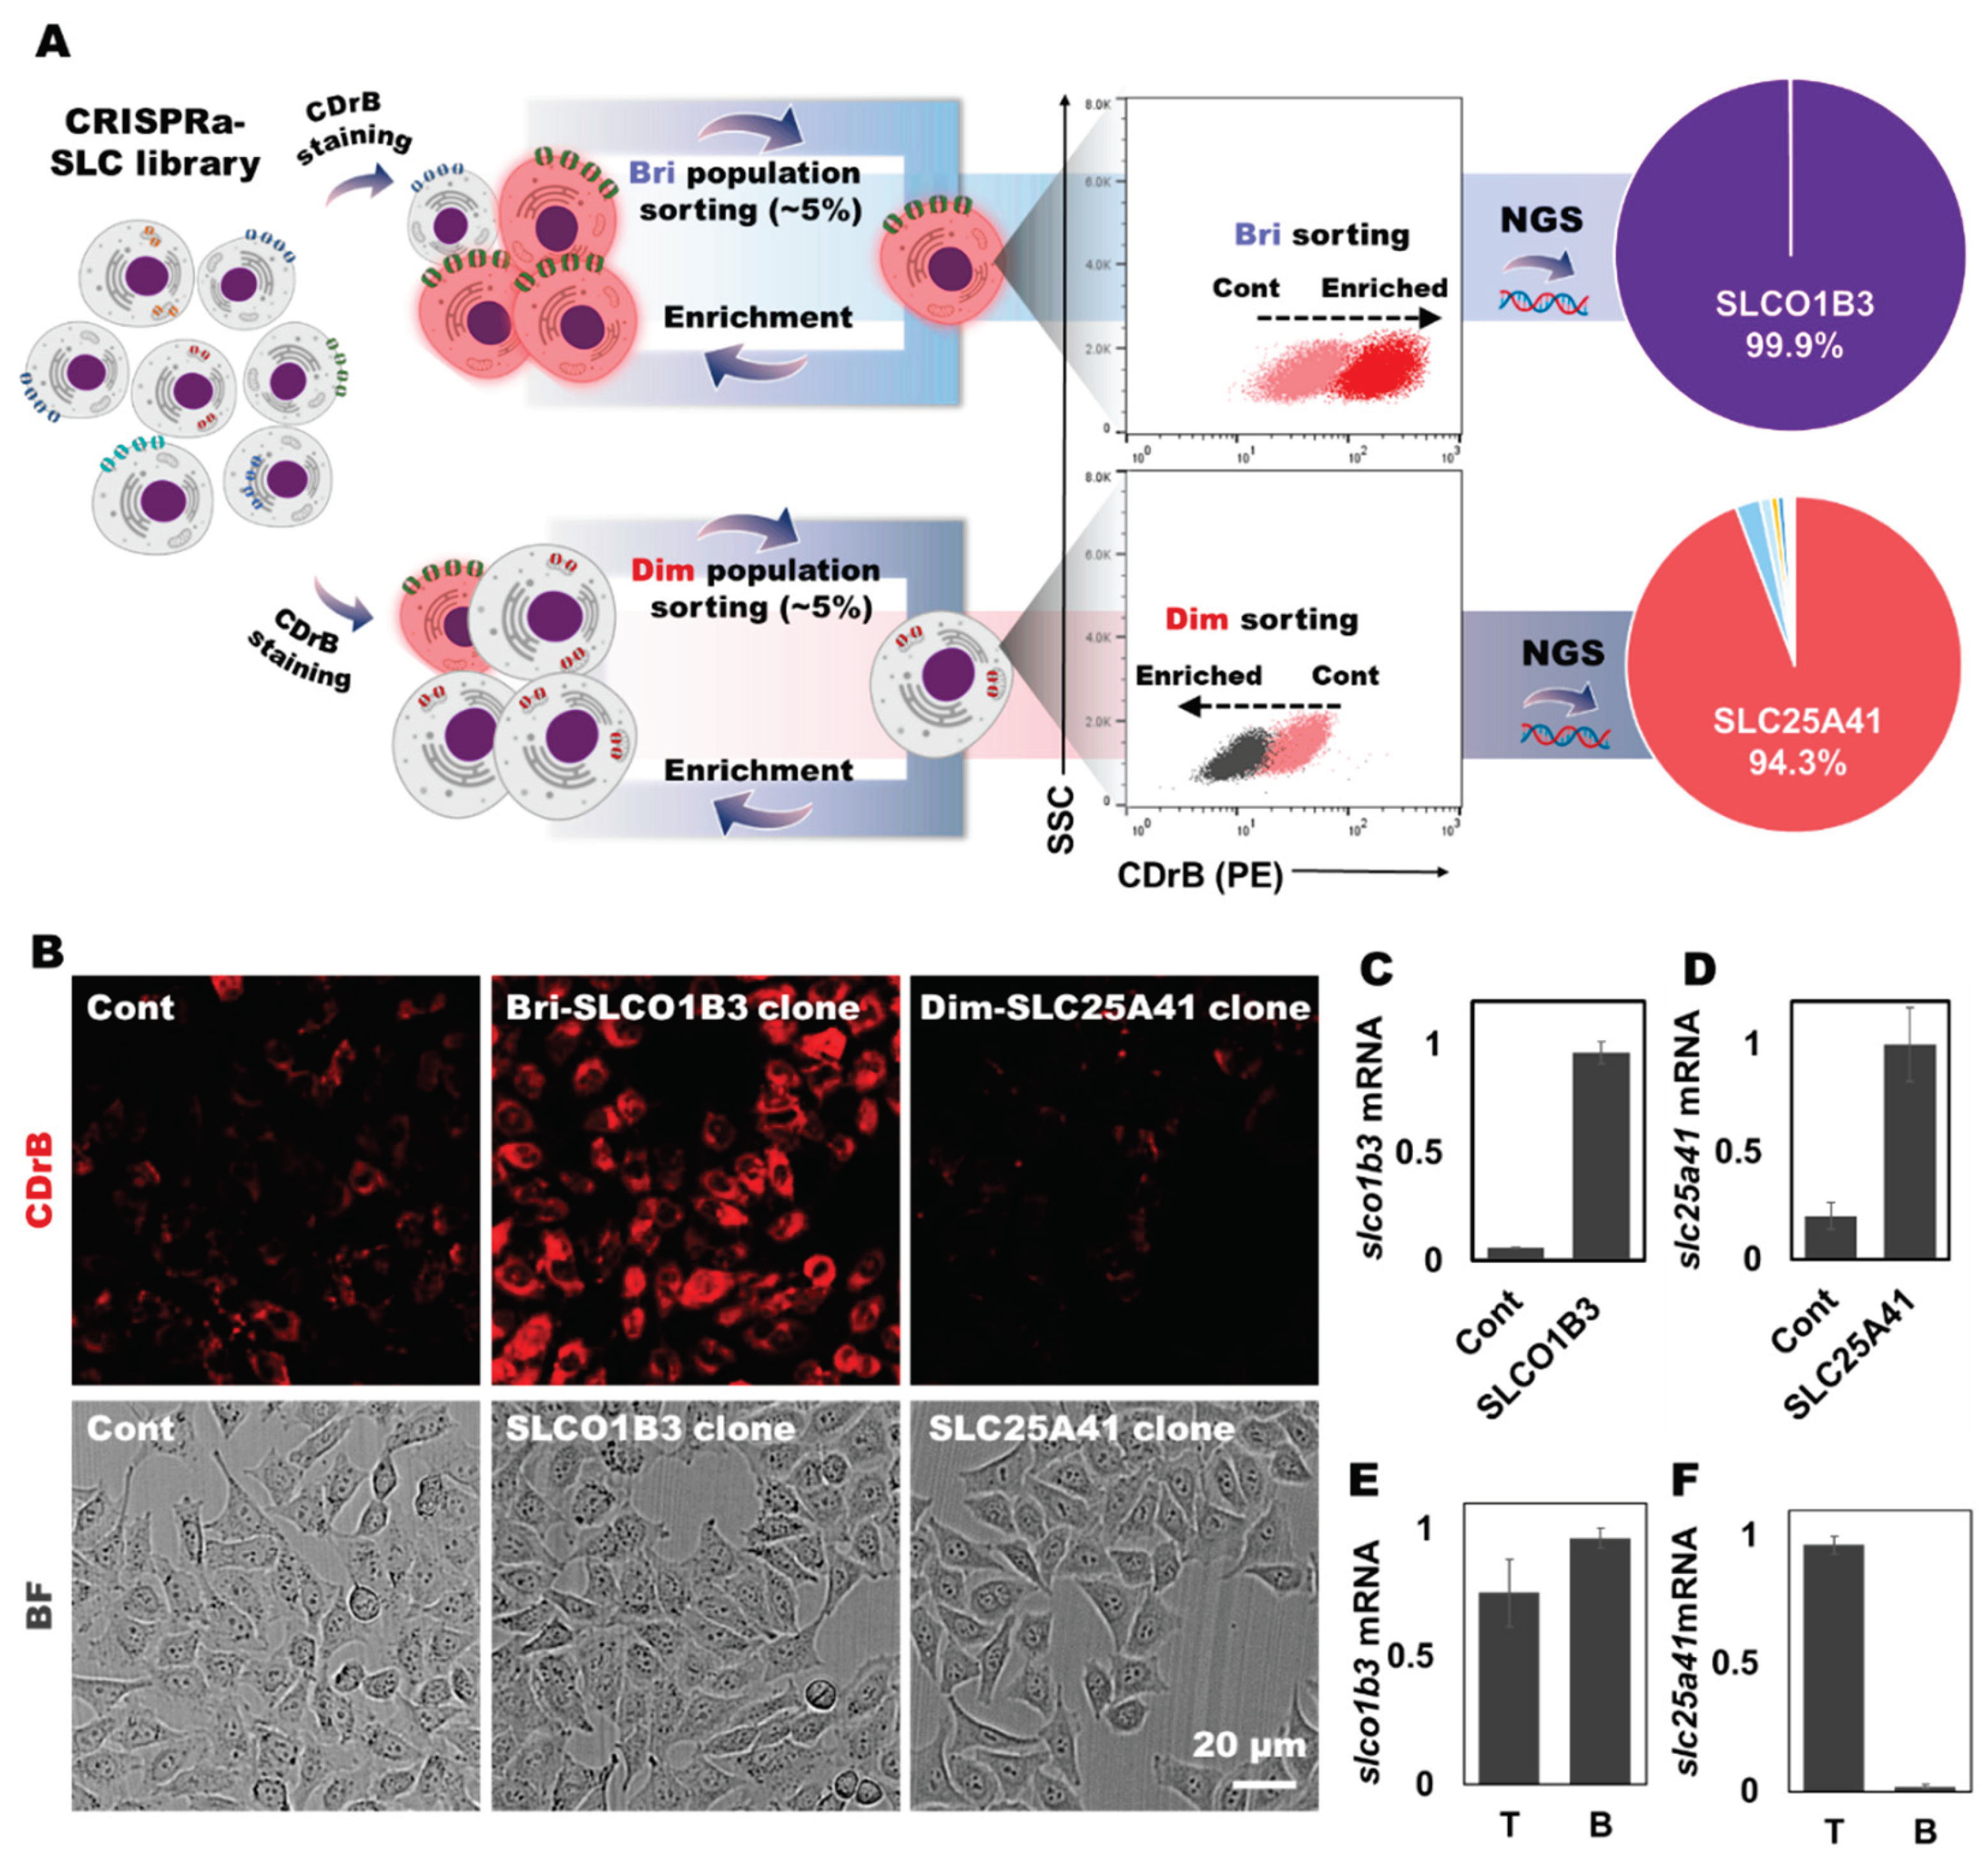
Figure 4.
Proposed mechanism of CDrB. SLCO1B3 helps CDrB to uptake from both T and B cells, but it pumps out by SLC25A41 which is overexpressed in T lymphocytes compared to B cells. This image is created with BioRender.com.
Figure 4.
Proposed mechanism of CDrB. SLCO1B3 helps CDrB to uptake from both T and B cells, but it pumps out by SLC25A41 which is overexpressed in T lymphocytes compared to B cells. This image is created with BioRender.com.
Disclaimer/Publisher’s Note: The statements, opinions and data contained in all publications are solely those of the individual author(s) and contributor(s) and not of MDPI and/or the editor(s). MDPI and/or the editor(s) disclaim responsibility for any injury to people or property resulting from any ideas, methods, instructions or products referred to in the content. |
© 2024 by the authors. Licensee MDPI, Basel, Switzerland. This article is an open access article distributed under the terms and conditions of the Creative Commons Attribution (CC BY) license (http://creativecommons.org/licenses/by/4.0/).
Copyright: This open access article is published under a Creative Commons CC BY 4.0 license, which permit the free download, distribution, and reuse, provided that the author and preprint are cited in any reuse.


