Submitted:
23 February 2024
Posted:
23 February 2024
You are already at the latest version
Abstract
As data driven models gain importance in driving decisions and processes, recently it becomes increasingly important to visualize the data with both speed and accuracy. A massive amount of data is presently generated in the educational sphere from various learning platforms, tools, and institutions. Visual analytics of educational big data has capability to improve student learning, develop strategies for personalized learning, and improve faculty productivity. How-ever, there are limited advancements in the education domain for data-driven decision making leveraging the recent advancements in the field of machine learning. Some of the recent tools such as Tableau, Power BI, Microsoft Azure suite, Sisense etc. leverage artificial intelligence and machine learning techniques to visualize data and generate insights out of it, however their ap-plicability in educational advances is limited. This paper focuses on leveraging machine learn-ing and visualization techniques to demonstrate their utility through a practical implementation using k-12 state assessment data compiled from the institutional websites of the State of Texas and Louisiana. Effective modeling and predictive analytics are the focus of the sample use case presented in this research. Our approach demonstrates the applicability of web technology in conjunction with machine learning to provide a cost-effective and timely solution to visualize and analyze big educational data. Additionally, ad-hoc visualization provides contextual anal-ysis within areas of concern for Education Agencies (EA).
Keywords:
Data Visualization
; Big Data
; AI
; Machine Learning
1. Introduction
Information processing and dissemination is a primary resource valuable to any organization. The average person processes sensory data or stimuli as images. Humans process images better than any other stimulus. When data comes into the brain, the first inclination is to turn it into an image or relate it to some visual experience that the person is familiar with. For example, audio stimuli such as music or screams. Immediately on reception, a person will either associate imagery related to how that stimuli makes them feel or their personal assumption as to what is occurring during the event. Therefore, it is a viable assumption that turning data into visualizations would have an impact in processing that data [1].
Data driven decision making has become increasingly popular for action-based strategic planning. An organizational body or institution will use it to derive milestones for goals, adjust operations, or provide proof of concept for proposed action plans. The education field is no exception [2]. More and more entities are making usage of data in ways other than the educational outcome of learning how to derive or visualize data. However, there is still a gap in the actualization and usage in several areas; namely: data delivery, predictive analysis, visualization, and machine learning [3]. In this paper, we will demonstrate feasibility of actualizing these areas and improving on its implementation for use in education.
While investigating the available, ready to deploy or easy to use solutions that make use of visualization or machine learning, we found a significant lack of web capable or web ready solutions for k-12 school use. Although the data was available in the readable format on the web, there was a notable lack of understandable and actionable visualization, predictive analytics and functional use. Thus, there is significant need of a cost-effective and timely solution to visualize and analyze big educational data.
The major goal of this paper is to leverage the data visualization and machine learning techniques to address the challenges in the educational data analytics and demonstrate the utility, versatility and usefulness of these techniques through a practical implementation of reading grade level data in k-12 education compiled from the institutional websites of the State of Texas and Louisiana. To meet the major objective, the project has several subobjectives as shown below:
- Goal #1: To quantify data factors in the data set and separate into events, outcomes, and points of interest.
- Goal #2: To showcase visualization of the results derived from Goal #1
- Goal #3: To help explain how to build knowledge and data using visualization.
- Goal #4: To leverage ML models to showcase the utility in the educational data.
- Goal #5: To understand the intent of usage of the data and impact.
2. Related Work
In recent years, data is considered as a viable means of evaluating school’s effectiveness [4,5]. However, most of the existing data that an agency uses focuses on individual schools and has not tried to leverage the widely available data from all institutions within the agency’s governing body sphere of jurisdiction [3]. Even within individual local organizations, they are primarily focused on the overall comparison against the standard set by the governing agency and possibly a few similar competitors [6].
We have reviewed literature related to machine learning (ML), modeling, visualization, education, and data collection to understand the state-of-the-art technologies, dataset and research in education domain. The relevant knowledge helped us to understand some of the challenges in data access [7,8], approaches to personalized metrics [9], and identifying certain technologies suitable for the desired outcomes of this research [10]. Since visualization and ML is the underlying foundation of this work, these papers act as a baseline for prior work, gap analysis and foundational theory.
Existing literature on data-driven decision-making act as a knowledge bank for educational institutions to support academic enhancement, resource allocation, or the strategic plan to increase enrollment [11]. Among these, a heavy focus in allowing the data to dictate which operational objectives are critical to the response matrices the institutions present. However, there is still a gap in the means or methods of disseminating data in a technologically innovative manner. The norm of any investigative report or analysis that return as a product outcome is either multiple versions of spreadsheets or tables for displaying the results. For administrative purposes charts, graphs or heatmaps can act as a good visualization tool to understand the data insights.
Uyan Dur [12] discussed the importance of data visualization and infographics to communicate the complex ideas and concepts in a simpler, comprehensive, and creative manner and its utility in current education system. To efficiently share information, it's crucial to assess the conditions under which visualizations might be needed and determine the most fitting design. The reviewed literature for this paper confirms that when applied to practical use cases, the utilization of visualization can contribute to achieving desired outcomes in the field of education.
Recently Rui and Badarch [13] deeply explored the usage of artificial intelligence (AI) in education. Their study showcases the benefits in student outcomes by incorporating AI into mainstream education. From this perspective, AI as a learning tool is highly supported. Authors discussed a design of an information-based teaching model with the purpose of displaying knowledge more intuitively in front of students. By doing this they hope to showcase how the proposed model enriches the overall teaching and reduces the difficulty of students' learning. Since the article exclusively focuses on student learning, the authors delve extensively into how advancements in technology have proven beneficial as integrations into the methodology.
Similarly, prior works from Jones [14] and Beck et al. [15], provided exposition of the usage of computers as a resource in education. One of the key observations regarding these articles is that limitations such as programming language compatibility, resource constraints and inability to conduct conversations with the student in the student’s natural language can now be mitigated with the technology currently available. The research specifically discusses AI and several types of computer-assisted instruction systems (CAI) and how they may facilitate learning. Though the article focuses on the development of learning environments, it also discusses viable uses for diagnostic tools.
A more recent publication by Wang et al. [16] in 2022 pinpoints one of the gaps mentioned in education. In this article, the researchers acknowledge that current research on the visualization of education big data lacks relevant theoretical guidance, systematic sorting, and is limited on the design of informatization platforms based on the visualization of education big data. Our paper directly aims to encourage improvement in the areas of implementation of educational data visualization as mentioned in [16] and actively attempts to address the design of educational informatics platforms based on the visualization of education data. Our approach will be beneficial for the institutional administrators as it will assist them with making data-driven decisions for institutional or organizational improvement.
As data-driven decision making has become an area of focus in education, it is important to discuss the impact of visualization and machine learning algorithms in the education domain. It is reasonable to assume that the more data leads to more complexity. Recently, Llaha and Aliu [17] discussed the application of data visualization and machine learning algorithms for better decision making in criminology. However similar approaches can be taken in education for decision making at any level. Williamson [18] discusses cases that employ models and different implementations facilitating predictive analytics as well as increased levels of interactive use. By taking advantage of available resources, multiple uses can be found that are highly suited to an educational agency’s advancement in governance, data visualization, predictive analytics, and advance ‘real-time’ strategies while safeguarding security.
Artificial intelligence exposes vulnerabilities in data security while visualization displays the degree. Therefore, sensitivity becomes a factor in displaying information. How sensitive will depend on the investment value leading to bias and ethical issues. Programmatically influence is injected through lenses of perceived relevance of data or stakeholder investment values. The appropriate approach to implementing ML and visualization must at some point consider ethics and biases [19]. Although the purpose of AI and MLAs is to allow automated learning and prediction, biases and challenges in ethics do creep in. In the article authored by Akgun and Greenhow [20] the authors assess ethical challenges and propose means of addressing them while introducing useful resources to that end.
Overall the previous works discussed several valid approaches to different concepts in visualization, machine learning and educational practices. However, they did not fully address the gap found in creating and demonstrating cost-effective in-house approach for education agencies. This is an important area of concern for institutions since the majority of their budgets tend to rely heavily on public funds and government allotments. Solutions that are replicable, cost-effective, and maintainable provide the best functionality for these institutions. While being cost-effective it also ensures data safety or ethics required by these institutions remain as internal as the delivery tactics chosen and are directly controlled by their delivery processes, not by contracts from external agencies. Since data sharing agreements and software usage rights at times contain clauses for rights, we eliminate that issue by delivering in-house builds. In this paper, we provide an implementable solution for addressing this need when funds are non-existent for subscription-based products like Power BI and others.
3. Methods
This section provides a brief overview of our proposed data visualization and machine learning approach and its application on the k-12 assessment data.
3.1. Dataset
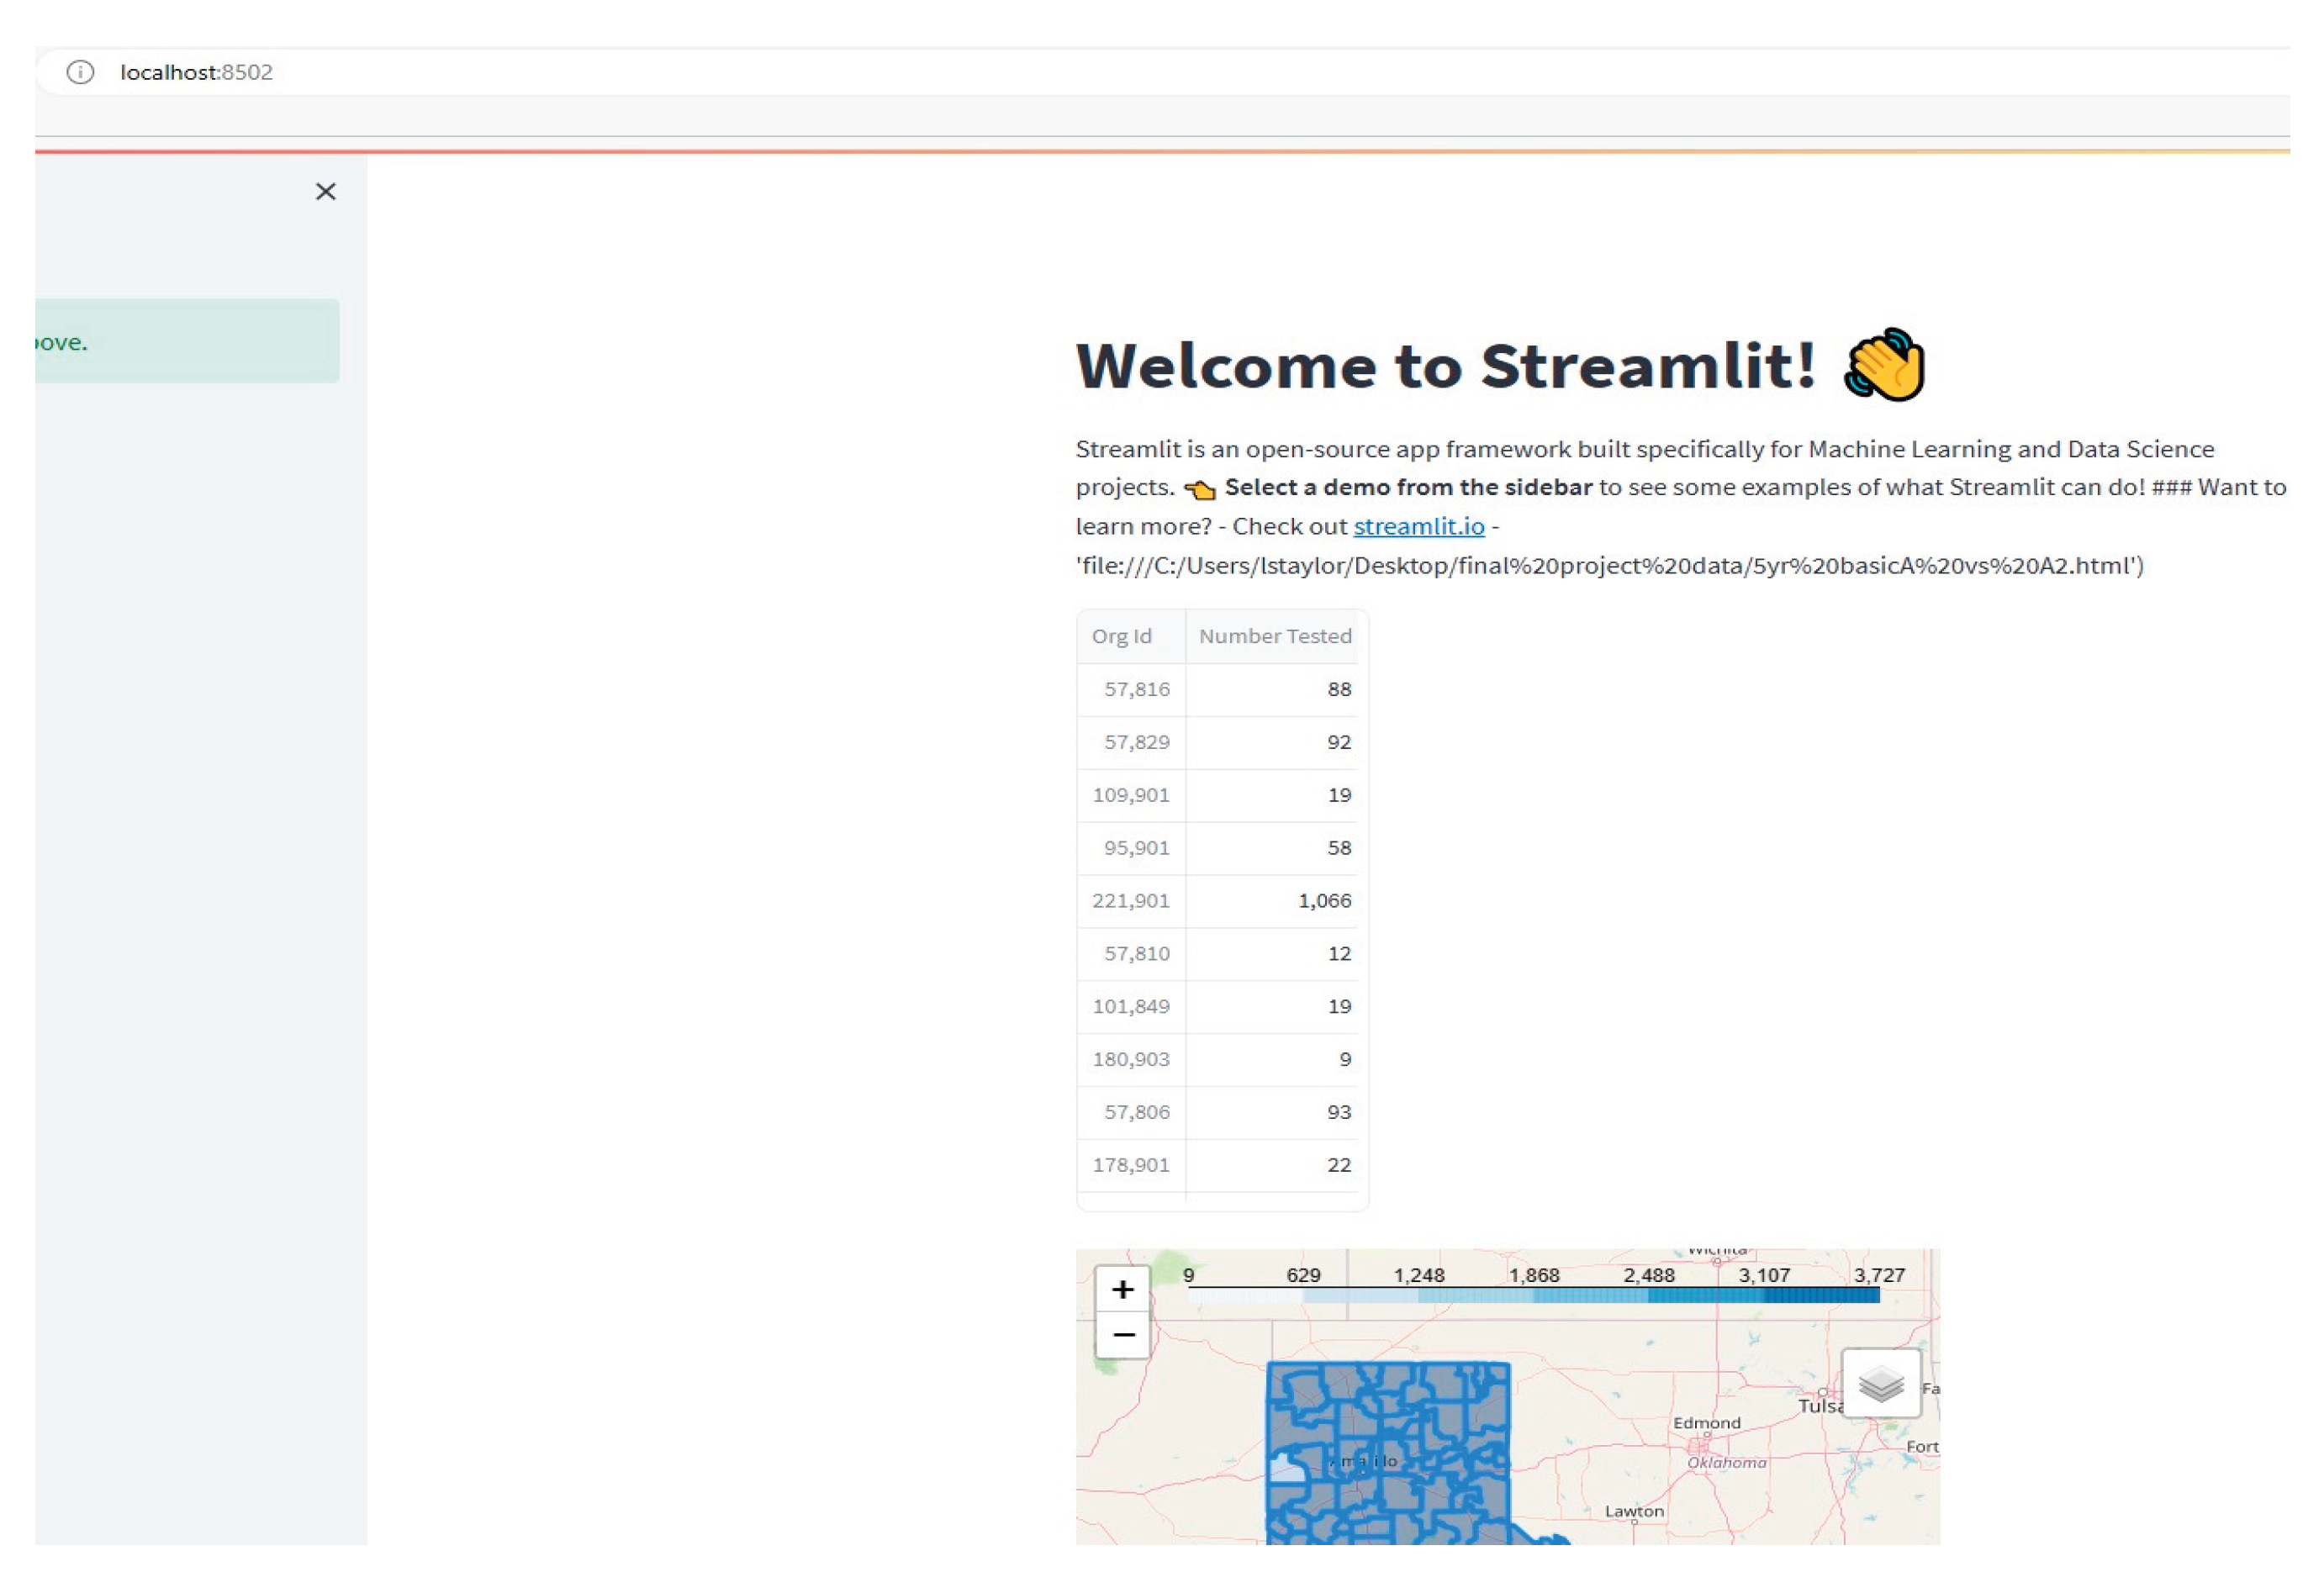
In this paper, we have used GeoJSON map files and end-of-year state assessment data for the State of Texas and Louisiana as shown in Figure 1 and Table 1. Map files used housed the geolocations and coordinates of the districts observed within the state of Texas. These data points were used to create the district comparisons and interactive map models for our research. There was a total of three map files including the comprehensive district data file retrieved from the Texas Education Agency Public Open Data Site. The end-of-year state assessment data is obtained from publicly available sources, including the State of Texas Education Agency for students assessed in Texas, the State of Louisiana, and the National Center for Education Statistics (NCES) [21,22,23,24].
The education assessment data STAAR [21] is the publicly available data available on the Texas Education Agency (TEA) website containing district level data of third grade reading performance results from assessment years 2017–2022. Table 1 shows the descriptive statistics of the data from Texas. Each of these datasets contains information about the district, school, class, session of the year, test type and then percentage of students meeting the proficiency level or not. This data provides an assessment of overall students within the school in district of the state. Texas state assessment data comprised of 1152 districts. Some districts lack grade-level data for specific years either because the grade level was not tested in that particular year, or the district was not actively operational during that time. This data spans approximately five years of tracking and comprises a combination of numerical and textual results. Since the data is not treated, there will be a need to quantify and preprocess before using in any of the models designed. Ingestion of data points collected included demographic data, test results, dates and location data. Map files used for this research are in geojson format and specify location-based features of the districts as well as the relative geometric shape boundary of those districts and states.

Table 1.
Data Description of Texas Education Assessment Data.
| Type | Grade Level | % of Students Did Not Meet | % of Students Approaches | % of Students Meets | % of Students Masters |
|---|---|---|---|---|---|
| Mean | 3 | 22.39 | 77.18 | 49.80 | 28.23 |
| Sd | 0 | 13.48 | 14.34 | 16.18 | 12.9 |
| Min | 3 | 0 | 0 | 0 | 0 |
| 25% | 3 | 13 | 70 | 40 | 20 |
| 50% | 3 | 21 | 79 | 50 | 27 |
| 75% | 3 | 30 | 87 | 60 | 35 |
| Max | 3 | 90 | 100 | 100 | 77 |
Key fields of importance extrapolated from the file include: the location’s size measured by area, its geometry, and its coordinates (longitude/latitude). The states’ data was further parsed by district with these same data points. The assessment data for Texas schools comprises of 1152 total districts. For the grade 3 data used in this research percentage of students per performance category ranging from 22 to 77%, with the highest category of students attaining the Approaches standard (minimum passing rate).
3.2. Extraction, Transformation and Loading
After obtaining the data, a review was conducted to ensure that each subject would have the minimum required number of variables as shown below:
- Number of students tested
- Percent of students at proficiency
- Dates of assessment
- Location
Our statistical models and computations took advantage of prebuilt libraries to graphically display the comparative results of the data. We removed missing values, corrected misaligned data points, and filtered non-numerical values to structure data for extraction. Additionally, there was required testing of multiple comparison models and distribution models to ensure that the desired outcomes were reflected in the paper.
For example, Figure 2 shows the distribution of districts that had the reflected percentage groups in the approach’s performance standard. The histogram reflects the greatest number of districts have 50% or more of their students at the minimum passing rate. Two challenges that this paper may tackle effectively as a side result is automating effective visualization and limiting created cognitive barriers.
It is easy to sometimes display data that will result in inference confusion, in which a result is concluded based off misrepresentation of data. For example, the Figure 3, shows multiple trend lines for performance metrics on the same graph as total student count. It would be better to represent the percentages together on one graph or separately as shown in Figure 4.
Often how information is presented will have an effect on the outcome of any action taken or insights derived. Since this paper aims to assist in understanding data in a specific arena, the output may be useful in changing approaches or standpoints. With this work, there is space to make this a web-enabled and fully deployed solution in the future. For this research’s processes we tackled: eliminating undesirable models, color correction and adding features while maintaining accurate visualizations. Eventually this offers the capability to combine population statistics, employment data and use datamining.
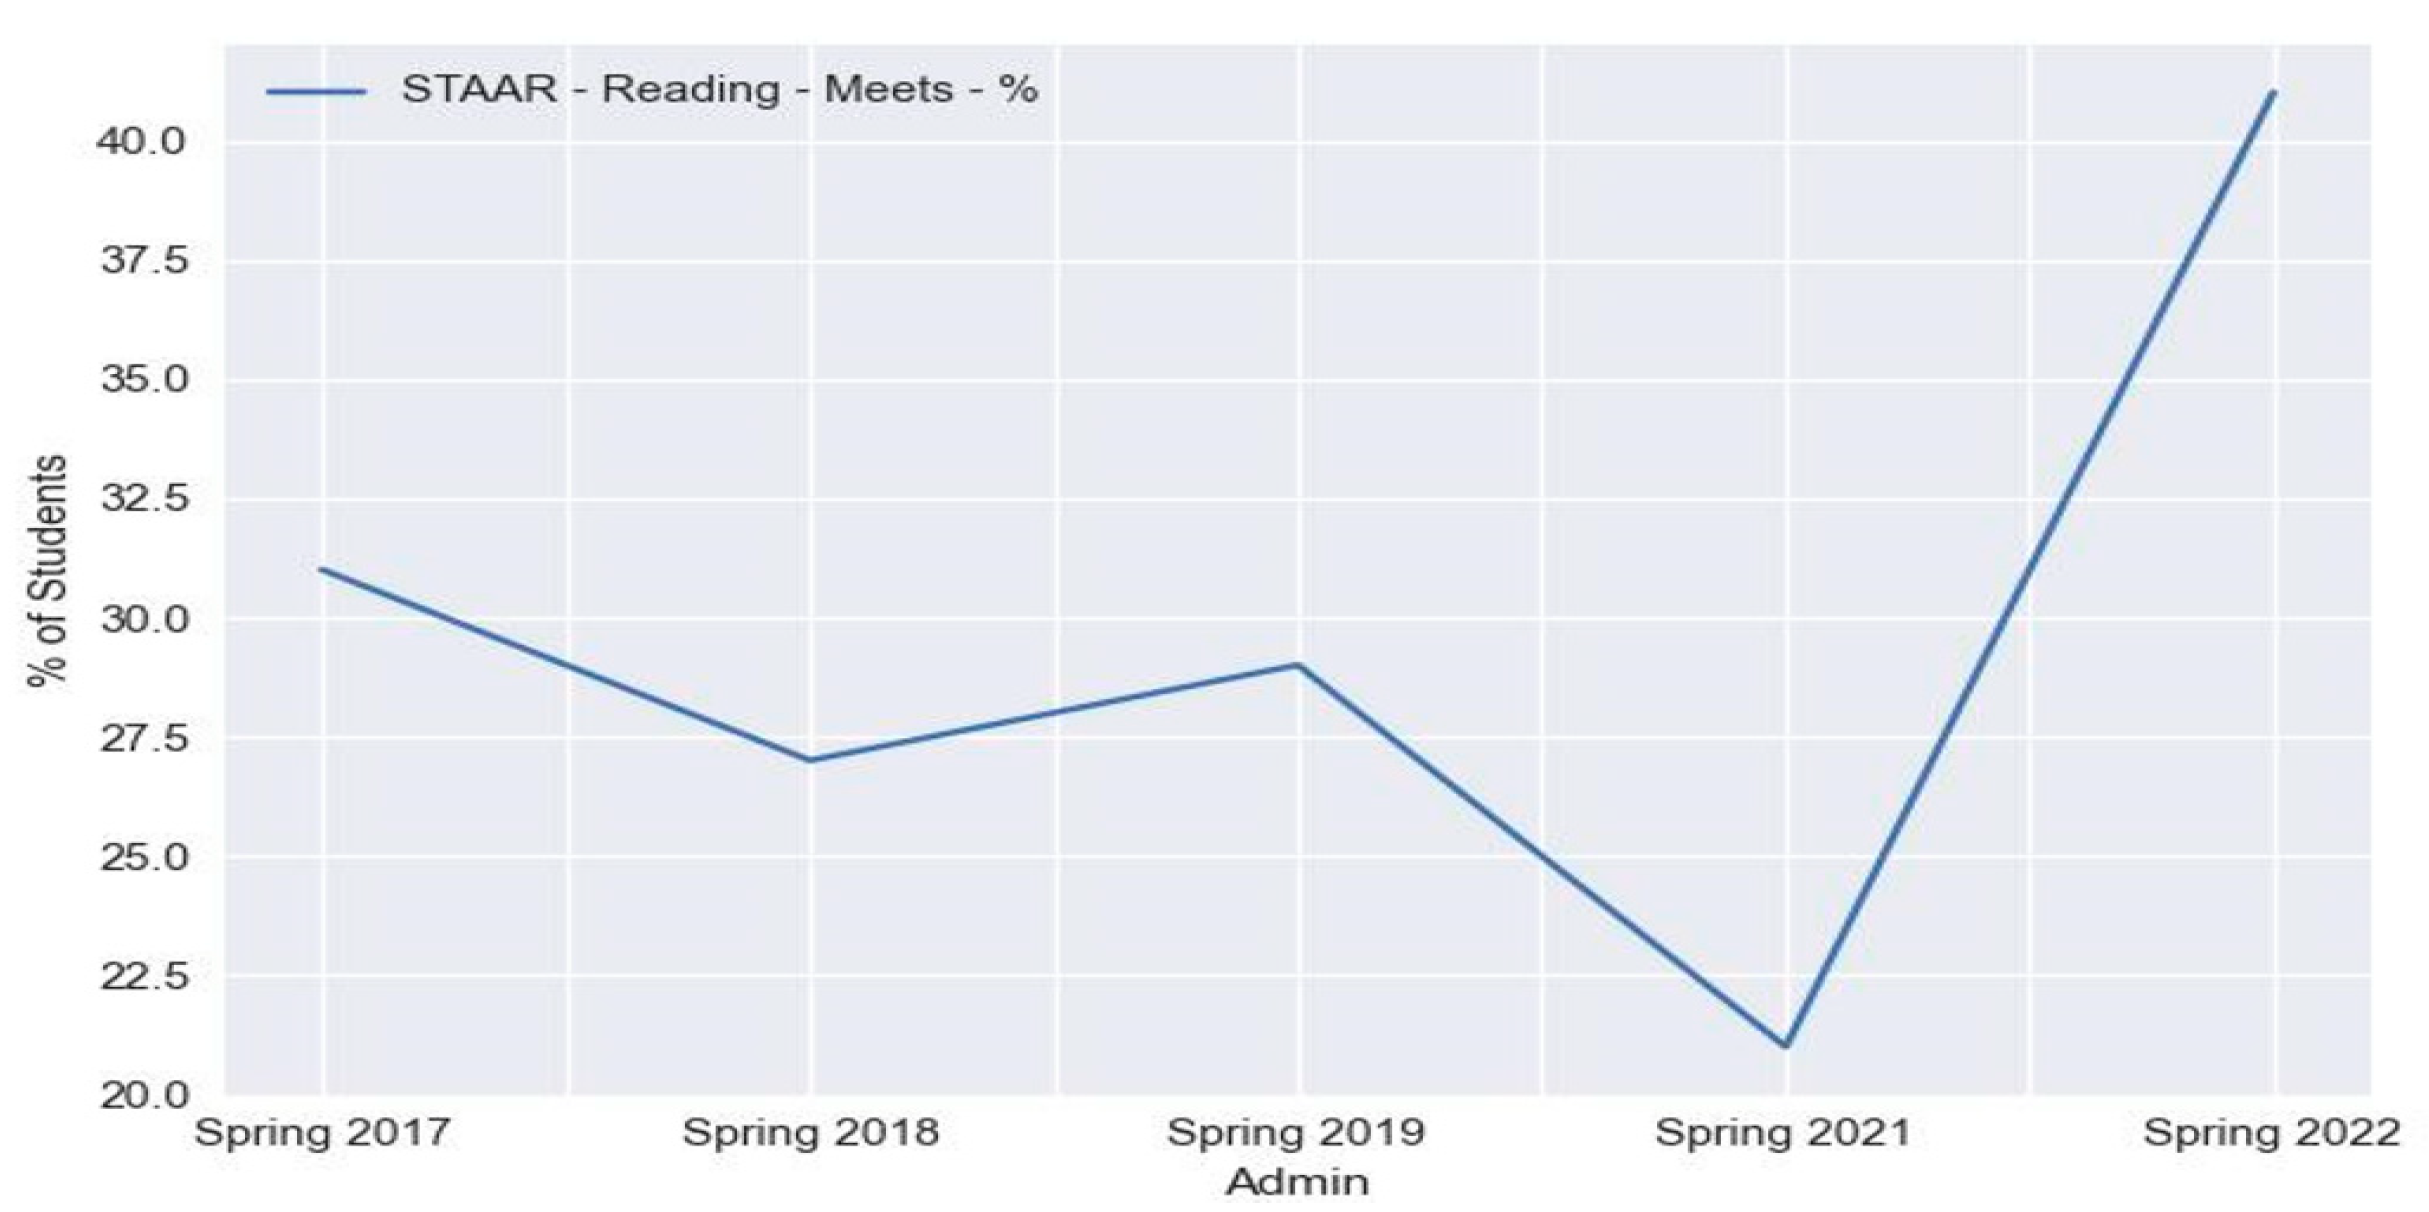
Figure 5.
Graphical Representation of Trend Line of Performance Standard Measurement by Time.
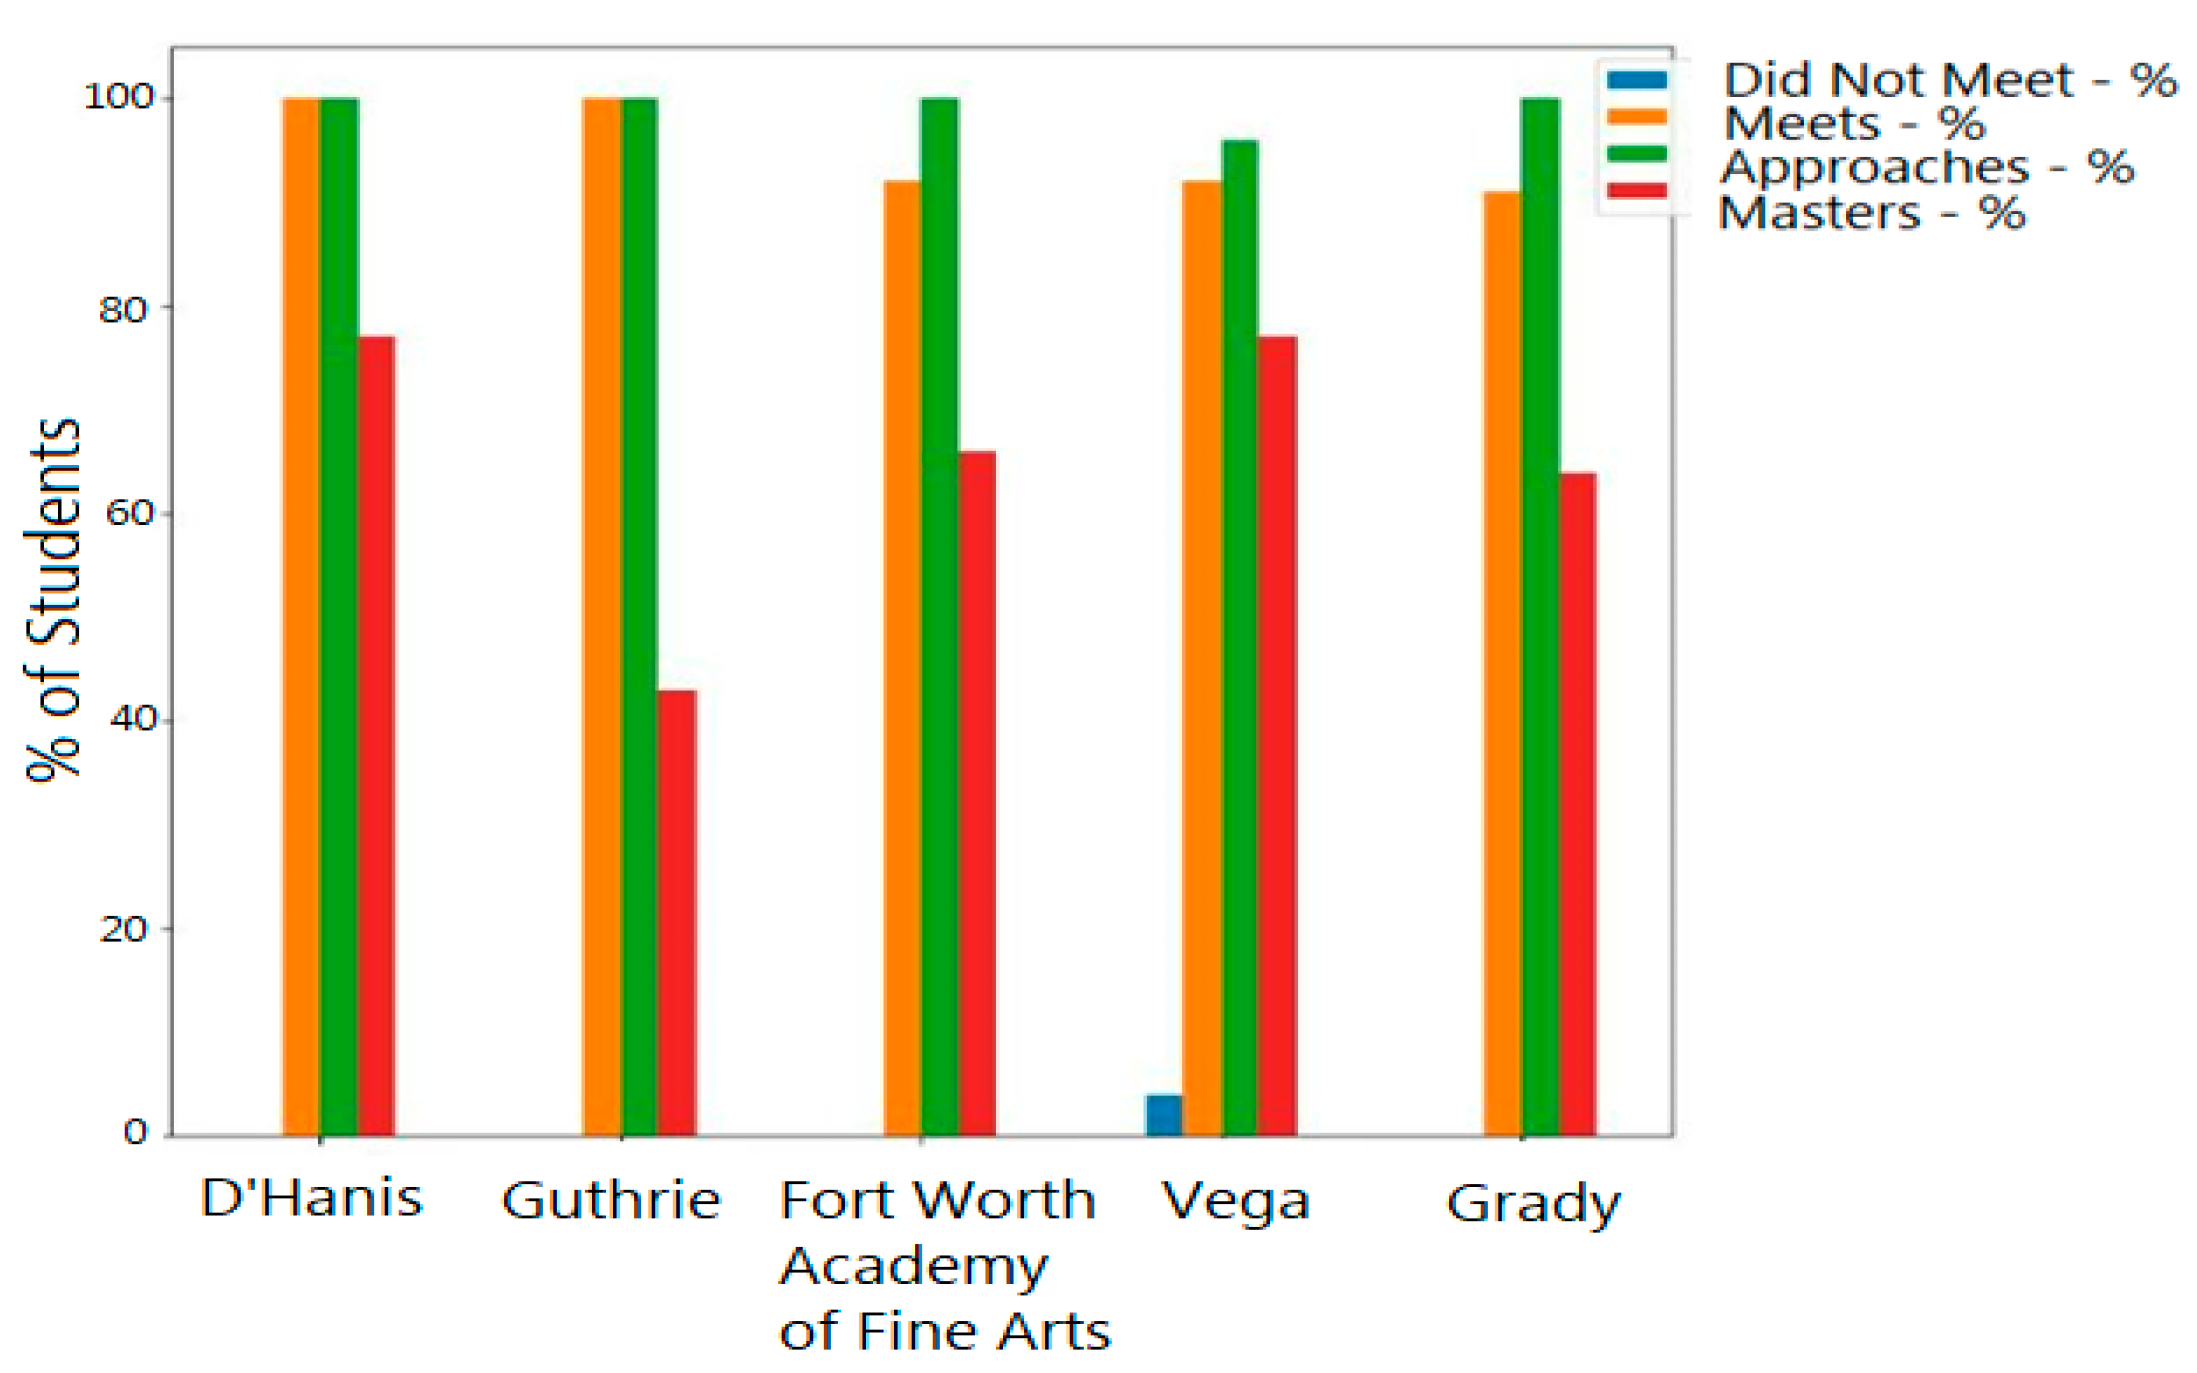
The types of visualizations that resulted from this research included several types of statistical graphs. In the bar graphs such as image below, we can showcase what would be useful for our story concept the how the scores are distributed across the five highest performing school districts (of which our test district is not included) to compare with our test district’s data.
Figure 6.
Graph of Percentage of Students within Each Performance Standard Measurement.
There were also spaces for which scatter plots such as the next infographic were useful. As shown in Figure 7, we plotted the entire statewide data and showed how our test district performed in our category of interest compared to all others.
One of the reasons these are so effective is because schools spend a great deal of time with spreadsheets or PDFs to try to assemble something useful for deriving insights.
Figure 8.
Example of Accessible Data Reports [6].
Figure 8.
Example of Accessible Data Reports [6].
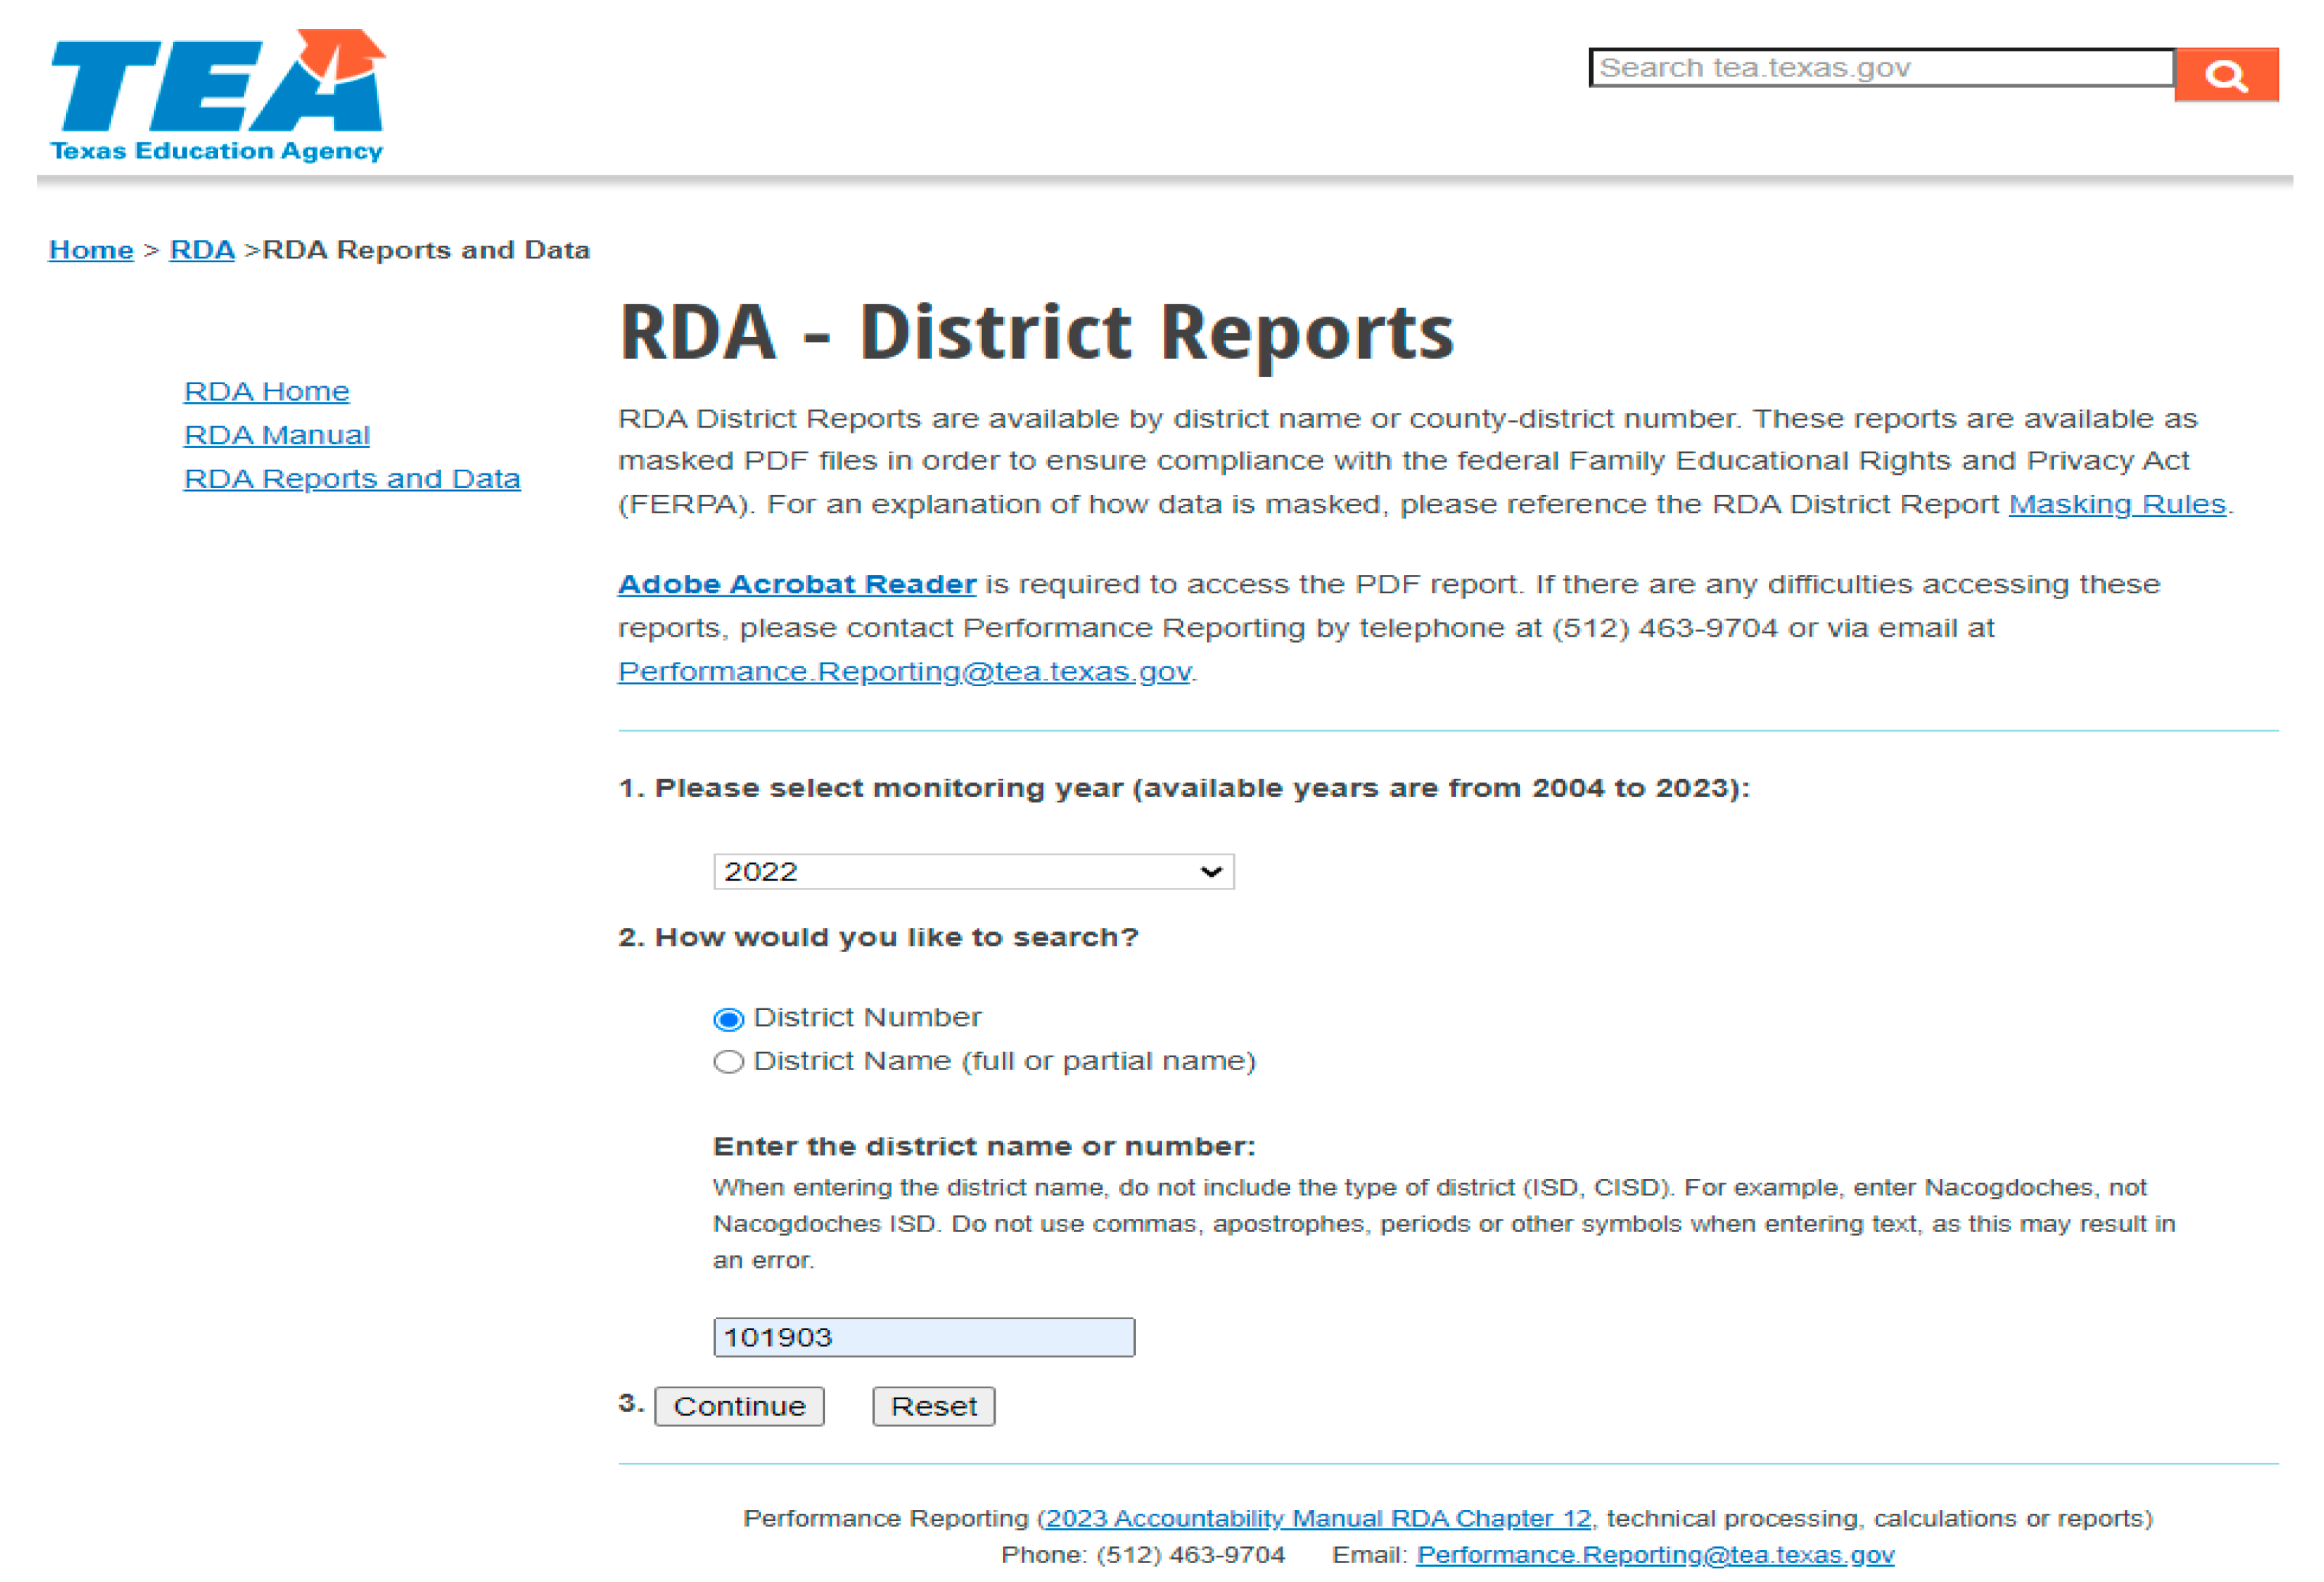
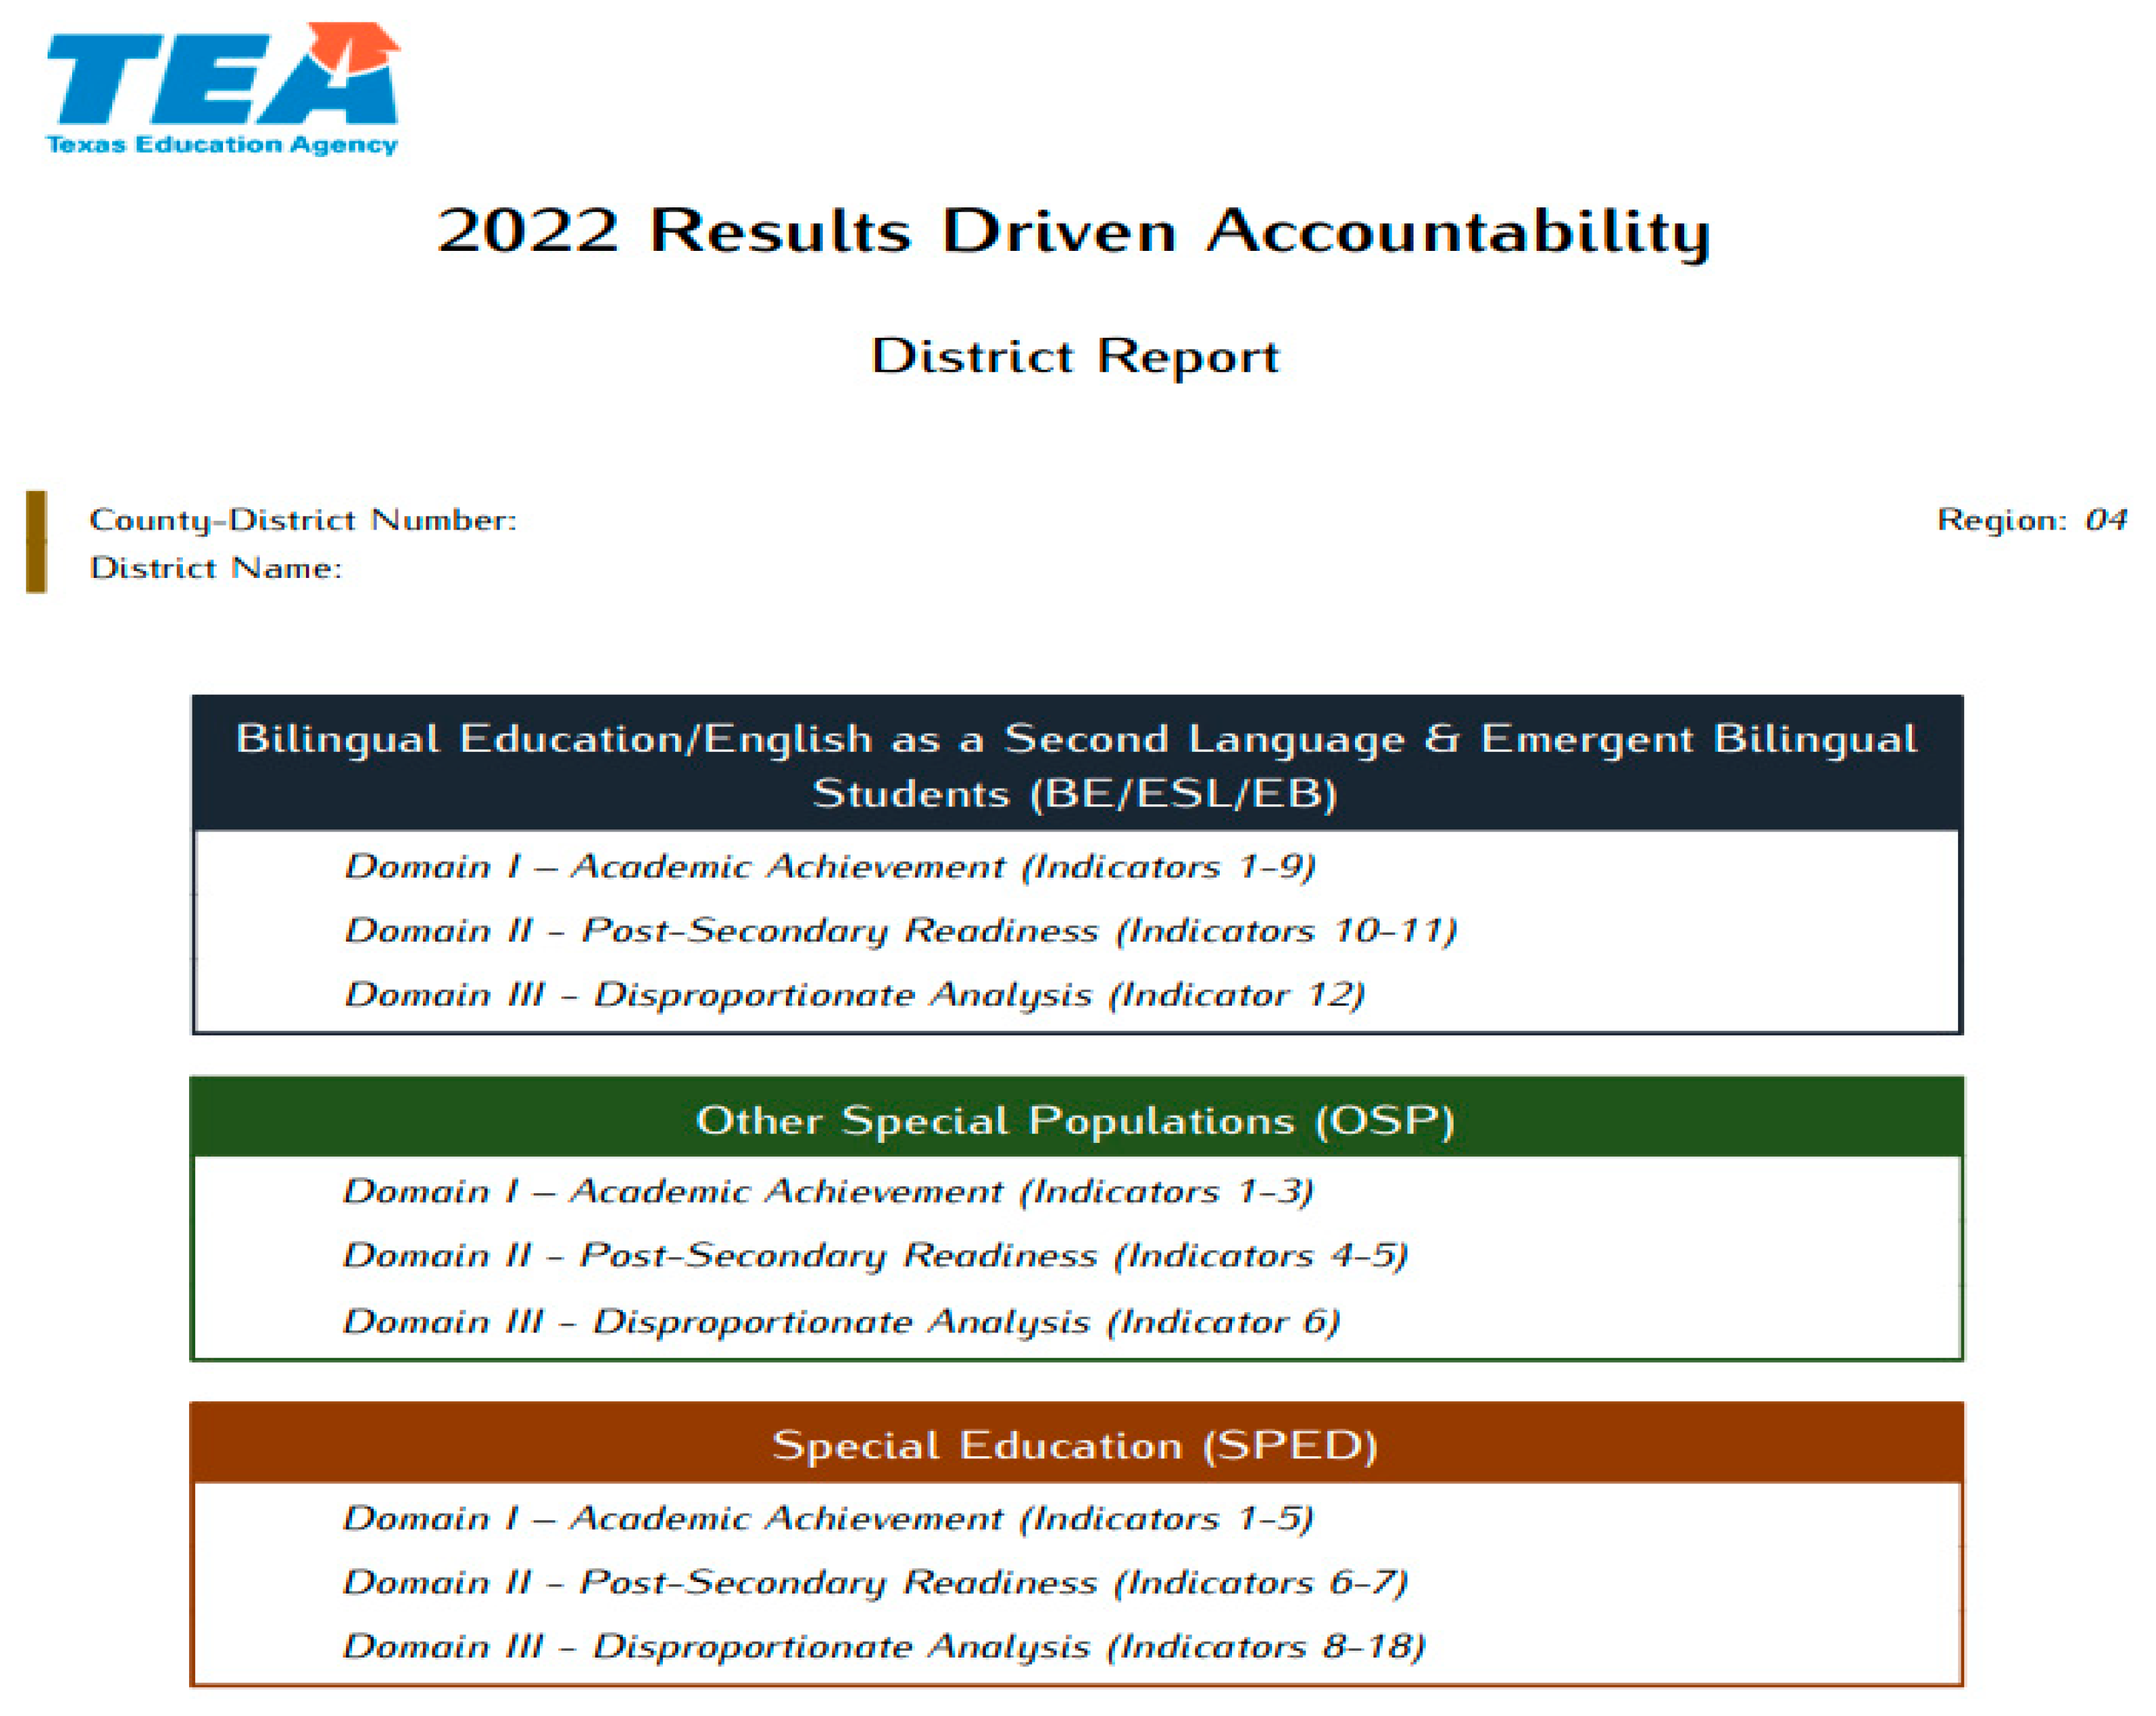
Figure 10.
Example of Accessible Data Reports by Interest group [25].
Figure 10.
Example of Accessible Data Reports by Interest group [25].
The sources or repositories for the information is often not user-friendly or time consuming to make any effective use of*.
Figure 11.
Example of Visually Friendly, Low Functionality Data Viewer [21]. *this data portal has since been disabled and replaced as of school year 2023-2024 [21,26].
Deploying this method allows for not just the visual representation of the data, but also interactive dash boarding that is suitable to stakeholders invested in school operations.
Figure 12.
Example of Creating Analytic Solutions for Web Deployment Through Dashboarding.
3.3. Learning Models
This research uses linear regression and logistic regression [27,28]. The models will take the grade level data for the test district and use the data from the prior years to train and make a prediction for the next estimated score. Our test case uses the performance standard category “Meets grade level” and using the percentage of students per year to make an estimate.
3.3.1. Expected Results
We expect the research to provide visualizations that are intuitive of the data retrieved. The results we expect from the research are to create visualizations that will be able to be used in reference to the data that the visualizations were created from. They will be understandable, lacking misrepresentation, and effective in modeling the desired perspectives. The approach we take will produce results because one of the processes in the design model is to remove biases and to first model statistical reference before inferring relationships. It is expected to have precision to the degree of completeness of the data and where appropriate, adjustment for missing data and new models to represent that missing data. This paper’s requirements can be used to provide the following results:
-
Financial Benefits
- Result #1: Reduce expenditure of funds on resources to generate products
- Result #2: Inexpensive data evaluation to interested entities
-
Technical Benefits
- Result #1: Computerized model of data and correlations
- Result #2: Additional hands-on usage of data visualization
- Result #3: Evidentiary support/background research used as preliminary to future work
-
Other BenefitsThese benefits are those that are specific to the stakeholders:
- Result #1: Increased stakeholder investment and satisfaction
- Result #2: Opportunity to be used in conferences and research presentations
4. Experiments and Results
In this section, we describe the experimental setup, results, and evaluation.
4.1. Experimental Setup
Several technologies were leveraged in order to showcase this research. Programming tools used were Jupyter notebook and notepad. The bulk of the language used was Python with some batch scripting to showcase different deployment options to be discussed later. Additionally, this research used machine learning in the form of regression for modeling and predictions. While this research employed simple linear and logistic regression of univariate stats, it is not limited in capability and can support multivariate analysis. The web tool for deployment that was used is Streamlit. After creating the python code used in the implementation, a batch script was used to call for the code and run through a simple command line interface. This way, if necessary, any minute changes that would need to be made could be made during testing or during execution. It is saved and would even offer the ability to change the default image icon if one wanted to distinguish it from other programs stored on device. To simply create the code file used to generate the data and results then follow the steps like so:
Table 2.
Simple Packaging and scripting methods for Deployment.
| Steps | Tasks |
|---|---|
| Step 1: | Determine the data used in the implementation |
| Step 2: | Create the Python code to generate the desired data analysis |
| Step 3: | Save the Python code in a specified location and make note of the file path |
| Step 4: | Create a batch script file to execute the data to the web browser of choice through StreamLit. Use the file path of the saved Python file for the run command |
| Step 5: | Save the batch script preferably in an easy to manage location for instant access or deployment |
| Step 6: | Assign an image icon to the batch script |
We experimented in a system with Intel(R) Core(TM) i7-10610U processing unit running at 1.80GHz processor with 16.0 GB RAM, 8 cores and 1TB of the hard disk. Software and programs used in this research include general 64-bit operating system for the device (Windows 10), Python 3.1 version install, native built text editor (notepad for creating batch scripts), and SteamLit framework install. For this research the data and technology components were acquired by the research team. To verify the feasibility of design and need, this research was also put through a simplified version of the software development life cycle as well as agile development. Data gathering, data processing, data model design, and data model programming and testing were included in this process. This is useful to any agency or institution that may intend to remain relevant in those functional areas. In the event that the data was unavailable for any district, we ensured the related models accounted for them and reflected accurately.
4.2. Evaluation Metrics
We evaluated the expected models against the actual observed scores and based on the difference, identify the most likely model for the implementation. Criteria for success for predictions is the estimate must be within +/- 1% of the observed value, the error rate accepted by most institutions. Utility set of criteria includes the level of complexity related to implementation, cost-effectiveness and level of value they will bring to the user and to the organization.
4.3. Results
As a result of the research, we were able to achieve several deliverables. There were four successful grouping of models derived from implementing this research’s approach. Visual Model Group 1 generated visual models of relevant data under uncorrelated conditions such as histograms and scatter plots. Visual Model Group 2 generated visual models of relevant data under correlated conditions such as multi-year data and bar charts. Visual Model Group 3 generated visual models of relevant data under predicted conditions of next event such as line graphs with and without the estimated predictions. Visual Model Group 4 generated visual models of relevant data under assumed impact of implemented approach such as web deployment tools and the multifunction choropleth maps.
After compiling the data, a typical scenario was run through of how a school may approach this usage if they were to use data-driven decision making. In this dataset, the results from grade level three participants across all the school districts from the state of Texas and Louisiana were used. Then we dove into how that representation looked for district performance, used that to run comparisons at certain proficiency levels, and then tracked the data across time and implemented predictions based upon the data. This allowed for further analysis to be ran on comparison of an individual district’s performance in reference to statewide results. While implementing this research, we wanted to focus on valid use cases for this paper that would be relevant to demonstrate our concept. To that end, we introduce the following storyboard:
“At any given time, a school district will make attempts to evaluate their institutional effectiveness. At times, that can include evaluating themselves against other districts; either in their surrounding area that may be competitors for enrollment or across a geographic area that has similar distributions of demographics within their population(s) served.”
These evaluations not only are analyzed at an organizational level as a whole (district) but also at an institutional level (school). The prevalent analyses often delve further by disaggregating by demographics or special populations. Priorities of doing so are usually to attain insight on whether or not there is improvement in a desired focus area such as enrollment or assessment outcomes. Statewide results are more relevant for an institution when population size is a parameter. It offers the benefit of having the ability to see how many institutions for any comparison made is in the total comparison group (see Figure 13). Comparing results across groups with like populations is typical in assessing overall academic performance in institutions.
One of the measures for evaluating baselines or successful learning organizations is the ability to review and disaggregate performance in proficiency of state mandated assessment results. As these assessments measure learning of students in content areas, schools use them in decision making in curriculum and content for instruction. Furthermore, the data allows them to review the success of the instructor’s ability to deliver content effectively in order for students to demonstrate satisfactory progress.
Being able to accurately use data to derive insights becomes the most important outcome at the organizational level. At the stage in which the data is the most effective, it also requires quick turn around and accuracy while being delivered in the most efficient manner across multiple audience types. Visualizing the data serves to meet this need as we can quickly view results from any distribution or measured standpoint. It is the creation of images, diagrams, or animations of data for visual representations in order to provide information. Visualization helps to quantify results in the most meaningful and appropriate focus area. Effective, high-impact, practical evidence that can be received in a timely manner is the best way to measure cause and effect of learner outcomes and the relationships between organizational objectives, students and teachers. Providing this through visualization serves to make the information digestible and interpretable while also connecting the material to the audience. Take a look at how simple using visualization to showcase statistical measures or data trends can be implemented in the examples below.
In Figure 14, we are showcasing the how state assessment results are distributed across all districts in Texas against agencies in Louisiana. The scatter plot shows two performance measures and where our test district lies within the distribution of those performances. This distribution shows the distribution of the overall school population percentage of students tested in grade three reading for the state’s assessment for each performance measure. In Texas the minimum passing standard is the Approaches performance standard (orange) while in Louisiana the minimum standard is Basic (green). Texas Approaches standard does not assume the student is proficient at their grade level. The Texas Meets performance standard (blue) correlates to proficiency at grade level. By comparing these categories with each other, we can understand the difference between assessments and student performances between the two states. The comparisons are often used to determine where an institution falls in the range of performances as seen by the example district’s performance ratings (purple-Approaches, yellow-Meets).
For the case of this paper’s scenario, we use the results for Alief Independent School District in Houston, Texas as our district of interest. In Figure 15, the district’s percent of students receiving the differing designations across the district for the state assessment in reading for third grade is shown. With these types of visualizations, we can view how certain areas of interest are distributed within the organization of interest as well as make summative comparisons against similar organizations.
In addition to measuring or showing data distributions, often education agencies make plans based on “what-if” scenarios. These scenarios give a sample guide of how situations are addressed or affect an outcome. It is a basic analytic tool that is used quite frequently in education for decision making. They can be further thought of as specific types of trends or projection analysis which can also be modeled through machine learning.
Machine learning is a field of artificial intelligence that allows learning of systems, computers, or other devices through experience with data or algorithms. We can use machine learning to project situational outcomes given the various data inputs or-in other words-to make predictions and/or decisions. Machine learning minimizes the error/biases sometimes created, by allowing the data define rules for predicting the most probable outcome and then modeling that result across different domains. Using different types of machine learning algorithms will have differing effects on the strengths of the relationships in your model. Machine learning practitioners also can make use of correction algorithms combined with their predictor algorithms to increase the effectiveness and accuracy. When including machine learning as a component to supporting data-driven objectives in education, there is a noticeable difference in turn-around time on providing results that are actionable and valuable. We make use of two machine learning algorithms. Although there are other applicable types such as k-means clustering or SVM algorithms, in this paper we are using linear regression followed by logistic regression. This research focuses on simple regression using single variable analysis. It is possible to use multivariate regression techniques but to prove that regression is a viable solution, we use single variable analysis to demonstrate.
Linear regression is a modeling technique that approaches prediction by drawing a relationship from on variable based upon the value of another. What happens is that the data is modeled in such a way that a line approximating the relationship between the variables is used then used as the estimating function for determining a new value if given some test input. Similar to how we estimate the next point on a line by using the slope-intercept formula in mathematics.
As shown in Figure 16, the variable we focused on for regression analysis is the performance metric for grade level standard. It is the “Meets” category which defines how the student performed on an assessment content area. The value for each student’s assessment score is placed into this category using true/false indicators to denote whether the student has fulfilled the requirements of the exam to demonstrate proficiency in the content on the grade level assessed for that content. As such, not only does the student “pass” the exam, but it is also at the grade level of proficiency as indicated in the subject assessed by the exam.
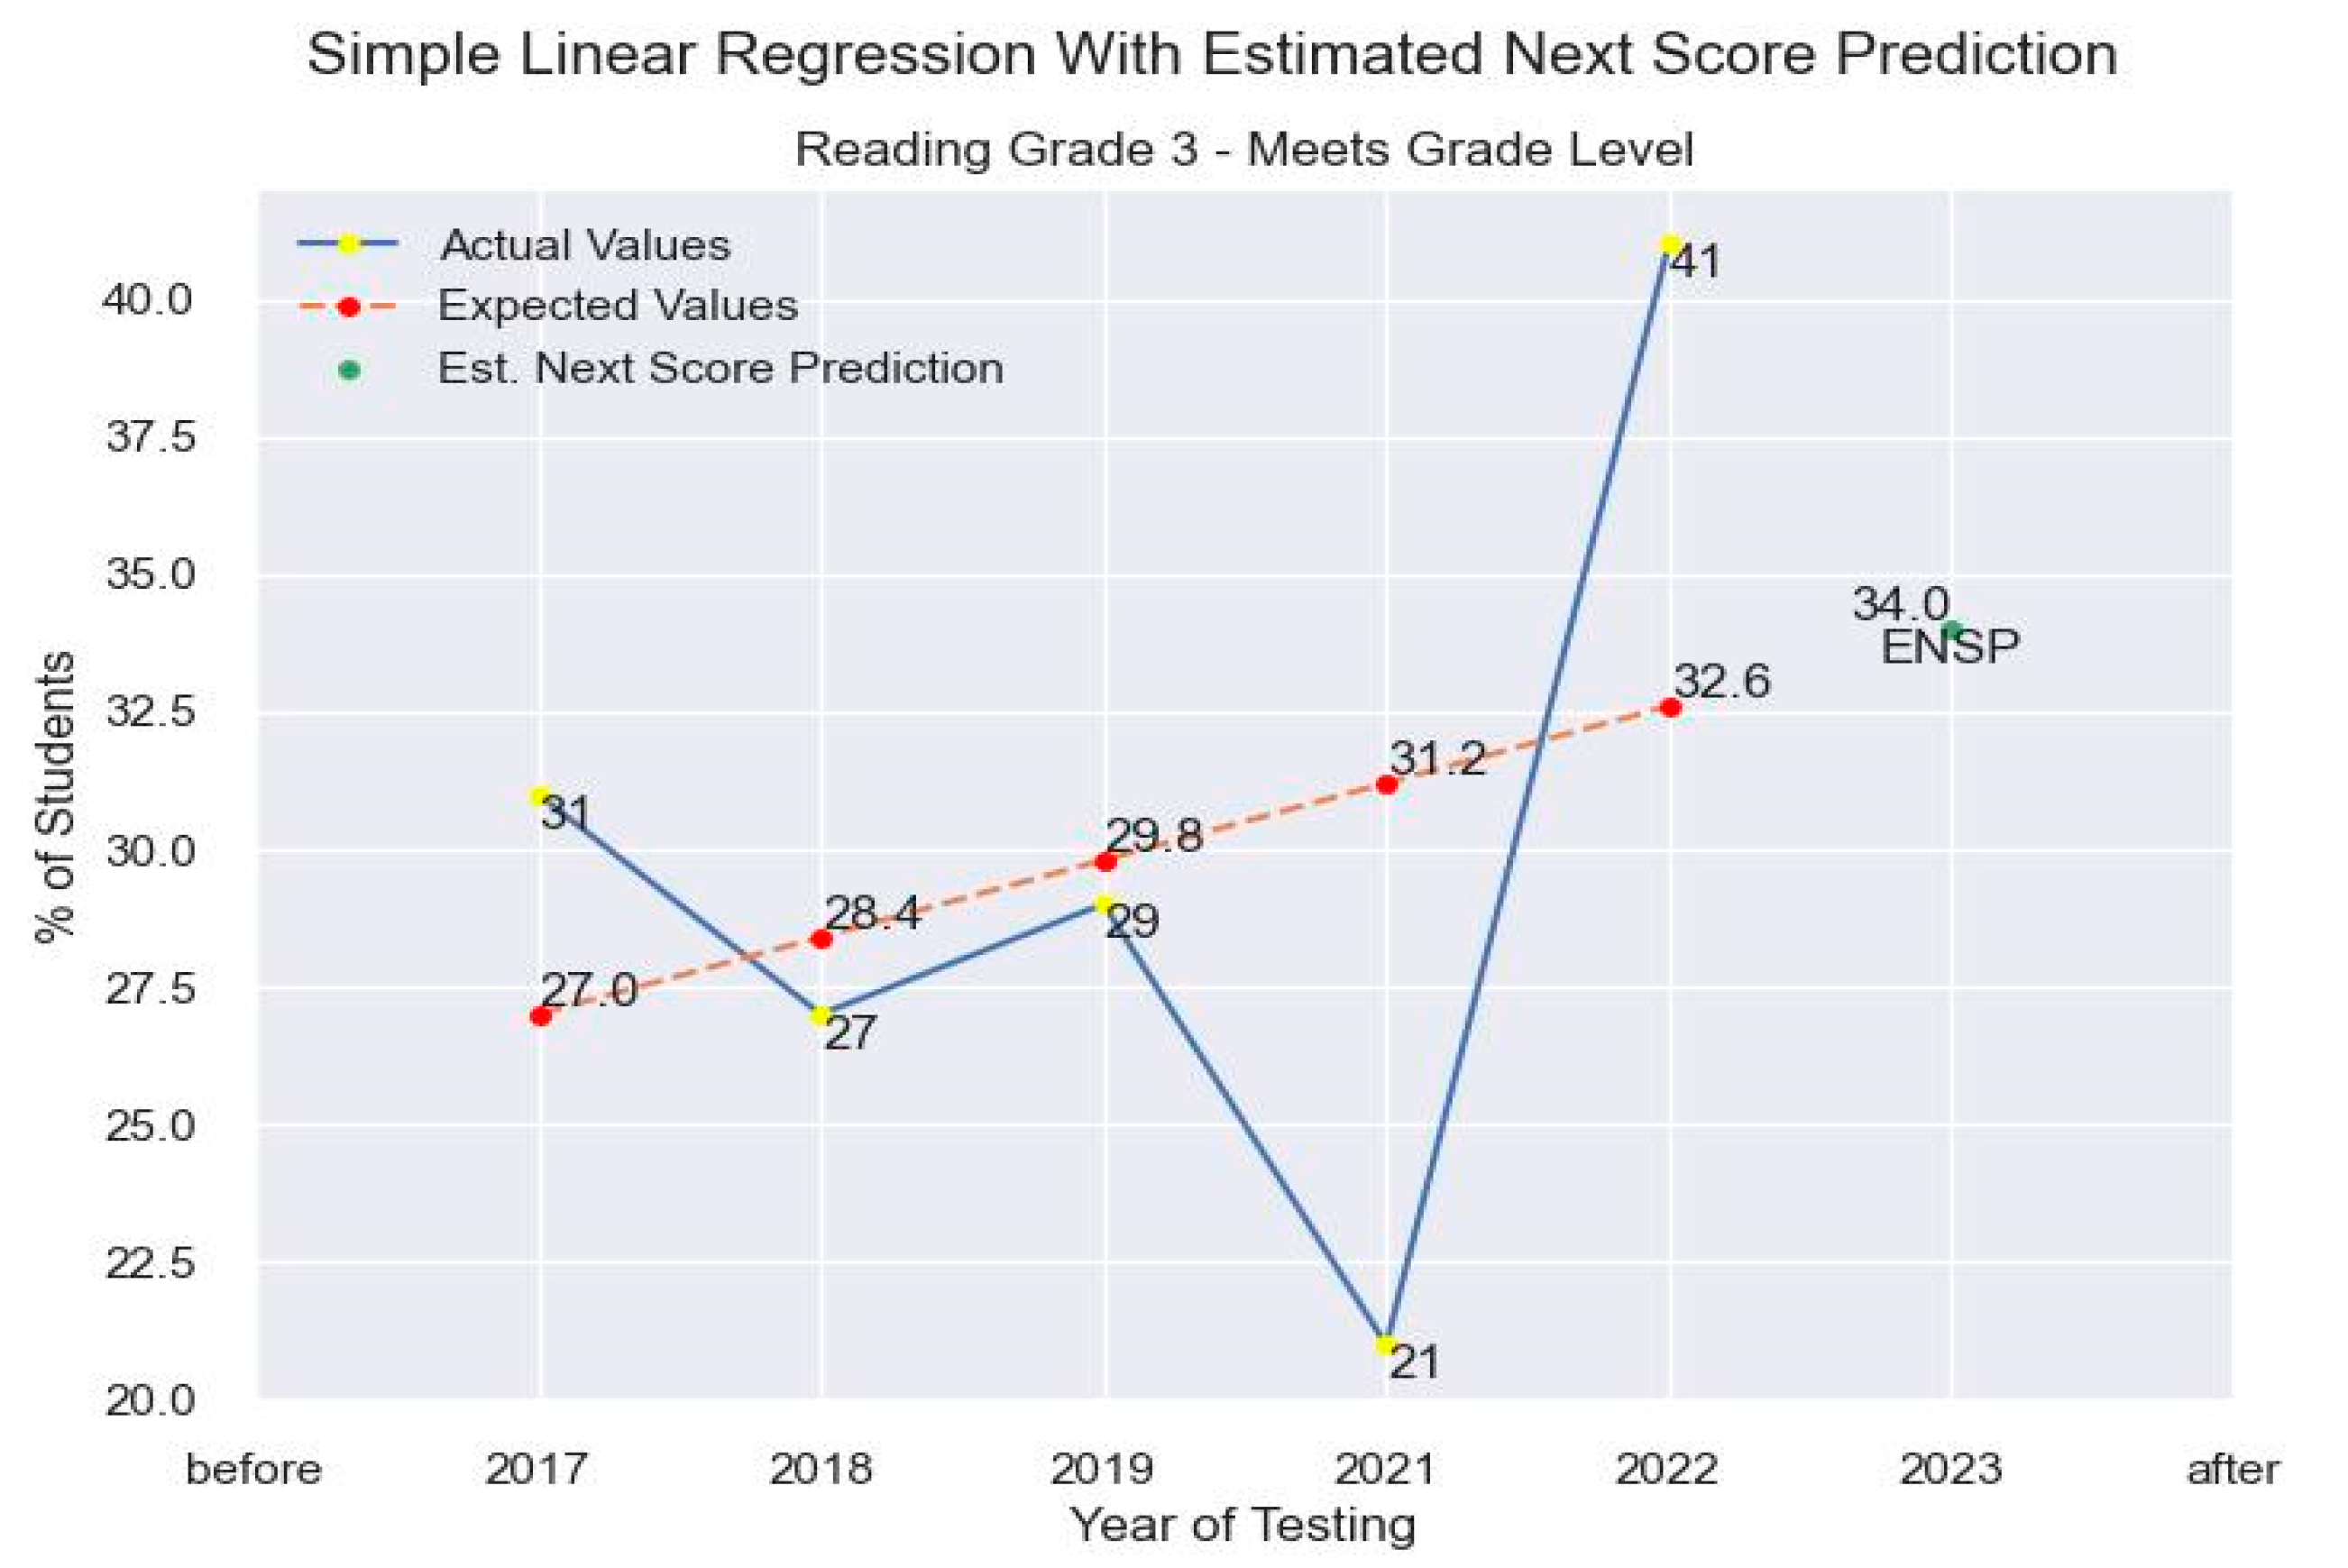
Previously mentioned, the content and grade level chosen to demonstrate the concept of using MLAs is third grade reading. The dataset given imports all of the STAAR results at the district level for all of the school districts in the state of Texas. This publicly available data found on the Texas Education Agency (TEA) website is comprised of third grade reading performance results from assessment years (where existing) 2017-2022. From there, we use this single variable under the “Meets” category and, following the rules for implementing linear regression, fit a line to the data in order to predict the estimated percentage expected to receive for the example district in 2023. For our test district we used the linear regression package built in the scikit learn library to create our regression model. At the time of the initial version of this report, the expected value for our example district using linear regression was 34 as shown in Figure 17.
This was of course, assuming no other variables are associated and will have a large enough effect necessitating the need to include them in the regression model. The results schools sometimes calculate themselves tend to be within +/- one percentage point of the official published data usually published sometime later, after the schools are using their data to make administrative decisions. Being able to implement this type of predictive analysis much quicker and to some degree of accuracy allows for better response time for districts to improve their operations* (*note: The official published data for our sample district noted the results to be at 35%, which is within the accepted margin of +/- one percentage point districts accept, proving validity of usefulness of MLAs to enhance decision making).
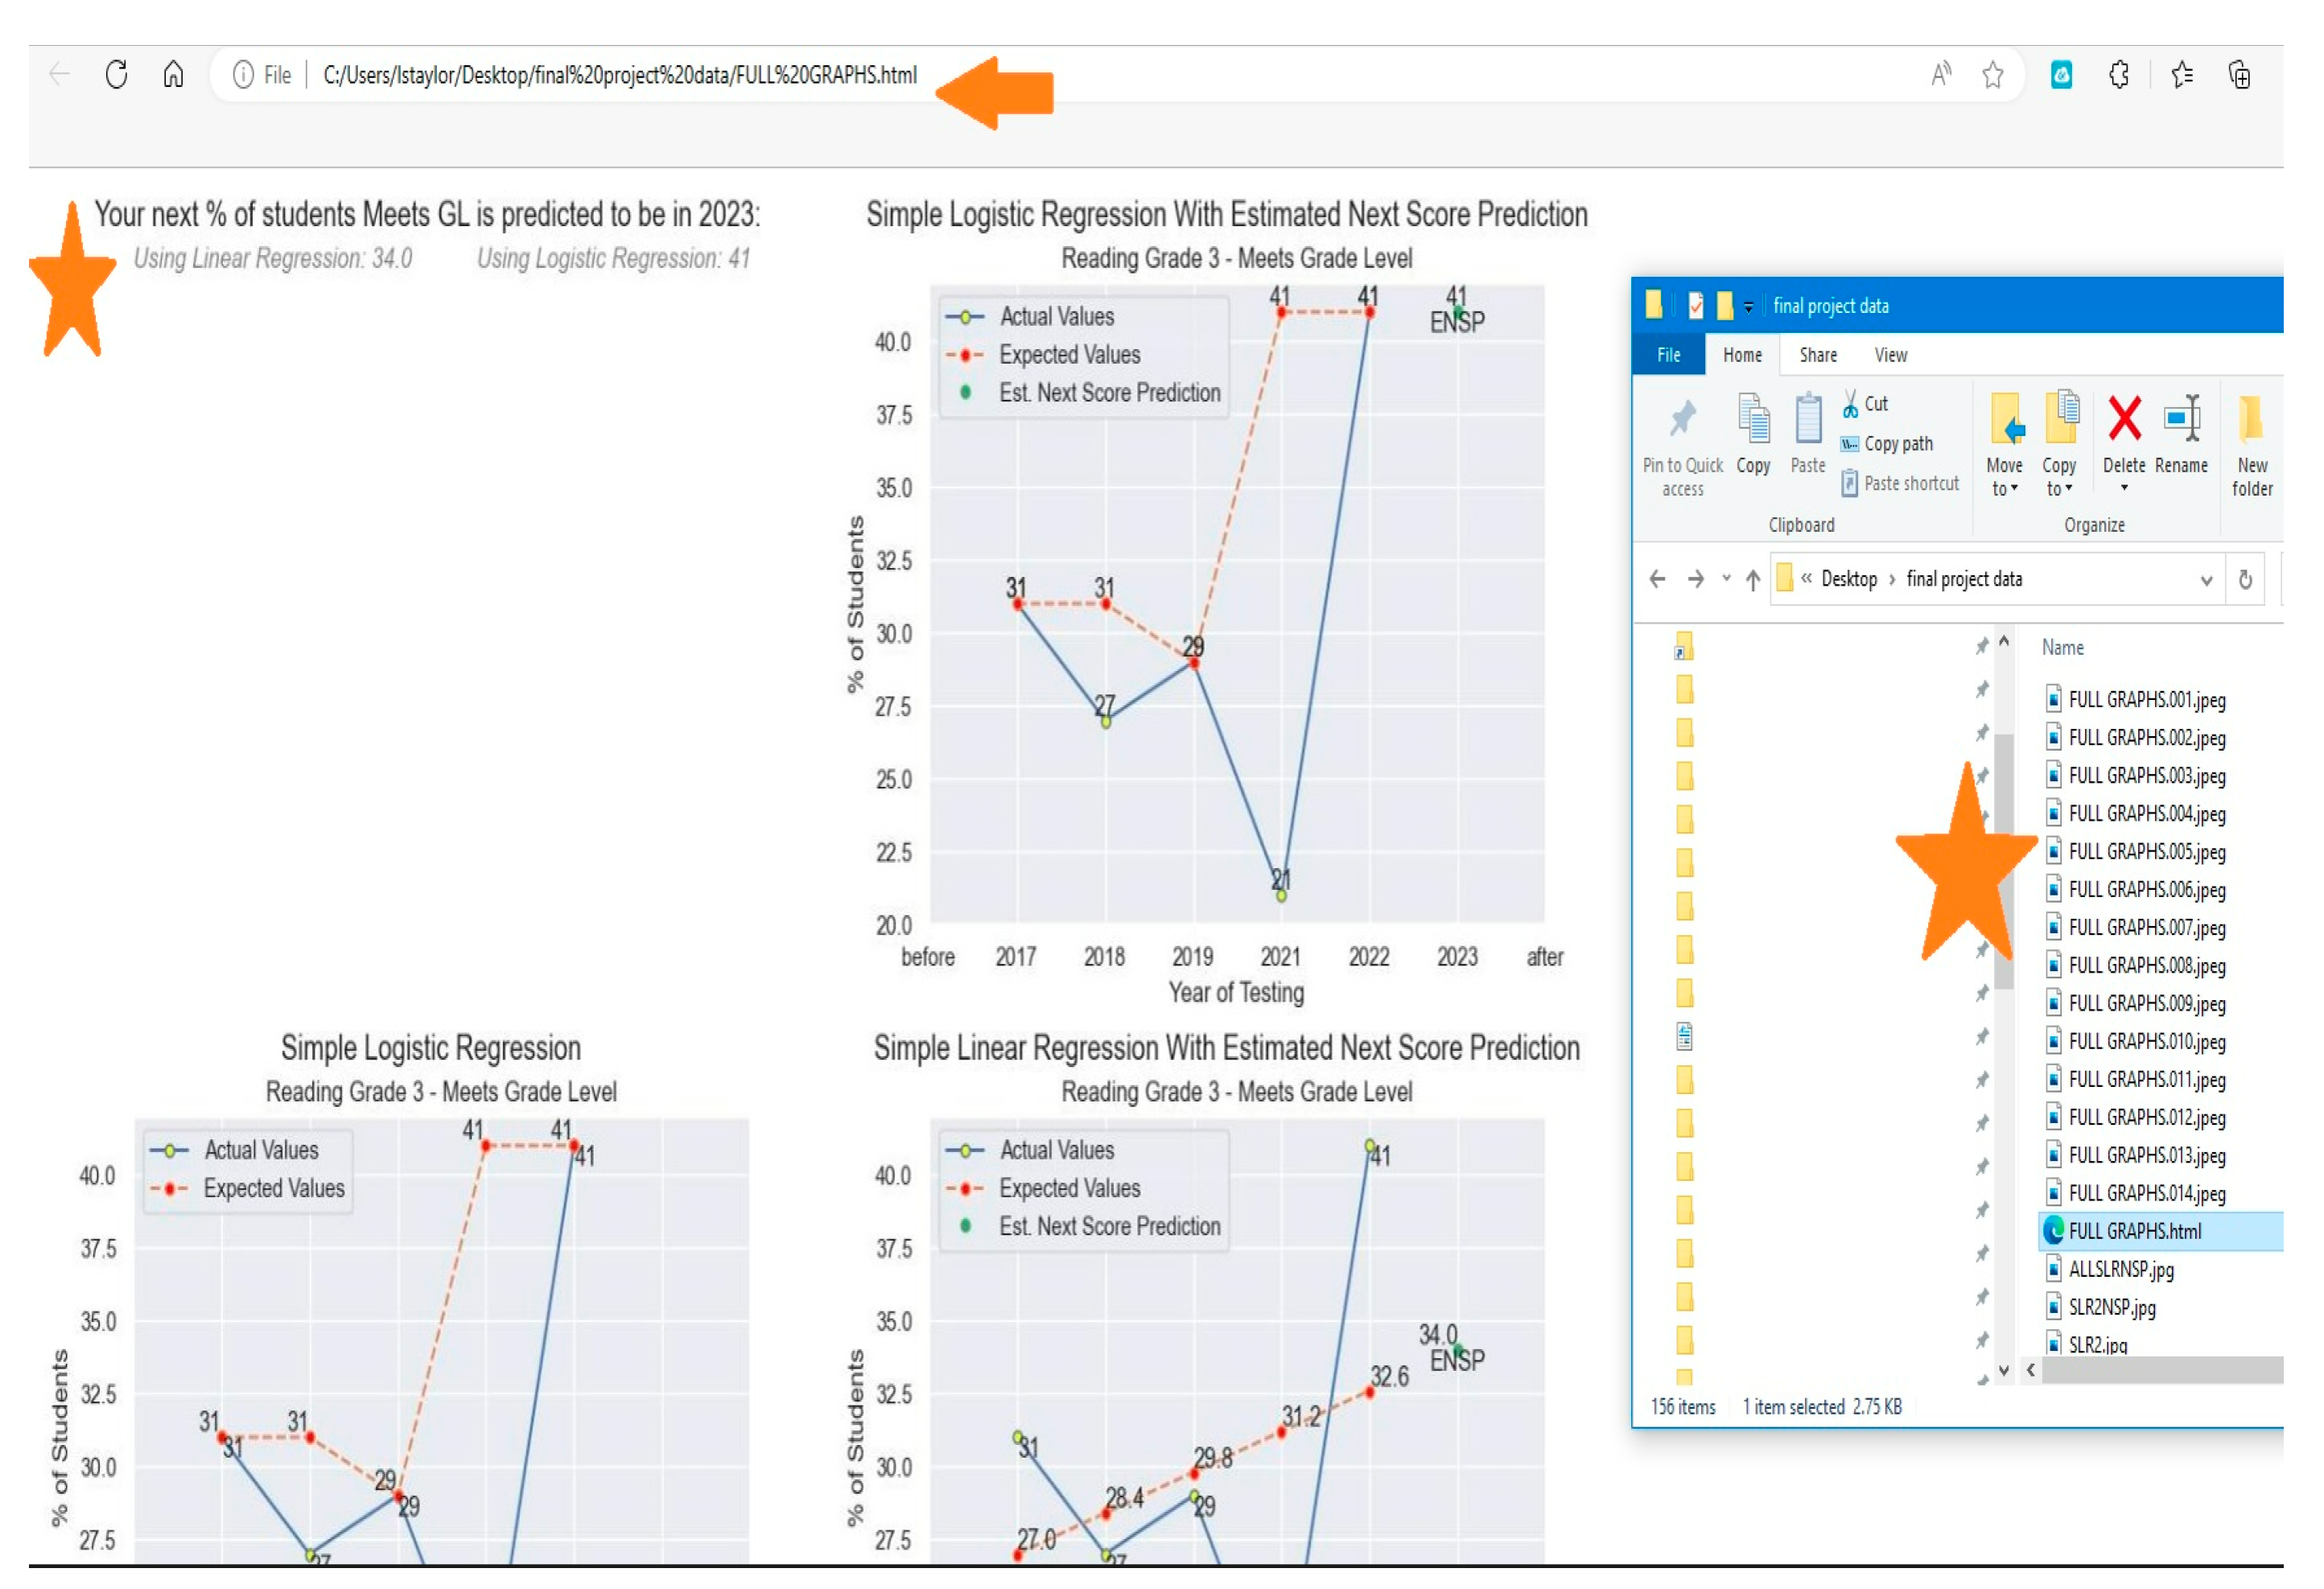
Figure 18.
Logistic Regression Modeling for Education Assessment Data.
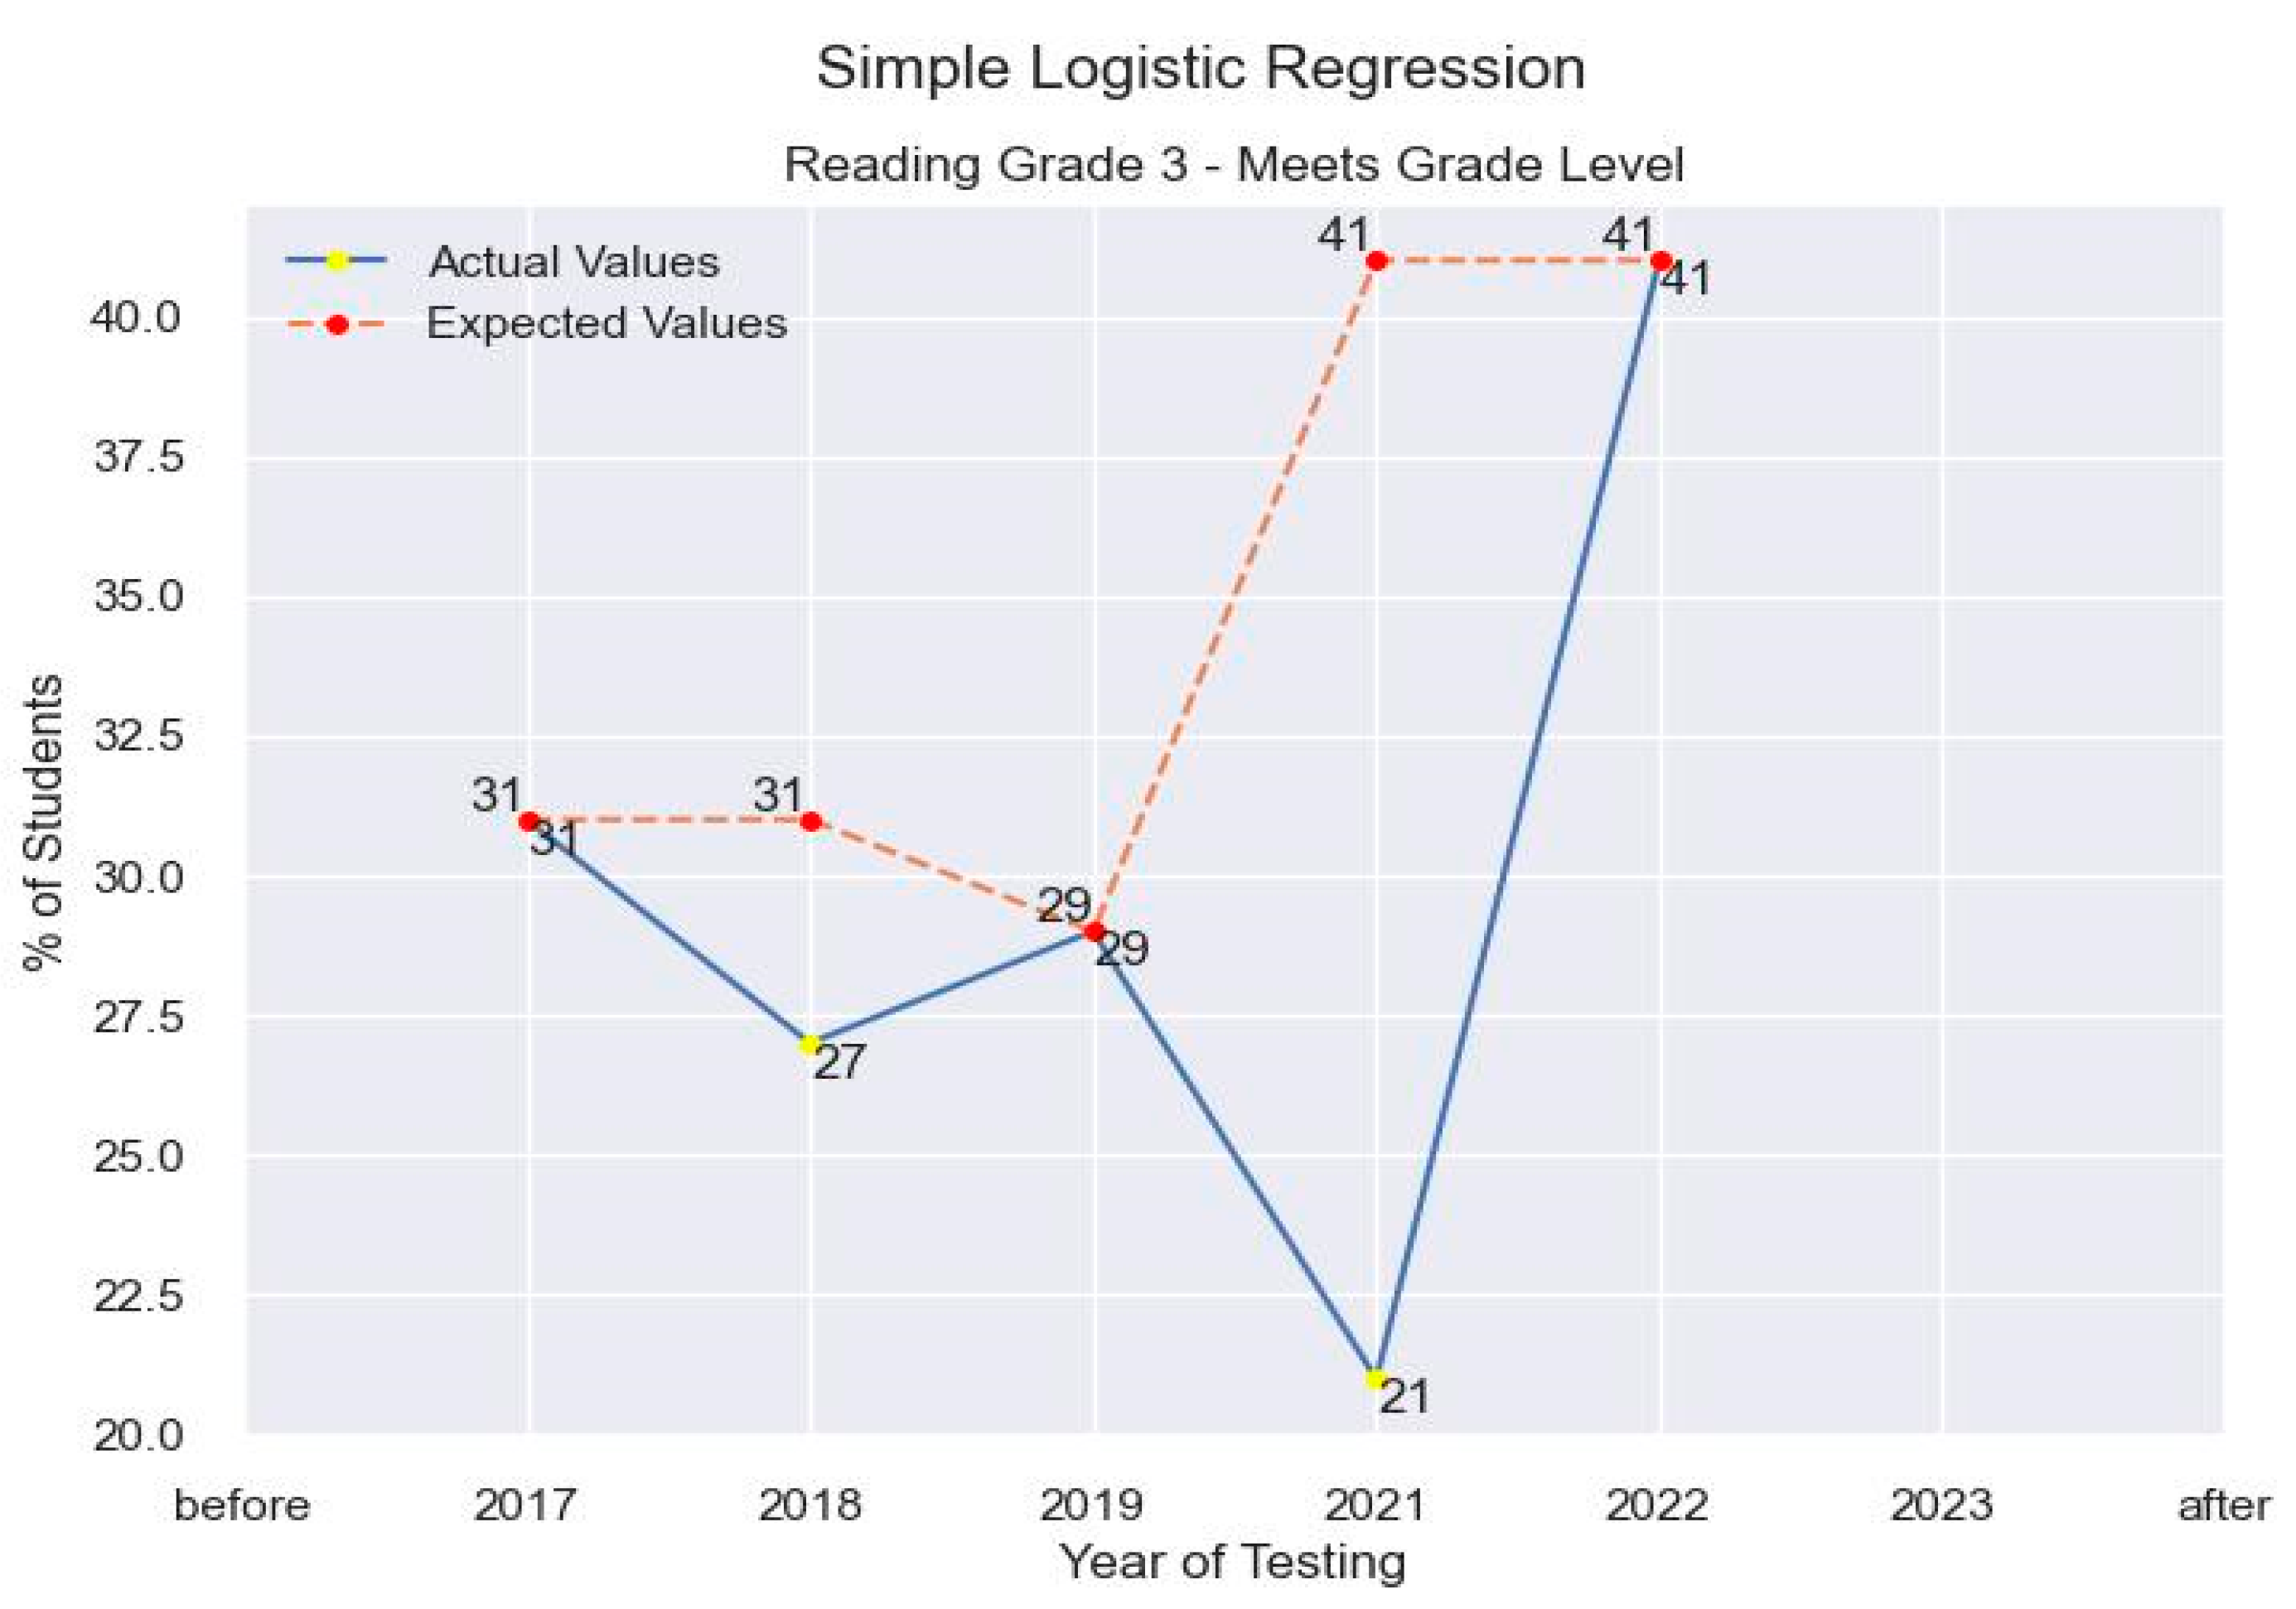
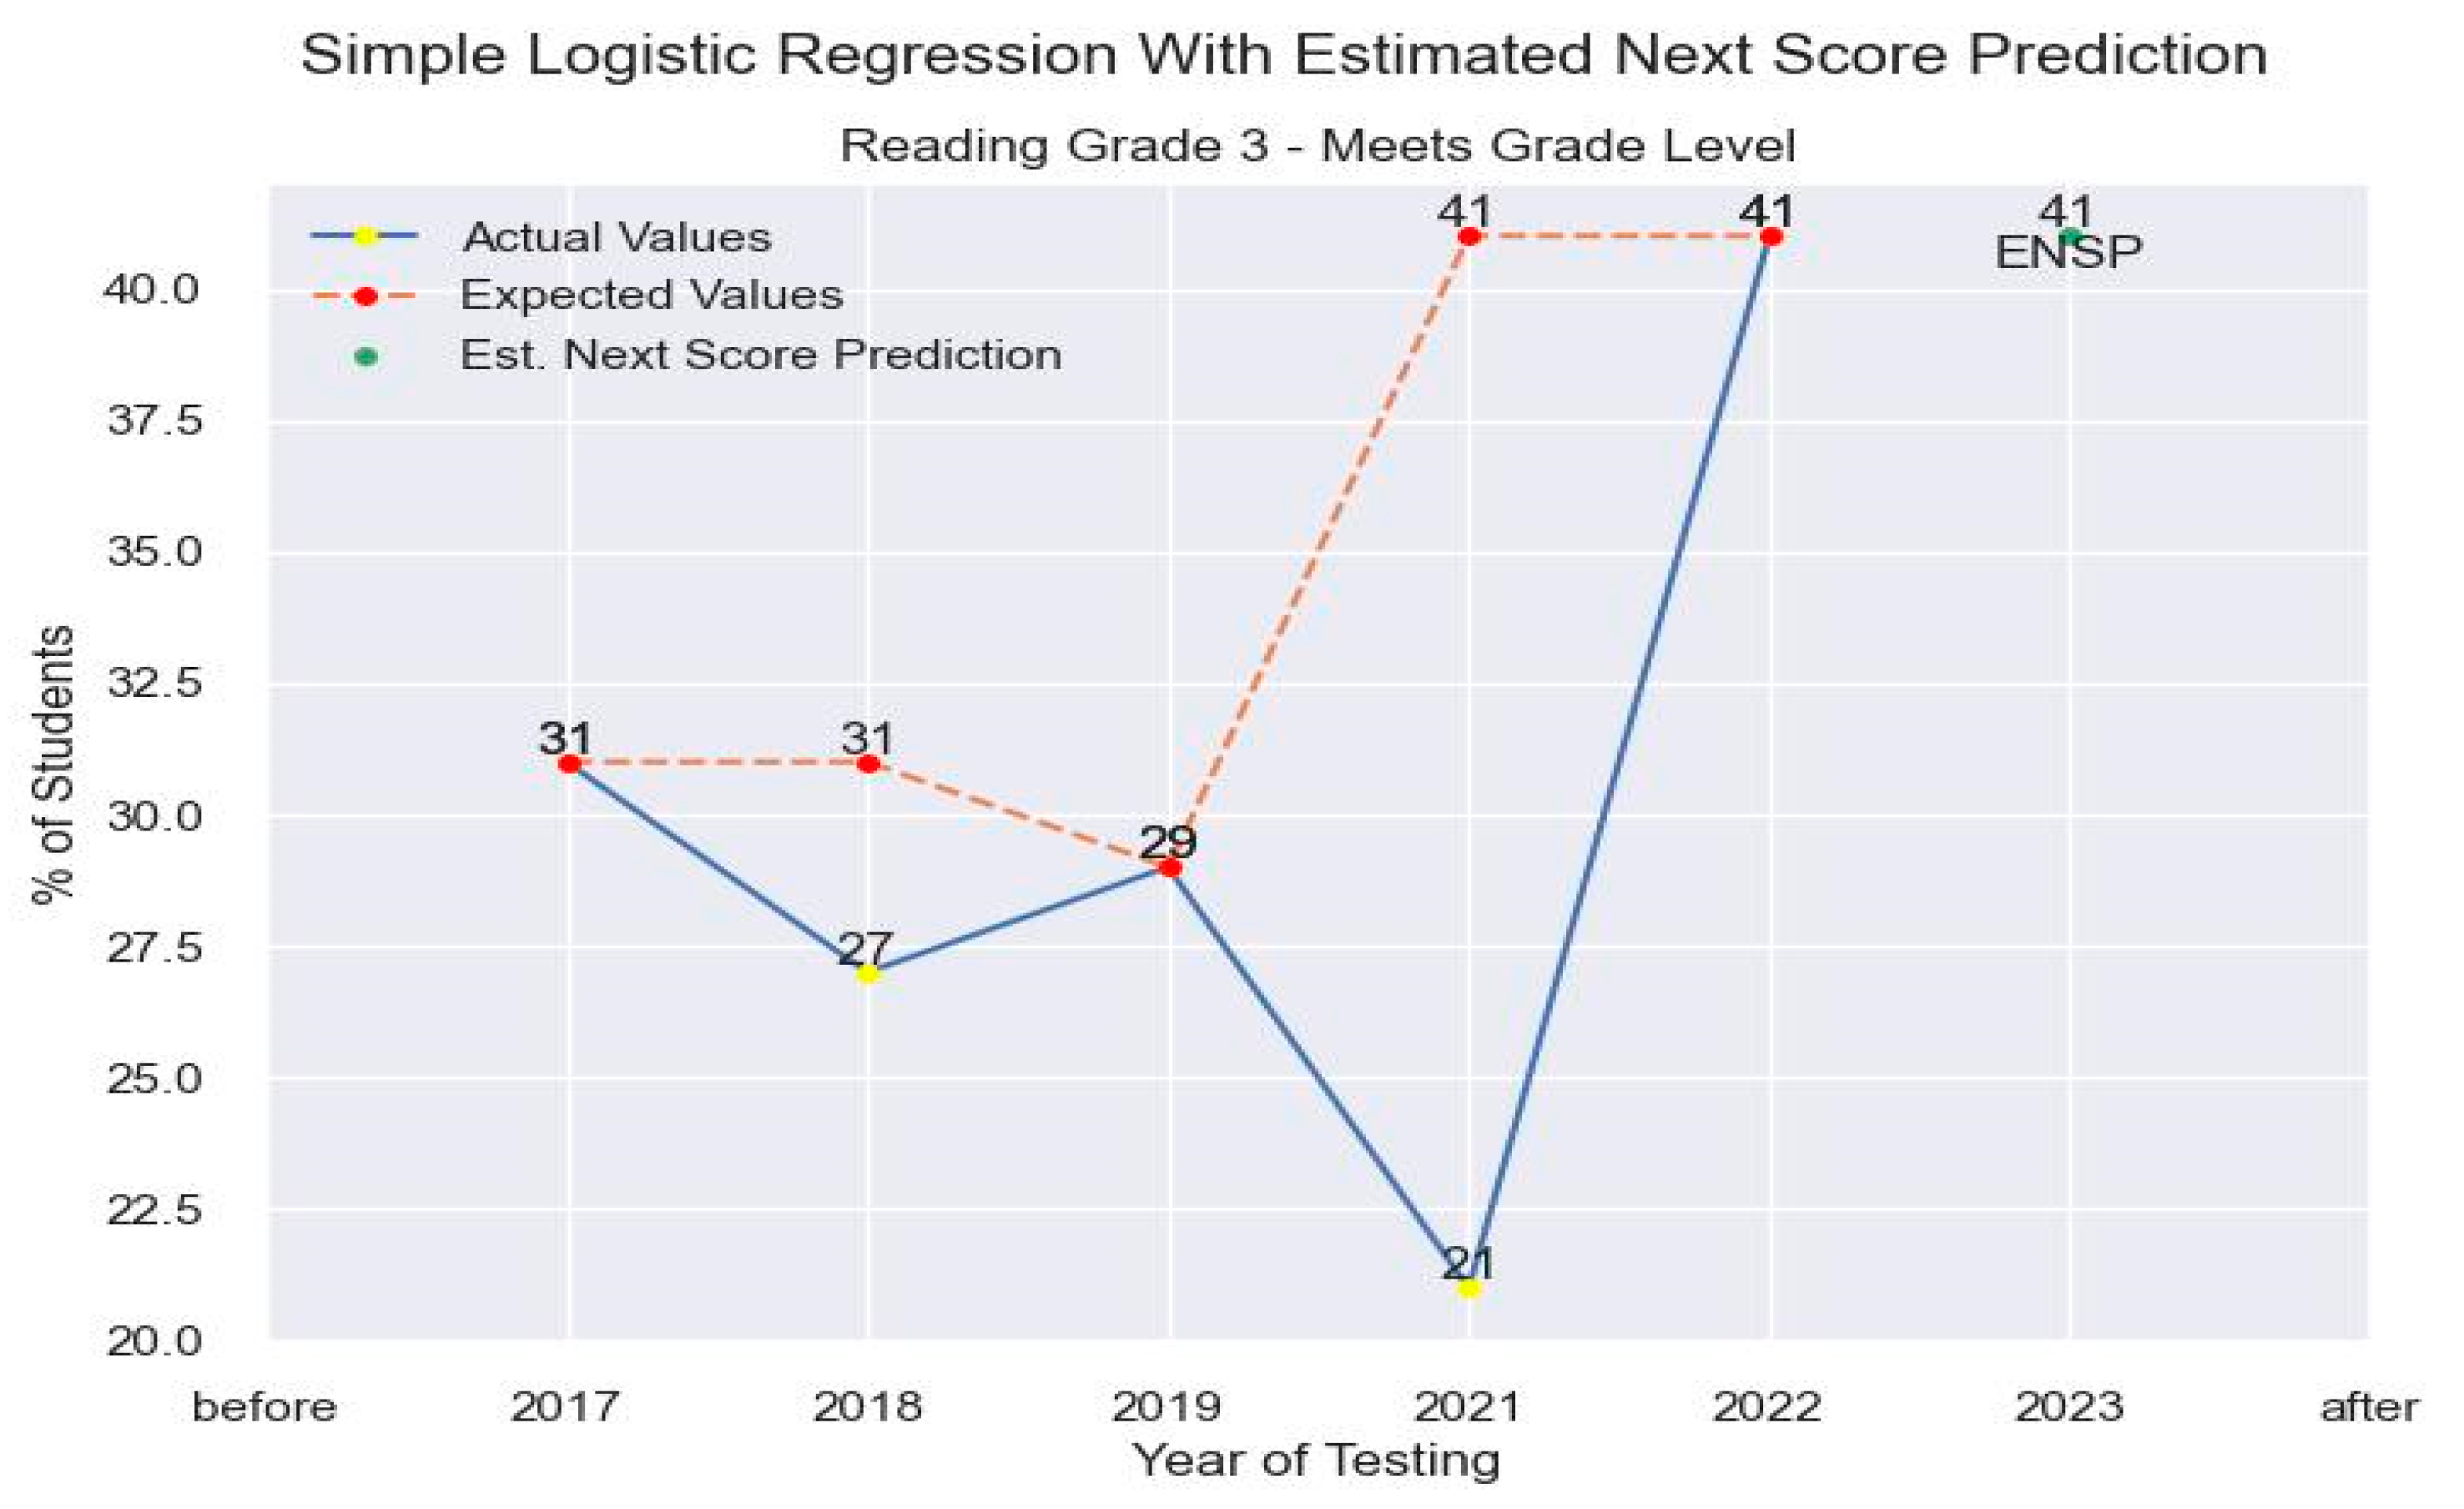
Similarly, with linear regression, we used the same variable and conditions to run our test case under logistic regression. In the paper only one variable is used and following the procedure for logic regression, received an estimate for the predicted value. As with linear regression, the values also assumed no other variable was influencing the result in order to show possibility of regression analysis. Using logistic regression, the estimated next score prediction was computed to be 41%, which can be seen in the figure below.
Figure 19.
Logistic Regression Predictions next score predictions.
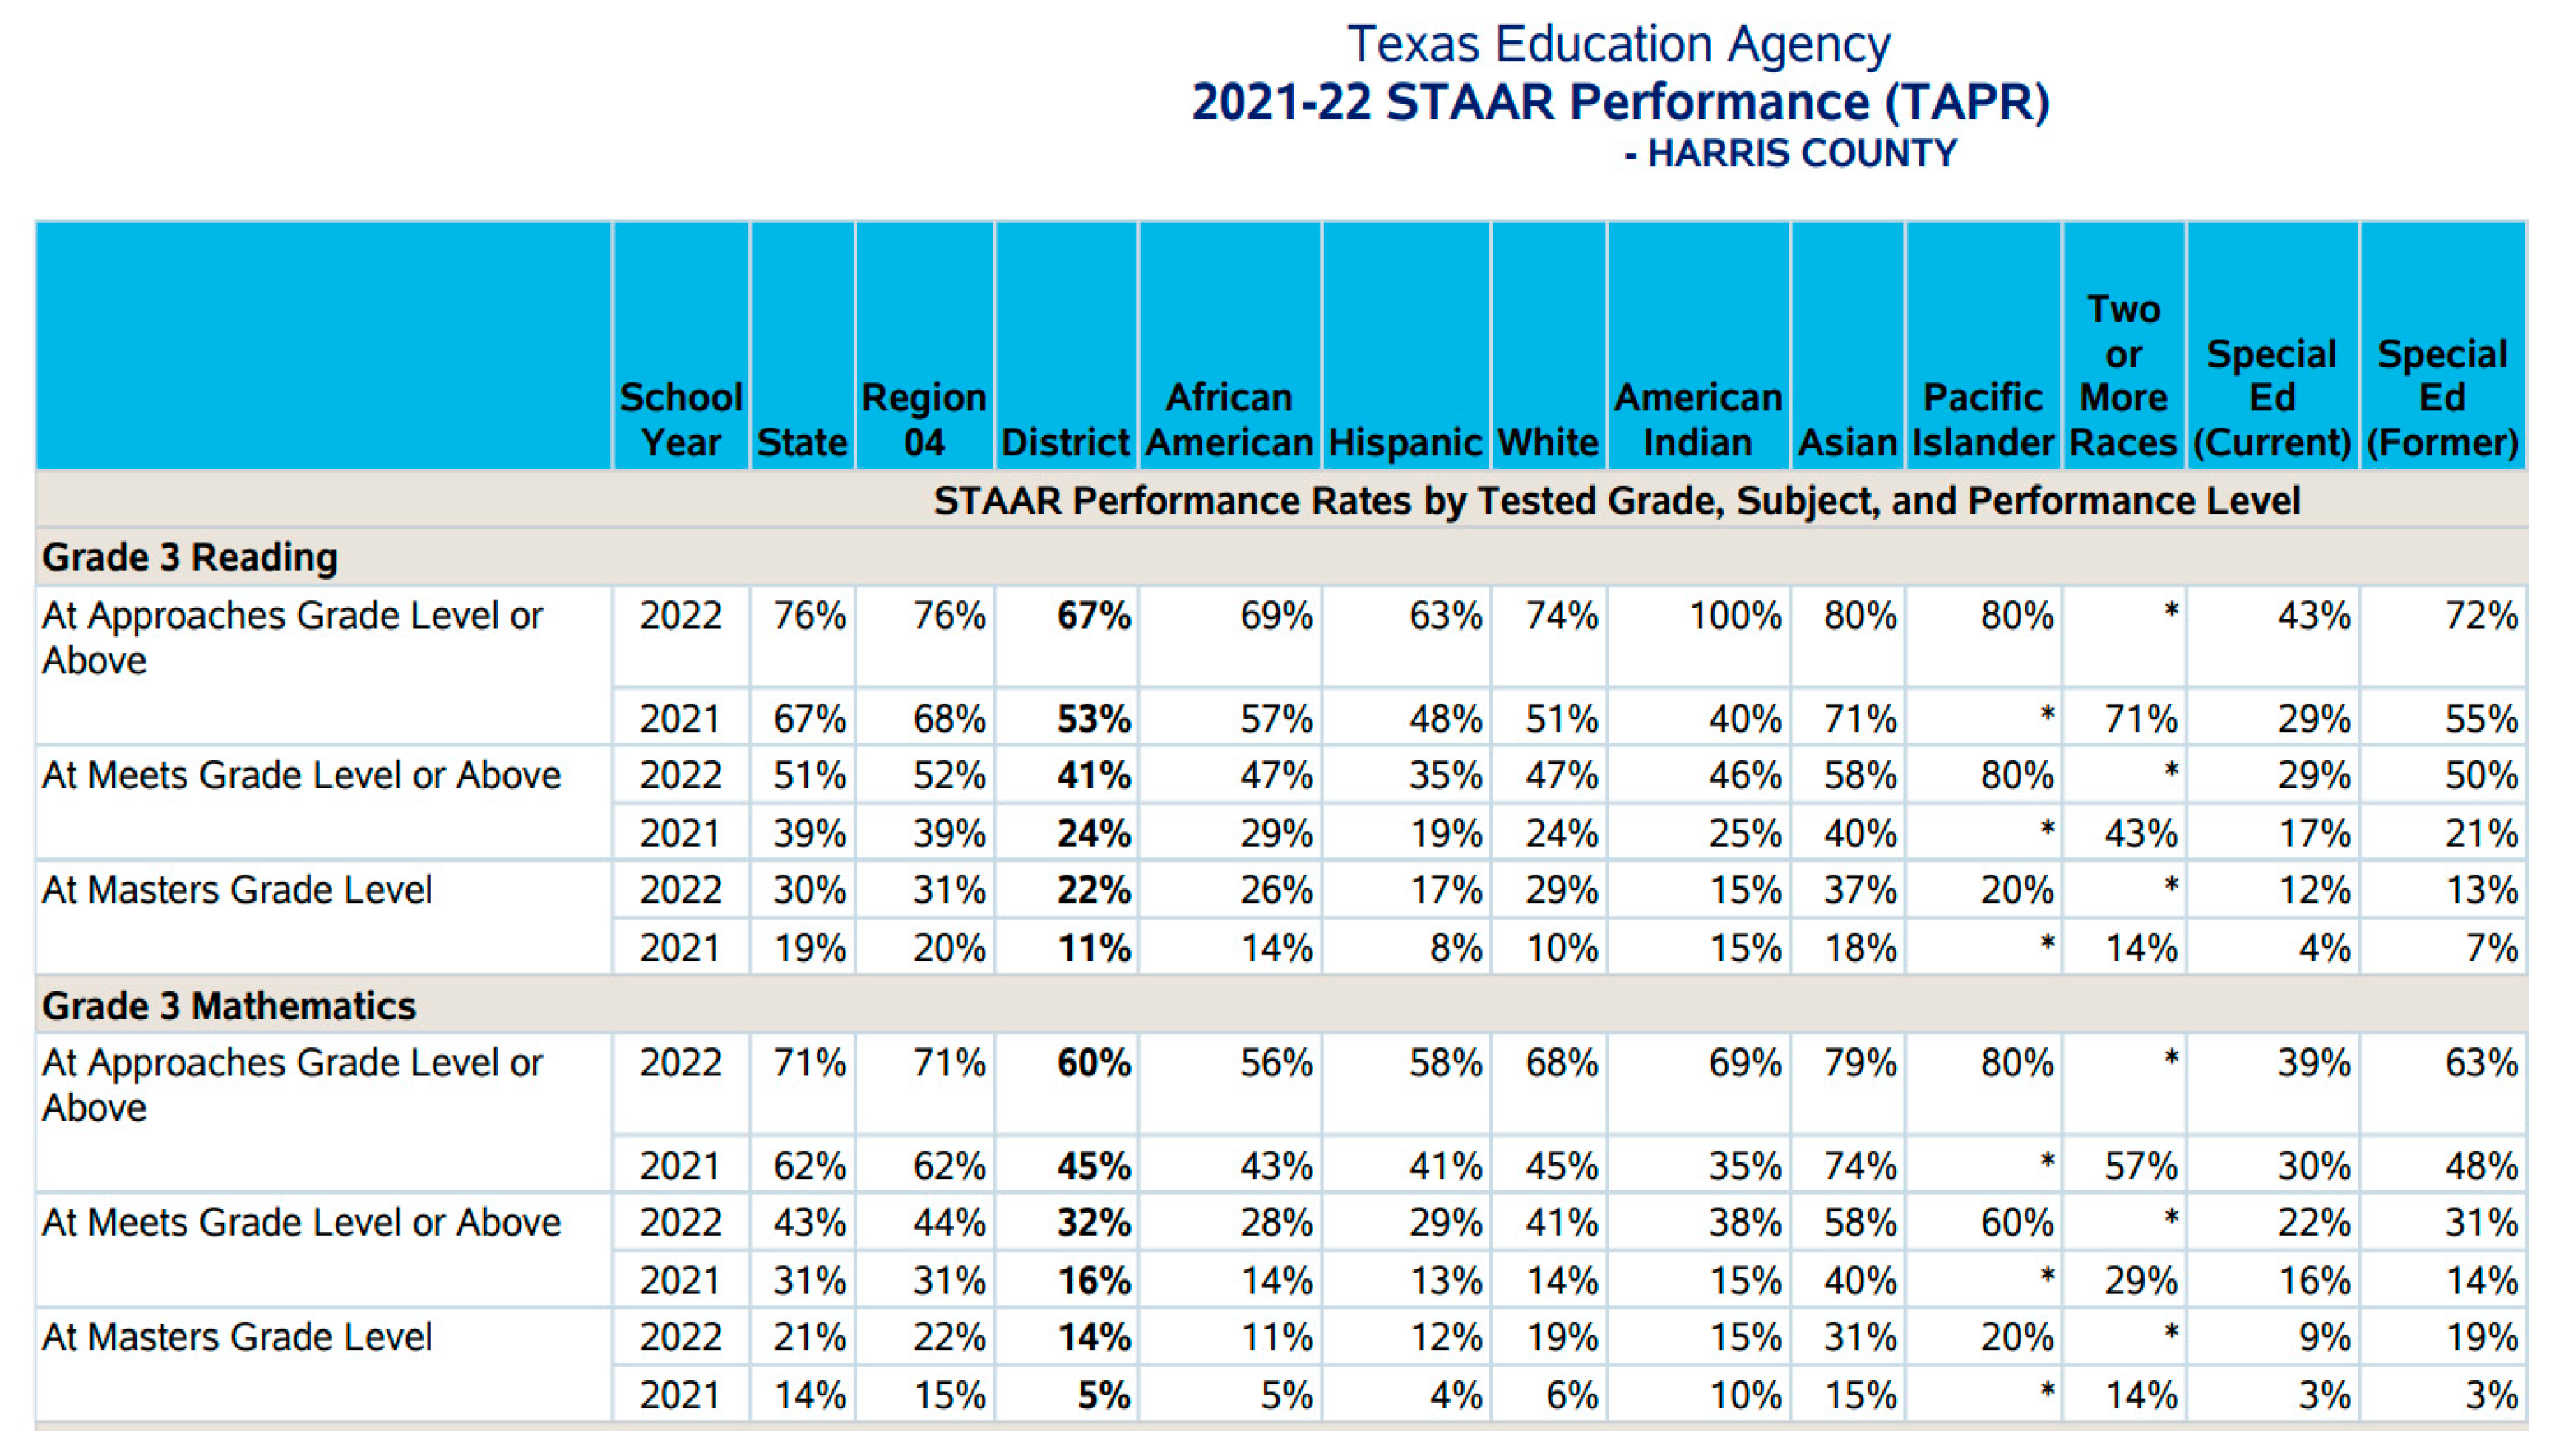
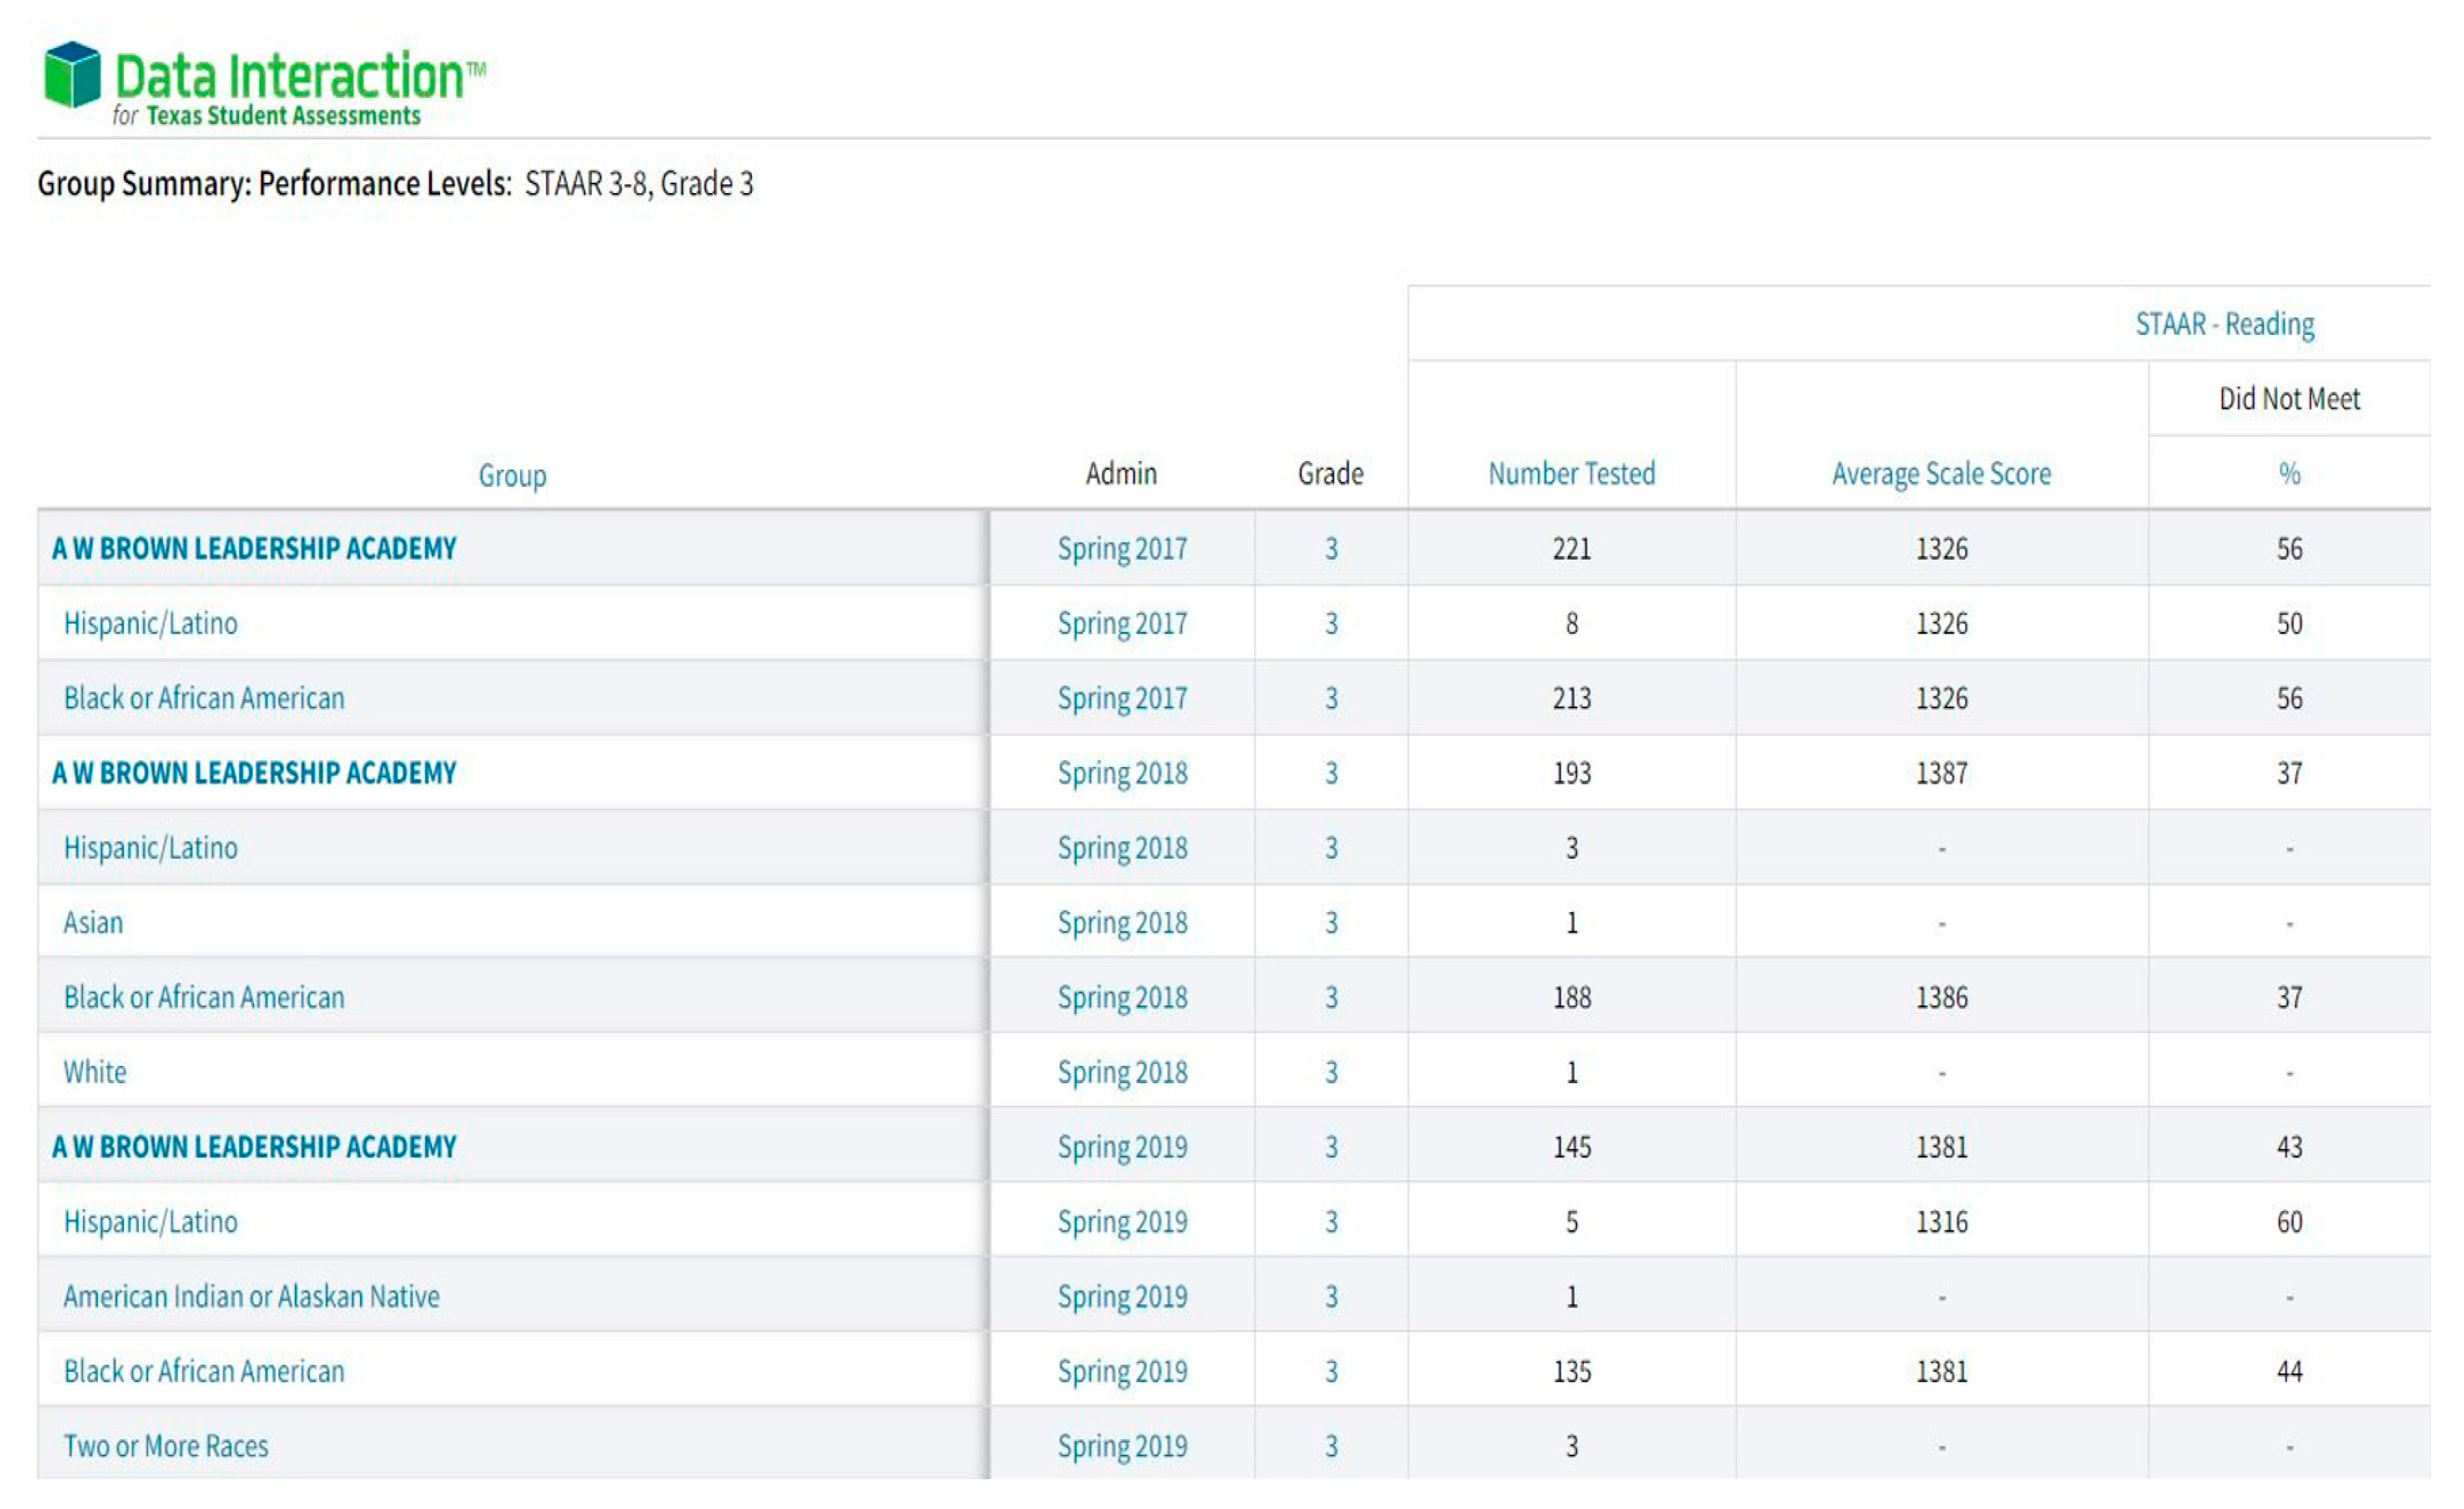
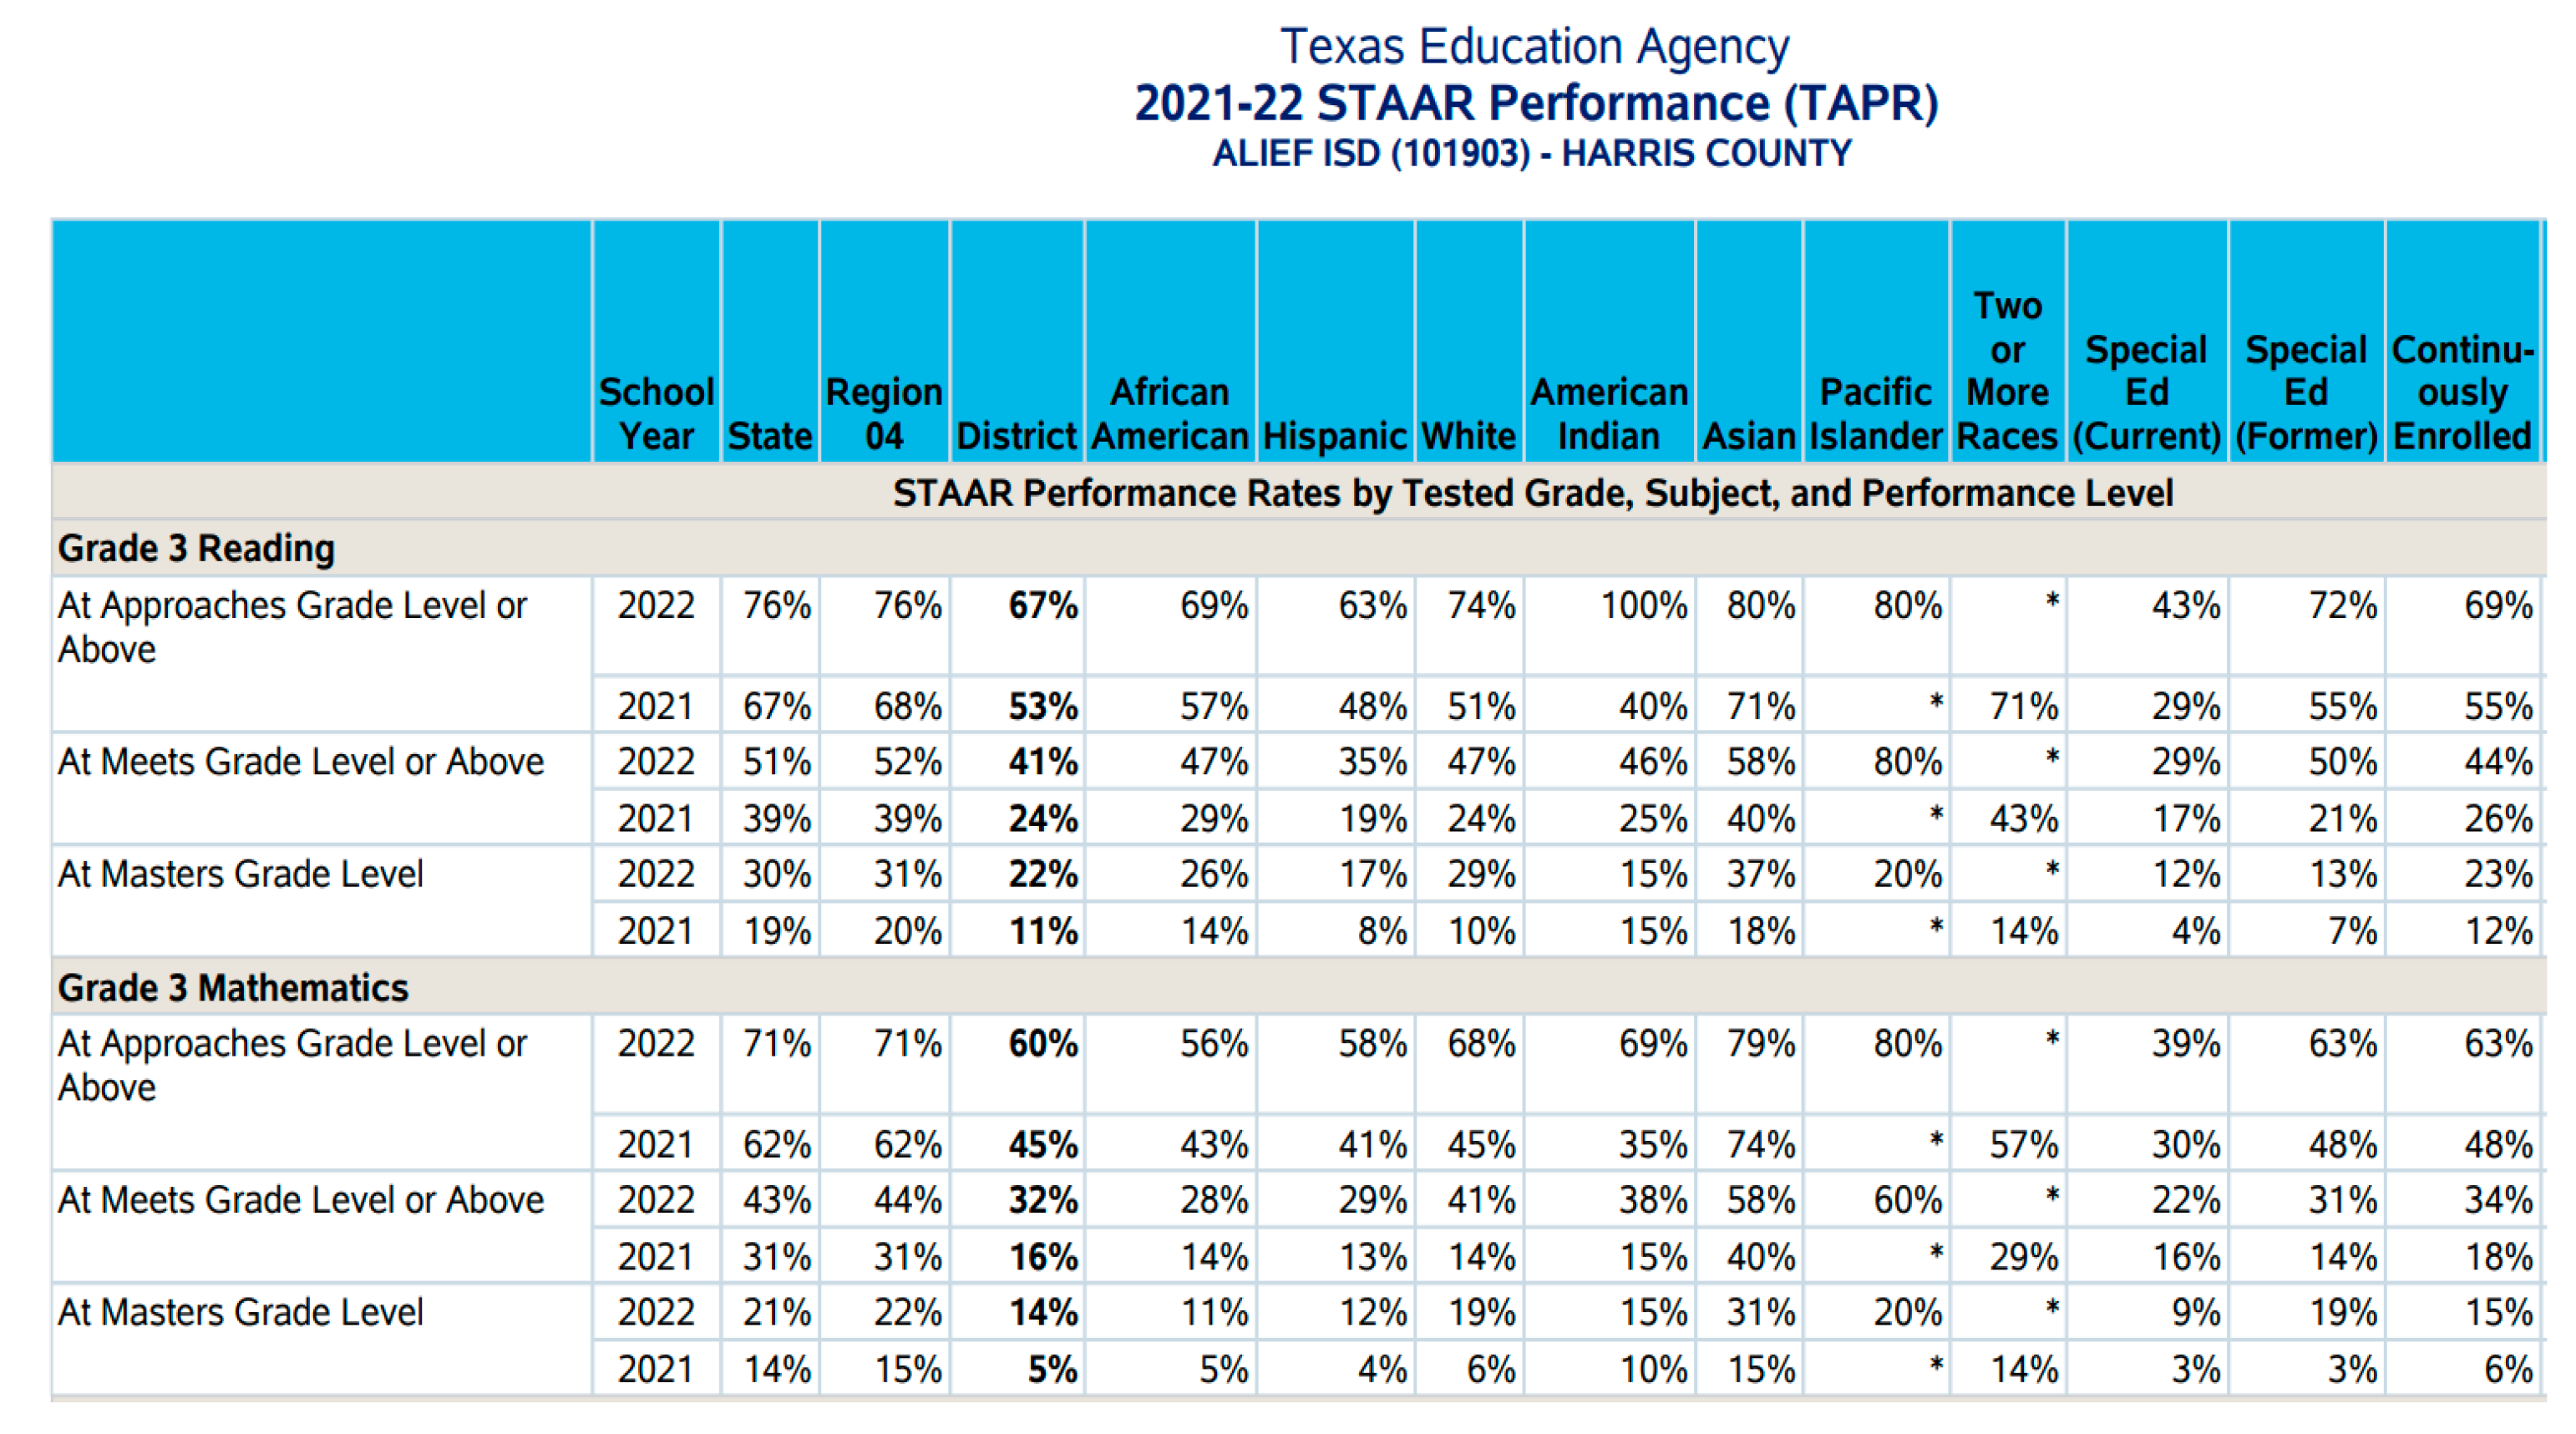
The robustness of the experiment is replicable at multiple levels. Often as previously mentioned, districts may want to do comparisons at a demographic or population group level. Similar with district data, states, districts and even schools have the ability to compare across different subpopulations. To date, the most popular comparisons are usually by racial groups, gender, language and economic groups. Following the same procedure as with our other visualizations and regression techniques, you can derive insights based on your criteria of interest for datasets like the one retrieved from TEA website shown below.
Although in our example we use Python for our practical implementation of the concept, there are many other tools that serve this purpose. And with the progressive movement to dashboarding education is expected to slowly join in the collective of stakeholders buying into them. Other means include using R, Tableau, Power BI, Julia and more that vendors and companies are taking advantage of to customize solutions to sell and deploy products. Each method has its own considerations for usage in the education space. As long as the infrastructure and resources are clearly understood, you can effectively duplicate, streamline, improve or further develop your own avenues for showcasing deliverables within the data-driven space.
One of the driving forces for this paper is the availability to make something of this nature web-deployable. To make this research a fully functional product that education institutions and other stakeholders would find useful, we focused on using tools that they would be able to acquire. It should be re-mentioned that in addition to the data being publicly available and therefore no-cost, the other tools that were used to build this solution were no-cost as well; helping to limit the cost to build and can be replicated by those that would invest time and labor into production. With agencies limiting the funding to education institutions in the U.S., this becomes increasingly important to consider in their budgets. The data can be easily retrieved from the state website. After using python to preprocess the data, we created our visualizations using Jupyter as the IDE to see results.
Figure 20.
Special Population Groups Dataset by Performance Level from TEA.
To showcase the scenarios that use comparisons across locales, we made use of Python libraries to incorporate map and mapping functions with geolocations.
Figure 21.
Districts across Texas-Interactive Choropleth.
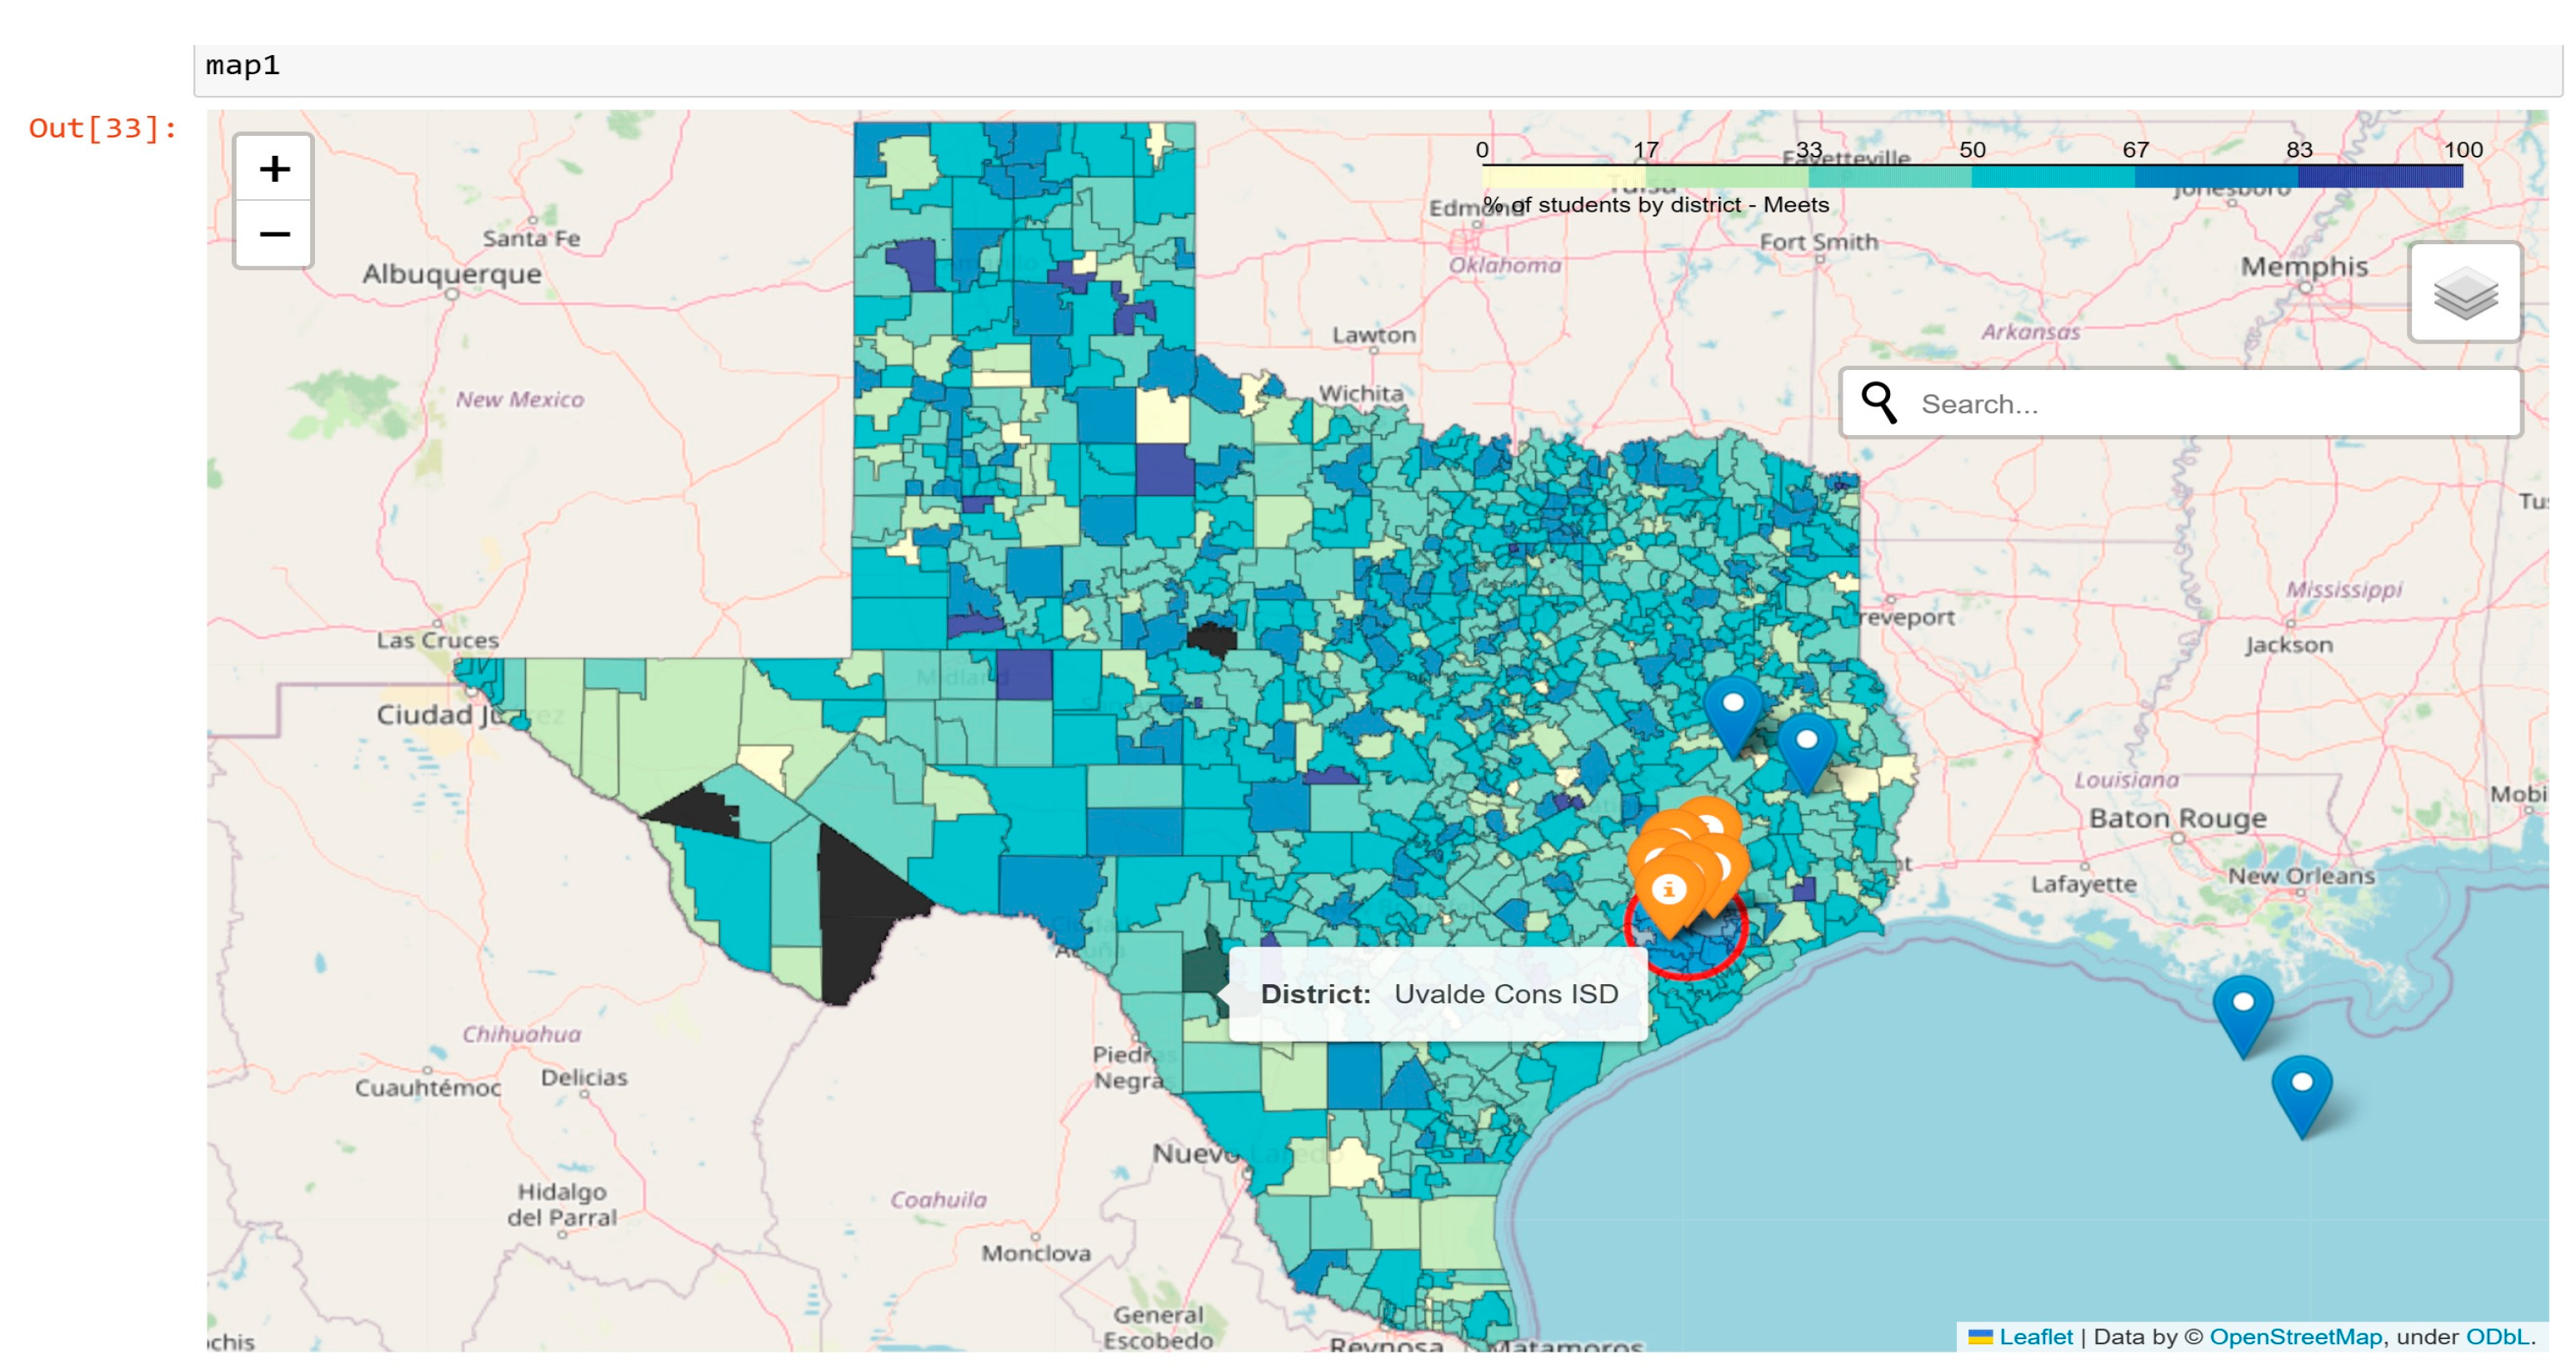
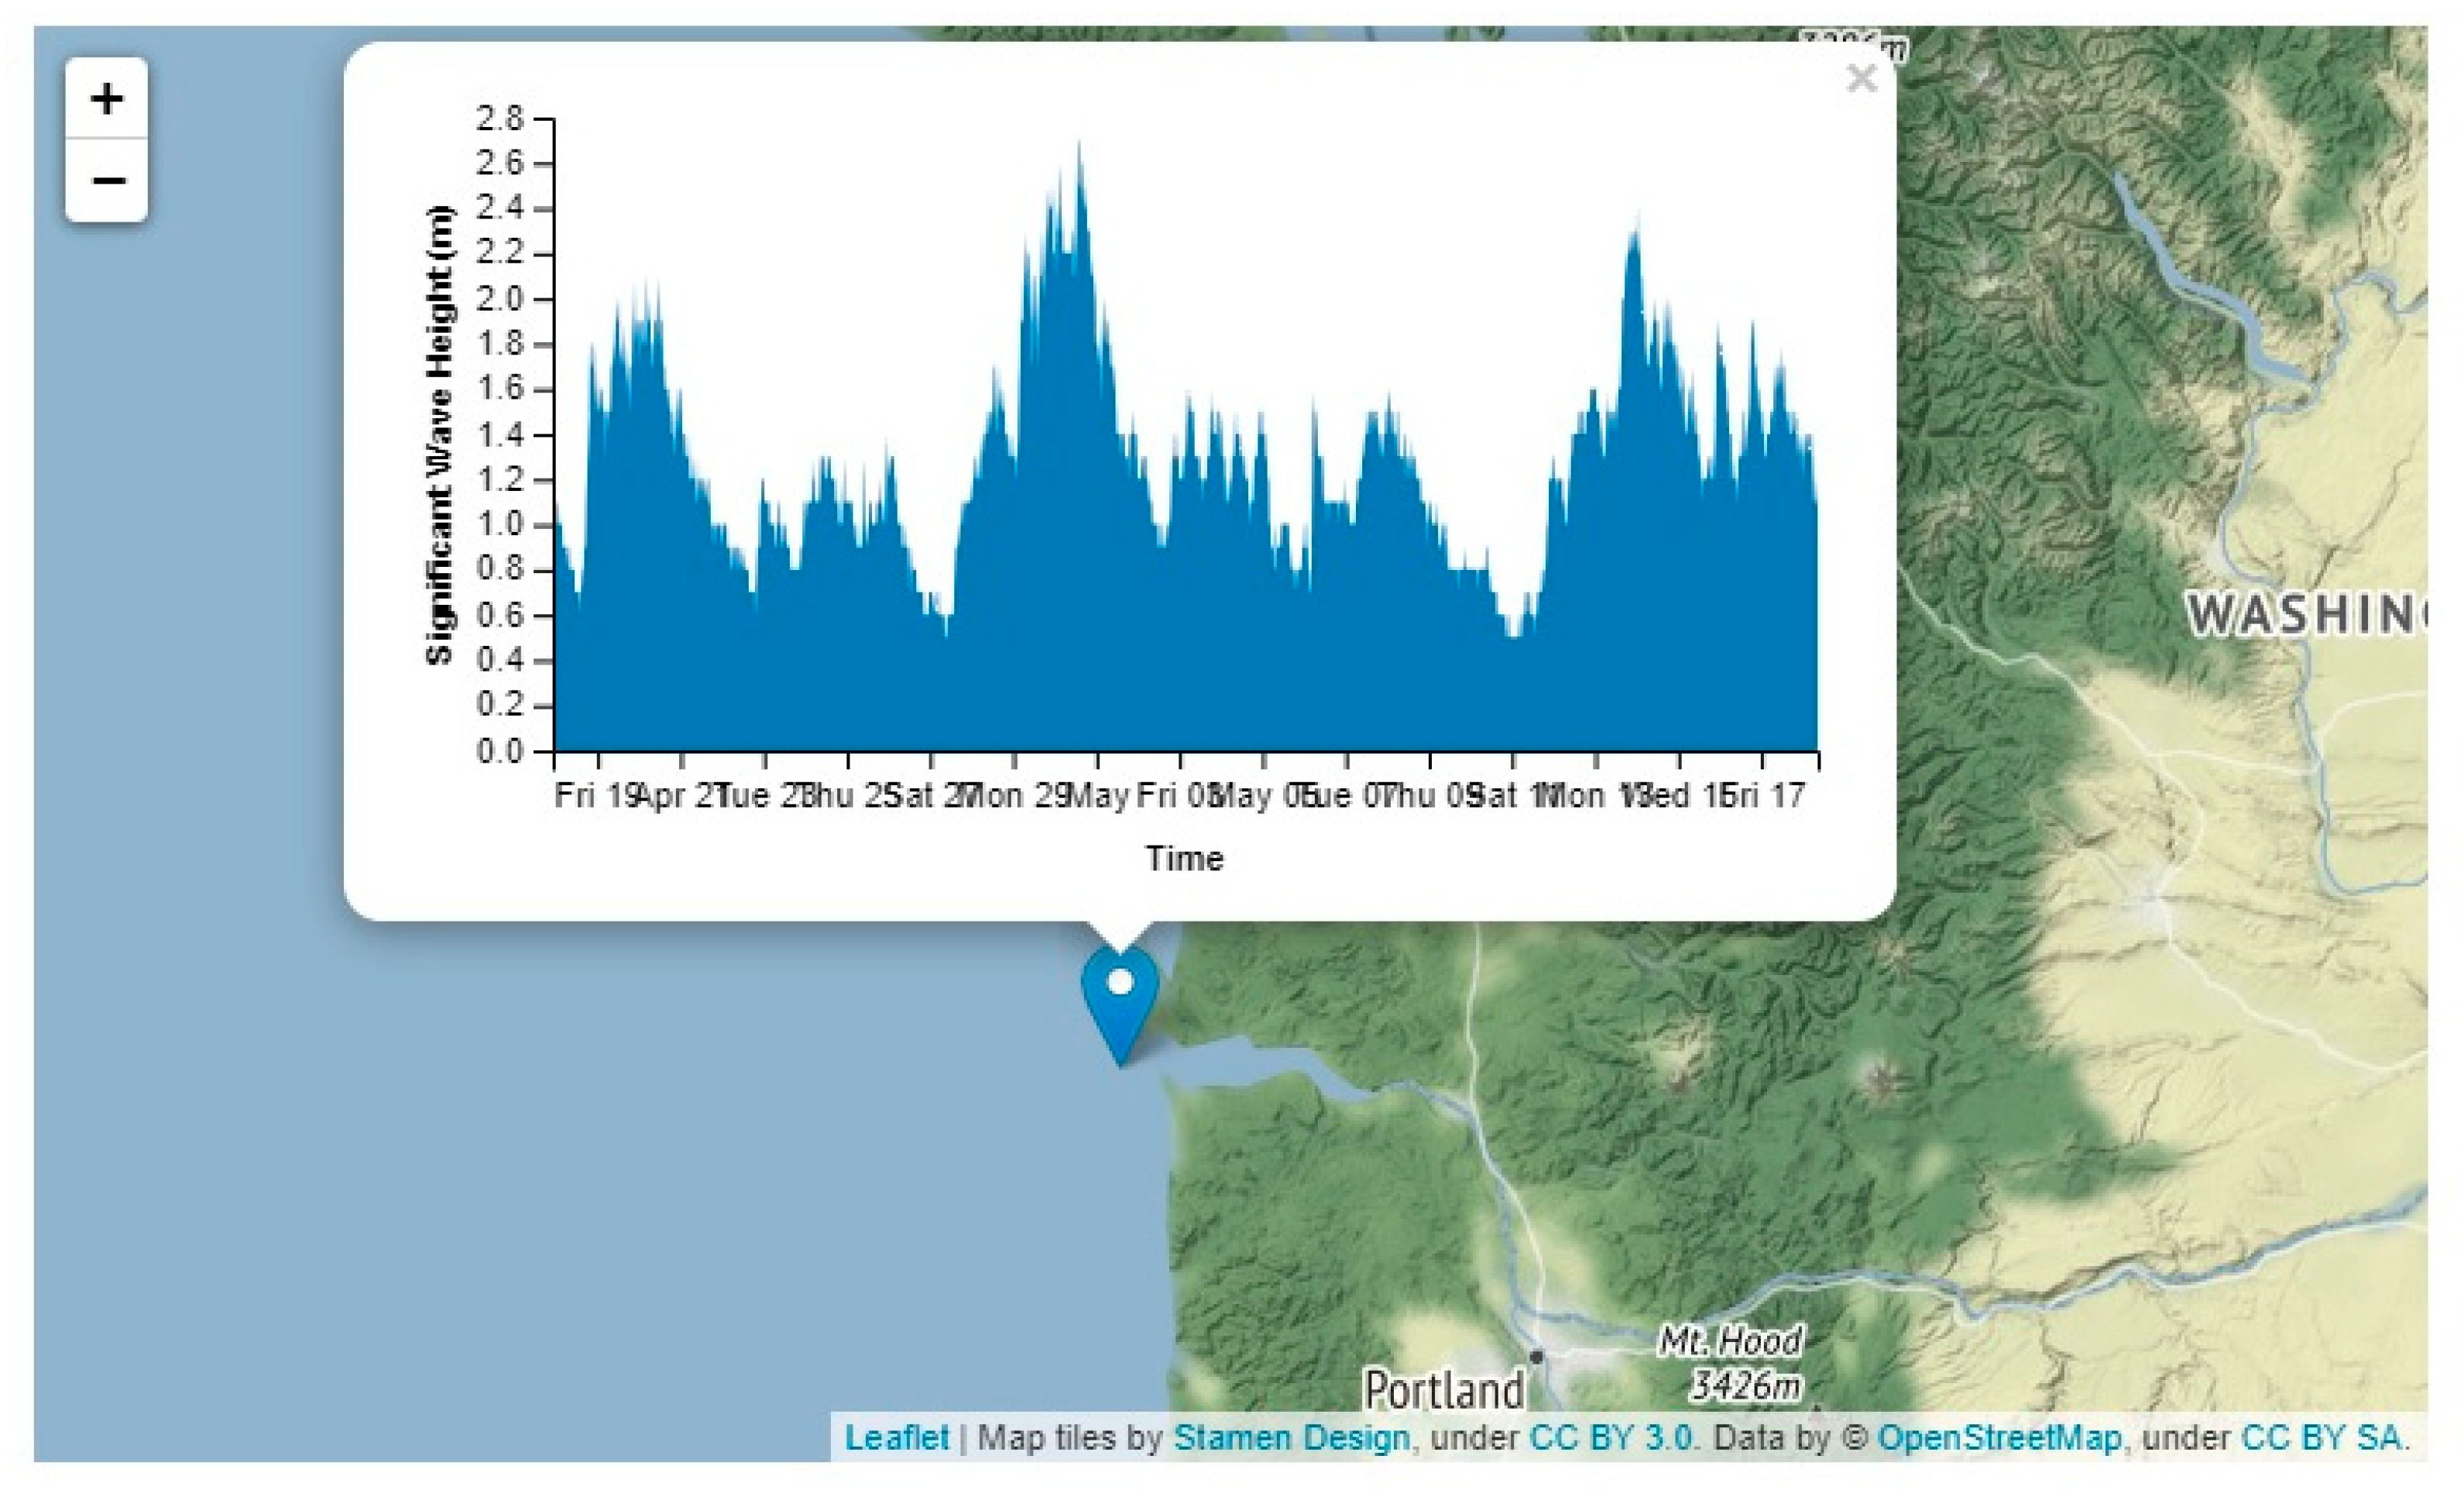
This not only served as a way of providing the ability to compare data across locales, but also interact with the maps to perform useful functions such as searches, radius marking, and multilevel information relay. We can hide features that would be important to have at the ready for users on rollover or click function and embed those qualities into the map so that each location has their own specific detailing according to the information available (see Figure 22). The web-deployment criteria were successfully implemented using StreamLit, a powerful tool allowing for results to web browser that is typically the preferred method of information display. StreamLit allowed the flexibility to take any visualizations, documents, videos and more to build an interactive site. We tested this by creating in Python html document ready pages for our visualizations and linking them as subpages. Some of the data was output as tables that were directly read from our data files into StreamLit. Even the interactive maps were able to find their home on the site page with full functionality intact.
Figure 22.
Example of Optional Features for Maps Using Folium.
Since our approach required the use of command line code to run StreamLit, it also provided an excellent method for packaging as a runnable software package. By creating a simple executable or batch file to run the code(s) required, you have an easy and simple way to deploy this solution as an in-house product for an institution.
Figure 23.
Deploying Creations to Functional Websites Using StreamLit.
The solution can be housed on any server and deployed from any station or imaged into an institution’s endpoint configuration. Python, RStudio, Dash and other tools have the ability to interact and deploy web solutions proving that this is not only useful, but sustainable in the education space. There are numerous avenues this product can live in an environment and what makes it flexible is that it is also able to be delivered through systems such as Altiris, SCCM or ServiceNow, if group policy management determining device management were of consideration. Further improvements would allow the use of automation through Selenium to incorporate action-based scripting. With the completion of this research and paper, this could be used for presentation of modernizing decision making in education for multiple levels of education. While this research was implemented on K-12 data, it also has the versatility to be used in higher-ed. As in the case with other programs such as “My Brother’s Keeper” we could also integrate multiple sources of data to increase the types of information presented to stakeholders the more granular the request is.
One example is local disciplinary data or epidemiological records that would then showcase education results and its level of relationship between them. Since there are very little programs available providing these types of complete and comprehensive visualizations, especially those that are useful as case management tools, if worked to its fullest potential we could actually derive cross-functional insights from several correlational studies.
5. Discussion
School improvement and accountability is a driving force in competition for enrollment between schools. To this end, schools have several needs to address in order to remain abreast of operational ability. Those needs include equity, proficiency, expenditures, economic determinants as well as others [29]. Schools are one of the places where we spend time learning about ourselves and the world. As such, there is often a need to choose an institution of learning based on what is culturally valued. One of the most agreed upon baseline metrics is educational proficiency and performance in academics [30,31,32].
As institutions begin to take further advantage of data to drive improvement [33], one of the useful approaches to gaining insight is to use current technology to visualize the data, provide an avenue for analyzing statistical trends, and use artificial intelligence by machine learning to predict events [34]. The background of the basis of this research stems from a noticeable lack of material and easily accessible means of providing user-friendly and actionable data to schools, specifically in the state of Texas. Often schools comb through unfriendly/unwieldy reports that are time consuming to make any real use of. While the state is improving their ability to work towards creating effective dashboards and other useful tools, this research will demonstrate how schools can take the initiative to work towards that goal with greater independence [35].
In this paper, we hoped to set a base for the future usage of artificial intelligence (AI) and use cases of visualizations associated as an outcome of the design. As AI intends to build mimicked cognitive function, the use of this research can enable to some degree a response-type product in the future primarily in the scope of analytics or image processing. In AI, the computer, system or inorganic (artificial) component is endowed with capabilities assumptive of human ability (intelligence). The process components of AI are to essentially teach a system, the system then learns, the system judges or makes decisions and then finally, the system then acts or performs a task based on the previous input. One of the examples of that application that was explored here was in machine learning (ML) and algorithms. In machine learning, the intent is to teach a computer, system or machine to learn through algorithms. To leverage these effectively in education, the appropriate visualizations must also accompany it [36].
6. Conclusions
This research will serve to offer a second look into data elements and determine if there is cause to explore other options. By completing this paper, it can offer conclusive evidence on the approaches and help solve lingering issues. With the benefit of years of experience in computation, programming, simulation as well as the close ties to this subject, one can combine the visualizations produced with data science to make relevant meaning for not just the administration but other stakeholders that may arise as a result.
One can look forward to working further on this research to model and create unbiased visualizations. Some invested stakeholders have expressed a high interest in the work of the initial research with the openness to pursue future outcomes. By creating and providing supporting visualizations, we could potentially improve efforts to rehabilitate the currently used processes and prevent side-effects of data lag in education. There is a very high level of confidence that this approach can effectively provide a route to pinpointing areas of concern within the desired research range and if unable to retrieve enough data, can accept alternate usable data in its place. The plan put forth is a rough estimate of feasibility and it is believed this model will work to drive a successfully completed implementation.
This research employed statistical analysis, interactive maps, density metrics, etc. as tools to engage stakeholders in investigating metrics across target data. Although data preprocessing was employed to streamline some of the visualizations for the purpose of this demonstration, these strategies are effective for modeling and predicting data under any desired condition. Additionally, through this implementation it was able to effectively show insight into how negative an inaccurate representation impacts a user. Quite a few tools that are available to use are not limited to the ones presented here and some can work with different network organization and deployment requirements (cloud, batch, and network image deployment). One of the ones that are common, popular to use and that has been gaining ground is machine learning. Others include open-source tools and programming languages that use statistical functions. The usage of these in the education space to drive decision making and school improvement instead of as a content focus needs greater consideration with focus to implementation. By learning the concepts central to visualization and compounding that knowledge with understanding applicable implementation, we can provide reasonable use cases while still providing readable and usable images for users.
Overall, this paper is geared towards showcasing visualizations, AI/ML and their effective usefulness in education. Our test case proves that there is a comparative advantage in applying their concepts and web technology to enhance data-driven decisions and instruction. We were able to successfully use the data to show that the distributions differ and look for future work to apply other studies to bolster our analysis. Additionally, this data and its accompanying results affords the ability to consider utilizing machine learning as a tool for identification of delineating factors.
Author Contributions
Conceptualization, L.T. and V.G.; methodology, L.T.; software, L.T.; validation. L.T. and V.G..; formal analysis, L.T.; investigation, L.T.; resources, L.T. and V.G.; data curation, L.T.; writing—original draft preparation, L.T.; writing—review and editing, L.T., V.G. & K.J.; visualization, L.T.; supervision, V.G.; project administration, V.G.; All authors have read and agreed to the published version of the manuscript.
Funding
This research has received no external funding.
Conflicts of Interest
The authors declare no conflict of interest.
References
- Tang, N., Wu, E., Li, G. 2019. Towards Democratizing Relational Data Visualization. In 2019 International Conference on Management of Data (SIGMOD ’19), June 30–July 5, 2019, Amsterdam, Netherlands. ACM, New York, NY, USA, 6 pages. [CrossRef]
- U.S. Department of Education, Office of Educational Technology, Artificial Intelligence and Future of Teaching and Learning: Insights and Recommendations, Washington, DC, 2023.
- Ocheja, P., Flanagan, B., Oyelere, S., Ogata, H. (2022). Visualization of education blockchain data: trends and challenges. Interactive Learning Environments. [CrossRef]
- Pella, S. (2012). What should count as data for data driven instruction? Toward contextualized data-inquiry models for teacher education and professional development. Middle Grades Research Journal, 7. 57-75.
- Marshall, K. (2009). What Data-Driven Instruction Should Really Look Like. Available online: URL: https://www.teachermagazine.org (accessed on 28 Jan 2024).
- Results Driven Accountability Data and Reports. Available online: URL: https://tea.texas.gov/reports-and-data/school-performance/results-driven-accountability-data-and-reports (accessed on 28 Jan 2024).
- Dayana, B. D., Samanta, A., Ranganathan, N., Venkatachalam, K., & Jain, N. (2019). A comprehensive approach to visualize industrial data set to meet business intelligence requirements using statistical models and big data analytics. International Journal of Recent Technology and Engineering, 7(6), 1437–1443.
- Moss, G. (2014). The Rise of Data in Education Systems: Collection, visualization and use. London Review of Education. 12. 154-155. [CrossRef]
- Yafeng, Z., Yaning, Z., Xue, B., Qian, F. (2021). Survey of Big Data Visualization in Education. doi: 10.3778/j.issn.1673-9418.2009014. [CrossRef]
- Chai, C.P. (2020) The Importance of Data Cleaning: Three Visualization Examples, CHANCE, 33:1, 4-9. [CrossRef]
- Zhai, X., Chu, X., Sing Chai, C., Siu Yung Jong, M., Istenic, A., Spector, M., Liu, J., Yuan, J., Li, Y. "A Review of Artificial Intelligence (AI) in Education from 2010 to 2020", Complexity, vol. 2021, Article ID 8812542, 18 pages, 2021. [CrossRef]
- Uyan Dur, B. (2014). Data Visualization and Infographics in Visual Communication Design Education at the Age of Information. Journal of Arts and Humanities (JAH), Volume -3, No.-5, May, 2014.
- Rui, Z., Badarch, T. (2022). Research on Applications of Artificial Intelligence in Education. American Journal of Computer Science and Technology, 5(2), 72-79. [CrossRef]
- Jones, M. 1985. Applications of Artificial Intelligence Within Education. DOI: 10.1016/0898-1221(85)90054-9. [CrossRef]
- Beck, J., Stern, M., Haugsjaa, E. (1996). Applications of AI in education. XRDS 3, 1 (September 1996), 11–15. [CrossRef]
- Wang, P., Zhao, P., Li, Y., Tai Chui, K. 2022. Design of Education Information Platform on Education Big Data Visualization. Wirel. Commun. Mob. Comput. 2022 (2022). [CrossRef]
- Llaha, O., Aliu, A. (2023). Application of Data Visualization and Machine Learning Algorithms for Better Decision Making.
- Williamson, B. (2016). Digital education governance: data visualization, predictive analytics, and ‘real-time’ policy instruments, Journal of Education Policy, 31:2, 123-141. [CrossRef]
- Borenstein, J., Howard, A. (2020). Emerging challenges in AI and the need for AI ethics education. [CrossRef]
- Akgun, S., Greenhow, C. Artificial intelligence in education: Addressing ethical challenges in K-12 settings. AI Ethics 2, 431–440 (2022). [CrossRef]
- Data Interaction for Texas Student Assessments. (2023). Group Summary: Performance Levels: STAAR 3-8, Grade 3. Available online: URL: https://txreports.emetric.net/ (accessed on 10 Dec 2023).
- Louisiana Department of Education. (2023). STATEWIDE RESULTS. Available online: URL: https://www.louisianabelieves.com/resources/library/data-center/Statewide-Results (accessed on 10 Dec 2023).
- Louisiana Department of Education. (2023). ELEMENTARY & MIDDLE SCHOOL PERFORMANCE. Available online: URL: https://www.louisianabelieves.com/resources/library/elementary-and-middle-school-performance (accessed on 10 Dec 2023).
- National Center for Education Statistics. (2023). Data & Tools. Available online: URL: https://nces.ed.gov/ (accessed on 10 Dec 2023).
- Texas Academic Performance Reports. (2023). Available online: URL: https://tea.texas.gov/texas-schools/accountability/academic-accountability/performance-reporting/texas-academic-performance-reports (accessed on 10 Dec 2023).
- Texas Assessment Research Portal. (2023). Available online: URL: https://txresearchportal.com/ (accessed on 10 Dec 2023).
- Linear Regression. Available online URL: https://www.cs.toronto.edu/~rgrosse/courses/csc321_2018/readings/L02%20Linear%20Regression.pdf/ (accessed on 10 Jan 2024).
- Logistic Regression. Available online URL: https://web.stanford.edu/~jurafsky/slp3/5.pdf (accessed on 10 Jan 2024).
- Neuman, S.B. (2016). Code Red: The Danger of Data-Driven Instruction. Educational Leadership, 74, 24-29.
- Seo, K., Tang, J., Roll, I. et al. The impact of artificial intelligence on learner–instructor interaction in online learning. Int J Educ Technol High Educ 18, 54 (2021). [CrossRef]
- Perrotta, C., Selwyn, N. (2019): Deep learning goes to school: toward a relational understanding of AI in education, Learning, Media and Technology. [CrossRef]
- Van der Vorst, T., Jelicic, N. (2019). Artificial Intelligence in Education: Can AI bring the full potential of personalized learning to education?, 30th European Conference of the International Telecommunications Society (ITS): "Towards a Connected and Automated Society", Helsinki, Finland, 16th-19th June, 2019, International Telecommunications Society (ITS), Calgary. http://hdl.handle.net/10419/205222.
- Hershkovitz, A. (2015). Towards data-driven instruction. Teaching, Instruction, Cognition and Learning.
- Williamson, B. 2014. New centers of data visualization in education. DMLcentral.net, 26 June 2014.
- 35. Vincent-Lancrin, S. and R. van der Vlies (2020), "Trustworthy artificial intelligence (AI) in education: Promises and challenges", OECD Education Working Papers, No. 218, OECD Publishing, Paris. [CrossRef]
- Firat, Elif E., Laramee, R. (2018). Towards a Survey of Interactive Visualization for Education.
- Ojha, S., Narendra, A., Mohapatra, S., & Misra, I. (2023). From Robots to Books: An Introduction to Smart Applications of AI in Education (AIEd). arXiv preprint arXiv:2301.10026.
- Sharma, R. (2021). Applications of Artificial Intelligence in Education. 1-4.
- Xu, Z., Wei, Y., Zhang, J. (2021). AI Applications in Education. In: Shi, S., Ye, L., Zhang, Y. (eds) Artificial Intelligence for Communications and Networks. AICON 2020. Lecture Notes of the Institute for Computer Sciences, Social Informatics and Telecommunications Engineering, vol 356. Springer, Cham. [CrossRef]
- L. Chen, P. Chen and Z. Lin, "Artificial Intelligence in Education: A Review," in IEEE Access, vol. 8, pp. 75264-75278, 2020. [CrossRef]
- Gibson, J. P., & Mourad, T. (2018). The growing importance of data literacy in life science education. American journal of botany, 105(12), 1953–1956. [CrossRef]
- Davis Bianco, S. (2010). Improving Student Outcomes: Data-driven Instruction and Fidelity of Implementation in a Response to Intervention (RTI) Model. TEACHING Exceptional Children Plus, 6(5) Article 1. Retrieved [date] from http://escholarship.bc.edu/education/tecplus/vol6/iss5/art1.
- Halverson, R., Grigg, J., Prichett, R., Thomas, C. (2006). The new instruction leadership: Creating data-driven instructional systems in schools. Journal of School Leadership. 25. [CrossRef]
Figure 1.
Implementing Choropleths and Interactive Maps with Geojson Files.
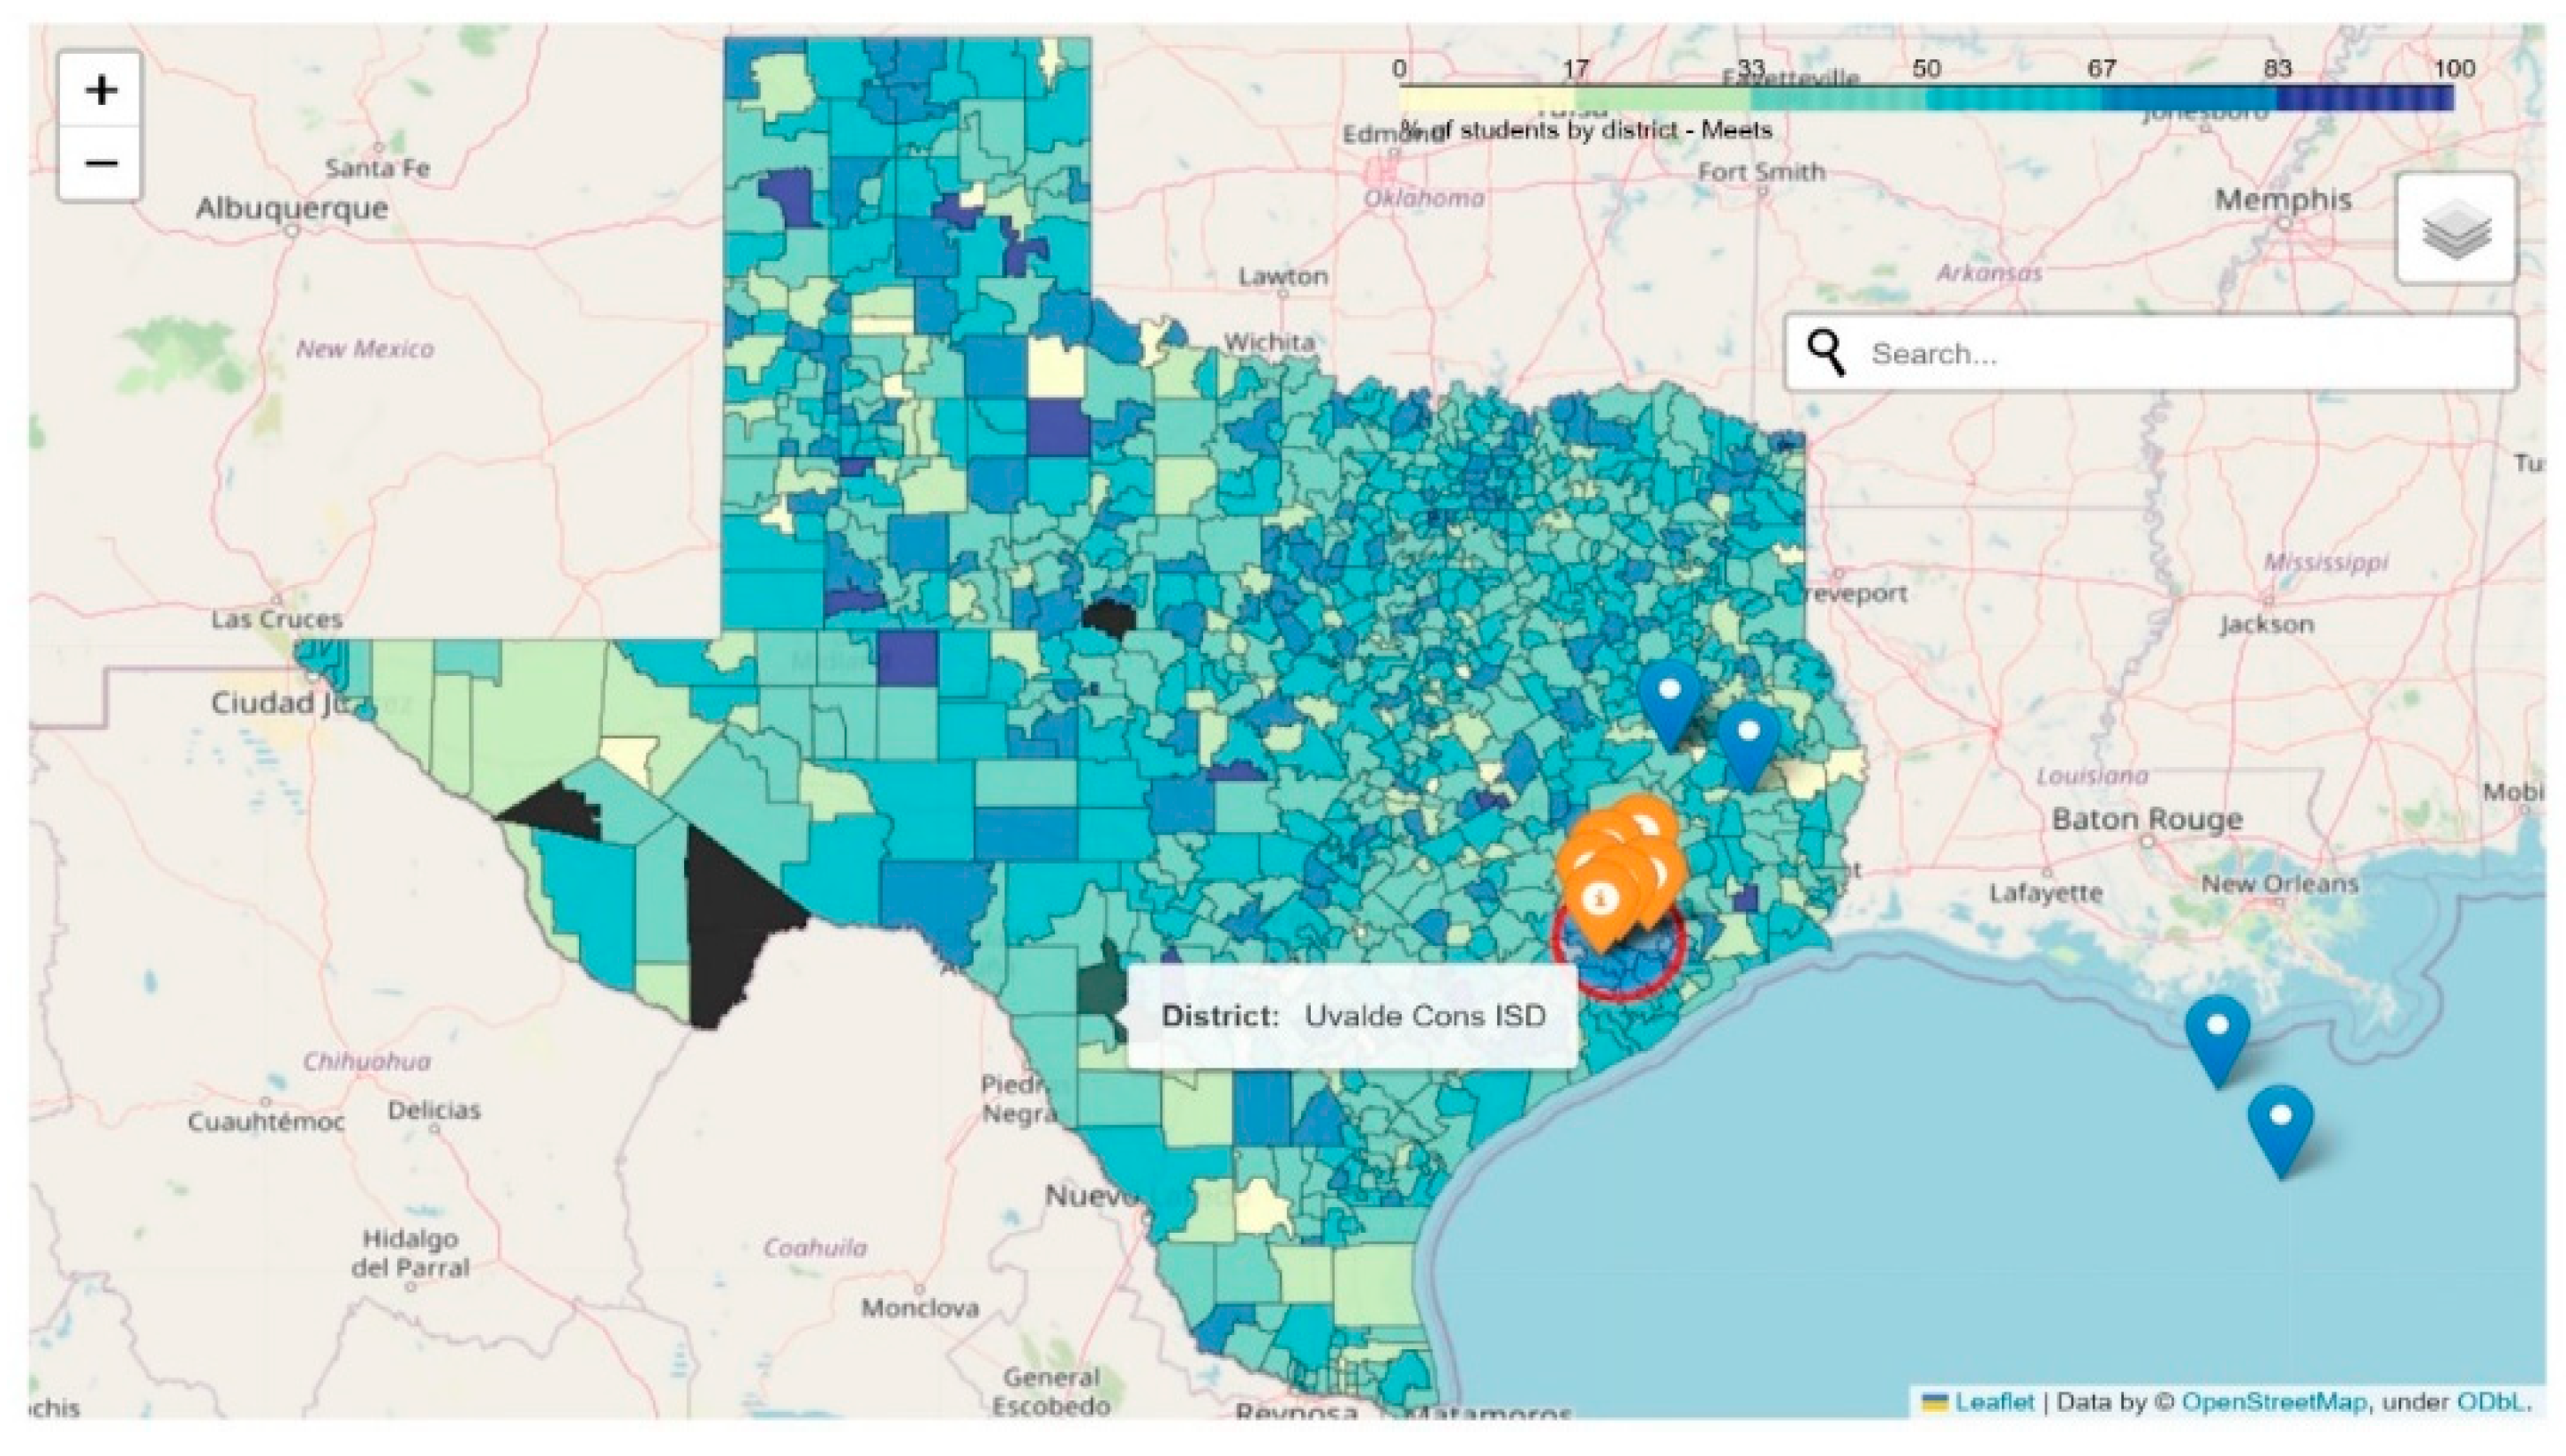
Figure 2.
Histogram showing Number of Districts and Percentage at Standard Measured.
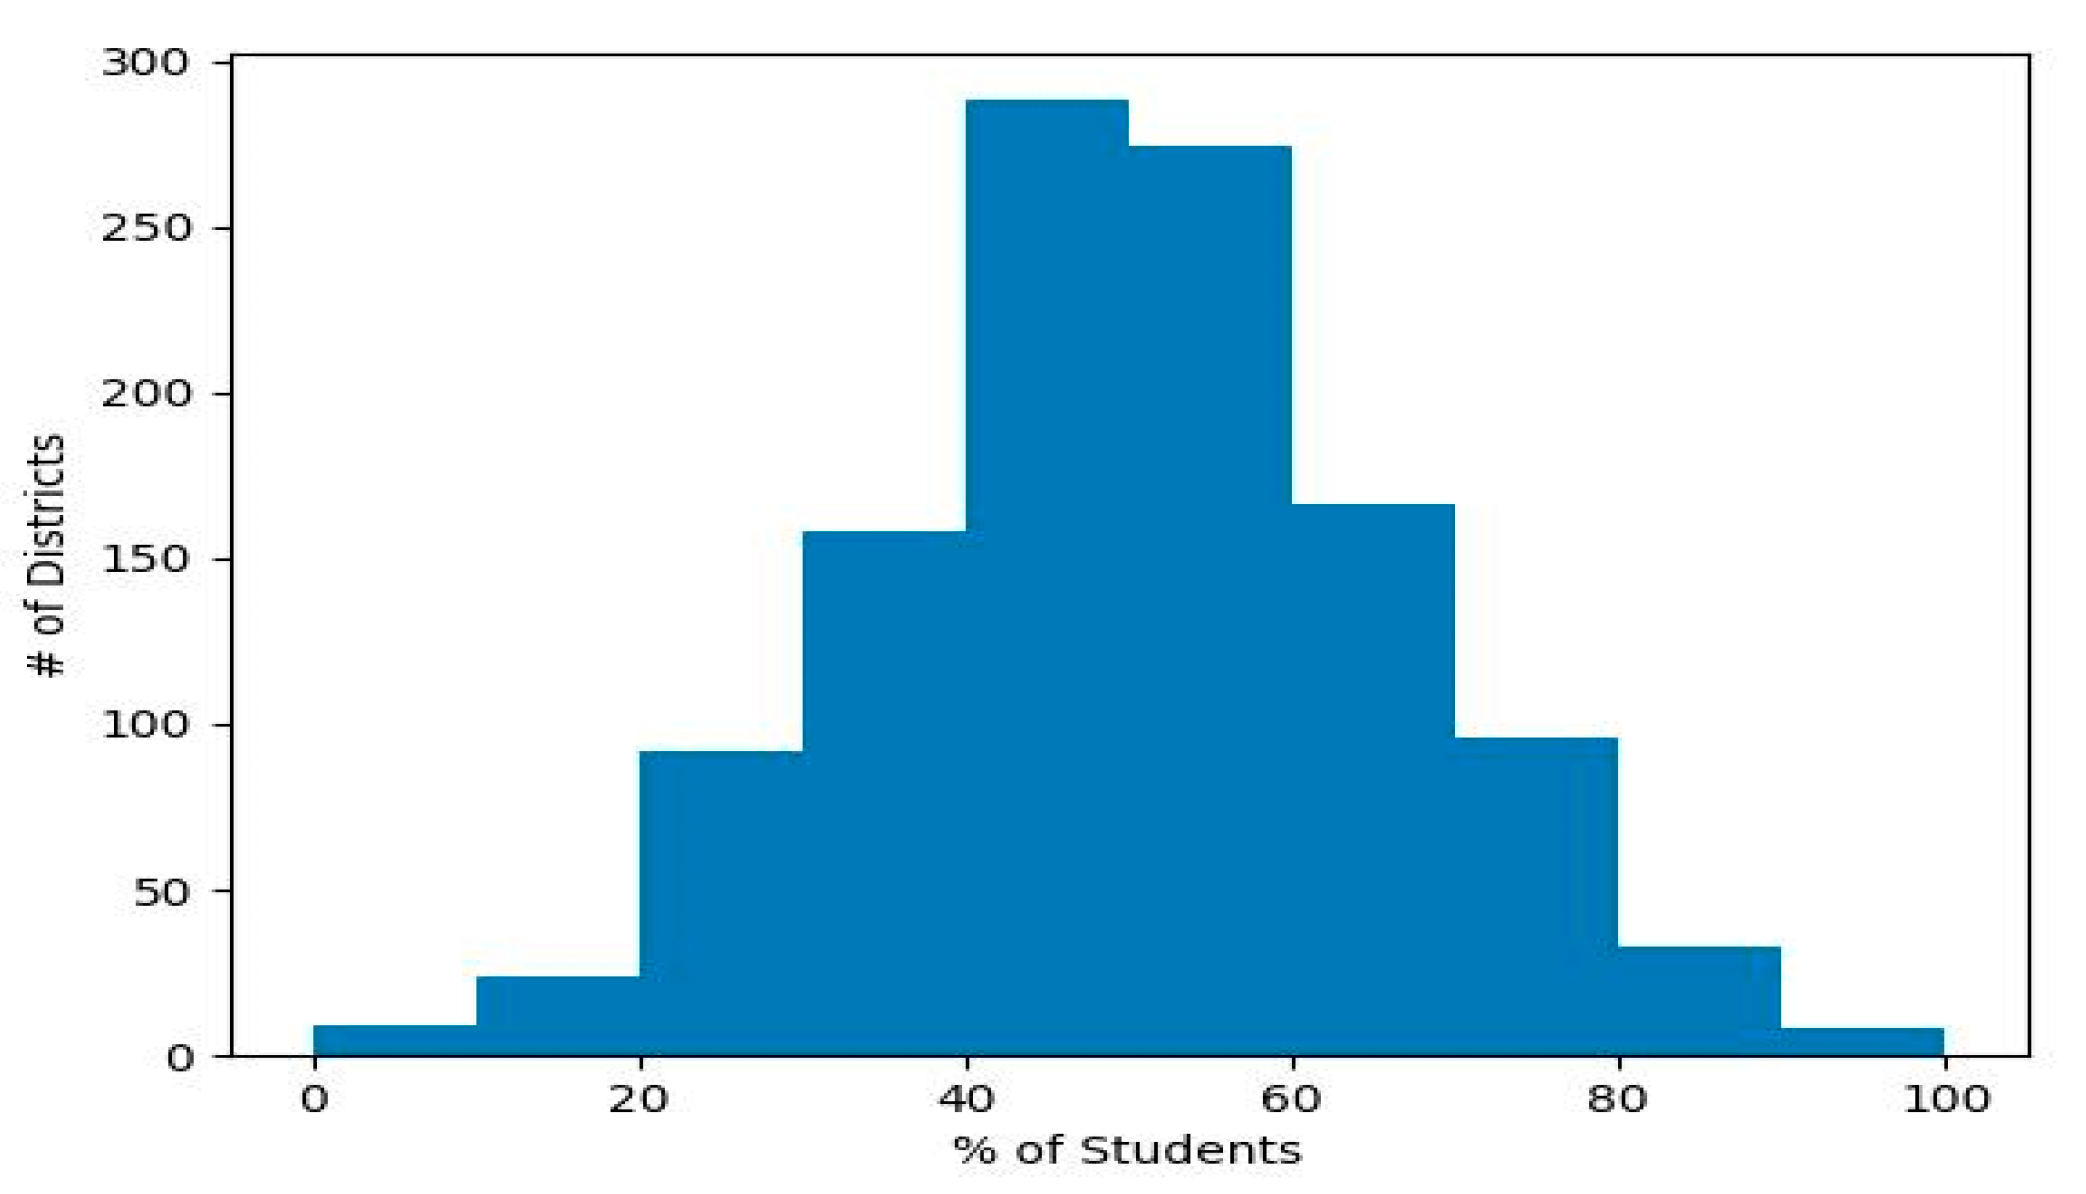
Figure 3.
Example of Poor Graphical Representation of Multiple Trend Lines and Axis Misrepresentation.
Figure 3.
Example of Poor Graphical Representation of Multiple Trend Lines and Axis Misrepresentation.
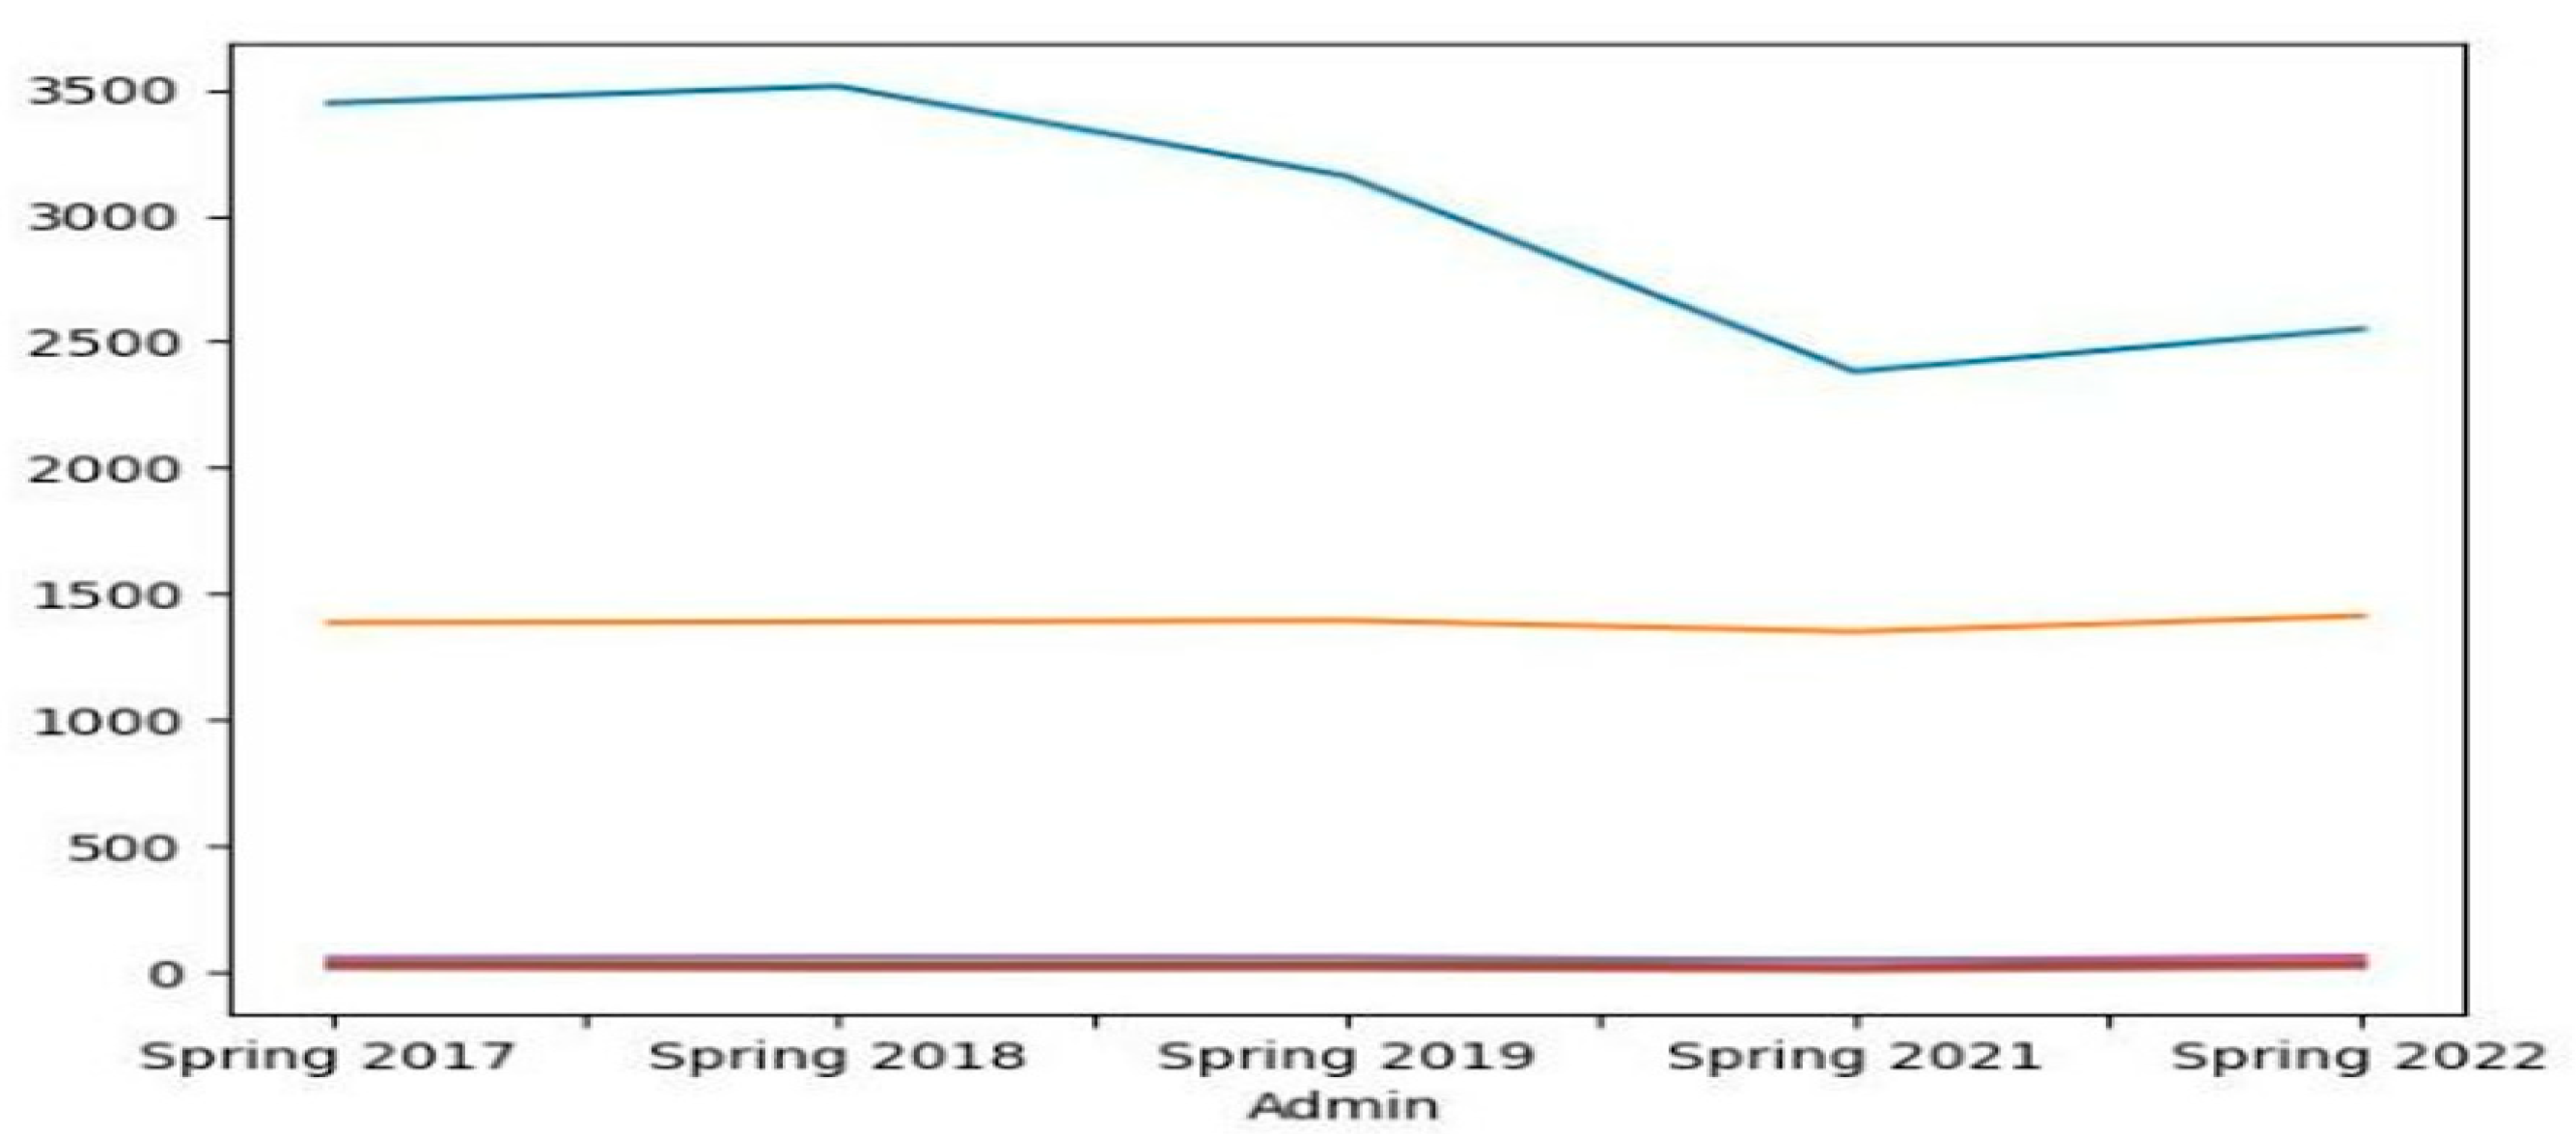
Figure 4.
Example of Better Graphical Representation for Trend Lines of Performance Standard Measurement of Top Five Performing Districts.
Figure 4.
Example of Better Graphical Representation for Trend Lines of Performance Standard Measurement of Top Five Performing Districts.
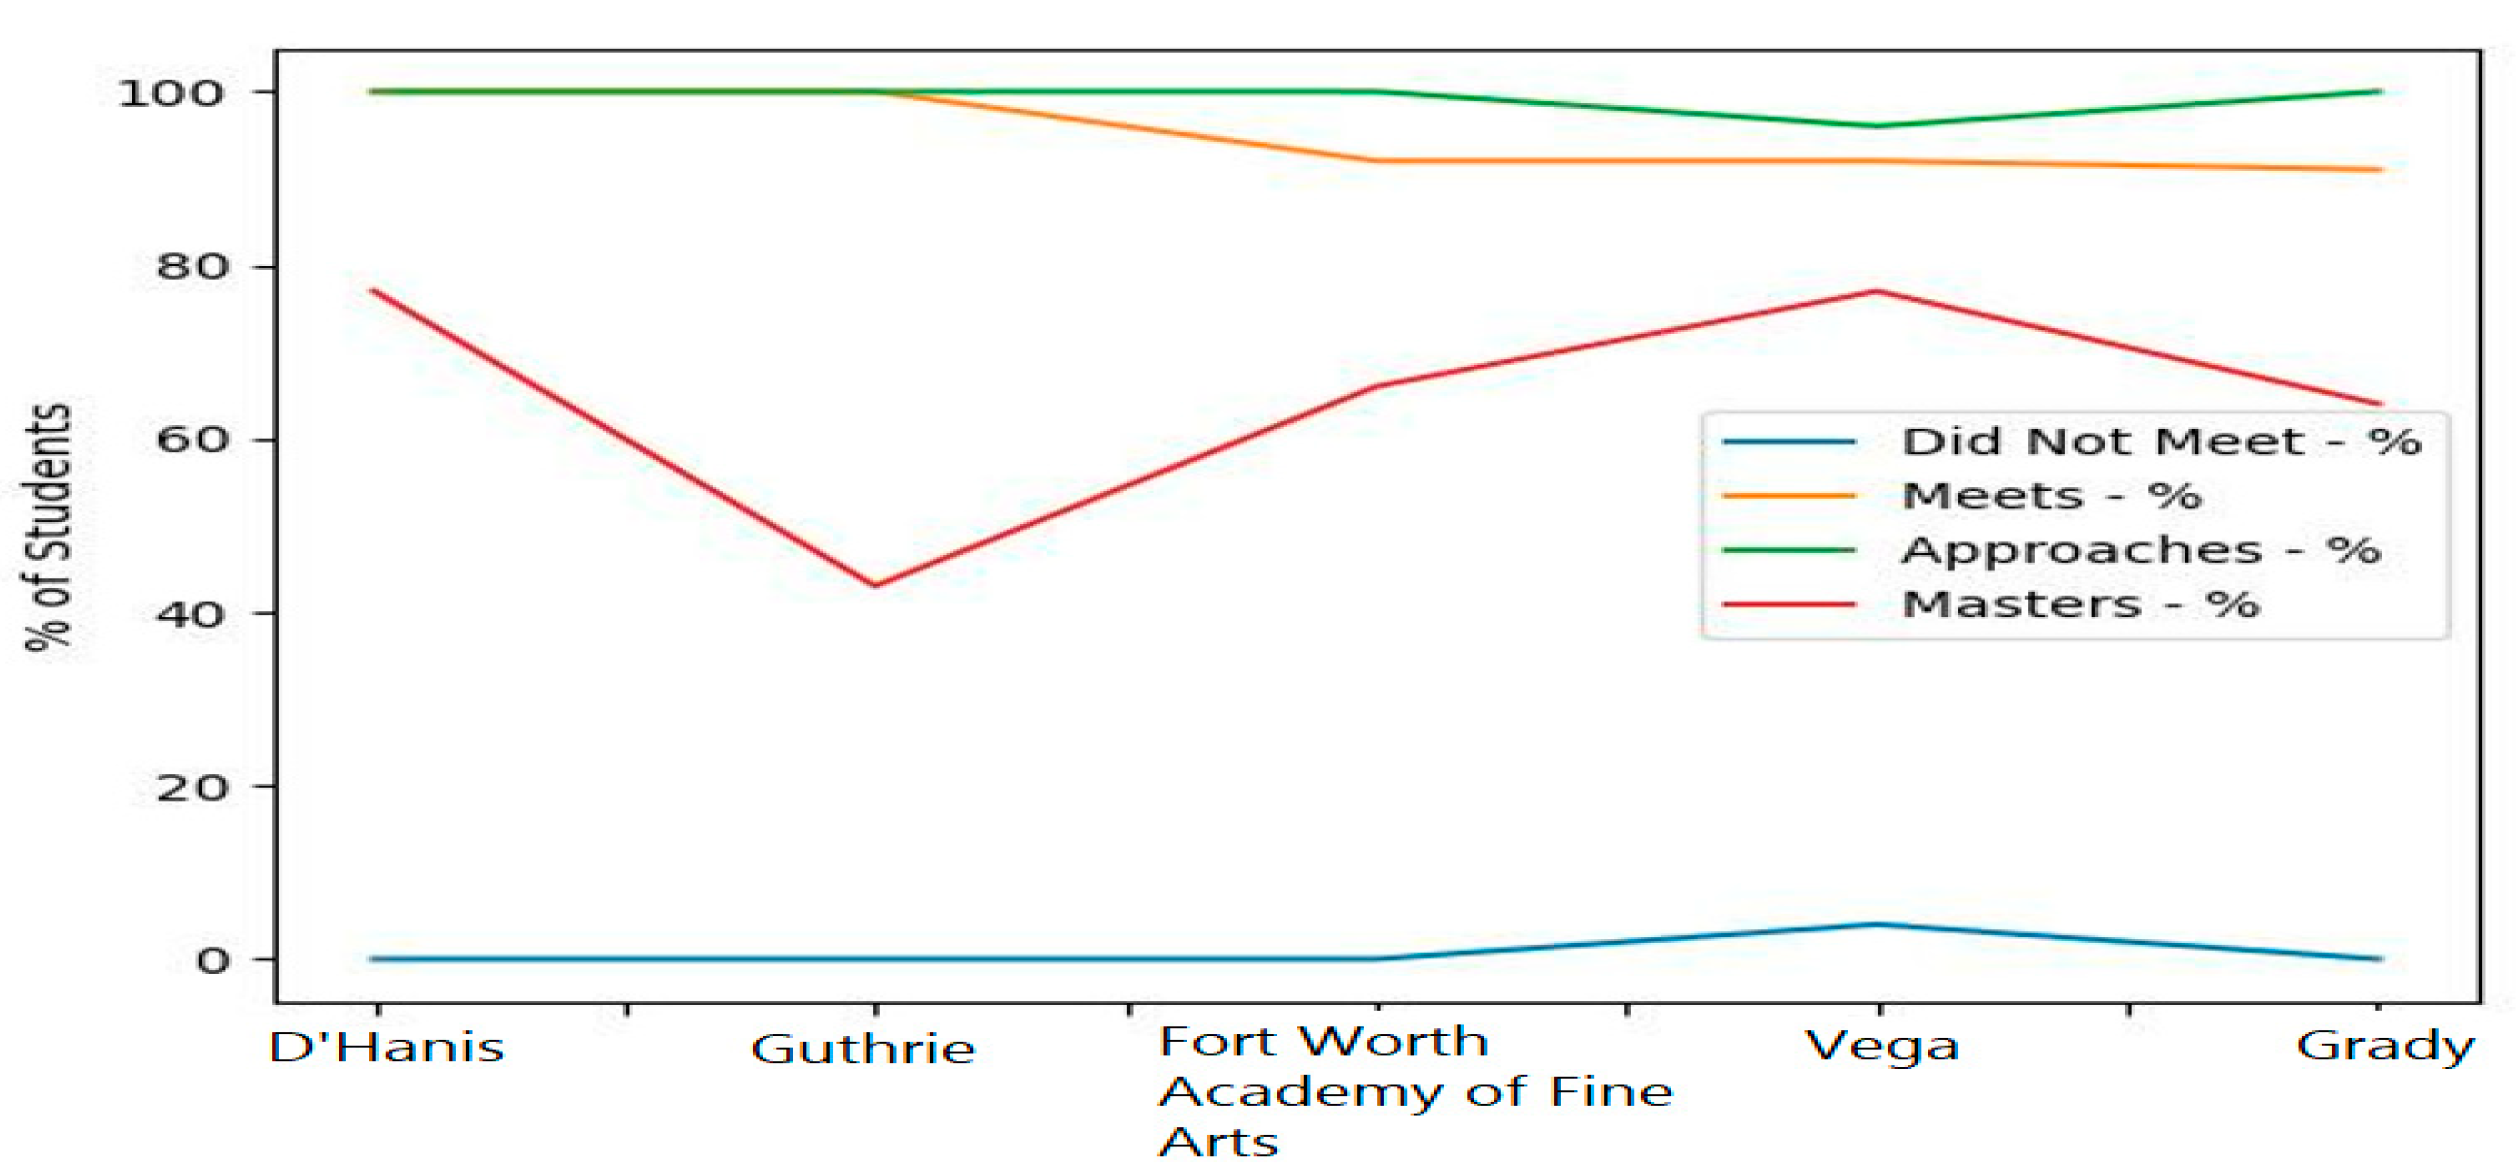
Figure 7.
Plot of Percentage of Students of Individual Districts.
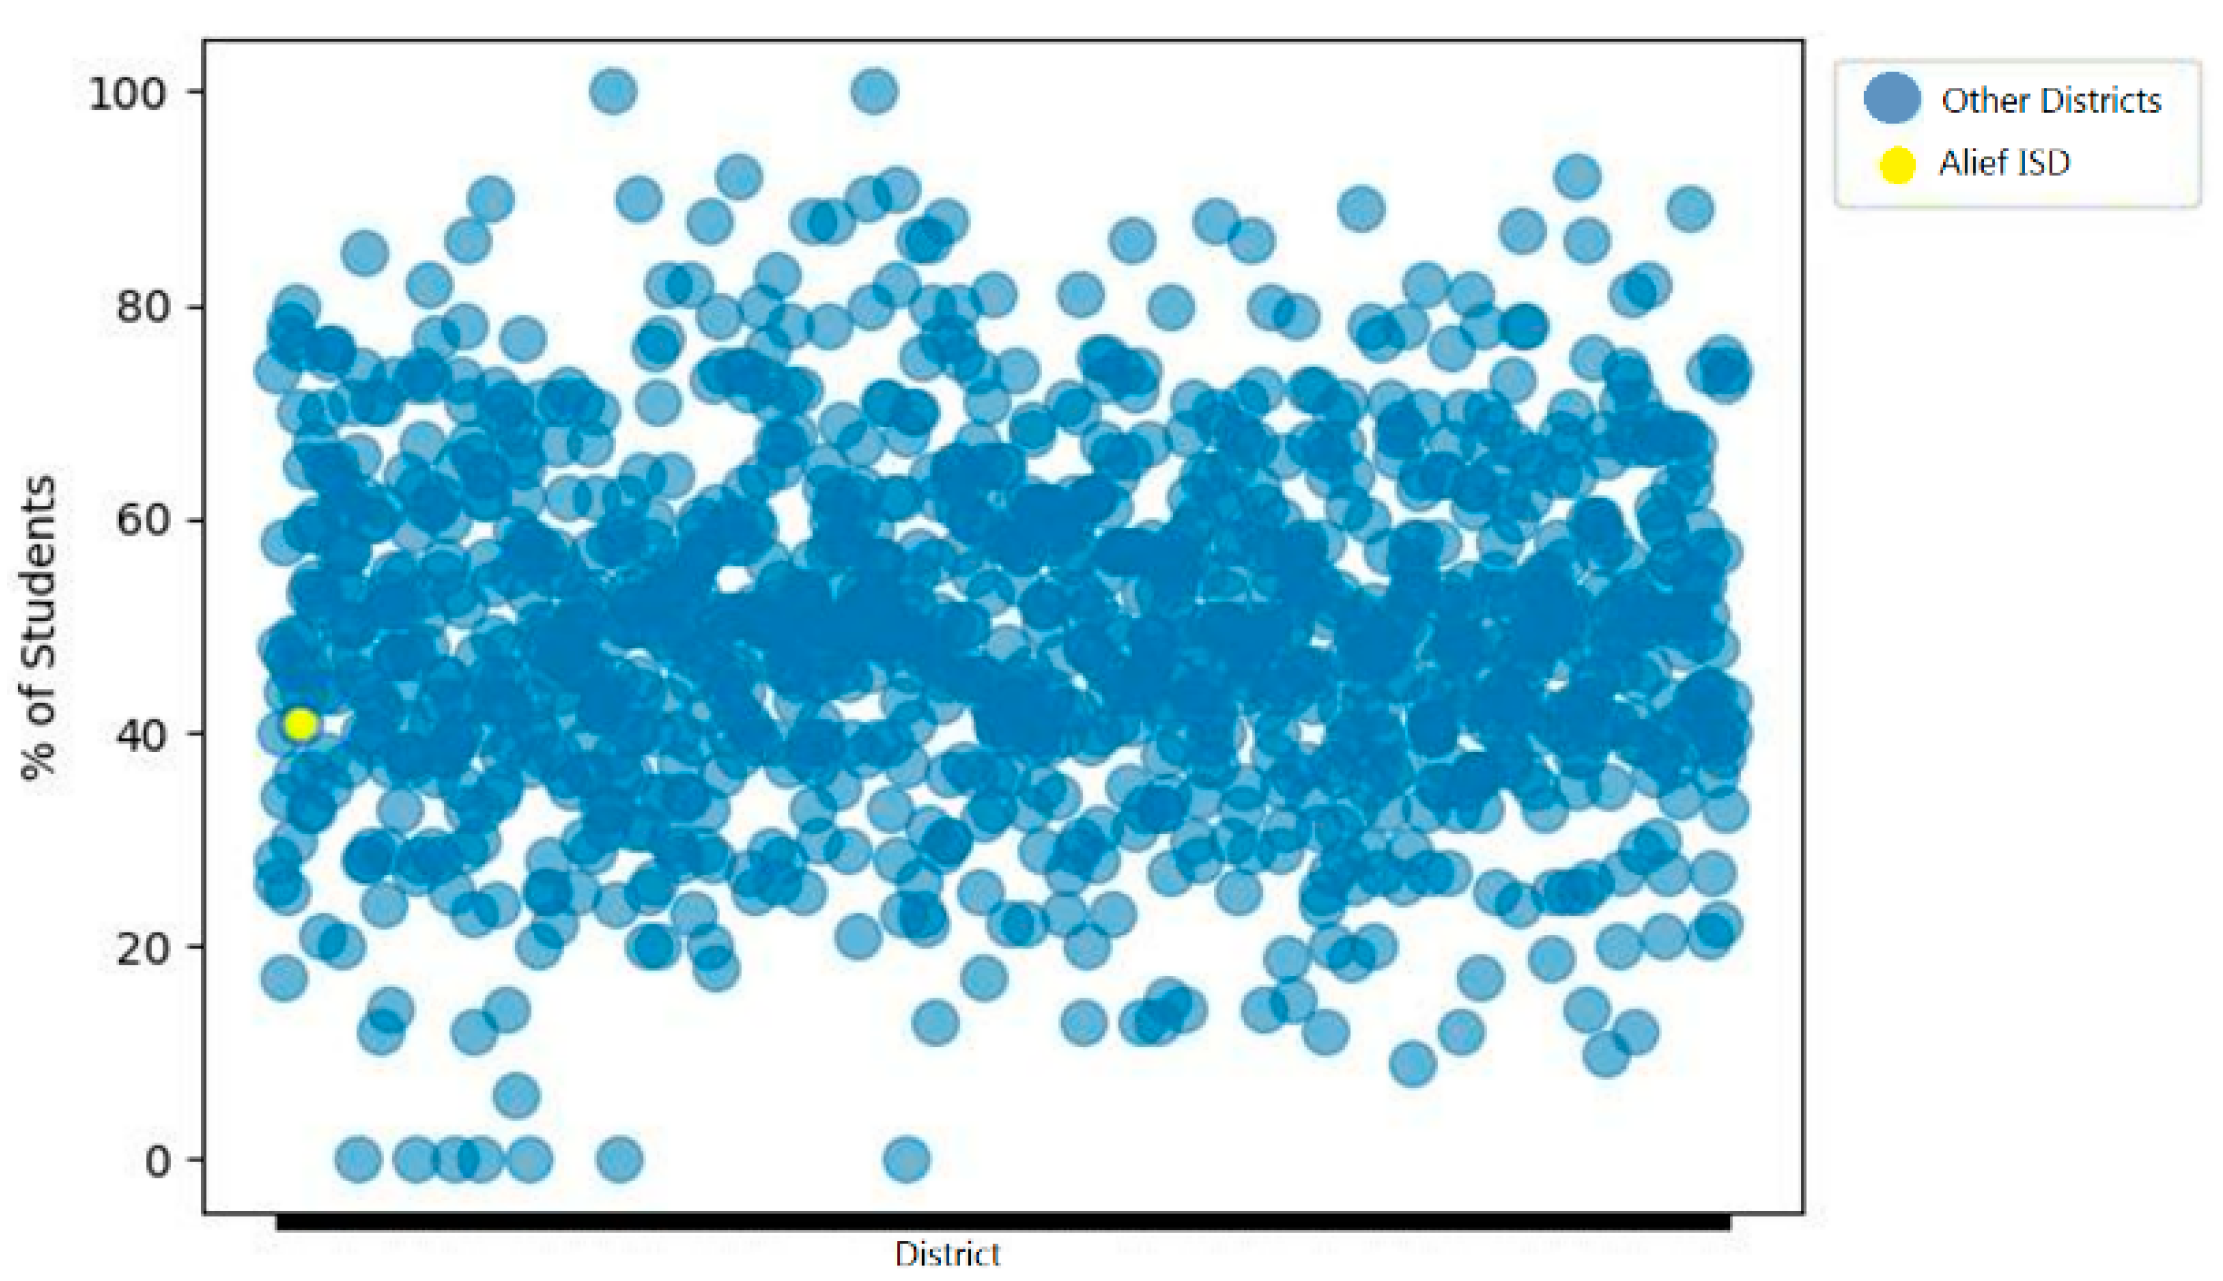
Figure 13.
Number of districts per group of number of students tested.
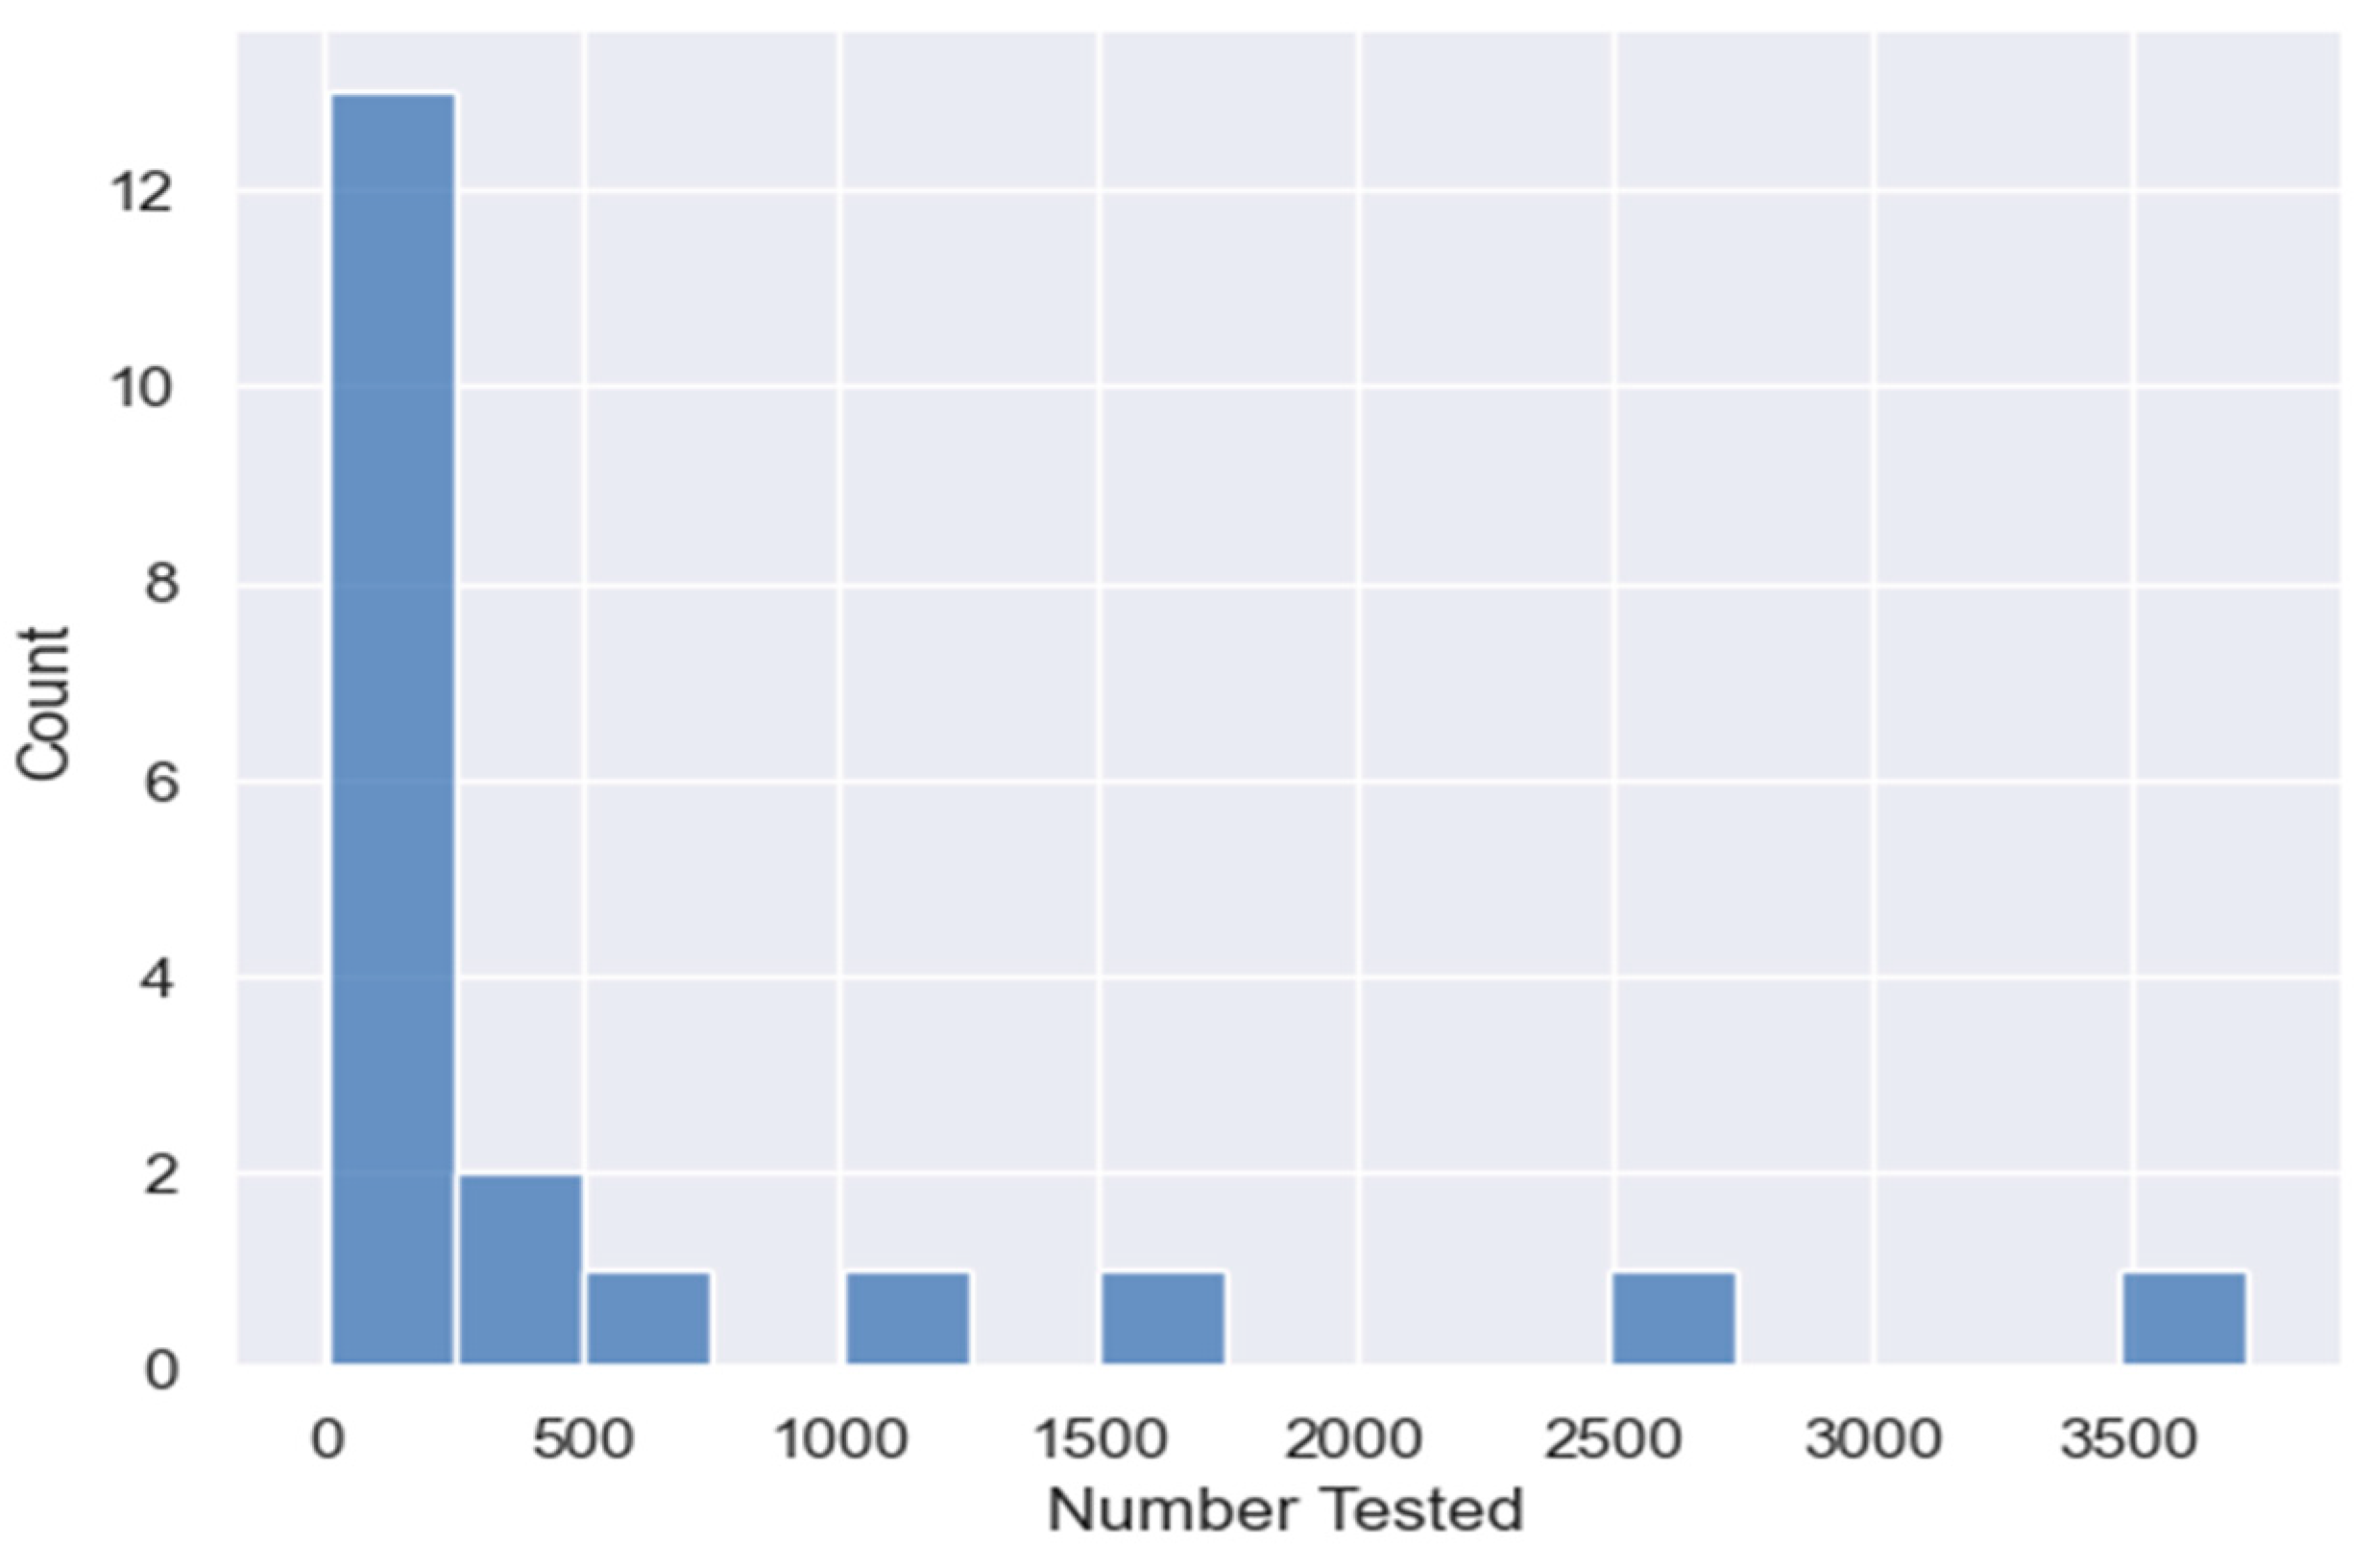
Figure 14.
Plot of Education Assessment Data Comparisons per Performance Measure by State.

Figure 15.
Graph of Education Assessment Data.
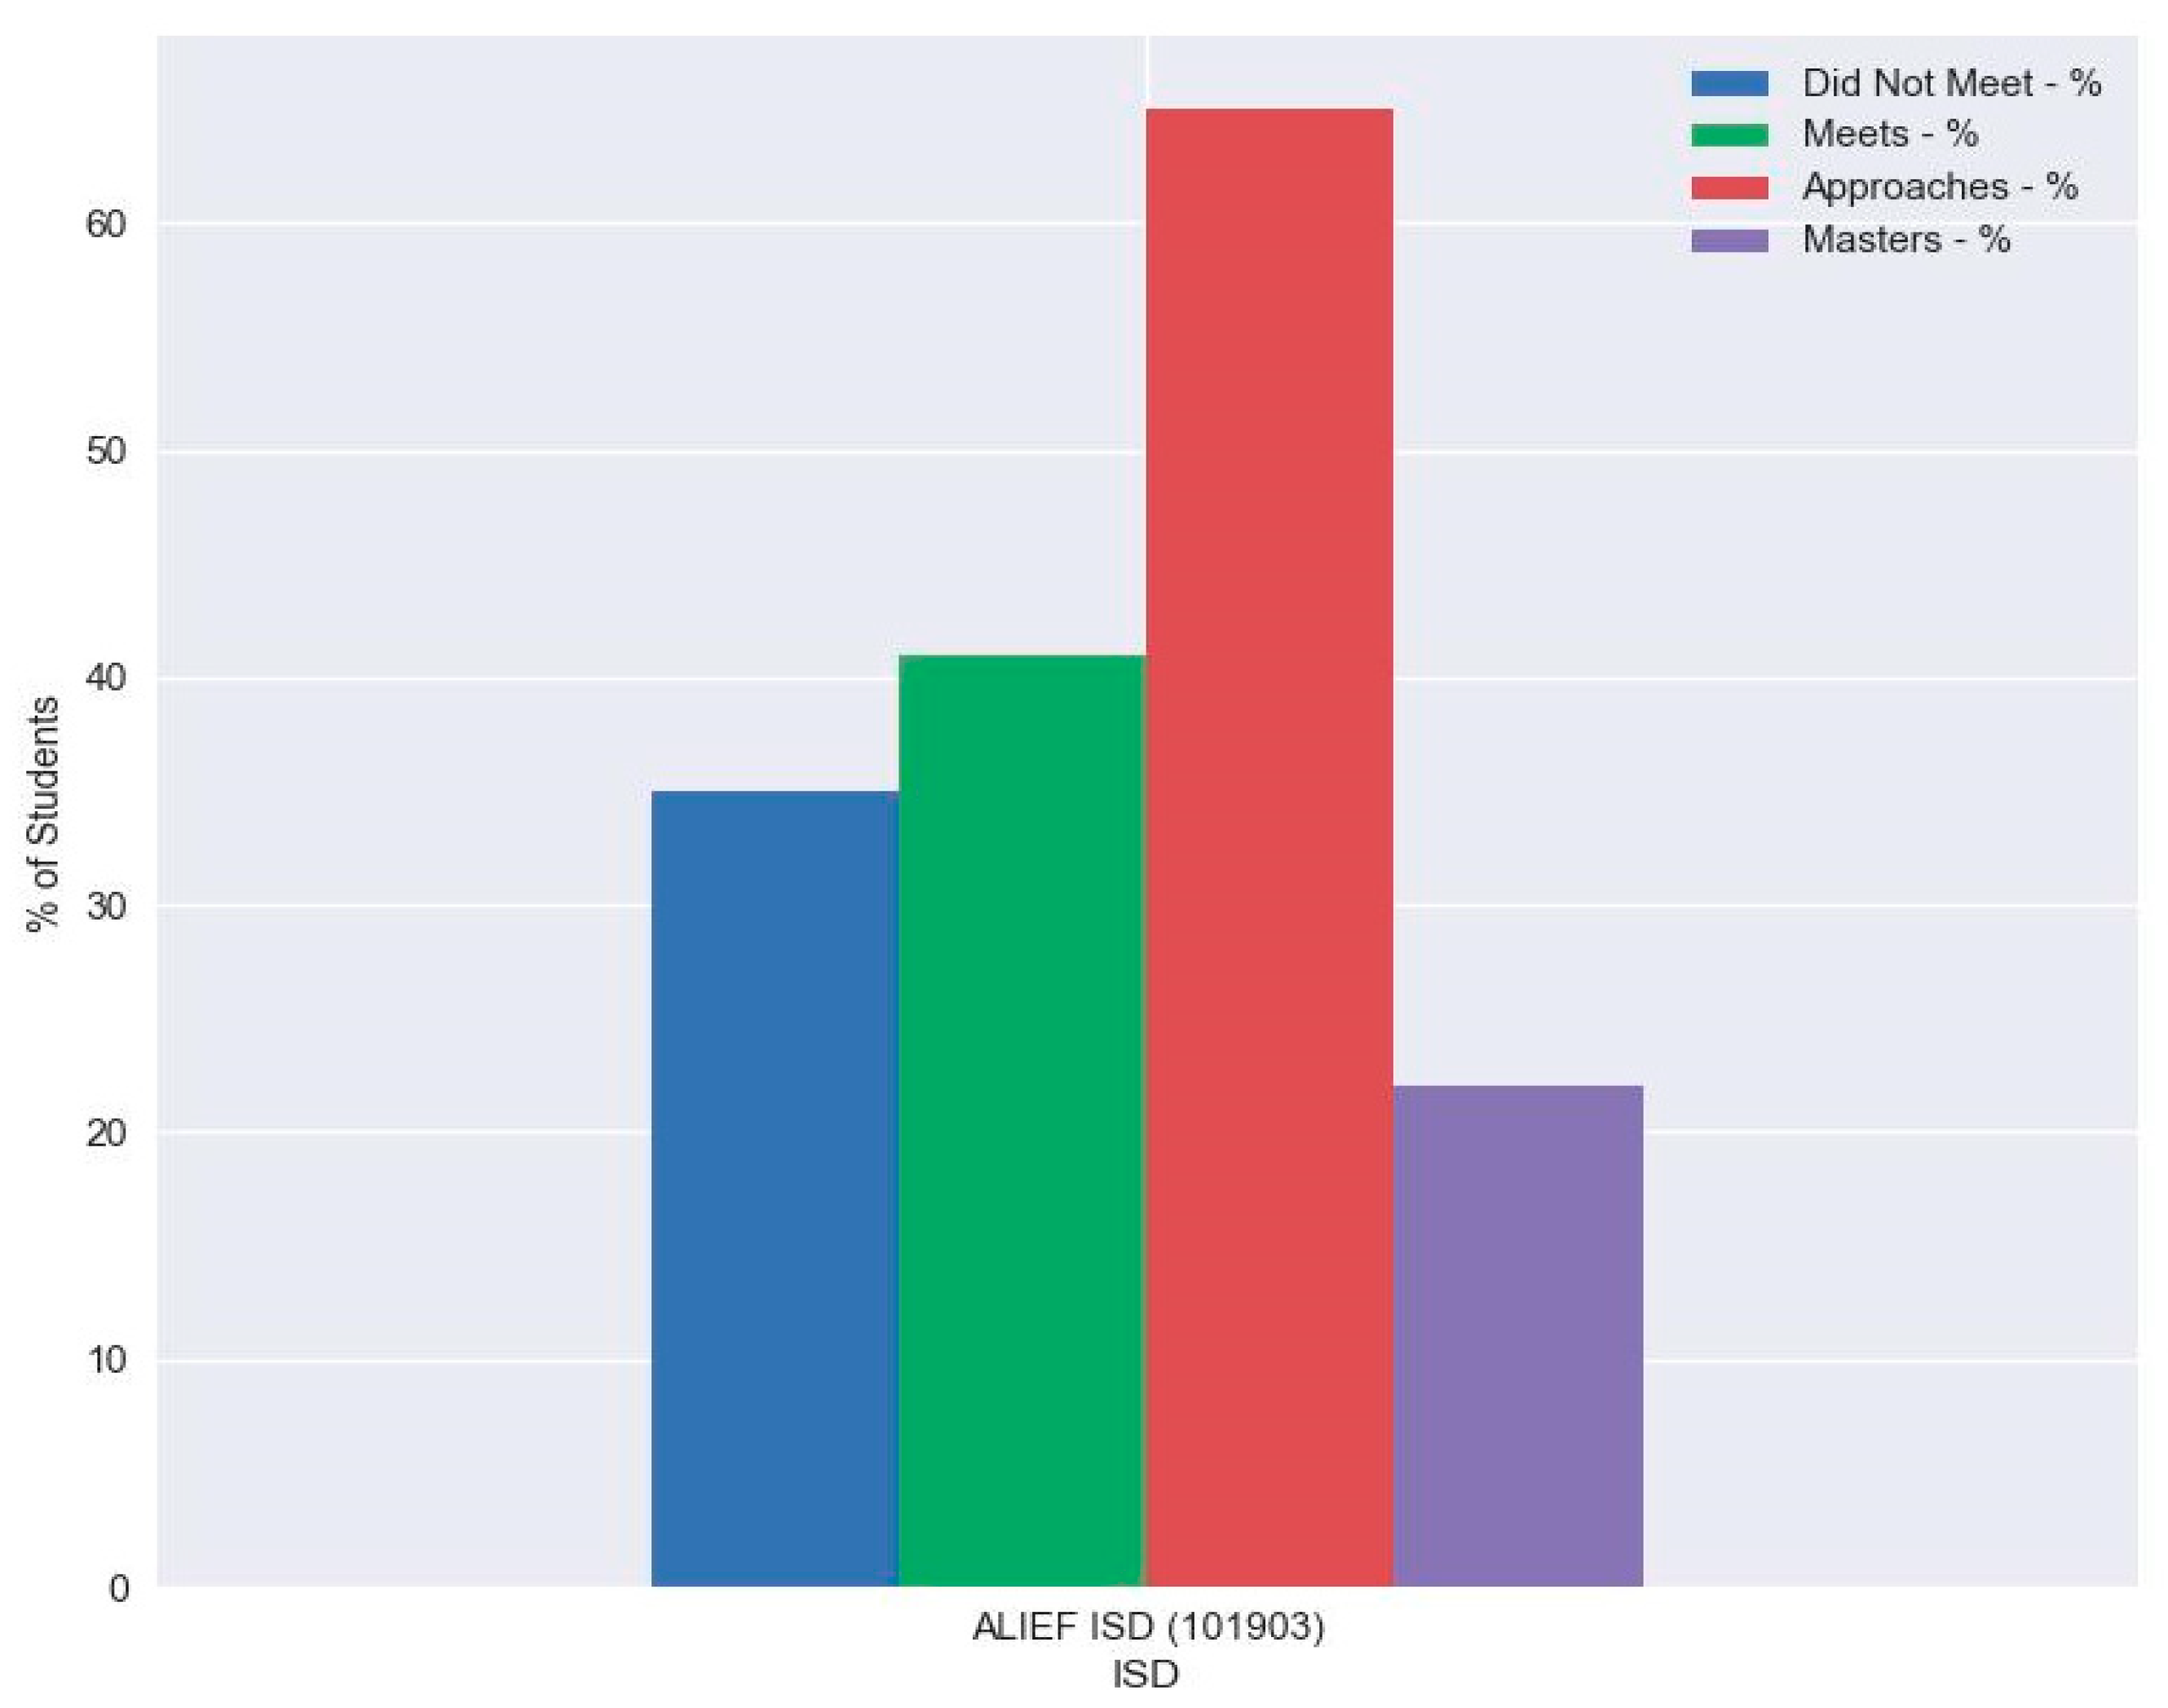
Figure 16.
Linear Regression Modeling for Education Assessment Data.
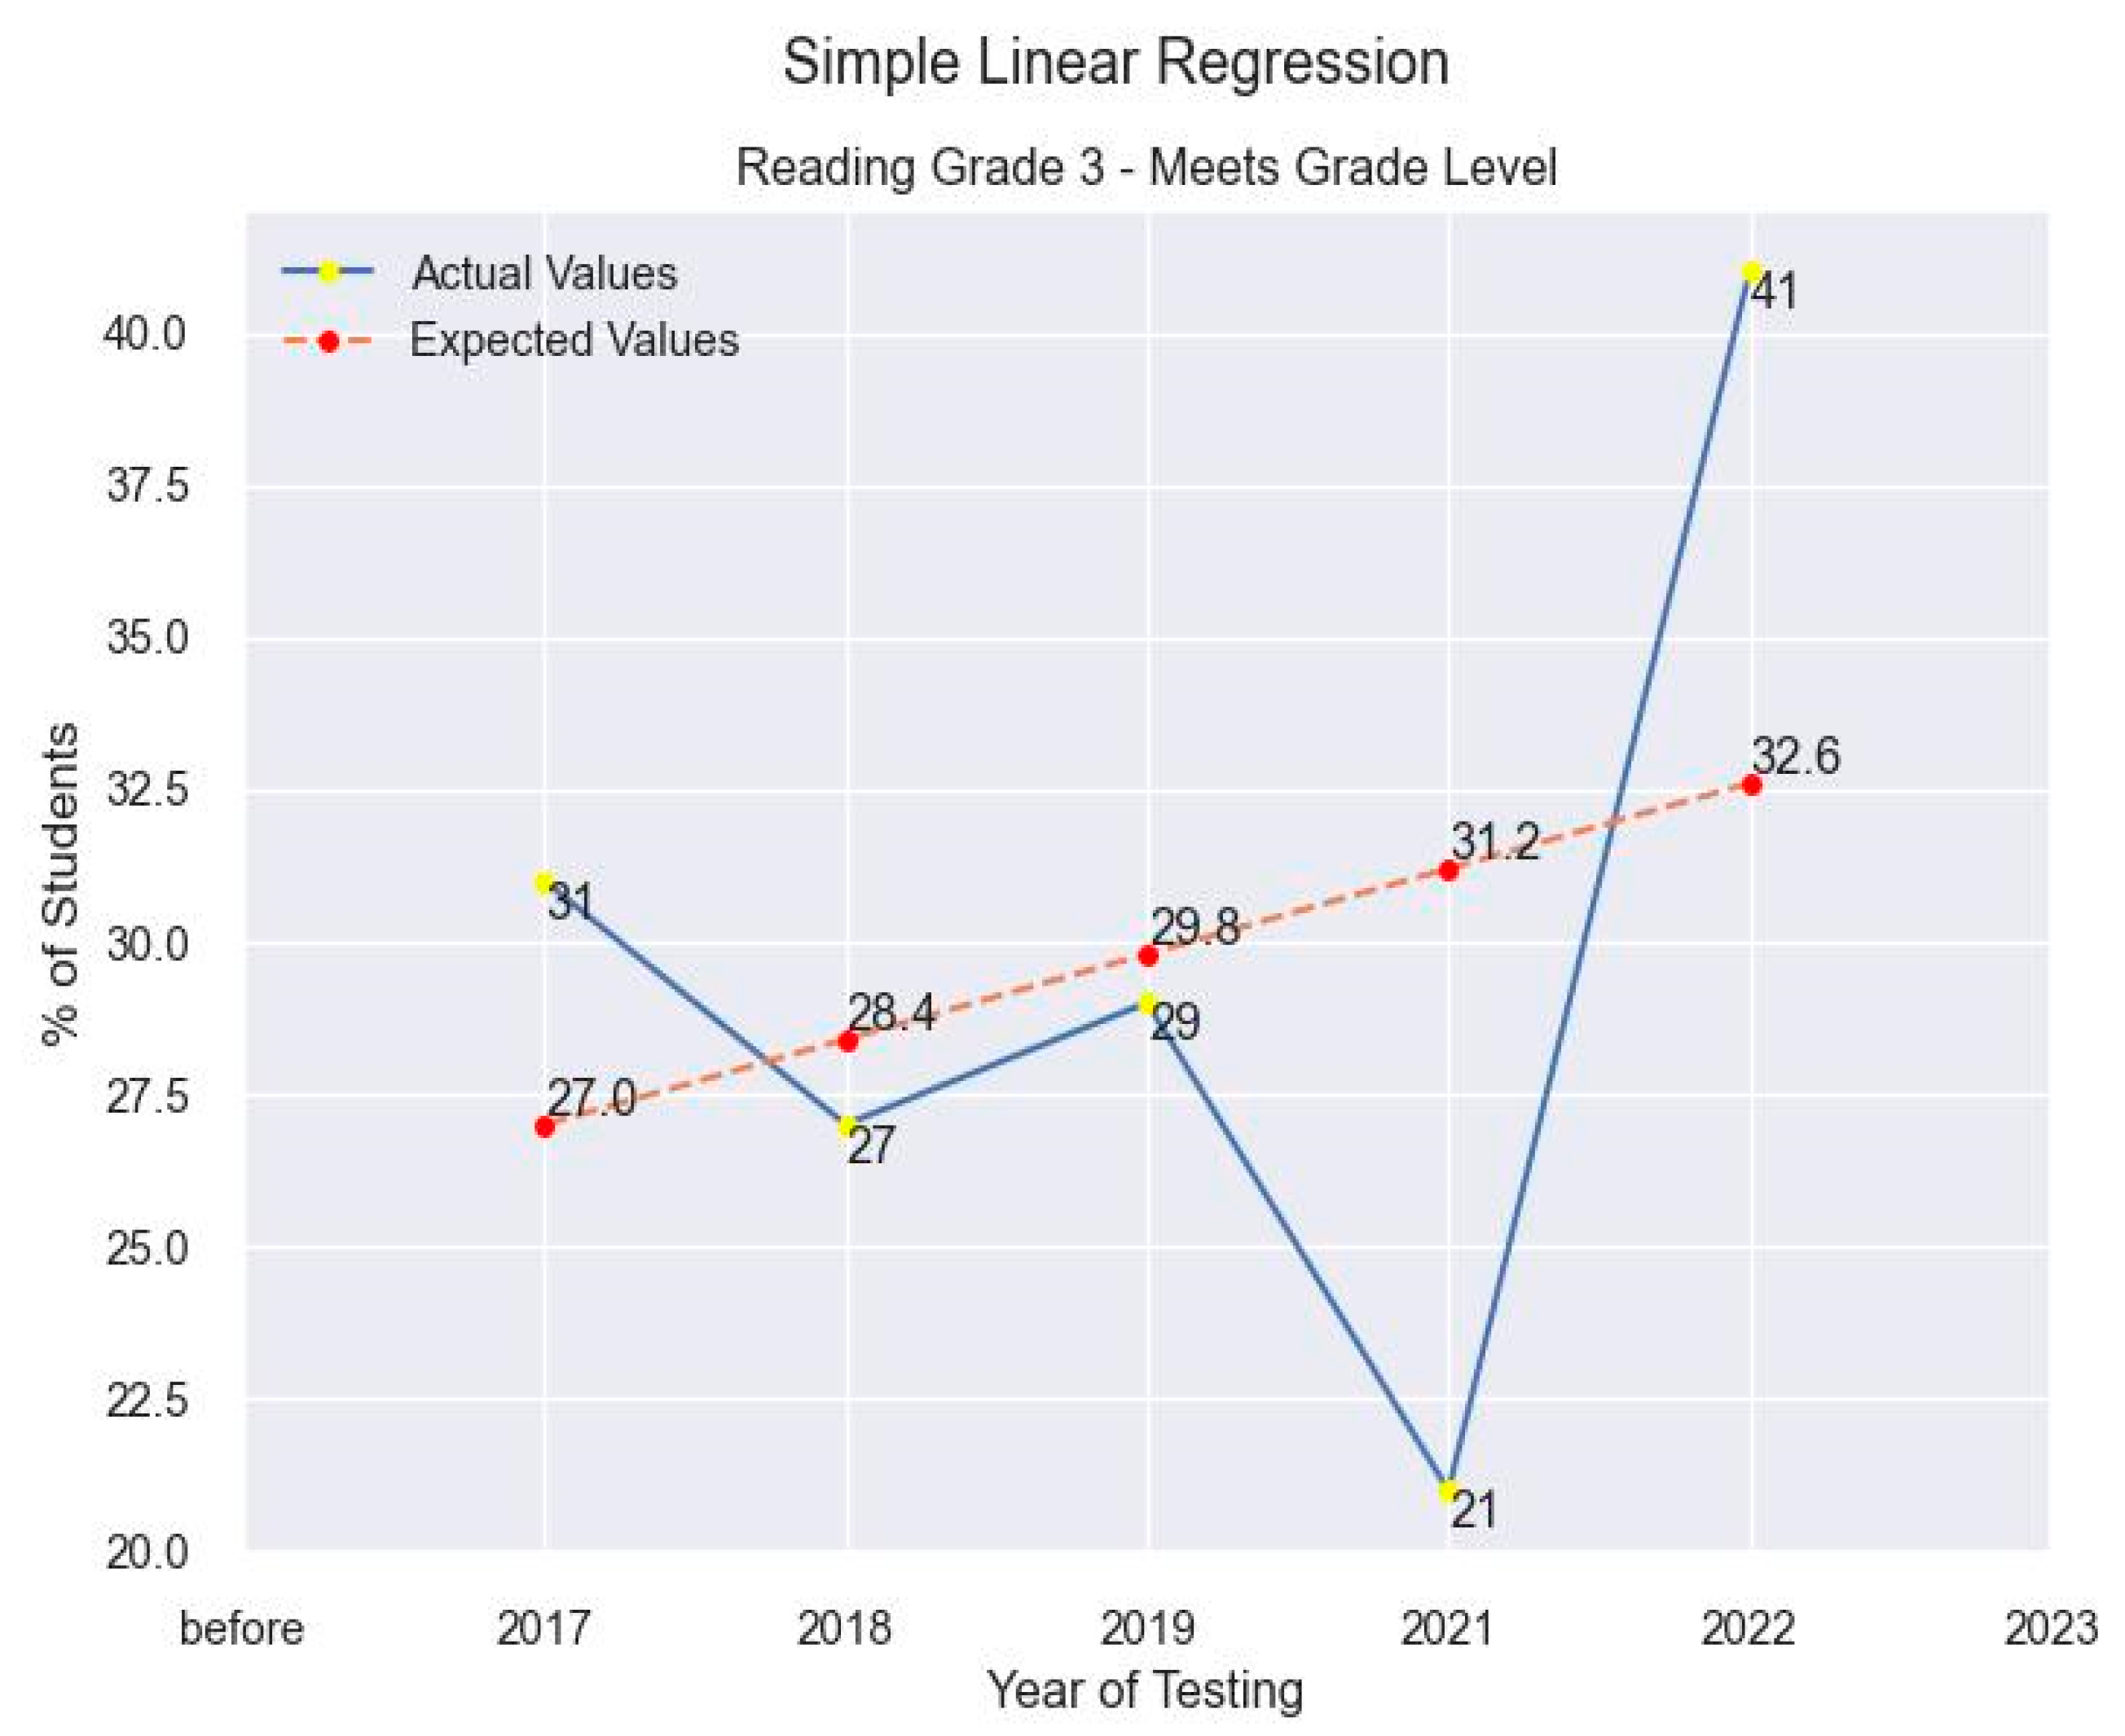
Figure 17.
Predictions for Education Assessment Data Using Linear Regression.
Disclaimer/Publisher’s Note: The statements, opinions and data contained in all publications are solely those of the individual author(s) and contributor(s) and not of MDPI and/or the editor(s). MDPI and/or the editor(s) disclaim responsibility for any injury to people or property resulting from any ideas, methods, instructions or products referred to in the content. |
© 2024 by the authors. Licensee MDPI, Basel, Switzerland. This article is an open access article distributed under the terms and conditions of the Creative Commons Attribution (CC BY) license (http://creativecommons.org/licenses/by/4.0/).
Copyright: This open access article is published under a Creative Commons CC BY 4.0 license, which permit the free download, distribution, and reuse, provided that the author and preprint are cited in any reuse.


