
Submitted:
19 February 2024
Posted:
22 February 2024
You are already at the latest version
Abstract
This study focuses on the optimal deployment problem, and determines the optimal size of a
military force to send to the battle field. The decision is optimized, based on an objective
function, that considers the cost of deployment, the cost of the time it takes to win the
battle, and the costs of killed and wounded soldiers with equipment. The cost of deployment
is modeled as an explicit function of the number of deployed troops and the value of a
victory with access to a free territory, is modeled as a function of the length of the time it
takes to win the battle. The cost of lost troops and equipment, is a function of the size of the
reduction of these lives and resources. An objective function, based on these values and
costs, is optimized, under different parameter assumptions. The battle dynamics is modeled
via the Lanchester differential equation system based on the principles of directed fire. First,
the deterministic problem is solved analytically, via derivations and comparative statics
analysis. General mathematical results are reported, including the directions of changes of
the optimal deployment decisions, under the influence of alternative types of parameter
changes. Then, the first order optimum condition from the analytical model, in combination
with numerically specified parameter values, is used to determine optimal values of the
levels of deployment in different situations. A concrete numerical case, based on
documented facts from the Battle of Iwo Jima, during WW II, is analyzed, and the optimal US
deployment decisions are determined under different assumptions. The known attrition
coefficients of both armies, from USA and Japan, and the initial size of the Japanese force,
are parameters. The analysis is also based on some parameters without empirical
documentation, that are necessary to include to make optimization possible. These
parameter values are motivated in the text. The optimal solutions are found via Newton-
Raphson iteration. Finally, a stochastic version of the optimal deployment problem is defined.
The attrition parameters are considered as stochastic, before the deployment decisions have
been made. The attrition parameters of the two armies have the same expected values as in
the deterministic analysis, are independent of each other, have correlation zero, and have
relative standard deviations of 20%. All possible deployment decisions, with 5000 units
intervals, from 0 to 150000 troops, are investigated, and the optimal decisions are selected.
The analytical, and the two numerical, methods, all show that the optimal deployment level
is a decreasing function of the marginal deployment cost, an increasing function of the
marginal cost of the time to win the battle, an increasing function of the marginal cost of
killed and wounded soldiers and lost equipment, an increasing function of the initial size of
the opposing army, an increasing function of the efficiency of the soldiers in the opposing
army and a decreasing function of the efficiency of the soldiers in the deployed army. With
stochastic attrition parameters, the stochastic model also shows that the probability to win
the battle is an increasing function of the size of the deployed army. When the optimal
deployment level is selected, the probability of a victory is usually less than 100%, since it
would be too expensive to guarantee a victory with 100% probability. Some of many results
of relevance to the Battle of Iwo Jima, are the following: In the deterministic Case 0 analysis,
the optimal US deployment level is 66200, the time to win the battle is 30 days and 14000 US
soldiers are killed or wounded. If the marginal cost of the time it takes to win a victory
doubles, the optimal deployment increases to 75400, the time to win a victory is reduced to
26 days, and less than 12000 soldiers are killed or wounded. In the stochastic Case 0 analysis,
the optimal US deployment level is 65000, the expected time to win the battle is 46 days and
almost 25000 US soldiers are expected to be killed or wounded. If the cost per killed or
wounded soldier increases from 0 to 5 M $US, the optimal deployment level increases to
75000. Then, the victory is expected to appear after 35 days and 19900 US soldiers are
expected to be killed or wounded.
Keywords:
optimization
; Lanchester equations
; attrition coefficients
; differential equation system
; numerical iteration
1. Introduction
Competition can be observed in many different areas. In the domain of economics, we find competition between nations, in international trade theory, between companies, in market theory, and between individuals, in labor economics. Shatz (2020) gives a wide perspective on connected issues. Biological theory includes models of competition between different species, including many types of animals and plants. Compare the field covered by Ianelli and Pugliese (2014). Competition between nations and coalitions can also lead to wars and other conflicts. Relevant mathematical theories and examples are found in Washburn and Kress (2009). In all these kinds of competition, we find several interesting and relevant scientific questions, such as: How do the different parties in the competition affect the other parties? How will the system develop over time? Can some actors influence these competition situations and may optimal strategies be derived?
When scientific models are developed to describe, analyze, and manage the competition situations in economics, biology, and war science, it often turns out that the mathematical structure is very similar. In this study, we will focus on typical military problems. The general results and approaches can however be expected to be useful also in the fields of biology and economics. Wars are military conflicts, usually between nations. Sometimes, the participants belong to, or are cooperating with, other nations or coalitions. A recent study of how such wars can be modelled, and the strategies optimized, using optimal control theory, is Lohmander (2023). Key ingredients in that study are differential equations that show how the involved parties influence each other, via attrition warfare, and how the total war system can be controlled and optimized via external arms support. Wars can also be studied at lower levels of command and within more constrained geographical regions. Lohmander (2019a) and Lohmander (2019b) are two such examples.
In military operations research, the famous article by Lanchester (1916) is often used as a mathematical foundation. There, the general idea is that the sizes of two opposing forces, X and Y, change over time, according to principles expressed as two differential equations. One of these differential equation systems based on the principles of directed fire, which has often been found to fit empirical time series data from real battles, very well, states that the time derivative of the size of force X, is negative and proportional to the size of force Y. Furthermore, the time derivative of the size of force Y, is negative and proportional to the size of force X. In battles with aimed fire, the attrition of a force can under simplified assumptions be shown to be proportional to the number of enemies. Lanchester models for aimed fire are differential equation systems that can be applied to describe and derive the dynamics of such battles. Estimations of attrition coefficients, the force reductions per time unit, per unit of the enemy force, have been reported in the literature, based on time series data from historical battles. Engel (1954), Bracken (1995), Tam (1998), Hung et al (2005) and Stymfal (2022) include such applications and estimations of the Lanchester models based on real military time series from different battles. Braun (1993) describes some of the applied differential equations and approaches.
Relevant empirical data would ideally contain complete time series of the numbers of units of both forces. Sometimes, the time series are incomplete, and only the time series of one force is known. In some cases, the time series of one force is completely known, but only the initial and the final sizes of the enemy force are known. In earlier research, estimations of attrition coefficients have sometimes been made in discrete time, based on the observed time series data of one force, X, and the assumed and calculated time path of the size of the other force, Y. Such estimations have been made in several steps.
Mostly, deterministic models are approximations of a reality that is not perfectly predictable. Of course, this is true also in the present area of analysis. Rothschild and Stiglitz (1970) and (1971) define risk, and increasing risk, in mathematically convenient ways, which makes it possible to study how stochastic parameter variations affect variables, systems, and optimal decisions. Lohmander (1986) and (1988) combines and applies the risk definitions of Rothschild and Stiglitz (1970) and (1971) with the famous Jensen’s inequality, Jensen (1906), biological production functions, and price series of natural resources, via analytical stochastic dynamic programming, to show how increasing risk in market prices and growth processes dynamically affect optimal decision in biological production. In a similar way, stochastic parameters should be expected to influence the decisions and outcomes of dynamic competition, battles, and wars. This is also investigated and reported in this paper.
The literature related to the Lanchester differential equations, contains generalizations and modifications in different directions. Often, the motivation is rational decision support, such as determination of the optimal size of some military force. Some of these studies concern general mathematically derived principles and results, and other articles have real military decision problems in mind. An early article in this class is Taylor (1979). He investigates the initial force commitment problem in battles governed by Lanchester equations. He defines three different decision criteria, or objective functions, namely the victor’s loss, the loss ratio, and the loss difference. The analysis is based on general qualitative comparative statics methods, and the determination of the signs of partial derivatives. He finds that the optimal initial force commitment decision is sensitive to the decision criterion. From the perspective of economic theory, the conclusion that objective functions influence the optimal decisions, are not surprising. However, from an economic perspective, the articles choice of objective function seems arbitrary. If military missions should be economically rational, it is important to define costs and revenues as functions of possible military decisions, and to let these functions be used to define the objective function that governs the military decisions. The models and analyses in this this paper are created to optimize strategic decisions problems with explicit economic objectives in mind.
Another author that studies the optimal force structure, is Chan (2016). He focuses on the Lanchester square law, general findings from the battle of Trafalgar, and the quality and quantity of the Singapore defense forces. A key conclusion is that it is necessary to maintain high quality of the forces in peace time, since possible opponents may have large numbers of attacking units. Minguela-Castro et al (2021) presents a multi stage decision support model, for strategic military decision making. With such a structure, it is possible to adapt the forces to new information about the actions taken by the enemy and other possible events. The Battle of Crete, during World War II, is discussed in relation to the dynamic model. The objective function is based on the expected value of battle casualties and the fulfillment of the mission. Exactly how these objectives are combined is not clear to the reader. Obviously, the objective function is not defined in economic terms. Lystopadova and Khalaim (2023) give a general introduction to Lanchester differential equations and include some examples from the war during the years 2022 to 2024 in Ukraine. They write that dynamic force predictions can be made, based on the fire powers of the Russian and Ukrainian armies.
Some studies extend the Lanchester model system to cover multi front problems, optimal dynamic reinforcements, international cooperation, and combinations of units from the army, the navy and/or the air force. The optimal partitioning of available military defense resources to counter attacks in different fronts, with Lanchester dynamics, is studied by Sheeba and Ghose (2008). The decision problem is defined as a Time-Zero-Allocation problem, and analytical and numerical solutions are given. Chen and Qui (2014) investigate the optimal reinforcement problem. They apply Lanchester dynamics within a differential game model and derive optimal reinforcement strategies. Algorithm convergence results and numerical examples are included.
The Lanchester model can also be extended to handle cooperation between different players and endogenously optimized intelligence levels. This is done, via optimal control, by Hy et al (2020), in a study on optimal counter terrorism. Kostic and Jovanovic (2023) is a promising study from a methodological point of view. Different kinds of forces, such as air force and army, cooperate. During different phases of a war, they can cooperate in several ways. The system of differential equations is governed by Lanchester equations, but the set of equations changes at different points in time. This way, rather complicated dynamic strategies that involve different kinds of forces can be defined, studied, and rapidly optimized, with a simple mathematical structure and limited numerical and computational efforts. Of course, a sufficiently simple model structure, that makes it possible to easily communicate the general model ideas and results to the involved parties, and that also makes it quite clear how an objective function can be developed to cover the essential costs and revenues of the system, are all important to successful applications.
In several mathematical models, with fundamental links to the classical Lanchester system, partly new assumptions are introduced. The classical ordinary differential equations are replaced by partial differential equations and more dimensions, the number of parties in the conflicts increases, networks are introduced and perhaps even deterministic chaos appears. With such adjusted model assumptions, it is sometimes possible to illustrate, discuss and highlight several principles from classical military strategy. Often, however, such model developments make it difficult or impossible to find closed form solutions. Still, qualitative analysis may lead to some general qualitative results, and particular numerical specifications and iteration can be used to create examples and illustrations of typical solutions. Spradlin and Spradlin (2007) move away from the ordinary Lanchester differential equations to partial differential equations. With this approach, they do not only investigate the development of the system over time. The spatial distributions of the armies over the battlefield are simultaneously studied. Numerical simulations with this approach are reported.
Lanchester models usually handle two party conflicts. Kress et al (2018), however, extend the analysis to three party conflicts. The motivation includes conflicts in Syria, where, as they write, several parties have been involved, such as Russia, Turkey, Iran, al-Qaeda, Jabahat al Nusra, ISIS, the free Syrian army, Hezbollah, Kurds, and the Assad regime. The results are reported in phase portraits, that show regions where different parties can win the war. It is important to be aware that the study and the results are based on fixed force allocations. It is quite clear that other results can be obtained in case the different parties are allowed to adaptively change the behavior over time, as the situation develops. The authors conclude that, the possibility of temporary cooperation would lead to many challenges in a differential game setup. This is certainly true. It is also true that such a development of the dynamic multiplayer games seems necessary, if we are interested to understand and control the real and highly complicated conflicts in the region. Sometimes, it is interesting and important to generalize the Lanchester system to cover more strategy dimensions. Kalloniatis et al (2020) do that, via the development of a networked Lanchester model, with fire integration and manouvres. McCartney (2022) studies repeated battles with reinforcements. The reinforcements follow different principles, that can give different outcomes. With nonlinear reinforcements, we may obtain quasi-periodic behavior, deterministic chaos, and fractal partitioning. In our present world, the situation can in many regions be interpreted as chaotic. Maybe, models of this type are useful to model such phenomena.
The Lanchester differential equation system is a highly relevant and useful basis for qualified strategy optimization. Fundamental facts, such as sizes of forces and attrition coefficients, that determine the outcomes of conflicts, are used in a mathematically straight forward way. Without fundamental mathematical descriptions of the forces in action, logically defendable alternatives simply do not, and cannot, exist.
This study:
This study has the ambition to determine the optimal size of the military force to send to the battle field. This decision is optimized, based on an objective function, that considers the costs of deployment, the cost of the time it takes to win the battle, and the costs of killed and wounded soldiers with equipment. The optimal decisions are determined via analytical and numerical methods.
Step 1:
First the deterministic optimization problem is defined and solved, based on an economically specified objective function and explicit general solution of the ordinary Lanchester differential equation system. Comparative statics analysis, via differentiation, determines how the optimal decisions change under the influence of parameter changes. Then, the first order optimum condition and the Newton-Raphson method, are used to determine the optimal decisions, in a set of numerically specified cases. The method is illustrated via empirically estimated parameters from the Battle of Iwo Jima, during WW II.
Step 2:
Stochastic attrition coefficients are introduced, since these coefficients cannot generally be assumed to be perfectly known before battles start. The expected value of the total result, in economic terms, is optimized. Optimal decisions are determined, with consideration of the stochastic attrition parameters, in different numerically specified cases. The outcomes of the battles, such as the numbers of killed and wounded soldiers, and the time it takes before one party wins the battle, are affected by the stochastic attrition parameters, and cannot be perfectly predicted. It is important to be aware that, even if the optimal number of soldiers is sent to the battle, it is possible that the enemy wins the victory. It would simple be too costly to make sure that, whatever happens and whatever the attrition parameter values turn out to be, you will always win a possible battle. For this reason, a relevant objective function must be defined and calculated as a function of different kinds of decision dependent stochastic outcomes, including a decision dependent probability to win the battle.
2. Materials and Methods
This study concerns optimization of strategical military decisions. The perspective on the topic is as general as possible and the analysis is based on the famous Lanchester differential equations under the influence of directed, or aimed, fire, as illustrated in Equation (1). There we see how the state of the system, , representing the sizes of two opposing forces, changes over time, . The two parameters, , are called attrition coefficients. Newtonian notation, with time derivatives marked by dots, is used.
In the later sections of this paper, general analytical methods are used to analyze and solve this equation system and the more complicated problem, where the solutions of the differential equation system (1) are used as subproblems within general strategy optimization problems. Since the differential equation system is a central component of the relevant strategy optimization problems, we start with a briefing on the properties of the system (1), based on fundamental methods, including qualitative analysis and simulation.
From (1), we construct (2).
Consider this special case: The time derivatives of the sizes of the resources, divided by the sizes of that resources, are equal. In such a case, the time path of (x, y) should follow a straight line in the first quadrant, moving towards origo. This is seen below. From (2) we get (3).
Equation (3) can be rewritten as (4).
From (4) we derive (5), which is consistent with the famous Lanchester square law. Compare Lanchester (1916).
From (5) we get (6), which leads to (7) and (8).
Figure 1 shows the time path of (x, y) in the special case, when Equation (5) holds. Note that (x, y) follows the time path in the direction of the arrows. The lengths of these arrows indicate how rapidly (x, y) moves. The arrows get shorter as we move towards origo. The reason is that the time derivative of x is proportional to -y, and the time derivative of y is proportional to -x. Compare (1). Hence, x and y are strictly decreasing functions of time. In fact, since (x, y) moves slower and slower, and the speed approaches zero, as (x, y) approaches origo, (x, y) never reaches origo. Compare Equations (9) and (10).
In Figure 2, we find the time path of (x, y) in the special case, when bx2=ay2, as a function of the ratio b/a. The coefficients a and b may change for many different reasons. We may consider the following cases:
Case 1: A force with x units defends an area and another force with y units attacks the same area. If the defender prepares the defense efficiently, it is more difficult to reduce x, and easier to reduce y. In other words, a decreases and b increases. Compare the differential Equations (1). This means that the ratio b/a increases. Then, as Figure 2 shows, the time path of the special case shifts from the black dotted line to red dotted line.
Case 2: A force with y units defends an area and another force with x units is attacking the same area. If the defender prepares the defense efficiently, it is more difficult to reduce y, and easier to reduce x. This means that one parameter, a, increases and the other, b, decreases. Compare the differential Equations (1). This means that the ratio b/a decreases. Then, as Figure 2 shows, the time path of the special case moves from the black dotted line to the blue dotted line.
Deviations from the line , imply that (x, y) will not converge towards origo. This is shown in Figure 3. If we start at a point on the original time path (yellow), and let the value of x increase, we move to the blue point. Then, the adjusted time path of (x, y) will later reach a point on the x-axis, x1. There, x > 0 and y = 0. If we start at a point on the original time path (yellow), but let the value of y increase, we move to the red point. Then, the new time path of (x,y) will reach a point on the y-axis, y1. There, x = 0 and y > 0.
The results found in Figure 4 follow from Figure 3. T is the point in time when x or y equals zero. If (x,y) at some point in time, t, such that t<T, is found in the blue sector, then x(T)>0 and y(T)=0. If (x,y) at some point in time, t, such that t<T, is found in the red sector, then x(T)=0 and y(T)>0.
Now, we will investigate the dynamics of (x, y) when we use some well documented empirically determined parameters from a real case. Compare the studies of the battle of Iwo Jima, by Engel (1954), Braun (1993), Washburn and Kress (2009) and by Stymfal (2022). In this study, we consider the data and dynamics from day D+6, when all the US troops had landed on Iwo Jima, according to the definitions in Stymfal (2022). According to the empirical data, x0 = 66150 and y0 = 18000. In the different studies, the attrition coefficient estimates differ marginally. Here, we use these figures, very close to all reported estimates: a = 0.05347 and b = 0.01045. In this paper, x0 is treated as a decision variable. Different ways to optimize x0, and the optimal values of x0 in different situations, will be determined. In the graph in Figure 5, x0 is assumed to be 65000.
Figure 6 shows the positions of (x, y) in the beginnings of each day, during the battle. In Figure 7, the same values of (x, y) have been used to construct a continuous function.
Now, let us determine the initial value of x, x0, that leads to the special case, bx2=ay2, based on the initial value of y, y0 = 18000, and the parameters a = 0.05347 and b = 0.01045. See Equation (11). With that value of x0, the time derivatives of the size of the resources, divided by the sizes of the resources, are equal. In that case, the time path of (x, y) follows a straight line in the first quadrant, moving towards origo.
In Figure 8 we see how x(t) and y(t) develop over time, in case x0 = 40716. The attrition coefficients have the same values as in Figure 5. Note, in Figure 8, how both resources decrease over time, and that the ratio x/y remains constant. In Figure 5, y was reduced to zero at t = 31. Figure 8, shows x and y during the first 100 days. They both approach zero, but will never reach zero. The conflict will continue forever.
In Figure 9 and Figure 10, we see that the point (x, y) really moves in a straight line towards origo, during the first 100 days. The sequence of points shows that the speed slows down. Consequently, (x, y) never reaches origo. The conflict continues forever.
If x0 is reduced to 30000, which is less than 40716, as derived in Equation (11), the system develops quite differently. The Figure 11, Figure 12 and Figure 13 show how x reaches zero when y still has a value close to 12000.
Clearly, we have seen that the initial value of x, x0, strongly influences several things of importance to the decision makers. Consider two decision makers, BLUE and RED. BLUE is the commander of the x resources, and RED commands the y resources. BLUE is the defender and RED is a potential attacker. Figure 4 can be used to determine the lowest value of x0 that makes it possible to get a solution such that BLUE wins a potential conflict, in the sense that BLUE will have a strictly positive value of x after a conflict where RED has lost all resources, which means that y is zero. BLUE can also use Equation (7) directly, to determine a value of x, conditional on the observed value of y. Then, if x is marginally increased, BLUE will not be completely out of x resources after a potential conflict, as seen in Figure 3. Hopefully, from the BLUE perspective, this fact can also stop RED from attacking BLUE.
In principle, it is possible to determine x0 this way: Estimate the values of y, a and b. Then, use Equation (7) to determine a value of x, called x2, that makes sure that we have a point on the time path leading to origo, found in Figure 1. Then, let the value of x0 be x2 + x3, where x3 > 0 makes sure that we are in the safe BLUE region, according to Figure 4. Of course, if we increase x3, this generally costs money. During peace time, it is economically tempting to reduce the value of x3 as much as possible. This has also been seen in several countries, during the period after World War II.
It is important to be aware that the reduction of x3 does not only reduce the defense budget. The estimates of y, a and b may be too optimistic from the BLUE perspective. Then, with a too low value of x3, and the true values of y, a and b, the system may move to the red region in Figure 4. In other words, the probability that BLUE would not survive a possible war with RED increases, if a low value of x3 is selected.
However, it is not likely that BLUE is only interested to “win” a possible war in the sense that some small number of the units x can survive a possible attack. The Figure 5, Figure 6, Figure 7, Figure 8, Figure 9, Figure 10, Figure 11, Figure 12 and Figure 13 have clearly shown that BLUE can adjust the time it takes for a conflict to end, via the selection of x0. The time it takes to stop a possible attack from RED is important in several ways. If a war goes on for a long time, this negatively influences the economically profitable production and trade. Furthermore, during a war, infrastructure and the environment are destroyed. Civilians are killed and wounded. Hence, it is important to determine how BLUE can reduce the time to stop the war, via the selection of x0.
The number of killed and wounded soldiers should also be considered. It is important to determine how BLUE can reduce the number of destroyed resources, x, such as killed and wounded soldiers, via the selection of x0.
In the later parts of this paper, detailed analytical and numerical investigations of these effects and decisions are included. Here, some introductory simple examples are given, with different values of x0. They show the time it takes to end a possible war, and the size of force reductions. In five different cases, found in Figure 14, x0 takes the values 30000, 40716, 45000, 52500 or 65000.
Note, in Figure 14, that it is possible to calculate the total number of lost x resources, at different points in time. That kind of information is shown in Figure 15. The total number of lost y resources, at different points in time, is shown in Figure 16.
In Figure 17, we see how the time of termination of a conflict, the point in time when the attacker RED has no more resources available, is affected by the value of x0. Clearly, a conflict stops more rapidly in case BLUE selects a larger value of x0.
In Figure 18, we see how the number of lost resources, x, at the time of termination of a conflict, is affected by the value of x0. Obviously, the number of resources, x, that are lost during the war, decreases if BLUE selects a larger value of x0.
Formal analysis:
Briefing on this section:
The complete dynamics of the battle in continuous time is determined. First, the general solution to the Lanchester differential equation system, which is a homogenous second order differential equation system, is derived. This may be interpreted as a 2-dimensional Two Point Boundary Value Problem (TPBVP). Equation (12) corresponds to Equation (1), but also includes initial conditions.
We study the differential equation system (12). The state of the system, , representing the sizes of the two opposing forces, changes over time, . The two parameters, , are called attrition coefficients. Newtonian notation, with time derivatives marked by dots, is used.
From (12.a), we get (13).
Differentiation of (13) with respect to time, gives (14).
(14) and (12.b) give (15). That can be rewritten as (16) and (17), which is a homogenous second order differential equation.
Let us assume that the functional form (18) is relevant. The parameters are assumed to be strictly different from zero.
Then, the following procedure can be used to determine the state variable as an explicit function of time. Equations (17) and (18) give (19).
Equation (19) can be simplified to (20).
Equations (18) and (20) imply (21).
From the quadratic Equation (21), we obtain the solution (22).
Let be defined according to (23).
Clearly, two solutions exist.
Observation:
, as we see in Equation (12), which means that there are two real roots. These roots have different values. Hence, the general solution of the differential equation is:
Furthermore, from (13) we already know that:
As a result, we get (27).
The expression (27) may be rewritten as (28).
Hence, the solution to the differential equation system (12) is given in (29).
To determine the time path we need to know the four parameters . We already know the initial value of . In this study, we are interested to determine the optimal value of . We want to be sure that we will win the battle, which means that and at a point in time, . This point in time, when the enemy has no more available resource, is denoted the terminal time.
From Equation (29), the initial conditions (30) and (31) follow:
The terminal conditions, (32) and (33), are also derived from Equation (29):
The nonlinear simultaneous equation system (34) must be satisfied. We assume that a feasible solution exists and that this solution is unique.
Determination of :
From Cramer’s rule, we get:
Observations:
Two different proofs are given in the end of this paper that show that .
If , then reaches zero when . In that case, .
If , then reaches zero when . In that case, .
If (which is extremely unlikely), then and both converge to zero. Then, .
The case when is not further studied in this paper, since the probability of that case is practically zero.
Determination of T.
From now on, we only consider the case where . Consequently, reaches zero when and . Let us determine as the point in time when .
In Figure 15, we see how the terminal time T is affected by the initial sizes of the two forces, when the attrition coefficients from Iwo Jima are used. In Figure 16, it is demonstrated that the terminal time T is reduced, in case the attrition coefficient b increases.
Determination of the derivative of T with respect to x0.
Determination of the second derivative of T with respect to x0.
Determination of xT via the function x(t) and the value of T when yT = 0:
Alternative method to determine xT:
Q.E.D.
In Figure 17, we see how the size of the x force at the terminal time T is affected by the initial sizes of the two forces, when the attrition coefficients from Iwo Jima are used.
In Figure 17, we see the number of killed or wounded soldiers from the x force at the terminal time T, as a function of the initial sizes of the two forces, when the attrition coefficients from Iwo Jima are used.
Figure 18.
K(x0, y0) = x0 - xT(x0,y0). a = 0.05347, b = 0.01045. Compare Equation (83).
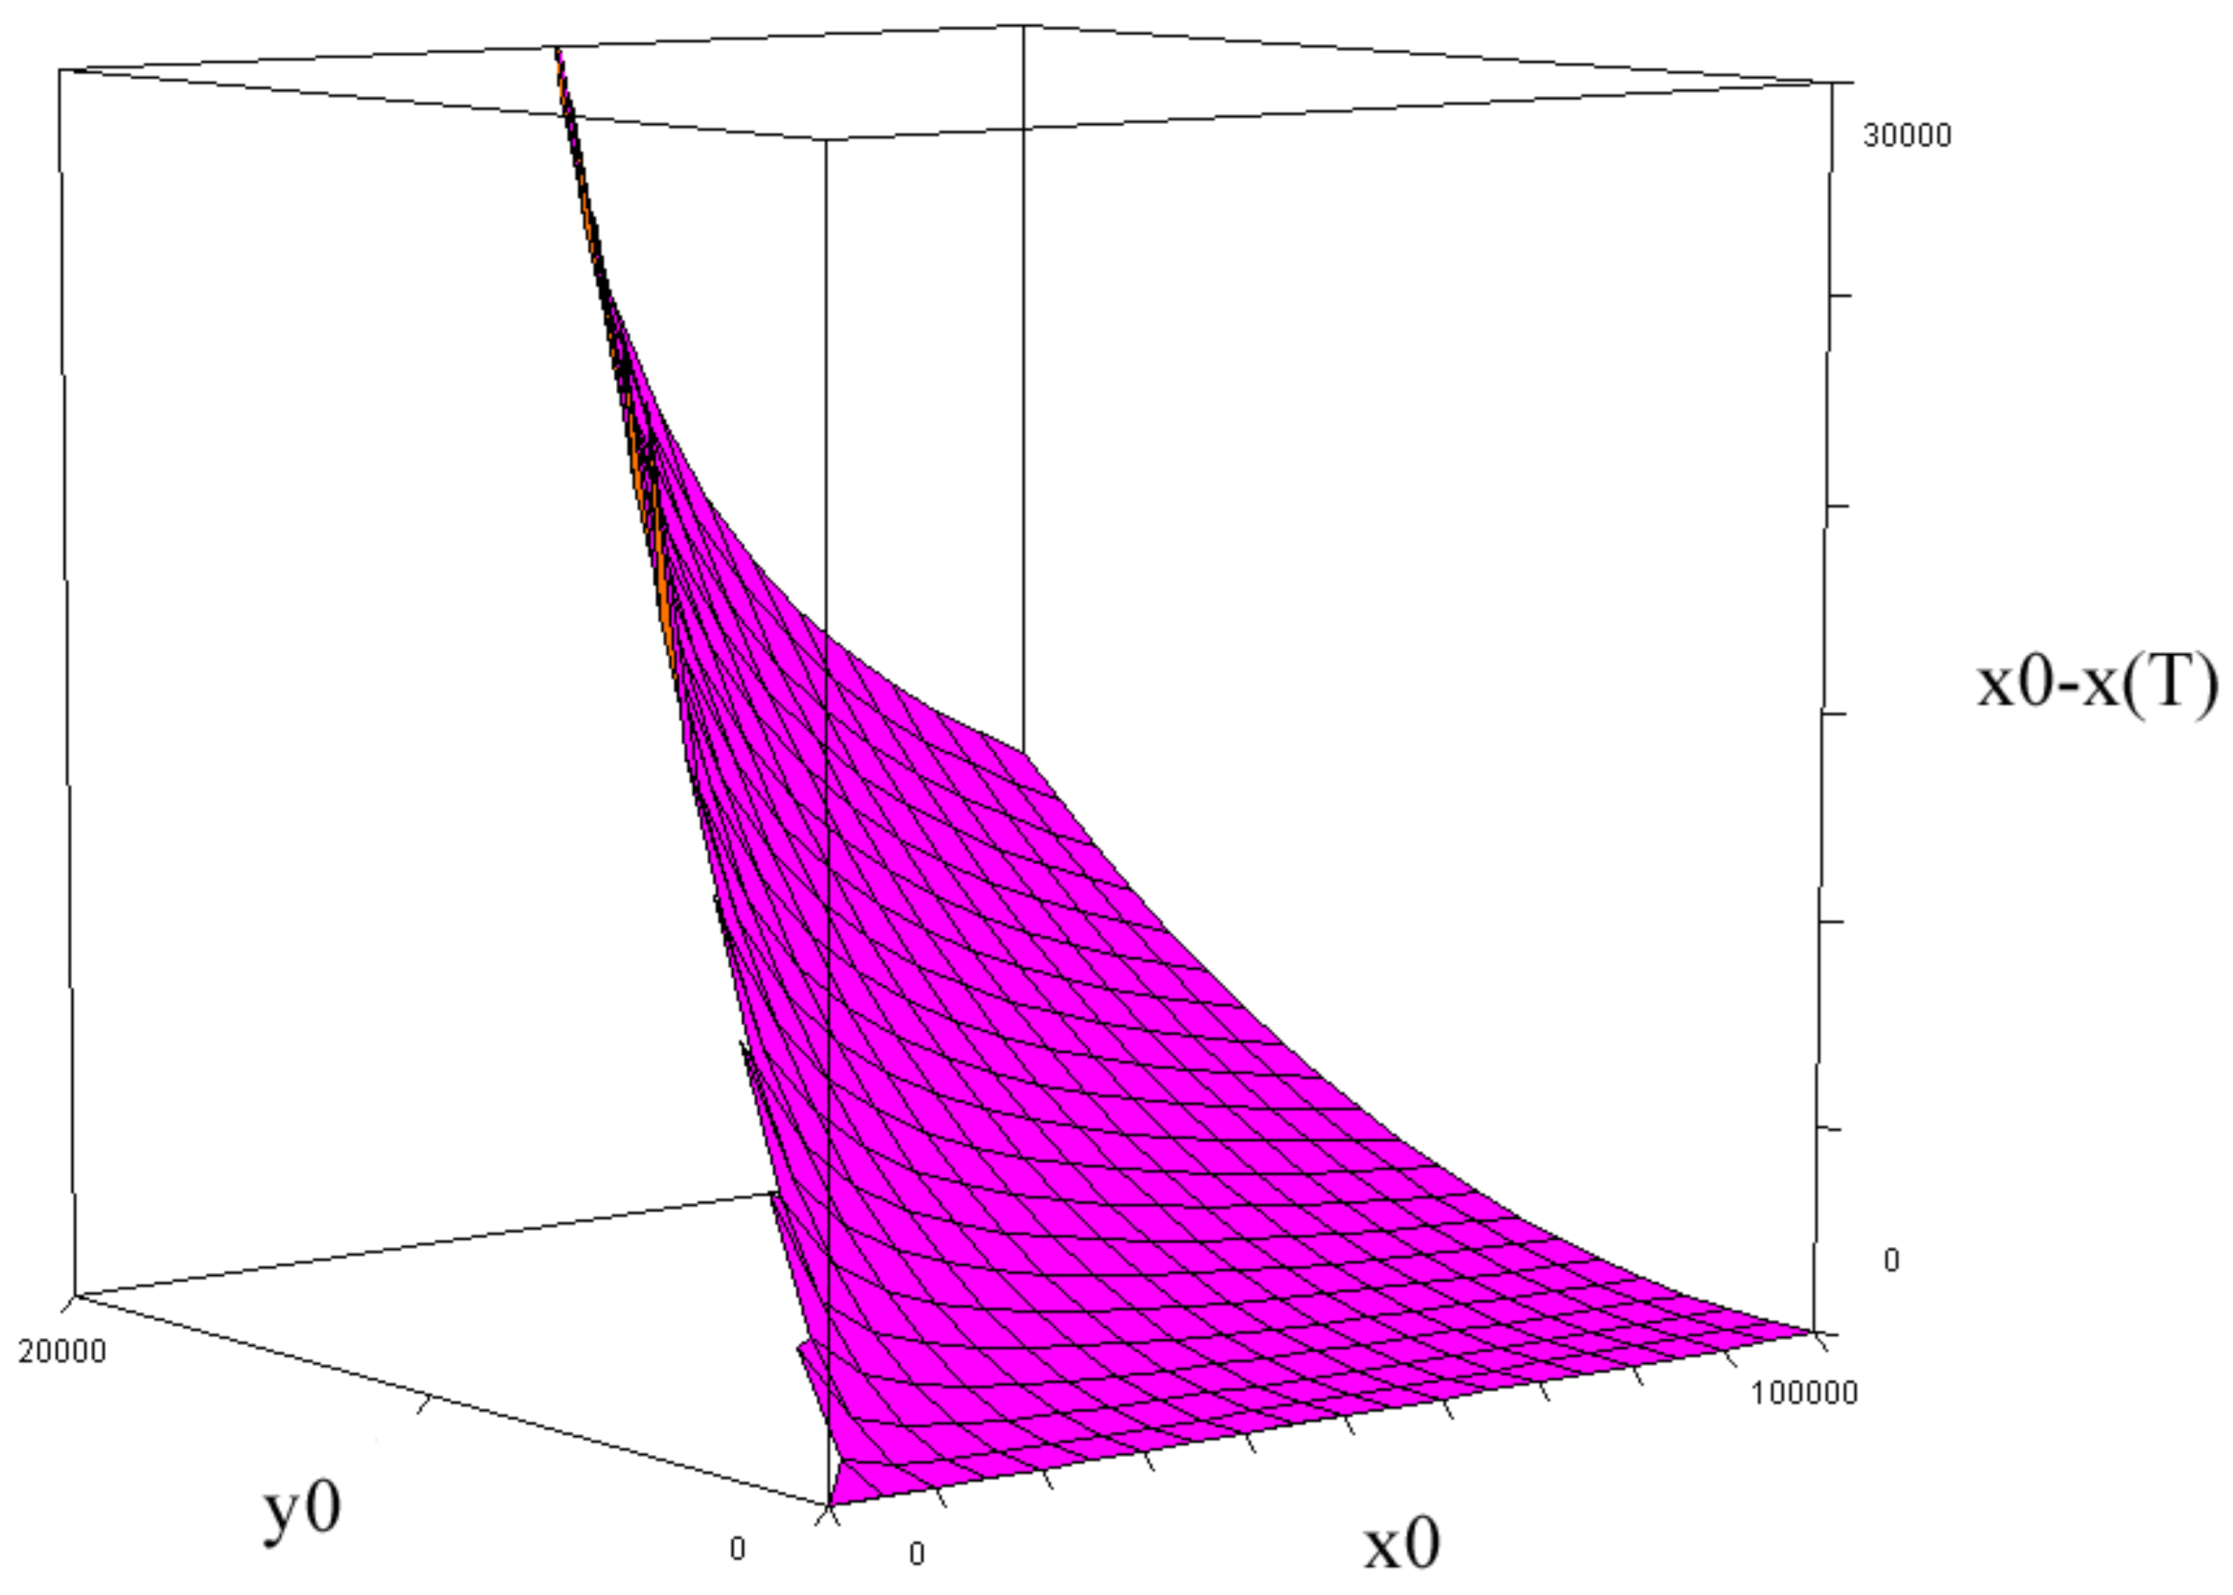
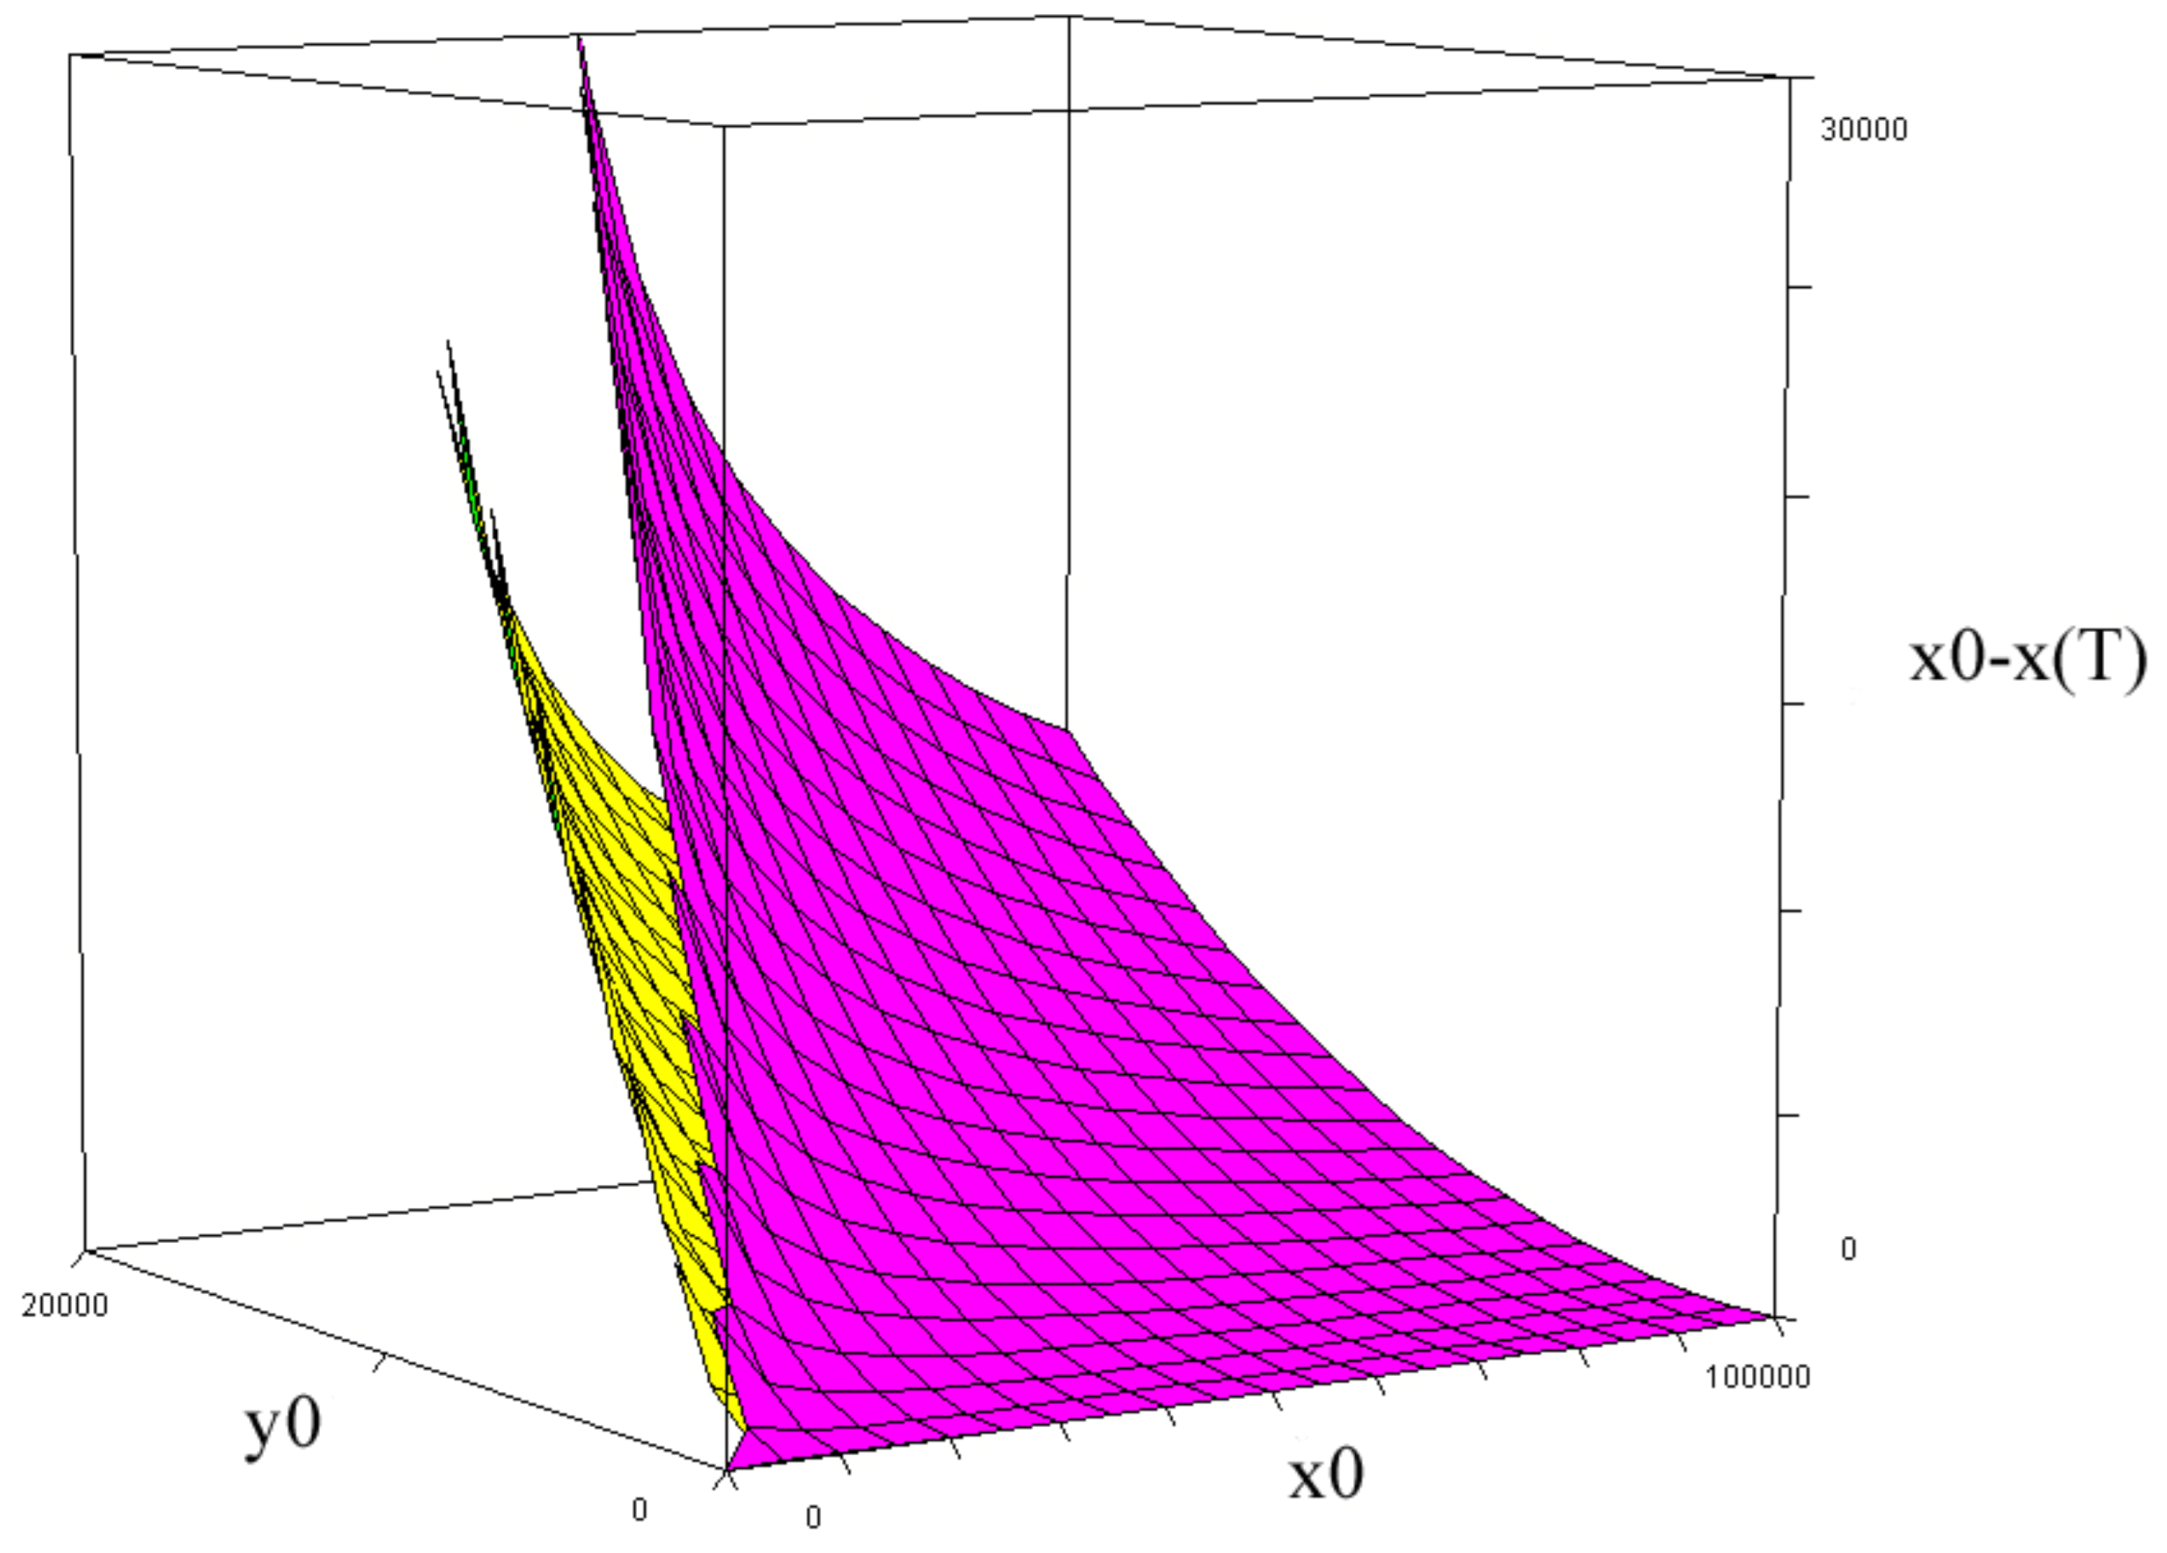
In Figure 18, we see the number of killed or wounded soldiers from the x force at the terminal time T, as a function of the initial sizes of the two forces, when the attrition coefficients from Iwo Jima are used. We also see how the number of killer or wounded soldiers from the x force at the terminal time T, for different combinations of the initial sizes of the two forces, is affected in case the attrition coefficient b increases. If the coefficient b increases, a smaller number of soldiers from the x force are killed or wounded.
Figure 19.
K(x0, y0) = x0 - xT(x0,y0). a = 0.05347, b = 0.01045. (Purple). Compare Equation (83). K(x0, y0) = x0 - xT(x0,y0). a = 0.05347, b = 0.02045. (Yellow). Compare Equation (83).
Figure 19.
K(x0, y0) = x0 - xT(x0,y0). a = 0.05347, b = 0.01045. (Purple). Compare Equation (83). K(x0, y0) = x0 - xT(x0,y0). a = 0.05347, b = 0.02045. (Yellow). Compare Equation (83).
Determination of the derivative of xT with respect to x0 when yT = 0:
Determination of the second derivative of xT with respect to x0 when yT = 0:
Summary of important results
Economic optimization in the deterministic case:
Economic optimization of the deployment decision, is based on an objective function. This objective function is the sum of the possible revenues minus the different costs, that are consequences of the decision. In the first version of this optimization problem, the revenue associated with an instant victory, is denoted G. The maximization of such an objective function, denoted , is presented in general form in Equation (102). The decision variable is the initial size of force x. The listed parameters are the attrition coefficients, a and b, the marginal cost of the time of the victory, , the marginal cost of killed or wounded soldiers with equipment, , and the initial size of force y.
A more explicit form of the objective function is found in Equation (103). is the total cost of the soldiers with equipment, sent to the battle field. It is important to be aware that this total cost includes the costs of military education, transport, and possible alternative values of utilization of the deployed soldiers. For instance, the soldiers could probably also have been used in industrial production, or in some other way, if they would not have been sent to this particular battle field. Furthermore, it could also have been possible to send some of them to some other battle field.
Equation (104) is an even more explicit form of the objective function.
The Figure 20 and Figure 21 illustrate the objective function (104) as a function of the initial sizes of the two forces. The functions and values in Figure 20 are: C(x0) = 1000 + 1x0, G = 200000, cT = 730 and cxT =2. a = 0.05347, b = 0.01045. The attrition coefficients are collected from the empirical estimations based on the Battle of Iwo Jima. Compare Figure 5 and Stymfal (2022).
Motivation for the introduced parameter values, used in CASE 0:
The two parameters in the function C(x0), G, cT and cxT have no documented empirical background. In fact, it is not even clear that these parameter values have ever been empirically determined, decided, or documented in connection to the real battle. Still, since the values of these parameters are necessary to know, in case we should be able to optimize the deployment decision x0, in a logically defendable manner, with consideration of the economically relevant conditions present in the objective function (104), these numerically specified parameter values are now suggested. We assume that the unit of the objective function is M$US, in the price level of 2024.
First, we should be aware that fix costs and fix revenues do not affect the optimal deployment decision, as long as the optimal deployment decision is strictly positive. The fix cost parameter in is 1000, which represents 1billion $US. The marginal cost of one soldier in is 1 M$US, which may be reasonable with consideration of the fact that the economic value of alternative use of one person in the labor force, plus several other costs, may be considerable. The value of G, 200 billion $US, represents the value of instant access to the island Iwo Jima, during the end of WW II. This island was very important during the final part of the war, but the economic value G was probably never calculated. The parameter cT shows how rapidly the value of access to the island declines, per day, when we wait for the victory. With the suggested parameter value, the economic value of access to the island would be 0 after 274 days, or 9 months. Hence, each month, the economic value of access to the island falls with approximately 11% of the value of instant access to the island. The economic value of each lost killed or wounded soldier, with equipment, cxT, is assumed to be set to 2 M$US. Such economically defined values, of lost lives, are almost never reported. Still, such values are necessary parameters, when the optimal deployment problem should be solved. The reader is encouraged to search for empirically estimated parameters of the types that now have been introduced. If new values are found, the updated complete analysis may be repeated.
In Figure 21, we see how the objective function (104) is affected, in case the attrition coefficient b increases. Then, the objective function of the x force commander, increases. Furthermore, the optimal value of x0 decreases.
A unique maximum:
First order optimum condition:
Hence, the solution of the first order optimum condition represents a unique maximum of the objective function.
Comparative statics analysis:
Now, we determine how parameter changes affect the optimal deployment decision:
With comparative statics analysis, we see how the optimum is maintained when different possible parameter changes take place. First, the cost per day of the battle is adjusted. The first order optimum condition is differentiated with respect to the optimal value of , denoted , and :
Hence, if the cost per day before the victory increases, then the optimal deployment level increases. This is understandable, since the process will end more rapidly if the initial number of units is larger.
The result shows that if the cost per unit of killed or wounded troops with equipment increases, then the optimal deployment level increases. This is understandable, since the number of surviving units is an increasing function of the initial number of units.
Hence, if the attrition coefficient a increases, then the optimal deployment increases.
Hence, if the attrition coefficient b increases, then the optimal deployment decreases. This is also illustrated in Figure 21.
3. Results
Numerical results are reported from two alternative optimization models. Both models are documented in the Appendix.
Numerical Model 1:
Continuous optimization model with Newton Raphson iteration:
This model, directly based on the analytical derivations presented in the earlier sections, determines the optimal decisions and consequences, via the Newton- Raphson method applied to the first order optimization condition. Table 1. contains the output from the model when the Case 0 parameters are used. In the first and second rows, the parameters are shown. x0_0 is the initial value of x0, when the iteration method starts. Then, the steps of the iteration are listed. The table shows the number of the iteration, n, the value of the deployment, x0, the time of the victory, T (days), the number of killed and wounded soldiers, K, and the change of x0, dx0. The iterations stop when dx0 is sufficiently close to zero. The optimal results are found in the last row. Table 1. and the Figure 22, Figure 23 and Figure 24, show the optimal results in different cases. Table A1 in the Appendix includes numerical information.
Numerical Model 2:
Discrete optimization model with stochastic attrition coefficients:
This model, partly based on the analytical derivations presented in the earlier sections, determines the optimal decisions and consequences, via numerical calculations, for alternative deployment levels. The optimal value of the objective functions is defined as the highest value of the investigated alternatives.
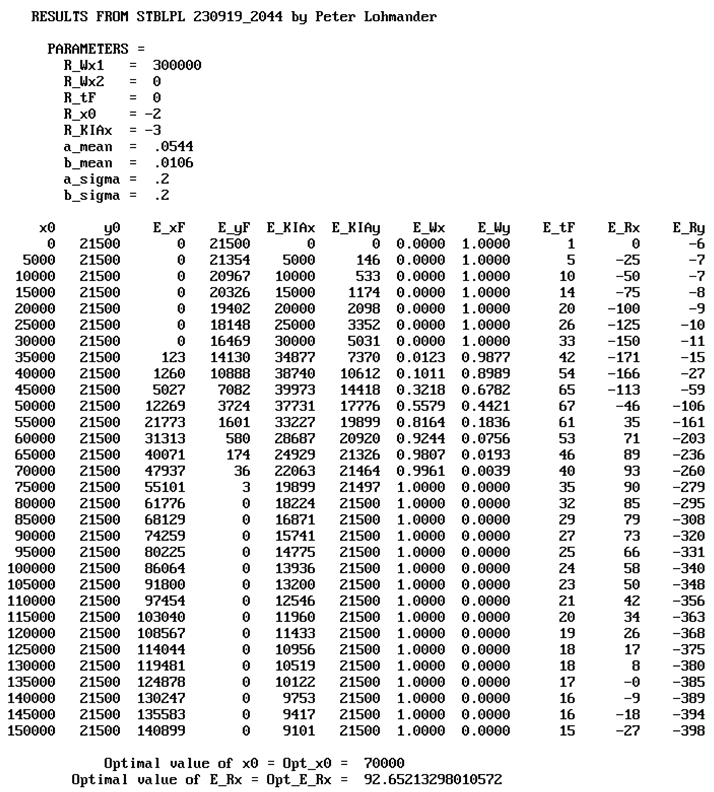
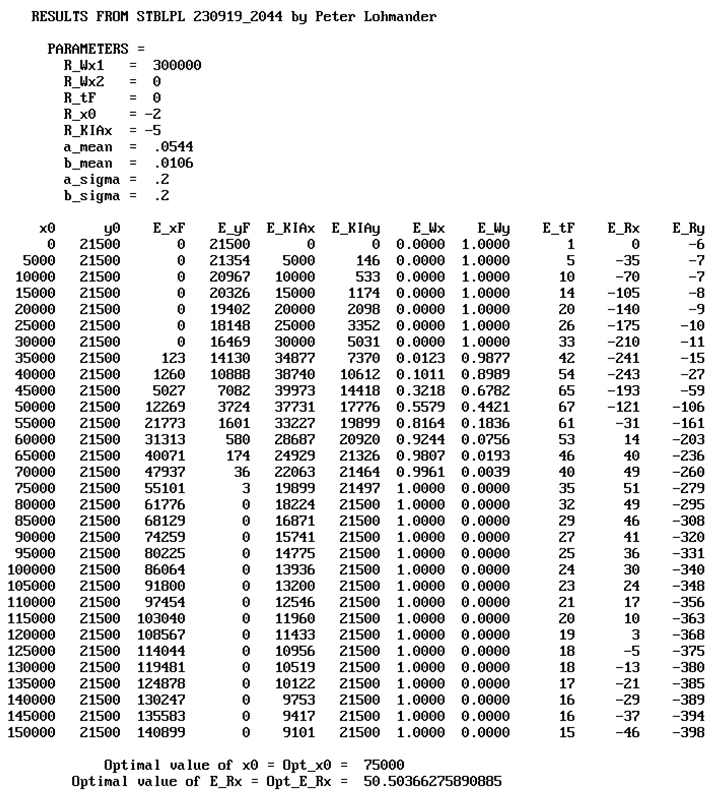
Table 2 contains the output from the model when the Case 0 parameters are used. The cases and parameters are not all identical as in the Numerical model 1. R_Wx1 is the value of instant access to the island, and corresponds to G. R_tF corresponds to cTX. R_x0 corresponds to the marginal cost of C(x) multiplied by -1. R_KIAx corresponds to cxT. a_mean and b_mean are the expected values of the attrition coefficients a and b. a_sigma and b_sigma are the relative standard deviations of the attrition coefficients a and b. E_xF and E_yF are the expected numbers of soldiers, x and y, that are still alive after the battle. E_KIAx and E_KIAy are the expected numbers of killed or wounded soldiers in the two armies, after the battle. E_Wx is the probability that the army with the x resources wins the battle and E_Wy is the probability that the army with the y resources wins the battle. E_tF is the expected time (Day) when one of the armies wins the battle. E_Rx and E_Ry are the expected objective function values of the two armies, in the unit billion $US. (The details of E_Ry are not of relevance here. More details may be found in the Appendix.) In the final two rows, the optimal deployment decision, x0, and the optimal objective function value, E_Rx, are presented. Table 2.b and the Figure 25, Figure 26 and Figure 27, show the optimal results in different cases. Table A2 in the Appendix includes numerical information.
4. Discussion
The decision problem studied in this paper, to determine the optimal size of a military force to send to the battle field, is based on several assumptions. We should be aware that, in many conflicts, the objective function is not mathematically defined. There may be several reasons for this fact. Maybe, the decision maker simply does not know the potential value of a victory, the costs of different possible delays of a victory, the true costs of deployment of different numbers of soldiers, the costs of killed and wounded soldiers and destroyed equipment, and the attrition coefficients. Maybe the knowledge of mathematics is not sufficient. The analysis and optimization in this paper has shown that the optimal size of the deployed force is strongly dependent on the listed parameters. If the value of a potential victory is not sufficiently high, the optimal decision may be to avoid the battle completely. Then, in a formal analysis, the optimal objective function would be negative. This way, the costs of deployment, delays, killed and wounded soldiers and destroyed equipment, can all be avoided. Clearly, without an objective function that covers all relevant costs and revenues, with numerically specified cost and revenue functions and parameters, it is not possible to observe and react on such possible negative values, before it is too late. In the case of the Battle of Iwo Jima, the value of a potential victory is a function of the properties of the general strategy plans in the Pacific Ocean and connected areas, during WW II. Hence, it would have been necessary to investigate and optimize the complete strategic plan, with or without access to the island Iwo Jima, to be able to determine an approximate value of a potential victory at Iwo Jima. Furthermore, to be able to determine the costs of different possible time delays before access to the island would be possible, several alternative general strategies in the Pacific would have to be developed. Obviously, such analyses could have been very difficult and time consuming, at the time of the battle, partly because of the lack of modern computers. Nowadays, however, the computational capacity provides no relevant constraints to this kind of analysis. In the analysis in this paper, it has been demonstrated that the optimal size of the deployed force, and the expected numbers of killed or wounded soldiers, are strongly dependent on the marginal cost of potential delays of a victory. In the deterministic case, if the marginal cost of waiting for a victory doubles, the optimal size of the deployed force increases by almost 10000 soldiers. Then, the victory appears 4 days earlier and the number of killed or wounded soldiers decreases by more than 2000. In one of the stochastic cases, if the marginal cost per killed or wounded soldier increases by 5 M $US, the optimal size of the deployed force increases by 10000 soldiers. Then, the expected victory occurs 11 days earlier and the expected number of killed or wounded soldiers decreases by more than 5000. Hence, if we are truly interested to develop the optimal strategic plan, and care about the lives of soldiers, we simply must define the objective function correctly and perform the relevant optimization.
5. Conclusions
This study focuses on the optimal deployment problem, and determines the optimal size of a military force to send to the battle field. The decision is optimized, based on an objective function, that considers the cost of deployment, the cost of the time it takes to win the battle, and the costs of killed or wounded soldiers and equipment. The cost of deployment is modeled as an explicit function of the number of deployed troops and the value of a victory with access to a free territory, is modeled as a function of the length of the time it takes to win the battle. The cost of lost troops and other equipment, is a function of the size of the reduction of these lives and resources. An objective function, based on these values and costs, is optimized, under different parameter assumptions. The battle dynamics is modeled via the Lanchester differential equation system based on the principles of directed fire. First the deterministic problem is solved analytically, via derivations and comparative statics analysis. General mathematical results are reported, including the directions of changes of the optimal deployment decisions, under the influence of alternative types of parameter changes. Then, the first order optimum condition from the analytical model, in combination with numerically specified parameter values, is used to determine optimal values of the levels of deployment in different situations. A concrete numerical case, based on documented facts from the Battle of Iwo Jima, during WW II, is analyzed, and the optimal US deployment decisions are determined under different assumptions. The known attrition coefficients of both armies, from USA and Japan, and the initial size of the Japanese force, are parameters. The analysis is also based on some parameters without empirical documentation, that are necessary to include to make optimization possible. The optimal solutions are found via Newton Raphson iteration. Finally, a stochastic version of the optimal deployment problem is defined. The attrition parameters are considered as stochastic, before the deployment decisions have been made. The attrition parameters of the two armies have the same expected values as in the deterministic analysis, are independent of each other, have correlation zero, and have relative standard deviations of 20%. All possible deployment decisions, with 5000 units intervals, from 0 to 150000, are investigated, and the optimal decisions are selected. The analytical, and the two numerical, methods, all show that the optimal deployment level is a decreasing function of the marginal deployment cost, an increasing function of the marginal cost of the time to win the battle, an increasing function of the marginal cost of killed and wounded soldiers and lost equipment, an increasing function of the initial size of the opposing army, an increasing function of the efficiency of the soldiers in the opposing army and a decreasing function of the efficiency of the soldiers in the deployed army. The stochastic model also shows that the probability to win the battle is an increasing function of the size of the deployed army. When the optimal deployment level is selected, the probability of a victory is usually less than 100%, since it would be too expensive to guarantee a victory with 100%. Some of many results of relevance to the Battle of Iwo Jima, are the following: In the deterministic Case 0 analysis, the optimal US deployment level is 66200, the time to win the battle is 30 days and 14000 US soldiers are killed or wounded. If the marginal cost of the time to wait for a victory doubles, the optimal deployment increases to 75400, the time to win is reduced to 26 days, and less than 12000 soldiers are killed or wounded. In the stochastic Case 0 analysis, the optimal US deployment level is 65000, the expected time to win the battle is 46 days and almost 25000 US soldiers are expected to be killed or wounded. If the cost per killed or wounded soldier increases by 5 M$US, the optimal deployment level increases to 75000. Then, the victory is expected to appear after 35 days and 19900 US soldiers are expected to be killed or wounded.
Appendix
Numerical Model 1:
Continuous optimization model with Newton Raphson iteration:

Table A1.
Optimal results from Numerical Model 1, in different cases.
| Case | Case | x0 | T | K |
|---|---|---|---|---|
| 0 | Case 0 | 66156 | 30.36 | 14014 |
| 1 | cx0 = 2 | 54281 | 41.17 | 18384 |
| 2 | cT = 1460 | 75419 | 25.551 | 11935 |
| 3 | cK = 4 | 77210 | 24.81 | 11608 |
| 4 | y0 = 23000 | 81670 | 31.862 | 18716 |
| 5 | a = 0.033470 | 56857 | 34.353 | 10006 |
| 6 | b = 0.02045 | 47292 | 21.703 | 10018 |
Software developed in the computer language QB64:
        Rem
        Rem OptStrat_240114_1950
        Rem Peter Lohmander
        Cls
        Open "AOpt_Out.txt" For Output As #1
        DefDbl A-Z
        F = 1000
        cx0 = 1
        G = 200000
        cT = 730
        cK = 2.0
        a = .05347
        b = .01045
        y0 = 18000
        x0 = 90000
        dx0 = 1
        dPdx0 = 0
        d2Pdx02 = 0
        T = 0
        K = 0
        Print "       F     cx0       G       cT      cK"
        Print Using "########"; F;
        Print Using "####.###"; cx0;
        Print Using "########"; G;
        Print Using "#####.###"; cT;
        Print Using "####.###"; cK
        Print ""
        Print "         a         b       y0     x0_0"
        Print Using "###.######"; a; b;
        Print Using "#########"; y0;
        Print Using "#########"; x0
        Print ""
        Print "  n      x0       T       K           dx0"
        Print #1, "       F     cx0       G       cT      cK"
        Print #1, Using "########"; F;
        Print #1, Using "####.###"; cx0;
        Print #1, Using "########"; G;
        Print #1, Using "#####.###"; cT;
        Print #1, Using "####.###"; cK
        Print #1, ""
        Print #1, "         a         b       y0     x0_0"
        Print #1, Using "###.######"; a; b;
        Print #1, Using "#########"; y0;
        Print #1, Using "#########"; x0
        Print #1, ""
        Print #1, "  n      x0       T       K           dx0"
        For n = 0 To 20
            Print Using "###"; n;
            Print #1, Using "###"; n;
            If n = 0 GoTo 2
            Print Using "########"; x0;
            Print Using "####.###"; T;
            Print Using "########"; K;
            Print Using "#######.######"; dx0
            Print #1, Using "########"; x0;
            Print #1, Using "####.###"; T;
            Print #1, Using "########"; K;
            Print #1, Using "#######.######"; dx0
            GoTo 3
            2 Rem
            If n > 0.1 Then GoTo 3
            Print Using "########"; x0
            Print #1, Using "########"; x0
            3 Rem
            dx02 = (dx0 * dx0) ^ .5
            If dx02 < 0.000001 Then GoTo 4
            dPdx0 = -cx0 - cT * (-y0 / (b * x0 * x0 - a * y0 * y0)) - cK * (1 - ((b ^ .5) * x0 / ((b * x0 * x0 - a * y0 * y0) ^ .5)))
            d2Pdx02 = -cT * (2 * b * x0 * y0) / ((b * x0 * x0 - a * y0 * y0) ^ 2) - cK * (a * (b ^ .5) * y0 * y0) / ((b * x0 * x0 - a * y0 * y0) ^ (3 / 2))
            dx0 = (-1) * dPdx0 / d2Pdx02
            Rem Convergence stabilizer
            dx0_test = (dx0 * dx0) ^ 0.5
            If dx0_test > 5000 Then dx0 = dx0 * 0.3
            x0 = x0 + dx0
            T = Log((x0 + ((a / b) ^ .5) * y0) / (x0 - ((a / b) ^ .5) * y0)) / (2 * (a * b) ^ .5)
            K = x0 - ((b * x0 * x0 - a * y0 * y0) / b) ^ .5
        Next n
        4 Rem
        Close #1
        End
        RESULTS CASE 0 (According to the original software version):
               F     cx0       G       cT      cK
            1000   1.000  200000  730.000   2.000
                 a         b       y0     x0_0
          0.053470  0.010450    18000    90000
          n      x0       T       K           dx0
          0   90000
          1   75787  25.395   11866 -14213.471601
          2   71793  27.214   12662  -3993.160551
          3   69728  28.277   13123  -2065.419803
          4   65658  30.680   14149  -4069.855630
          5   66147  30.366   14016    488.771454
          6   66156  30.360   14014      9.613701
          7   66156  30.360   14014      0.003585
          8   66156  30.360   14014      0.000000
        RESULTS CASE 1 (cx0 = 2):
               F     cx0       G       cT      cK
            1000   2.000  200000  730.000   2.000
                 a         b       y0     x0_0
          0.053470  0.010450    18000    90000
          n      x0       T       K           dx0
          0   90000
          1   50504  47.215   20624 -39495.713055
          2   53285  42.560   18912   2781.032194
          3   54212  41.263   18419    927.034539
          4   54281  41.170   18384     68.677048
          5   54281  41.170   18384      0.331041
          6   54281  41.170   18384      0.000008
          7   54281  41.170   18384     -0.000000
        RESULTS CASE 2 (cT = 1460):
               F     cx0       G       cT      cK
            1000   1.000  200000 1460.000   2.000
                 a         b       y0     x0_0
          0.053470  0.010450    18000    90000
          n      x0       T       K           dx0
          0   90000
          1   83643  22.499   10579  -6357.049117
          2   80557  23.546   11047  -3086.257186
          3   78776  24.200   11338  -1780.791194
          4   75080  25.697   11999  -3695.964467
          5   75416  25.552   11936    335.709627
          6   75419  25.551   11935      3.426741
          7   75419  25.551   11935      0.000350
          8   75419  25.551   11935      0.000000
        RESULTS CASE 3 (cK = 4.0):
               F     cx0       G       cT      cK
            1000   1.000  200000  730.000   4.000
                 a         b       y0     x0_0
          0.053470  0.010450    18000    90000
          n      x0       T       K           dx0
          0   90000
          1   84755  22.147   10421  -5245.016446
          2   82009  23.040   10822  -2746.123451
          3   80375  23.611   11076  -1633.407381
          4   76930  24.923   11658  -3445.217337
          5   77208  24.811   11609    277.570355
          6   77210  24.810   11608      2.164392
          7   77210  24.810   11608      0.000130
          8   77210  24.810   11608     -0.000000
        RESULTS CASE 4 (y0 = 23000):
               F     cx0       G       cT      cK
            1000   1.000  200000  730.000   2.000
                 a         b       y0     x0_0
          0.053470  0.010450    23000    90000
          n      x0       T       K           dx0
          0   90000
          1   86810  29.278   17317  -3190.065298
          2   85006  30.128   17780  -1803.655790
          3   81303  32.067   18826  -3702.890302
          4   81665  31.865   18717    361.867276
          5   81670  31.862   18716      4.387576
          6   81670  31.862   18716      0.000630
          7   81670  31.862   18716      0.000000
        RESULTS CASE 5 (a = 0.033470):
               F     cx0       G       cT      cK
            1000   1.000  200000  730.000   2.000
                 a         b       y0     x0_0
          0.033470  0.010450    18000    90000
          n      x0       T       K           dx0
          0   90000
          1   64609  29.272    8604 -25390.678169
          2   61518  31.085    9109  -3090.877732
          3   59846  32.174    9410  -1671.977709
          4   56484  34.648   10087  -3362.124354
          5   56852  34.357   10007    367.209670
          6   56857  34.353   10006      5.740354
          7   56857  34.353   10006      0.001362
          8   56857  34.353   10006      0.000000
        RESULTS CASE 6 (b = 0.020450):
               F     cx0       G       cT      cK
            1000   1.000  200000  730.000   2.000
                 a         b       y0     x0_0
          0.053470  0.020450    18000    90000
          n      x0       T       K           dx0
          0   90000
          1   41565  26.243   11892 -48434.782573
          2   45537  22.885   10516   3972.157477
          3   47126  21.809   10063   1588.180413
          4   47290  21.704   10018    164.537547
          5   47292  21.703   10018      1.493795
          6   47292  21.703   10018      0.000121
          7   47292  21.703   10018     -0.000000
Numerical Model 2:
Discrete optimization model with stochastic attrition coefficients:
Table A2.
Output from Numerical Model 2, Case 0.
| Case | Case | x0 | T | K |
|---|---|---|---|---|
| 0 | Case 0 | 65000 | 46 | 24929 |
| 1 | R_KIAx = -3 | 70000 | 40 | 22063 |
| 2 | R_KIAx = -5 | 75000 | 35 | 19899 |
| 3 | R_tF = -2000 | 75000 | 35 | 19899 |
| 4 | R_tF = -4000 | 85000 | 29 | 16871 |
Software developed in the computer language QB64:
        Rem
        Rem STBLPL_230919_2053_r
        Rem Peter Lohmander
        DefDbl A-Z
        Dim m_value(11), m_freq(11), n_value(11), n_freq(11), a_value(11), b_value(11)
        Screen _NewImage(1000, 1000, 256)
        Cls
        Rem Open "C:\Users\Peter\OneDrive\Desktop\STBLPL\STBLPL_Out.txt" For Output As #2
        y0 = 21500
        R_Wx1 = 300000
        R_Wx2 = 0
        R_tF = 0
        R_x0 = -2
        R_KIAx = 0
        a_mean = 0.0544
        b_mean = 0.0106
        a_sigma = 0.2
        b_sigma = 0.2
        c_value = (18 / 105) ^ 0.5
        Print ""
        Print "     RESULTS FROM STBLPL 230919_2044 by Peter Lohmander"
        Print ""
        Print "       PARAMETERS = "
        Print "         R_Wx1   = "; R_Wx1
        Print "         R_Wx2   = "; R_Wx2
        Print "         R_tF    = "; R_tF
        Print "         R_x0    = "; R_x0
        Print "         R_KIAx  = "; R_KIAx
        Print "         a_mean  = "; a_mean
        Print "         b_mean  = "; b_mean
        Print "         a_sigma = "; a_sigma
        Print "         b_sigma = "; b_sigma
        Print ""
        Rem Values of m(i) and n(i)
        For i = 1 To 11
            m_value(i) = (i - 6) * c_value * a_sigma
            n_value(i) = (i - 6) * c_value * b_sigma
        Next i
        Rem Relative Frequences of m(i) and n(i)
        For i = 1 To 6
            m_freq(i) = i / 36
            n_freq(i) = i / 36
        Next i
        For i = 7 To 11
            m_freq(i) = (12 - i) / 36
            n_freq(i) = (12 - i) / 36
        Next i
        Rem Values of a and b
        For i = 1 To 11
            a_value(i) = a_mean * (1 + m_value(i))
            b_value(i) = b_mean * (1 + n_value(i))
        Next i
        GoTo 100
        Rem Optional tests of distributions (if the line before this line is removed)
        E_m = 0
        E_m2 = 0
        E_n = 0
        E_n2 = 0
        For i = 1 To 11
            E_m = E_m + m_freq(i) * m_value(i)
            E_m2 = E_m2 + m_freq(i) * (m_value(i)) ^ 2
            E_n = E_n + n_freq(i) * n_value(i)
            E_n2 = E_n2 + n_freq(i) * (n_value(i)) ^ 2
        Next i
        Print "  E_m = "; E_m; "  E_m2 = "; E_m2
        Print "  E_n = "; E_n; "  E_n2 = "; E_n2
        Print ""
        Rem Tests of a and b values
        For i = 1 To 11
            Print " i = "; i; " a_value(i) = "; a_value(i); "  b_value(i) = "; b_value(i)
        Next i
        100 Rem
        Opt_x0 = 0
        Opt_E_Rx = -99999999
        Print "      x0      y0    E_xF    E_yF  E_KIAx  E_KIAy    E_Wx    E_Wy    E_tF    E_Rx    E_Ry"
        For x0_index = 0 To 150 Step 5
            x0 = x0_index * 1000
            Rem The expected values of the result variables are set to zero before the (a,b) loop begins.
            E_xF = 0
            E_yF = 0
            E_KIAx = 0
            E_KIAy = 0
            E_Wx = 0
            E_Wy = 0
            E_tF = 0
            E_Rx = 0
            E_Ry = 0
            Rem Loop with alternative values of a and b
            For m_index = 1 To 11
                For n_index = 1 To 11
                    Prob = m_freq(m_index) * n_freq(n_index)
                    Rem Engel coefficients
                    a = a_value(m_index)
                    b = b_value(n_index)
                    x = x0
                    y = y0
                    For t = 1 To 100
                        xt = x
                        yt = y
                        x = xt - a * yt
                        y = yt - b * xt
                        If x < 1 Then GoTo 2
                        If y < 1 Then GoTo 2
                    Next t
                    2 Rem
                    tF = t
                    xF = x
                    yf = y
                    If xF < 0 Then xF = 0
                    If yf < 0 Then yf = 0
                    Wx = 0
                    Wy = 0
                    If xF > yf Then Wx = 1
                    If xF < yf Then Wy = 1
                    KIAx = x0 - xF
                    KIAy = y0 - yf
                    If KIAx > x0 Then KIAx = x0
                    If KIAy > y0 Then KIAy = y0
                    Rx = (R_Wx1 * Wx * Exp(R_Wx2 * tF) + R_tF * tF + R_x0 * x0 + R_KIAx * KIAx) / 1000
                    Ry = (-500000 * Wx * Exp(-.02 * tF) - .3 * y0 - 1 * KIAy) / 1000
                    E_xF = E_xF + Prob * xF
                    E_yF = E_yF + Prob * yf
                    E_KIAx = E_KIAx + Prob * KIAx
                    E_KIAy = E_KIAy + Prob * KIAy
                    E_Wx = E_Wx + Prob * Wx
                    E_Wy = E_Wy + Prob * Wy
                    E_tF = E_tF + Prob * tF
                    E_Rx = E_Rx + Prob * Rx
                    E_Ry = E_Ry + Prob * Ry
                Next n_index
            Next m_index
            Print Using "########"; x0; y0; E_xF; E_yF; E_KIAx; E_KIAy;
            Print Using "###.####"; E_Wx; E_Wy;
            Print Using "########"; E_tF; E_Rx; E_Ry
            If E_Rx > Opt_E_Rx Then Opt_x0 = x0
            If E_Rx > Opt_E_Rx Then Opt_E_Rx = E_Rx
        Next x0_index
        Print ""
        Print "              Optimal value of x0 = Opt_x0 = "; Opt_x0
        Print "          Optimal value of E_Rx = Opt_E_Rx = "; Opt_E_Rx
        Print ""
        3 Rem
        Rem Close #2
        End
Results in Case 1:
Results in Case 2:
Results in Case 3:
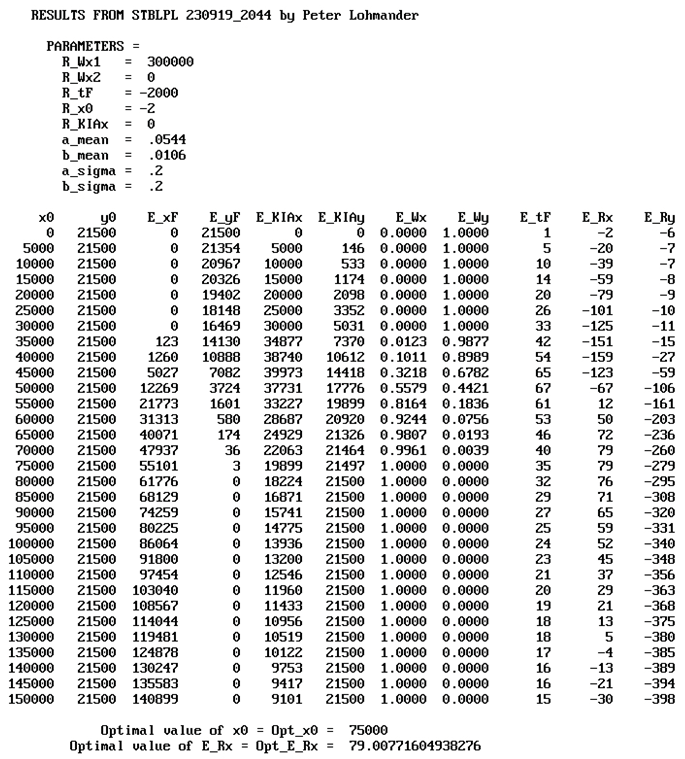
Results in Case 4:
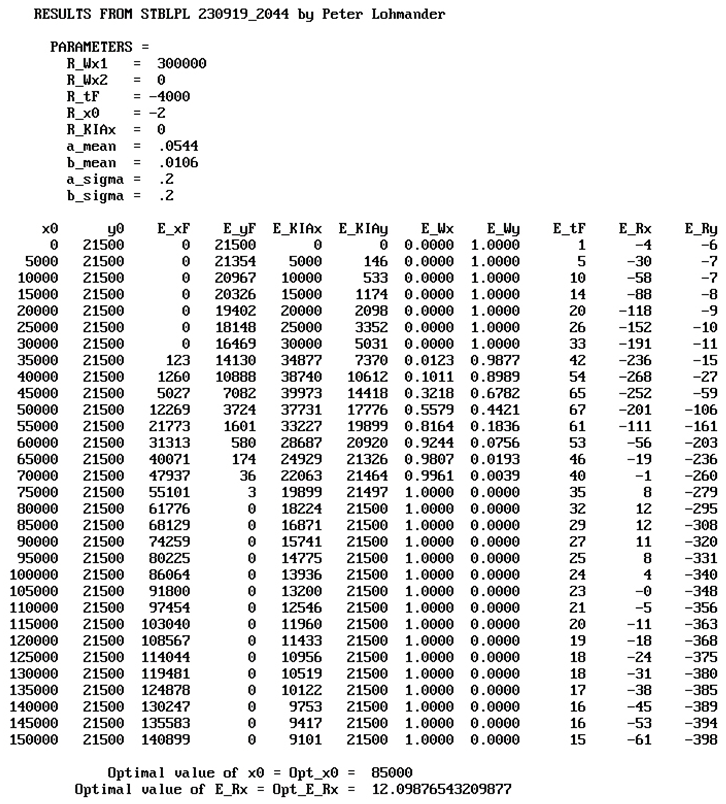
References
- Bracken J (1995). Lanchester models of Ardennes Campaign. Naval Research Logistics, 42: 559–577. https://onlinelibrary.wiley.com/doi/10.1002/1520-6750(199506)42:4%3C559::AID-NAV3220420405%3E3.0.CO;2-R.
- Braun, M. (1993). Differential Equations and Their Applications, Springer-Verlag, New York, 4 ed. https://link.springer.com/book/10.1007/978-1-4612-4360-1.
- Chan, P. (2016) The Lanchester Square Law: Its Implications for Force Structure and Force Preparation of Singapore’s Operationally-Ready Soldiers, POINTER, JOURNAL OF THE SINGAPORE ARMED FORCES VOL.42, NO.2. https://www.mindef.gov.sg/oms/safti/pointer/documents/pdf/Vol42No2_5%20Lanchester%20Square%20Law.pdf.
- Chen, X., and Qui, J. (2014), Differential Game for a Class of Warfare Dynamic Systems with Reinforcement Based on Lanchester Equation, Abstract and Applied Analysis Volume 2014, Article ID 837431, 8 pages. [CrossRef]
- Engel J.H. (1954). A Verification of Lanchester's Law, Journal of the Operations Research Society of America, 2(2):163-171. https://pubsonline.informs.org/doi/pdf/10.1287/opre.2.2.163.
- Hung, CY., Yang, G., Deng, P. et al. (2005). Fitting Lanchester's square law to the Ardennes Campaign. Journal of the Operations Research Society of America, 56, 942–946. [CrossRef]
- Hy, M.D., Vu, M.A., Nguyen, N.H., Ta, A N., Bui, D.V. (2020) Optimization in an asymmetric Lanchester (n, 1) model, Journal of Defense Modeling and Simulation: Applications, Methodology, Technology 2020, Vol. 17(1) 117–122. DOI: 10.1177/1548512919828553. https://www.google.com/url?sa=t&rct=j&q=&esrc=s&source=web&cd=&ved=2ahUKEwiT0eONqoKEAxV8LBAIHfyMAogQFnoECBoQAQ&url=https%3A%2F%2Fjournals.sagepub.com%2Fdoi%2Ffull%2F10.1177%2F1548512919828553&usg=AOvVaw1DULZfTqrVmHxgRhaxeFn4&opi=89978449.
- Iannelli, M., Pugliese, A. (2014). Competition among species. In: An Introduction to Mathematical Population Dynamics, vol 79. Springer, Cham. [CrossRef]
- Jensen, J. L. W. V. (1906). "Sur les fonctions convexes et les inégalités entre les valeurs moyennes." Acta Math. 30 175 - 193. [CrossRef]
- Kalloniatis, A.C., Hoek, K., Zuparic, M., Brede, M. (2020) Optimising structure in a networked Lanchester Model for Fires and Manoeuvre in Warfare, Journal of the Operational Research Society, 72:8, 1863-1878. https://eprints.soton.ac.uk/438471/1/Optimising_structure_in_a_networked_Lanchester_Model_for_Fires_and_Manoeuvre_in_Warfare_JORS_2020_.pdf. [CrossRef]
- Kostic M., Jovanovic, A. (2023) LANCHESTER’S DIFFERENTIAL EQUATIONS AS OPERATIONAL COMMAND DECISION MAKING TOOLS, Serbian Journal of Management 18 (1), 71 – 92. https://scindeks-clanci.ceon.rs/data/pdf/1452-4864/2023/1452-48642301071K.pdf.
- Kress, M., Caulkins, J.P., Feichtinger, R., Grass, D., Seidl, A. (2018) Lanchester model for three-way combat, European Journal of Operational Research, Vol 264, Issue 1, January 2018, 46-54. [CrossRef]
- Lanchester F.W. (1916). Aircraft in Warfare: The Dawn of the Fourth Arm. Constable: London. https://ia804709.us.archive.org/23/items/aircraftinwarfar00lancrich/aircraftinwarfar00lancrich.pdf.
- Lohmander, P. (1986). Continuous extraction under risk, IIASA, International Institute for Applied Systems Analysis, Systems and Decisions Sciences, WP-86-16, March 1986. https://core.ac.uk/download/pdf/33894314.pdf.
- Lohmander, P. (1988). Continuous extraction under risk, Systems Analysis – Modelling – Simulation, Vol. 5, No. 2, 131-151. http://www.Lohmander.com/PL_SAMS_5_2_1988.pdf.
- Lohmander, P. (2019a). Four central military decision problems, General methods and solutions. The Royal Swedish Academy of War Sciences Proceedings and Journal, 2, 119-134. http://www.lohmander.com/PLRSAWS_19.pdf.
- Lohmander, P. (2019b). Optimal decisions and expected values in two player zero sum games with diagonal game matrixes—Explicit functions, general proofs and effects of parameter estimation errors, International Robotics and Automation Journal, 5, 186–198. https://medcraveonline.com/IRATJ/IRATJ-05-00193.pdf.
- Lohmander, P. (2023). Optimal Dynamic Control of Proxy War Arms Support, Automation 4, No. 1: 31-56. [CrossRef]
- Lystopadova, V., Khalaim, D. (2023) Application of Lanchester's mathematical laws in military strategy. Osvita. Innovatyka. Praktyka – Education. Innovation. Practice, Vol. 11, No 8. S. 44-50. https://www.researchgate.net/publication/375152016_APPLICATION_OF_LANCHESTER'S_MATHEMATICAL_LAWS_IN_MILITARY_STRATEGY/link/654252b63cc79d48c5c6801a/download?_tp=eyJjb250ZXh0Ijp7ImZpcnN0UGFnZSI6InB1YmxpY2F0aW9uIiwicGFnZSI6InB1YmxpY2F0aW9uIn19. [CrossRef]
- McCartney, M. (2022) The solution of Lanchester’s equations with inter-battle reinforcement strategies, Physica A: Statistical Mechanics and its Applications, Vol. 586, 15 January 2022, 126477. [CrossRef]
- Minguela-Castro, Gerardo, Ruben Heradio, and Carlos Cerrada. 2021. "Automated Support for Battle Operational–Strategic Decision-Making" Mathematics 9, no. 13: 1534. [CrossRef]
- Rothschild, M., Stiglitz, J.E. (1970). Increasing risk: I. A definition, Journal of Economic Theory, Volume 2, Issue 3, 225-243, ISSN 0022-0531. https://www.sciencedirect.com/science/article/pii/0022053170900384. [CrossRef]
- Rothschild, M., Stiglitz, J.E. (1971). Increasing risk II: Its economic consequences, Journal of Economic Theory, Volume 3, Issue 1, 66-84, ISSN 0022-0531. https://www.sciencedirect.com/science/article/pii/0022053171900342. [CrossRef]
- Shatz, H.J. (2020). Economic Competition in the 21st Century. Santa Monica, CA: RAND Corporation. https://www.rand.org/pubs/research_reports/RR4188.html.
- Sheeba, P.S., Ghose, D. (2008) Optimal resource allocation in conflicts with the Lanchester linear law (2,1) model, 2008 American Control Conference, Seattle, WA, USA, 2008, pp. 1806-1811. https://ieeexplore.ieee.org/document/4586754. [CrossRef]
- Spradlin, C., Spradlin, G. (2007) Lanchester’s equations in three dimensions, Computers and Mathematics with Applications 53, 999–1011. https://www.sciencedirect.com/science/article/pii/S0898122107000557.
- Stymfal, M.G. (2022). Revisiting Engel’s verification of Lanchester’s square law using battle of Iwo Jima data, Thesis, Naval Postgraduate School, NPS, Monterey, California, USA. https://apps.dtic.mil/sti/trecms/pdf/AD1201776.pdf.
- Tam, J.H. (1998), Application of Lanchester combat model in the Ardennes campaign, Natural Resource Modeling, 11: 95-116. [CrossRef]
- Taylor, J.G. (1979), Optimal Commitment of Forces in Some Lanchester-Type Combat Models, Operations Research Vol. 27, No. 1 (Jan. - Feb.), pp. 96-114. https://www.jstor.org/stable/170246.
- Washburn, A., Kress, M. (2009). Combat Modeling, Springer Science, New York. https://archive.org/details/springer_10.1007-978-1-4419-0790-5.
Figure 1.
The time path of (x, y) in the special case, when bx2=ay2.
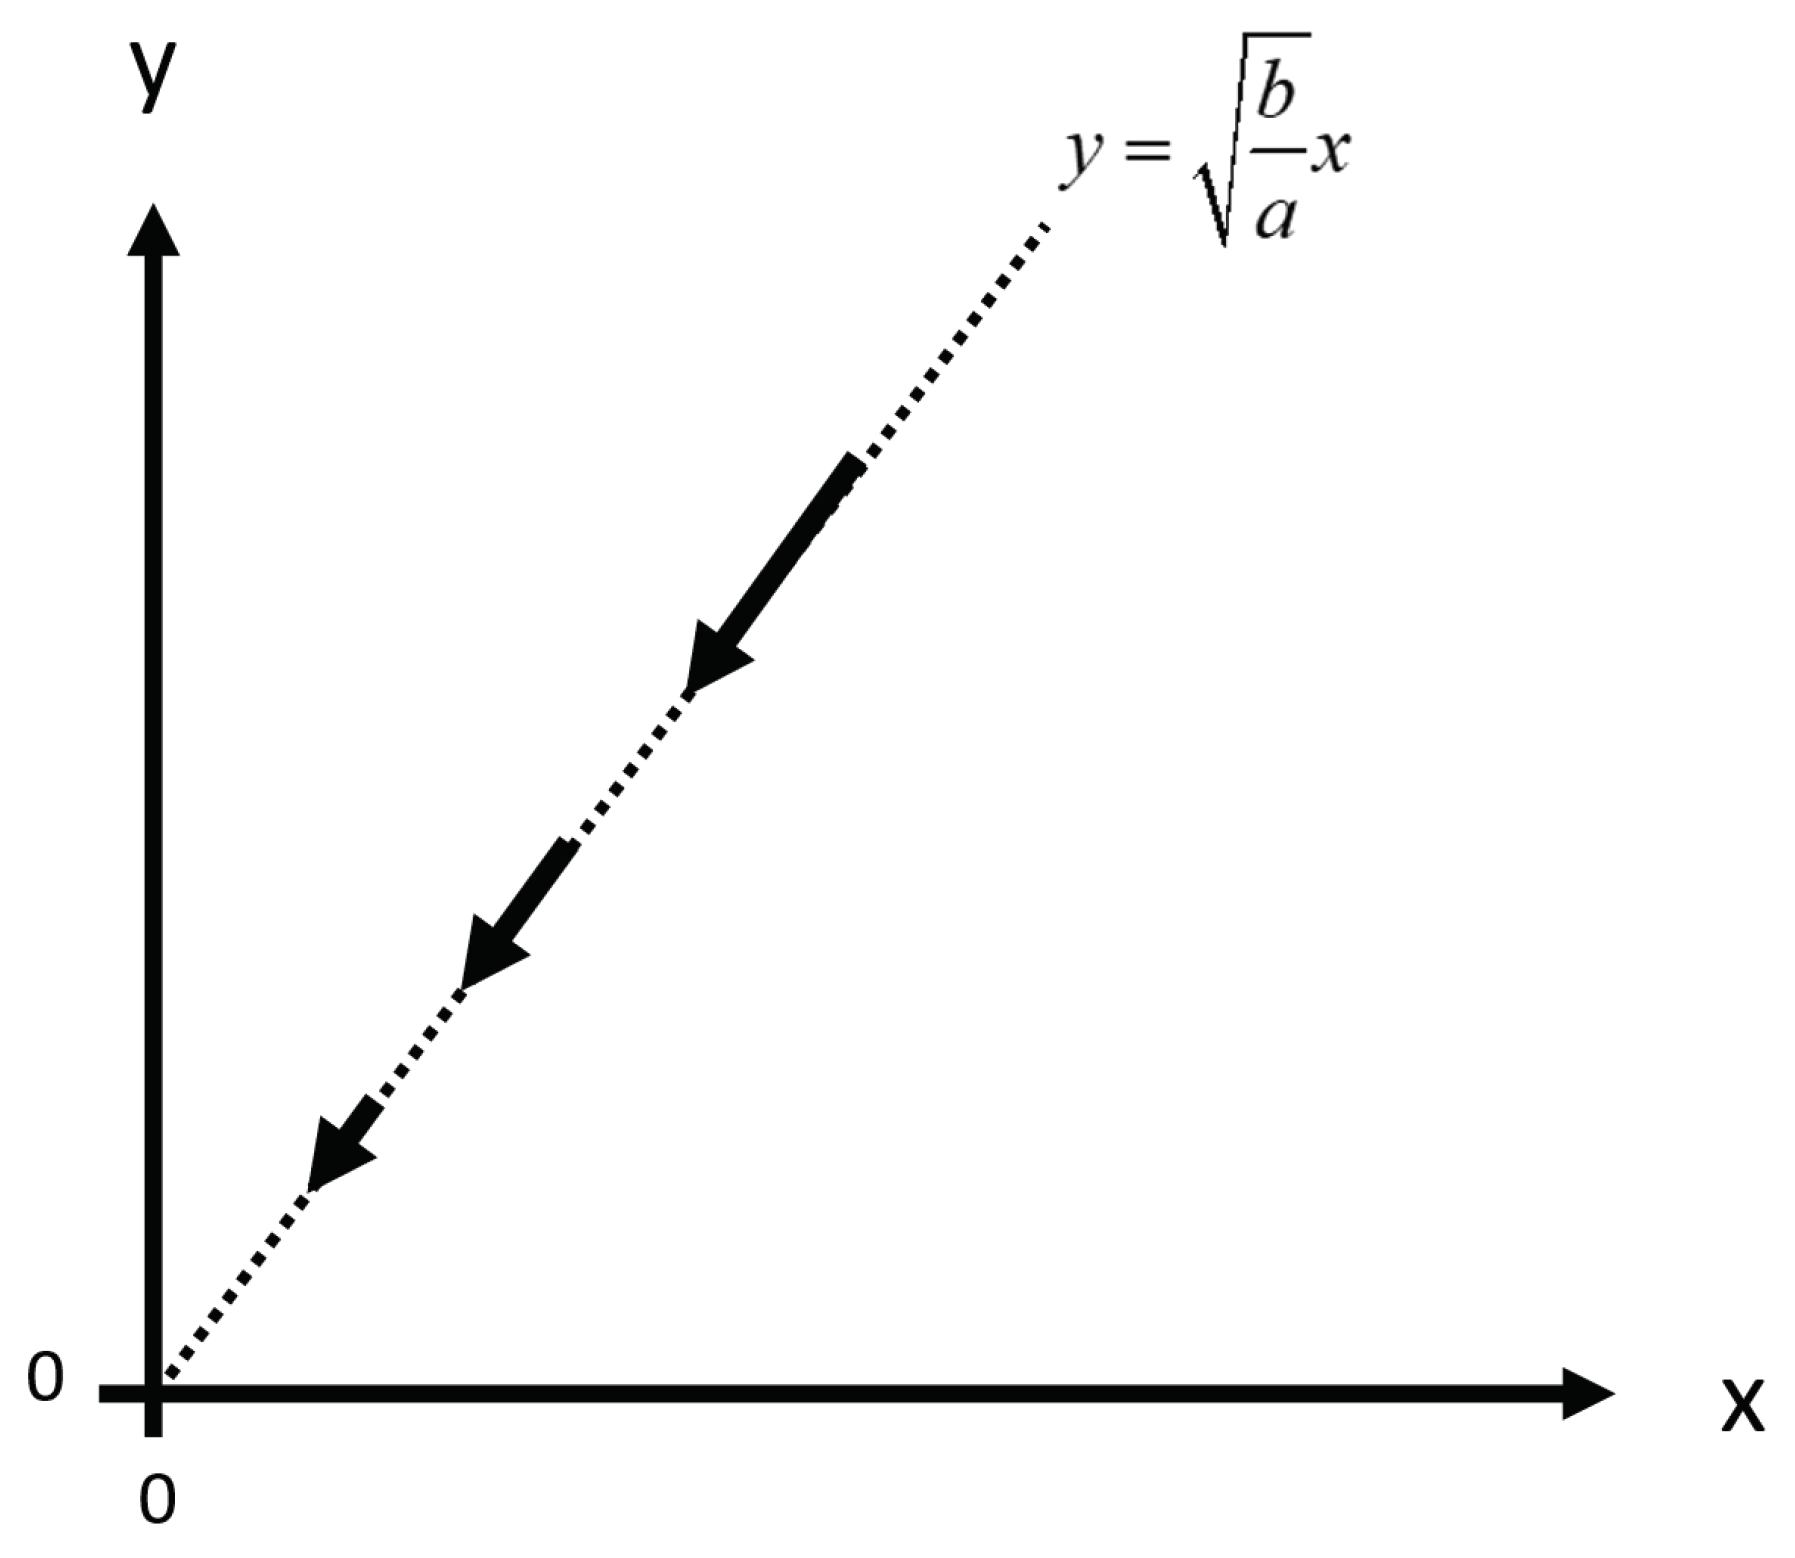
Figure 2.
The time path of (x,y) in the special case, when bx2=ay2, is a function of the ratio b/a. The graph shows how the time path changes if the ratio b/a increases or decreases.
Figure 2.
The time path of (x,y) in the special case, when bx2=ay2, is a function of the ratio b/a. The graph shows how the time path changes if the ratio b/a increases or decreases.
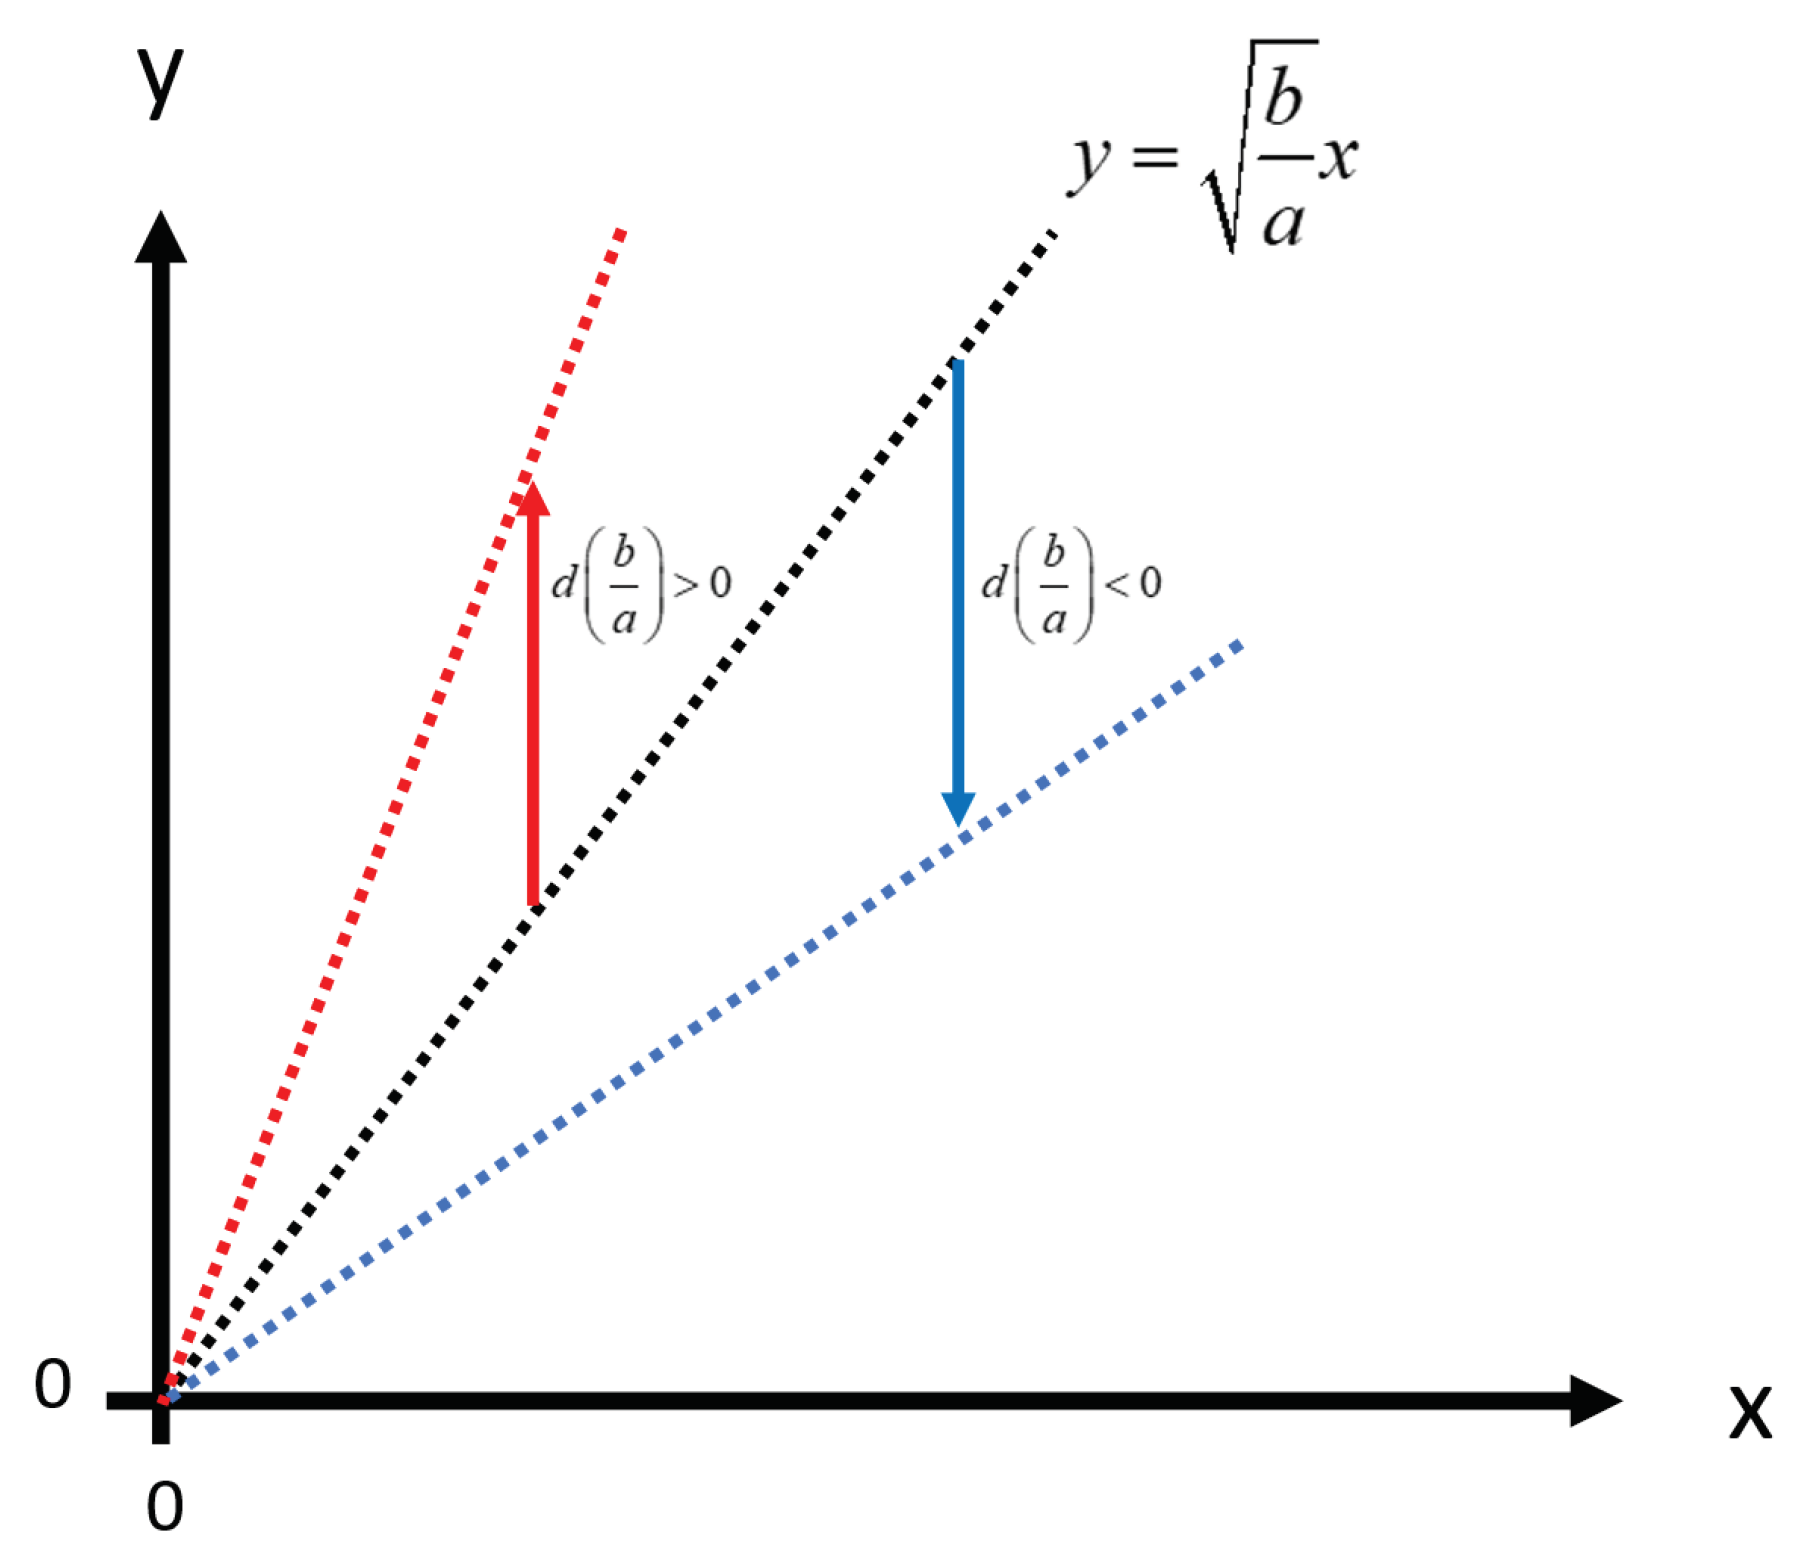
Figure 3.
Deviations from the line , imply that (x, y) will not converge to origo.
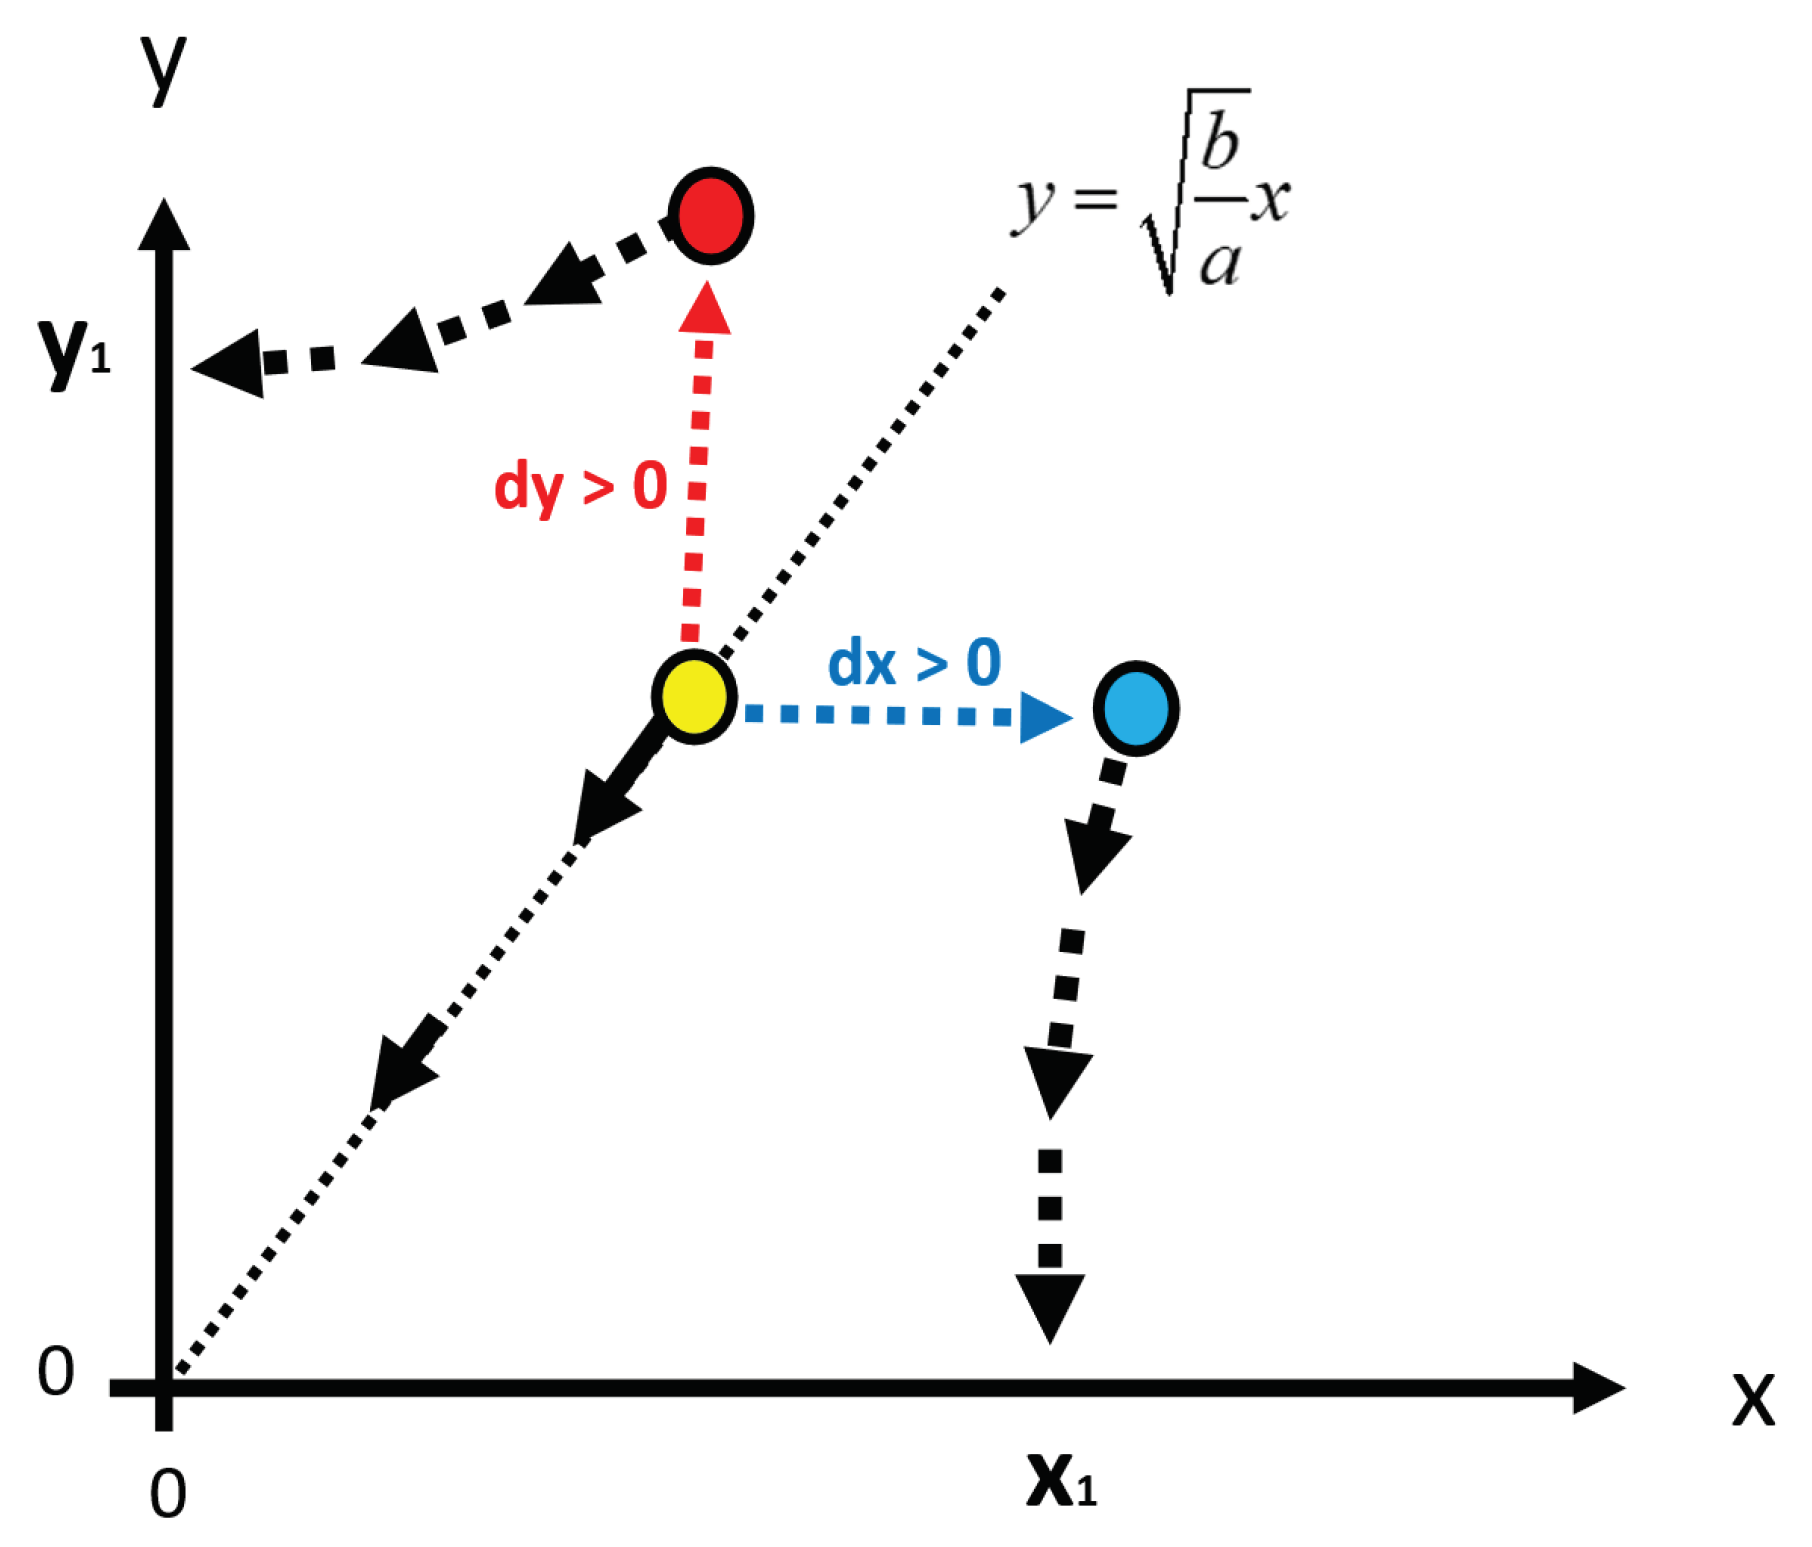
Figure 4.
Deviations from the line , imply that (x, y) will not converge to origo. T is the point in time when x or y equals zero. If (x, y) at some point in time, t, such that t<T, is found in the blue sector, then x(T)>0 and y(T)=0. If (x, y) at some point in time, t, such that t<T, is found in the red sector, then x(T)=0 and y(T)>0.
Figure 4.
Deviations from the line , imply that (x, y) will not converge to origo. T is the point in time when x or y equals zero. If (x, y) at some point in time, t, such that t<T, is found in the blue sector, then x(T)>0 and y(T)=0. If (x, y) at some point in time, t, such that t<T, is found in the red sector, then x(T)=0 and y(T)>0.
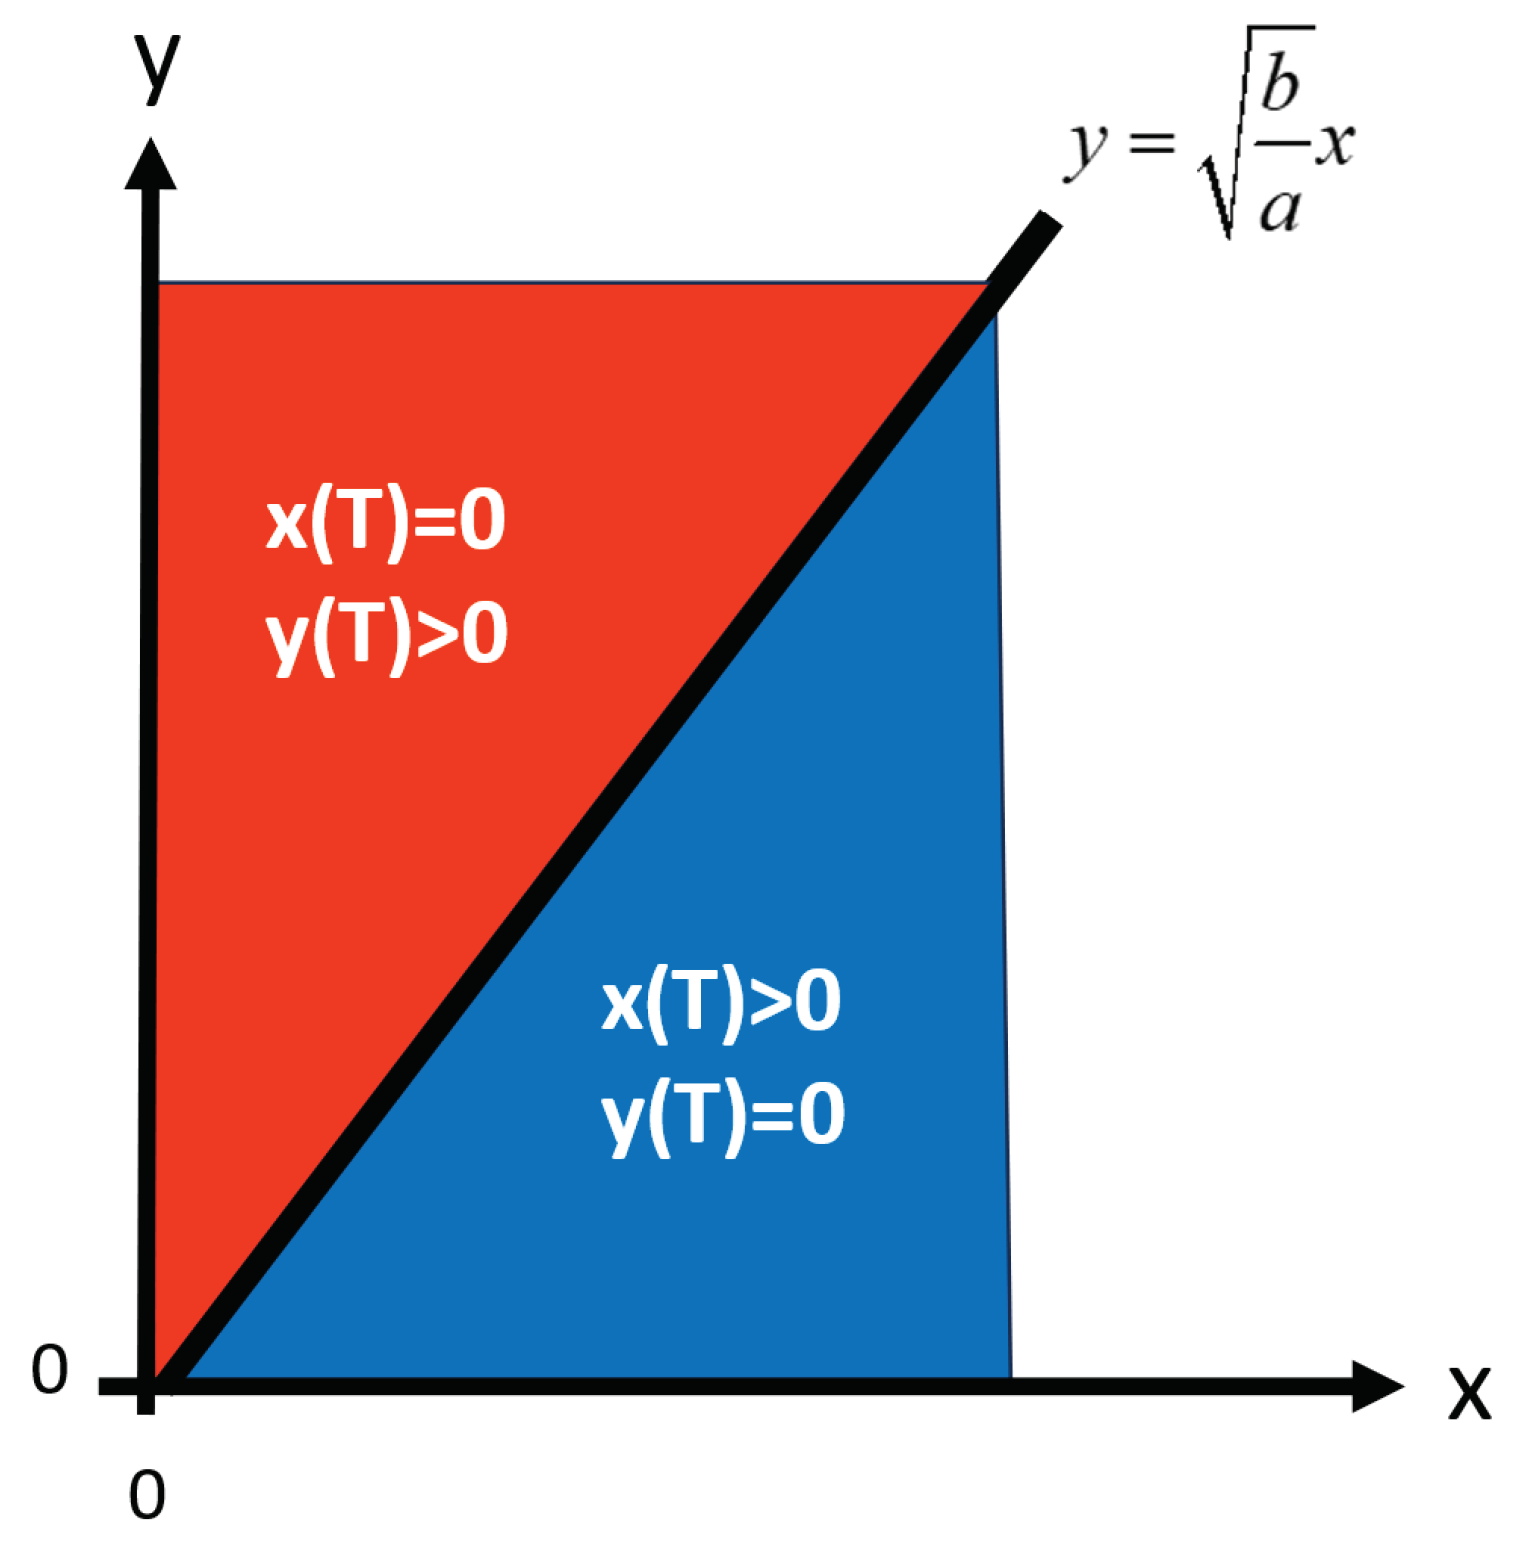
Figure 5.
x(t) and y(t), for t = 0, 1, …, 31. t = time (days), (x0, y0) = (65000, 18000). a = 0.05347 and b = 0.01045. The graph is constructed via a discrete time approximation of the differential equation system (1). Each time step represents one day (24 hours). Time t = 0 corresponds to time D+6, when all US troops had landed on Iwo Jima, in Stymfal (2022).
Figure 5.
x(t) and y(t), for t = 0, 1, …, 31. t = time (days), (x0, y0) = (65000, 18000). a = 0.05347 and b = 0.01045. The graph is constructed via a discrete time approximation of the differential equation system (1). Each time step represents one day (24 hours). Time t = 0 corresponds to time D+6, when all US troops had landed on Iwo Jima, in Stymfal (2022).
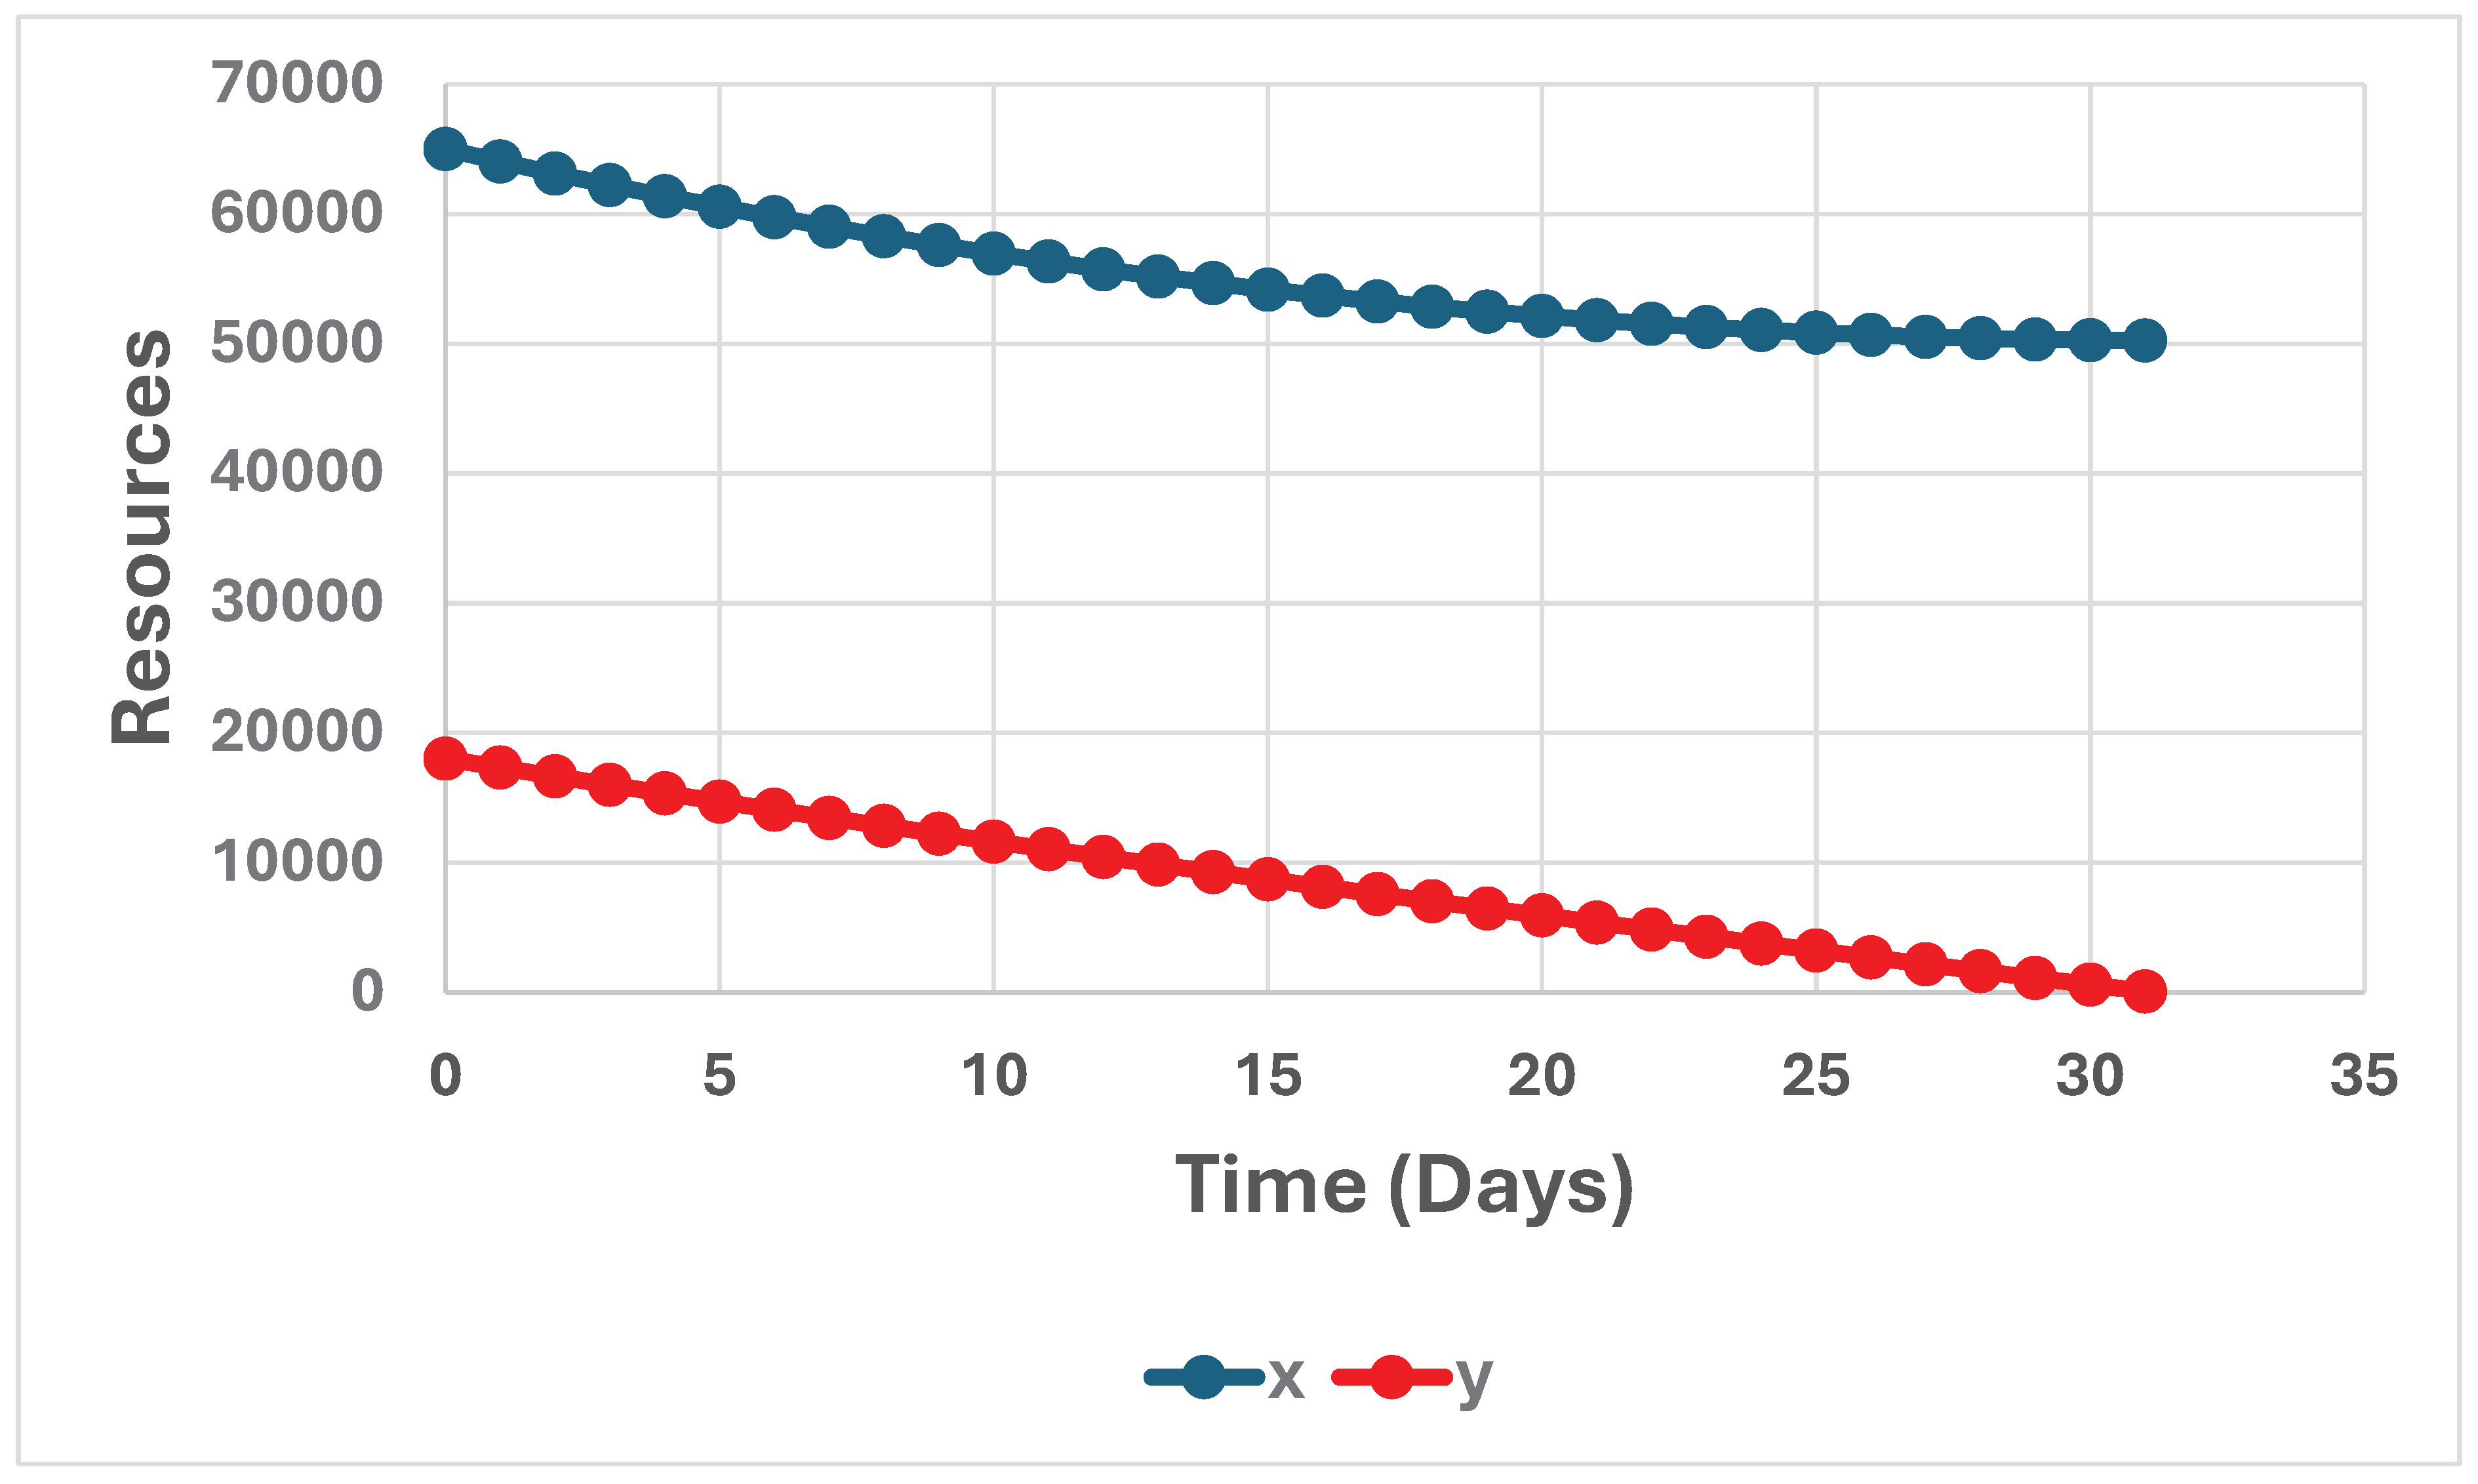
Figure 6.
(x(t), y(t)), for t = 0, 1, …, 31, in case (x0, y0) = (65000, 18000), a = 0.05347 and b = 0.01045. The graph is constructed via a discrete time approximation of the differential equation system (1). Each time step represents one day (24 hours). Note that the distances between the neighbor points decreases as T increases.
Figure 6.
(x(t), y(t)), for t = 0, 1, …, 31, in case (x0, y0) = (65000, 18000), a = 0.05347 and b = 0.01045. The graph is constructed via a discrete time approximation of the differential equation system (1). Each time step represents one day (24 hours). Note that the distances between the neighbor points decreases as T increases.
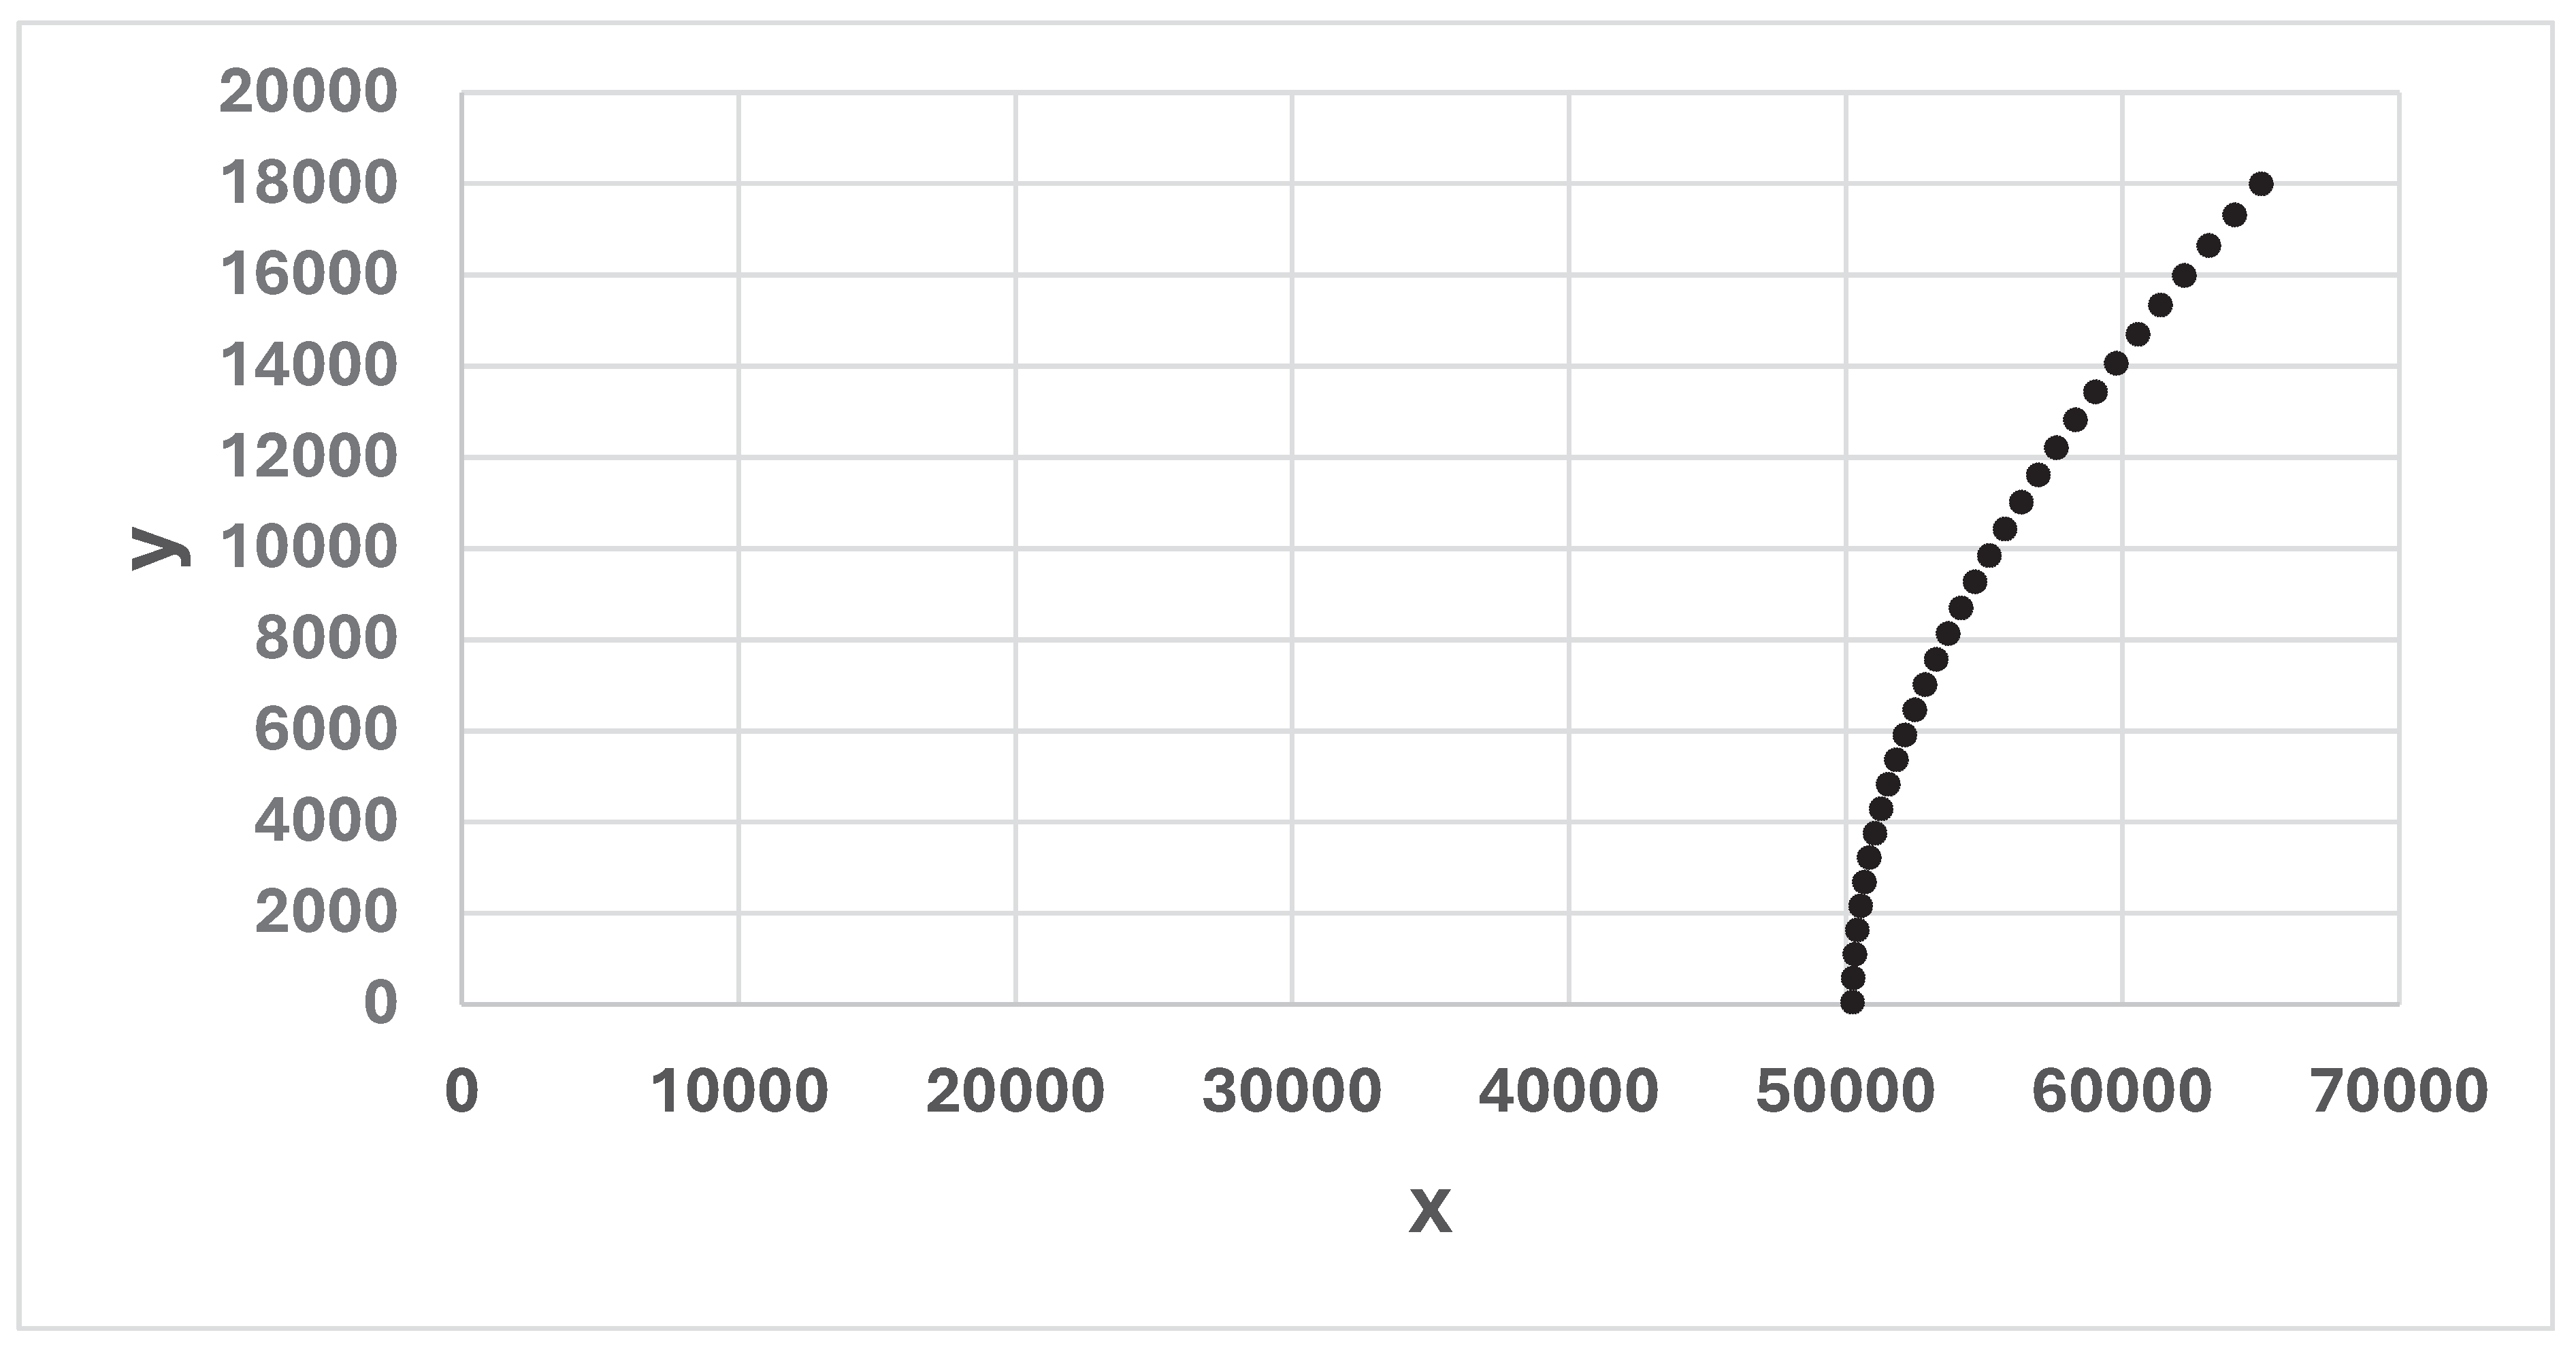
Figure 7.
Continuous time path of (x(t), y(t)). (x0, y0) = (65000, 18000), a = 0.05347 and b = 0.01045. The graph is constructed via a discrete time approximation of the differential equation system (1).
Figure 7.
Continuous time path of (x(t), y(t)). (x0, y0) = (65000, 18000), a = 0.05347 and b = 0.01045. The graph is constructed via a discrete time approximation of the differential equation system (1).
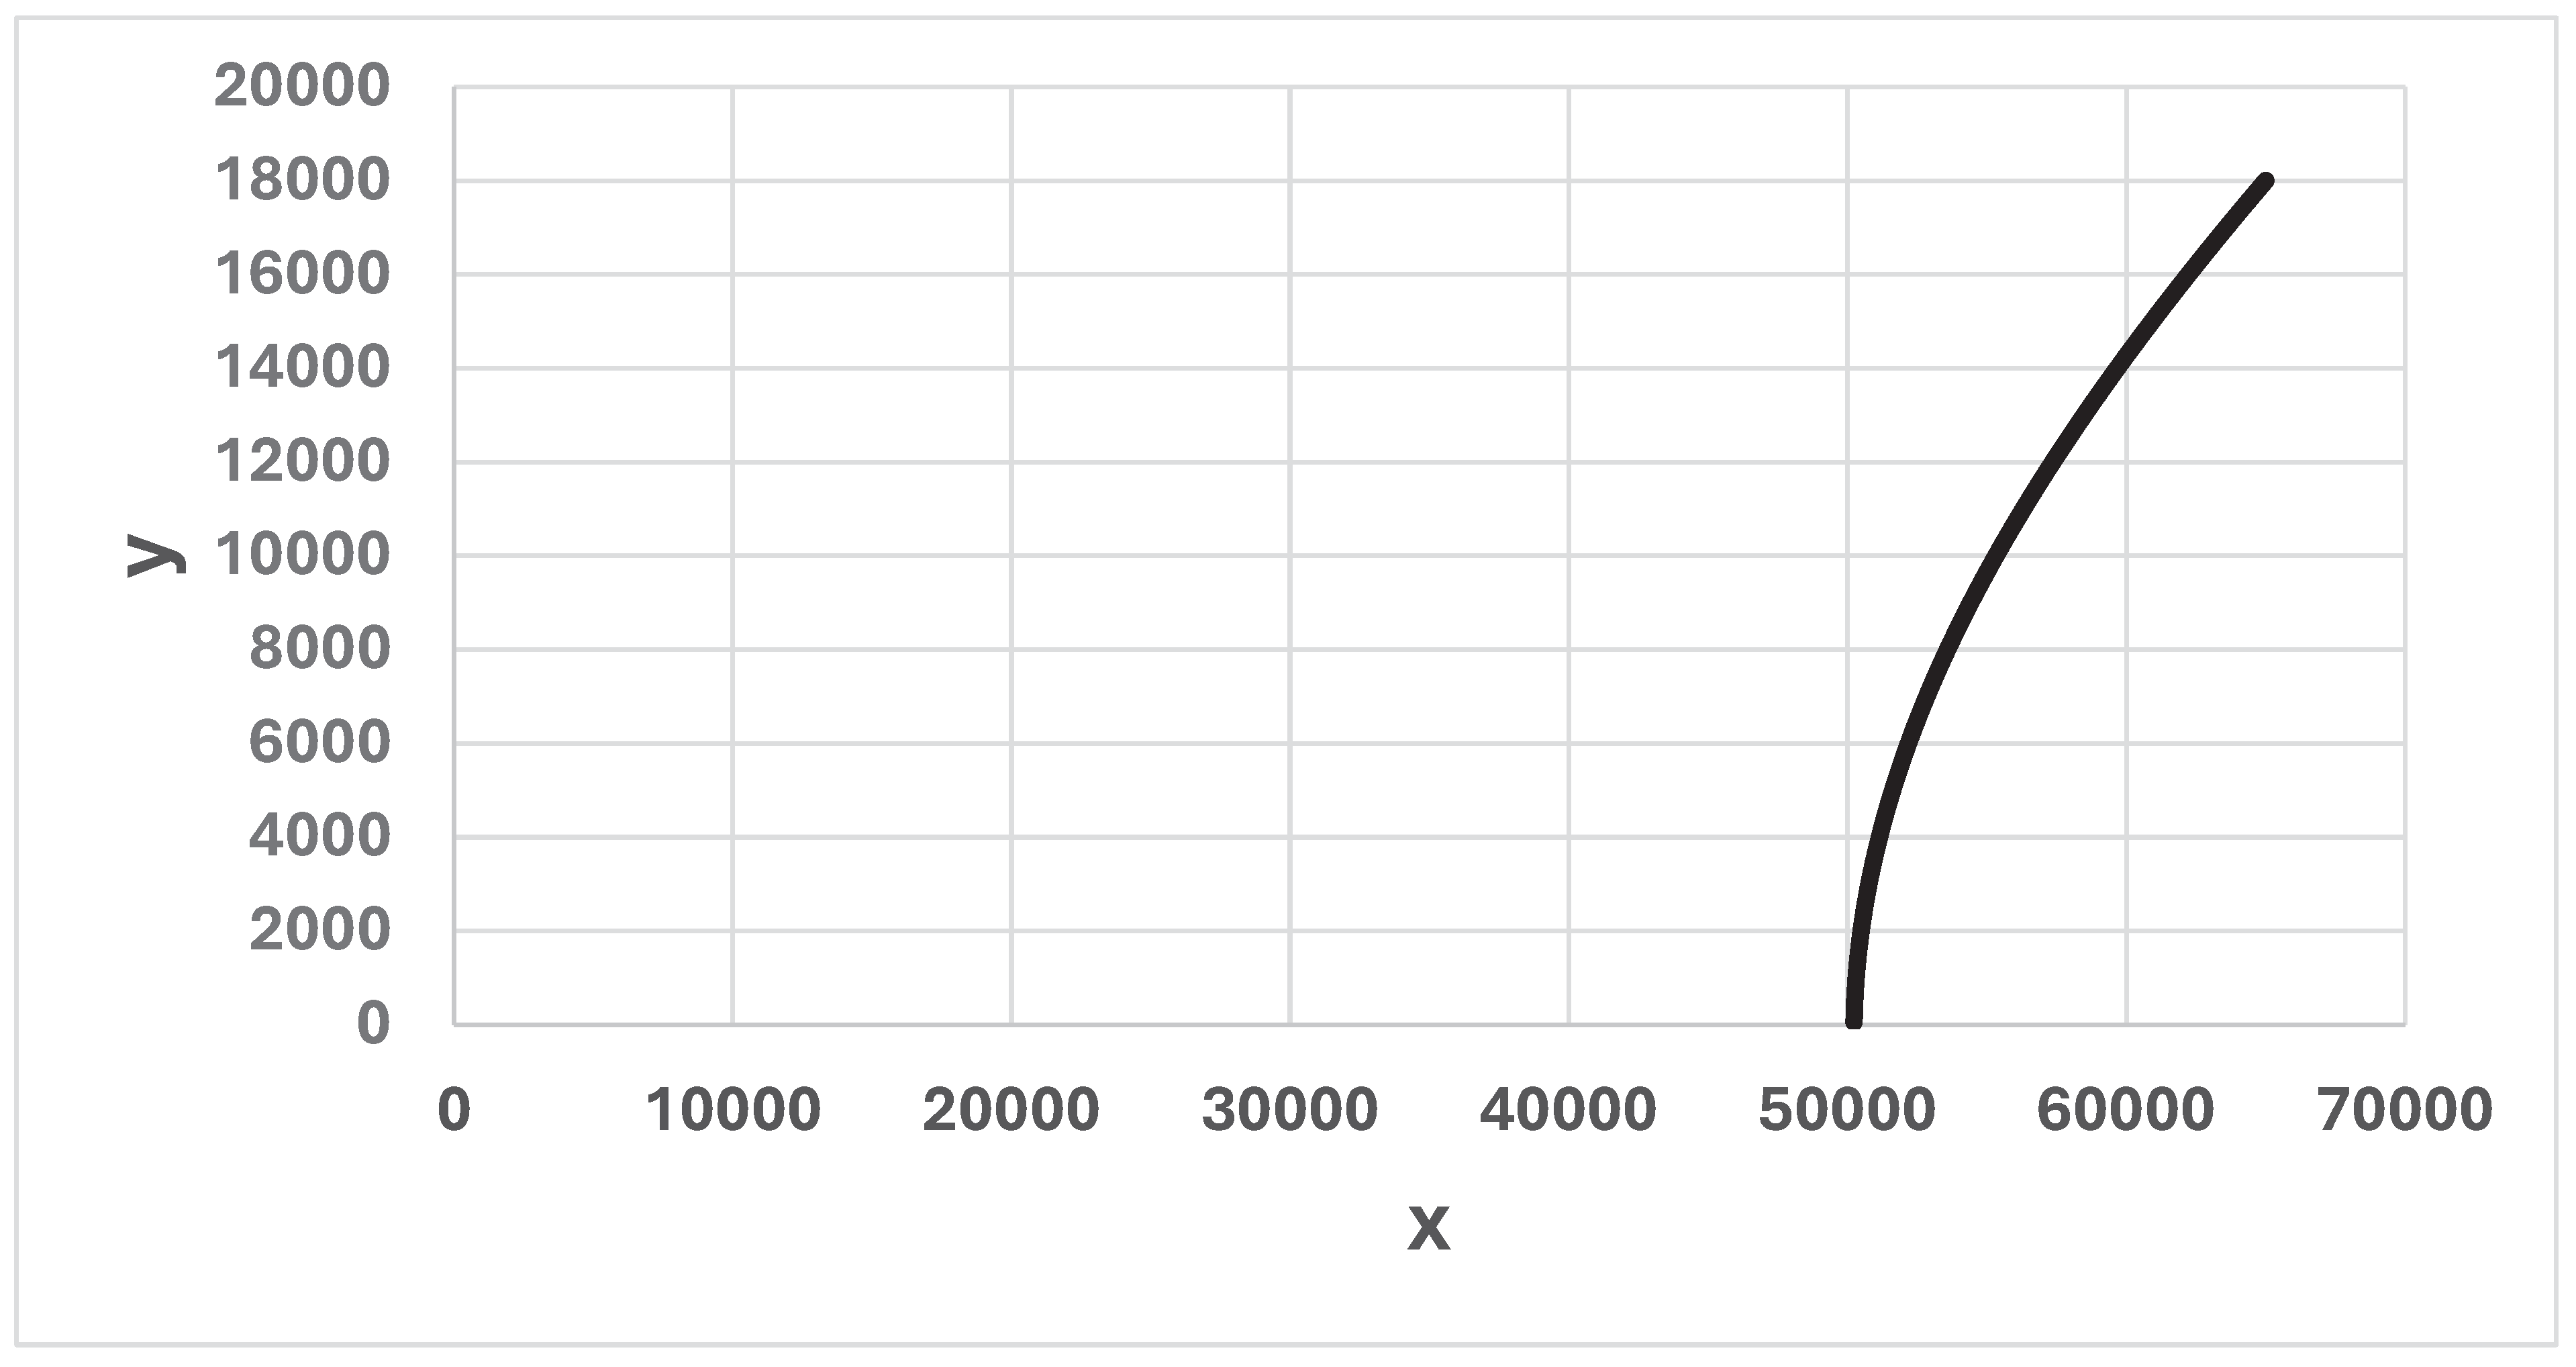
Figure 8.
x(t) and y(t), for t = 0, 1, …, 100. t = time (days), (x0, y0) = (40716, 18000). a = 0.05347 and b = 0.01045. The graph is constructed via a discrete time approximation of the differential equation system (1). Each time step represents one day (24 hours). .
Figure 8.
x(t) and y(t), for t = 0, 1, …, 100. t = time (days), (x0, y0) = (40716, 18000). a = 0.05347 and b = 0.01045. The graph is constructed via a discrete time approximation of the differential equation system (1). Each time step represents one day (24 hours). .
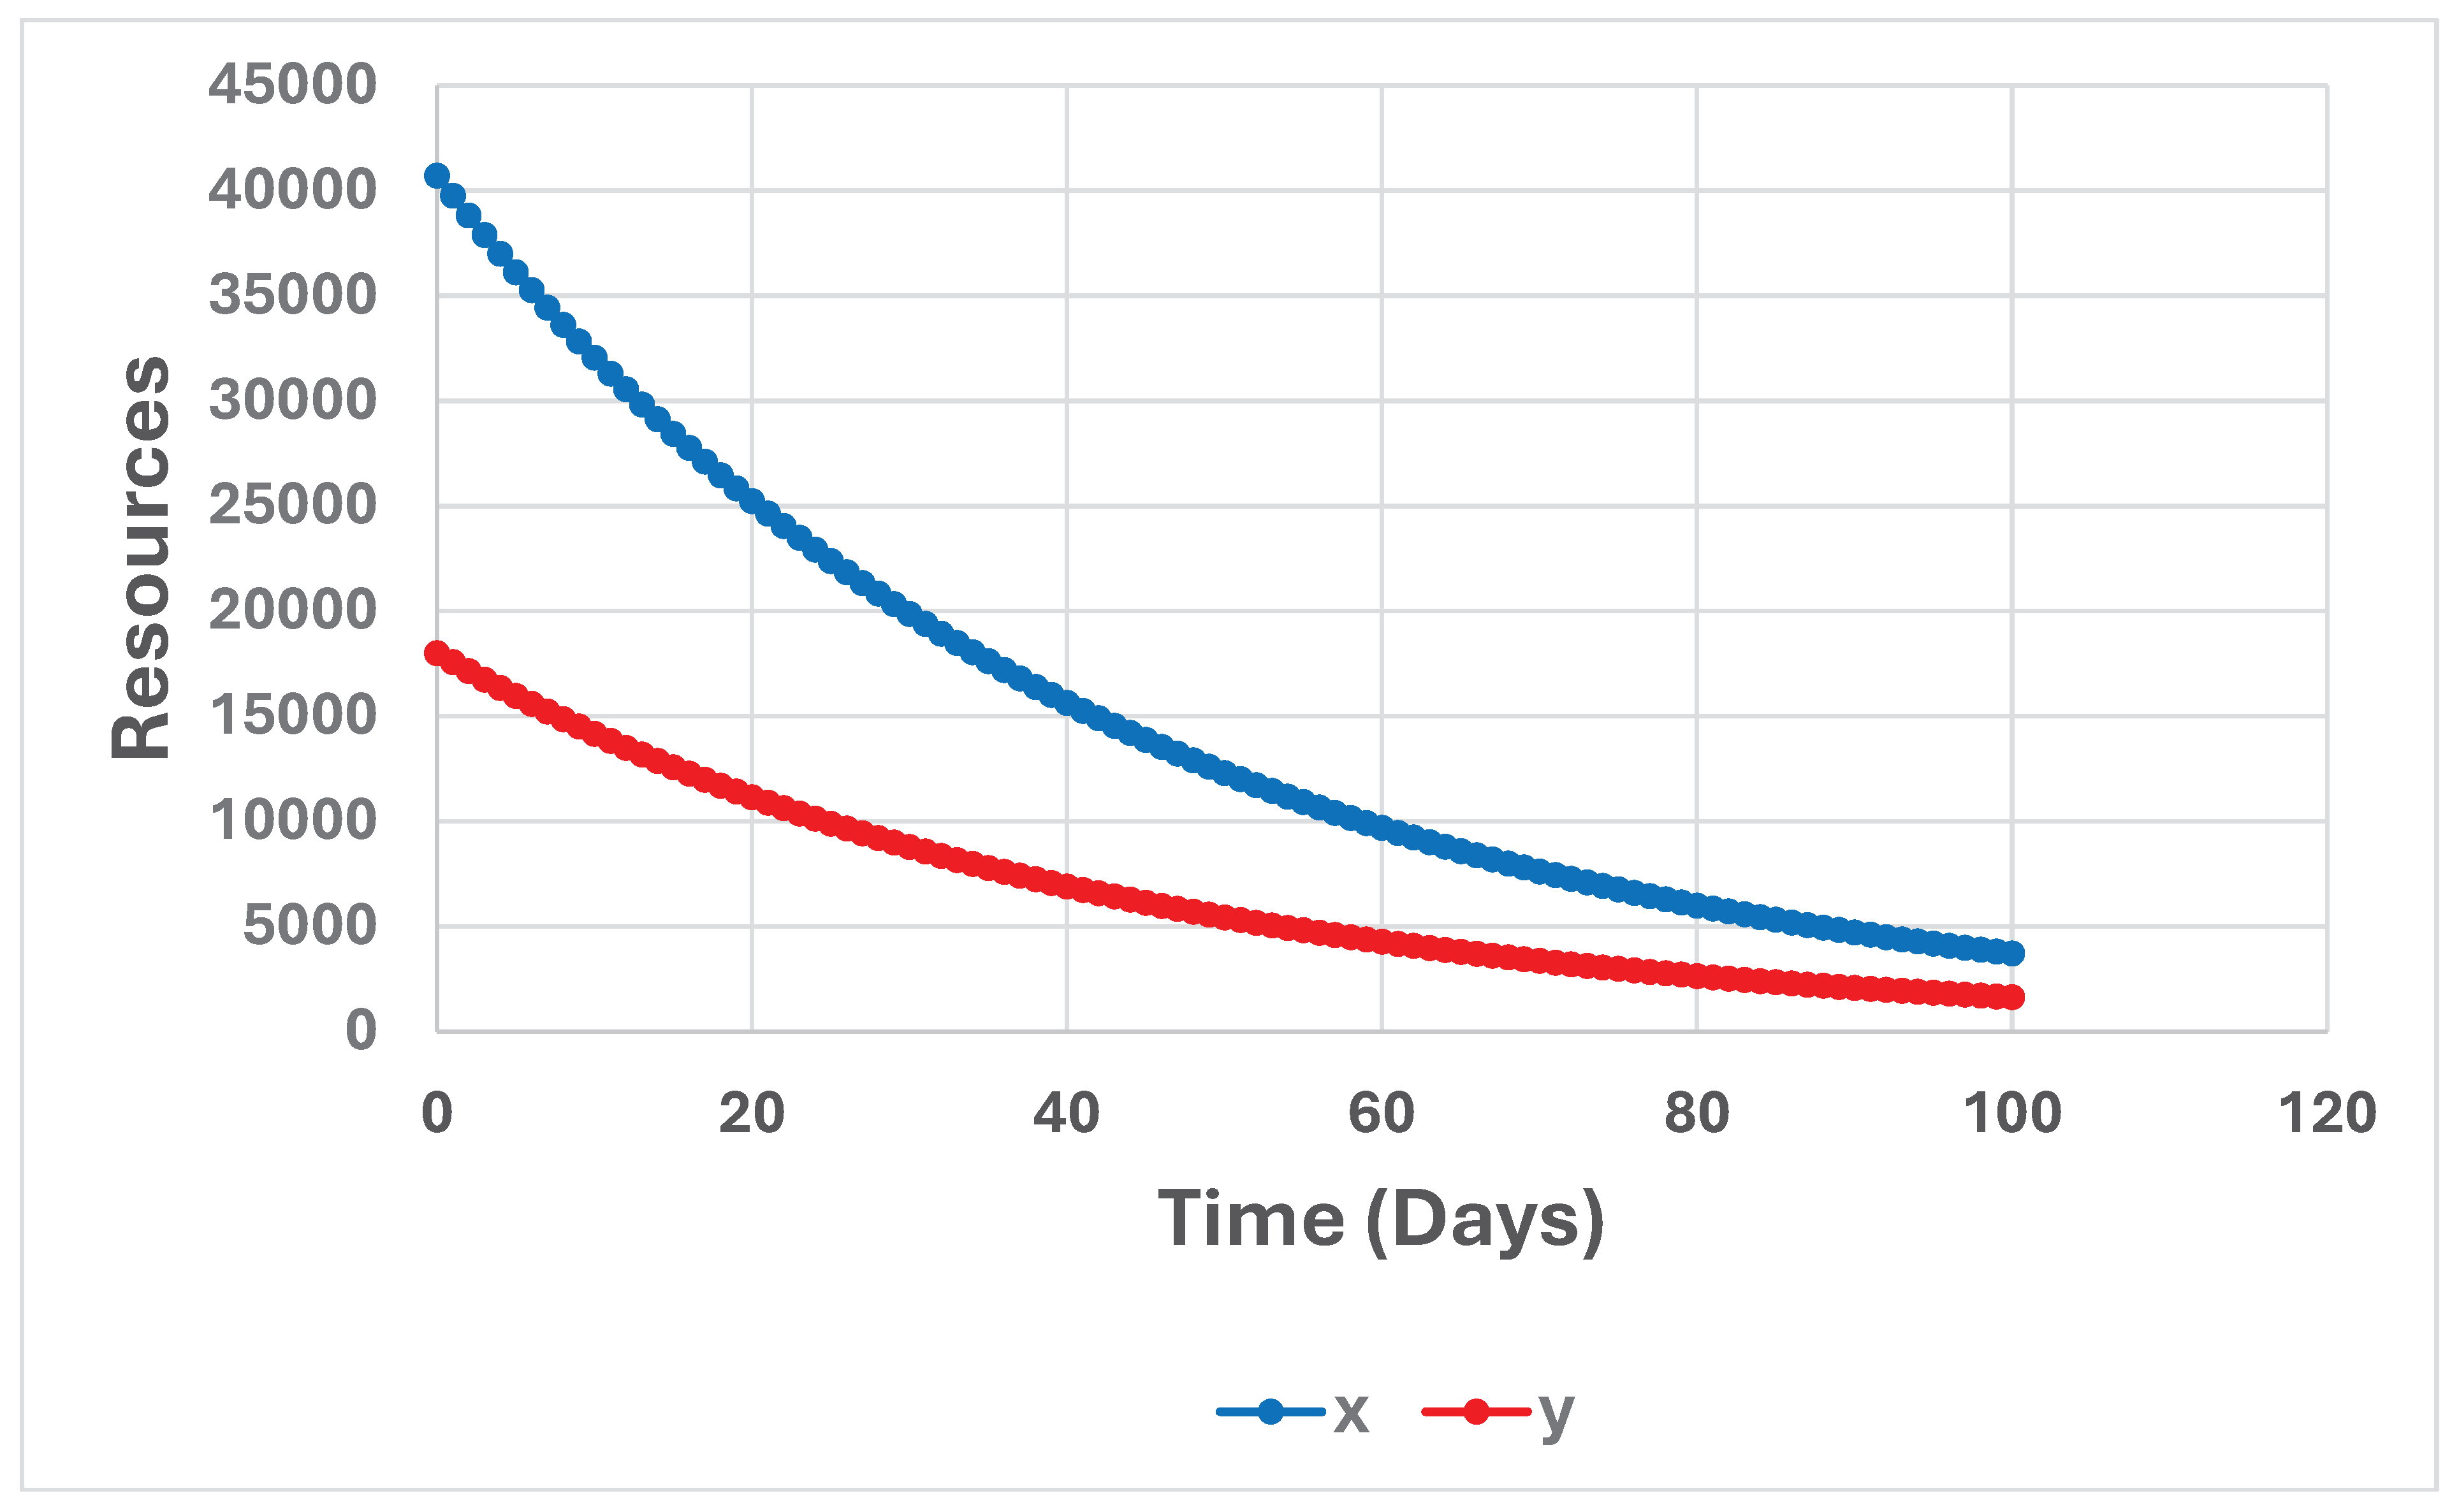
Figure 9.
(x(t), y(t)), for t = 0, 1, …, 100. t = time (days), (x0, y0) = (40716, 18000). a = 0.05347 and b = 0.01045. The graph is constructed via a discrete time approximation of the differential equation system (1). Each time step represents one day (24 hours). .
Figure 9.
(x(t), y(t)), for t = 0, 1, …, 100. t = time (days), (x0, y0) = (40716, 18000). a = 0.05347 and b = 0.01045. The graph is constructed via a discrete time approximation of the differential equation system (1). Each time step represents one day (24 hours). .
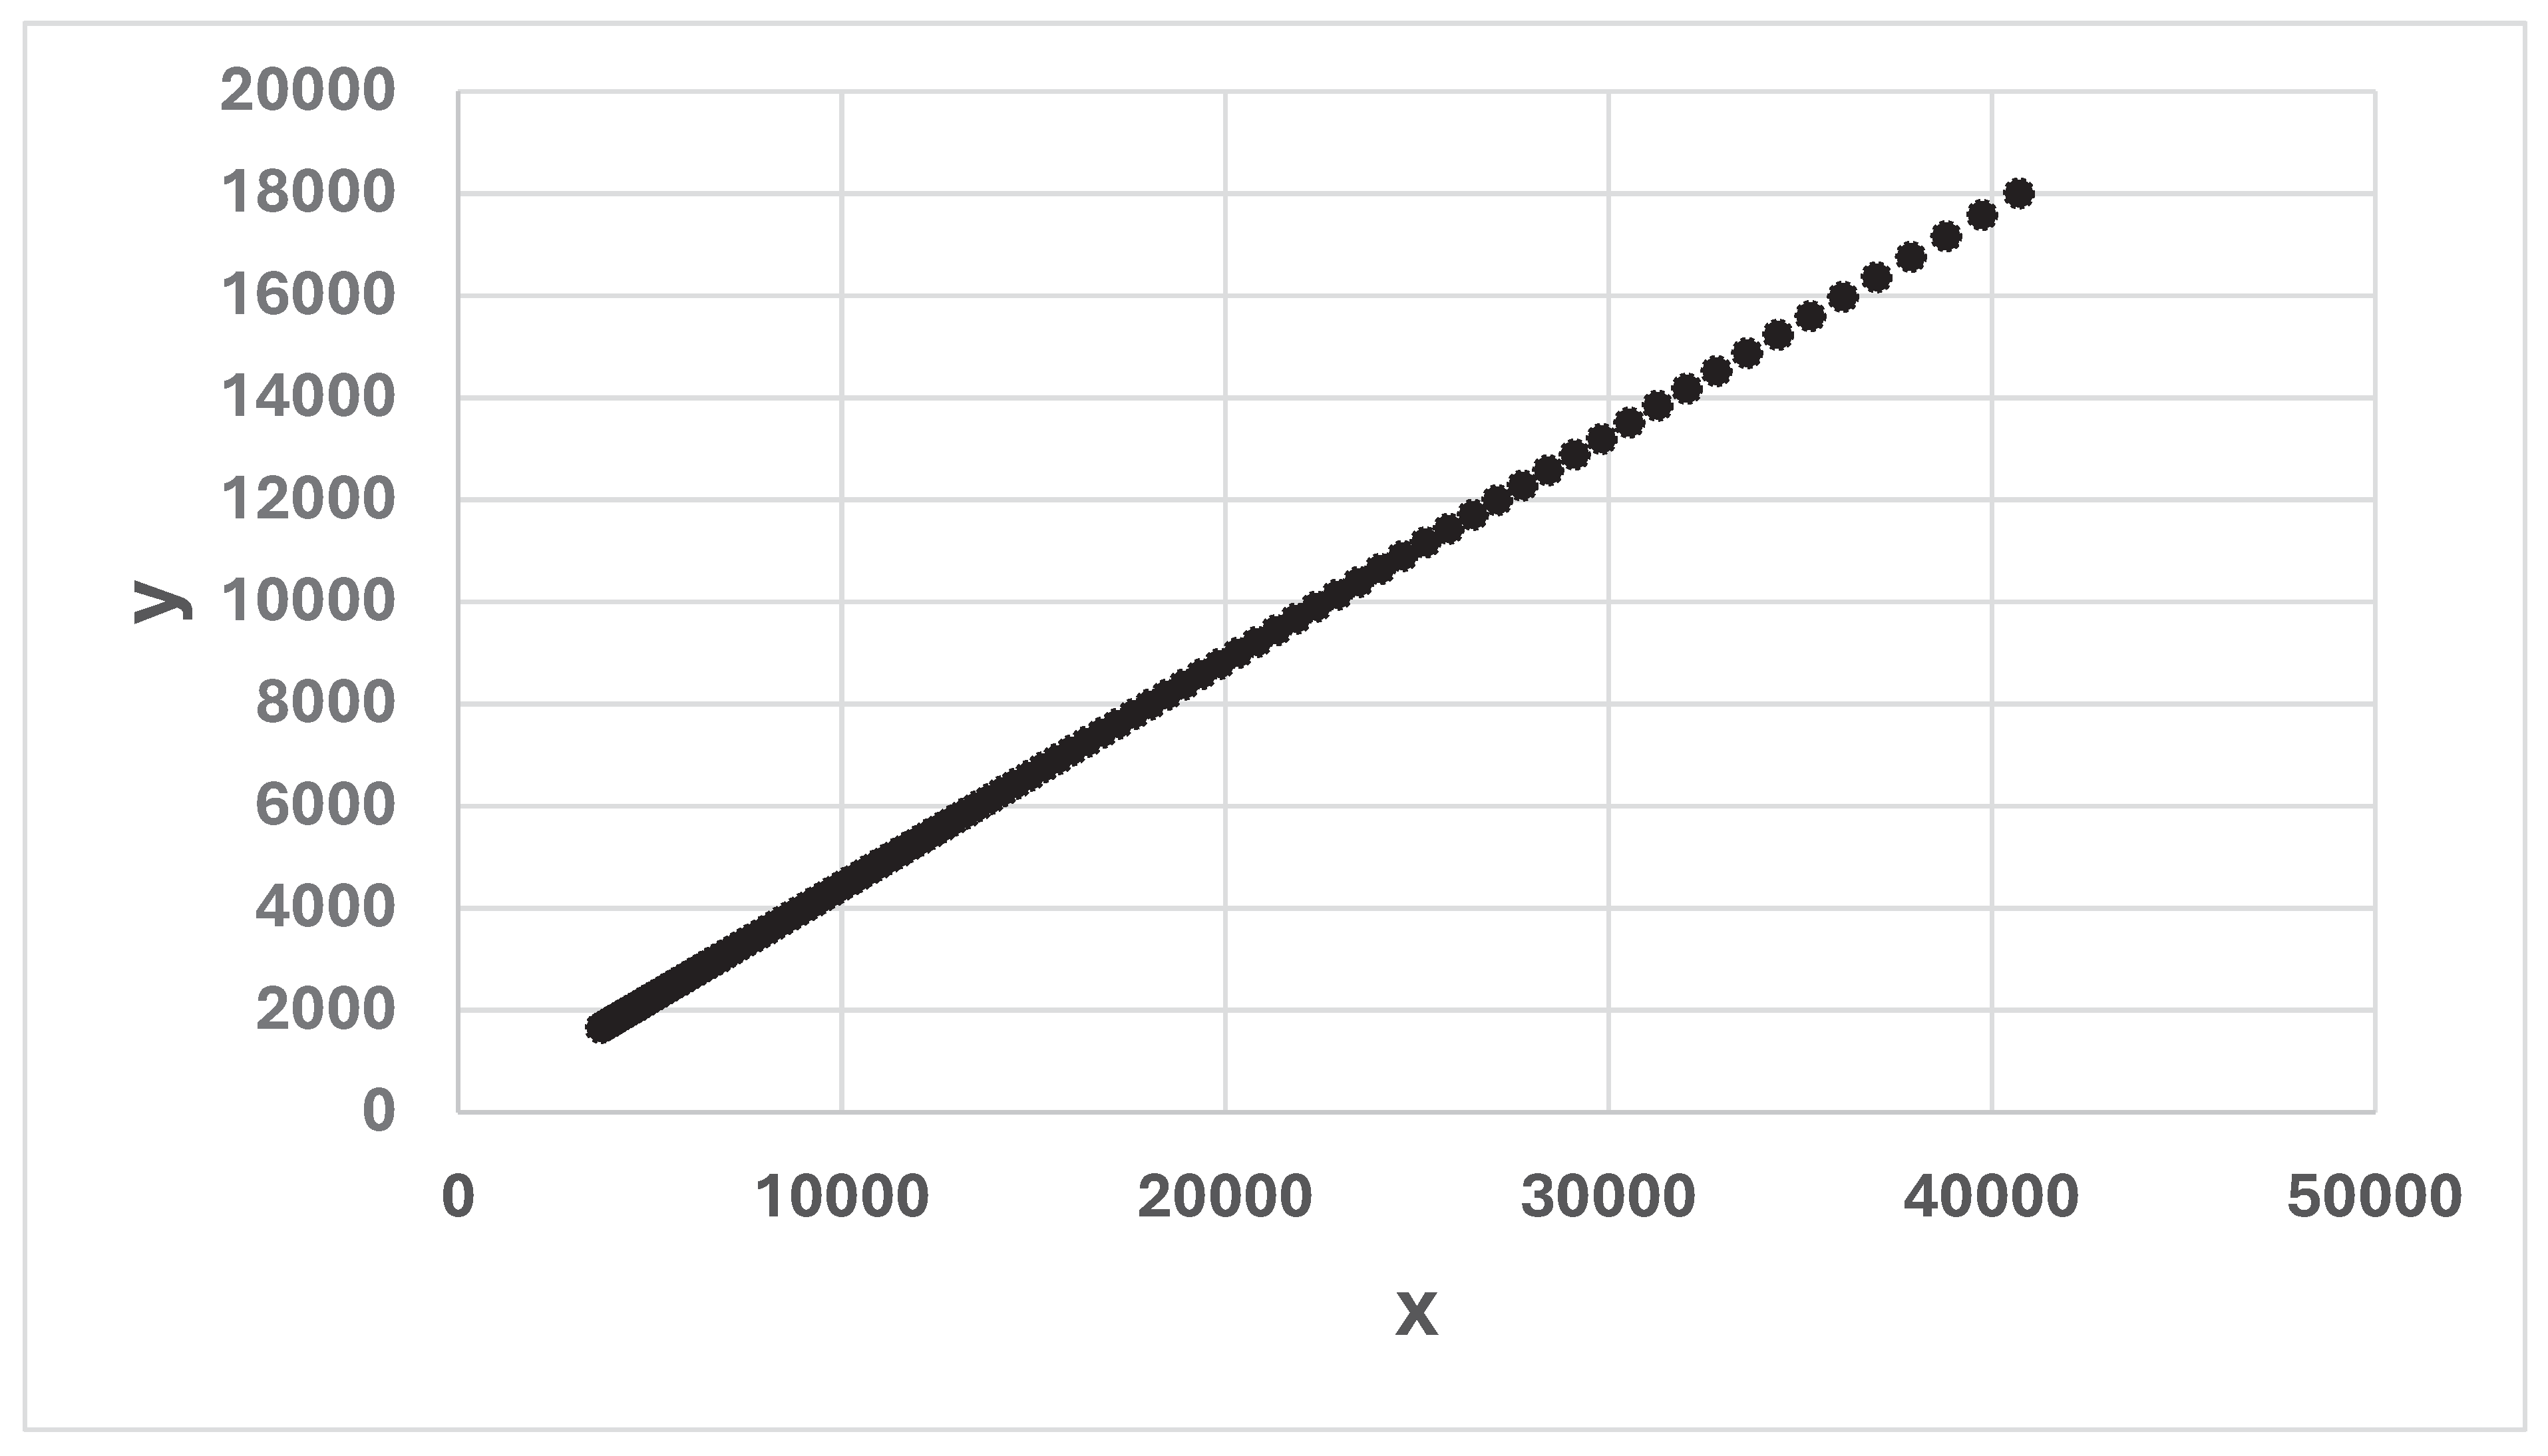
Figure 10.
A continuous time approximation of (x(t), y(t)), for 0 < t < 100. t = time (days), (x0, y0) = (40716, 18000). a = 0.05347 and b = 0.01045.
Figure 10.
A continuous time approximation of (x(t), y(t)), for 0 < t < 100. t = time (days), (x0, y0) = (40716, 18000). a = 0.05347 and b = 0.01045.
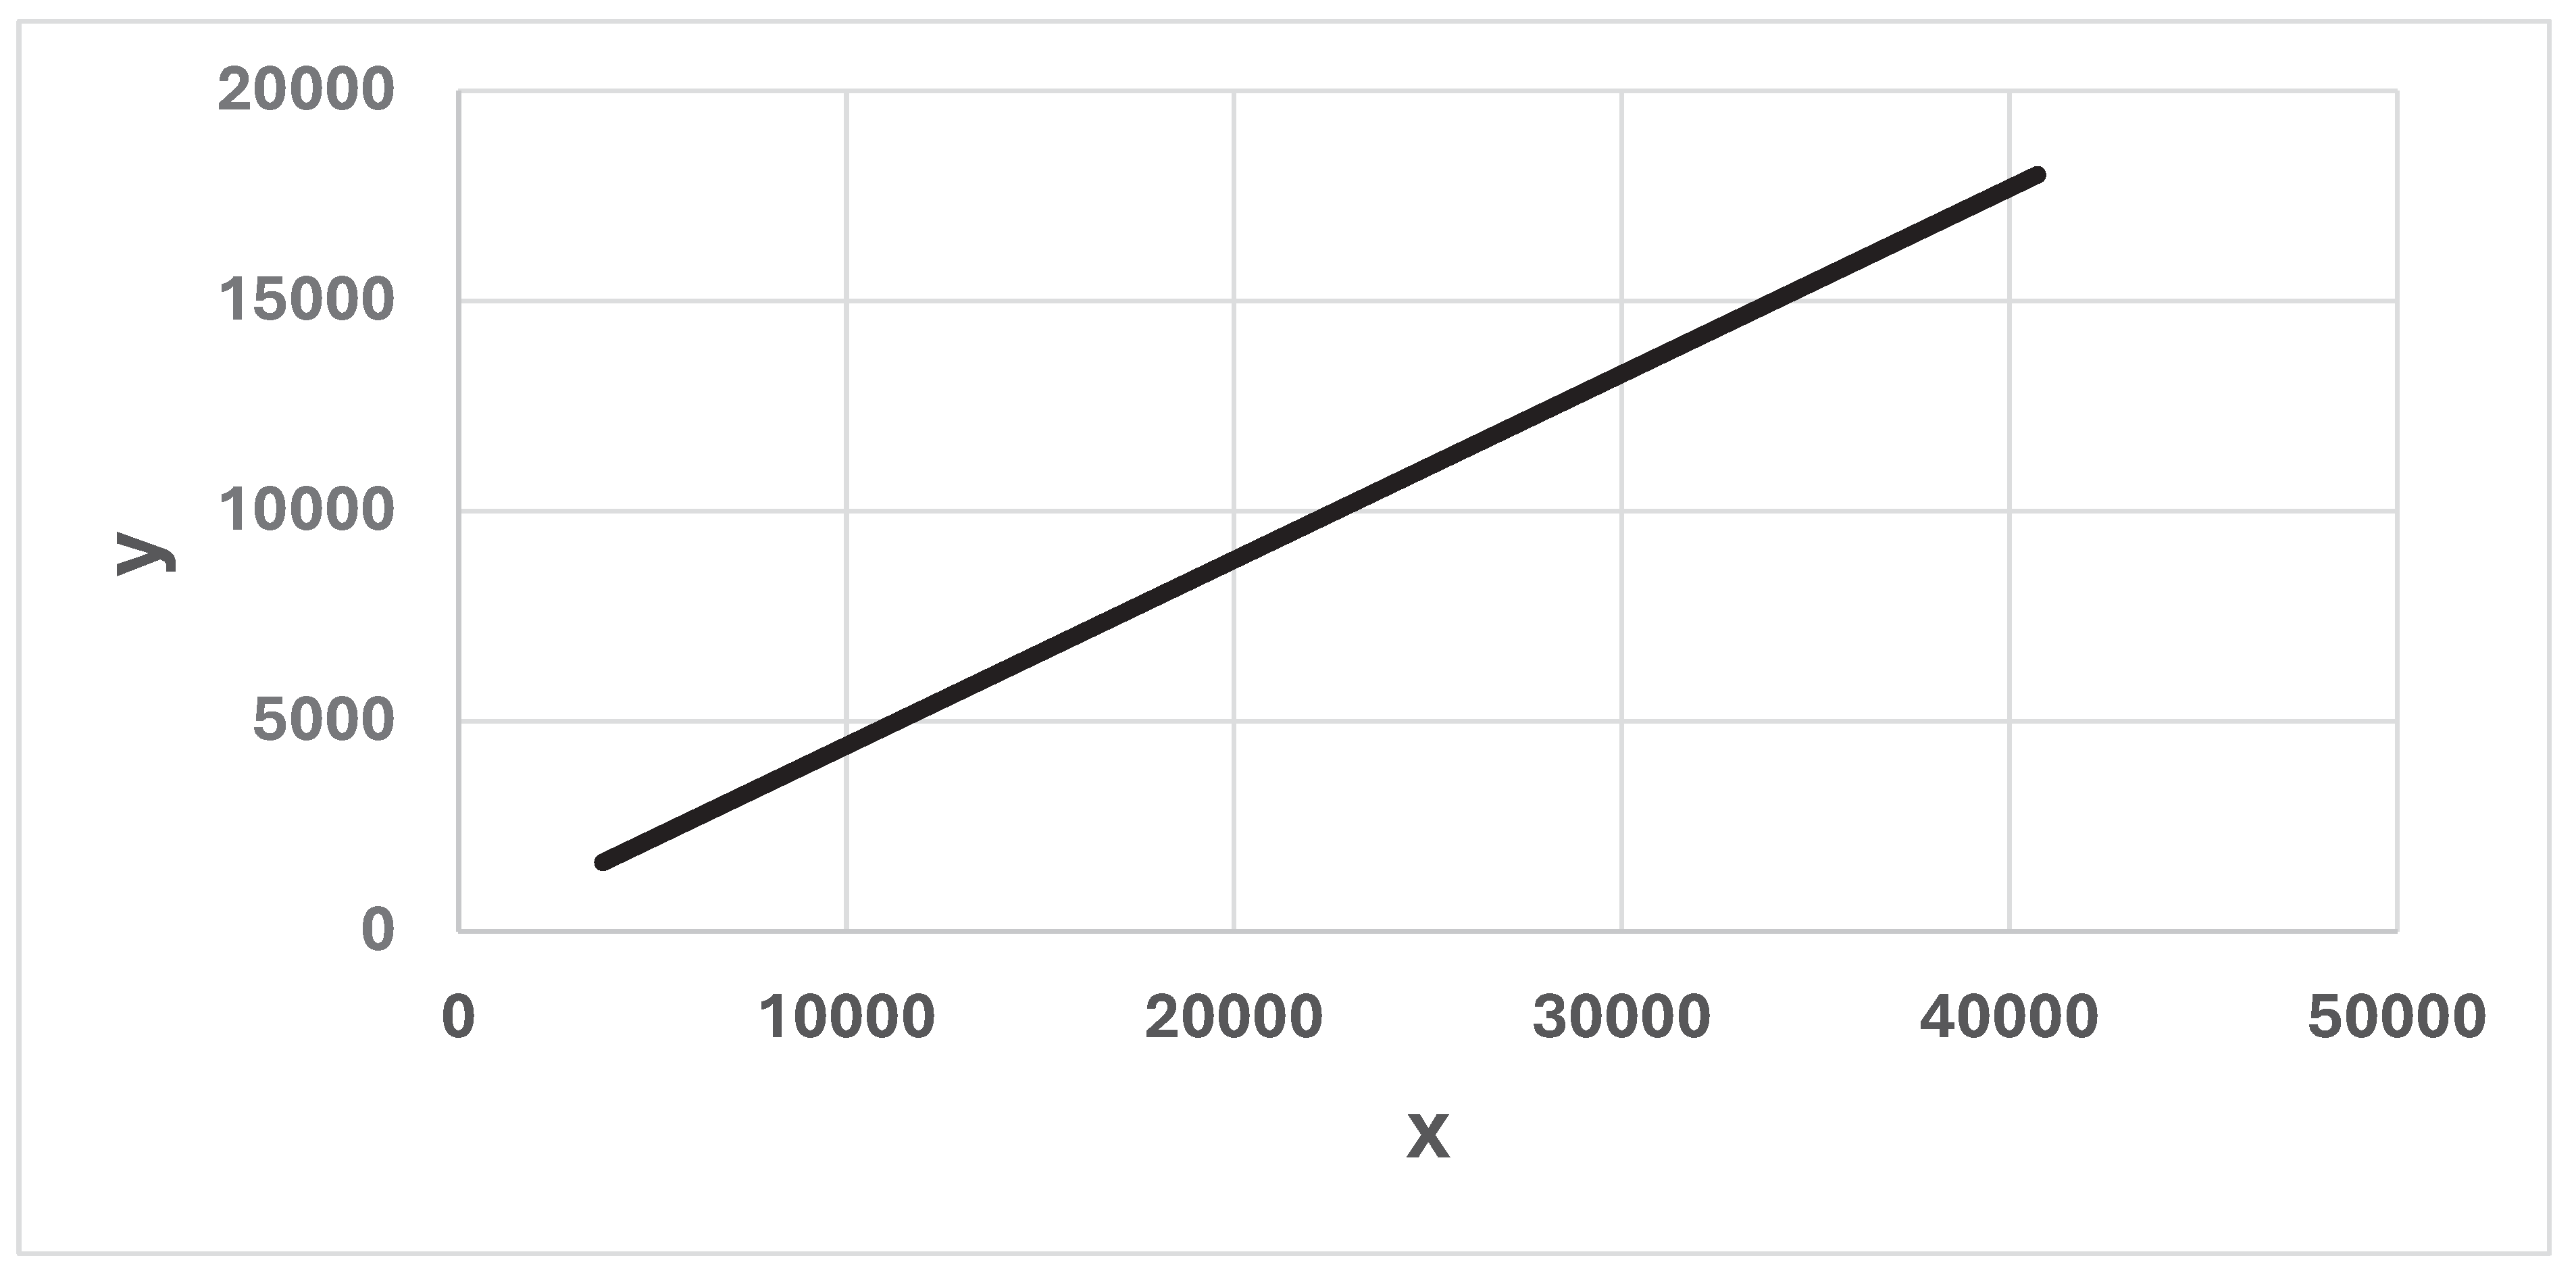
Figure 11.
x(t) and y(t), for t = 0, 1, …, 39. t = time (days), (x0, y0) = (30000, 18000). a = 0.05347 and b = 0.01045. The graph is constructed via a discrete time approximation of the differential equation system (1).
Figure 11.
x(t) and y(t), for t = 0, 1, …, 39. t = time (days), (x0, y0) = (30000, 18000). a = 0.05347 and b = 0.01045. The graph is constructed via a discrete time approximation of the differential equation system (1).
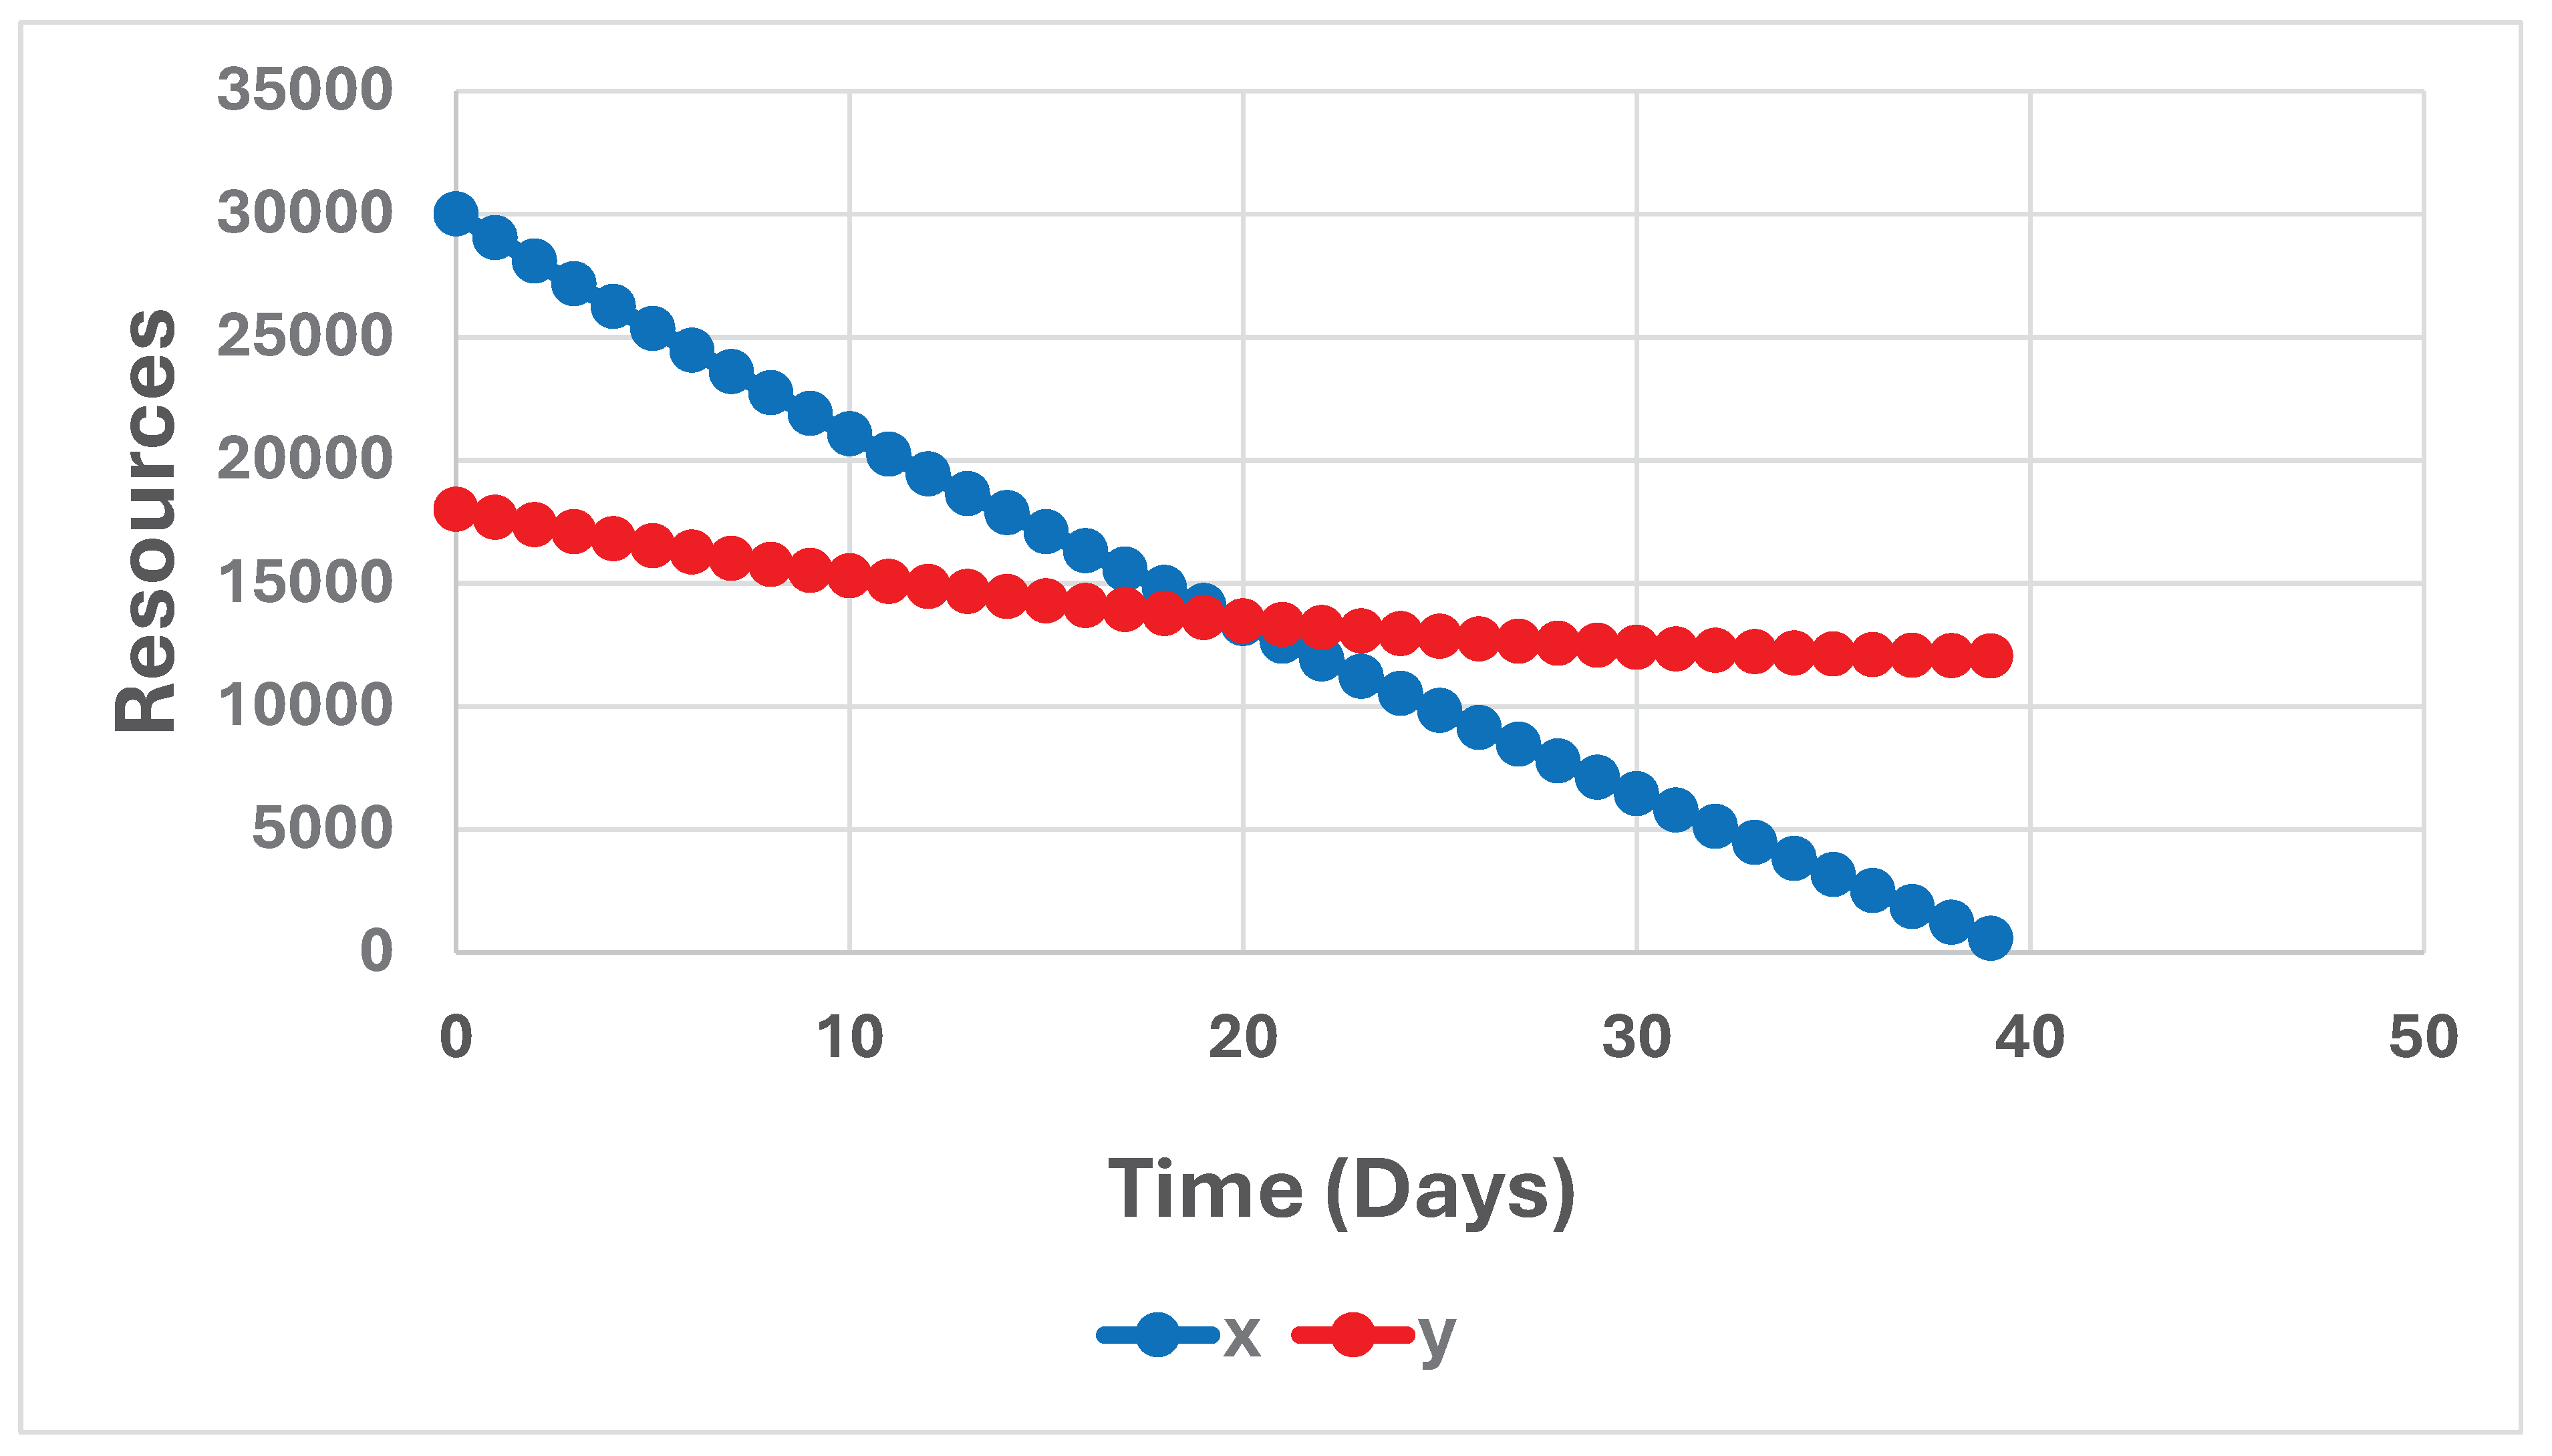
Figure 12.
(x(t), y(t)), for t = 0, 1, …, 39. (x0, y0) = (30000, 18000). a = 0.05347 and b = 0.01045. The graph is constructed via a discrete time approximation of the differential equation system (1).
Figure 12.
(x(t), y(t)), for t = 0, 1, …, 39. (x0, y0) = (30000, 18000). a = 0.05347 and b = 0.01045. The graph is constructed via a discrete time approximation of the differential equation system (1).
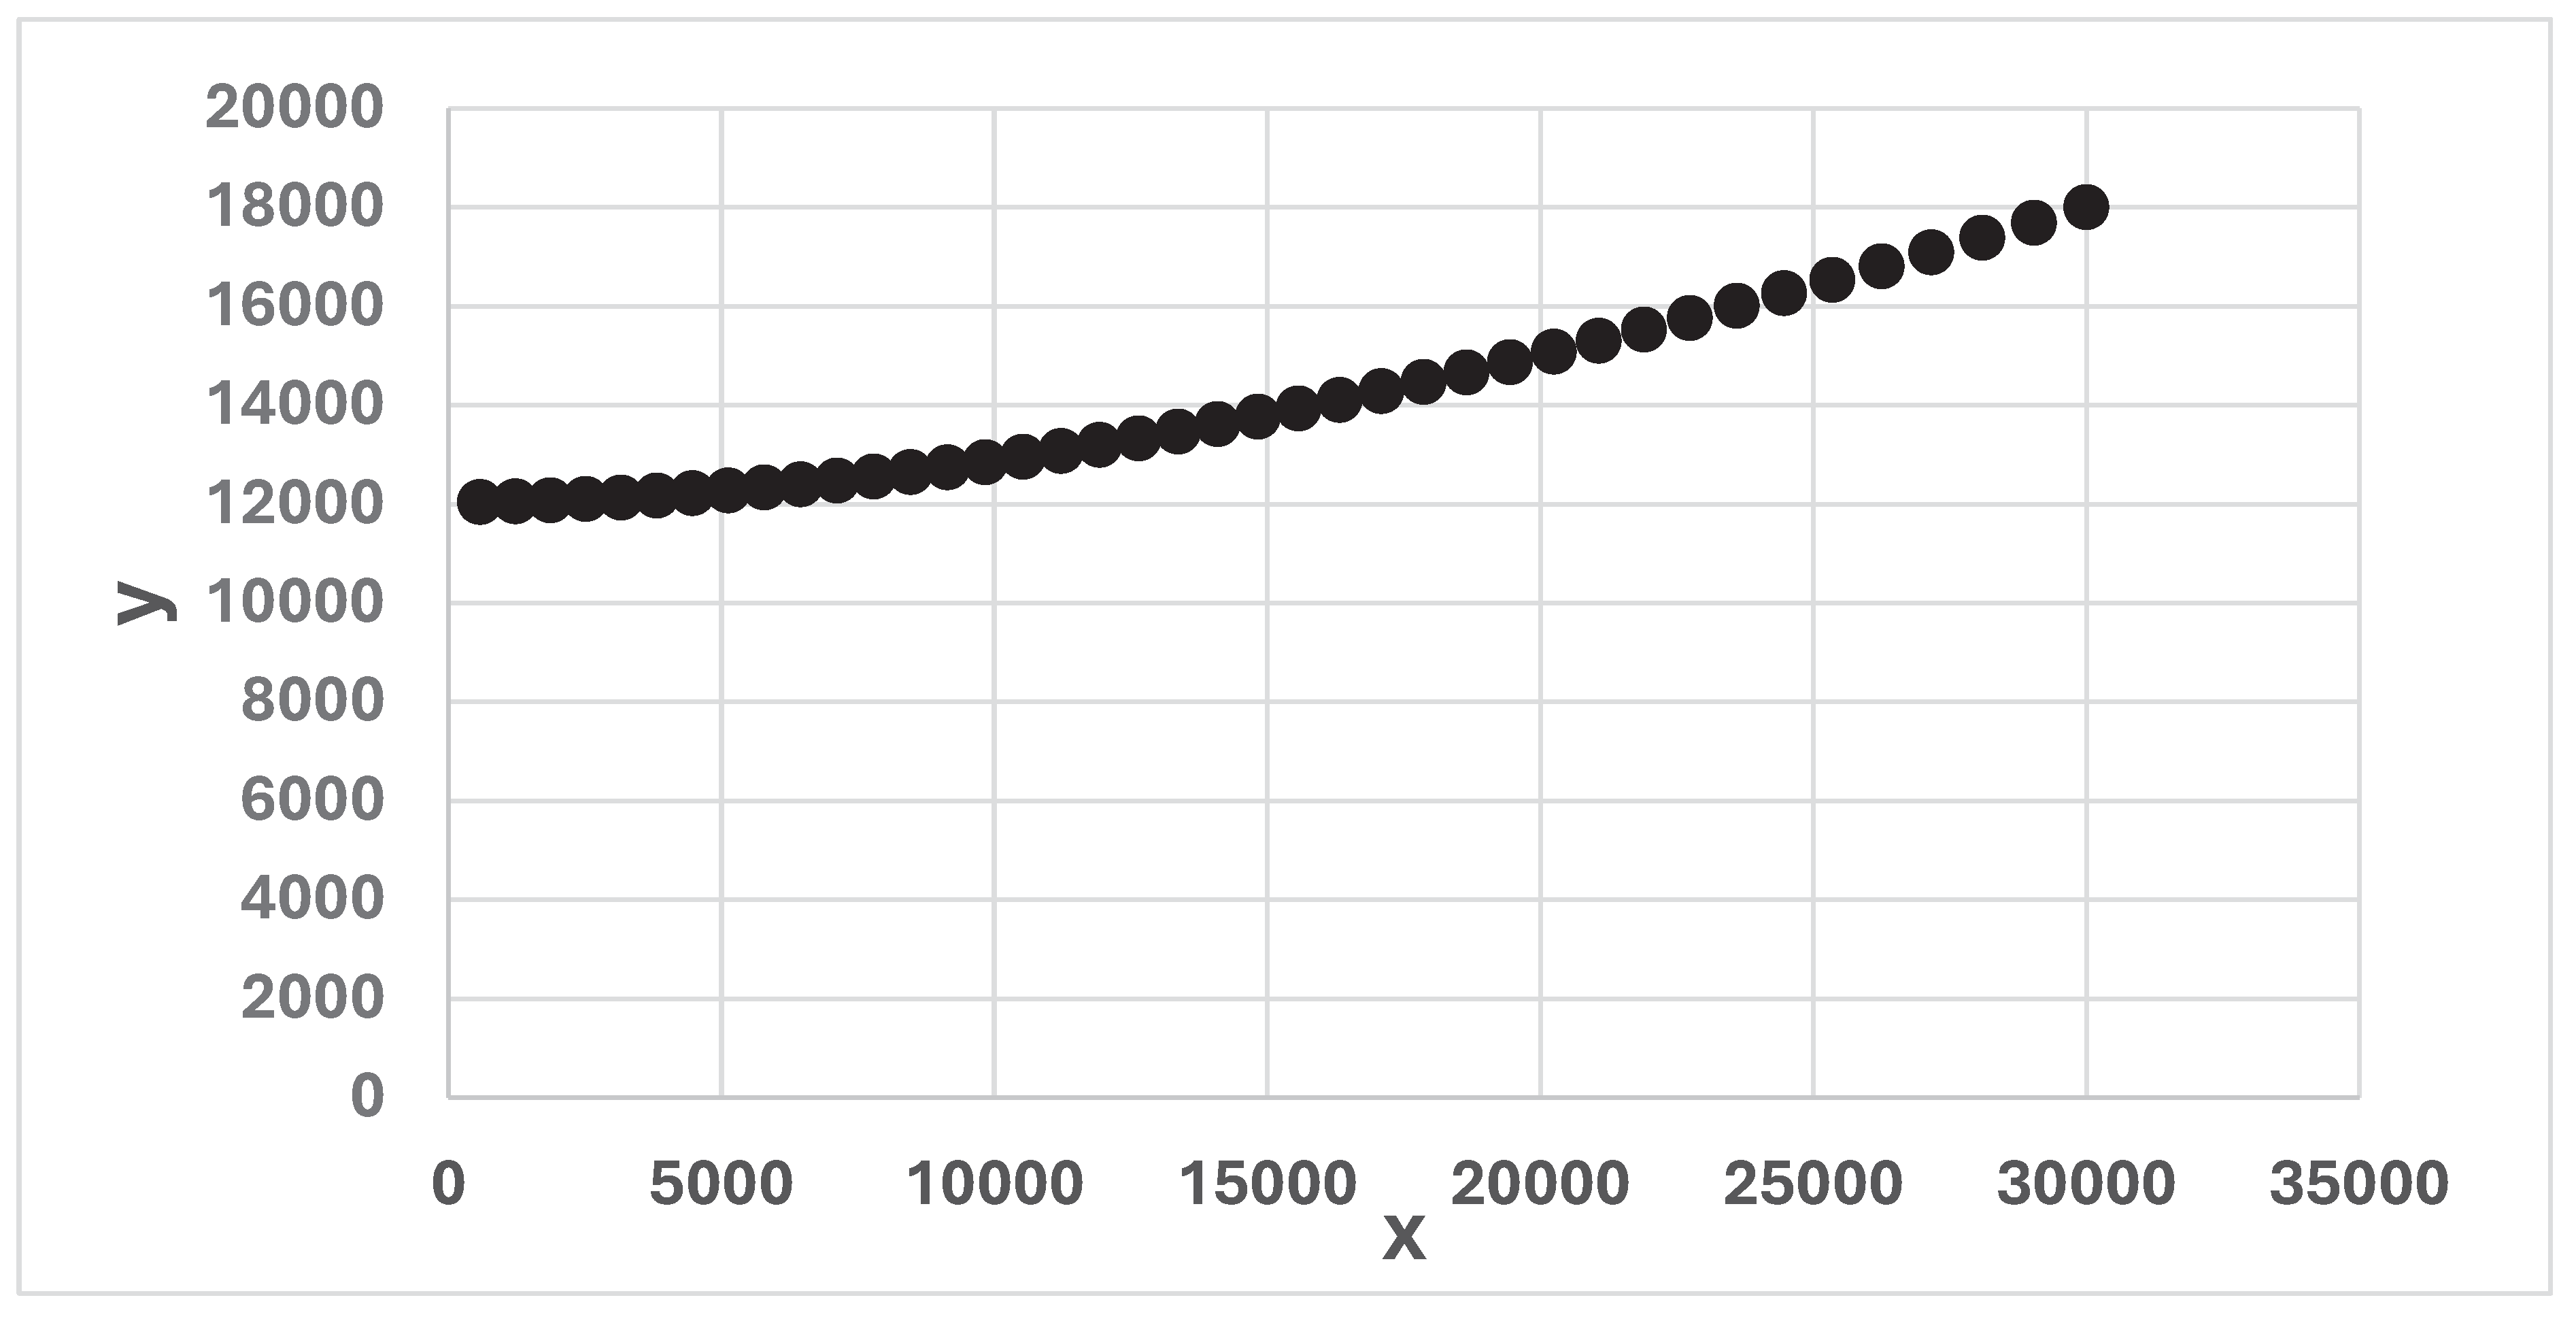
Figure 13.
A continuous time approximation of (x(t), y(t)), for 0 < t < 39. t = time (days), (x0, y0) = (30000, 18000). a = 0.05347 and b = 0.01045. The graph is constructed via a discrete time approximation of the differential equation system (1).
Figure 13.
A continuous time approximation of (x(t), y(t)), for 0 < t < 39. t = time (days), (x0, y0) = (30000, 18000). a = 0.05347 and b = 0.01045. The graph is constructed via a discrete time approximation of the differential equation system (1).
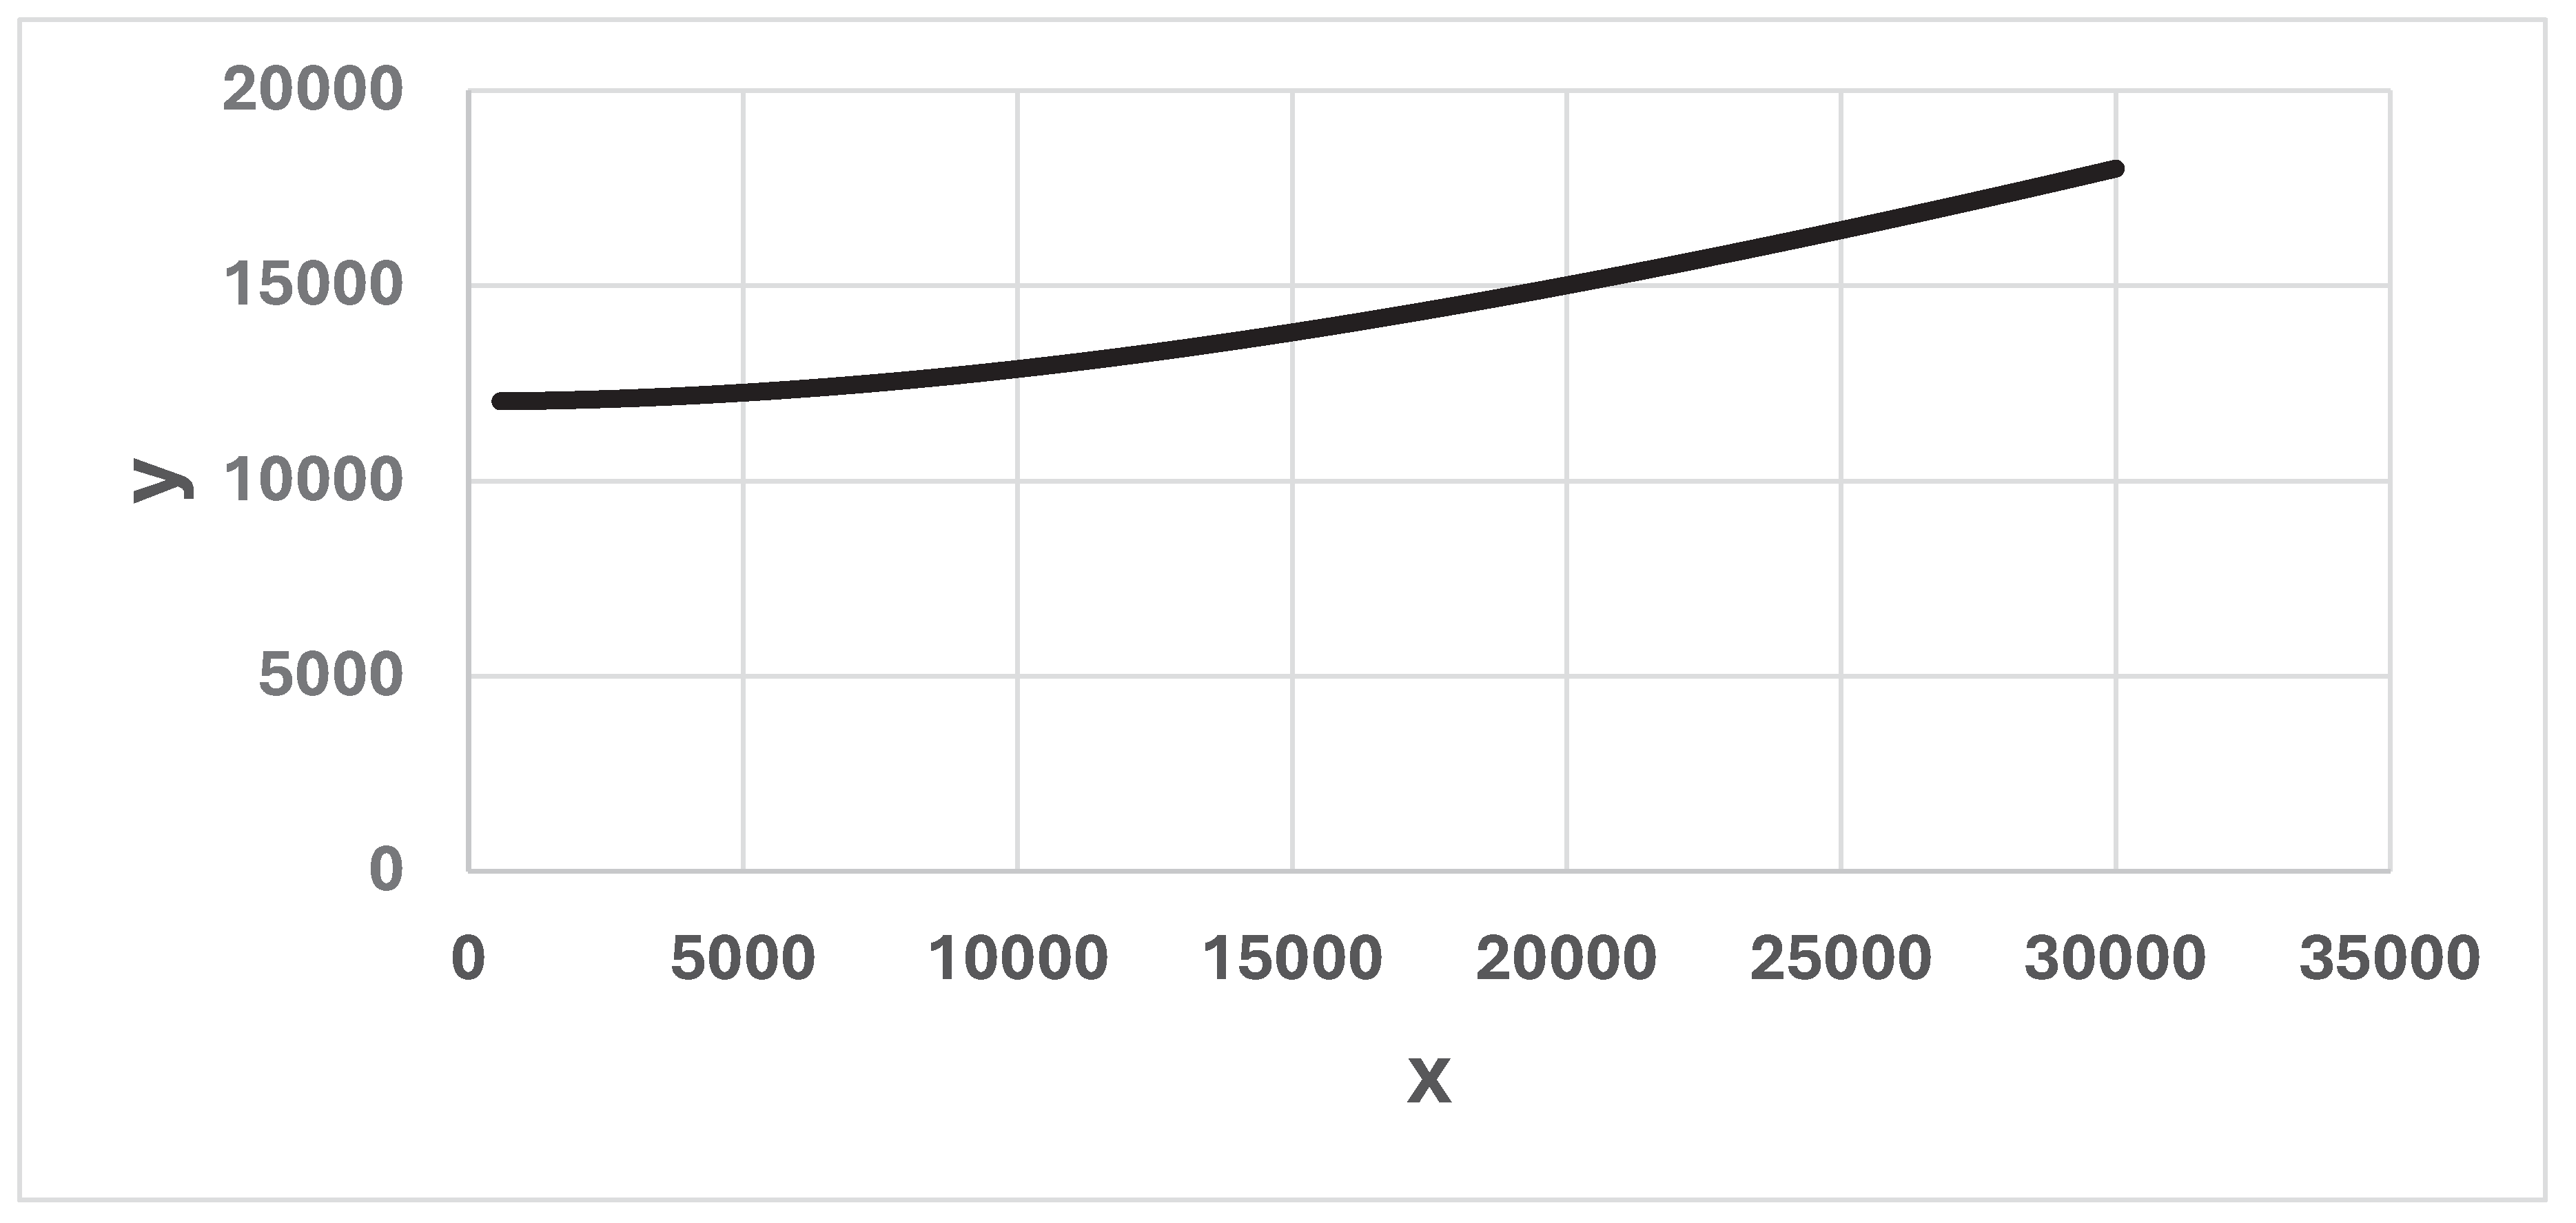
Figure 14.
(x(t), y(t)), for t = 0, 1, …, T. t = time (days), T is the point in time when one of the variables x or y, takes the value zero. a = 0.05347 and b = 0.01045. y0 = 18000. In the five different cases, x0 takes the value 30000, 40716, 45000, 52500 or 65000. The graph is constructed via a discrete time approximation of the differential equation system (1).
Figure 14.
(x(t), y(t)), for t = 0, 1, …, T. t = time (days), T is the point in time when one of the variables x or y, takes the value zero. a = 0.05347 and b = 0.01045. y0 = 18000. In the five different cases, x0 takes the value 30000, 40716, 45000, 52500 or 65000. The graph is constructed via a discrete time approximation of the differential equation system (1).
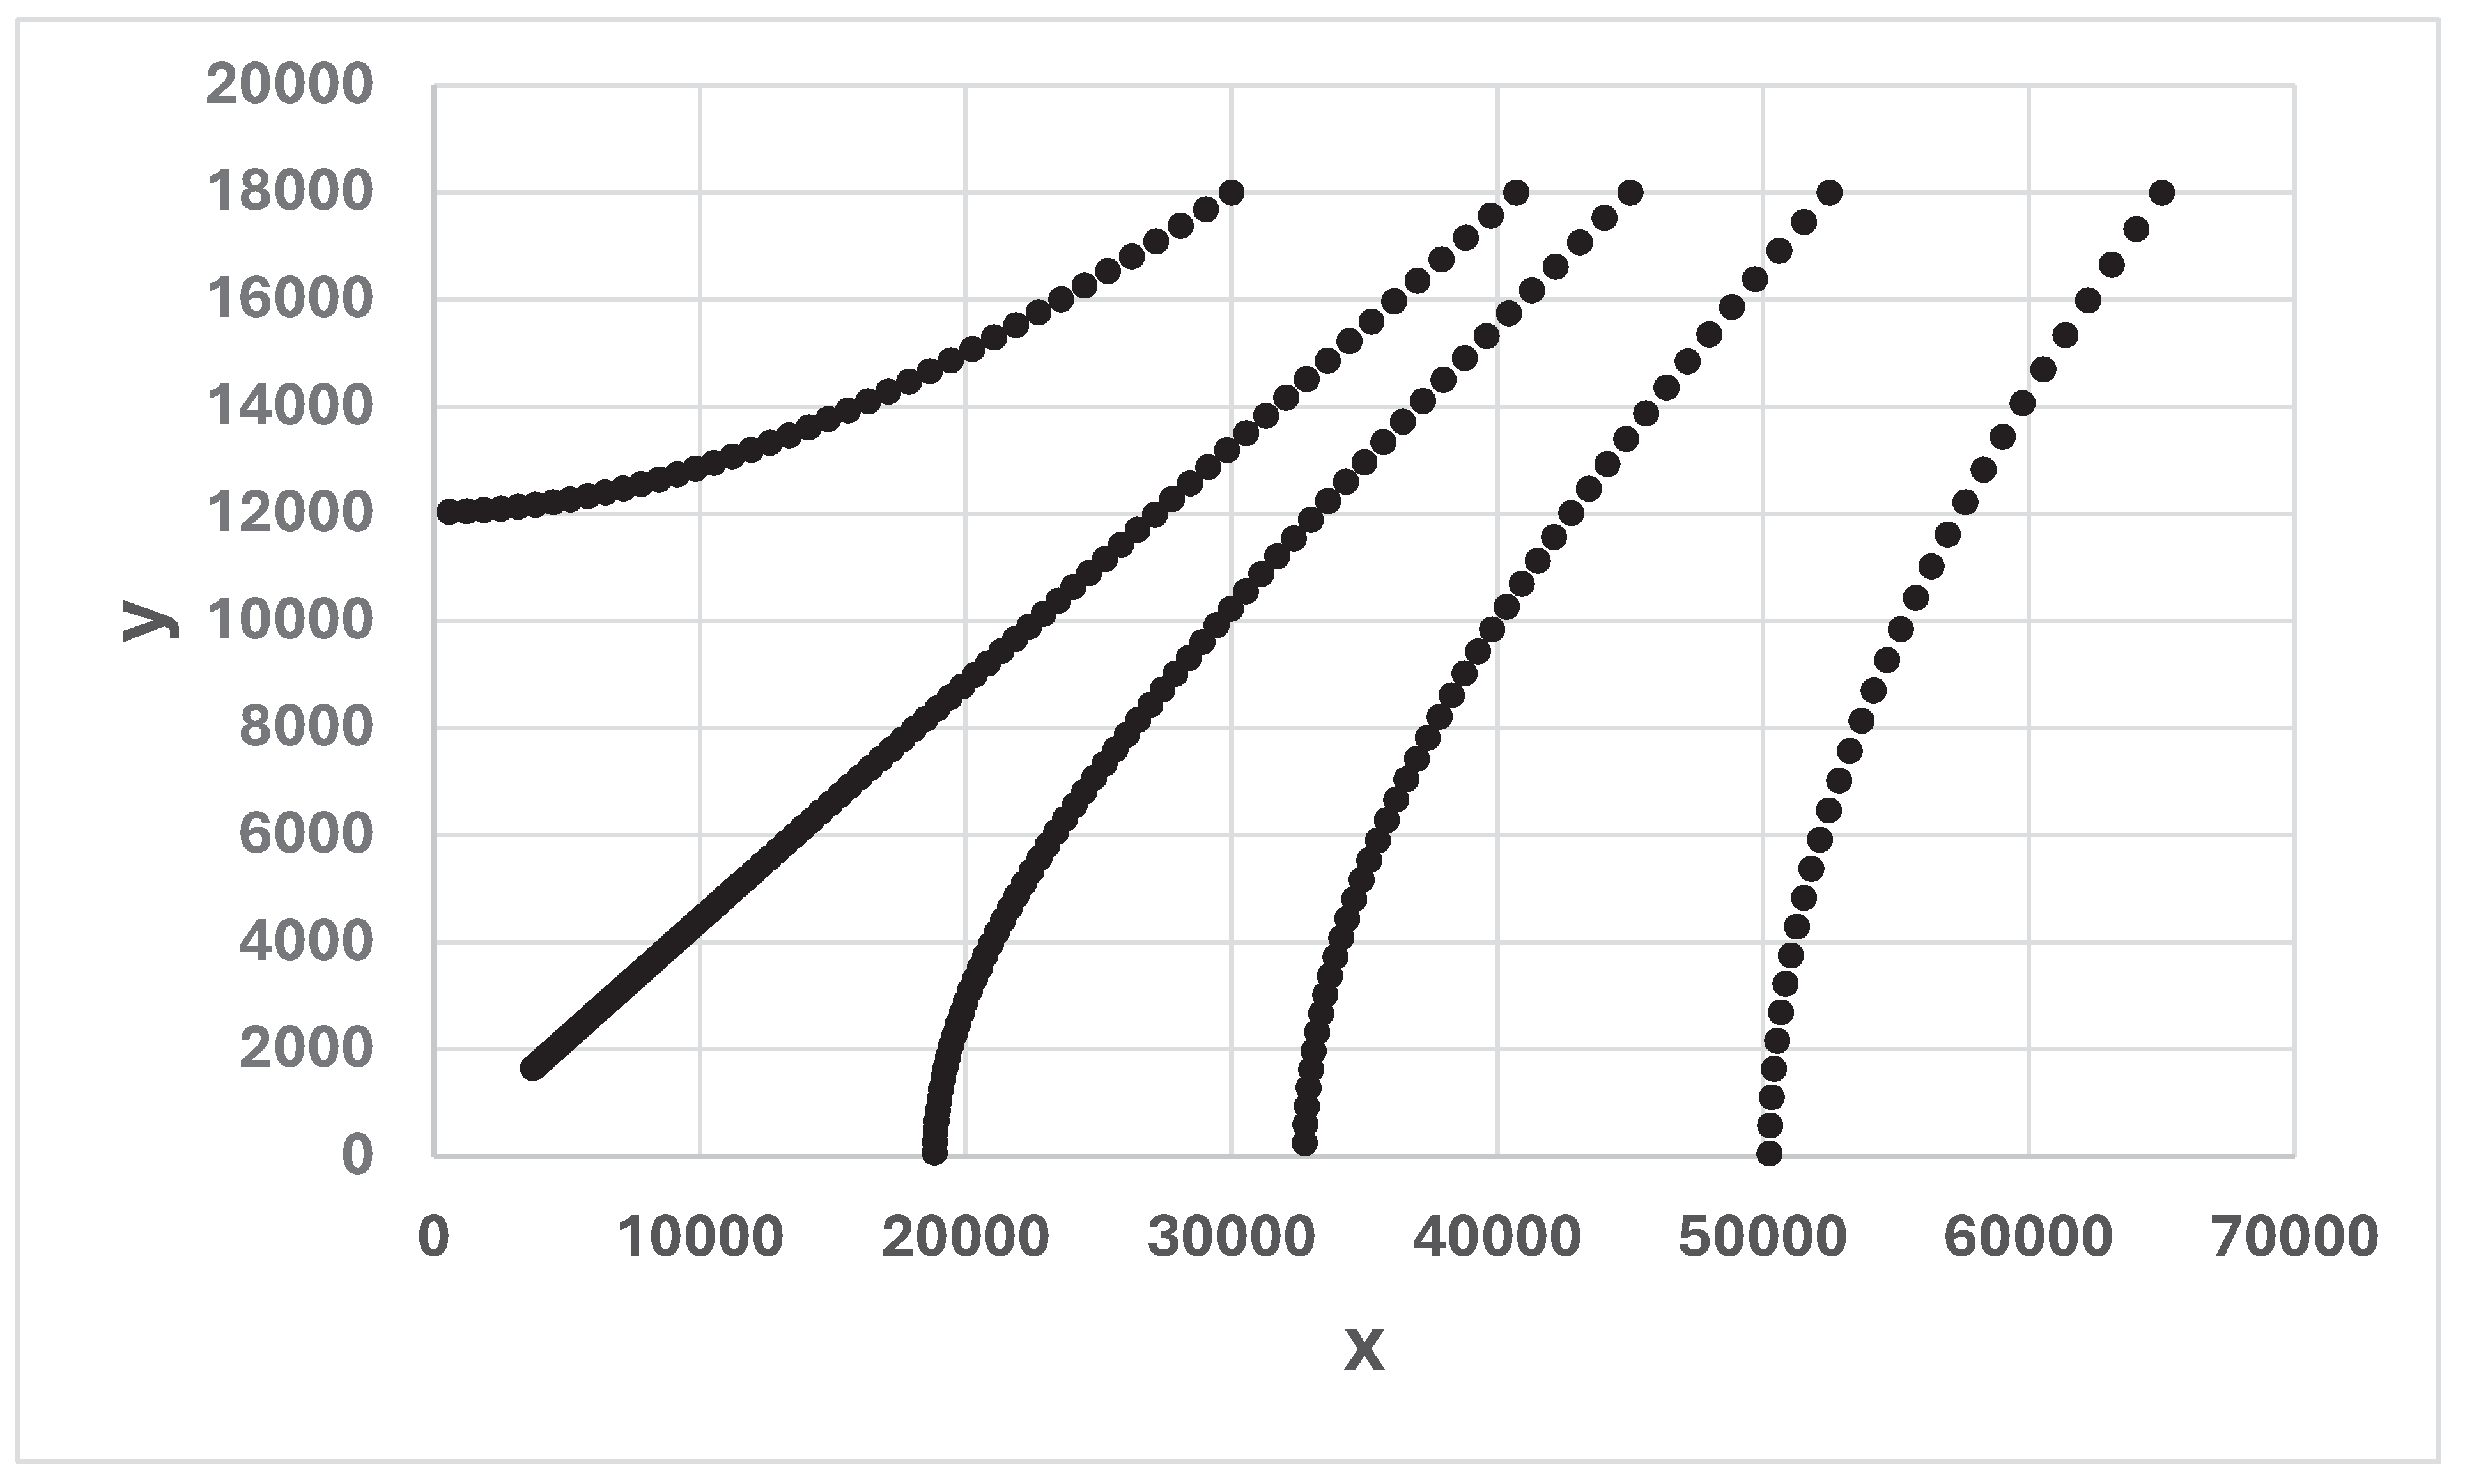
Figure 15.
KIAx denotes the total number of lost x resources, at different points in time, t, until t = T. T is the point in time, when y(T) = 0. KIAx(x0/1000) = x0 – x(t). a = 0.05347 and b = 0.01045. y0 = 18000. In the four different cases, x0 takes the value 45000, 65000, 85000, or 105000. The graph is constructed via a discrete time approximation of the differential equation system (1).
Figure 15.
KIAx denotes the total number of lost x resources, at different points in time, t, until t = T. T is the point in time, when y(T) = 0. KIAx(x0/1000) = x0 – x(t). a = 0.05347 and b = 0.01045. y0 = 18000. In the four different cases, x0 takes the value 45000, 65000, 85000, or 105000. The graph is constructed via a discrete time approximation of the differential equation system (1).
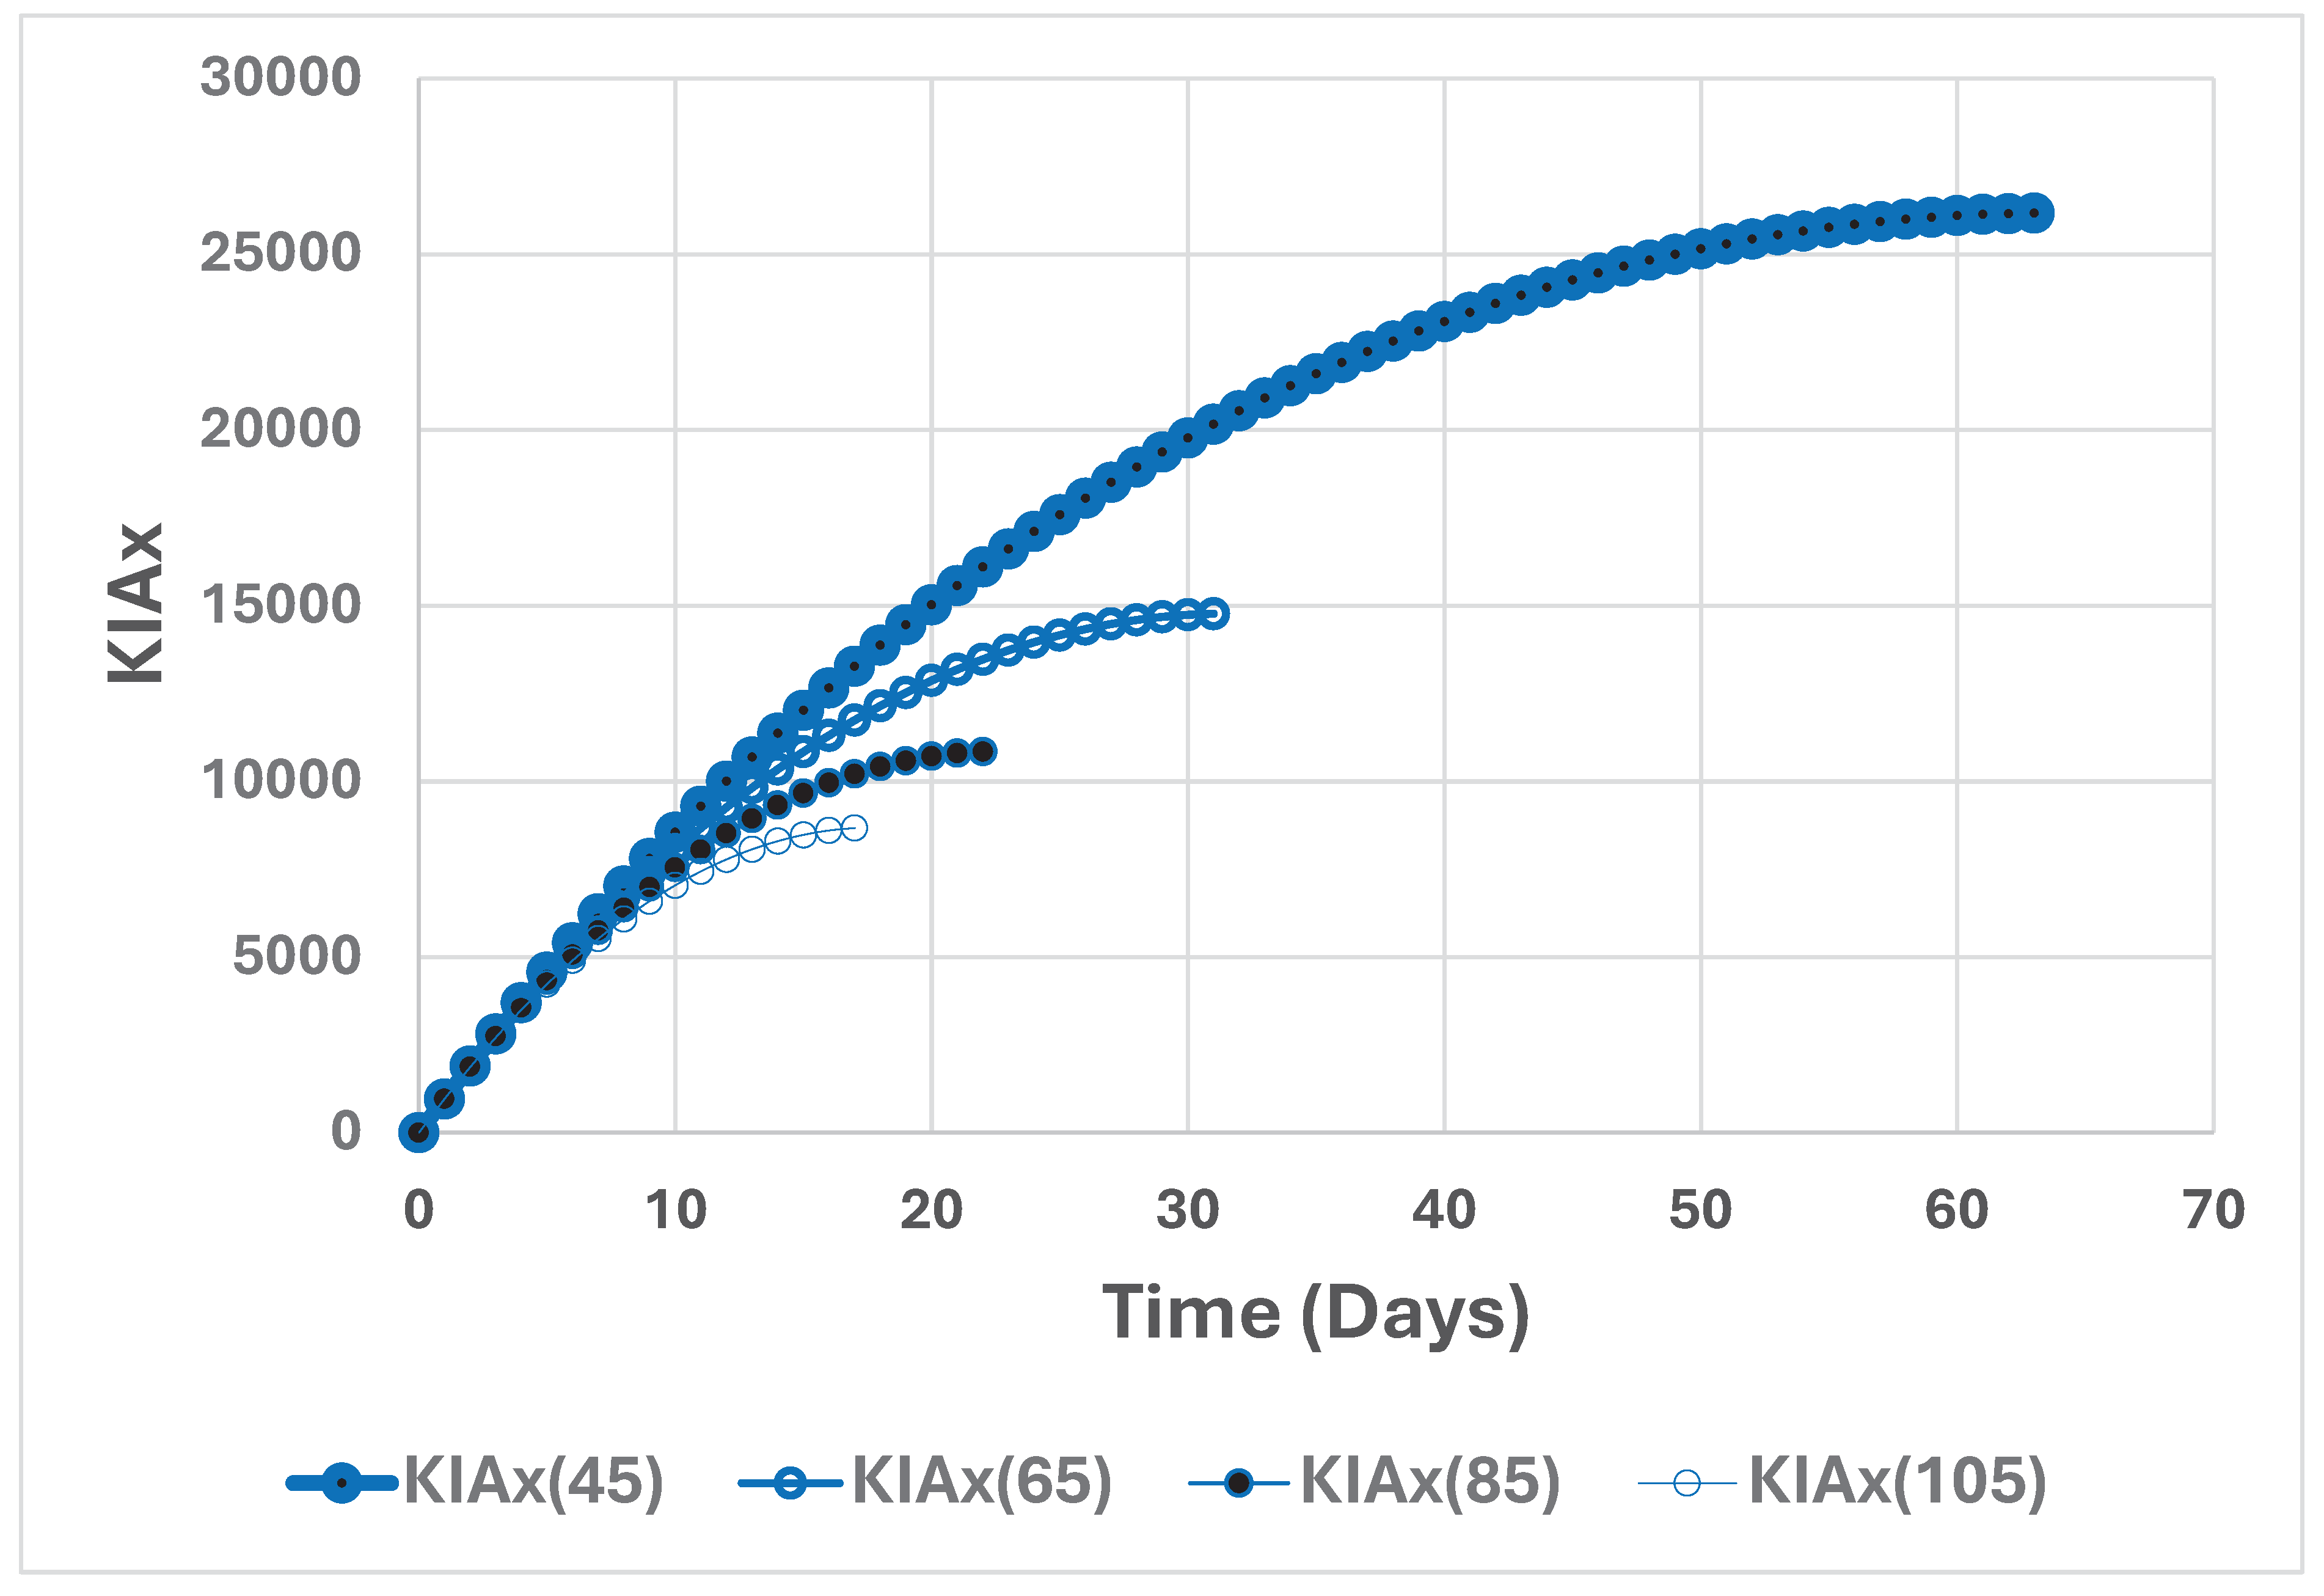
Figure 16.
KIAy is the total number of lost y resources, at different points in time, t, until t = T. T is the point in time when y(T) = 0. KIAy(x0/1000) = y0 – y(t). a = 0.05347 and b = 0.01045. In all cases, y0 = 18000. In the four different cases, x0 takes the value 45000, 65000, 85000, or 105000. The graph is constructed via a discrete time approximation of the differential equation system (1).
Figure 16.
KIAy is the total number of lost y resources, at different points in time, t, until t = T. T is the point in time when y(T) = 0. KIAy(x0/1000) = y0 – y(t). a = 0.05347 and b = 0.01045. In all cases, y0 = 18000. In the four different cases, x0 takes the value 45000, 65000, 85000, or 105000. The graph is constructed via a discrete time approximation of the differential equation system (1).
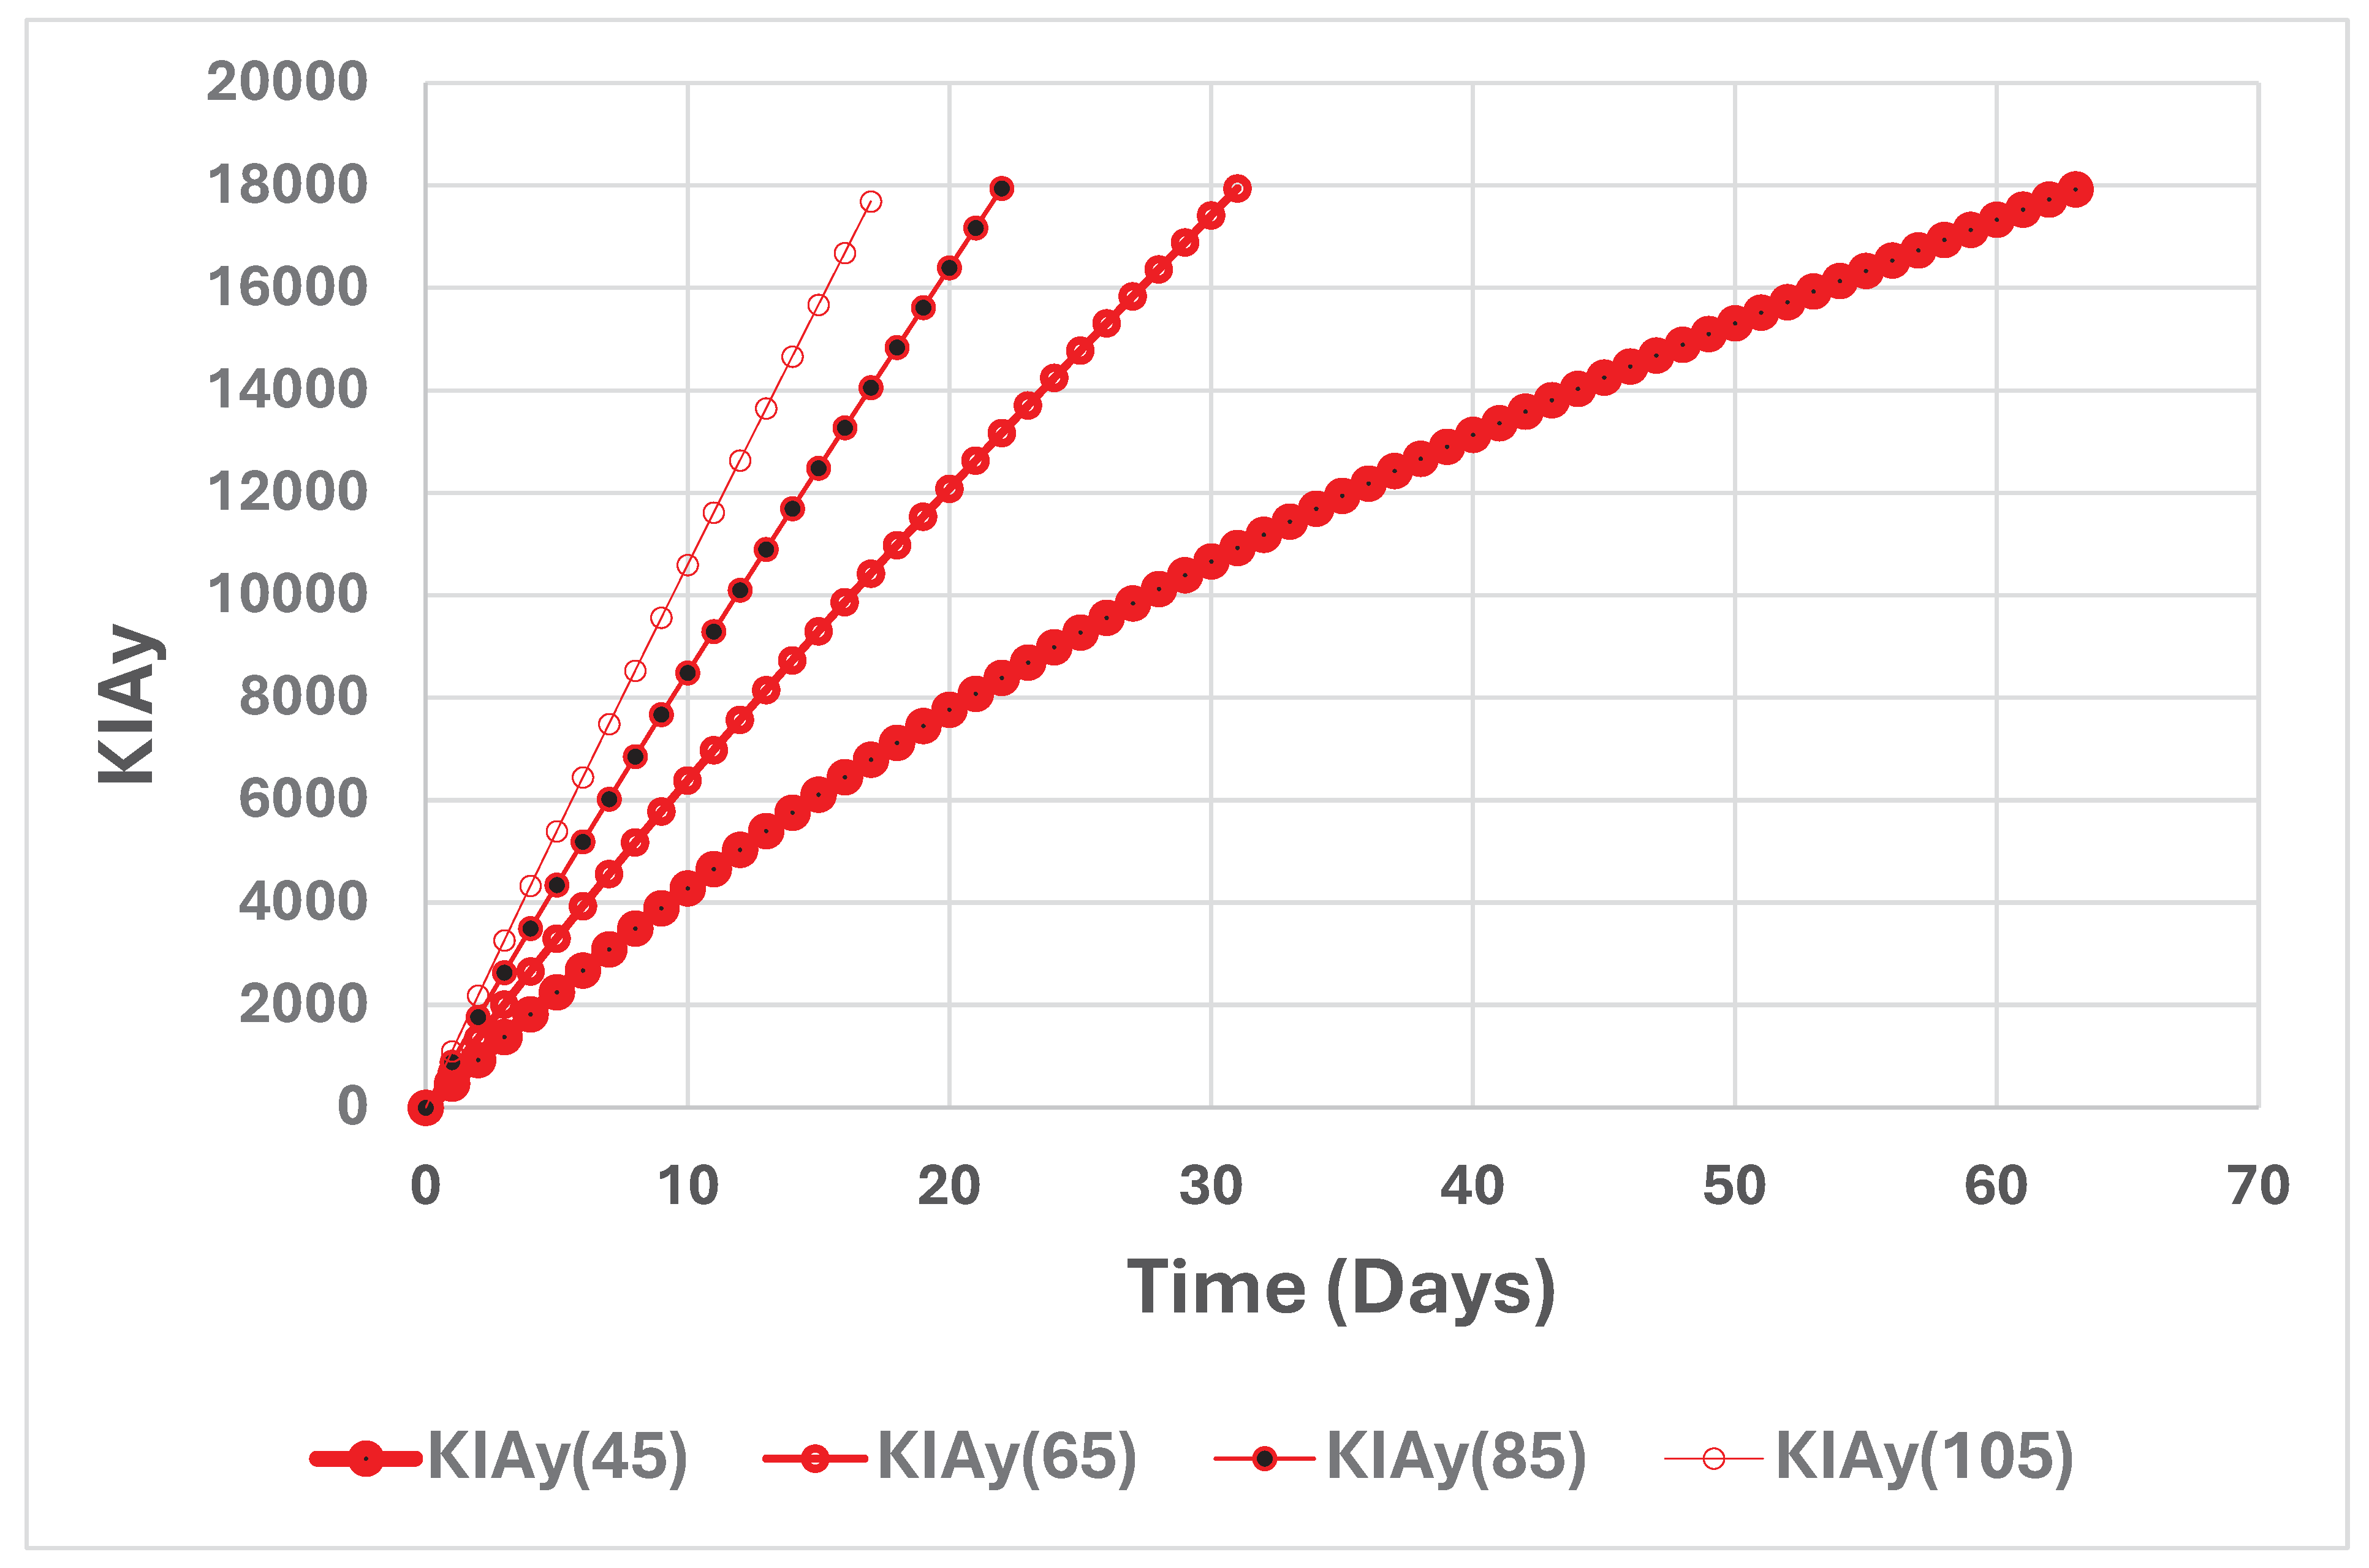
Figure 17.
T, the time of termination, is the point in time, when y(T) = 0. a = 0.05347 and b = 0.01045. y0 = 18000. In the four different cases, x0 takes the value 45000, 65000, 85000, or 105000. The graph is constructed via a discrete time approximation of the differential equation system (1).
Figure 17.
T, the time of termination, is the point in time, when y(T) = 0. a = 0.05347 and b = 0.01045. y0 = 18000. In the four different cases, x0 takes the value 45000, 65000, 85000, or 105000. The graph is constructed via a discrete time approximation of the differential equation system (1).
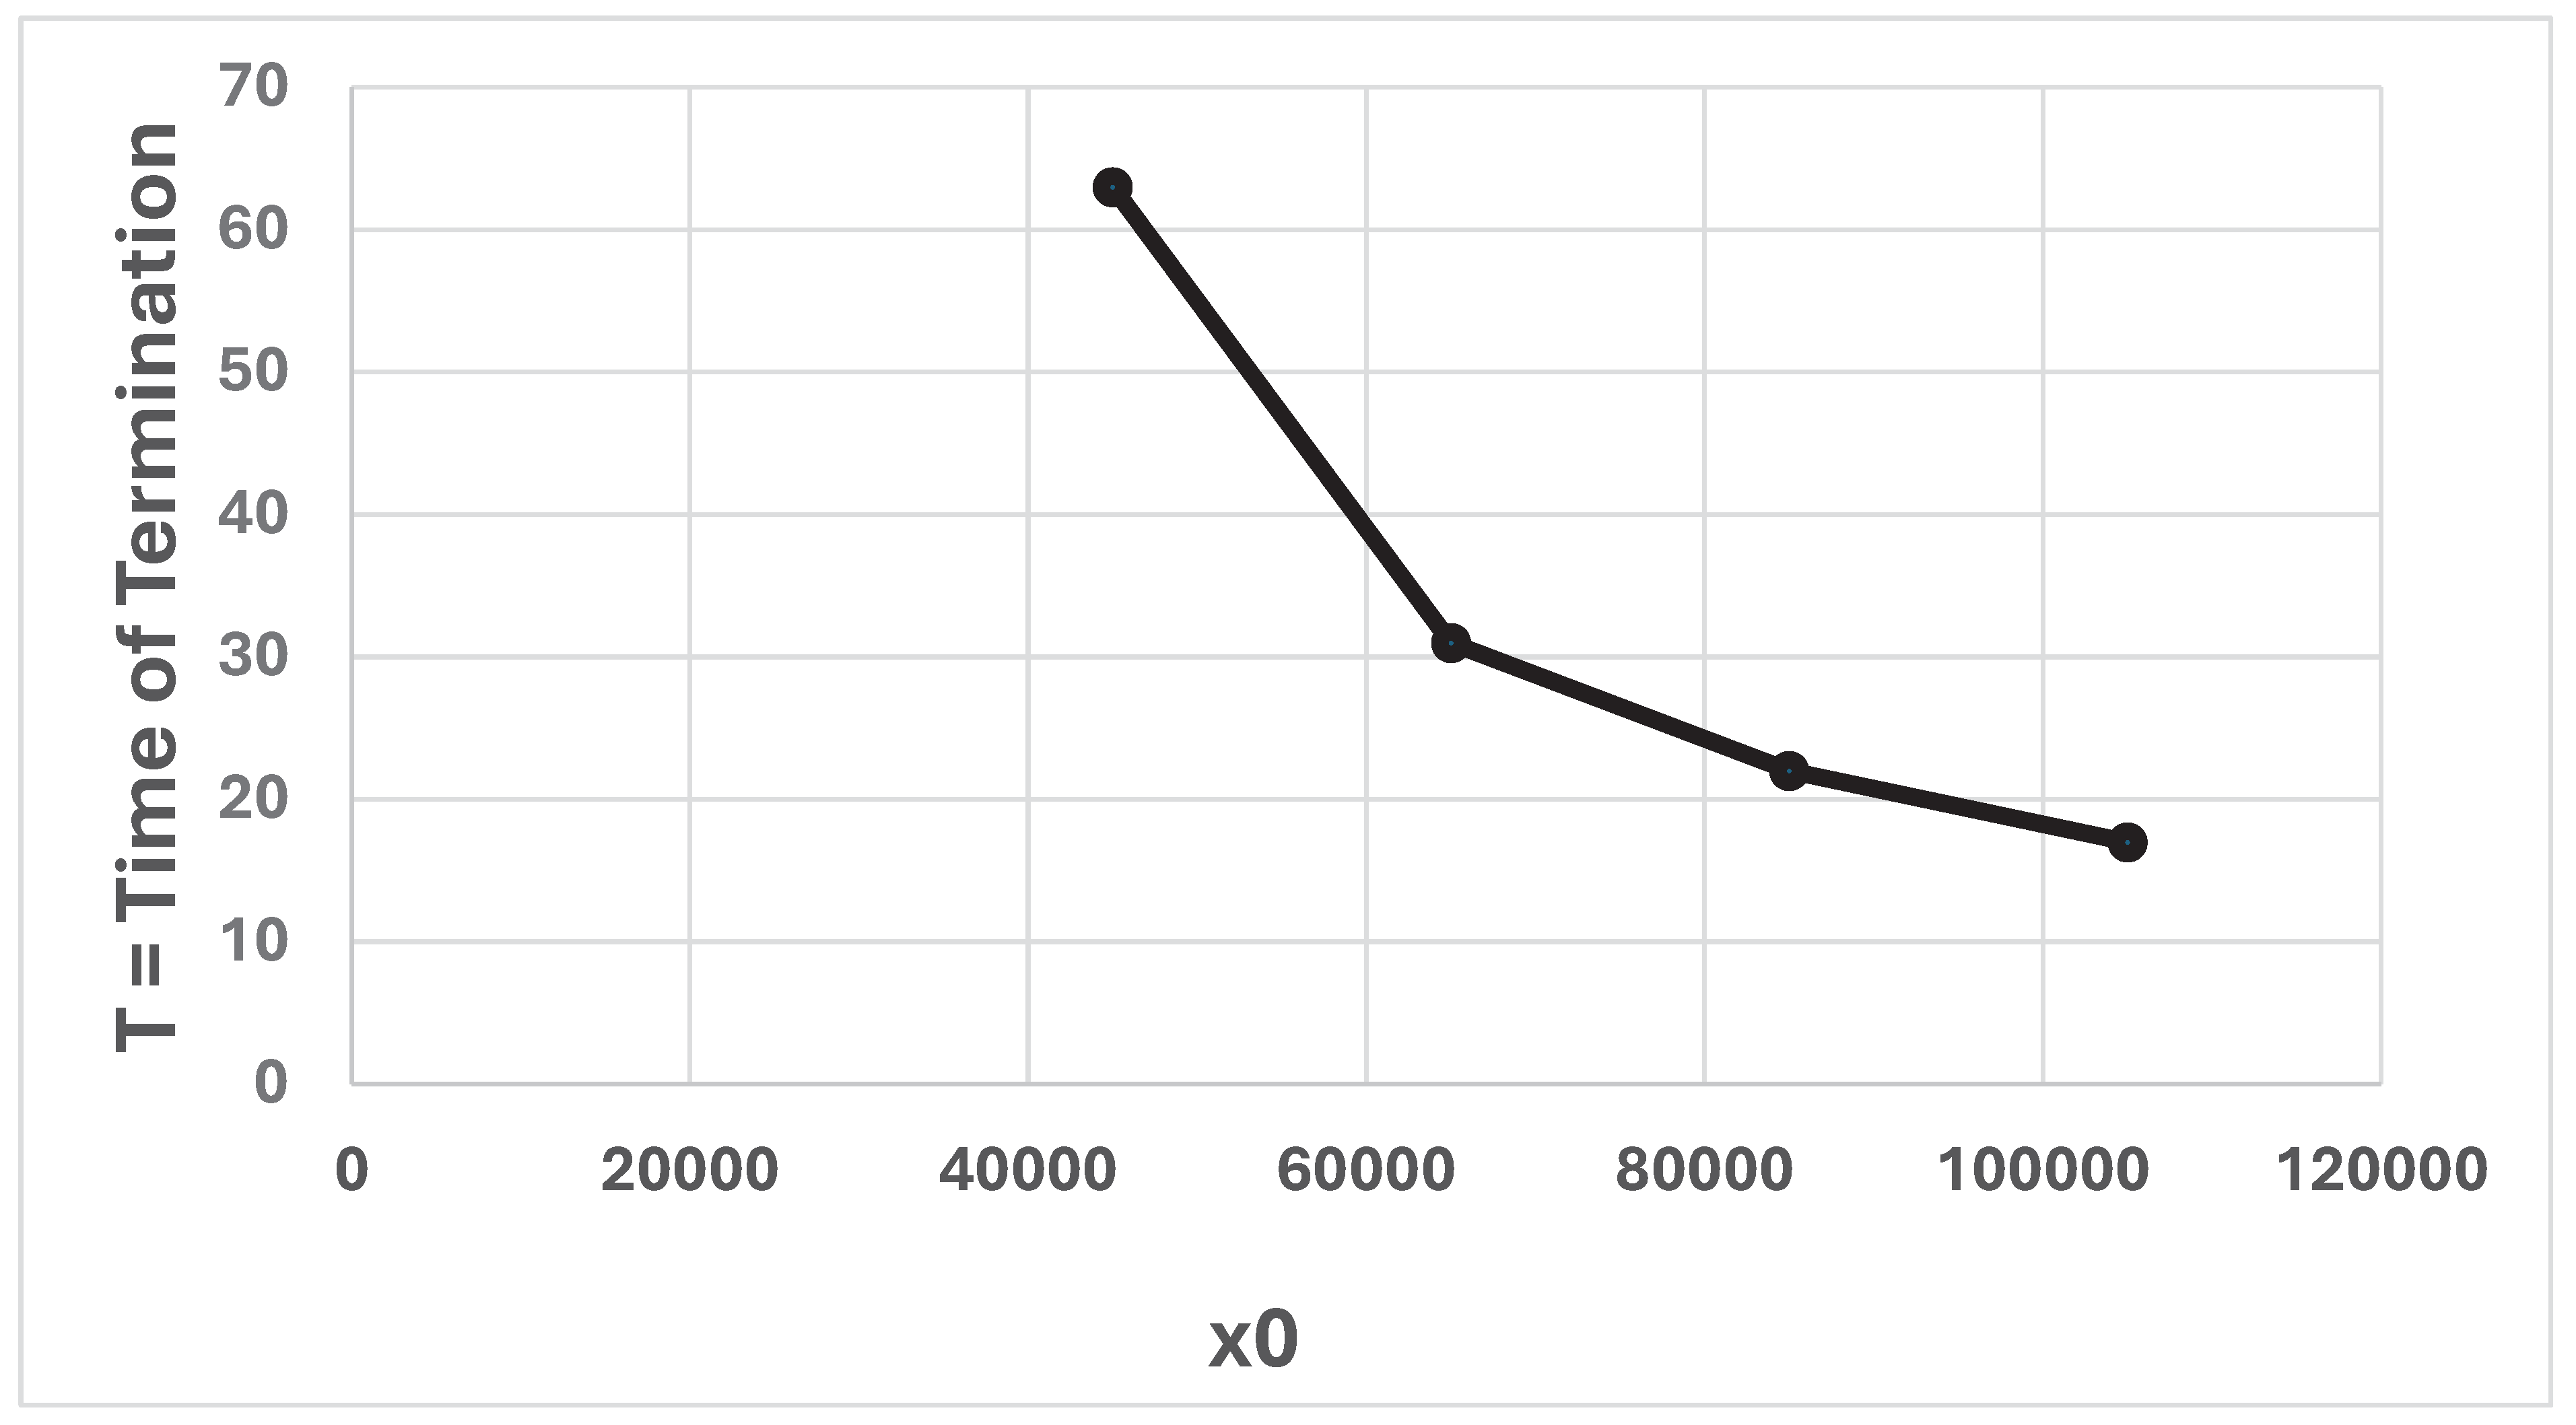
Figure 18.
KIAx at termination is the total number of lost x resources, at time t = T. T is the point in time, when y(T) = 0. a = 0.05347 and b = 0.01045. y0 = 18000. In the four different cases, x0 takes the value 45000, 65000, 85000, or 105000. The graph is constructed via a discrete time approximation of the differential equation system (1).
Figure 18.
KIAx at termination is the total number of lost x resources, at time t = T. T is the point in time, when y(T) = 0. a = 0.05347 and b = 0.01045. y0 = 18000. In the four different cases, x0 takes the value 45000, 65000, 85000, or 105000. The graph is constructed via a discrete time approximation of the differential equation system (1).
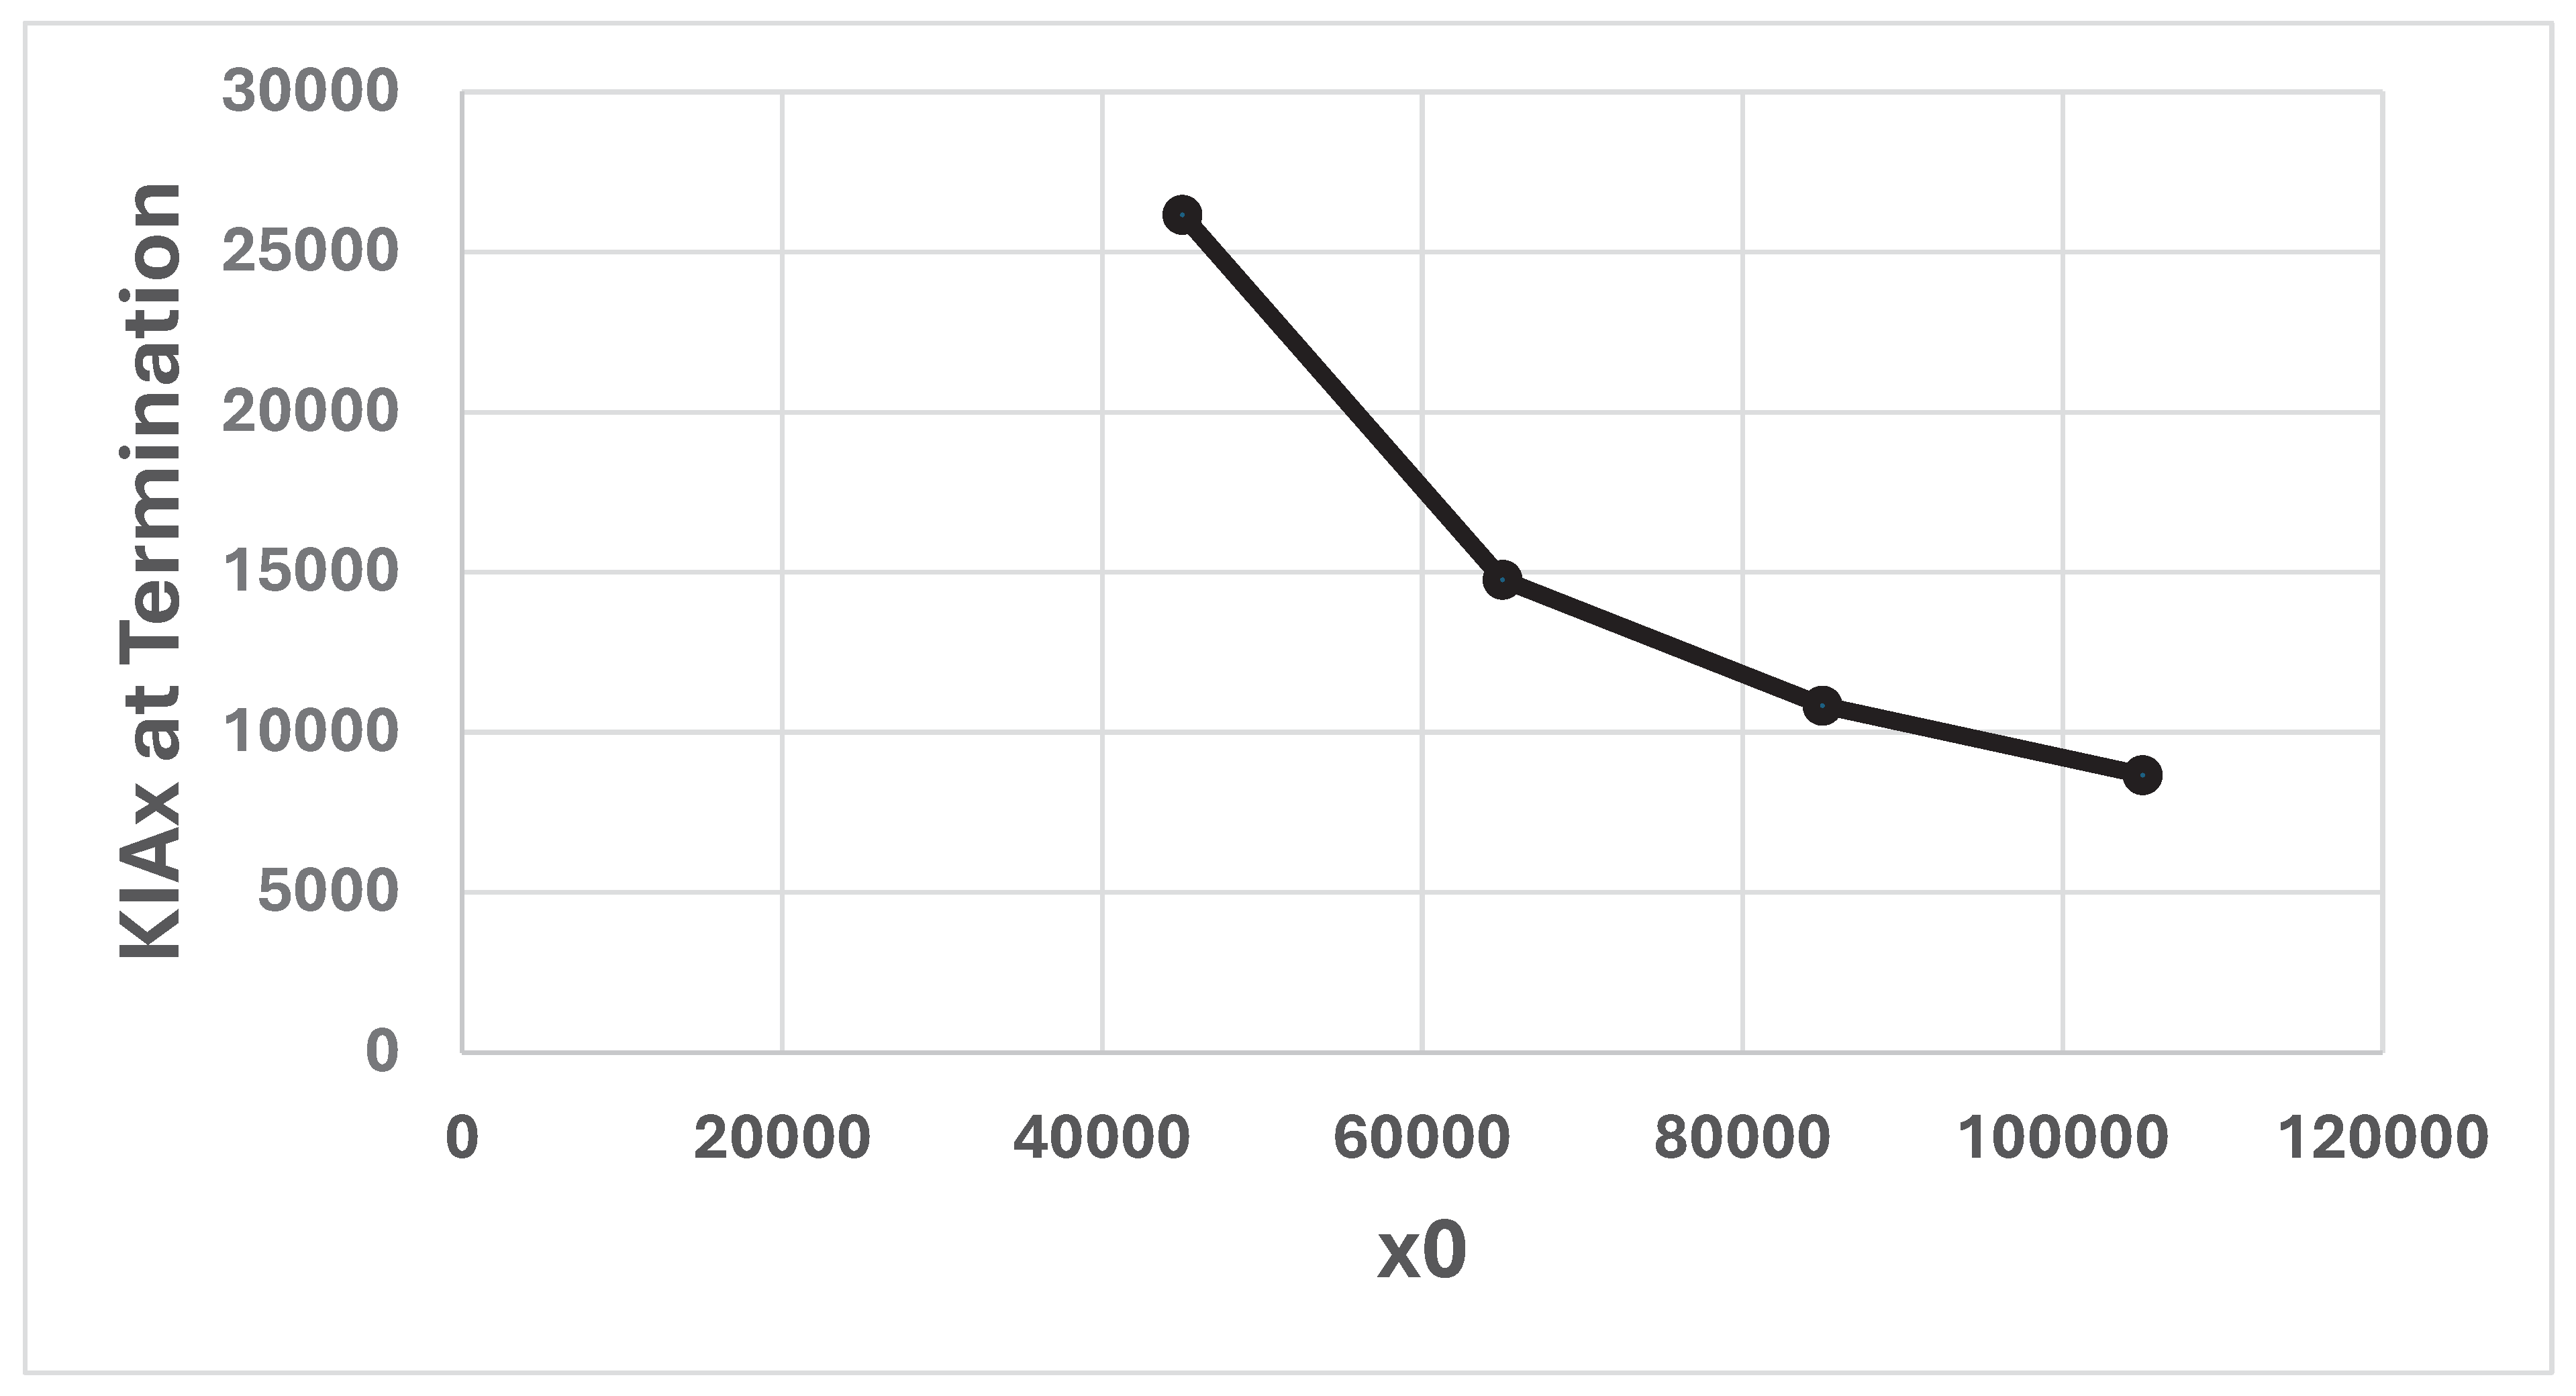
Figure 15.
T(x0, y0). a = 0.05347, b = 0.01045. Compare Equation (51).
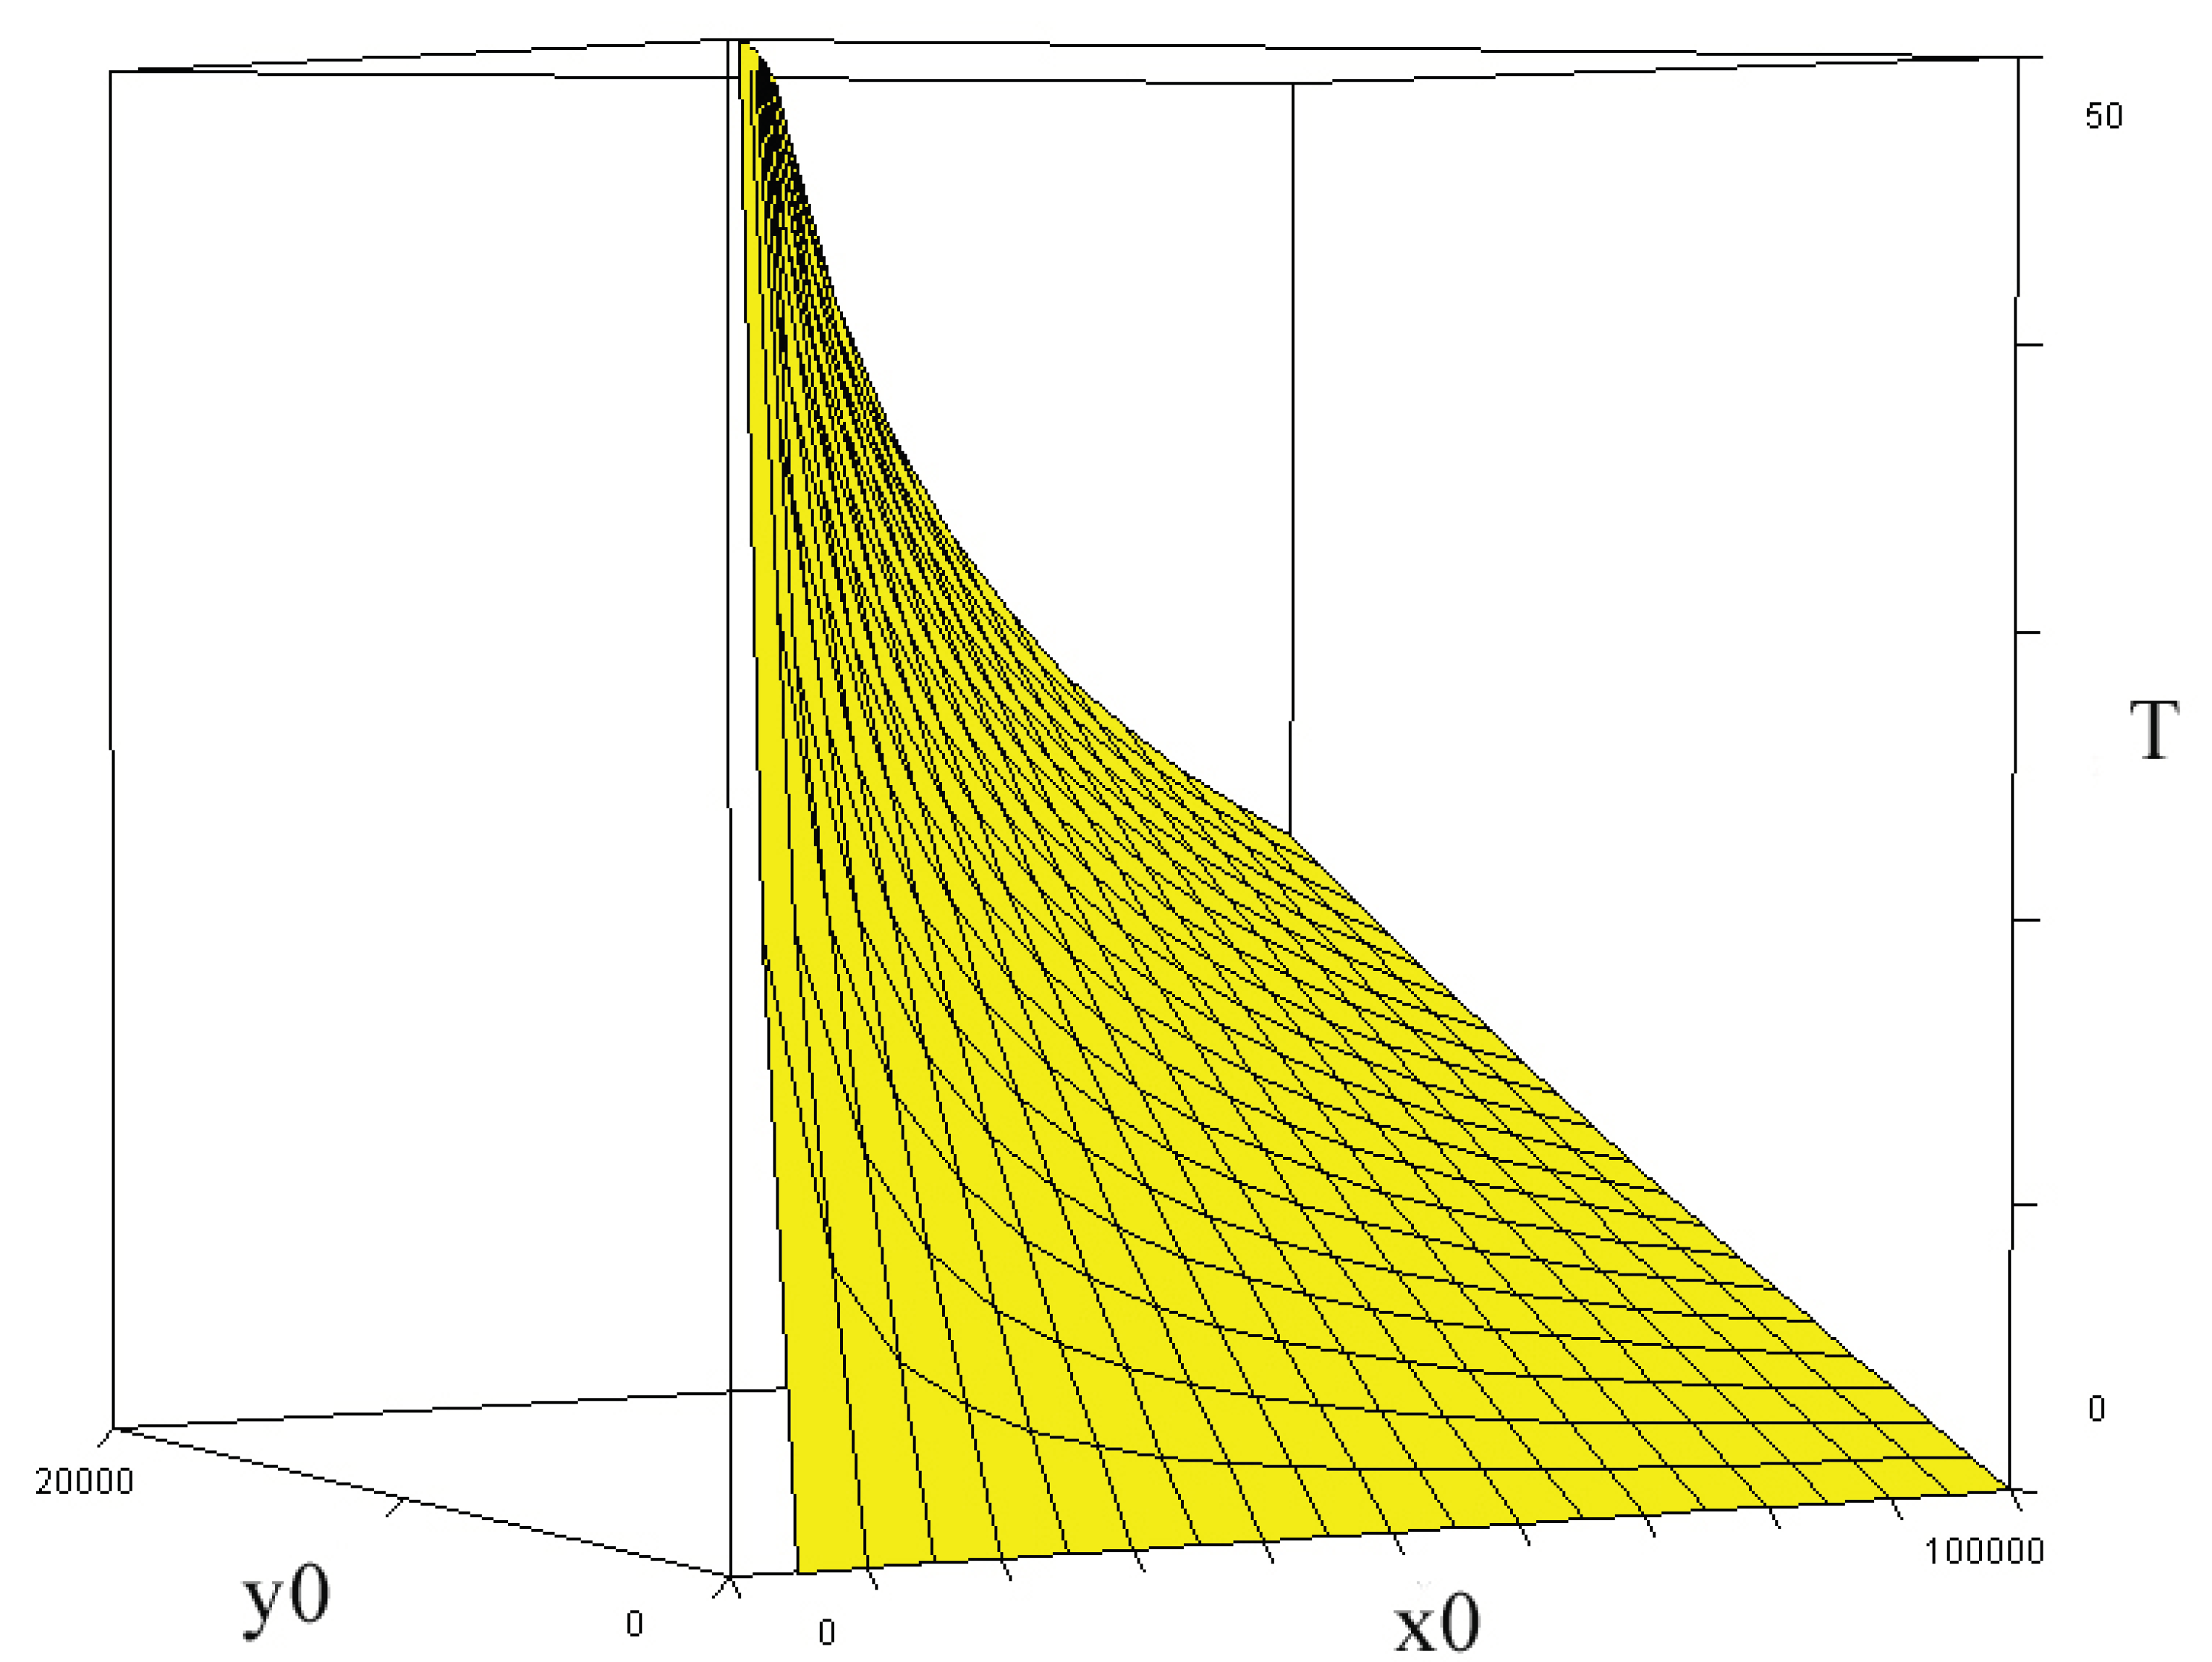
Figure 16.
T(x0, y0). a = 0.05347, b = 0.01045. (Yellow and green). T(x0, y0). a = 0.05347, b = 0.02045. (Purple and turquoise). Compare Equation (51).
Figure 16.
T(x0, y0). a = 0.05347, b = 0.01045. (Yellow and green). T(x0, y0). a = 0.05347, b = 0.02045. (Purple and turquoise). Compare Equation (51).
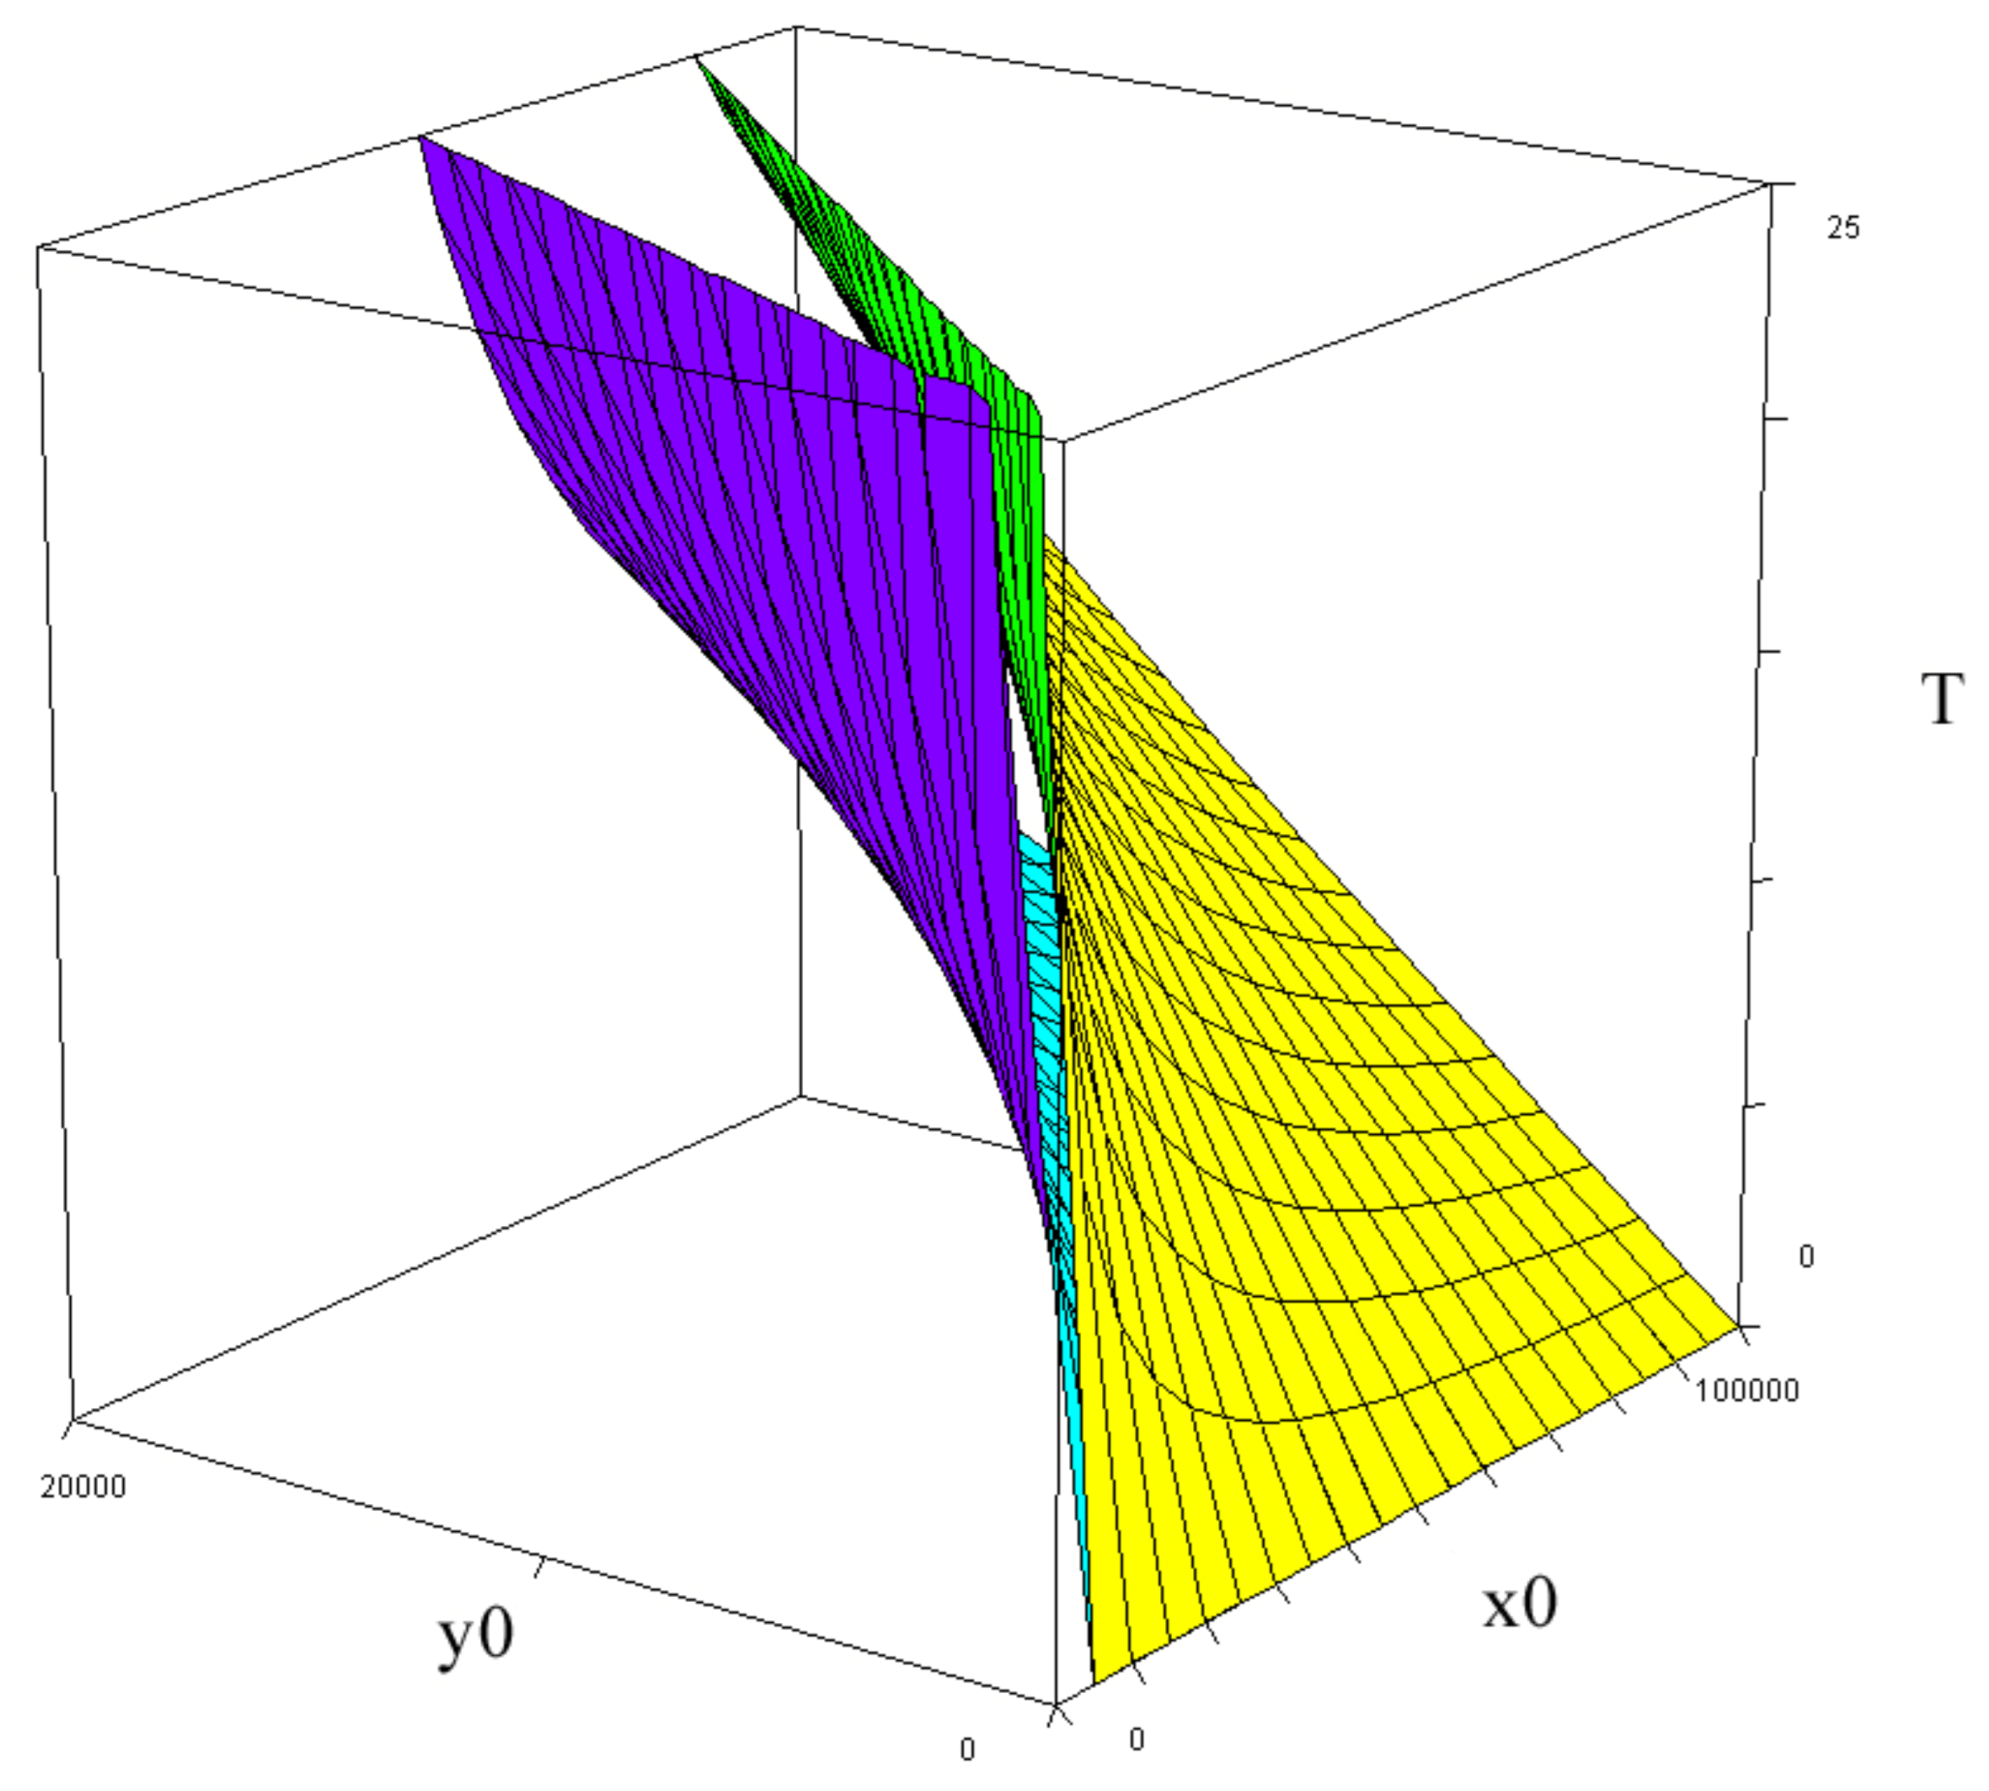
Figure 17.
xT(x0,y0). a = 0.05347, b = 0.01045. Compare Equation (83).
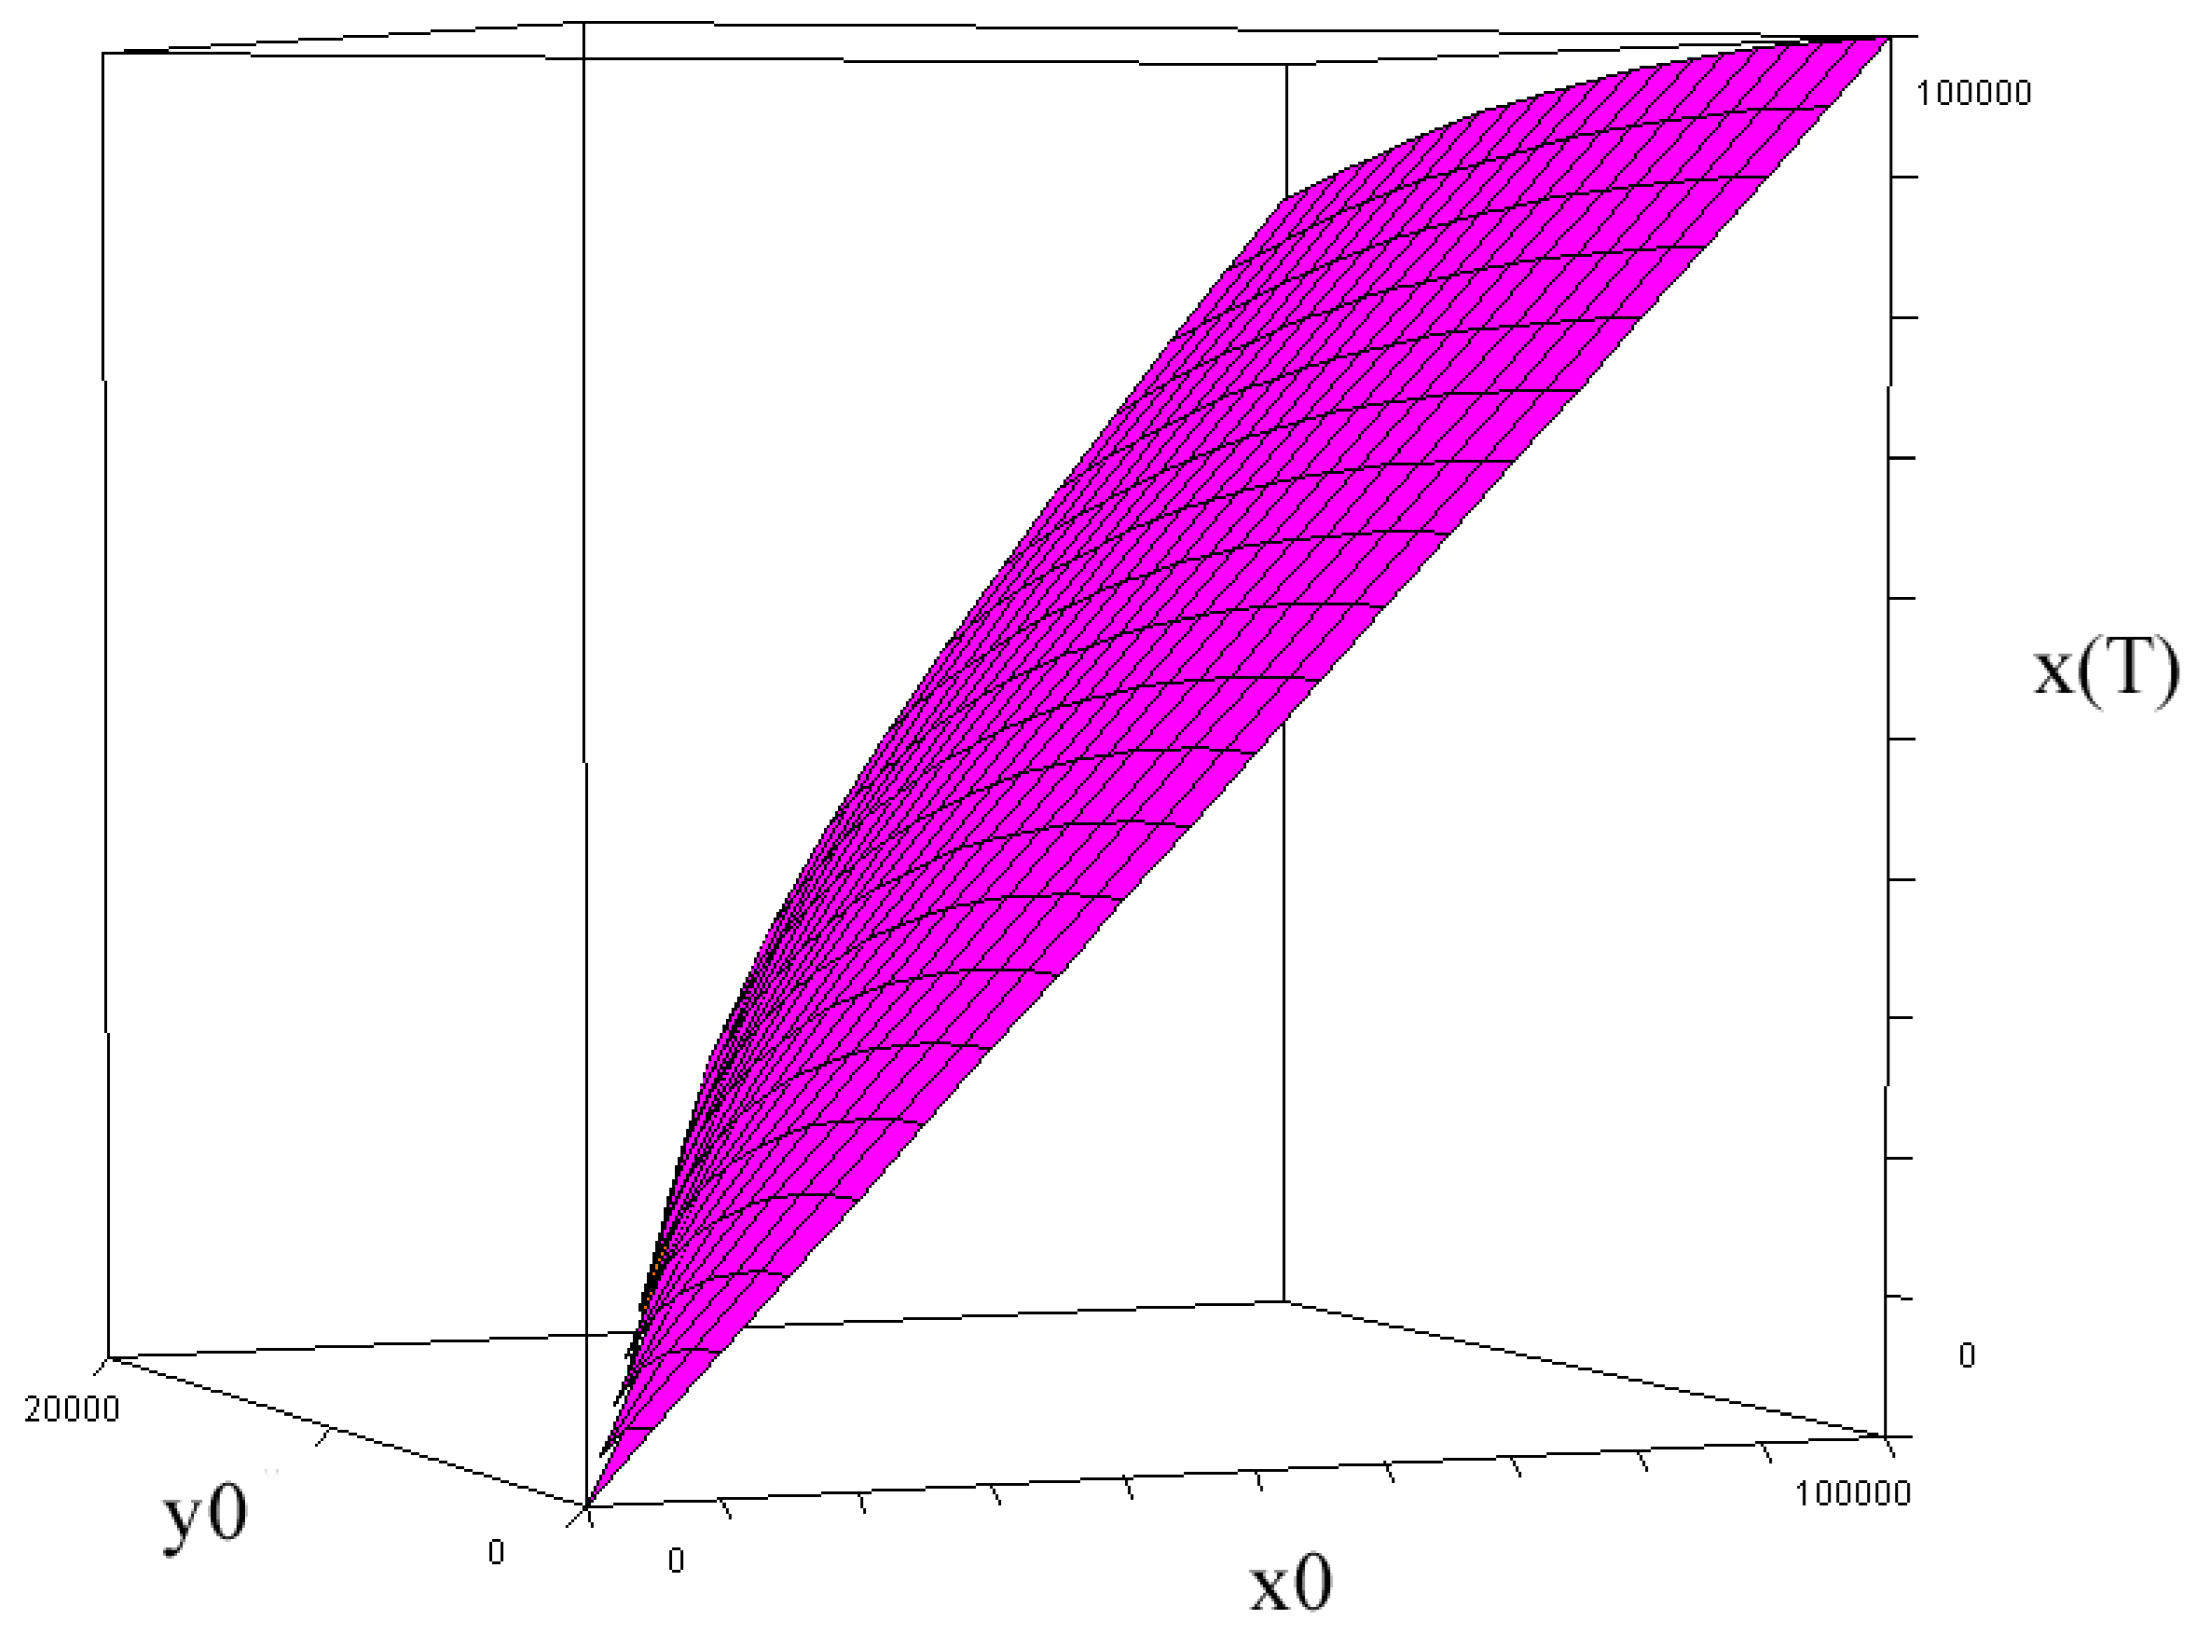
Figure 20.
The objective function in Equation (104), as a function of the initial sizes of the two forces. Parameters: C(x0) = 1000 + 1x0, G = 200000, cT = 730 and cxT =2. a = 0.05347, b = 0.01045. The graph illustrates that the optimal value of x0 is an increasing function of y0. Furthermore, the optimal value of the objective function of the commander of force x, is a decreasing function of the initial size of the force y. Clearly, if the value y0 would have a much larger value than 20000, as illustrated in the graph, the maximum of the objective function value, would be strictly negative. Then, the optimal decision of the commander of the x forces would be not to participate in the battle at all.
Figure 20.
The objective function in Equation (104), as a function of the initial sizes of the two forces. Parameters: C(x0) = 1000 + 1x0, G = 200000, cT = 730 and cxT =2. a = 0.05347, b = 0.01045. The graph illustrates that the optimal value of x0 is an increasing function of y0. Furthermore, the optimal value of the objective function of the commander of force x, is a decreasing function of the initial size of the force y. Clearly, if the value y0 would have a much larger value than 20000, as illustrated in the graph, the maximum of the objective function value, would be strictly negative. Then, the optimal decision of the commander of the x forces would be not to participate in the battle at all.
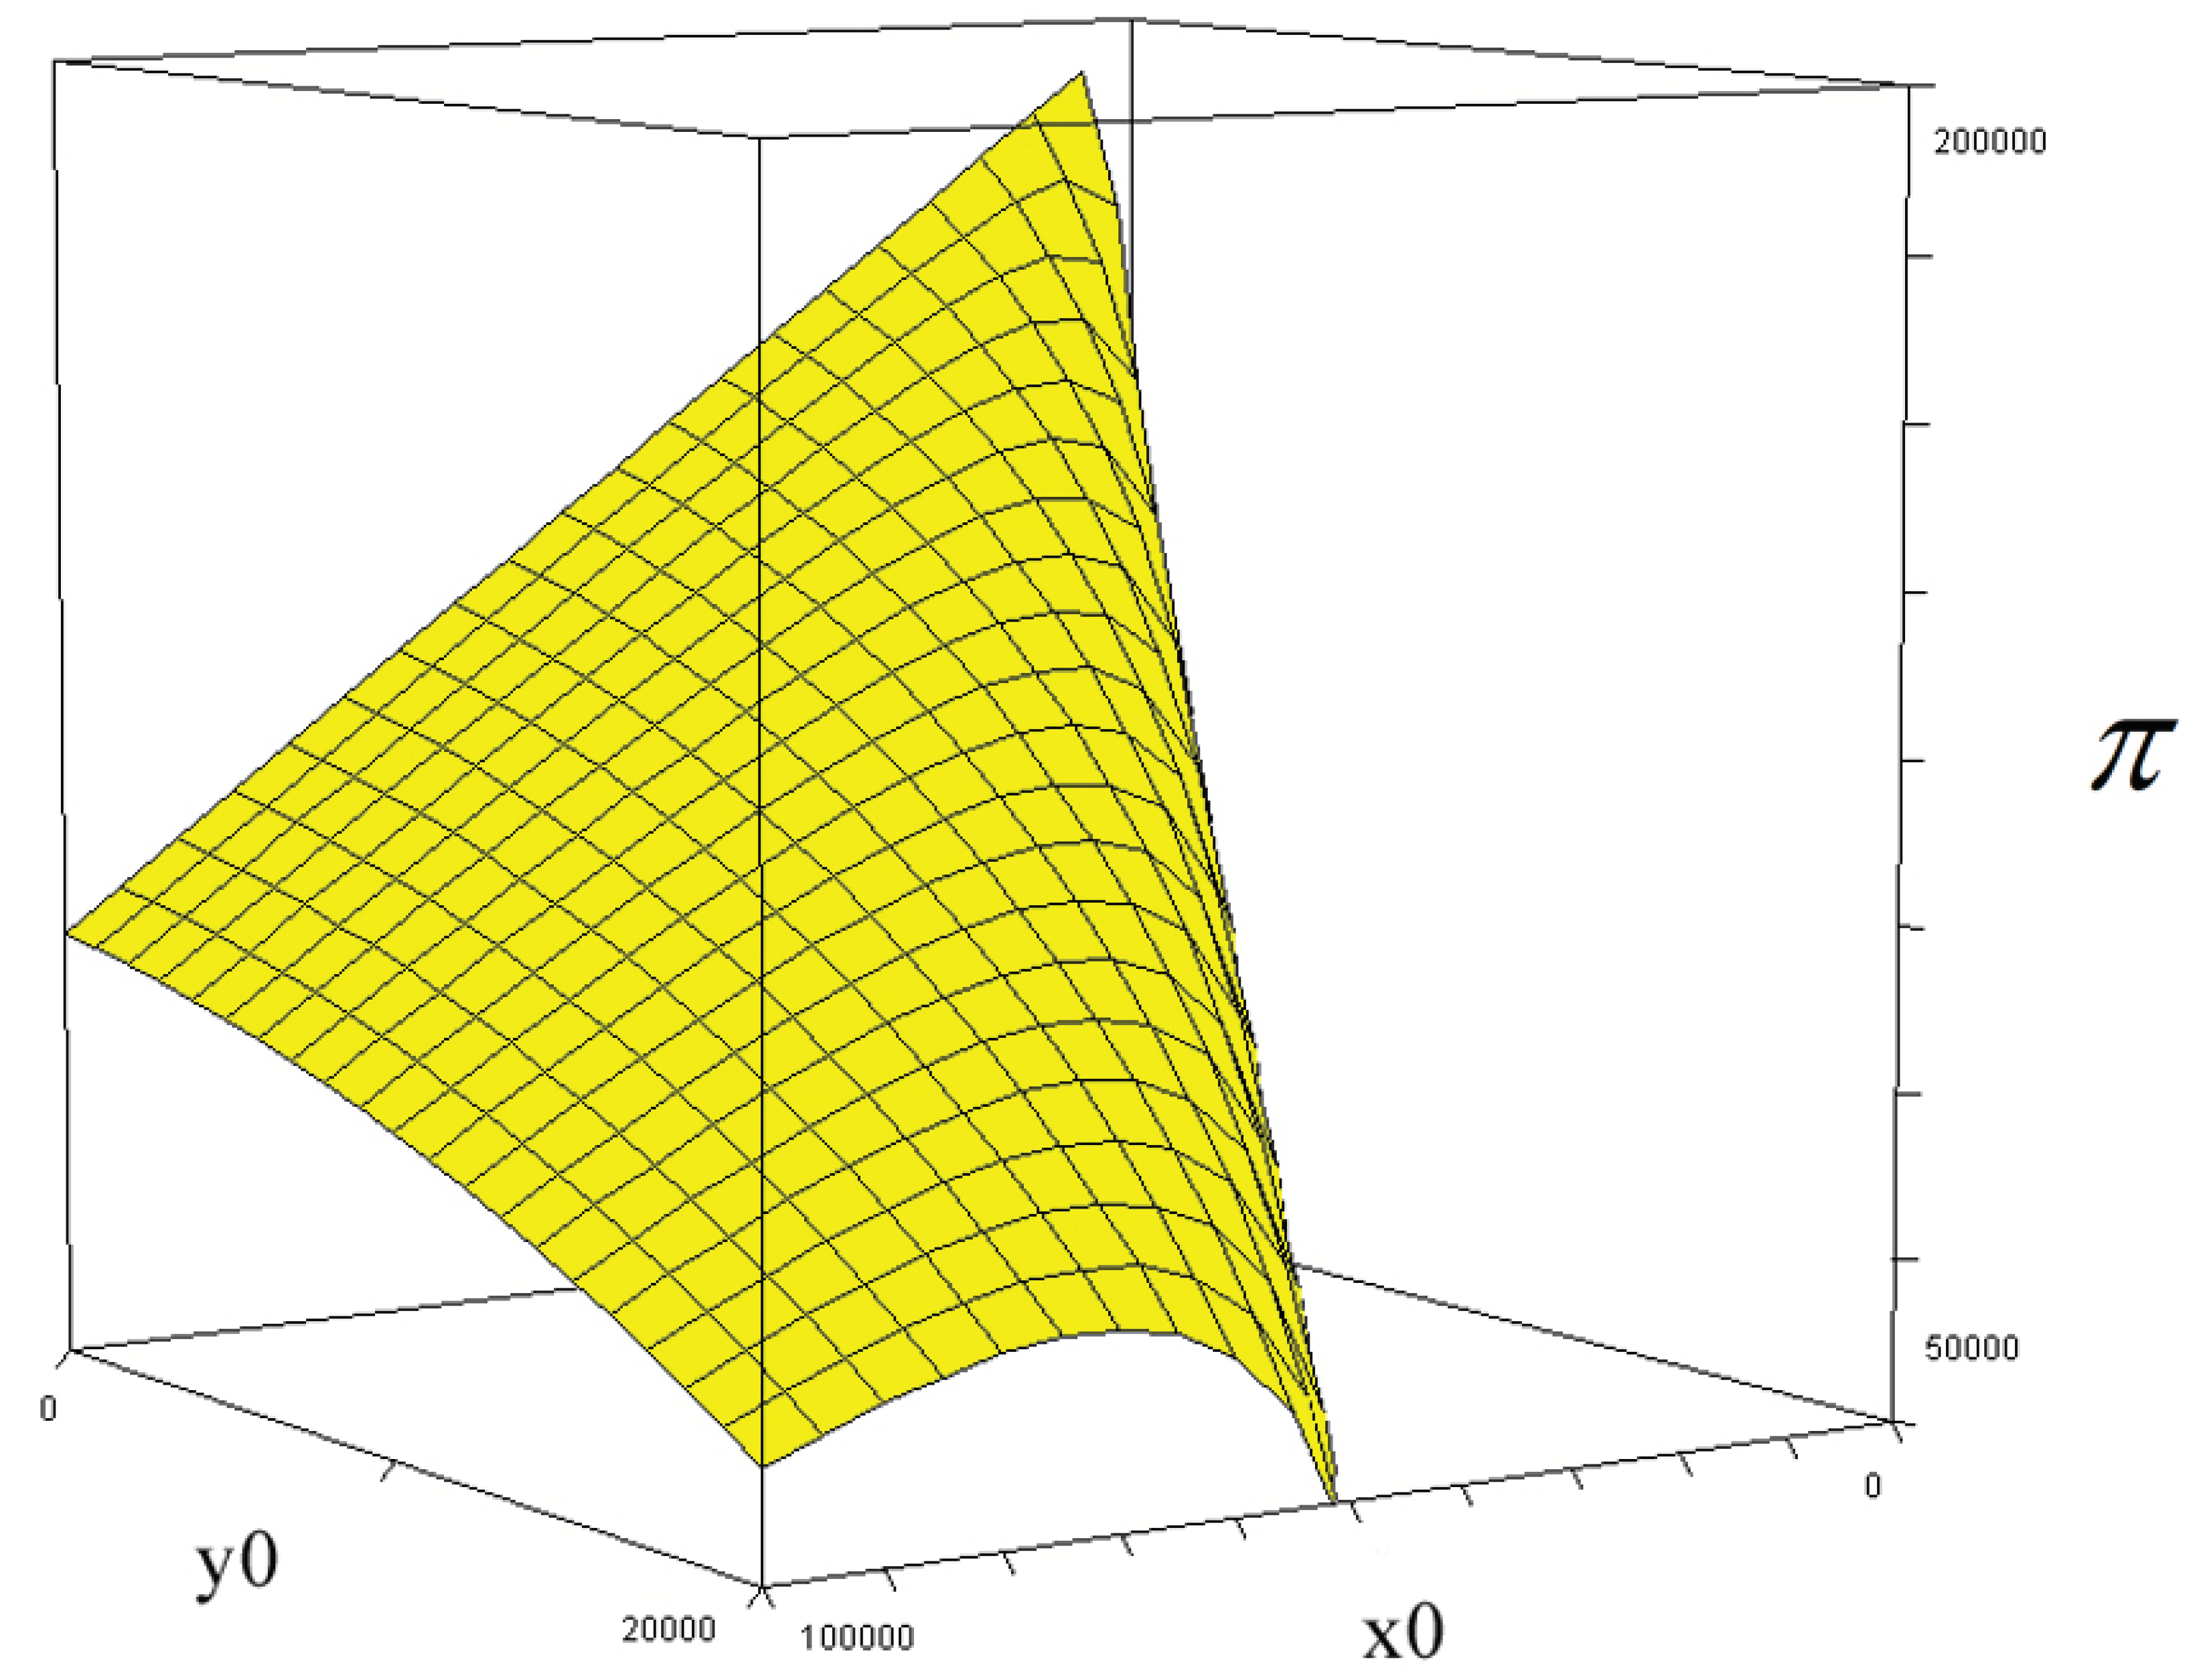
Figure 21.
The objective function in Equation (104), as a function of the initial sizes of the two forces, with alternative values of the attrition coefficient “b”. Attrition coefficients: Yellow: a = 0.05347, b = 0.01045, Turquoise: a = 0.05347, b = 0.02045. Other functions and parameters: C(x) = 1000 + 1x, G = 200000, cT = 730 and cxT =2. The graph illustrates that the objective function value of the commander of the x forces is an increasing function of the attrition coefficient b, and that the optimal number of units x to send to the battle field is a decreasing function of b, for all possible sizes of the enemy force, if the optimal decision x0 is strictly positive.
Figure 21.
The objective function in Equation (104), as a function of the initial sizes of the two forces, with alternative values of the attrition coefficient “b”. Attrition coefficients: Yellow: a = 0.05347, b = 0.01045, Turquoise: a = 0.05347, b = 0.02045. Other functions and parameters: C(x) = 1000 + 1x, G = 200000, cT = 730 and cxT =2. The graph illustrates that the objective function value of the commander of the x forces is an increasing function of the attrition coefficient b, and that the optimal number of units x to send to the battle field is a decreasing function of b, for all possible sizes of the enemy force, if the optimal decision x0 is strictly positive.
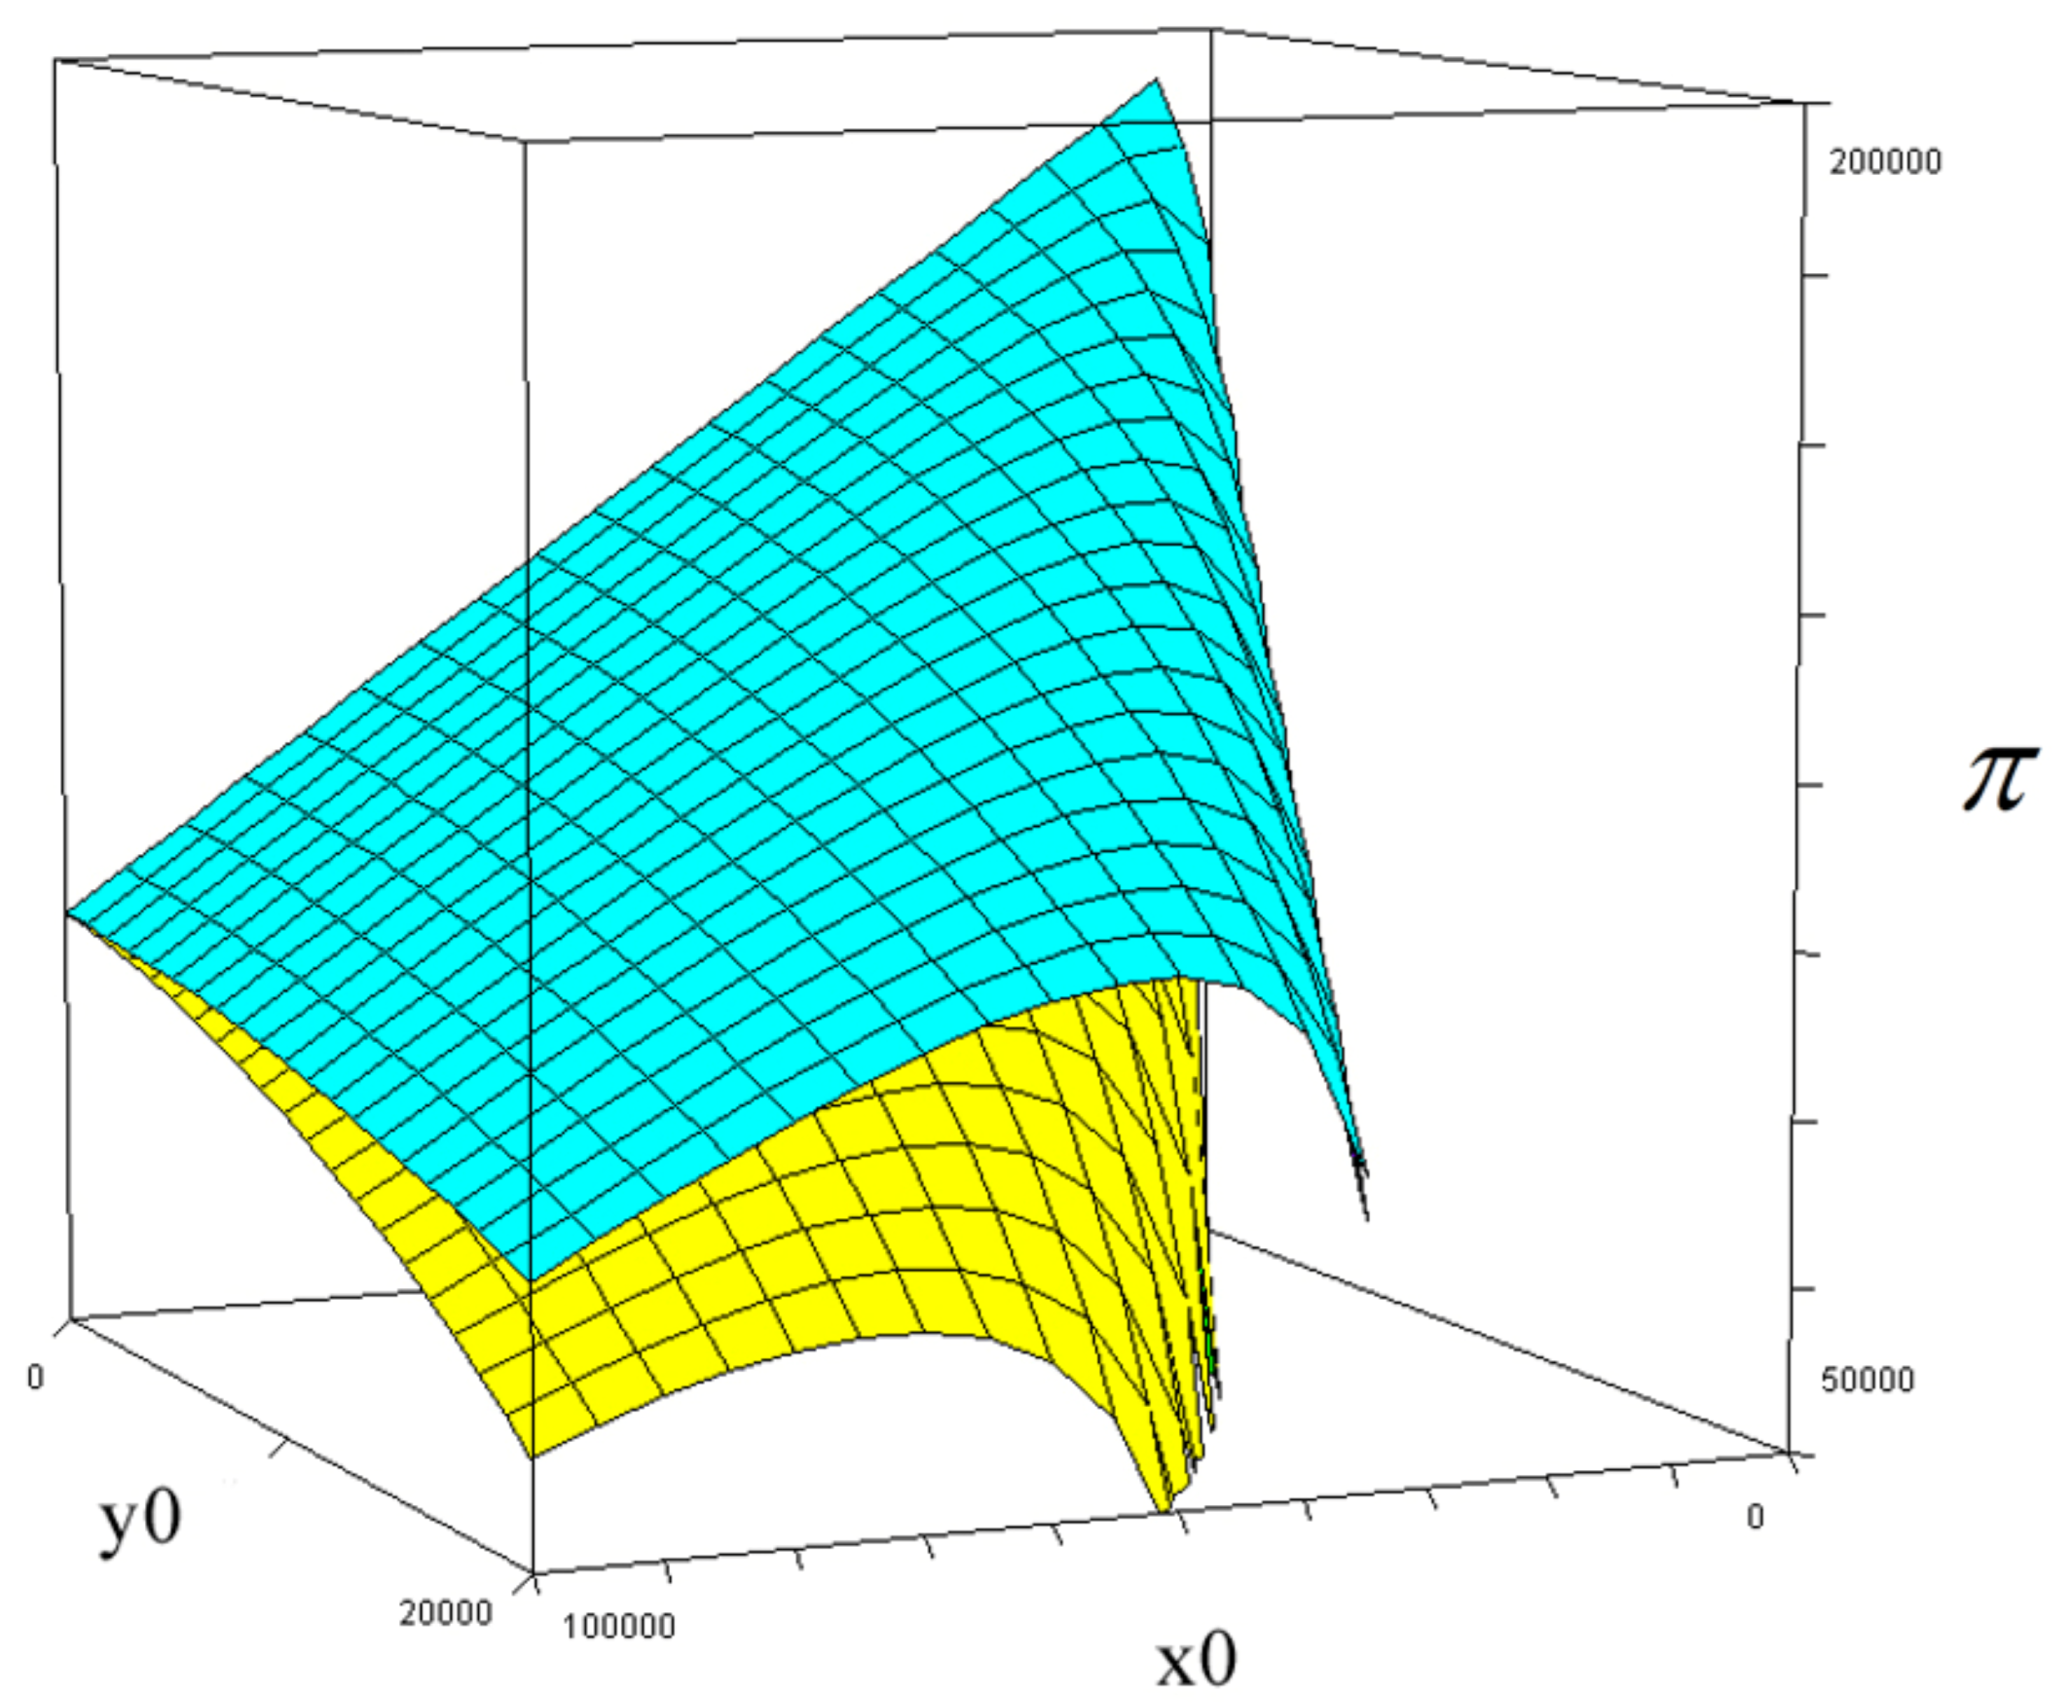
Figure 22.
The optimal values of x0, according to Numerical model 1, in alternative cases.
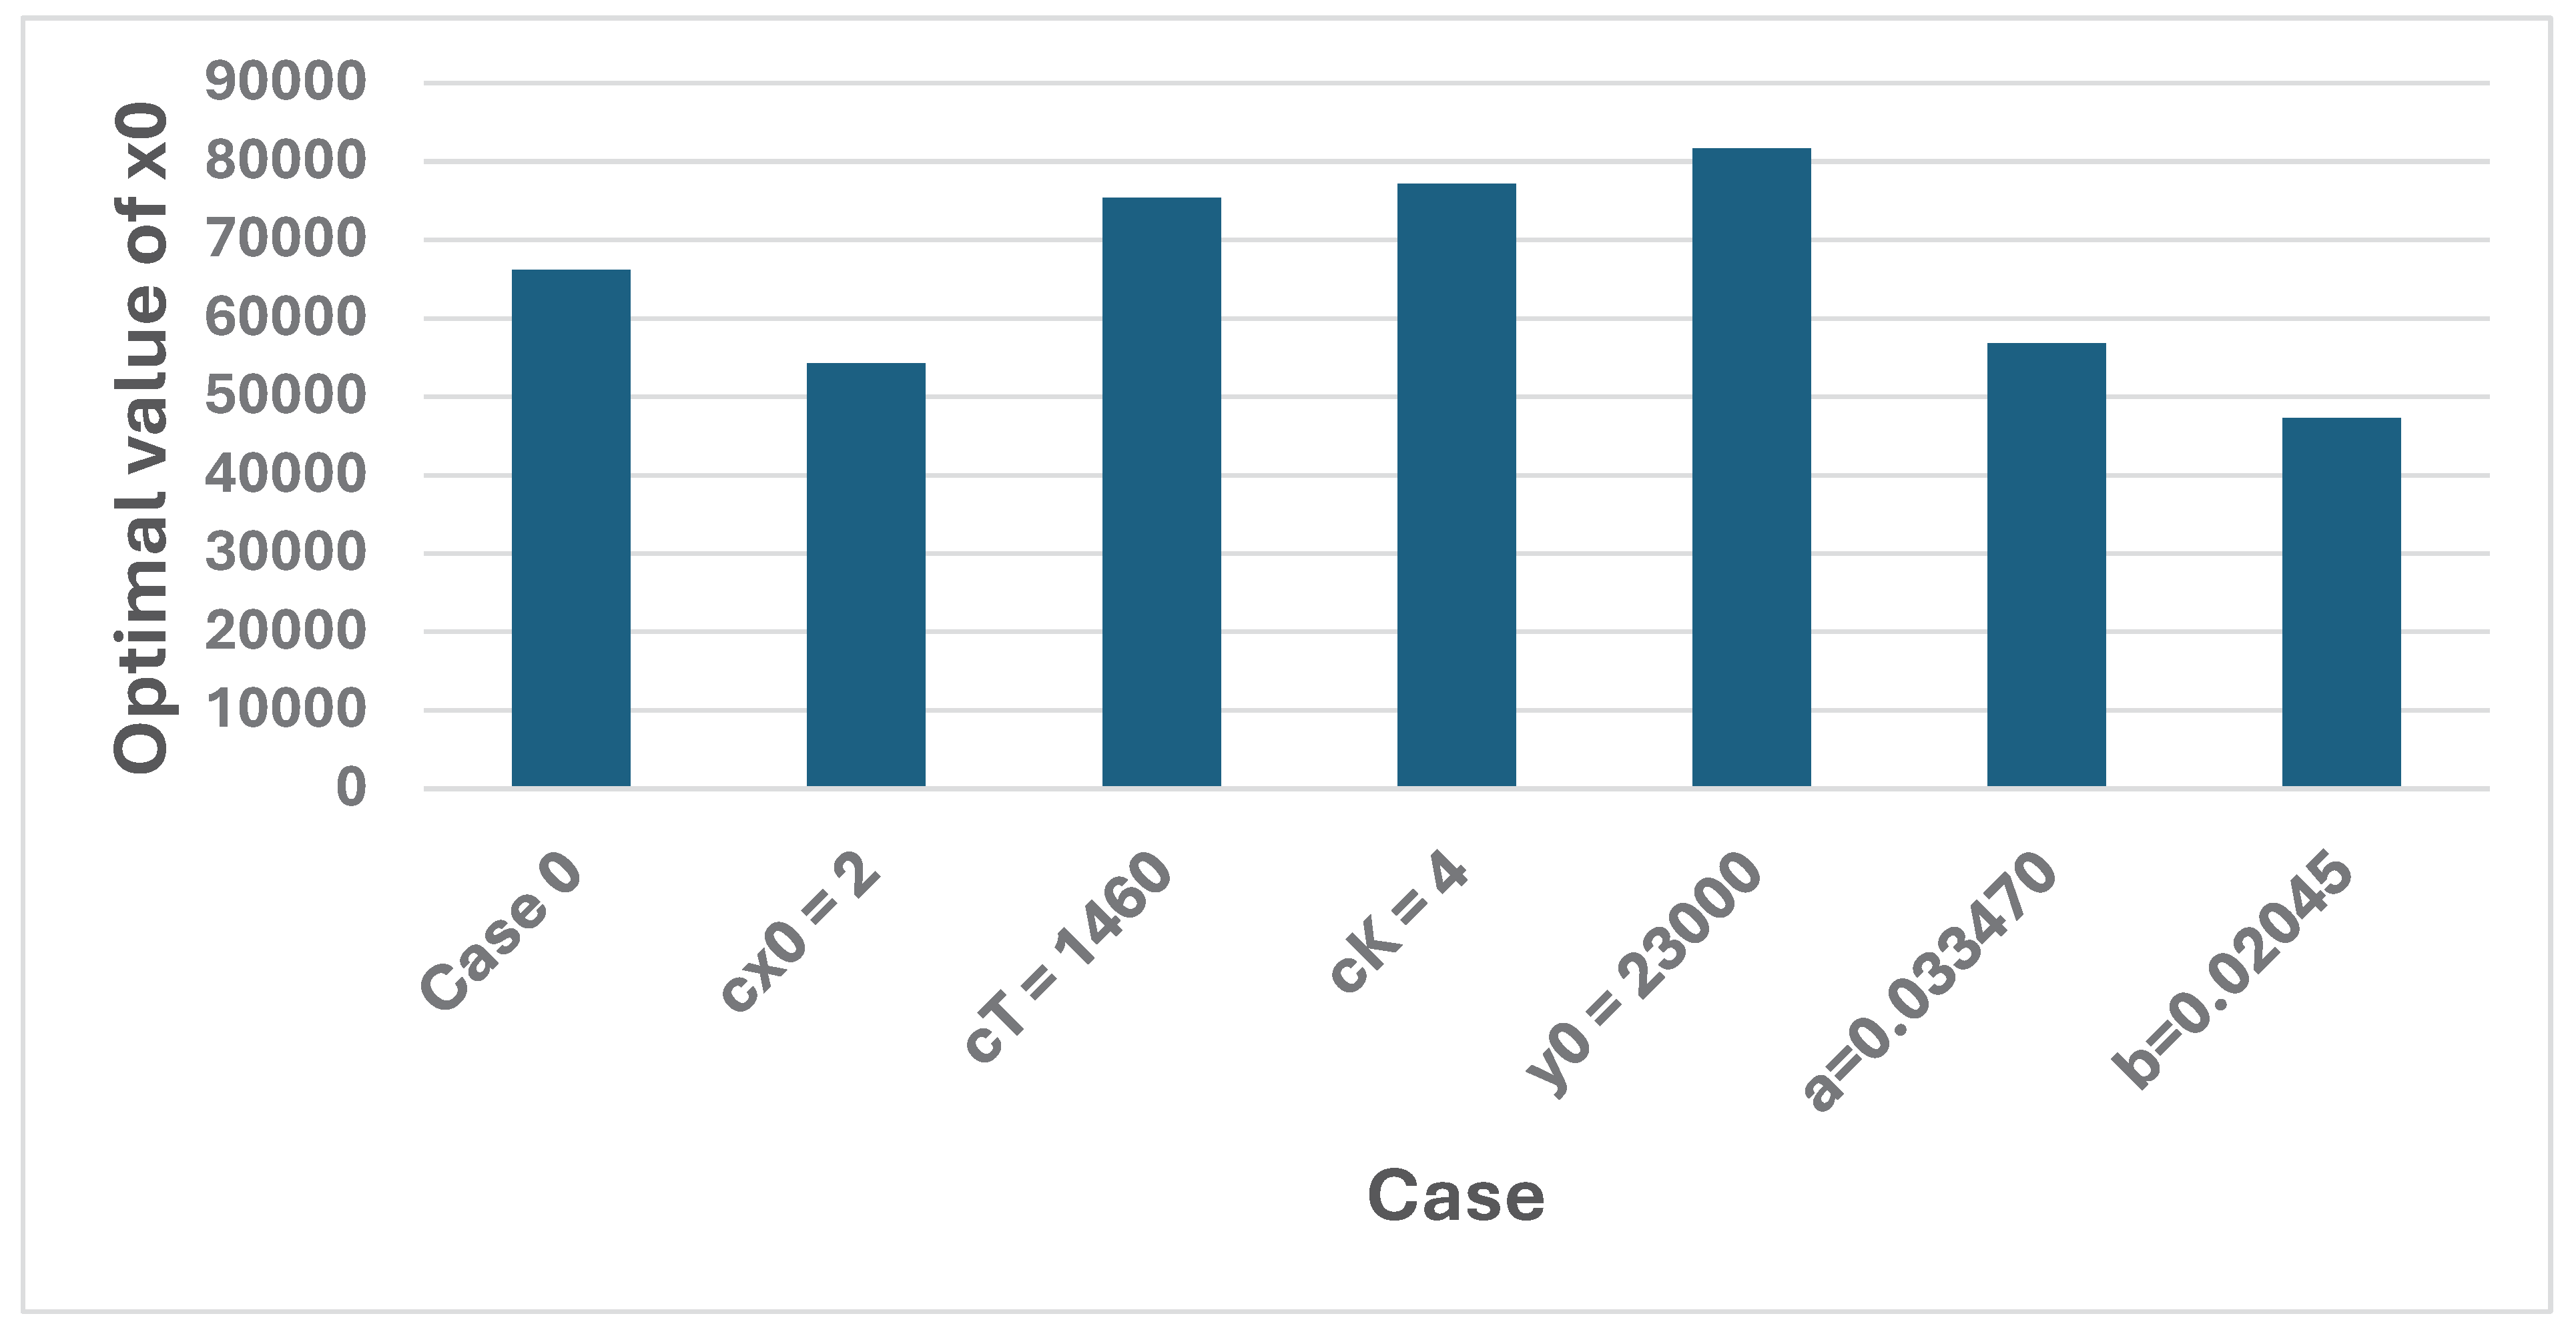
Figure 23.
The optimal values of T, the day of the victory, according to Numerical model 1, in alternative cases.
Figure 23.
The optimal values of T, the day of the victory, according to Numerical model 1, in alternative cases.
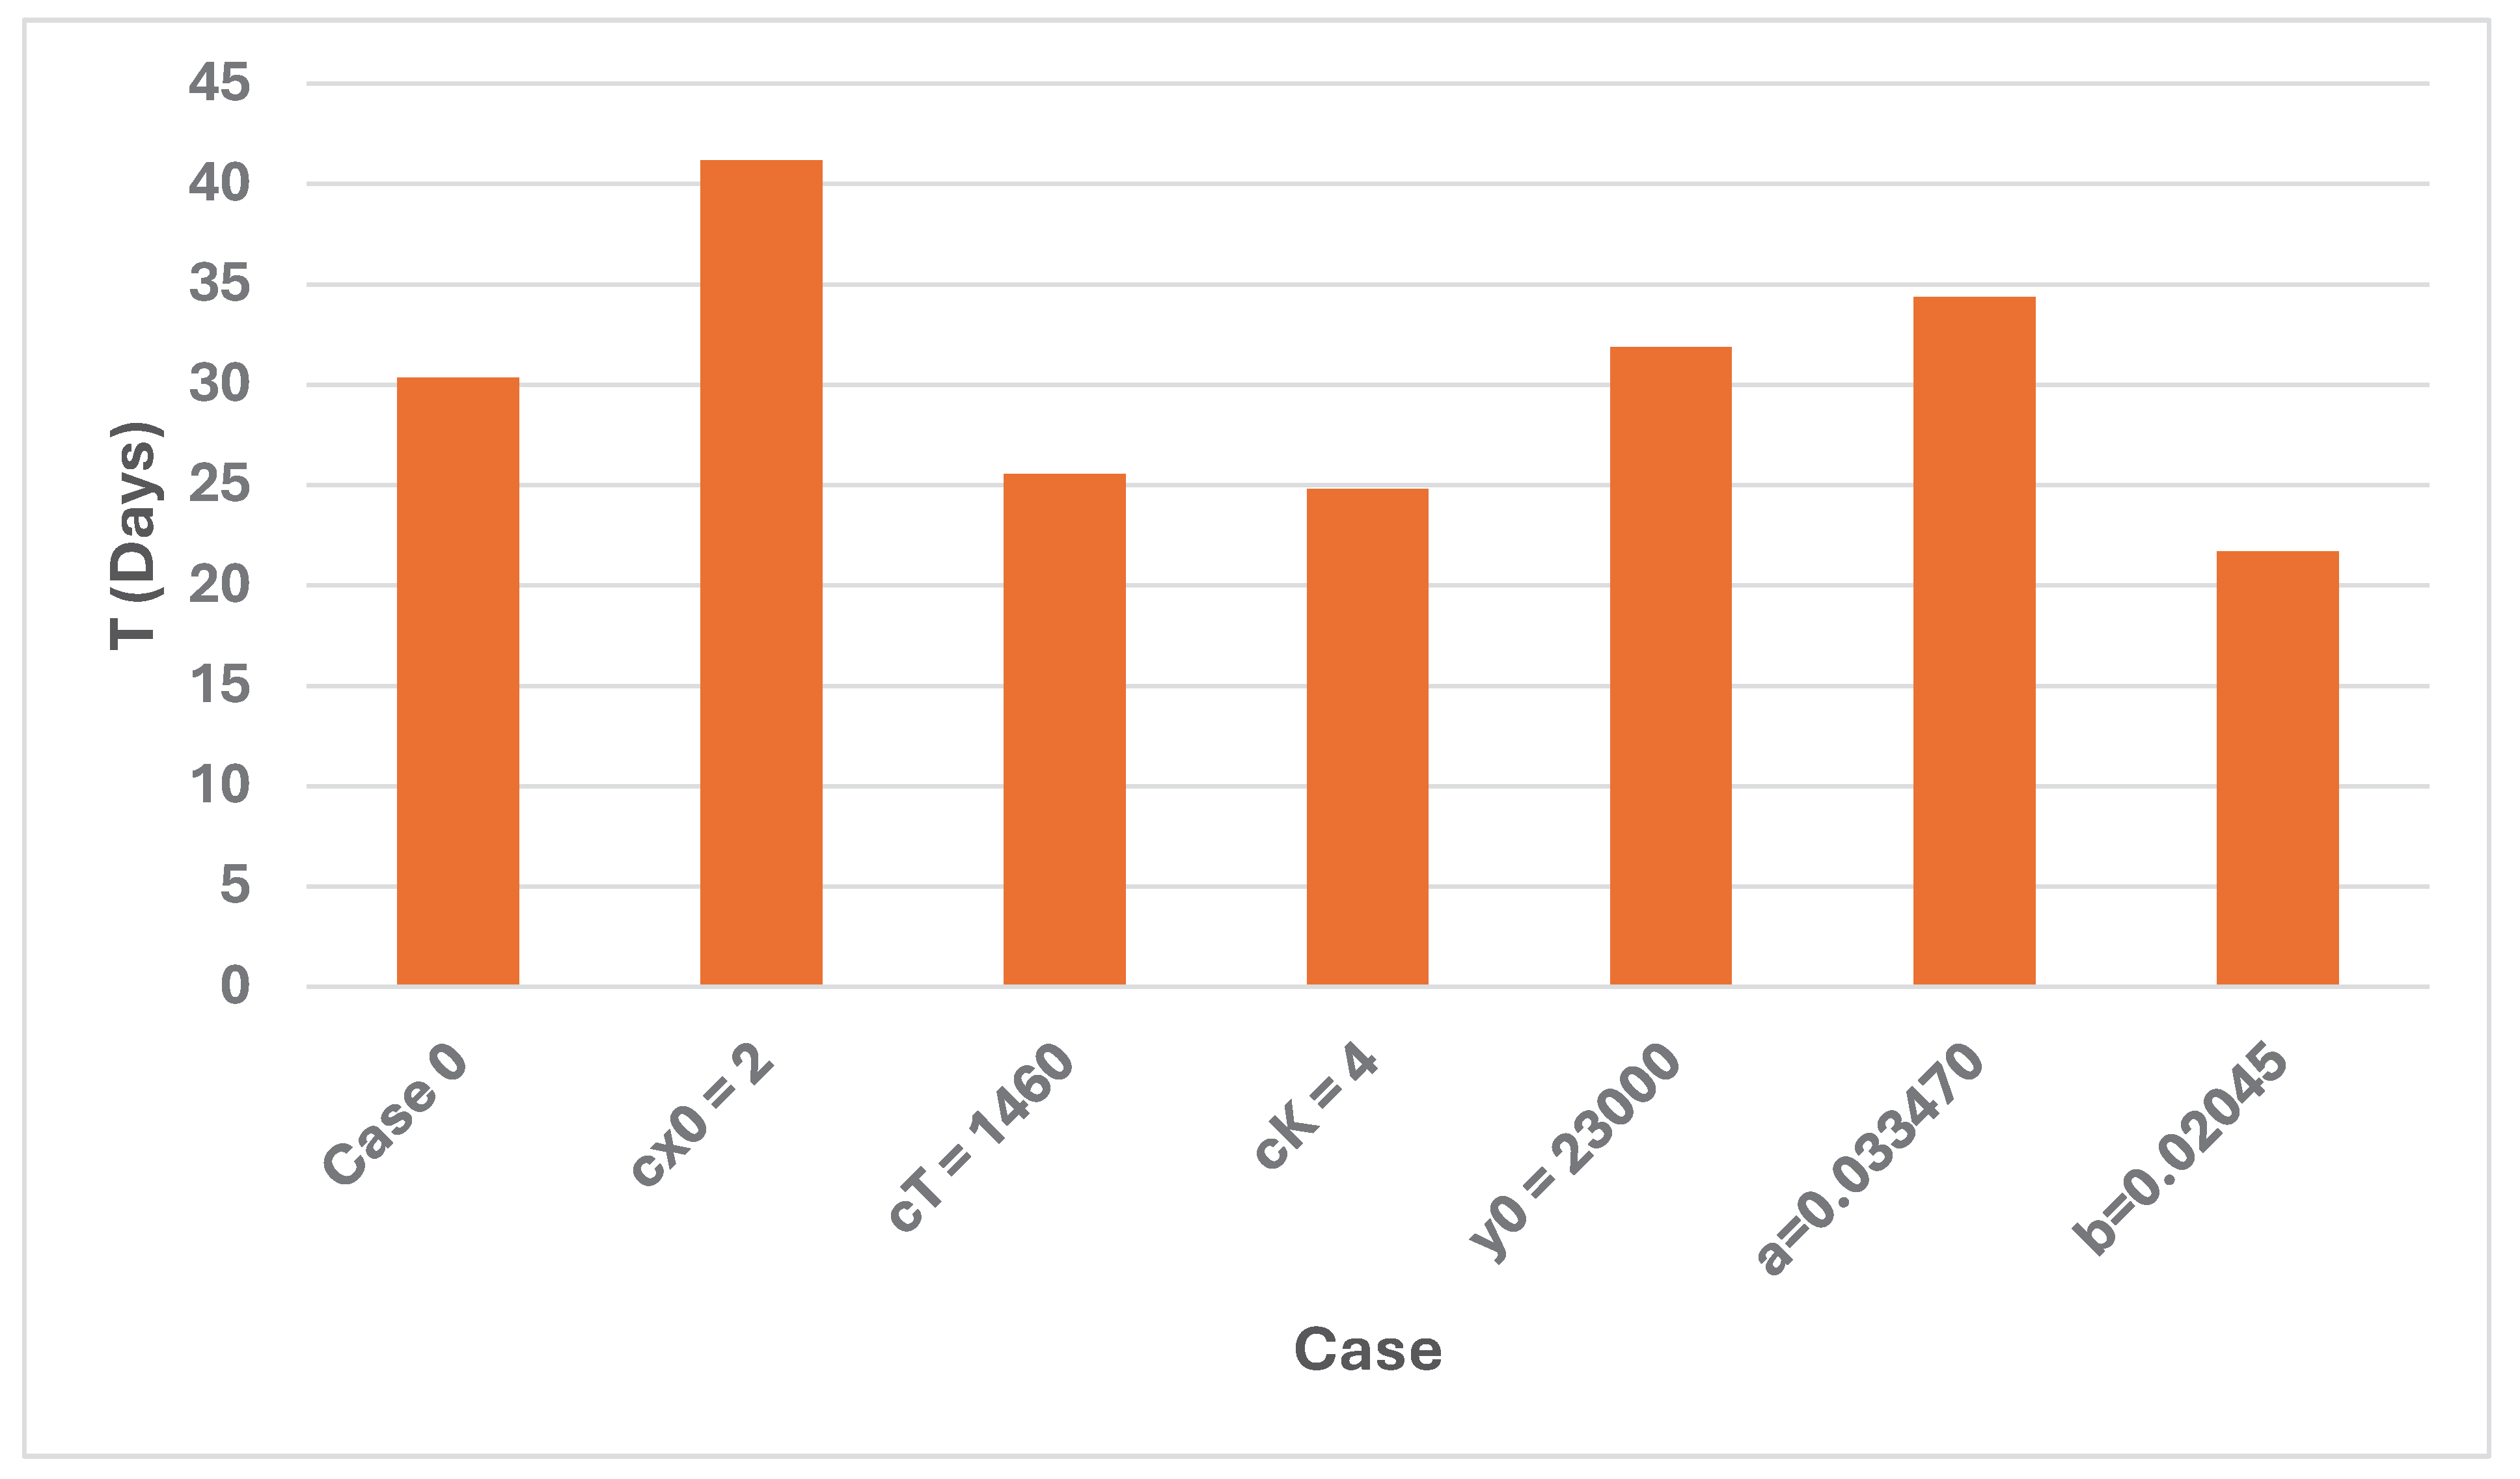
Figure 24.
The optimal values of K, the number of killed and wounded soldiers, according to Numerical model 1, in alternative cases.
Figure 24.
The optimal values of K, the number of killed and wounded soldiers, according to Numerical model 1, in alternative cases.
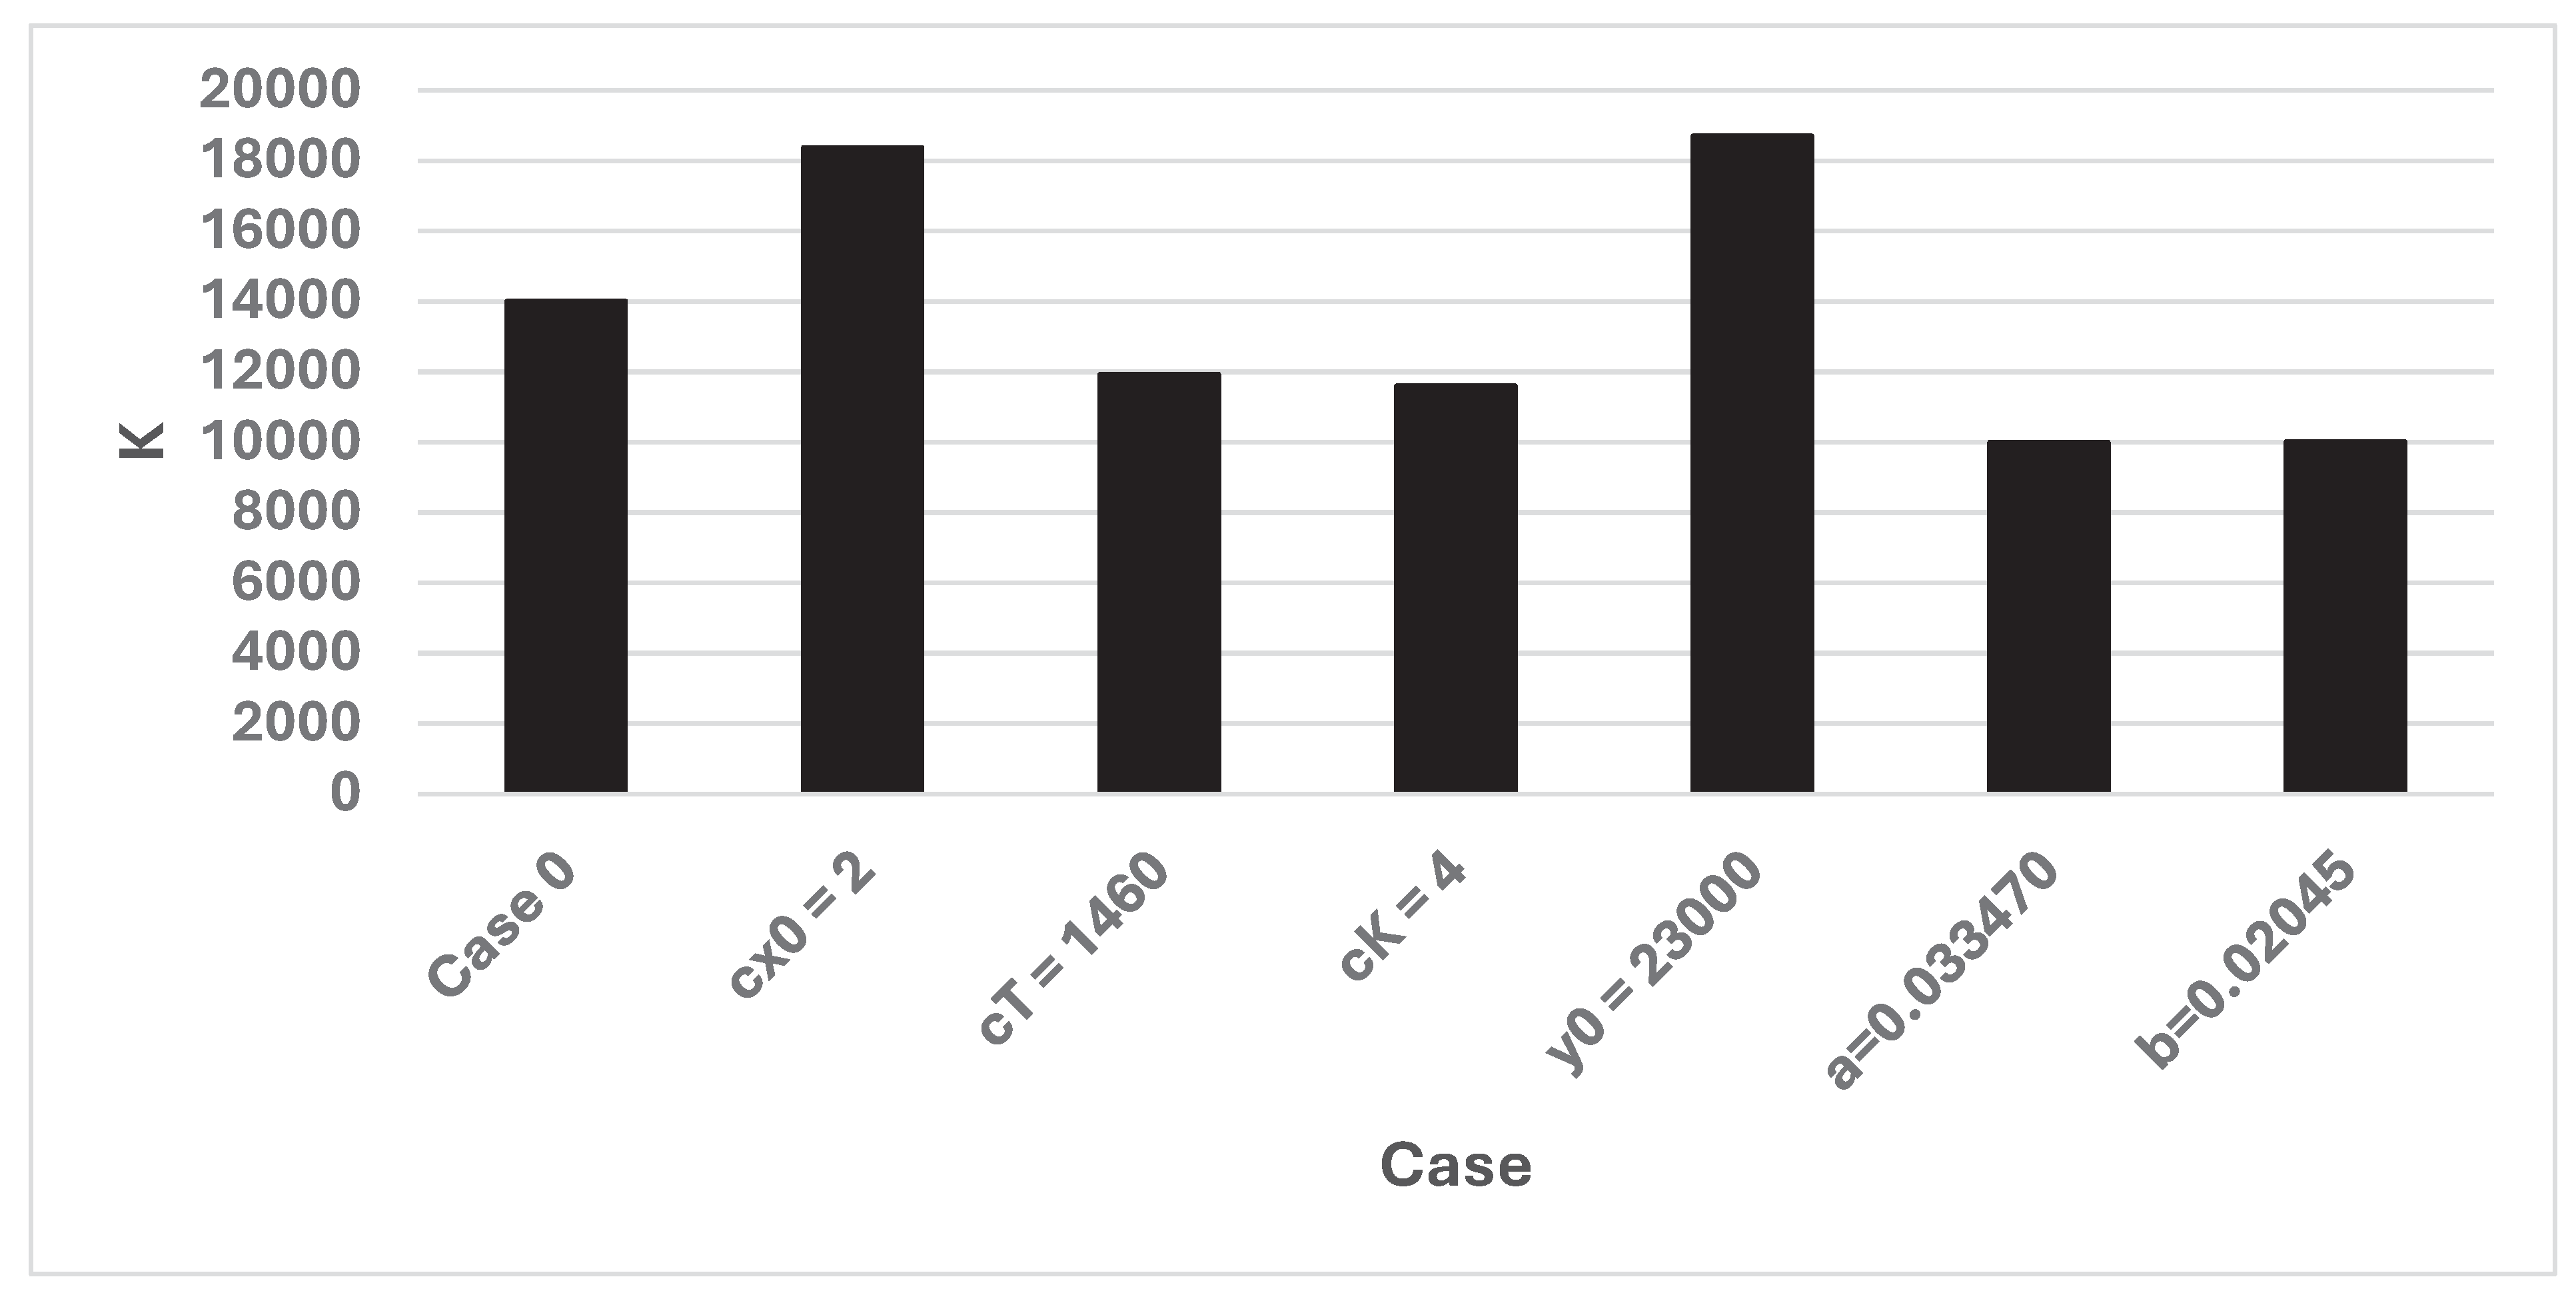
Figure 25.
The optimal values of x0, according to Numerical model 2, in alternative cases.
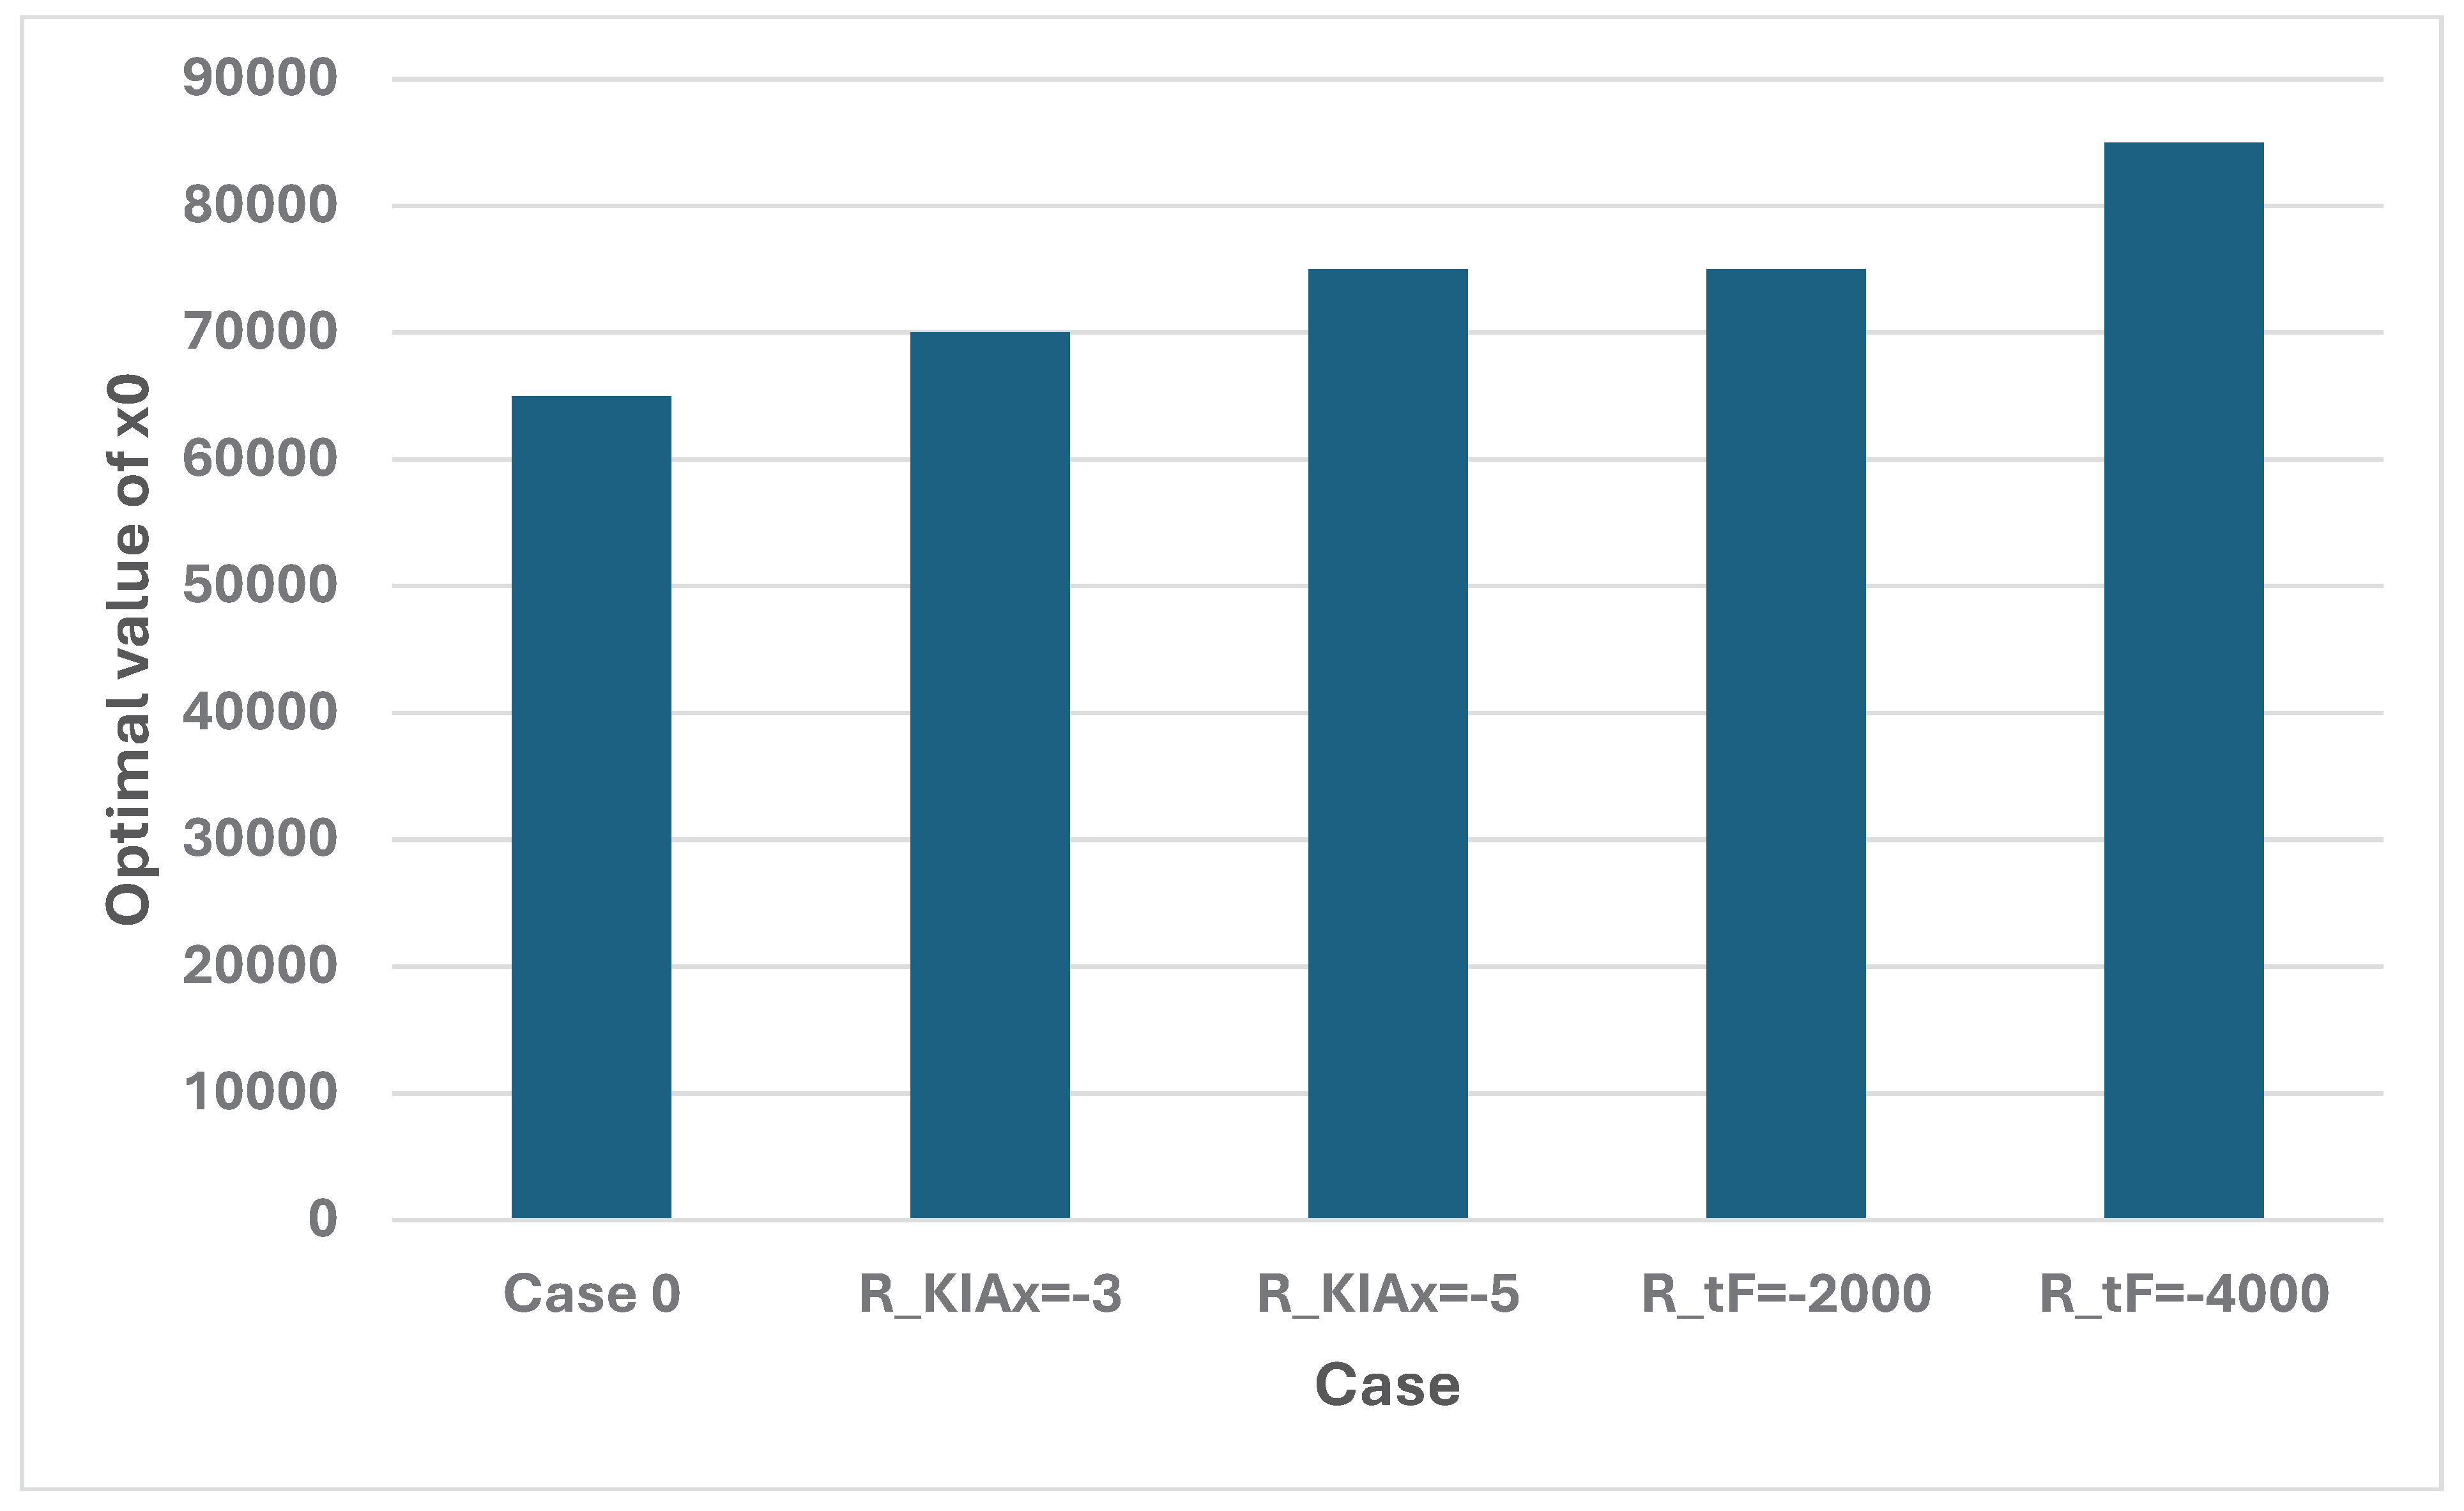
Figure 26.
The optimal expected values of E(T), the day of the victory, according to Numerical model 2, in alternative cases.
Figure 26.
The optimal expected values of E(T), the day of the victory, according to Numerical model 2, in alternative cases.
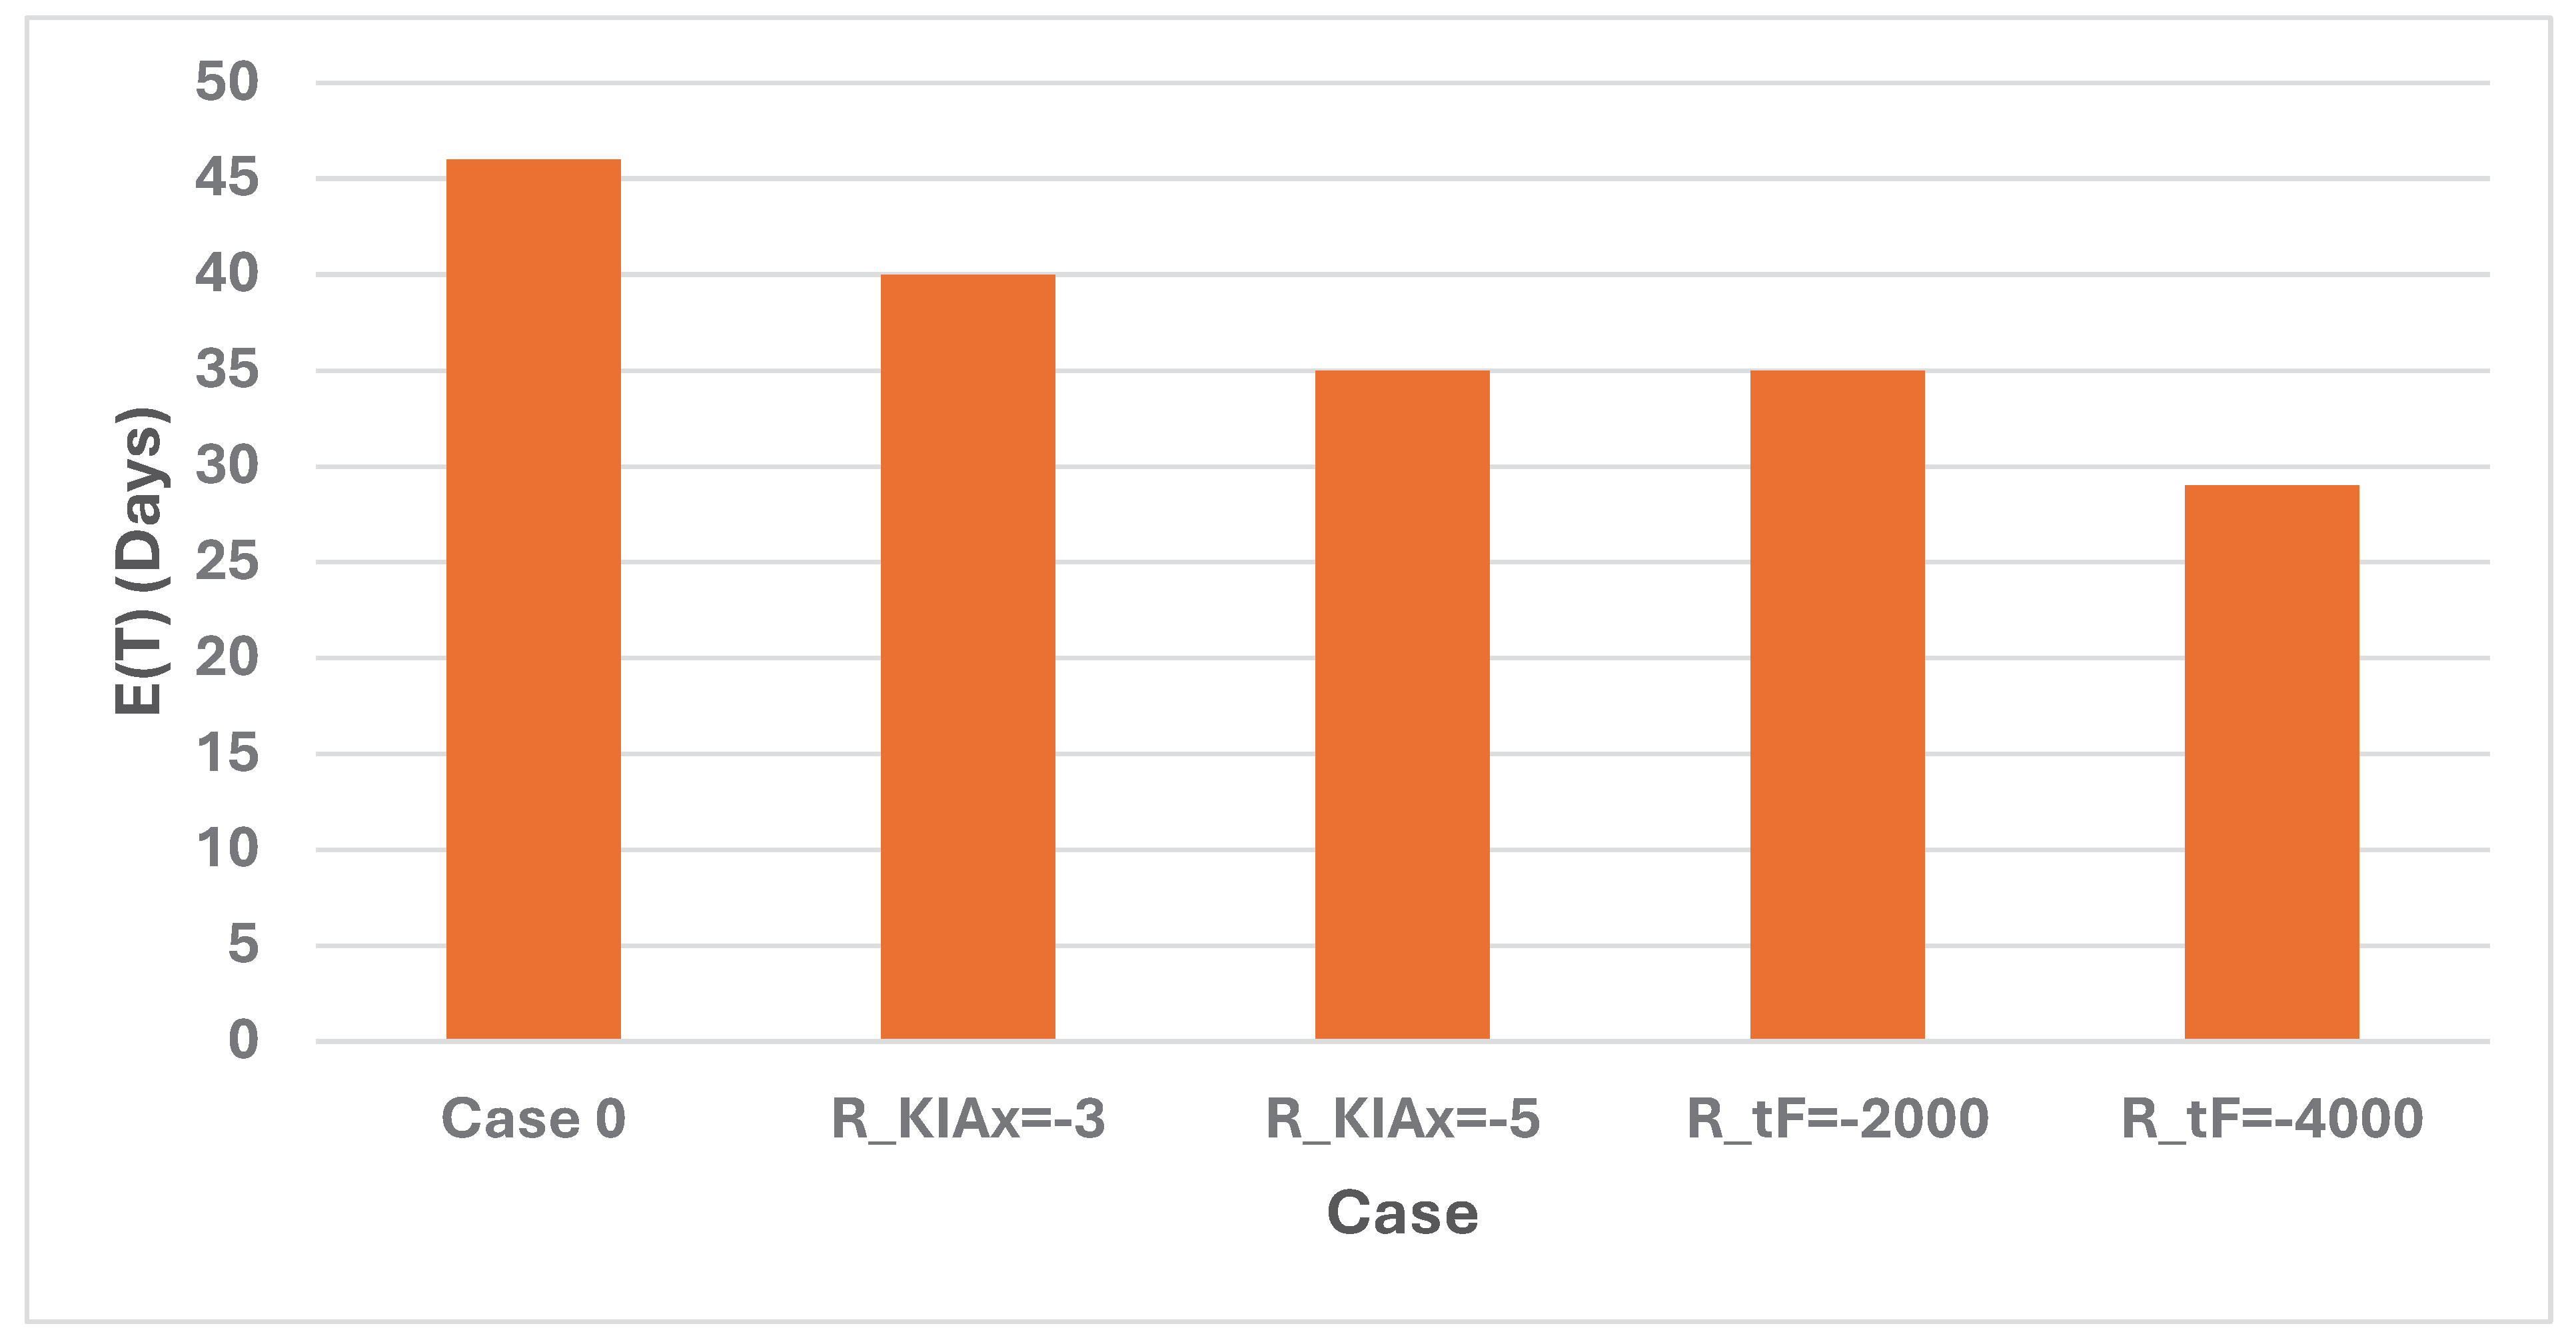
Figure 27.
The optimal expected values of K, (= KIAx), the number of killed and wounded soldiers, according to Numerical model 2, in alternative cases.
Figure 27.
The optimal expected values of K, (= KIAx), the number of killed and wounded soldiers, according to Numerical model 2, in alternative cases.
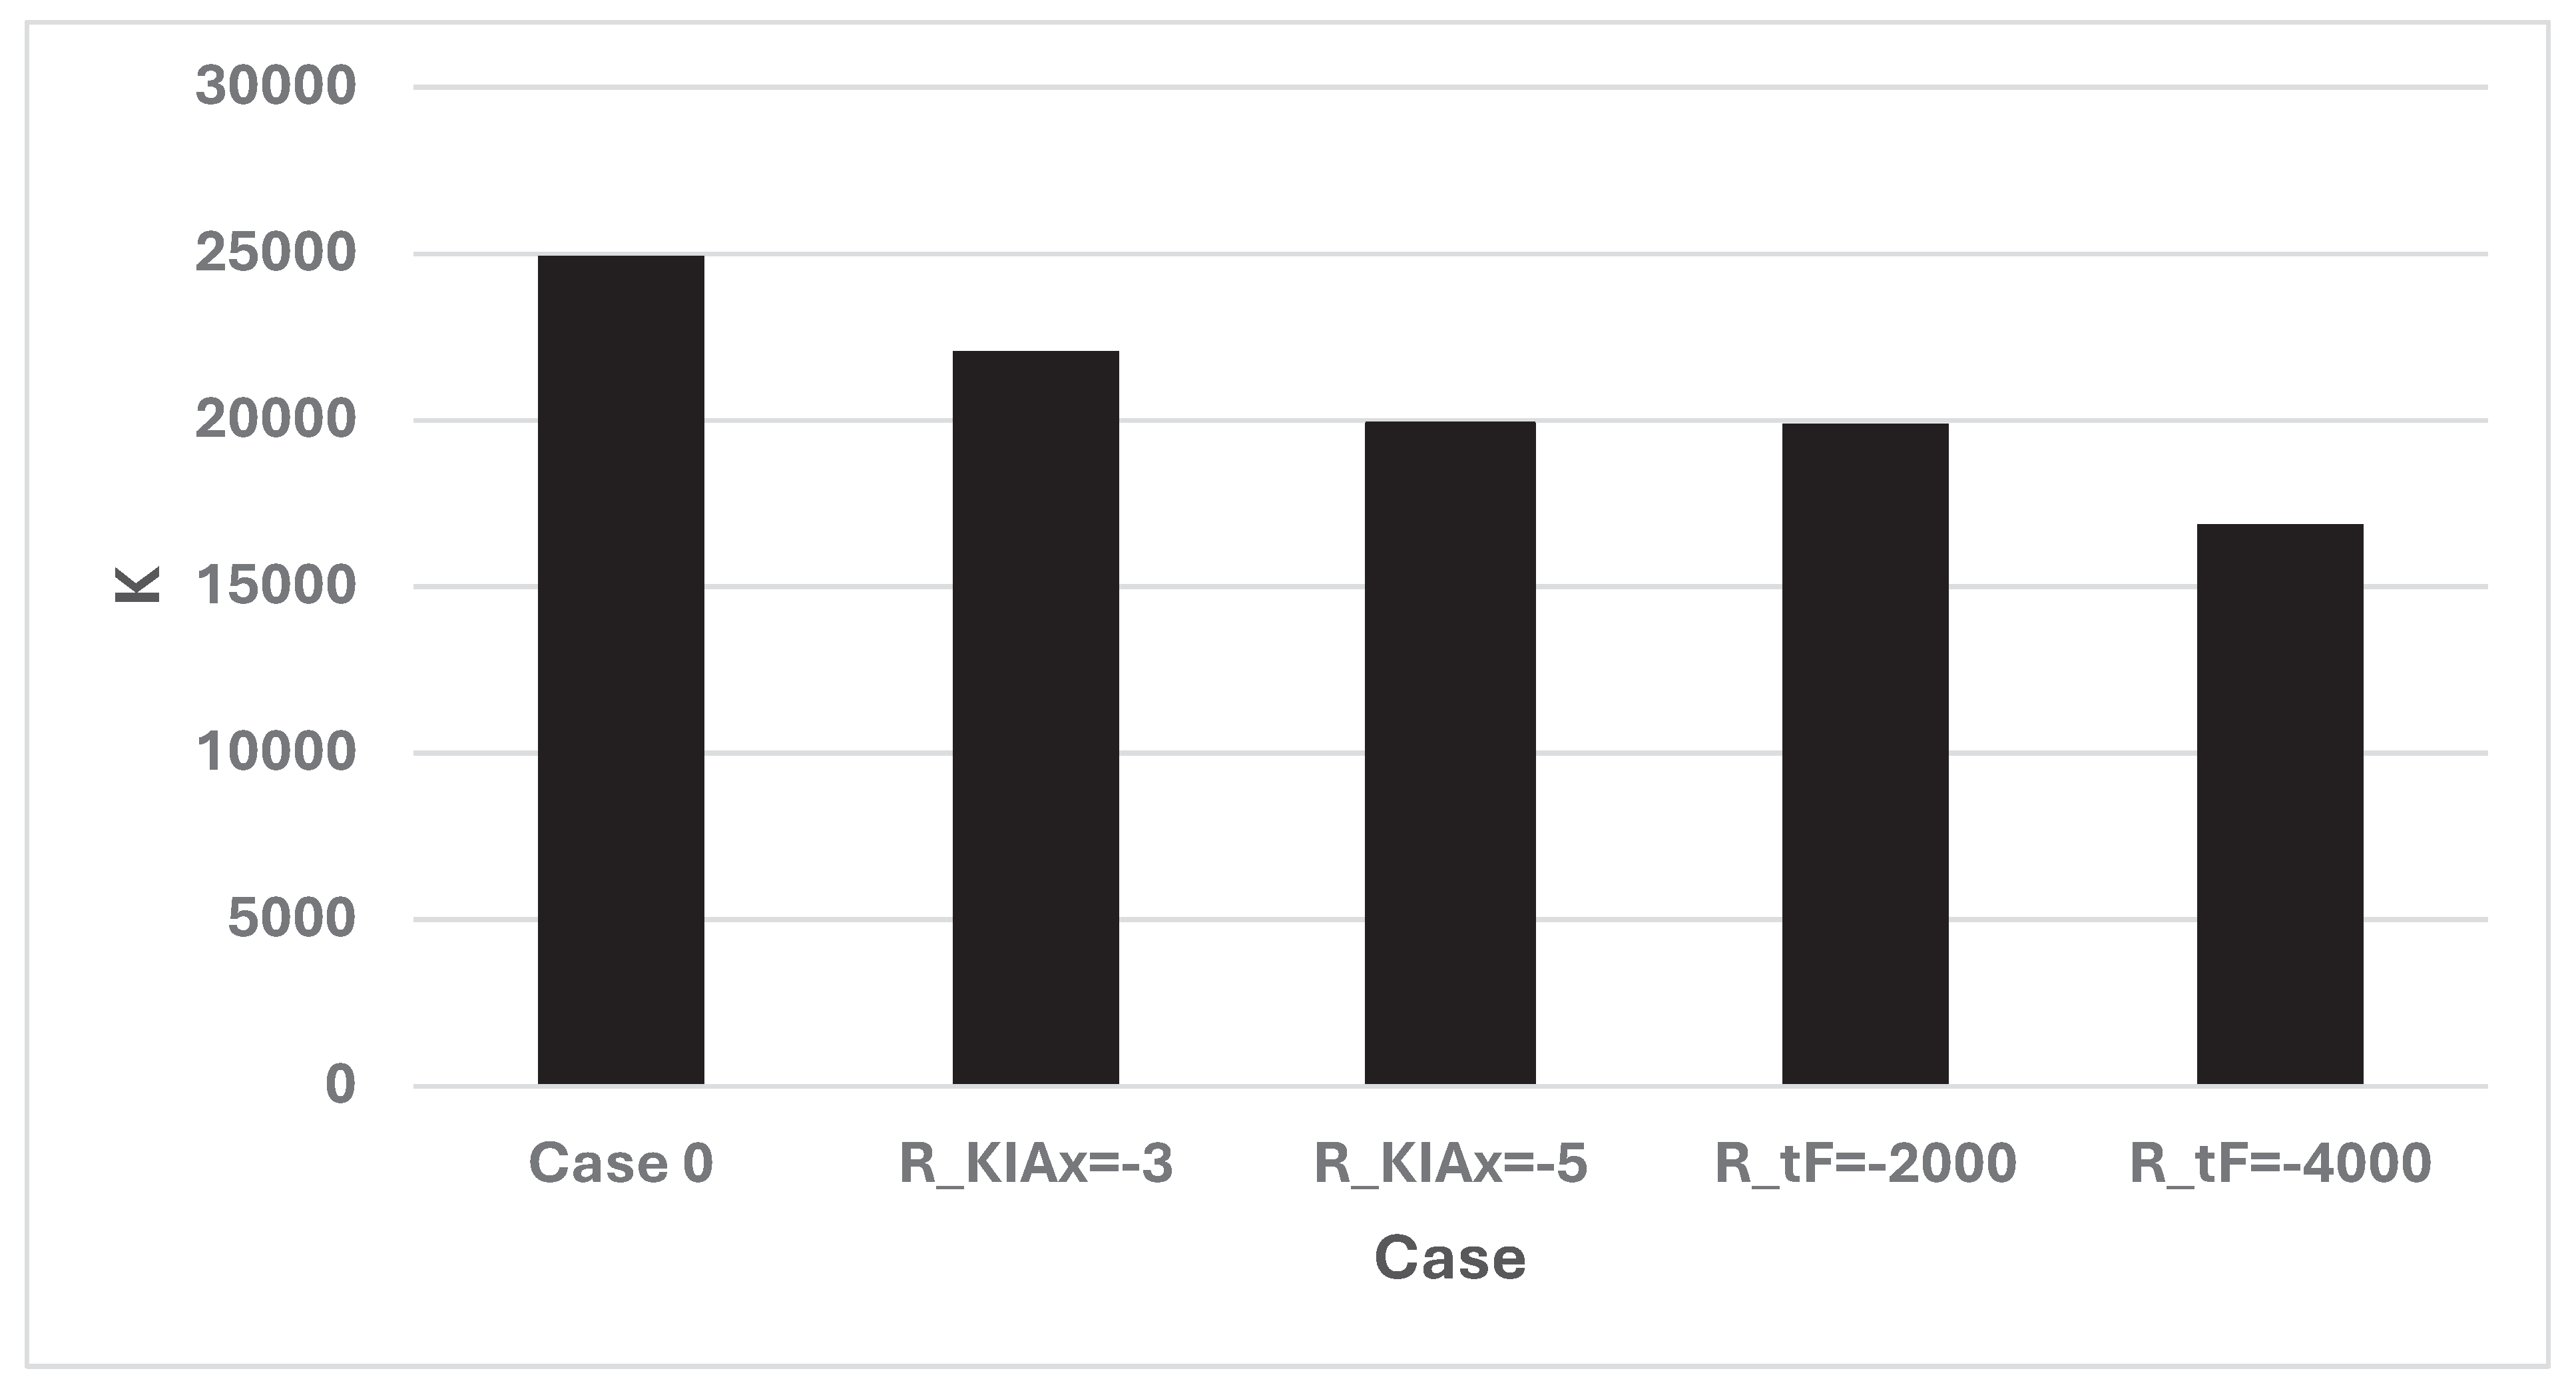
Table 1.
Output from Numerical Model 1, Case 0.
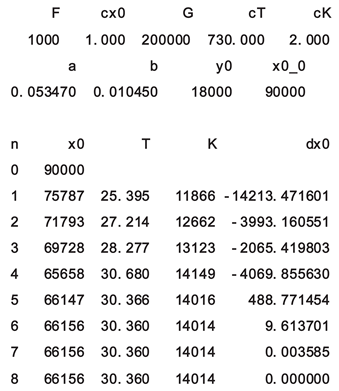
Table 2.
Output from Numerical Model 2, Case 0.
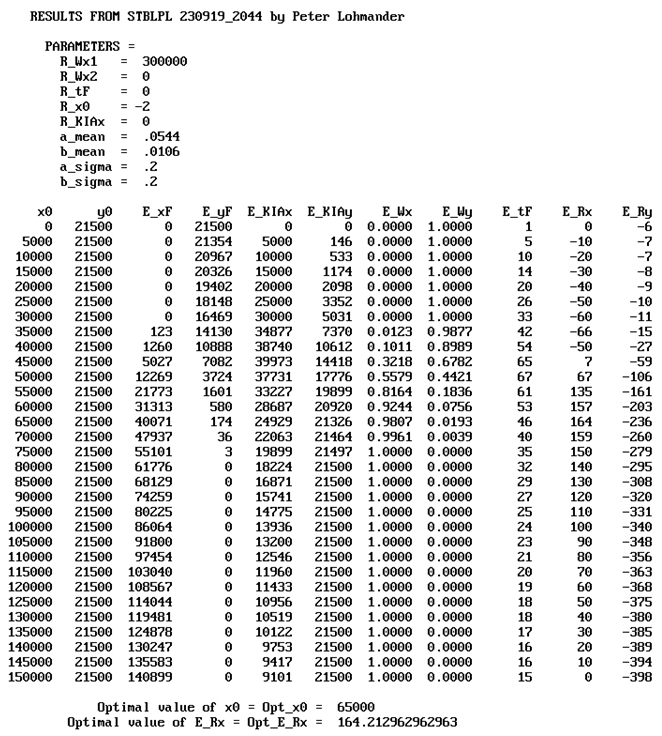
Disclaimer/Publisher’s Note: The statements, opinions and data contained in all publications are solely those of the individual author(s) and contributor(s) and not of MDPI and/or the editor(s). MDPI and/or the editor(s) disclaim responsibility for any injury to people or property resulting from any ideas, methods, instructions or products referred to in the content. |
© 2024 by the authors. Licensee MDPI, Basel, Switzerland. This article is an open access article distributed under the terms and conditions of the Creative Commons Attribution (CC BY) license (http://creativecommons.org/licenses/by/4.0/).
Copyright: This open access article is published under a Creative Commons CC BY 4.0 license, which permit the free download, distribution, and reuse, provided that the author and preprint are cited in any reuse.