
Submitted:
15 February 2024
Posted:
19 February 2024
You are already at the latest version
Abstract
Alzheimer's disease (AD) is a neurodegenerative olfactory disorder affecting millions of people worldwide. Alterations in the hexosamine or glucose-related pathways have been described through AD progression. Specifically, an alteration in glucosamine 6 phosphate isomerase 2 (GNPDA2) protein levels has been observed in olfactory areas from AD subjects. However, the biological role of GNPDA2 in neurodegeneration remains unknown. Using mass-spectrometry, multiple GNPDA2 interactors were identified in human nasal epithelial cells (NECs) mainly involved in intraciliary transport. Moreover, GNPDA2 overexpression induced an increment in NEC proliferation rates, accompanied by transcriptomic alterations in Type II interferon signalling or cellular stress responses. In contrast, the presence of beta-amyloid or mutated Tau-P301L in GNPDA2-overexpressing NECs induced a slow-down in the proliferative capacity in parallel with a disruption in protein processing. The proteomic characterization of Tau-P301L transgenic zebrafish embryos demonstrated that GNPDA2 overexpression interfered with collagen biosynthesis and RNA/protein processing, without inducing additional changes in axonal outgrowth defects nor neuronal cell death. In humans, a significant increase in serum GNPDA2 levels was observed across multiple neurological proteinopathies (AD, Lewy body dementia, progressive supranuclear palsy, mixed-dementia, and amyotrophic lateral sclerosis) (n=187). These data shed new light on GNPDA2-dependent mechanisms associated to the neurodegenerative process beyond the hexosamine route.
Keywords:
GNPDA2
; neurodegeneration
; olfaction
; zebrafish
1. Introduction
Alzheimer’s disease (AD) represents the most frequent neurodegenerative disorder and has become a major public health problem worldwide [1,2]. Among other typical symptoms such as memory loss or disorientation, AD is characterized by an early severe olfaction loss in 90% of the patients [3,4]. This early deficit has been associated with the appearance of neuropathological deposits such as amyloid plaques and neurofibrillary tangles [5]. The appearance of these neuropathological hallmarks is defined by the accumulation of beta-amyloid (Aβ) peptides and hyperphosphorylated Tau [6]. That is why, therapeutic strategies have been mostly Aβ and tau-targeted, however, any definitive success has been described until now.
Dysregulation of brain energetics has been described in various neurodegenerative disorders, including AD [7,8]. Specifically, brain hypometabolism is a well-described hallmark in AD patients [9] and consistently, this event also occurs in animal AD models [10,11]. Although a decrease in glucose levels occurs progressively, the exact connection between glucose metabolism and AD is not yet understood. Together with an increased glycolytic ratio, a disruption of the hexosamine pathway and subsequent O-linked-N acetylglucosamine (O-GlcNAc) cycling has also been suggested as a link between altered glucose metabolism and brain defects [12]. In this context, previous reports have observed alterations in GNPDA2 protein levels in the olfactory bulb derived from AD and Parkinson’s disease subjects [13]. GNPDA2 is a metabolic enzyme that participates in the hexosamine pathway, one of the main nutrient-sensing pathways in several organisms, catalysing the deamination of the glucosamine-6-phosphate [14]. This chemical reaction results in two molecular events: i) an increase in ammonium levels, a neurotoxic factor with great relevance in AD [15,16] and ii) a decrease in UDP-GlcNAc levels, which consequently leads to O-GlcNAcylation decline. Interestingly, it has been previously suggested that a decline in APP and Tau O-GlcNAcylation might lead to the emergence of Aβ plaques and neurofibrillary tangles [17-20]. However, alterations in GNPDA2 gene/protein levels have been mostly associated with obesity-related processes [21-24], being unexplored its potential involvement in neurodegeneration. Our study aims to increase our knowledge about the GNPDA2 biology, clarifying its potential interactions with AD-related contexts. To achieve this purpose, we have combined RNA sequencing (RNA-seq) and quantitative proteomics with olfactory in vitro studies and in vivo experiments with a zebrafish transgenic line overexpressing the human P301L Tau mutant in a neuron specific manner [25]. In addition, serum GNPDA2 levels have been monitored across multiple human neurological proteinopathies to extend our knowledge about hexosamine metabolism and neurodegeneration.
2. Materials and Methods
2.1. Materials
The following reagents and materials were used. Anti-GNPDA2 (ref. ab106363) and anti-Tau (phospho S396) (ab109390) were purchased from Abcam. Anti-Znp1/Zn-1 antibody was obtained from Developmental Studies Hybridoma Bank. Anti-GAPDH was obtained from Sigma-Aldrich (SAB2701826). Anti-ERK antibody was purchased from Cell signaling (9102) whereas anti-Tau K9JA was purchased from Dako. Electrophoresis reagents were purchased from Biorad and trypsin from Promega.
2.2. Cell culture
Human nasal epithelial cells (hNECs) (ABM. T9243) were cultured in DMEM (Gibco) supplemented with 10% FBS (Merck millipore) and 1% penicillin/streptomycin (ABM) and grown in a 5% C02 humidified atmosphere at 37ºC. For GNPDA2 overexpression, hNECs were seeded in 6-well plates (80% confluency). Briefly, one microgram of GNPDA2 and control GFP plasmid DNA were mixed with lipofectamine 3000 (Fisher) (1:2) in DMEM., followed by 15 min incubation at room temperature. Aβ 1-42 peptide and Tau P301L plasmid were added 24 hours after. Cells were then incubated for 24 hours and RNA was extracted using a RNeasy Mini Kit (Qiagen, Hilden, Germany) following manufacturer’s instructions.
2.3. Immunoprecipitation
Human nasal epithelial cells (hNECs) protein extracts were homogenized on ice-cold immunoprecipitation (IP) buffer (50 mM Tris, 150 mM NaCl, 2 mM EDTA, 1% Triton, pH 7.4, 1 mM PMSF, 10 μg/mL aprotinin, 1 μg/mL leupeptin). Four hundred micrograms of protein were incubated overnight at 4 °C under rotary agitation with 2 µg of GNPDA2 antibody (Abcam ab106363) or ERK antibody (Cell signaling 9102) as a negative control. The immune complexes were incubated overnight with the addition of sepharose beads (GE Healthcare, IL, Illinois, USA. 17-0618-01). Beads were washed once in IP buffer, IP/PBS (1:1) and PBS and collected by centrifugation at 3000 rpm 5 min. Immunocomplexes were heated 10 min at 100 °C and resolved on SDS-PAGE or resuspended in PBS. For mass-spectrometry analyses, immunoprecipitated protein extracts were diluted in Laemmli sample buffer and loaded into a 0.75 mm thick polyacrylamide gel with a 4% stacking gel casted over a 12.5% resolving gel. The run was stopped as soon as the front entered 3 mm into the resolving gel so that the whole interactome became concentrated in the stacking/resolving gel interface. Bands were stained with Coomassie Brilliant Blue, excised from the gel and protein enzymatic cleavage was carried out with trypsin (Promega, Madison, WI, USA; 1:20, w/w) at 37 °C for 16 h, as previously described [26]. Purification and concentration of peptides was performed using C18 Zip Tip Solid Phase Extraction (Millipore). Mass spectrometry analysis was performed using an EASY-1000 nanoLC system coupled to a Exploris 480 mass spectrometer (Thermo Fisher Scientific) as described below.
2.4. RNA sequencing (RNA-seq) and data analysis
Briefly, total RNA was extracted and purified using a RNeasy Mini Kit (Qiagen, Hilden, Germany) following manufacturer’s instructions. Sequencing libraries were prepared by following the Illumina Stranded Total RNA Prep with Ribo-Zero Plus (Illumina Inc., San Diego, CA) from 100 ng of total RNA, that has been depleted by following the instructions. All libraries were run in a HiSeq1500 PE100 lane in Rapid mode, pooled in equimolar amounts to a 10nm final concentration. The library concentration was measured by Qubit 3.0 (Invitrogen) and library size ensured by capilar electrophoresis in Fragment Analyzer (AATI). The quality of the RNAseq results was initially assessed using FastQC v0.11.9 (http://www.bioinformatics.babraham.ac.uk/projects/fastqc/) and MultiQC v1.9 (http://multiqc.info/). The raw reads were trimmed, filtered for those with a Phred quality score of at least 25 and all adapters were removed with TrimGalore v0.5.0 (https://www.bioinformatics.brabraham.ac.uk/projects/trim_galore/). Trimmed reads were analyzed with SortMeRNA v2.1 software (https://bioinfo.lifl.fr/RNA/sortmerna/) [27] to delete the 18S and 28S rRNA to eliminate the rRNA residues that could remain undepleted by the chemical treatment in the library preparation. Clean reads were aligned versus the Homo Sapiens reference genome (release GRCm38.p6/GCA_000001635.8, ftp://ftp.ensembl.org) using HISAT2 v2.2.1 (https://daehwankimlab.github.io/hisat2/) [28] with default parameters. Resulting alignment files were quality assessed with Qualimap2 (http://qualimap.bioinfo.cipf.es) [29] and sorted and indexed with Samtools software [30]. After taking a read count on gene features with the FeatureCounts tool (http://subread.sourceforge.net) [31], quantitative differential expression analysis between conditions was performed by DESeq2 [32], implemented as R Bioconductor package, performing read-count normalization by following a negative binomial distribution model. In order to automate this process and facilitate all group combination analysis, the SARTools pipeline was used [33]. All resultant data was obtained as HTML files and CSV tables, including density count distribution analysis, pairwise scatter plots, cluster dendrograms, Principal Component Analysis (PCoA) plots, size factor estimations, dispersion plots and MA and Volcano plots. The resulting CSV file, including raw counts, normalized counts, Fold-Change estimation and dispersion data was annotated with additional data from the Biomart database (https://www.ensembl.org/biomart/martview/346d6d487e88676fd509a1b9a642edb2). In order to control the False Discovery Rate (FDR), the p-values were amended by Benjamini-Hochberg (BH) multiple testing corrections. Those features showing corrected p-values below the 0.05 threshold and Fold-change values >1.5 or <0.5 were considered up- or down-regulated genes, respectively.
2.5. Zebrafish studies
The Zebrafish model characterization was performed by Biobide (https://biobide.com/). Briefly, adult zebrafish were housed and maintained in accordance with standard procedures. Fish were maintained in 3-liter aquaria heated at 28,5ºC with about 20 fish per tank and water continuously filtered. Water conditions were monitored and regulated conveniently. Fish were kept under a photoperiod of 14:10 hours light/dark. Adults were fed with ground dry pellets and live food. Embryos were collected and placed in E3 media with ampicillin (100 μg/ml) and methylene blue (0.0001%) and provided immediately to the lab for injection. All experiments were performed according to European standards of animal welfare on animal used for scientific purposes (2010/63/EU), compiled with national regulations for the care of experimental animals and were approved as described in national regulations (RD 53/2013) by the local and regional committees. Internal codes: SUA-BBD-0003/19 (WT production and maintenance; authorization code: PRO-AE-SS-158) and SUA-BBD-0005/19 (Transgenic ZF production, no pathology associated; authorization code: PRO-AE-SS-151). Plasmid containing GNPDA2 cDNA (clone OHu09718 in pBluescript II KS(+)) was commercially obtained from GenScript. Plasmid (5 μg) was linearized with SalI following manufacturer’s protocol. Once digestion was complete (verified on an agarose gel), sample was treated with proteinase K (100 μg/ml) and SDS (0.5%) and then DNA purified with phenol/chloroform. GNPDA2 mRNA was synthetized from this linearize plasmid using mMessage mMachine T7 Ultra kit (Ambion) following manufacturer’s instructions. mRNA control for Cypridine luciferase (cLuc) was also synthetized as just described using the cLuc control template provided in HiScribe T7 ARCA mRNA kit (New England BioLabs). After checking that synthesis successfully worked (agarose gel for RNA detection), poly A-tail was added (Poly A tailing Kit, Ambion) in both mRNAs following manufacturer’s instructions. Finally, mRNAs were purified with Qiagen columns also following manufacturer’s protocol and concentration of mRNAs obtained was determined by absorbance and by densitometry (ImageJ software) (Supplementary figure S1A).
2.6. RNA injection, evaluation of toxicity and determination of GNPDA2 protein expression.
Wild-type AB embryos were placed at one-cell stage in a premade 2% agarose plate that has series of wedge-shaped grooves, where embryos were aligned and immobilized. mRNA solutions (mRNA + 100 mM KCl + 0.5 mg/ml Phenol Red) were loaded into the injection capillary and delivered directly into the cell. A volume of 1-2 nl of the two mRNAs were injected at three different doses (based on final RNA concentration determined by absorbance) and around 100 embryos were injected per mRNA/concentration. Once injected, embryos were transferred into a petri dish with E3 embryo media + 10 mM HEPES and incubated at 28.5 °C until the end of the experiment (48 hpf). Embryos not injected for the same batch/batches used for injection were also kept for comparison. The presence of toxicity manifestations (including mortality and morphological alterations) was evaluated at 24 and 48 hpf under a stereoscope in all the experimental groups (Supplementary figure S1B). Once analysis at 48 hpf was done, 35 embryos were collected and deyolked by pipetting 5 times with a P200 pipette tip. in ice-cold PBS. After washing, embryos were lysed in Rippa buffer (without SDS) and frozen at -80 ⁰C. Cell extracts were then fractionated electrophoretically, transferred into nitrocellulose filters and subjected to immunoblot analysis with an antibody that specifically recognizes GNPDA2. Endogenous Gapdh was also analyzed as a loading control. Immunoreactive bands were developed using an enhance chemiluminescence system (LI-COR C-Digit Blot Scanner) (Supplementary figure S1C). One RNA concentration (highest one tested that did not induce unspecific toxicity at which protein expression was confirmed) was selected for next steps.
2.7. RNA injection and evaluation of the phenotype associated with TAU P301L overexpression.
For the overexpression experiments, GNPDA2 and control Luciferase mRNAs were injected in once-cell stage embryos from the ZF TAUP301L transgenic line at the selected concentration (384 ng/μl). Around 200 embryos were injected. A group of not injected embryos from the same transgenic line were hold for further comparisons. At 24 hours post fertilization (hpf), dead and malformed embryos were removed and DsRed expression (indicative of Tau expression) was checked under the fluorescence stereoscope. Embryos expressing high levels of DsRed as well as DsRed negative embryos (control siblings) were selected for further analysis. DsRed negative embryos were used to determine the possible effect of RNAs injected in the absence of any neuronal damage and to verify the neurotoxicity caused by TAUP301L overexpression.
Concerning GNPDA2 overexpression, around 100 embryos were injected with a volume of 1-2 nl of mRNAs. Once injected, embryos were transferred into a petri dish with E3 embryo media + 10 mM HEPES and incubated at 28.5 °C until the end of the experiment (48 hpf). Experimental groups are defined in Supplementary figure S1D.
2.8. Axonal motoneuron extension
For whole mounting immunohistochemistry embryos from the different experimental groups were fixed at around 30 hpf in 4% (wt/vol) paraformaldehyde (PFA) in PBS overnight at 4 ºC. Around 20 embryos were used per experimental group. Once fixed, embryos were dehydrated in 100% methanol and kept at -20 ºC at until the time immunohistochemistry was performed. At this time, before the incubation with the primary antibody, embryos were rehydrated, permeabilized with 10 μg/ml proteinase K and blocked in 5% normal serum, 4 mg/ml BSA and 0.5% Triton x-100 in PBS. Incubation with two primary (anti-znp1 1:500; anti-zn1 1:200, which label the synaptic protein synaptotagmin in extending axons of all primary motoneurons) and secondary (goat anti-mouse Alexa Fluor 488, dilution 1:500) antibodies was done overnight at 4 ºC. Labeled embryos were imaged on a fluorescent stereomicroscope (Leica M20FA) and pictures of the area of interest (the first 4 stained motoneuron projections before the end of the yolk extension) were obtained with a digital camera (KI5, Leica). Motoneuron axon length measurements were done with the ImageJ software (National Institutes of Health, Bethesda, MD). Statistical analysis (one-way ANOVA plus Tukey’s multiple comparison test) was conducted to determine if expression of GNPDA2 affected motoneuron axonal extension when compared with not-injected or embryos injected with RNA control, both in the presence (DsRed positive) and absence (DsRed negative) of Tau P301L overexpression.
2.9. Detection of neuronal death
Neuronal death was studied by TUNEL assay in all experimental groups at 48 hpf, (around 20 embryos per group). At the indicated stage, embryos were fixed, dehydrated, rehydrated and permeabilized as previously described, and TUNEL reaction (ApopTag Apoptosis Detection Kit, Millipore) was carried out following manufacturer instructions. Embryos were imaged on a fluorescent stereomicroscope (Leica M20FA) and the number of positive neuronal nuclei for each experimental group was counted along the spinal cord area from the end of the most bulging part of the yolk to the tail tip. Representative pictures were taken with the digital camera previously described. Statistical analysis (one-way ANOVA plus Tukey’s multiple comparison test) was conducted to compare the number of apoptotic cells between all the experimental groups to determine if GNPDA2 expression affected neuronal apoptosis both in the absence and presence of Tau P301L overexpression.
2.10. Detection of TAU phosphorylation
A group of 30 DsRed positive embryos from each of the experimental were collected at 48 hpf, deyolked and lysed. Expression of phosphorylated TAU protein specifically at residue Ser396 was evaluated by western blot (as described in the same task) using an anti-PhosphoTAU (Ser396) antibody. Same samples were developed in parallel with an anti-TAU antibody that recognizes both phosphorylated and non-phosphorylated TAU and with an anti-GNPDA2 antibody to confirm GNPDA2 expression. Immunoreactive bands were developed using an enhance chemiluminescence system (LI-COR C-Digit Blot Scanner) and quantified later by densitometry using Image Studio software. As a loading control, Ponceau S red staining of the membrane fragments used for development of PhosphoTAU and total TAU was conducted, pictures taken (G:BOX, Syngene) and densitometry of the corresponding lines was measured using ImageJ software.
2.11. Embryos collection and sample preparation for proteomic analysis
Embryos from each of the experimental conditions (around 50 embryos per group) were collected at 48 hpf, deyolked, washed, frozen in liquid nitrogen and stored at -80 ºC until further processing for the mass spectrometry experiment. Briefly, embryos were lysed with a buffer containing 7M urea, 2M tiourea and 50mM ABC. Protein extracts were then quantified using Bradford assay and 20 ug were utilized for the proteomic analysis. The reduction step was performed adding dithiothreitol (DTT) to a final concentration of 10mM and incubation at RT for 30 minutes. Subsequent alkylation with 30mM (final concentration) iodoacetamide (IAA) was performed for 30 minutes in the dark at RT. Then, an additional reaction step was performed with DTT 30mM (final concentration) for 30 minutes. This mixture was dilute to 0,9M urea using Miliq-water. The digestion step was performed using trypsin (Promega) at 1:50 w/w (enzyme/protein) and samples were incubated at 37ºC for 16 hours. Digestion was quenched by acidification with acetic acid. The final step before mass-spectrometry was Vacuum Manifold platform. Then, samples dryness by vacuum centrifuge and resuspension in 10 µL of 2% acetonitrile, 0.1% formic acid and 98% miliQ water.
2.12. Mass spectrometry
Dried down peptide samples were reconstituted with 2% ACN-0.1% FA (Acetonitrile-Formic acid), and quantified by NanoDropTM spectrophometer (ThermoFisher Sci.) prior to LC-MS/MS. Samples were analyzed using an EASY-1000 nanoLC system coupled to an EZ-Exploris 480 mass spectrometer (Thermo Fisher Sci.). Peptides were resolved using C18 Aurora column (75µm x 25cm, 1.6 µm particles; IonOpticks) at a flow rate of 300 nL/min using a 60-min gradient (50 oC): 2-5% B in 1 min, 5-20% B in 48 min, 20-32% B in 12 min, and 32-95% B in 1 min (A = FA, 0.1%; B = 100% ACN: 0.1% FA). Sample data were acquired in data-independent acquisition (DIA) mode with a full MS scan (scan range: 400 to 900 m/z; resolution: 60,000; maximum injection time: 22 ms; normalized AGC target: 300%) and 24 periodical MS/MS segments applying 20 Th isolation windows (0.5 Th overlap: Resolution: 15000; maximum injection time: 22 ms; normalized AGC target: 100%). Peptides were fragmented using a normalized HCD collision energy of 30%.
2.13. Data analysis
The resulting mass spectrometry data files were analyzed using Spectronaut 17.1 (Biognosys) by direct DIA analysis (dDIA) against a Danio rerio Swissprot (isoforms) database, using default settings and filtering the precursors and protein groups by a 1% q-value. Enzyme was set to trypsin in a specific mode (maximum of two missed cleavages). Carbamidomethyl (C) was set as fixed modifications. Oxidation (M), Acetyl (Protein N-term), Deamidation (N), and Gln-> pyro-Glu were set as variable modifications (3 maximum modifications per peptide).
2.14. Bioinformatic analysis
The quantitative data obtained by Spectronaut software were analyzed using Perseus software (version 1.6.15.0) [34] in order to perform statistical analysis and visualization of the obtained data. Statistical significance was set at p-value lower than 0.05 in all cases and 1% peptide FDR threshold was considered. In addition, proteins were considered significantly differentially expressed when their absolute fold change was below 0.77 (down-regulated proteins) and above 1.3 (up-regulated proteins) in linear scale. The association of the differentially expressed genes and proteins with specifically dysregulated regulatory/metabolic networks was analyzed using different bioinformatic tools (Metascape, Biogrid, QIAGEN’s Ingenuity Pathway Analysis (IPA; QIAGEN Redwood City), SynGO). Metascape was used to extract biological information associated to proteome functionality [35]. Biogrid was used to analyze potential APP and Tau interactors. On the other hand, IPA software calculates significance values (p-values) between each biological or molecular event and the imported molecules based on the Fisher’s exact test (p ≤ 0.05). The IPA comparison analysis considers and reports hierarchically the signaling pathway rank according to the calculated p-value.
2.15. Enzyme-Linked Immunoabsorbent Assay
GNPDA2 concentrations were measured using enzyme-linked immunoabsorbent assay (ELISA) kits according to the manufacturer’s instructions (MBS9341798 - Mybiosource). The data were analyzed using Graphpad Prism Software and Mann–Whitney U test was used to make group comparisons. A p-value less than 0.05 was considered statistically significant. Serum samples include 71 controls; mean age: 69,2 years; 40M/31F, 40 AD subjects: mean age: 75,1 years; 20M/20F, 40 PSP subjects; mean age: 67,9 years; 15M/25F), 40 DFT subjects; mean age: 69,5 years; 20M/20F), 12 DLB subjects; mean age: 73,5 years; 6M/6F), 12 mixed dementia subjects; mean age: 78,5; 6M/6F; and 12 ALS subjects; mean age: 57,8 years; 5M/7F) (Supplementary Table S1).
3. Results
3.1. GNPDA2 interactome is partially associated to intraciliary transport in NECs
The physiological and molecular role of GNPDA2 in olfactory contexts is not yet completely understood. That is why, we considered that the elucidation of the GNPDA2 interactome in a human nasal epithelial cell line could help to decipher its direct association with specific cellular processes. Hence, GNPDA2 was immunoprecipitated from hNECs as well as an irrelevant antibody (ERK) which was included as a negative control to detect non-specific–associated proteins. Additionally, immunoprecipitation was also performed without using any specific antibody as a second negative control of the process. First, GNPDA2 immunoprecipitation was confirmed using Western blot (Figure 1A). Subsequent mass-spectrometry analysis was performed to identify GNPDA2-associated proteins (Figure 1A and Supplementary Table S2). Data were curated by excluding non-specific–associated proteins detected in both ERK and no antibody immunoprecipitations (Supplementary Table S2). After restrictive curation, 93 proteins were considered as co-immunoprecipitating with GNPDA2. GNPDA2 interactome was functionally analyzed using Metascape. As shown in Figure 1A, multiple functional categories were significantly enriched (Supplementary Table S3). Intraciliary transport (GO:0035735), metabolism of RNA (R-HAS-8953854) or amino-acid metabolic process (GO:0009081) were represented by 17 (PCM1, CEP131, IFT81, AP2M1, IFT172, LRRC7, ATP2B4, TUBB2A, NDC80, SPAG5, TPPP, PPP2R3C, PARD3, SIRT5, TGS1, CCDC96), 16 (POLR2L, RPS28, WDR46, CNOT8, ZC3H11A, SMG7, SMNDC1, SMG6,RPL26L1, TGS1, LAMTOR3, ATP6V1G1, AP2M1, MBP, TUBB2A, YES1) and 3 proteins (ALDH6A1, PCCA, HIBCH), respectively. Cellular component analysis revealed that GNPDA2 specific interactors were mainly defined as membrane-related and nuclear, indicating a scattered cell localization (Figure 1B). Finally, we observed that fourteen GNPDA2 interactors (APBB1, ATP6V1G1, TPPP, GFAP, GRIN2A, NFKBIB, UGCG, C1orf174, ATPAF2, IFT81, FRMD8, SIRT5, RPL26L1, LRRC42) had been previously described as APP interactors whereas another two of them (F2, TUBB2A) are experimentally-demonstrated Tau interactors (Figure 1C).
3.2. Dissimilar transcriptomic variability in GNPDA2-overexpressing NECs upon neuropathological insults
Due to an increased in GNPDA2 protein levels have been previously observed in neuropathological olfactory-related contexts [13,36], we explored the potential molecular events linked to a GNPDA2 overexpression in NECs in the presence of neuropathological insults (beta amyloid (Aβ) and mutated form of h.Tau P301L). The experimental design is shown in Figure 2A. First, we observed that GNPDA2 overexpression had a positive effect in cell proliferation accompanied by transcriptomic changes in 172 genes (Figure 2B). On the contrary, both Aβ and Tau P301L presence triggered a slowdown in NEC proliferation capacity (Figure 2B). However, Aβ-induced transcriptomic modulation was more severe than the observed in GNPDA2-overexpressing NECs overproducing h.Tau P301L (1879 and 229 differential expressed genes respectively; p-value adjusted <0.01), suggesting a synergic effect in the process of neurodegeneration (Figure 2B and Supplementary Table S4). Only 11 were commonly deregulated in the three experimental conditions (Figure 2C). Functional analysis demonstrated that Aβ impaired biological pathways related to extracellular matrix organization, actin filament-based process, regulation of cell projection organization and cellular response to growth factor stimulus among others, suggesting a negative impact in cell structure and response against external signalling (Figure 2D and Supplementary figure 2). On the other hand, the concomitant expression of GNPDA2 and h.Tau P301L seemed to interfere specifically with protein processing in the endoplasmic reticulum, PID integrin development, and membrane-bounded organelle assembly, among others (Supplementary figure S2). To characterize in detail the transcriptomic alterations in the three experimental conditions, transcriptome-scale interaction network analysis were performed. As shown in Figure 3, GNPDA2 overexpression mainly induced downregulation in protein components associated to IFN alpha interactome. On the other hand, the massive molecular disruption accompanying GNPDA2 overproduction in the presence of Aβ mainly revealed alterations in AKT signaling dynamics whereas Tau P301L expression impacted on other survival kinases such as ERK and P38 MAPK (Figure 3).
3.3. Effects of human GNPDA2 overexpression in h.Tau P301L transgenic zebrafish embryos
To elucidate the role of GNPDA2 in a in vivo neurodegenerative context, we explored the concomitant expression of human Tau P301L and GNPDA2 in a transgenic zebrafish line combining functional assays with quantitative proteomics. Experimental design is detailed in Figure 4A. As indicated, we first investigated the relationship between GNPDA2 overexpression and neuronal toxicity. Impairment of axonal outgrowth is considered a hallmark of tauopathy [25,37] and is observed in Tau P301L embryos. Hence, to examine abnormalities in axonal growth, Tau P301L transgenic embryos overexpressing GNPDA2 were immunostained with anti-zpn1/zn-1znp1 antibody, labelling the synaptic protein synaptotagmin in the extending axons of all primary motoneurons. Not injected Tau- and Tau+ embryos were analysed as the animal model control whereas cypridine luciferase (cLUC) Tau- and Tau+ embryos were considered transfection controls. As shown in Figure 4B, a statistically significant decrease in the axonal length was associated with h.Tau P301L overexpression. However, human GNPDA2 expression did not prevent or increase this effect (Figure 4B). In addition, there was a clear increase in the number of apoptotic cells in the spinal cord of Tau P301L embryos, without detecting neither increase nor decrease in the number of these cells due to GNPDA2 overproduction (Figure 4C). Alterations in the phosphorylated Tau (ser396) levels were analysed by Western Blot at 48 hours post fertilization (hpf). An increase in the amount of phosphorylated Tau was observed in embryos expressing GNPDA2, probably due to a slight increase observed in total Tau levels (Figure 4D). These data indicate that overexpression of human GNPDA2 together with the h.Tau P301L mutation in zebrafish neurons does not modify the neuronal toxicity but slightly interferes with tau levels.
3.4. Proteomic analysis revealed widespread alterations in GNPDA2-overexpressing h.Tau P301L zebrafish embryos
To examine the molecular alterations occurring in the development of the Zebrafish expressing both human Tau P301L and GNPDA2 proteins, a nanoLC-MS/MS workflow based on an EASY-1000 nanoLC system coupled to an Exploris 480 mass spectrometer with data-independent acquisition approach was applied on zebrafish specimens derived from all experimental groups of the study (Figure 4A). Among 1300 quantified proteins with at least two peptides, differential expression analysis was performed between the above-mentioned experimental groups. First, we initially explored the molecular impact of Tau P301L mutation in the zebrafish model, establishing a differential between Not injected Tau- embryos and Not injected Tau+ embryos. Forty-five statistically differential expressed proteins (DEPs) were specifically altered due to the overexpression of Tau (Figure 5A), pointing out alterations in protein translation-related pathways, apoptosis, and lipid metabolism, among others (Figure 5B). Moreover, additional analysis indicated that the overexpression of Tau P301L in zebrafish specimens had an impact in a small percentage of previously described Tau interactors together with synapse-related proteins (Figure 5C,D). To analyse the potential effect of GNPDA2 overexpression on Tau P301L zebrafish embryos, an ANOVA test was performed comparing protein levels between the following experimental groups: Not injected Tau-, Not injected Tau+, cLUC Tau+ and GNPDA2 Tau+. Among 823 DEPs, we initially observed 12 protein subsets modulated among the different experimental groups (Figure 6A). Interestingly, we found that GNPDA2 overexpression specifically modulated two specific clusters targeting the citric acid cycle and respiratory electron transport chain, carbon metabolism and cell-structure related pathways such as actin polimerization, collagen biosynthesis or axis elongation(Figure 6B; clusters 1 & 2). In addition, the parallel expression of human Tau P301L and GNPDA2 had a greater impact in a subgroup of proteins related to the regulation of axonogenesis (Figure 6B; cluster 3). Moreover, human GNPDA2 expression was able to revert the pathological effect of 69 proteins altered in the presence of Tau P301L. Fifty of them (mainly involved in endocytosis and LCAM1 interactions) diminished their levels after GNPDA2 overexpression whereas 19 proteins (most of them ribosomal proteins) were increased (Figure 6B; clusters 4 & 5).
3.5. Increased serum GNPDA2 protein levels across neurodegenerative proteinopathies
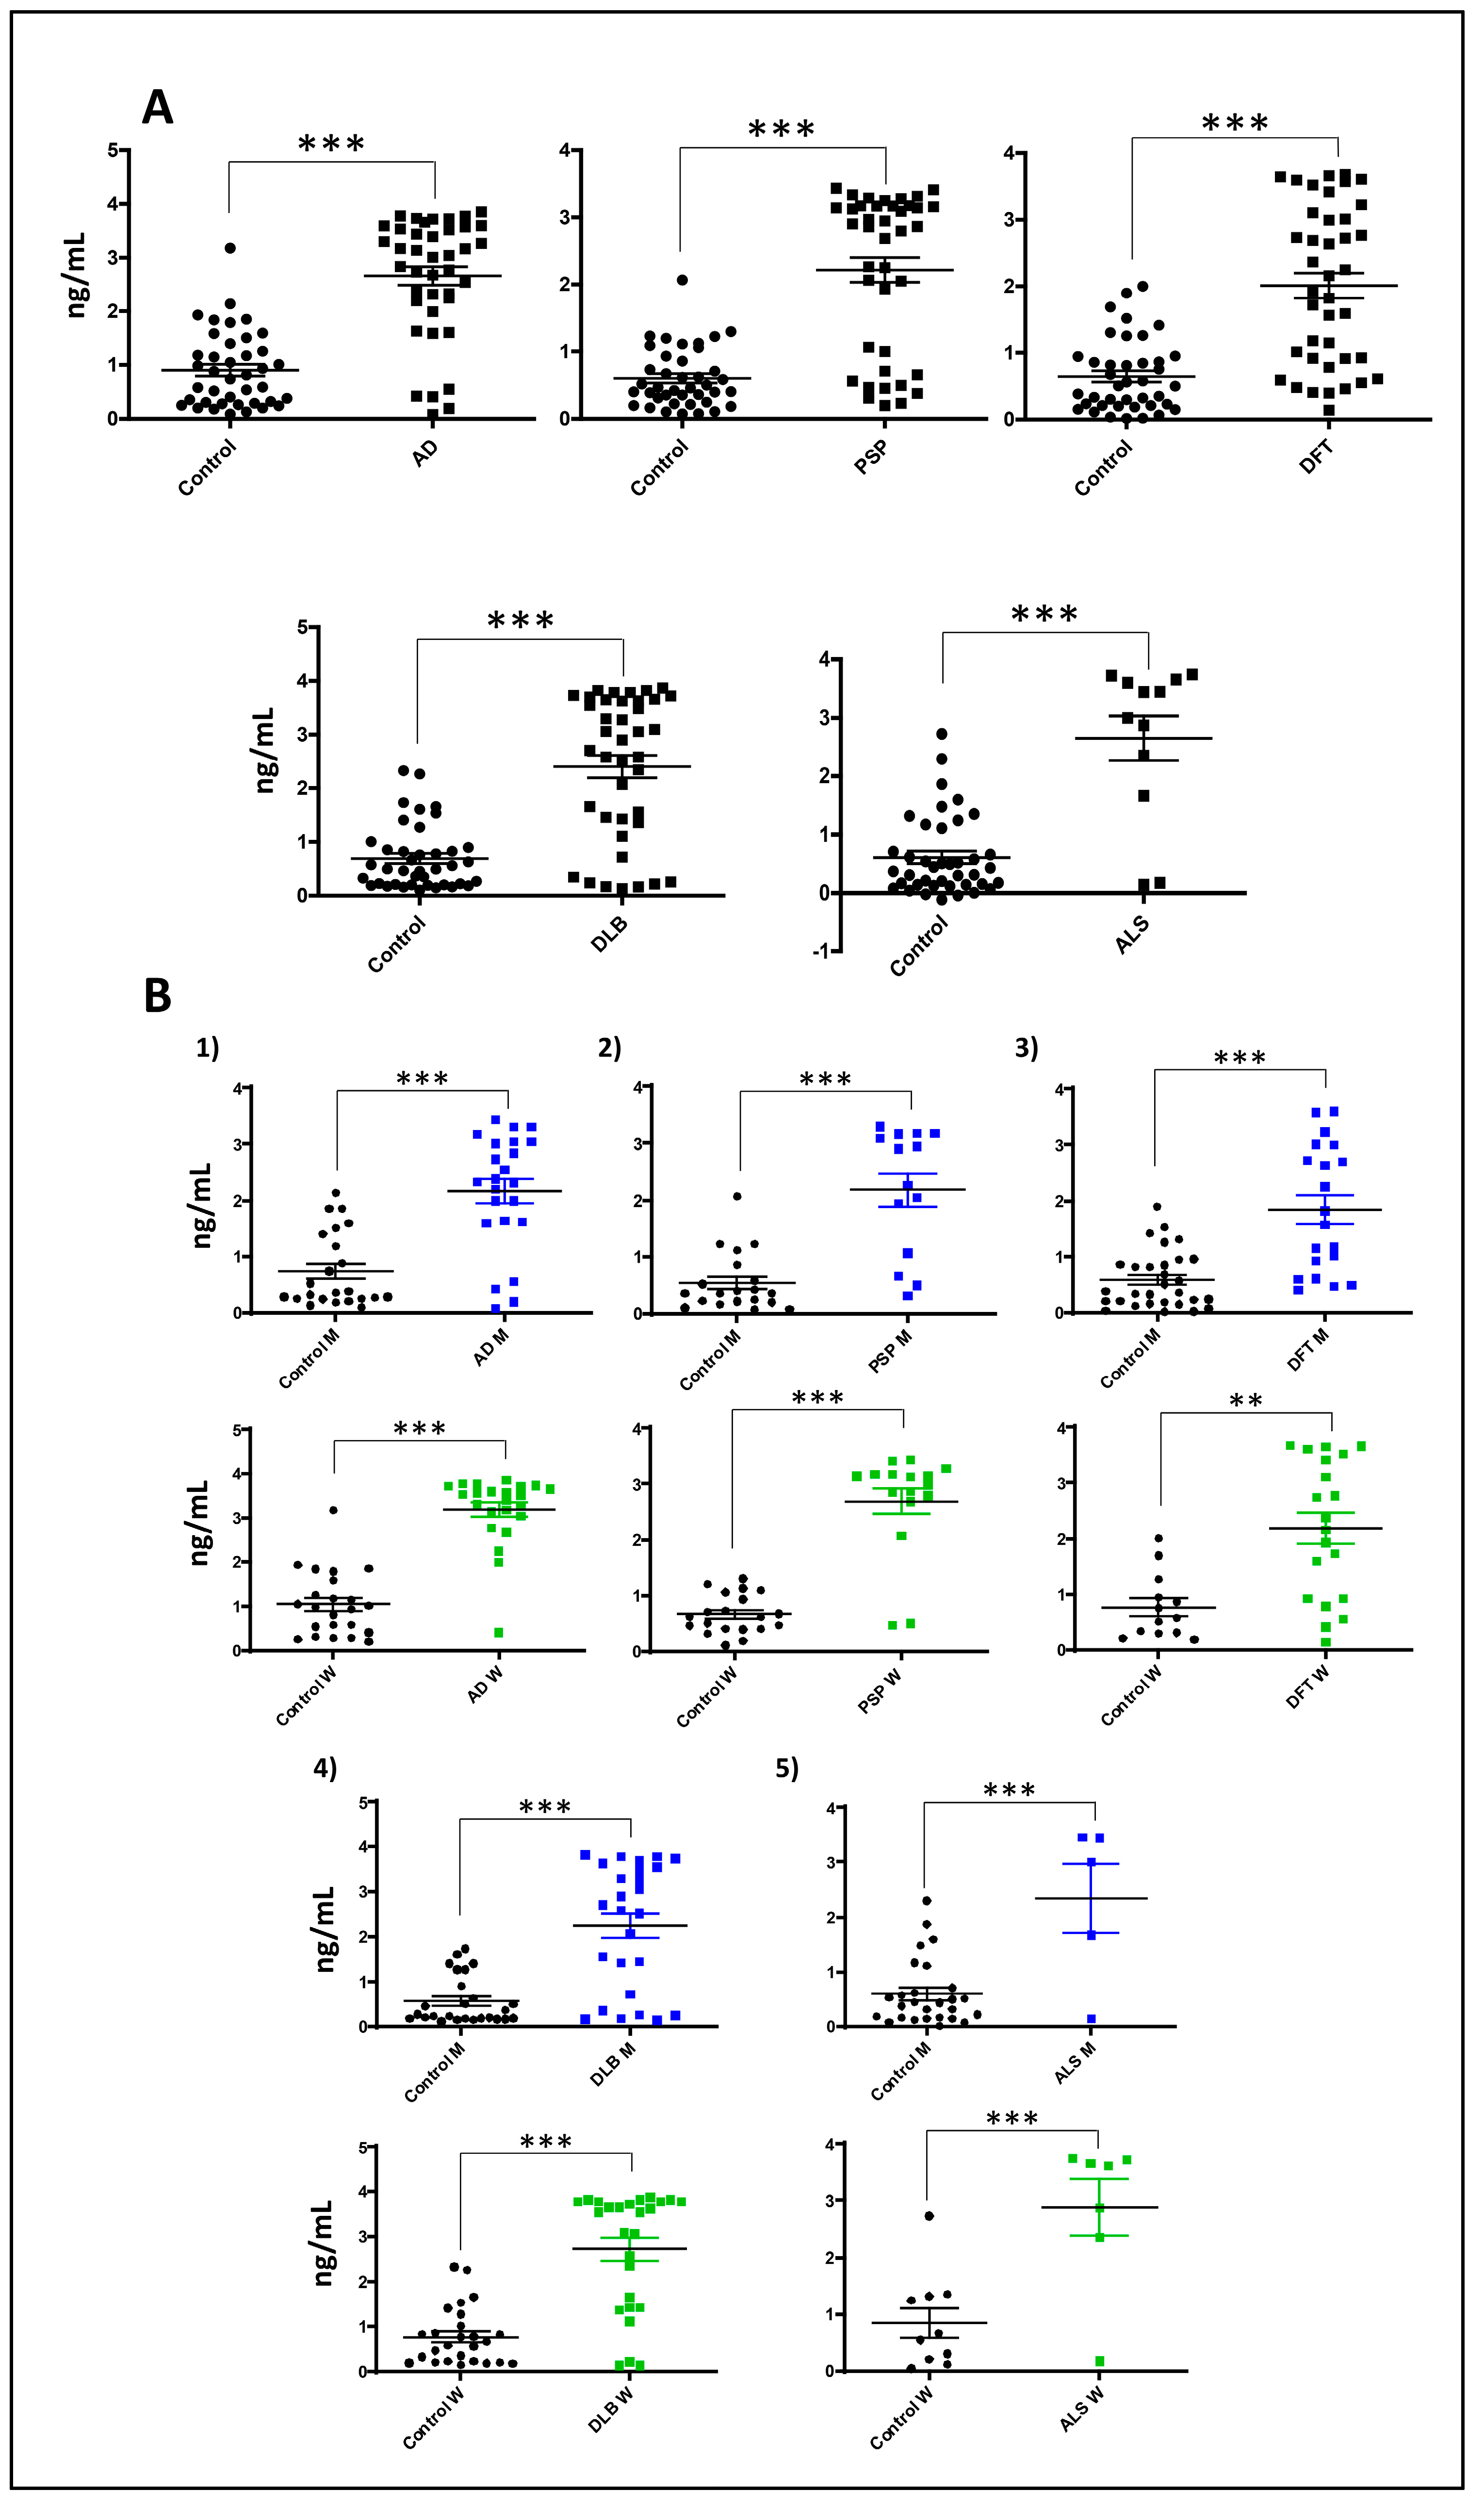
Due to GNPDA2 interferes with multiple metabolic routes in different neurodegenerative contexts, we decided to evaluate GNPDA2 protein levels in serum across different neurodegenerative diseases such as AD, Lewy body dementia, progressive supranuclear palsy, mixed dementia, and amyotrophic lateral sclerosis (n=187) (Figure 7A). We found that GNPDA2 serum levels were commonly increased across all indicated disorders respect to control population, being sex-independent (Figure 7B). These findings partially suggest that GNPDA2 may be considered a widespread marker of neurodegeneration.
4. Discussion
The lack of understanding of the disease mechanisms that underlie the vast amount of neurodegenerative processes, hinders the discovery of early disease biomarkers and the development of efficacious therapeutic approaches. Concerning AD, amyloid plaques and intracellular neurofibrillary tangles represent the two main neuropathological hallmarks present on the brain of AD subjects [6]. Among numerous mechanisms that connect the neurotoxic Aβ and Tau are oxidation of proteins, lipid peroxidation and brain hypometabolism. In fact, the glucose decline puts the brain at risk concerning cognitive functions and cerebral metabolic rates of glucose represent an early observation in AD subjects [9]. In this context, GNPDA2 is a metabolic enzyme actively participates in the hexosamine pathway [14]. In this study, we have partially defined the GNPDA2 interactome using immunoprecipitation in a human nasal epithelial cell line coupled to mass-spectrometry. To our knowledge, this is the first study that experimentally describes GNPDA2 interactome and we found that most of GNPDA2 interactors participate in intraciliary transport. The nasal cavity is covered by a pseudostratified ciliated epithelium that serves a front line in respiratory defense [38] and the physical interaction between GNPDA2 and ciliary and membrane proteins such as PCM1, CEP131, IFT81, AP2M1, IFT172, LRRC7, ATP2B4, or TUBB2A suggests a potential new function of GNPDA2 in a physiological context. In line with these results, we found that the overexpression of GNPDA2 in the presence of Aβ promoted alterations in cell projection organization. Accumulation of Aβ at presynaptic terminals has been shown to trigger primary cilia dysfunction and, consequently, neurite dystrophy [39]. On the other hand, we found that 14 GNPDA2 interactors had previously been described as APP interactors. Among all these protein partners, N-methyl-D-aspartate receptor GRIN2A expression levels, additionally, were altered in hNECs after GNPDA2 overexpression and Aβ treatment. GRIN2A belongs to the family of ionotropic glutamate N-methyl-D-aspartate receptors (NMDARs), with essential role in synaptic plasticity [40]. In fact, previous studies have demonstrated that GRIN2A knockdown accelerates memory and cognitive deficits in mice [41]. Hence, although more studies are needed in other neurological contexts, these data suggest a potential synergic effect between GNPDA2 and GRIN2A in AD progression.
Based on the involvement of the olfactory dysfunction in AD, we used hNECs to examine whether GNPDA2 overexpression might be responsible for enhancing the neurodegenerative process. The RNA-seq analysis revealed a slight modulation of hNECs transcriptome when overexpressing GNPDA2, specially exacerbated when combined with Aβ. Specifically, our data pointed out that GNPDA2 overexpression induces a shutdown of several ubiquitin-related genes (HERC6, TRIM22, IG15, PLAAT4) potentially governed by INF alpha. Interestingly, previous reports have demonstrated that increasing O-GlcNAcylation levels promote ubiquitination [42,43]. In this context, many neurodegenerative diseases are associated with the formation of ubiquitin-conjugated protein aggregates, including Aβ and Tau aggregates [44]. Hence, GNPDA2 overexpression appears to be a driver of the neurodegenerative process leading to alterations in both O-GlcNAcylation and ubiquitination processes. On the other hand, complementing the signaling mapping, AKT appeared as main node when analyzing the differential transcriptome after overexpressing GNPDA2 and Aβ. It is well known that AKT plays a crucial role during AD progression [45] and AKT hyperactivation has also been demonstrated in olfactory regions in AD and PD subjects [13,36]. On the contrary, analyzing the upstream signaling interactions of the differentially expressed transcriptomes after the concomitant expression of GNPDA2 and Tau P301L, upstream regulators such as ERK1/2 and p38 MAPK were reported to be highly interconnected with downstream altered genes. Previous reports in nasal epithelial cells have described an activation of ERK and p38 MAPK as a damage response [46,47]. On the other hand, these two pro-survival kinases have also been linked with AD-related processes such as APP processing or Tau phosphorylation [48-52]. In this regard, an activation of ERK was evidenced in the OB of AD subjects whereas an early activation of p38 MAPK was reported in initial AD stages [36]. Thus, our data suggest that GNPDA2 overexpression in hNECs leads to stress responses in the cell accompanied by alterations in survival-related kinases.
Animal models are critical to increase the understanding of AD and to evaluate potential new therapeutic options [53]. Several transgenic models have been generated round the biology of Tau aiming to define the molecular mechanisms underlying the neurodegenerative processes [54-57]. In this study, to determine whether GNPDA2 signaling could enhance the neurodegenerative process in vivo, we took advantage of the zebrafish Tau P301L line [25]. Corroborating previous studies that have previously linked ribosomal dysfunction in tauopathies [58,59], we found that Tau P301L zebrafish embryos presented alterations in various ribonucleoproteins. Besides, Tau P301L triggered apoptotic-related events impacting on the antiapoptotic BH3 family [60]. Said that, this is the first study revealing additional molecular alterations derived from the Tau P301L mutant overexpression in zebrafish. Conversely, although GNPDA2 overexpression did not exacerbate nor reduce axonal motoneuronal extension or neuronal death, it triggered significant proteome alterations at 48 hpf in this zebrafish model, involving axonogenesis-related proteins (dpysl3, dpysl2b, dbn1, vat1, cnmd, ndr2). In this sense, little is known concerning the role of GNPDA2 besides its role in the hexosamine pathway [14]. In fact, other studies have mainly linked its activity with obesity-related processes. To our knowledge, this is the first study linking GNPDA2 specific modulation with other cell processes such as axonogenesis, the citric acid cycle and respiratory electron transport, carbon metabolism, RNA splicing, regulation of actin filament polymerization or mitotic anaphase.
Conversely, ammonia, the product of GNPDA2 activity, has already been considered as a neurotoxic factor with severe negative effects on the central nervous system [16]. Excessive levels of ammonia have also been shown to provoke axonogenesis impairment and irreversible brain damage in neonates [61] and increased levels of ammonia have been detected in the brain and blood of AD patients [15]. This has shown to trigger inflammatory responses and the release of cytokines and inflammatory proteins by microglia, astrocytes and neurons, apoptosis and neuronal degeneration [62]. Studies have suggested the over-activity of adenosin-3-monosphosphate (AMP) deaminase as the main source of elevated ammonia levels [63]. However, our findings have shown increased levels of GNPDA2 not only in AD patients but also in a wide variety of neurodegenerative disorders such as Lewy body dementia, progressive supranuclear palsy, mixed dementia, and amyotrophic lateral sclerosis, strongly suggesting GNPDA2 as another source of excessive ammonia. In this scenario, it is important to note that neurological disorders show strong sex differences in both incidence and disease manifestation [64,65] and it has now been well established that understanding sex differences in the pathogenesis of AD and other neurodegenerative disorders is key to improve the development of effective diagnostics and therapeutic treatments. Importantly, GNPDA2 significant alterations were found to be sex-independent, contrary to sex differences found in glucose metabolism in AD patients [66]. Concerning the imperative urgency that exists to discover neurodegenerative drivers, our findings provide new molecular insights regarding the imbalance in the hesoxamine metabolic intermediates during the neurodegenerative process.
Supplementary Materials
The following supporting information can be downloaded at the website of this paper posted on Preprints.org, Supplementary figure 1: A) Agarose gel showing cLuc and GNDPA2 mRNAs synthetized and purified as described in procedure section. RNAs were eluted twice from the purification columns. Only RNAs from the first elution process were kept for future experiments since the amount recovered in the second elution was clearly lower. B) Toxicity analysis of embryos injected with both RNAs at the indicated doses and in not injected embryos from all the batches used. Percentage of affected embryos with respect the total number of live embryos is shown for each condition. The number/s shown between brackets indicate the batch/es of embryos used in each case. C) Western Blot developed with anti-GNPDA2 and anti-GAPDH antibodies of 48 hpf WT embryos not injected or injected with cLuc and GNPDA2 RNAs, at the indicated concentrations. D) Experimental groups for the different assays performed in the h.Tau P301L Zebrafish model; Supplementary figure 2: Top 100 clusters with their representative enriched terms for the differential expressed genes by RNA-seq; Supplementary Table 1: Serum samples for GNPDA2 protein levels analysis by ELISA; Supplementary Table 2: GNPDA2 immunoprecipitation data obtained in NECs; Supplementary Table 3: Differentially expressed genes (DEPs) identified from RNA-seq analysis. (Selection criteria FDR-adjusted less than 0.05); Supplementary Table 4: Functional analysis of GNPDA2 interactors.
Author Contributions
Conceptualization: ES; data curation: ML-M, RD, JF-I, ES; methodology: ML-M, PCC, ACJ, EAC, EP, KA, RD, JF-I, ES; formal analysis: ML-M, ES; funding acquisition: JF-I, ES; investigation: ML-M, JF-I, ES; writing—original draft: ML-M, ES. All authors are accountable for all aspects of the work. All authors read and approved the final manuscript.
Funding
This work was funded by grants from the Spanish Ministry of Science, Innovation and Universities (Ref. PID2019-110356RB-I00/AEI/10.13039/501100011033) to J.F.-I. and E.S. and the Department of Economic and Business Development from Government of Navarra (Ref. 0011-1411-2020-000028 and 0011-1411-2023-000028 to E.S.). ML-M is supported by a postdoctoral fellowship from Miguel Servet Foundation-Navarrabiomed. PCC is supported by a predoctoral fellowship from Universidad Pública de Navarra. EA-C is supported by “Programa MRR Investigo 2023” in the framework of the European Union recovery and resilience facility.
Institutional Review Board Statement
The study was conducted in accordance with the Declaration of Helsinki and all assessments and procedures were previously approved by the Clinical Ethics Committee of Navarra Health Service (Code: PI_2019/108).
Informed Consent Statement
Inform written consent from Universidad de Navarra Bank was obtained according to the Spanish Law 14/2007 of Biomedical Research for research purposes from patients included in this study.
Data Availability Statement
Mass-spectrometry data and search results files were deposited in the ProteomeXchange Consortium via the JPOST partner repository (https:// repository.jpostdb.org) with the identifier PXD049015 for ProteomeXchange and JPST002492 for jPOST (for reviewers: https://repository.jpostdb.org/preview/214159403965b93bb6e7293 ; Access key:8780).
Acknowledgments
We are very grateful to the patients and relatives that generously donor serum samples for research purposes. We are indebted to the Biobank from CIMA-Universidad de Navarra for providing us the serum samples as well as the associated clinic-pathological data. The Clinical Neuroproteomics Unit of Navarrabiomed is member of the Global Consortium for Chemosensory Research (GCCR) and the Spanish Olfactory Network (ROE) (supported by grant RED2018-102662-T funded by Spanish Ministry of Science and Innovation). We thank the bioinformatic support from María de Toro (CIBIR, Logroño, Spain).
Conflicts of Interest
The authors declare that the research was conducted in the absence of any commercial or financial relationships that could be construed as a potential conflict of interest.
References
- 2023 Alzheimer's disease facts and figures. Alzheimers Dement. 2023, 19, 1598–1695. [CrossRef]
- Li, X.; Feng, X.; Sun, X.; Hou, N.; Han, F.; Liu, Y. Global, regional, and national burden of Alzheimer's disease and other dementias, 1990-2019. Front Aging Neurosci 2022, 14, 937486. [Google Scholar] [CrossRef]
- Doty, R.L. Olfactory dysfunction in neurodegenerative diseases: Is there a common pathological substrate? Lancet Neurol 2017, 16, 478–488. [Google Scholar] [CrossRef]
- Zou, Y.M.; Lu, D.; Liu, L.P.; Zhang, H.H.; Zhou, Y.Y. Olfactory dysfunction in Alzheimer's disease. Neuropsychiatr. Dis. Treat. 2016, 12, 869–875. [Google Scholar] [CrossRef]
- Attems, J.; Walker, L.; Jellinger, K.A. Olfactory bulb involvement in neurodegenerative diseases. Acta Neuropathol. 2014, 127, 459–475. [Google Scholar] [CrossRef]
- Mucke, L. Alzheimer's disease.
- Afridi, R.; Rahman, M.H.; Suk, K. Implications of glial metabolic dysregulation in the pathophysiology of neurodegenerative diseases. Neurobiol. Dis. 2022, 174, 105874. [Google Scholar] [CrossRef]
- Yan, X.; Hu, Y.; Wang, B.; Wang, S.; Zhang, X. Metabolic Dysregulation Contributes to the Progression of Alzheimer's Disease. Front. Neurosci. 2020, 14, 530219. [Google Scholar] [CrossRef]
- Raut, S.; Bhalerao, A.; Powers, M.; Gonzalez, M.; Mancuso, S.; Cucullo, L. Hypometabolism, Alzheimer's Disease, and Possible Therapeutic Targets: An Overview. Cells 2023, 12. [Google Scholar] [CrossRef]
- Colavitta, M.F.; Grasso, L.; Barrantes, F.J. Environmental Enrichment in Murine Models and Its Translation to Human Factors Improving Conditions in Alzheimer Disease. J. Prev. Alzheimers Dis. 2023, 10, 287–300. [Google Scholar] [CrossRef]
- Dodart, J.C.; Mathis, C.; Bales, K.R.; Paul, S.M.; Ungerer, A. Early regional cerebral glucose hypometabolism in transgenic mice overexpressing the V717F beta-amyloid precursor protein. Neurosci. Lett. 1999, 277, 49–52. [Google Scholar] [CrossRef]
- Kim, D.Y.; Park, J.; Han, I.O. Hexosamine biosynthetic pathway and O-GlcNAc cycling of glucose metabolism in brain function and disease. Am. J. Physiol. Cell Physiol. 2023, 325, C981–c998. [Google Scholar] [CrossRef]
- Lachén-Montes, M.; González-Morales, A.; Iloro, I.; Elortza, F.; Ferrer, I.; Gveric, D.; Fernández-Irigoyen, J.; Santamaría, E. Unveiling the olfactory proteostatic disarrangement in Parkinson's disease by proteome-wide profiling. Neurobiol. Aging 2019, 73, 123–134. [Google Scholar] [CrossRef]
- Paneque, A.; Fortus, H.; Zheng, J.; Werlen, G.; Jacinto, E. The Hexosamine Biosynthesis Pathway: Regulation and Function. Genes (Basel) 2023, 14. [Google Scholar] [CrossRef]
- Seiler, N. Ammonia and Alzheimer's disease. Neurochem. Int. 2002, 41, 189–207. [Google Scholar] [CrossRef]
- Adlimoghaddam, A.; Sabbir, M.G.; Albensi, B.C. Ammonia as a Potential Neurotoxic Factor in Alzheimer's Disease. Front. Mol. Neurosci. 2016, 9, 57. [Google Scholar] [CrossRef]
- Zheng, B.W.; Yang, L.; Dai, X.L.; Jiang, Z.F.; Huang, H.C. Roles of O-GlcNAcylation on amyloid-β precursor protein processing, tau phosphorylation, and hippocampal synapses dysfunction in Alzheimer's disease. Neurol. Res. 2016, 38, 177–186. [Google Scholar] [CrossRef]
- Zhu, Y.; Shan, X.; Yuzwa, S.A.; Vocadlo, D.J. The emerging link between O-GlcNAc and Alzheimer disease. J. Biol. Chem. 2014, 289, 34472–34481. [Google Scholar] [CrossRef]
- Park, J.; Lai, M.K.P.; Arumugam, T.V.; Jo, D.G. O-GlcNAcylation as a Therapeutic Target for Alzheimer's Disease. Neuromolecular Med. 2020, 22, 171–193. [Google Scholar] [CrossRef]
- Pinho, T.S.; Verde, D.M.; Correia, S.C.; Cardoso, S.M.; Moreira, P.I. O-GlcNAcylation and neuronal energy status: Implications for Alzheimer's disease. Ageing Res. Rev. 2018, 46, 32–41. [Google Scholar] [CrossRef]
- Williams, M.J.; Almén, M.S.; Fredriksson, R.; Schiöth, H.B. What model organisms and interactomics can reveal about the genetics of human obesity. Cell Mol. Life Sci. 2012, 69, 3819–3834. [Google Scholar] [CrossRef]
- Yılmaz, B.; Gezmen Karadağ, M. The current review of adolescent obesity: The role of genetic factors. J. Pediatr. Endocrinol. Metab. 2021, 34, 151–162. [Google Scholar] [CrossRef]
- Gao, L.W.; Zhang, M.X.; Wu, L.J.; Fu, L.W.; Zhao, X.Y.; Mi, J. [Association between rs10938397 polymorphism in GNPDA2 and obesity in children at different stages of development].
- Hotta, K.; Nakamura, M.; Nakamura, T.; Matsuo, T.; Nakata, Y.; Kamohara, S.; Miyatake, N.; Kotani, K.; Komatsu, R.; Itoh, N.; et al. Association between obesity and polymorphisms in SEC16B, TMEM18, GNPDA2, BDNF, FAIM2 and MC4R in a Japanese population. J. Hum. Genet. 2009, 54, 727–731. [Google Scholar] [CrossRef] [PubMed]
- Paquet, D.; Bhat, R.; Sydow, A.; Mandelkow, E.M.; Berg, S.; Hellberg, S.; Fälting, J.; Distel, M.; Köster, R.W.; Schmid, B.; et al. A zebrafish model of tauopathy allows in vivo imaging of neuronal cell death and drug evaluation. J. Clin. Invest. 2009, 119, 1382–1395. [Google Scholar] [CrossRef]
- Shevchenko, A.; Tomas, H.; Havlis, J.; Olsen, J.V.; Mann, M. In-gel digestion for mass spectrometric characterization of proteins and proteomes. Nat. Protoc. 2006, 1, 2856–2860. [Google Scholar] [CrossRef] [PubMed]
- Kopylova, E.; Noé, L.; Touzet, H. SortMeRNA: Fast and accurate filtering of ribosomal RNAs in metatranscriptomic data. Bioinformatics 2012, 28, 3211–3217. [Google Scholar] [CrossRef]
- Kim, D.; Paggi, J.M.; Park, C.; Bennett, C.; Salzberg, S.L. Graph-based genome alignment and genotyping with HISAT2 and HISAT-genotype. Nat Biotechnol 2019, 37, 907–915. [Google Scholar] [CrossRef]
- Okonechnikov, K.; Conesa, A.; García-Alcalde, F. Qualimap 2: Advanced multi-sample quality control for high-throughput sequencing data. Bioinformatics 2016, 32, 292–294. [Google Scholar] [CrossRef]
- Li, H.; Handsaker, B.; Wysoker, A.; Fennell, T.; Ruan, J.; Homer, N.; Marth, G.; Abecasis, G.; Durbin, R. The Sequence Alignment/Map format and SAMtools. Bioinformatics 2009, 25, 2078–2079. [Google Scholar] [CrossRef] [PubMed]
- Liao, Y.; Smyth, G.K.; Shi, W. featureCounts: An efficient general purpose program for assigning sequence reads to genomic features. Bioinformatics 2014, 30, 923–930. [Google Scholar] [CrossRef]
- Love, M.I.; Huber, W.; Anders, S. Moderated estimation of fold change and dispersion for RNA-seq data with DESeq2. Genome Biol 2014, 15, 550. [Google Scholar] [CrossRef]
- Varet, H.; Brillet-Guéguen, L.; Coppée, J.Y.; Dillies, M.A. SARTools: A DESeq2- and EdgeR-Based R Pipeline for Comprehensive Differential Analysis of RNA-Seq Data. PLoS ONE 2016, 11, e0157022. [Google Scholar] [CrossRef] [PubMed]
- Tyanova, S.; Temu, T.; Sinitcyn, P.; Carlson, A.; Hein, M.Y.; Geiger, T.; Mann, M.; Cox, J. The Perseus computational platform for comprehensive analysis of (prote)omics data. Nat. Methods 2016, 13, 731–740. [Google Scholar] [CrossRef] [PubMed]
- Zhou, Y.; Zhou, B.; Pache, L.; Chang, M.; Khodabakhshi, A.H.; Tanaseichuk, O.; Benner, C.; Chanda, S.K. Metascape provides a biologist-oriented resource for the analysis of systems-level datasets. Nat. Commun. 2019, 10, 1523. [Google Scholar] [CrossRef] [PubMed]
- Lachén-Montes, M.; González-Morales, A.; Zelaya, M.V.; Pérez-Valderrama, E.; Ausín, K.; Ferrer, I.; Fernández-Irigoyen, J.; Santamaría, E. Olfactory bulb neuroproteomics reveals a chronological perturbation of survival routes and a disruption of prohibitin complex during Alzheimer's disease progression. Sci. Rep. 2017, 7, 9115. [Google Scholar] [CrossRef] [PubMed]
- Almeida, M.F.; Chaves, R.S.; Silva, C.M.; Chaves, J.C.S.; Melo, K.P.; Ferrari, M.F.R. BDNF trafficking and signaling impairment during early neurodegeneration is prevented by moderate physical activity. IBRO Rep. 2016, 1, 19–31. [Google Scholar] [CrossRef] [PubMed]
- Dahl, R.; Mygind, N. Anatomy, physiology and function of the nasal cavities in health and disease. Adv. Drug Deliv. Rev. 1998, 29, 3–12. [Google Scholar] [CrossRef] [PubMed]
- Jang, J.; Yeo, S.; Baek, S.; Jung, H.J.; Lee, M.S.; Choi, S.H.; Choe, Y. Abnormal accumulation of extracellular vesicles in hippocampal dystrophic axons and regulation by the primary cilia in Alzheimer's disease. Acta Neuropathol. Commun. 2023, 11, 142. [Google Scholar] [CrossRef] [PubMed]
- Lau, C.G.; Zukin, R.S. NMDA receptor trafficking in synaptic plasticity and neuropsychiatric disorders. Nat. Rev. Neurosci. 2007, 8, 413–426. [Google Scholar] [CrossRef]
- Du, Z.; Song, Y.; Chen, X.; Zhang, W.; Zhang, G.; Li, H.; Chang, L.; Wu, Y. Knockdown of astrocytic Grin2a aggravates β-amyloid-induced memory and cognitive deficits through regulating nerve growth factor. Aging Cell 2021, 20, e13437. [Google Scholar] [CrossRef]
- Guinez, C.; Mir, A.M.; Dehennaut, V.; Cacan, R.; Harduin-Lepers, A.; Michalski, J.C.; Lefebvre, T. Protein ubiquitination is modulated by O-GlcNAc glycosylation. Faseb J 2008, 22, 2901–2911. [Google Scholar] [CrossRef]
- Ruan, H.B.; Nie, Y.; Yang, X. Regulation of protein degradation by O-GlcNAcylation: Crosstalk with ubiquitination. Mol. Cell Proteom. 2013, 12, 3489–3497. [Google Scholar] [CrossRef] [PubMed]
- Huang, Q.; Figueiredo-Pereira, M.E. Ubiquitin/proteasome pathway impairment in neurodegeneration: Therapeutic implications. Apoptosis 2010, 15, 1292–1311. [Google Scholar] [CrossRef] [PubMed]
- Limantoro, J.; de Liyis, B.G.; Sutedja, J.C. Akt signaling pathway: A potential therapy for Alzheimer’s disease through glycogen synthase kinase 3 beta inhibition.
- Lee, M.; Kim, D.W.; Khalmuratova, R.; Shin, S.H.; Kim, Y.M.; Han, D.H.; Kim, H.J.; Kim, D.Y.; Rhee, C.S.; Park, J.W. The IFN-γ-p38, ERK kinase axis exacerbates neutrophilic chronic rhinosinusitis by inducing the epithelial-to-mesenchymal transition. Mucosal Immunol. 2019, 12, 601–611. [Google Scholar] [CrossRef] [PubMed]
- Li, T.; Li, Y.; Zhang, G. [The variations of p38 MAPK activity on lipopolysaccharide-induced inflammation of nasal epithelial cells and its significance in vitro]. Lin Chuang Er Bi Yan Hou Ke Za Zhi 2005, 19, 607–610. [Google Scholar] [PubMed]
- Dehvari, N.; Isacsson, O.; Winblad, B.; Cedazo-Minguez, A.; Cowburn, R.F. Presenilin regulates extracellular regulated kinase (Erk) activity by a protein kinase C alpha dependent mechanism. Neurosci. Lett. 2008, 436, 77–80. [Google Scholar] [CrossRef] [PubMed]
- Subramaniam, S.; Zirrgiebel, U.; von Bohlen Und Halbach, O.; Strelau, J.; Laliberté, C.; Kaplan, D.R.; Unsicker, K. ERK activation promotes neuronal degeneration predominantly through plasma membrane damage and independently of caspase-3. J Cell Biol 2004, 165, 357–369. [Google Scholar] [CrossRef] [PubMed]
- Lee, J.K.; Kim, N.J. Recent Advances in the Inhibition of p38 MAPK as a Potential Strategy for the Treatment of Alzheimer's Disease. Molecules 2017, 22. [Google Scholar] [CrossRef] [PubMed]
- Munoz, L.; Ammit, A.J. Targeting p38 MAPK pathway for the treatment of Alzheimer's disease. Neuropharmacology 2010, 58, 561–568. [Google Scholar] [CrossRef] [PubMed]
- Bachstetter, A.D.; Xing, B.; de Almeida, L.; Dimayuga, E.R.; Watterson, D.M.; Van Eldik, L.J. Microglial p38α MAPK is a key regulator of proinflammatory cytokine up-regulation induced by toll-like receptor (TLR) ligands or beta-amyloid (Aβ). J Neuroinflammation 2011, 8, 79. [Google Scholar] [CrossRef]
- LaFerla, F.M.; Green, K.N. Animal models of Alzheimer disease. Cold Spring Harb. Perspect. Med. 2012, 2. [Google Scholar] [CrossRef]
- Harada, A.; Oguchi, K.; Okabe, S.; Kuno, J.; Terada, S.; Ohshima, T.; Sato-Yoshitake, R.; Takei, Y.; Noda, T.; Hirokawa, N. Altered microtubule organization in small-calibre axons of mice lacking tau protein. Nature 1994, 369, 488–491. [Google Scholar] [CrossRef] [PubMed]
- Dawson, H.N.; Ferreira, A.; Eyster, M.V.; Ghoshal, N.; Binder, L.I.; Vitek, M.P. Inhibition of neuronal maturation in primary hippocampal neurons from tau deficient mice. J. Cell Sci. 2001, 114, 1179–1187. [Google Scholar] [CrossRef] [PubMed]
- Pérez, M.; Morán, M.A.; Ferrer, I.; Avila, J.; Gómez-Ramos, P. Phosphorylated tau in neuritic plaques of APP(sw)/Tau (vlw) transgenic mice and Alzheimer disease. Acta Neuropathol. 2008, 116, 409–418. [Google Scholar] [CrossRef] [PubMed]
- López-González, I.; Aso, E.; Carmona, M.; Armand-Ugon, M.; Blanco, R.; Naudí, A.; Cabré, R.; Portero-Otin, M.; Pamplona, R.; Ferrer, I. Neuroinflammatory Gene Regulation, Mitochondrial Function, Oxidative Stress, and Brain Lipid Modifications With Disease Progression in Tau P301S Transgenic Mice as a Model of Frontotemporal Lobar Degeneration-Tau. J Neuropathol Exp Neurol 2015, 74, 975–999. [Google Scholar] [CrossRef] [PubMed]
- Evans, H.T.; Taylor, D.; Kneynsberg, A.; Bodea, L.G.; Götz, J. Altered ribosomal function and protein synthesis caused by tau. Acta Neuropathol. Commun. 2021, 9, 110. [Google Scholar] [CrossRef] [PubMed]
- Evans, H.T.; Benetatos, J.; van Roijen, M.; Bodea, L.G.; Götz, J. Decreased synthesis of ribosomal proteins in tauopathy revealed by non-canonical amino acid labelling. Embo J 2019, 38, e101174. [Google Scholar] [CrossRef] [PubMed]
- Lomonosova, E.; Chinnadurai, G. BH3-only proteins in apoptosis and beyond: An overview. Oncogene 2008, 27 Suppl 1, S2–19. [Google Scholar] [CrossRef]
- Braissant, O.; Henry, H.; Villard, A.M.; Zurich, M.G.; Loup, M.; Eilers, B.; Parlascino, G.; Matter, E.; Boulat, O.; Honegger, P.; et al. Ammonium-induced impairment of axonal growth is prevented through glial creatine. J. Neurosci. 2002, 22, 9810–9820. [Google Scholar] [CrossRef] [PubMed]
- Buzańska, L.; Zabłocka, B.; Dybel, A.; Domańska-Janik, K.; Albrecht, J. Delayed induction of apoptosis by ammonia in C6 glioma cells. Neurochem. Int. 2000, 37, 287–297. [Google Scholar] [CrossRef]
- Sims, B.; Powers, R.E.; Sabina, R.L.; Theibert, A.B. Elevated adenosine monophosphate deaminase activity in Alzheimer's disease brain. Neurobiol. Aging 1998, 19, 385–391. [Google Scholar] [CrossRef]
- Clayton, J.A. Sex influences in neurological disorders: Case studies and perspectives. Dialogues Clin. Neurosci. 2016, 18, 357–360. [Google Scholar] [CrossRef] [PubMed]
- Subramaniapillai, S.; Almey, A.; Natasha Rajah, M.; Einstein, G. Sex and gender differences in cognitive and brain reserve: Implications for Alzheimer's disease in women. Front. Neuroendocrinol. 2021, 60, 100879. [Google Scholar] [CrossRef] [PubMed]
- Park, J.C.; Lim, H.; Byun, M.S.; Yi, D.; Byeon, G.; Jung, G.; Kim, Y.K.; Lee, D.Y.; Han, S.H.; Mook-Jung, I. Sex differences in the progression of glucose metabolism dysfunction in Alzheimer's disease. Exp. Mol. Med. 2023, 55, 1023–1032. [Google Scholar] [CrossRef] [PubMed]
Figure 1.
Identification of GNPDA2 molecular interactors. A) Immunoprecipitation (IP) assay was performed in protein extracts from a human olfactory cell line. ERK antibody and recombinant GNPDA2 (His-tag) were used as assay controls (left). Metascape analysis showing biological pathways governed by GNPDA2 interactors (right). B) GO analysis showing cellular localization of specific GNPDA2 interactors. C) Venn diagram showing common GNPDA2, APP and Tau interactors.
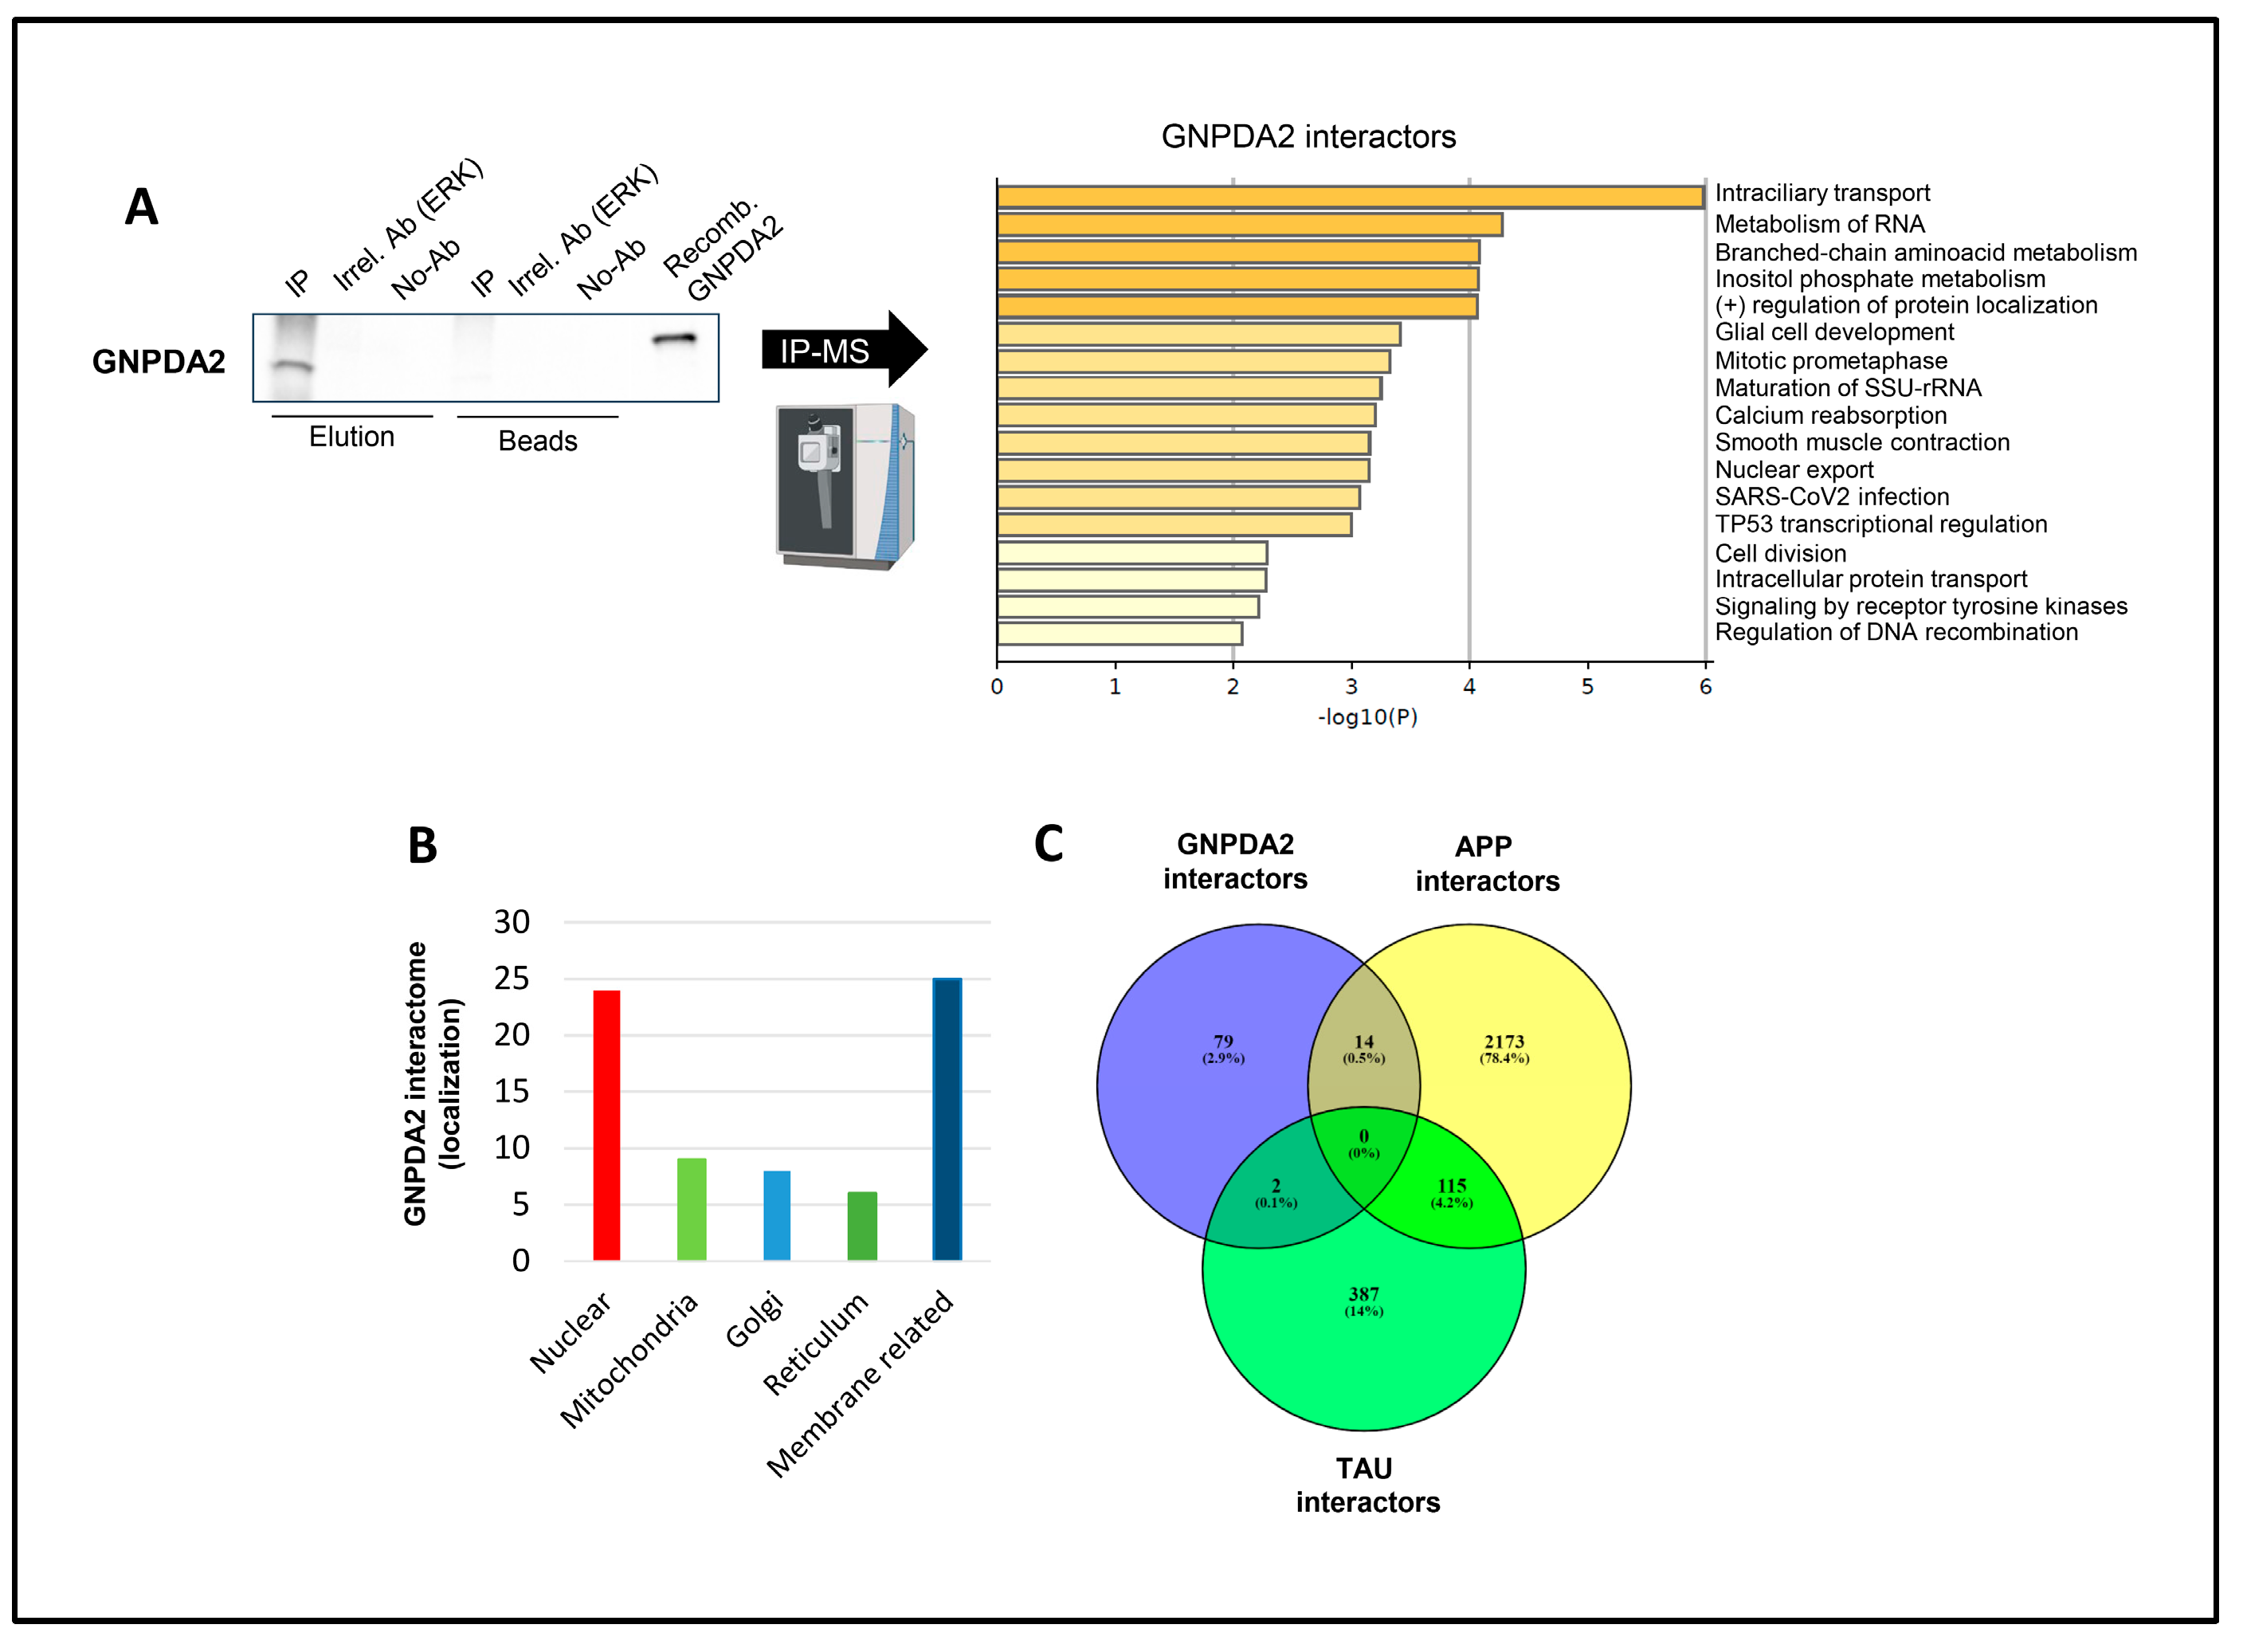
Figure 2.
RNA-seq analysis in hNECs. (A) Brief description of experimental design. (B) Cell proliferation monitoring (by xCELLigence analysis) and the corresponding Volcano plots of differentially expressed genes (in red) across biological conditions: Effect of GNPDA2 overexpression in hNECs, Effect of Aβ treatment after GNPDA2 overexpression in hNECs and effect of Tau P301L treatment after GNPDA2 overexpression in hNECs. (C) Overlap across differential RNA-seq datasets. D) Top-20 functional analysis across the three biological conditions generated by Metascape.
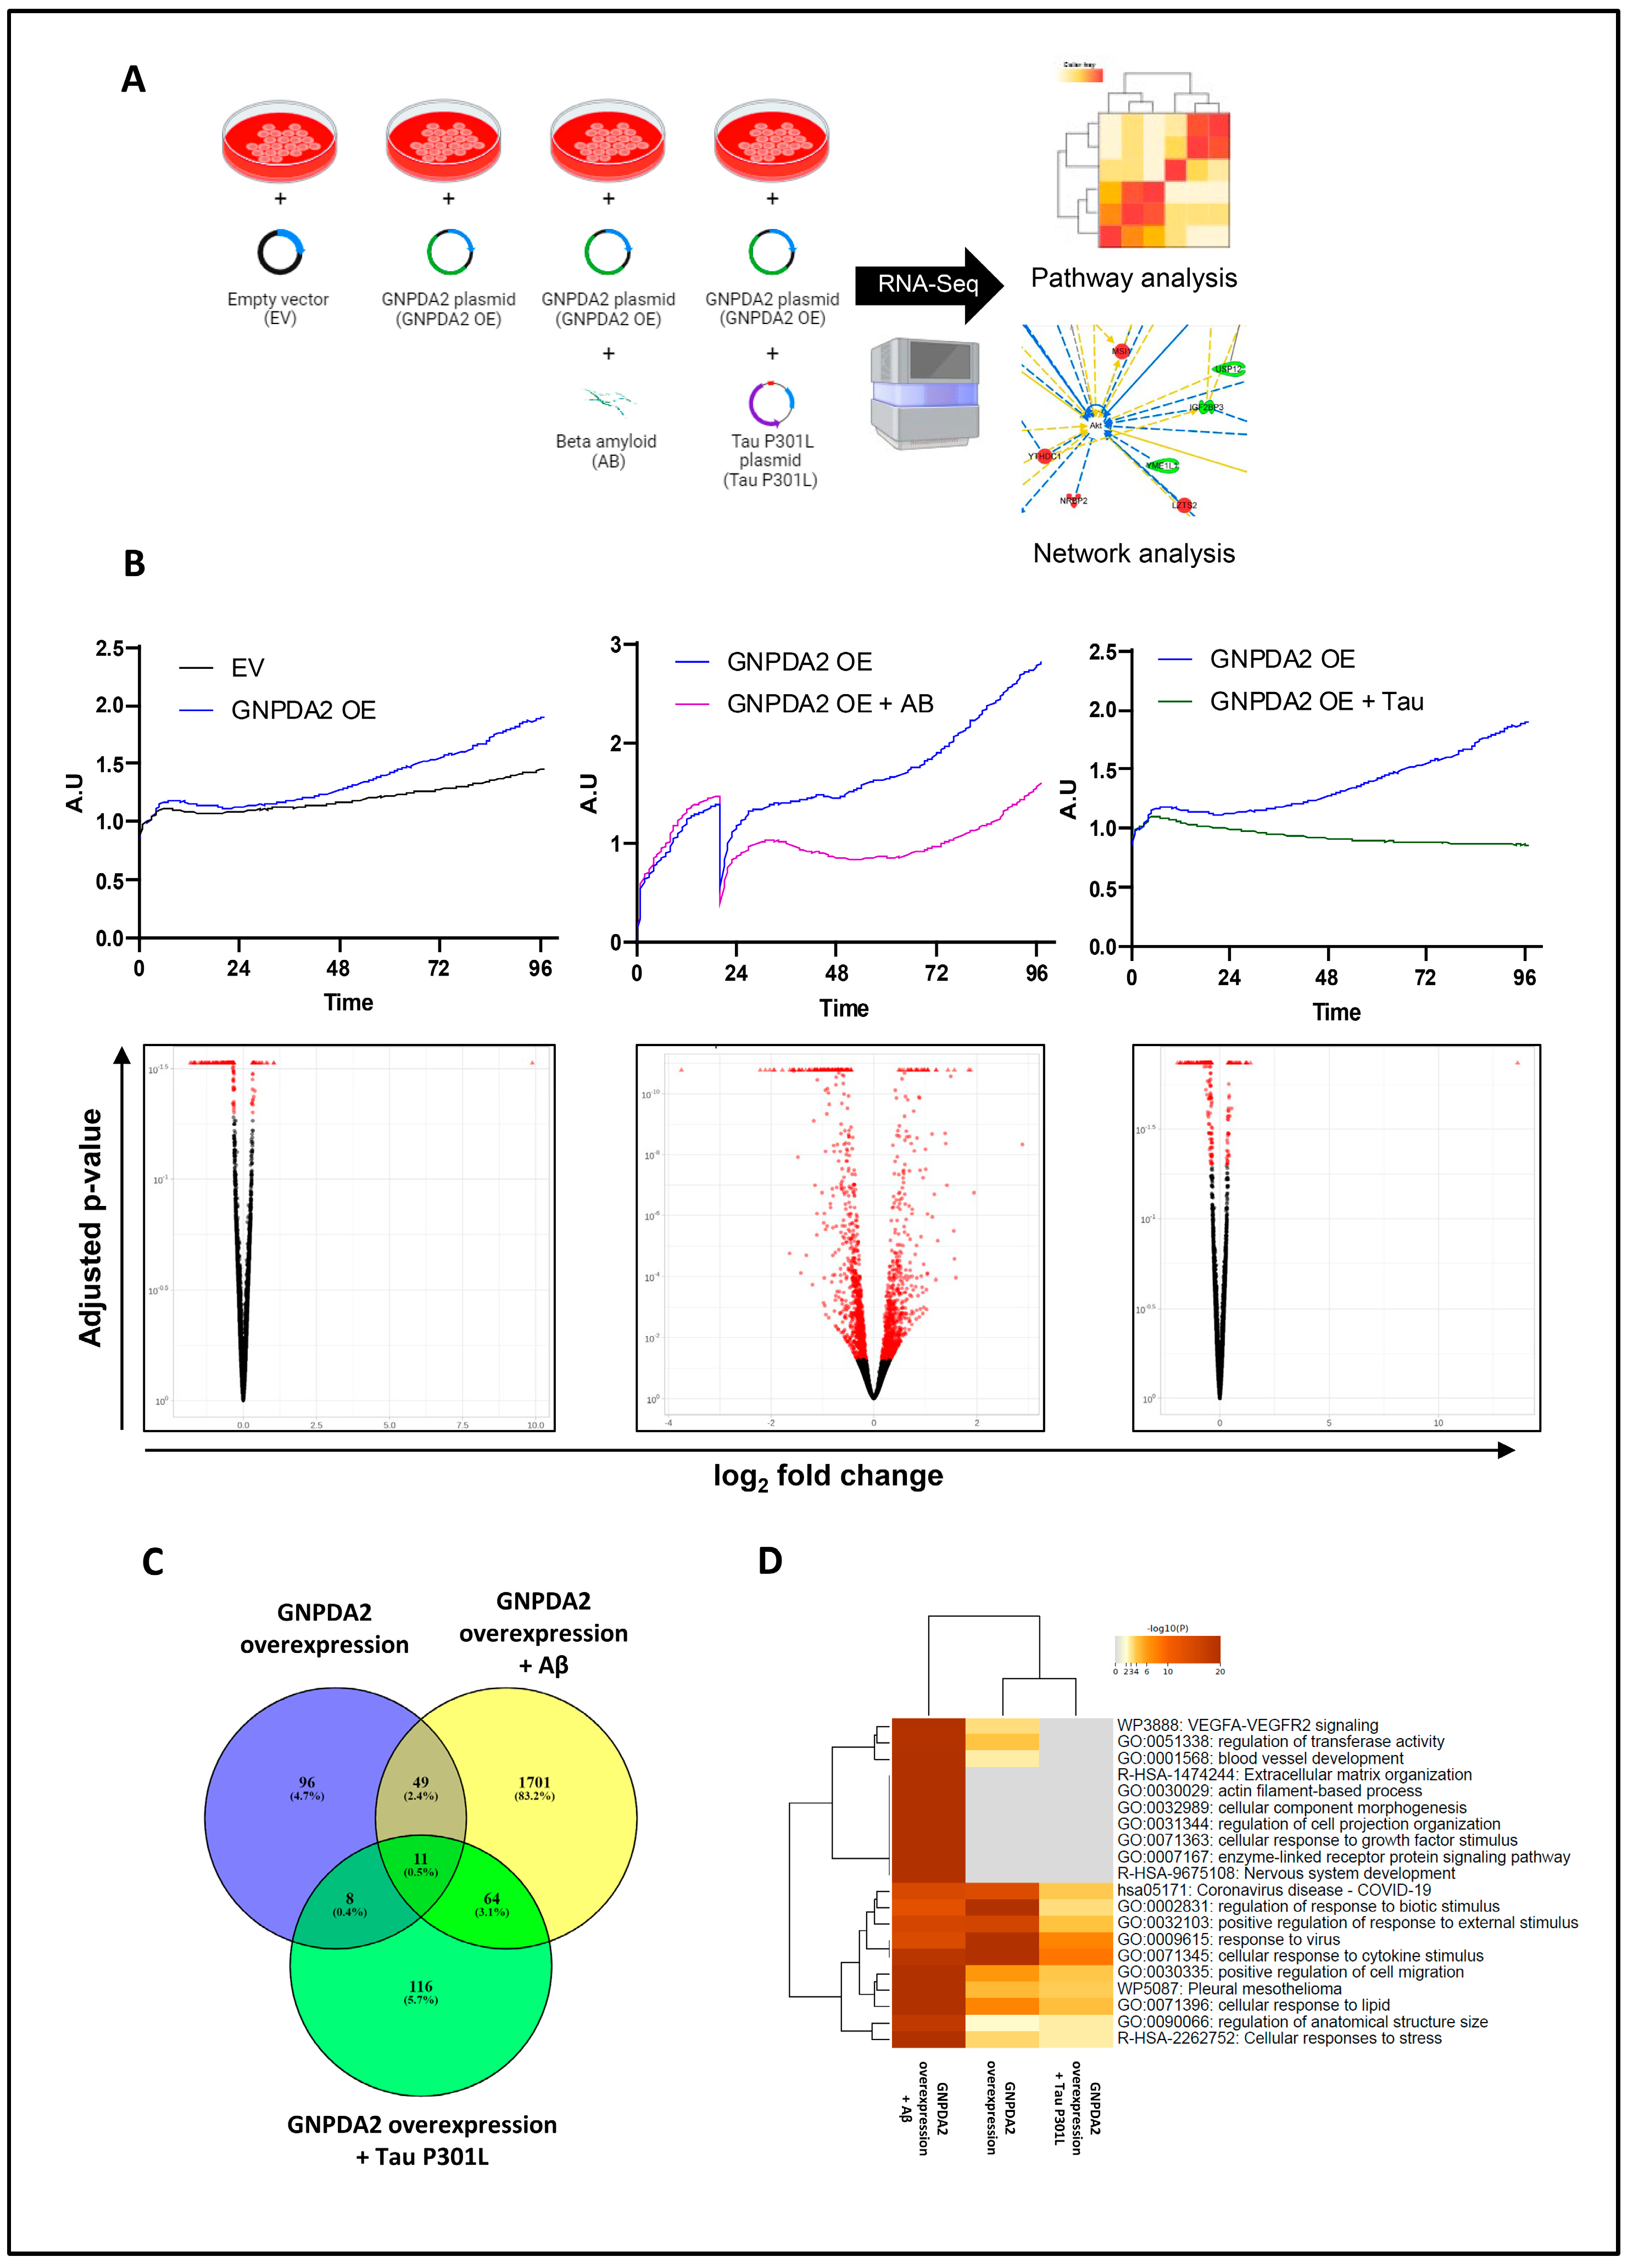
Figure 3.
High-scoring gene interactome maps for differentially expressed genes in hNECs. Representation of the relationships between differentially expressed genes and functional interactors after GNPDA2 overexpression (A), GNPDA2 overexpression and Aβ treatment (B) and GNPDA2 and Tau overexpression (C). .
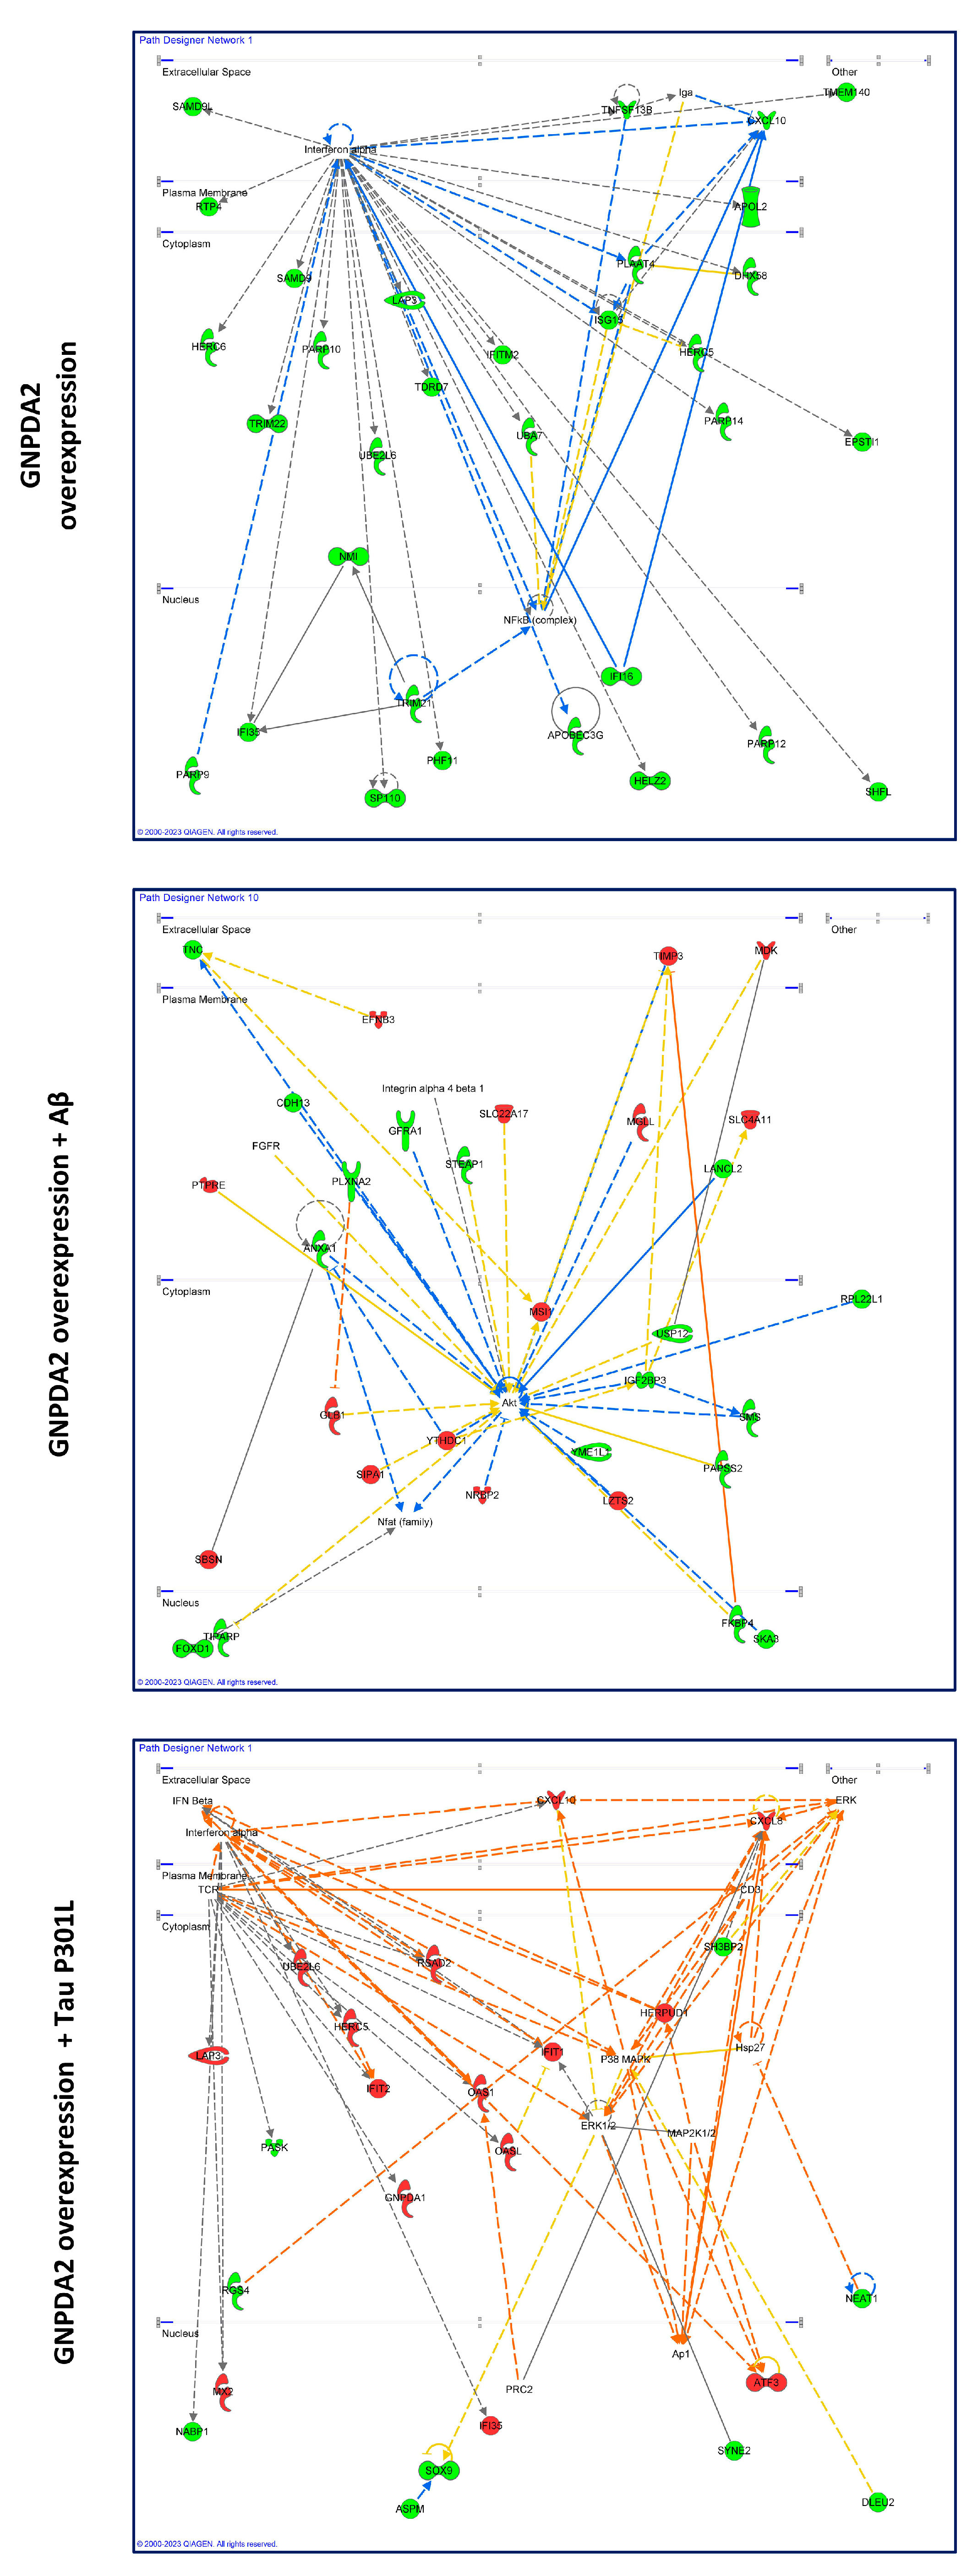
Figure 4.
Study of GNPDA2 overexpression in zf Tau P301L transgenic embryos. (A) Experimental design used in zebrafish model. (B). Representative pictures of 30 hpf not injected embryos or embryos injected with cLuc and GNPDA2 mRNAs (both DsRed/mutant TAU positive and negative embryos) after whole-mount immunostaining with znp1/zn-1 antibodies. White asterisks indicate the position of the 4 axonal extensions quantified in Not Injected Tau- picture. (C) Graph shows the mean ± SEM of the total axon length of the first four caudal primary motoneurons anterior to the end of the yolk extension of the indicated experimental groups. **p<0.01; ***p<0.001. (D) Representative pictures of 48 hpf not injected embryos or embryos injected with cLuc and GNPDA2 RNAs (both DsRed/mutant TAU positive and negative embryos) after TUNEL staining. Spinal cord area, where the number of TUNEL positive cells was quantified, is highlighted in Not Injected Tau- picture. (E) Graph shows the mean ± SEM of the number of TUNEL positive neurons present along the spinal cord area of the indicated experimental groups. **p<0.01; ***p<0.001. (F) Western Blot developed with anti-Tau (Phospho S396), anti-Tau (total) and anti-GNPDA2 antibodies of 48 hpf embryos from the indicated experimental groups. Ponceau S red staining corresponding to fragments used for developing pTau and total Tau are shown below each antibody-specific staining. Numbers correspond to the optical density quantification (arbitrary units) of Ser396 phosphorylated Tau with respect total Tau levels.

Figure 5.
Proteomics in h.Tau P301L zebrafish embryos. (A) Heatmap representation showing differential expressed proteins (DEPs) between Not injected Tau – and Not injected Tau +. (B) Functional clustering of DEPs between Not injected Tau – and Not injected Tau + using Metascape. (C) Venn diagram showing DEPs previously described as Tau interactors (D) Synaptic ontology analysis (subcellular distribution) of DEPs using SynGo tool.
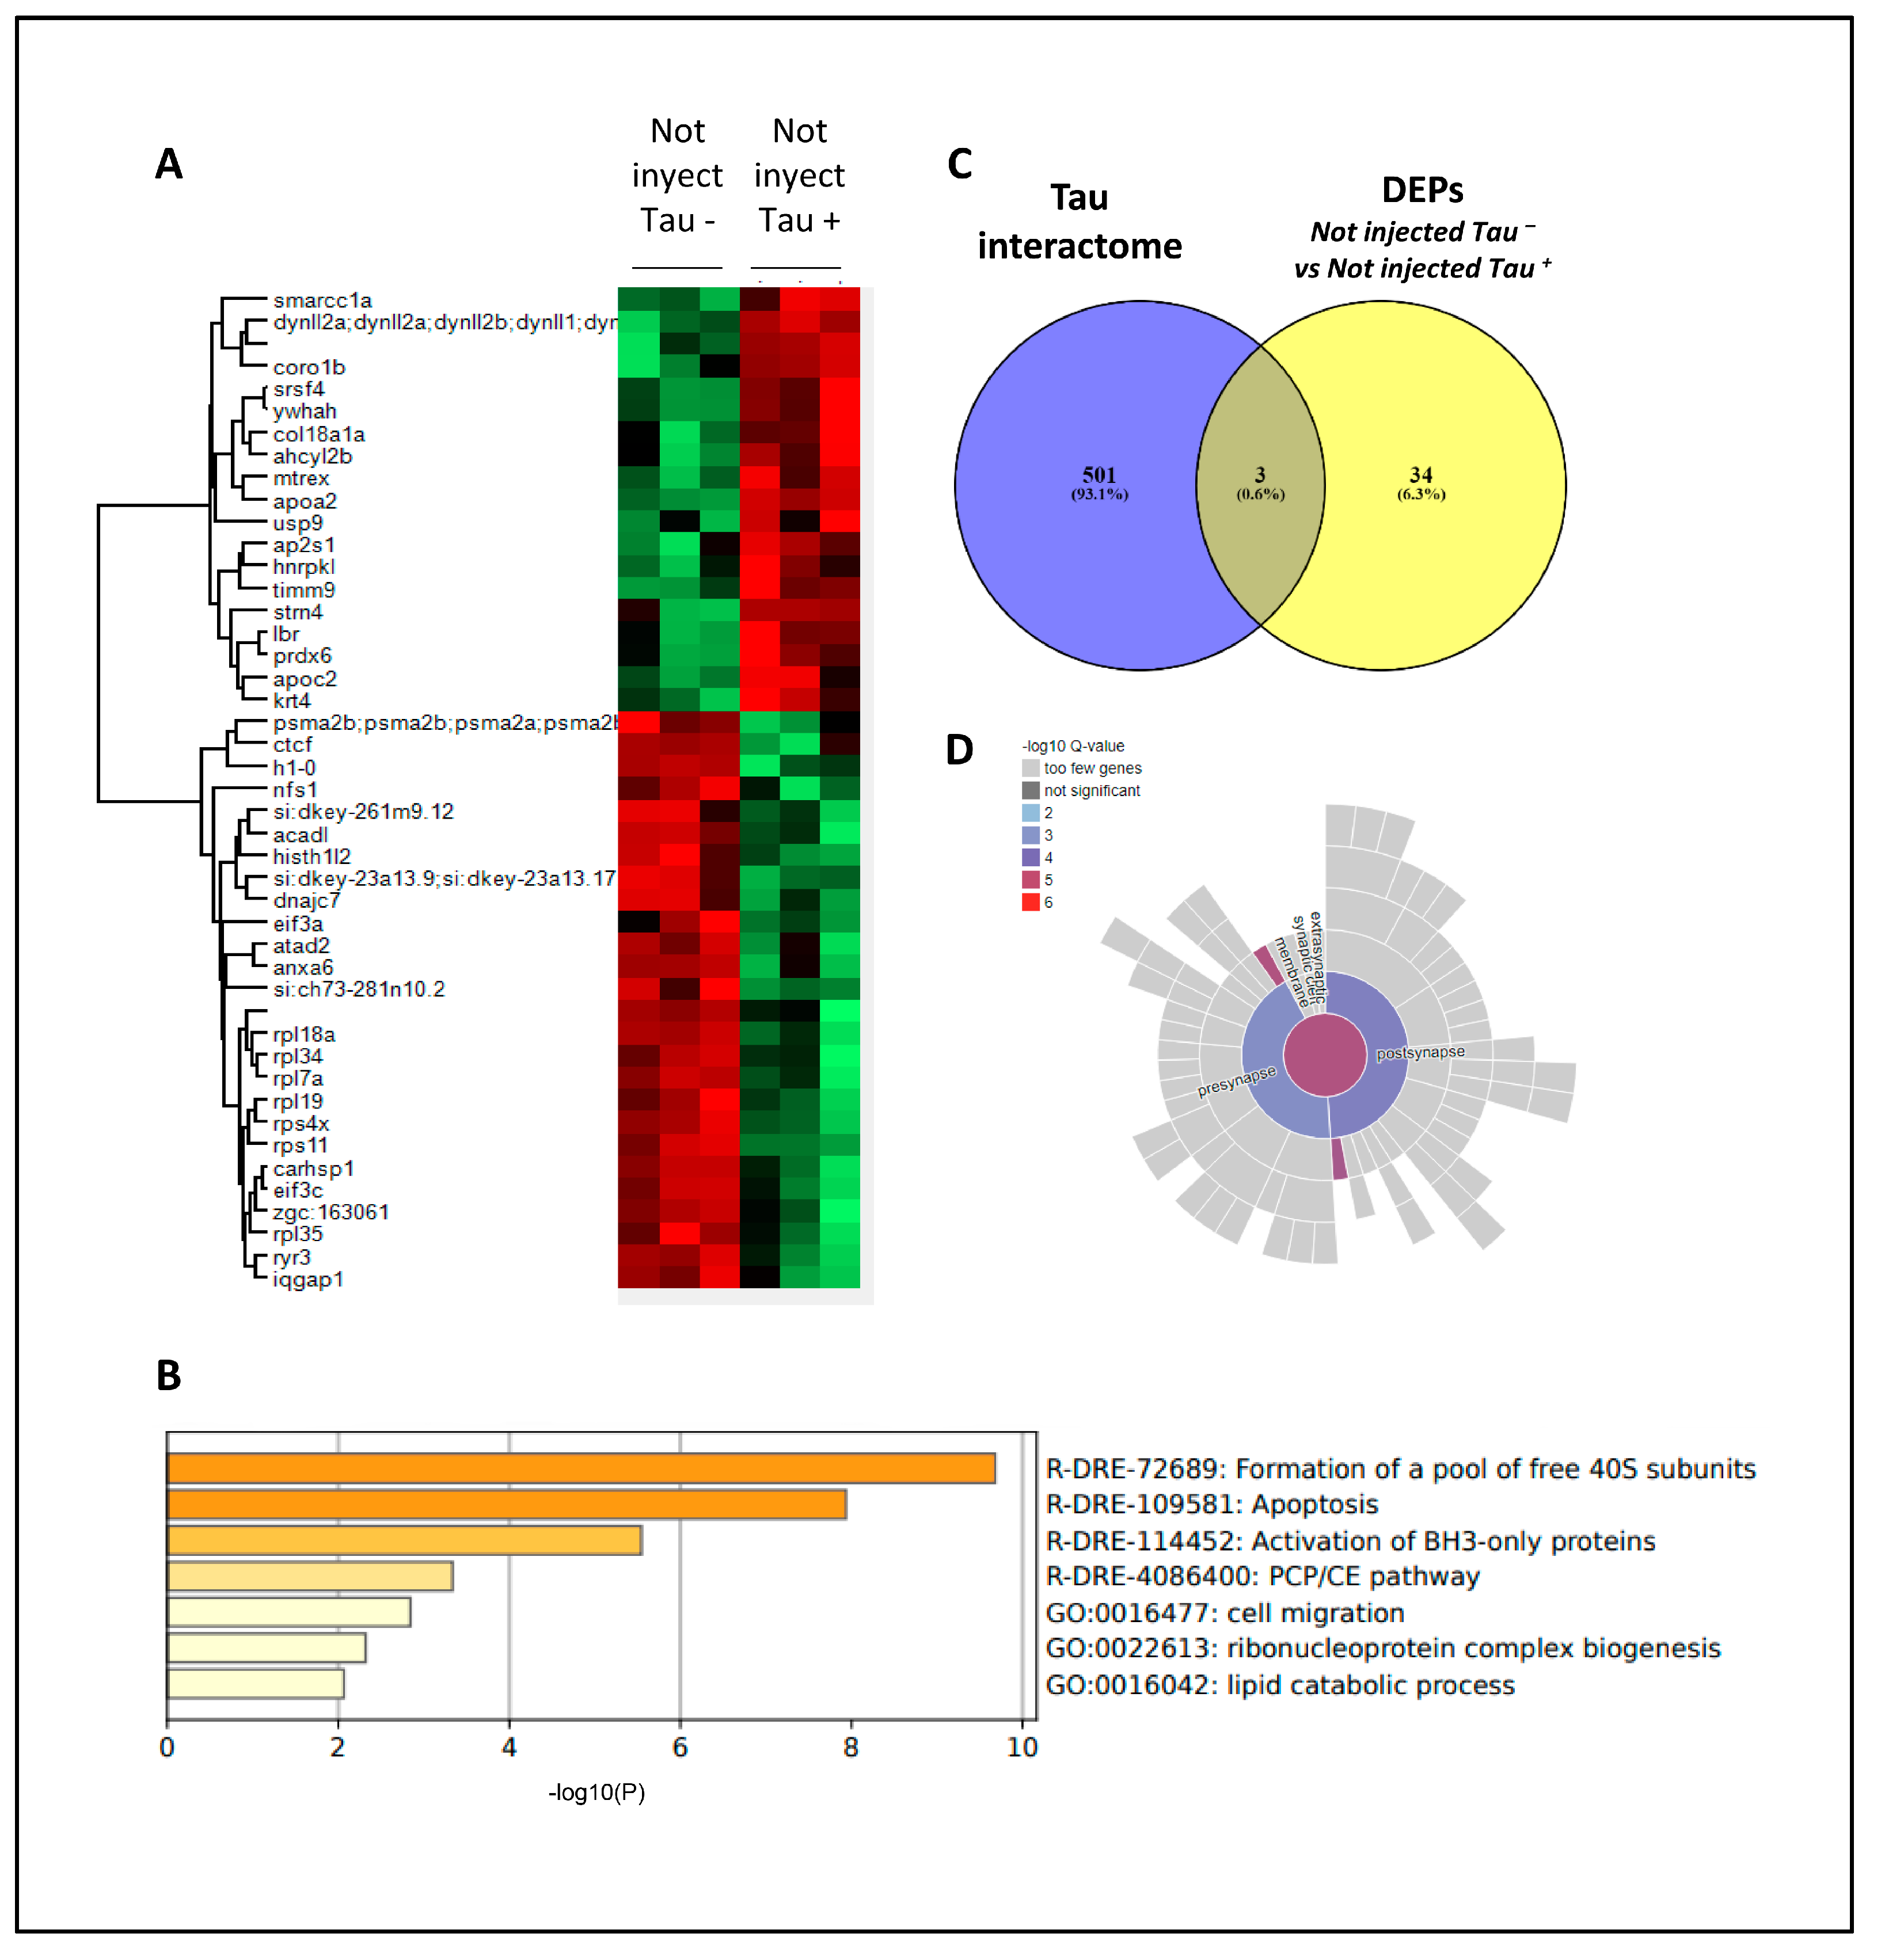
Figure 6.
Differential expressed proteins across Tau P301L embryos overexpressing GNPDA2. (A) Heatmap representing the differential zebrafish proteome across Not injected Tau-, Not injected Tau+ embryos, cLUC Tau+ and GNPDA2 Tau+ embryos. (B) Protein clusters specifically modulated across the different experimental conditions and functional clustering based on the specific zebrafish disrupted proteomes.
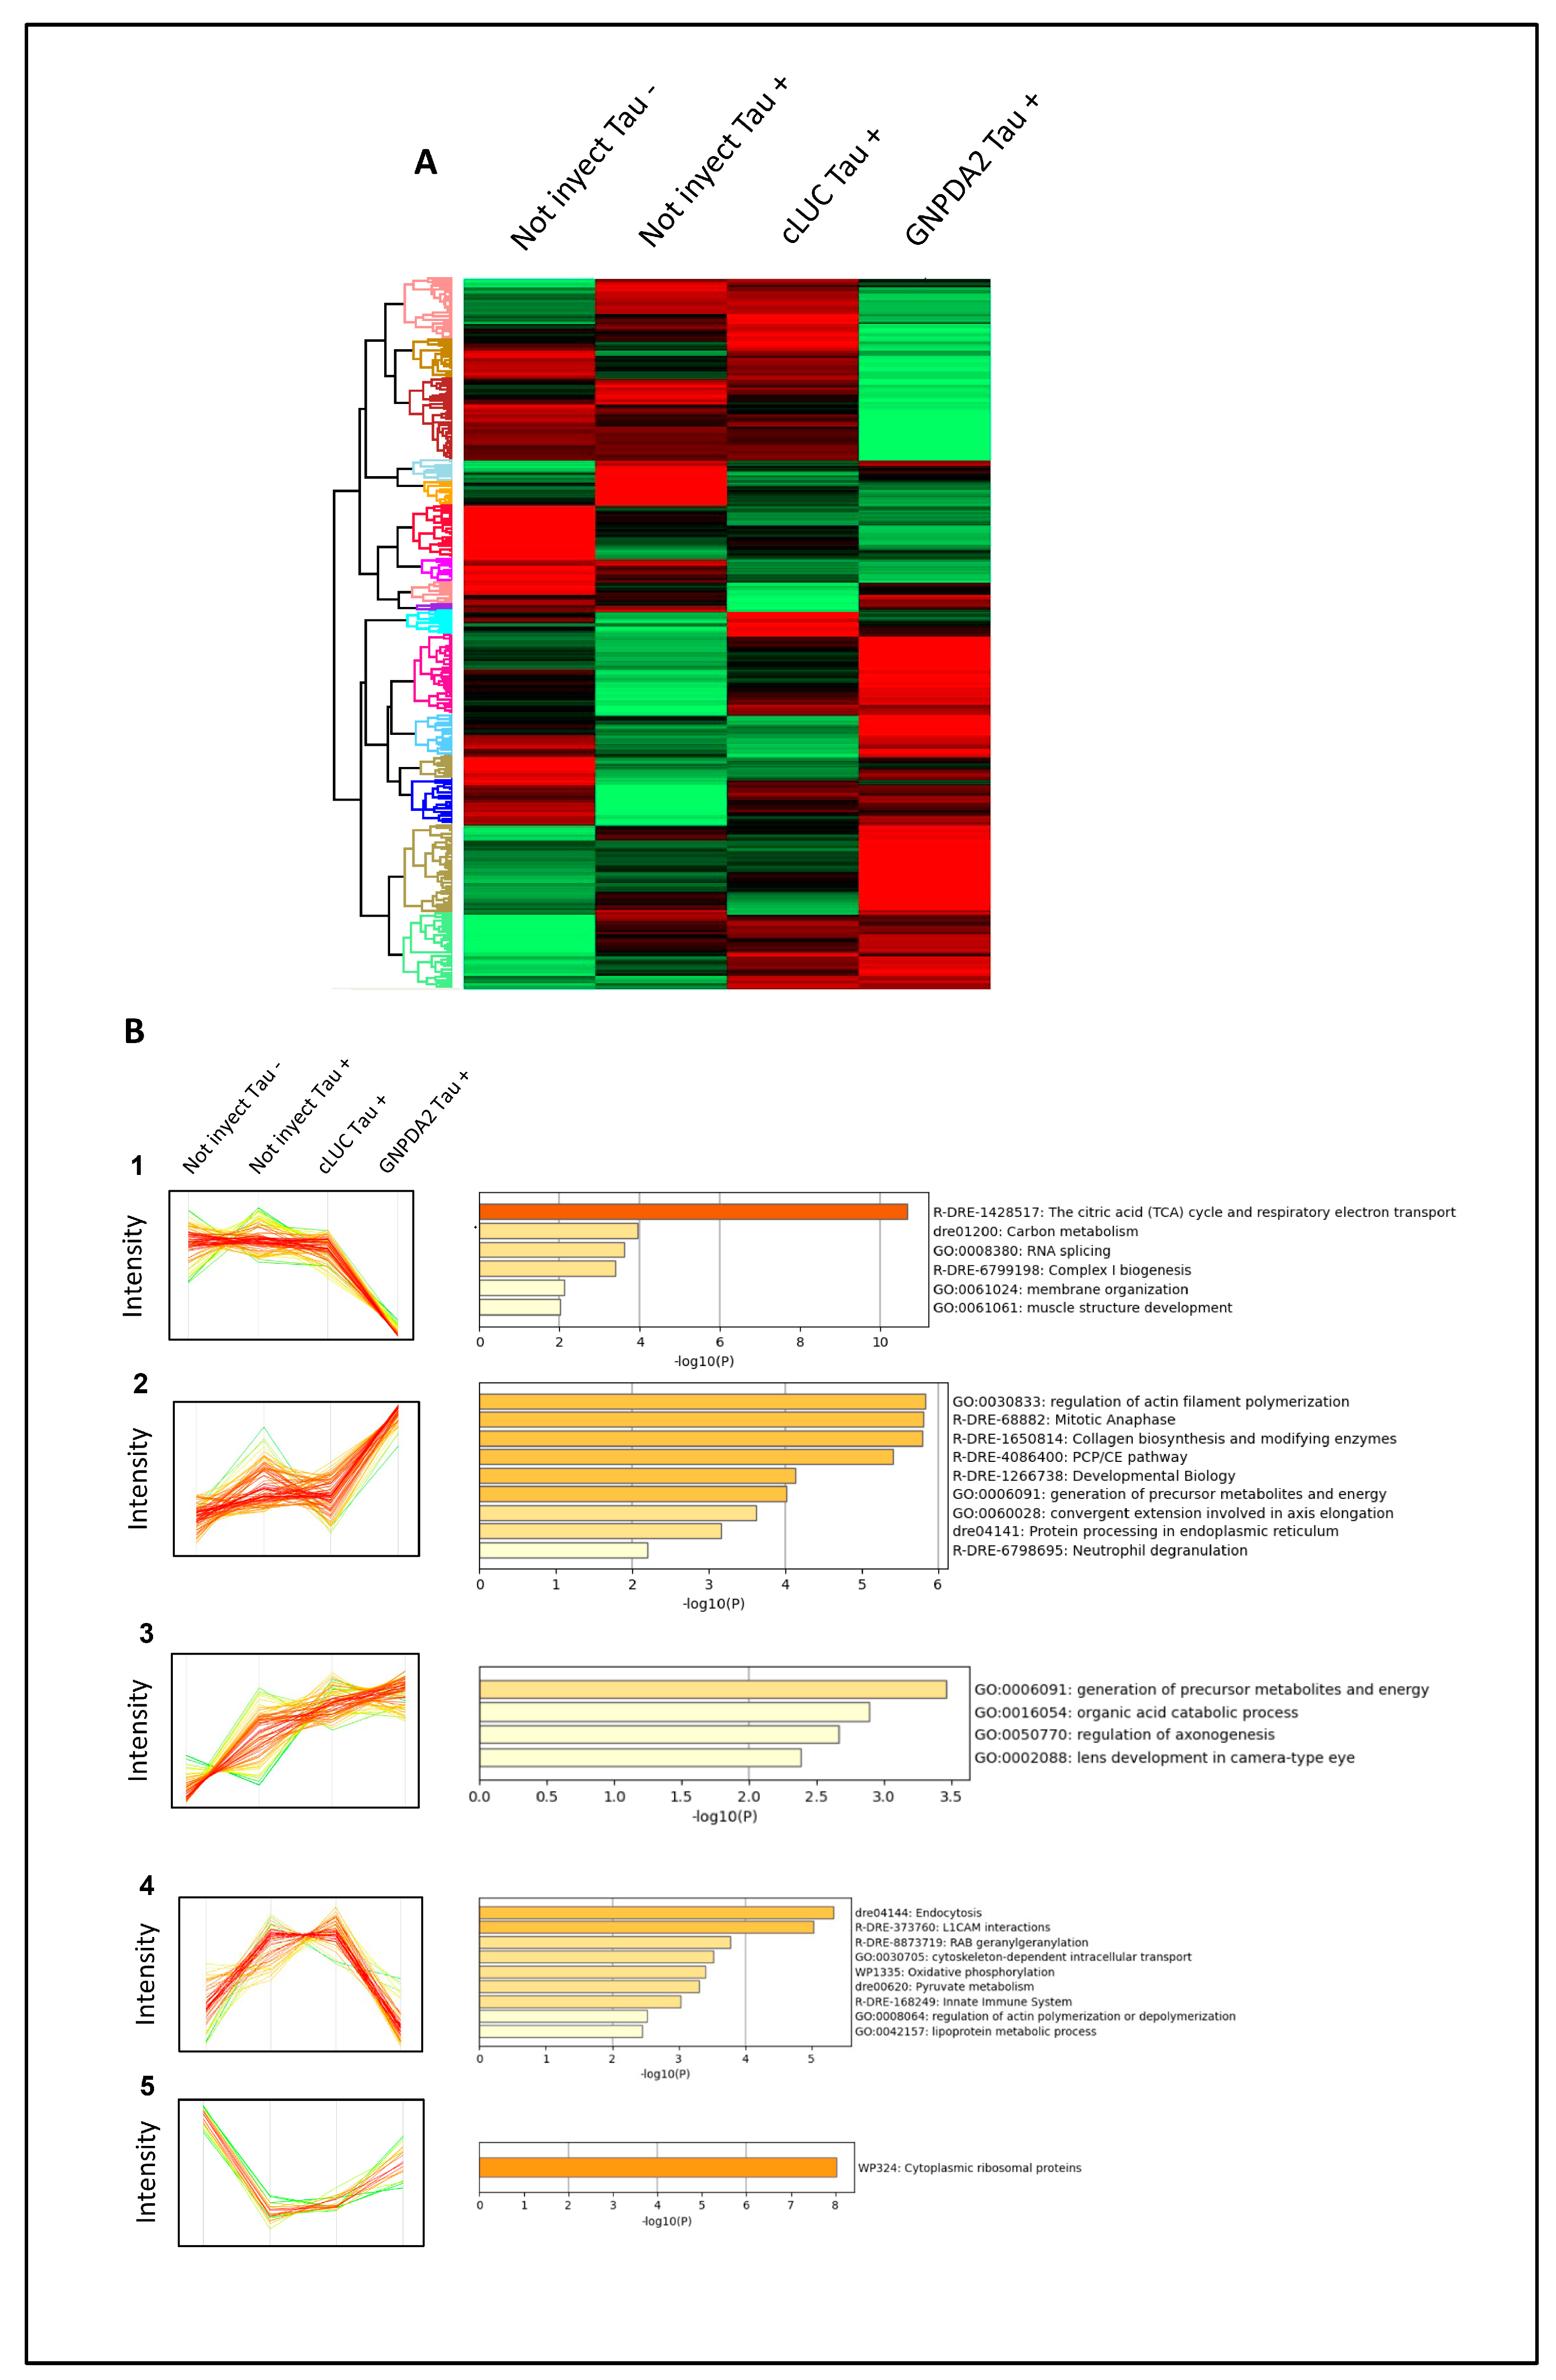
Figure 7.
Serum GNPDA2 levels across neurological disorders. (A) GNPDA2 levels measured in the sera derived from 187 individuals with different neurological syndromes. (B) Sex specific analysis across neurological disorders. (71 controls; mean age: 69,2 years; 40M/31F, 40 AD subjects: mean age: 75,1 years; 20M/20F, 40 PSP subjects; mean age: 67,9 years; 15M/25F), 40 DFT subjects; mean age: 69,5 years; 20M/20F), 12 DLB subjects; mean age: 73,5 years; 6M/6F), 12 mixed dementia subjects; mean age: 78,5; 6M/6F; 12 ALS subjects; mean age: 57,8 years; 5M/7F); by ELISA (Mann–Whitney U test; ** p-value < 0,01; *** p-value: 0,001).
Disclaimer/Publisher’s Note: The statements, opinions and data contained in all publications are solely those of the individual author(s) and contributor(s) and not of MDPI and/or the editor(s). MDPI and/or the editor(s) disclaim responsibility for any injury to people or property resulting from any ideas, methods, instructions or products referred to in the content. |
© 2024 by the authors. Licensee MDPI, Basel, Switzerland. This article is an open access article distributed under the terms and conditions of the Creative Commons Attribution (CC BY) license (http://creativecommons.org/licenses/by/4.0/).
Copyright: This open access article is published under a Creative Commons CC BY 4.0 license, which permit the free download, distribution, and reuse, provided that the author and preprint are cited in any reuse.


