1. Introduction
Zeolites are lightweight ceramic materials because they have a crystalline lattice particularly reach of cavities [
1,
2,
3]. The crystalline lattice of zeolites consists of a three-dimensional aluminosilicate network, composed of SiO
4 and AlO
4 tetrahedra connected together by the oxygen atoms [
4]. Since negative charges are present in the aluminosilicate framework, extra-framework cations are required for the material electroneutrality condition. Monovalent metal cations are located close to the aluminum atoms in order to balance their negative charges, while bivalent metal cations are positioned halfway between two neighboring negatively charged sites. In particular, the extra-framework ions, typically present in nature-made zeolites, are alkali (K
+, Na
+) and alkaline-earth (Ca
2+, Mg
2+) metal cations. Since mineral zeolites have mostly aluminous nature, i.e., they are characterized by a low value of the Si/Al ratio, which is usually ranging from 4 to 7 [
5], a large amount of charge balancing metal cations is contained. Many natural zeolites contain also iron, that causes a reddish coloration of the mineral. Iron can be present both in the covalent framework (isomorph substitution of silicon, like in the aluminum case) and/or in the extra-framework, as charge balancing cations (ferric cations, Fe
3+) [
6].
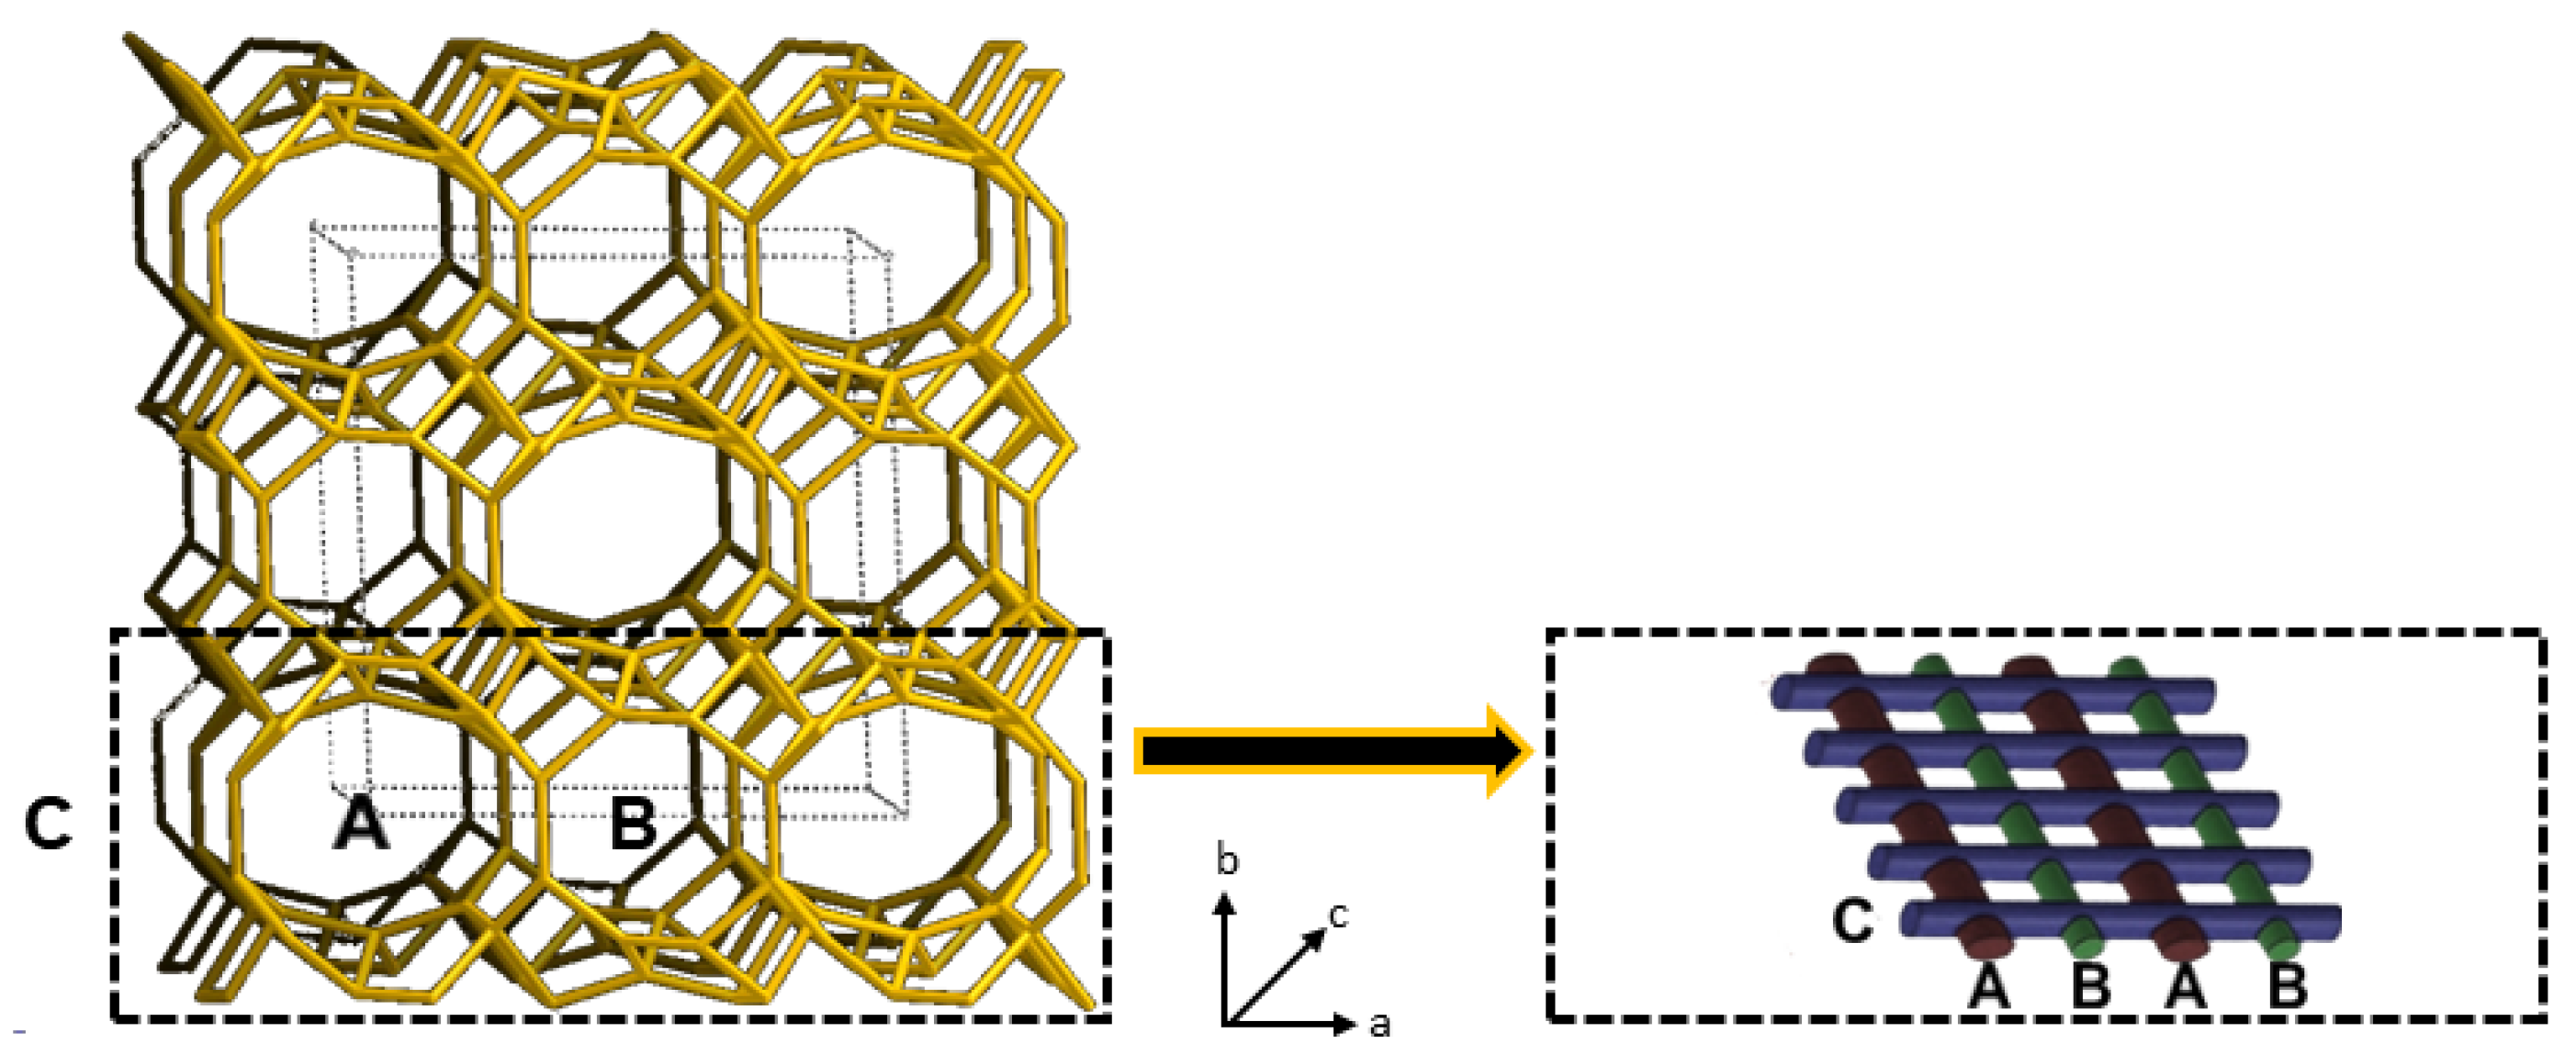
Most zeolites, like for example clinoptilolite, are microporous crystalline materials due to the presence of large and small reticular cavities (α and β cages, respectively). These cages are connected each other to form regular arrays of channels. A schematic representation of channels present in the clinoptilolite crystal is given in
Figure 1. As visible, the silica and alumina tetrahedra, connected together by shared oxygen atoms, form three types of channels that are organized in form of a two-dimensional array. In particular, the A-type (openings: 3.1 – 7.5Å) and B-type (openings: 3.6 – 4.6Å) channels are parallel to each other and parallel to the c-axis, while the C-type channels (openings: 2.8 – 4.7Å), which are parallel to the a-axis, perpendicularly intersect the A and B channels.
Extra-framework cations and adsorbed water molecules are located inside these channels, both close to the aluminum atoms. Owing to the strong electrostatic interaction (Coulomb’s forces) acting between the extra-framework cations and the negatively charged aluminum atoms, such cations practically do not move under the effect of an electric field at room temperature. Actually, the negative charge is not wholly localized on the aluminum atoms, but it is spread by mesomeric effect on a ‘nucleophilic area’, including the aluminum atom and the four neighboring oxygen atoms [
7]. Differently, at high temperatures, cations with low charge density (i.e., K
+ or Na
+) have enough energy for hopping among neighboring empty nucleophilic areas [
8]. Empty nucleophilic areas are contained in the zeolite framework because of the bivalent cations, whose presence leaves a number of unbalanced negative sites in the covalent crystal. Electrical transport in dehydrated zeolites has been investigated by different authors [
9,
10]. They have formulated an electrical conduction model based on the existence of a ‘free ionic conduction zone’ in the crystalline lattice [
11,
12,
13], that consists of free cationic conduction bands located just in the middle of the largest channels (that is, those channels containing super-cages). According to this model, zeolites have negative temperature coefficient behavior, indeed their resistivity significantly decreases in a linear manner with increasing of temperature [
14,
15]. This fully reversible phenomenon could be advantageously exploited for many technological applications, like for example the fabrication of new types of thermistors for the AC circuits [
16], thermal switches/regulators for AC circuits, temperature sensors and many other types of temperature-related devices [
17,
18,
19,
20,
21,
22].
Materials adequate for fabricating NTC devices (e.g., a thermal switch capable to turn on reversibly by heating) must have a quite low electrical conductivity at service temperature (e.g., room temperature) and significantly/rapidly change such value with rising of temperature. This device type could be based on zeolites; however, for showing such special electrical behaviour, the Si/Al atomic ratio is a critical parameter and it needs to have a convenient value, because the zeolite electrical conductivity strictly depends on it. Among the natural zeolite types, the clinoptilolite mineral seems to be the best choice for this application because it has an intermediate value of the Si/Al atomic ratio, which is capable to guarantee electrical insolation at room temperature and a significant electrical conductivity increase by heating (good electrical conductor at high temperature). Indeed, Si/Al atomic ratio is typically ranging from 3.5 to 7 in natural zeolites, and it falls close to 5 for the clinoptilolite mineral. In addition, this natural zeolite possesses a number of further useful characteristics, strictly needful for fabricating chip, stable and robust devices. For example, clinoptilolite is one of the most common types of natural zeolite [
23,
24], widely available on the market at very low cost. This material is non-toxic and biocompatible. In addition, differently from other nature-made zeolites, clinoptilolite has good thermal stability (also in a wet environment) and excellent mechanical proprieties for a natural ceramics due to the highly compact organization of lamellar crystals in its inner structure [
25]. These unique physical/chemical characteristics allow to use clinoptilolite for fabricating very robust functional devices very adequate for an industrial exploitation.
Here, the negative temperature coefficient properties of a commercial natural clinoptilolite sample have been investigated. The sample has been first structurally, morphologically and chemically characterized, in order to establish its exact nature. In particular, the type of crystalline phases contained in the mineral and its structural stability up to 150°C have been investigated by using the X-ray diffraction (XRD) technique. The sample morphology has been visualized by scanning electron microscopy (SEM). X-ray photoelectron spectroscopy (XPS) has been used to determine the mineral chemical composition and to establish its thermal stability up to 150°C. In order to achieve optimal results in ultra-high-vacuum (UHV) conditions, XPS tests have been carried out on samples reduced in a powdered form. The clinoptilolite specific surface area and pore size have been also accurately measured by using the Brunauer–Emmett–Teller (BET) analysis, since the electrical transport mechanism takes place just in the material microporosity.
2. Materials and Methods
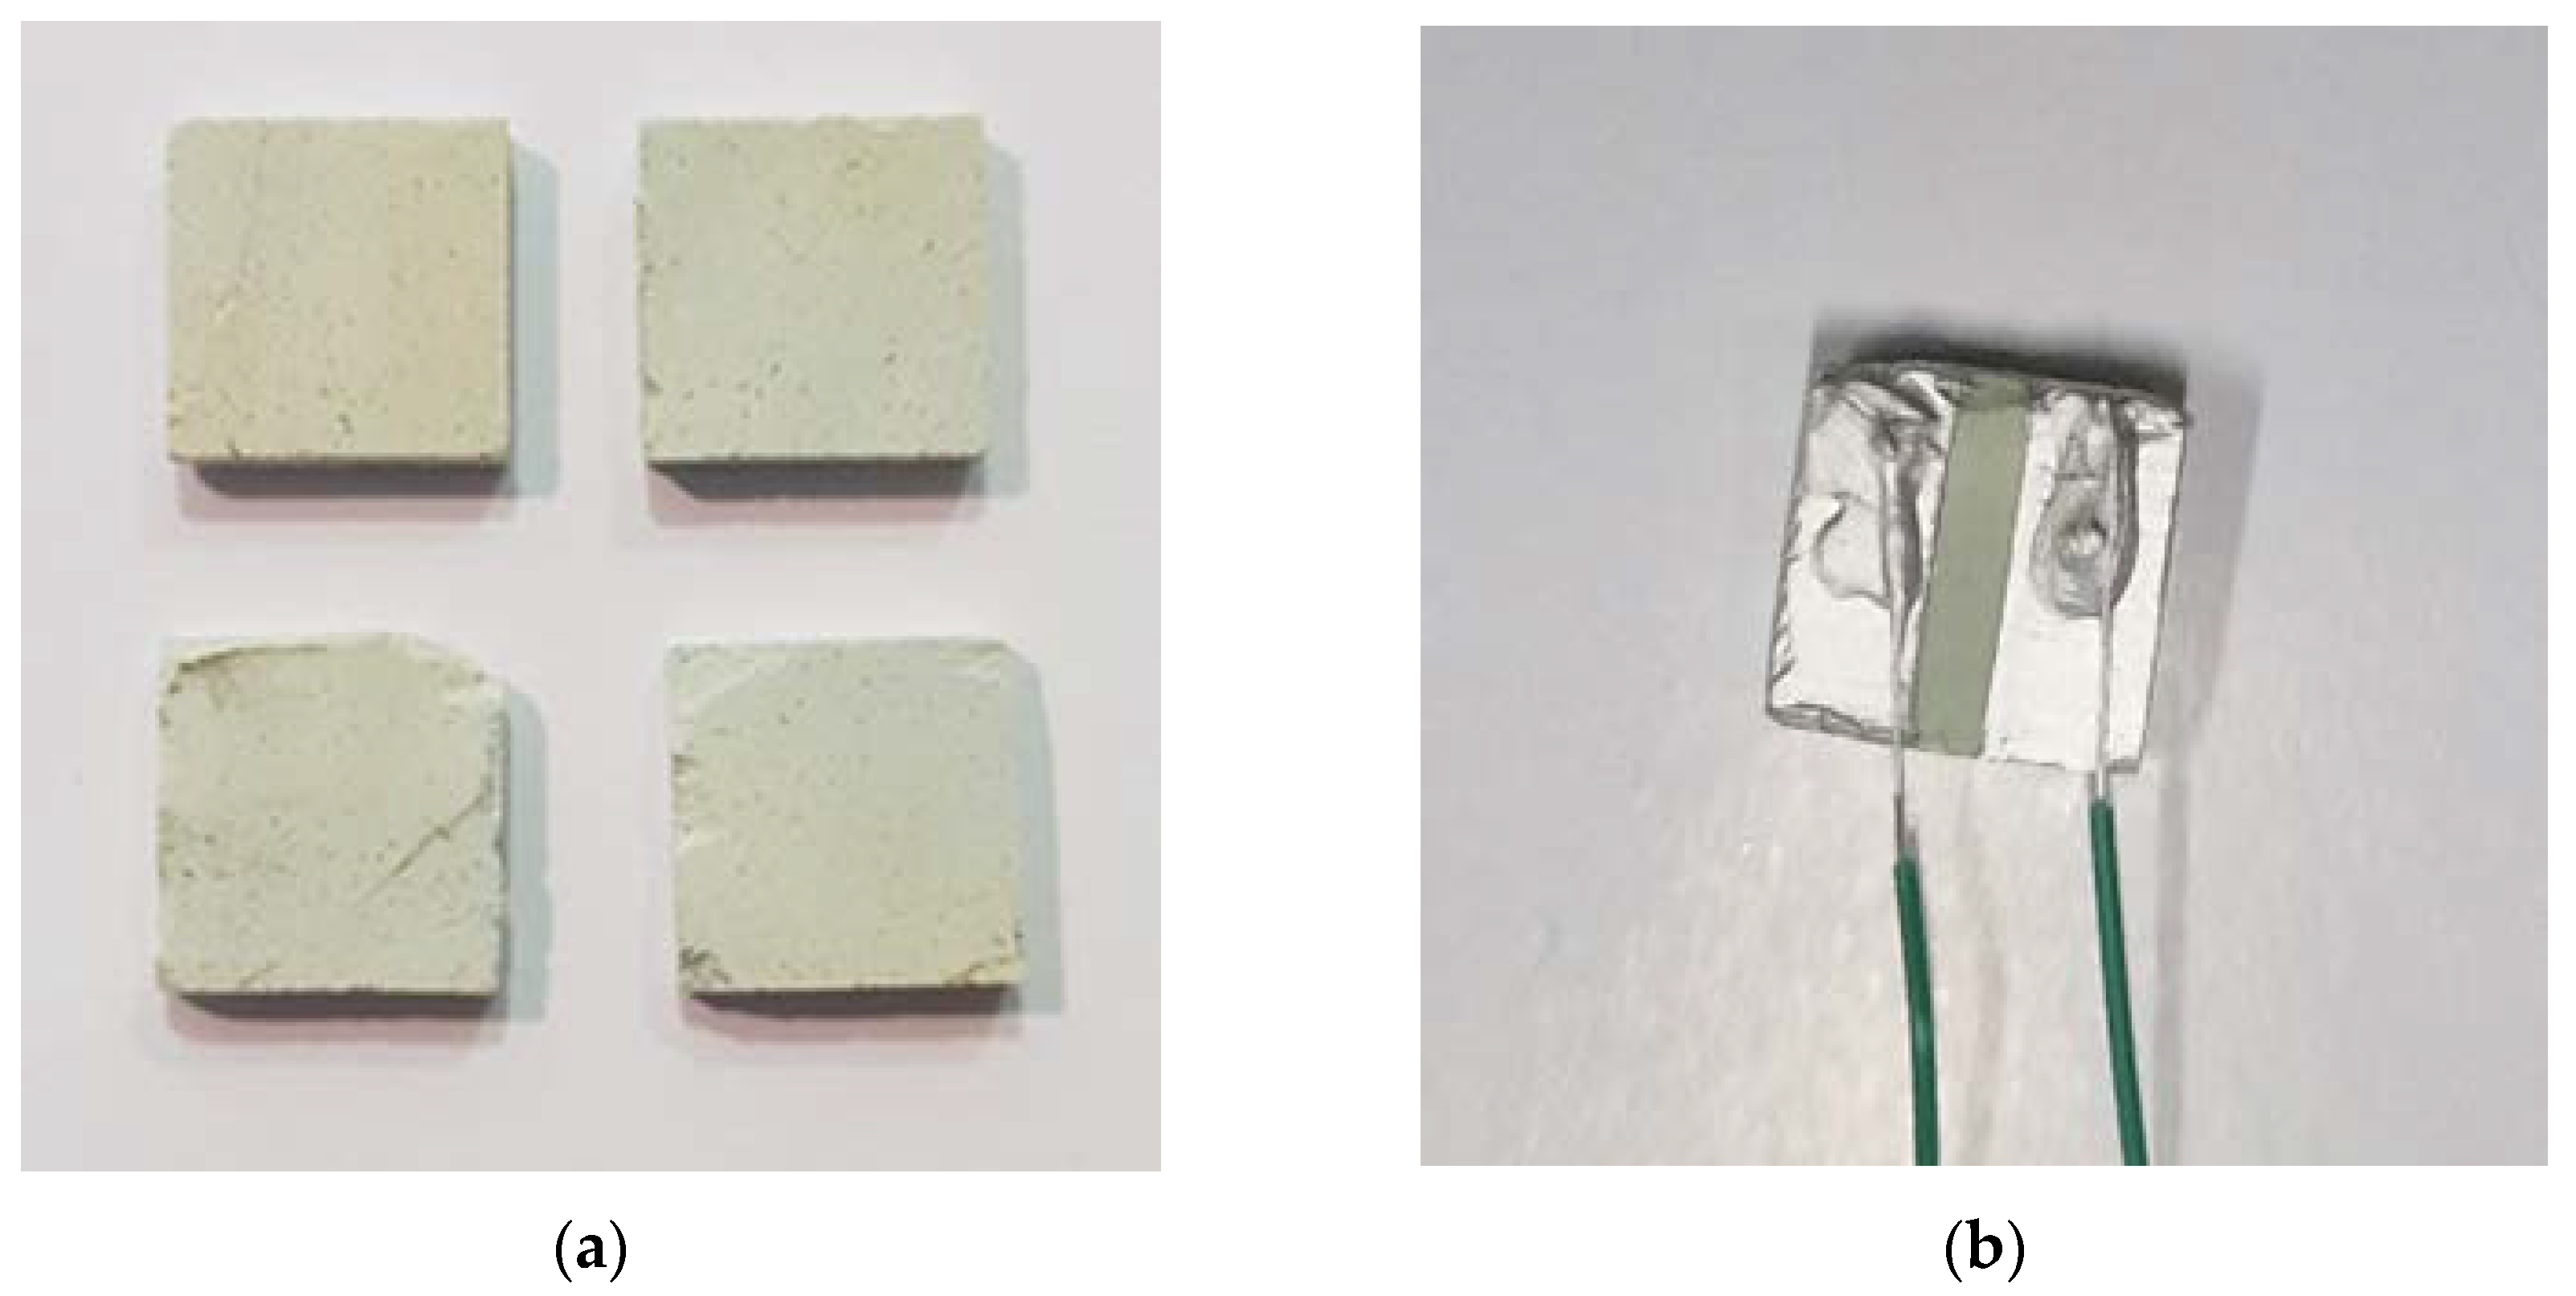
The clinoptilolite mineral was supplied by T.I.P. (Technische Industrie Produkte, GmbH, Waibstadt, Germany). The natural zeolite stone has been mechanically shaped in order to obtain squared monoliths with a thickness of only a few millimeters (see
Figure 2, a). The squared monoliths have been obtained by using a 3-axis computer numerical control (CNC) vertical milling machine (Super proLIGHT 1000, Vertical Machining Center). The irregularly shaped stone has been blocked in a press and successively cut by using a mini metal hacksaw. Then the sample, glued on a wooden support, has been successively clamped in the milling machine vice and machined. The processing cycle included an initial roughing stage to obtain samples with a programmed thickness of ca. 4 mm, subsequently reduced to 2.5 mm. In the second stage, square-shaped samples with a size of 10 mm have been produced, and excess of surface material has been removed up to reach the desired thickness. The electrodes for electrical characterizing the NTC behavior have been fabricated by using a conductive ceramic paste (XeredEx, XD-120, SGS) and a copper wire with a diameter of 0.6 mm was used for the electrical connections (see
Figure 2, b).
The nature of the crystalline phases present in the mineral, their percentages and the zeolitic phase structural stability under heating up to a temperature of 150°C have been investigated by X-ray diffraction (X’Expert PRO, PANalytical, Oxford, UK). The relative peak intensities have been recorded in a 2θ range from 5° to 80°.
The mineral morphological characterization has been performed by Scanning Electron Microscopy (SEM, Quanta 200 FEG microscope, FEI, Hillsboro, OR, USA). In particular, the surface of the mineral has been polished, chemically etched and observed at very high magnification. SEM observation at high magnification is required to visualize the clinoptilolite nanometric texture, made of lamellas with an identical thickness of 40nm. In particular, the sample was first grained and then polished by using a silicon carbide paper with a grit size of 4,000 (P4000, Microcut Silicon Carbide grinding paper, U.S.A, Buehler). Owing to the larger number of Si atoms contained in clinoptilolite compared to the Al atoms (4.6:1 for our zeolite sample), the chemical etching treatment was based on the desilication reaction (i.e., dissolution of the silica framework with formation of soluble sodium silicate). In particular, a sodium hydroxide (NaOH) aqueous solution (2.65 M) was used for the clinoptilolite mineral etching (the sample was treated for 3h at room temperature). It must be pointed out that an etching treatment based on the dealumination reaction (e.g., treatment by aqueous HCl solution) cannot be effective since it can only cause the formation of lattice defects.
X-Ray Photoelectron Spectroscopy (XPS) has been used to study the surface chemical composition of mineral samples in the ‘as received’ and powdered form. XPS measurements have been carried out in an ultra-high-vacuum (UHV) chamber equipped with a non-monochromatized X-ray source (Mg Kα photon at 1253.6 eV) and a VSW HA100 hemispherical analyzer (with PSP electronic power supply and control), leading to a total energy resolution of 0.86 eV. The binding energy (BE) scale of XPS spectra was calibrated using the Au 4f peak at 84.0 eV as a reference. Quantitative analysis has been performed on core levels by Voigt line-shape deconvolution after background subtraction of a Shirley function (the atomic percentages are determined with an error of ±0.25 %). Zeolite in powdered form has been the preferential choice for surface analysis, due to low outgas in UHV; however, several annealing at temperatures up to 150°C were necessary on the natural bulk stone, to check its thermal stability, in order to obtain the same results, like in the powder case.
Nitrogen adsorption analysis was performed on clinoptilolite by means of a 3Flex adsorption analyzer (Micromeritics, Norcross). N2 adsorption/desorption isotherms were recorded at 77 K and SSA was determined by nitrogen from the linear part of the Brunauner−Emmett−Teller (BET) equation. The pore volume of clinoptilolite was calculated from the N2 adsorption isotherm at a 0.85 p/p0. Nonlocal density functional theory (NLDFT) was applied to the N2 adsorption isotherm to evaluate the micro/mesopore size distributions. Before the analysis, the sample was degassed at 120 °C under vacuum (P < 10−7 mbar). The adsorption measurements were performed by using high-purity gases (>99.999%).
Electrical transport in high impedance ionic conductors (i.e., MΩ magnitude order) can be easily investigated. Indeed, a sinusoidal voltage, produced by a function generator, can be applied to this high impedance conductor without the risk of overloading the equipment, since the resulting electrical current intensity has a quite low value (µA-nA magnitude order) for the high impedance value. Owing to the very high signal stability, direct digital synthesis (DDS) function generators represent the most suitable sigmoidal voltage sources. The intensity of such micro/nano-currents can be measured as effective value (root-mean-square, RMQ) by using a large bandwidth AC microammeter of a digital multimeter (DMM). DMM bandwidth should be high enough for allowing the measurement of voltage signals with frequency higher than 1kHz, that are required to avoid electrode polarization phenomena. Such device may also include a datalogger system for recording the current intensity measurements made during the time.
Zeolites are ionic conductors with single charge-carrier, characterized by a very high impedance value; this physical characteristic allows to study these ceramic conductors by such a simple approach. Two electrodes were placed on the surface of the square-shaped clinoptilolite monolith, in order to test the material electric behavior under a fast uncontrolled heating, which was achieved by using a high-power light bulb, as heat source. The electric current intensity was measured by the true-RMS DMM, placed in series with the sinusoidal signal generator (see
Figure 3). The square-shaped clinoptilolite sample was connected to an AC voltage source (sinusoidal voltage signal of 20V
pp, 5kHz) and the current intensity flowing in it was measured by setting the wide-band true-RMS DMM as AC microammeter. Before electrical tests, the samples were stored for 24h in a cabinet, containing activated silica gel. Such mild dehydration treatment of the clinoptilolite device is required to avoid an excessive water molecules release phenomenon during the electrical measurement. Electrical signals were measured and recorded during the time by using the devoted DMM datalogger software.
In particular, a direct digital synthesis (DDS) function generator (Gratten, ATF20B+) was used as voltage source and a true-RMS, 10kHz bandwidth, DMM (Uni-Trend, UT61E) was used as AC microammeter. The effective current intensity value (Ieff) was recorded on a PC equipped with a devoted datalogging software. A fast specimen heating was achieved by placing its bottom-side surface in contact with the glass bulb surface of a high-power halogen lamp (NT U H4, 12V, 60/55W, P43T), powered up by a DC power supply (Velleman, LABPS 3005D, 30V/5A). In order to facilitate heat transfer from the heat source (i.e. the bulb) to the sample, the clinoptilolite specimen had a reduced thickness (2.5mm) and in addition, a silver conductive paste was placed between sample and light bulb. Successively, the following electrical test was performed: the sample was heated slowly and in a calibrated manner by using an aluminum block containing a ceramic heating cartridge. A layer of Kapton/cotton wadding thermally insulated the sample (for such purpose, the heating block set of a 3D printer was used). A digital datalogger thermometer (Uni-Trend, UT-325) was used to measure and record sample temperature over the time.
3. Results
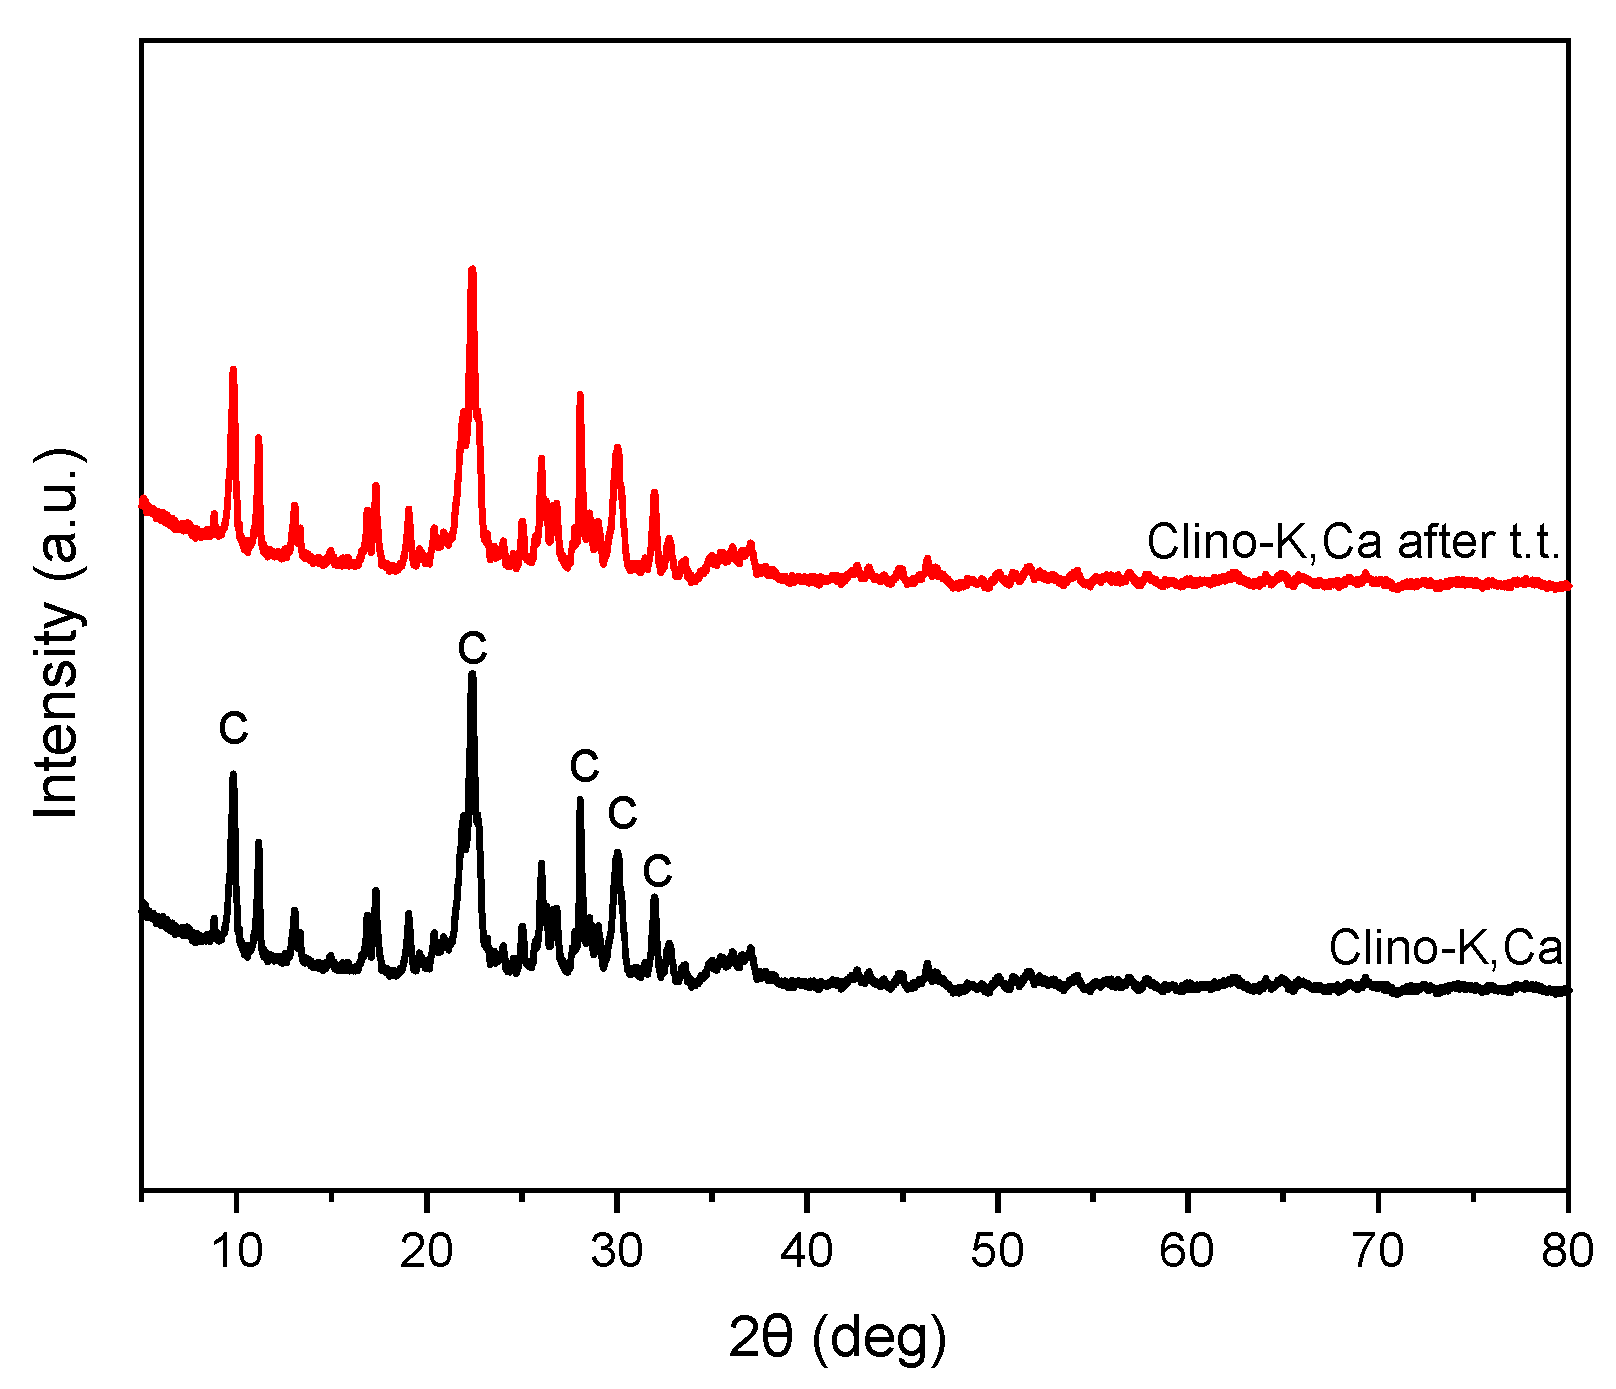
In order to establish the exact nature of the crystalline phases contained in the commercial zeolite sample, the mineral was first characterized by X-ray diffraction (XRD). Since zeolites and other minerals have a crystalline nature, XRD represents a very convenient approach to identify all solid phases present in the sample. As visible in
Figure 4, the XRD patterns of the mineral showed the diffraction peaks of clinoptilolite and cristobalite (quartz) phases. In particular, the most intensive characteristic signals of clinoptilolite can be detected at 9.8446°, 22.4026°, 30.0076°, 31.9576° [
26]. According to this XRD analysis, the clinoptilolite phase was ca. 65% by weight and the cristobalite phase was ca. 35% by weight.
XRD was used also to establish the thermal stability of the clinoptilolite phase in the temperature range involved in the electrical tests. As clearly visible in
Figure 4, the diffraction pattern of clinoptilolite sample after a thermal annealing treatment at 150°C resulted practically unmodified, thus indicating a high structural stability of the mineral in such temperature range.
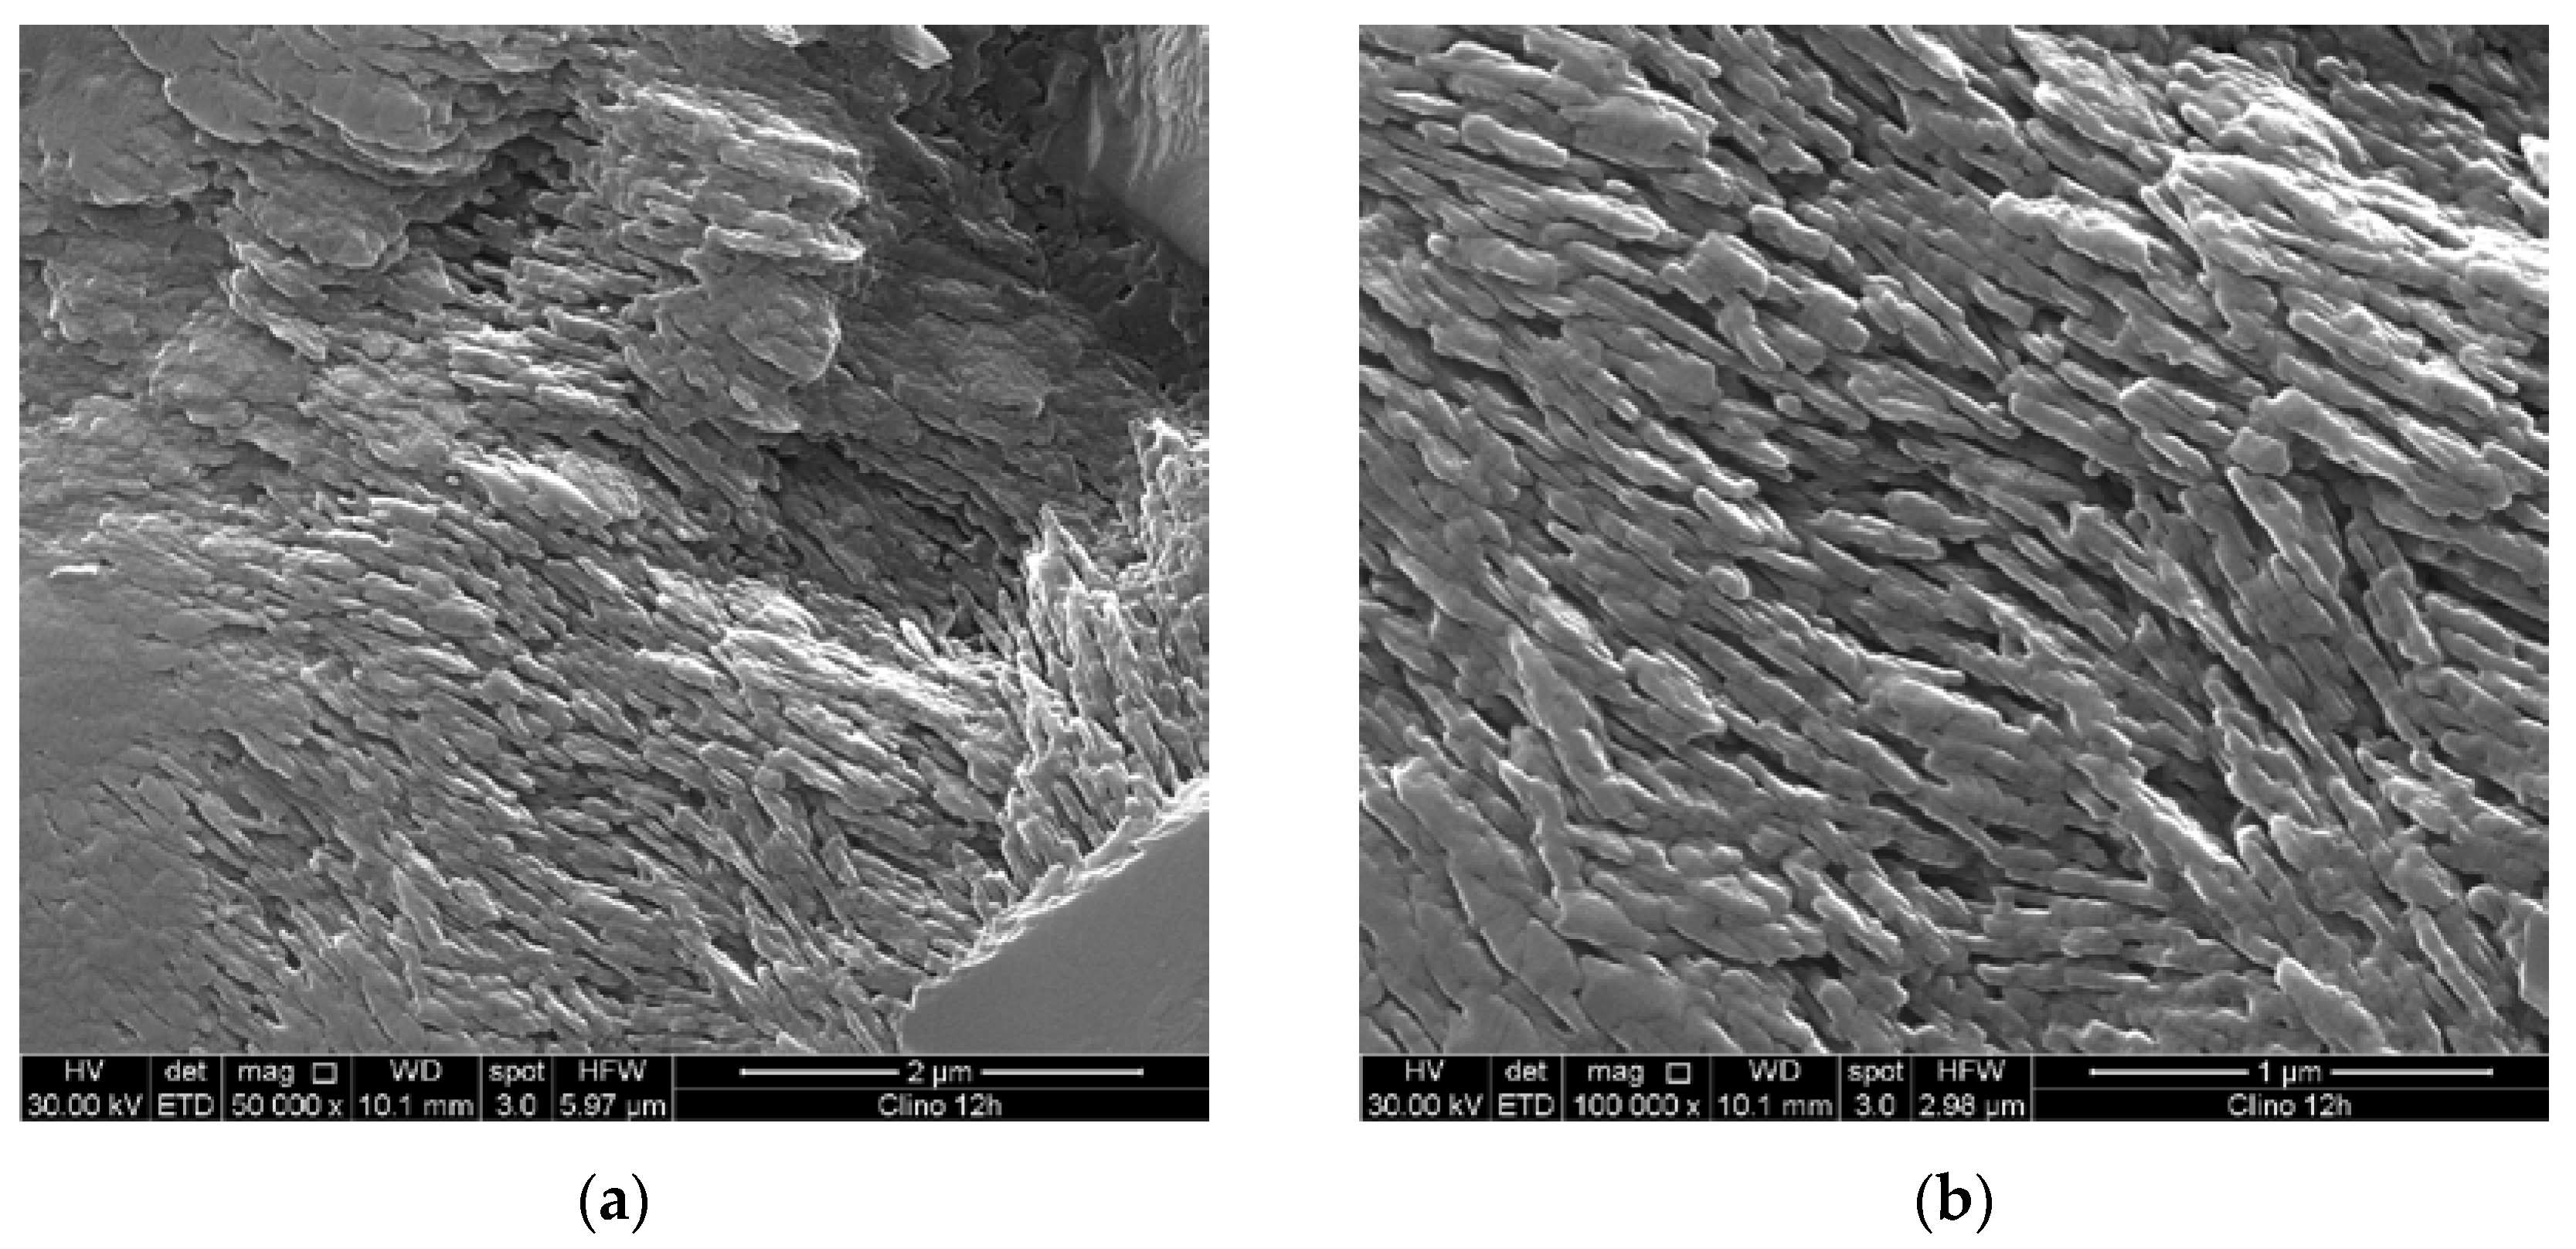
Scanning electron microscopy (SEM) micrographs of the etched mineral sample surface (see
Figure 5 a, b) clearly show the typical clinoptilolite microstructure, which is made of tendentially iso-oriented stacks of lamellar crystals. All clinoptilolite lamellas have the same thickness (40 nm), while the other two sizes are of a few hundred microns. Such lamellar morphology is a characteristic of the clinoptilolite crystals [
10,
27]; however, a similar microstructure can be found also in many other nature-made materials [
28]. The good mechanical performance of this zeolite type can be ascribed just to such special morphology. Owing to the high clinoptilolite content, the electrically conductive zeolite lamellar crystals are interconnected and form a continuous percolation network, with paths crossing the full solid structure.
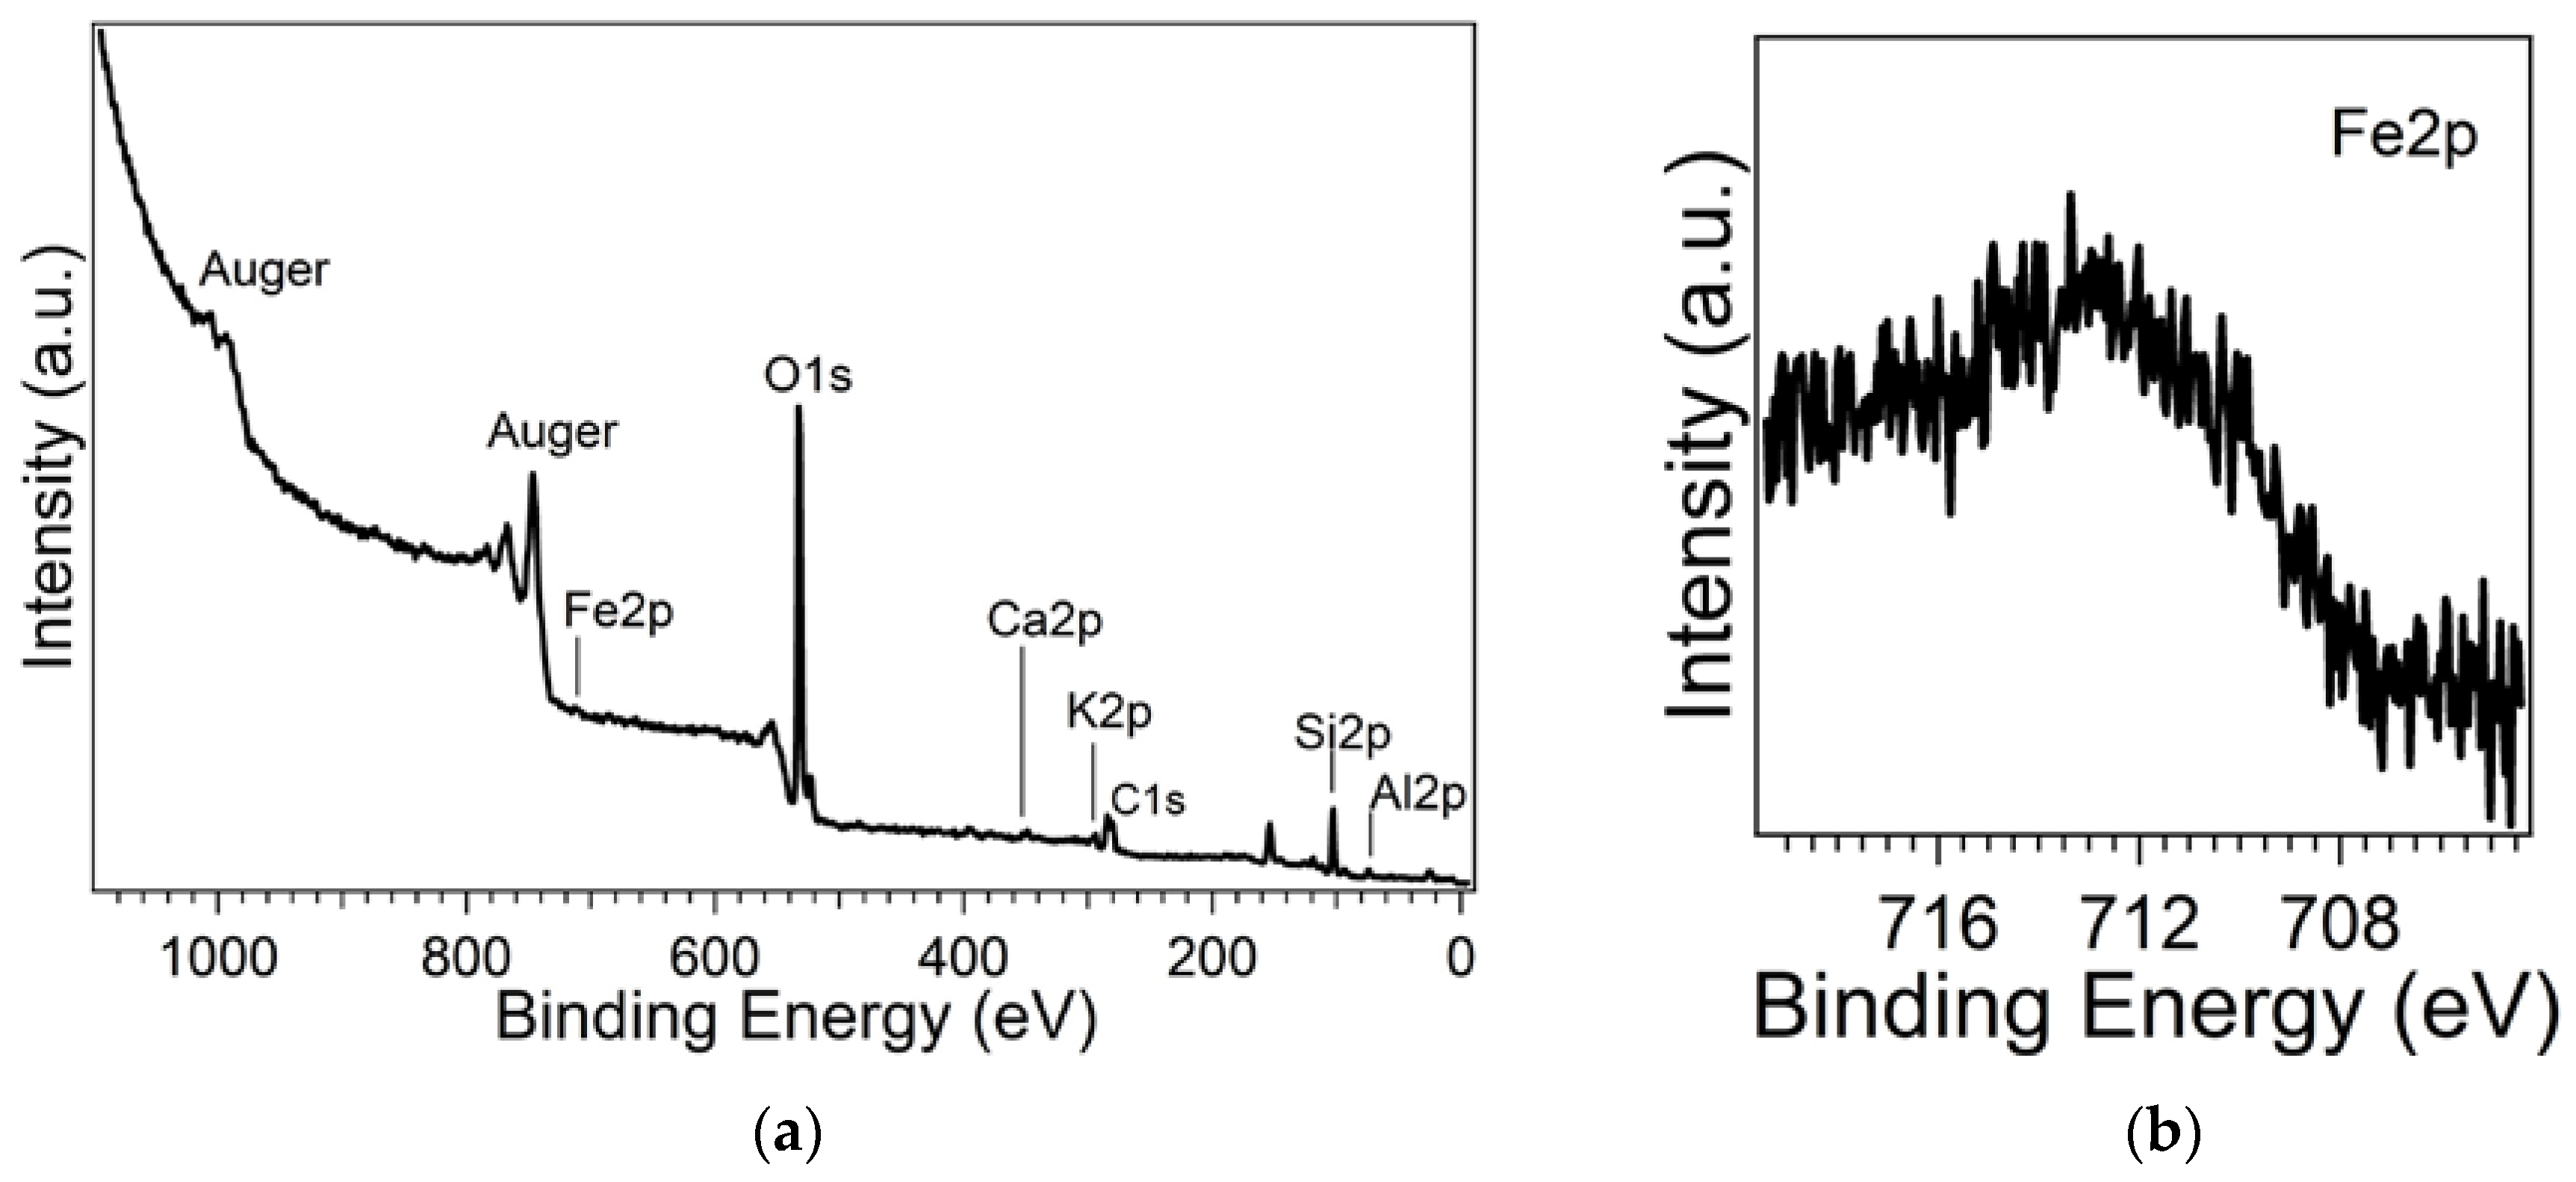
The chemical composition obtained by X-ray photoelectron spectroscopy (XPS) analysis (
Figure 6, a) revealed the presence of Si (Si2p), Al (Al2p), O(O1s) as framework elements, and Ca (Ca2p), K (K2p) as extra-framework elements. A little amount of Fe (Fe2p) has also been identified (
Figure 6, b); it shows a broad and complex core level lineshape, suggesting the presence of iron in different chemical configurations, likely Fe both in framework and extra-framework positions.
It is observed a BE shift of all core levels due to charging phenomena of about 5.6 eV (taking into account the energy reference from adventitious carbon at 285 eV). Al2p and Si2p BE positions are 74.5 eV and 102.9 eV (main), respectively, in agreement with the literature [
29,
30].
Table 1 reports the chemical composition in the surface as atomic percentages. Deviations from the bulk composition of natural clinoptilolite are expected, due to the high surface sensitivity of this technique, whose sampling depth is within few nanometers from the surface [
31]. Since it has been found that K and Ca elements have comparable concentrations in the mineral sample, the zeolite can be classified as clinoptilolite-K, Ca.
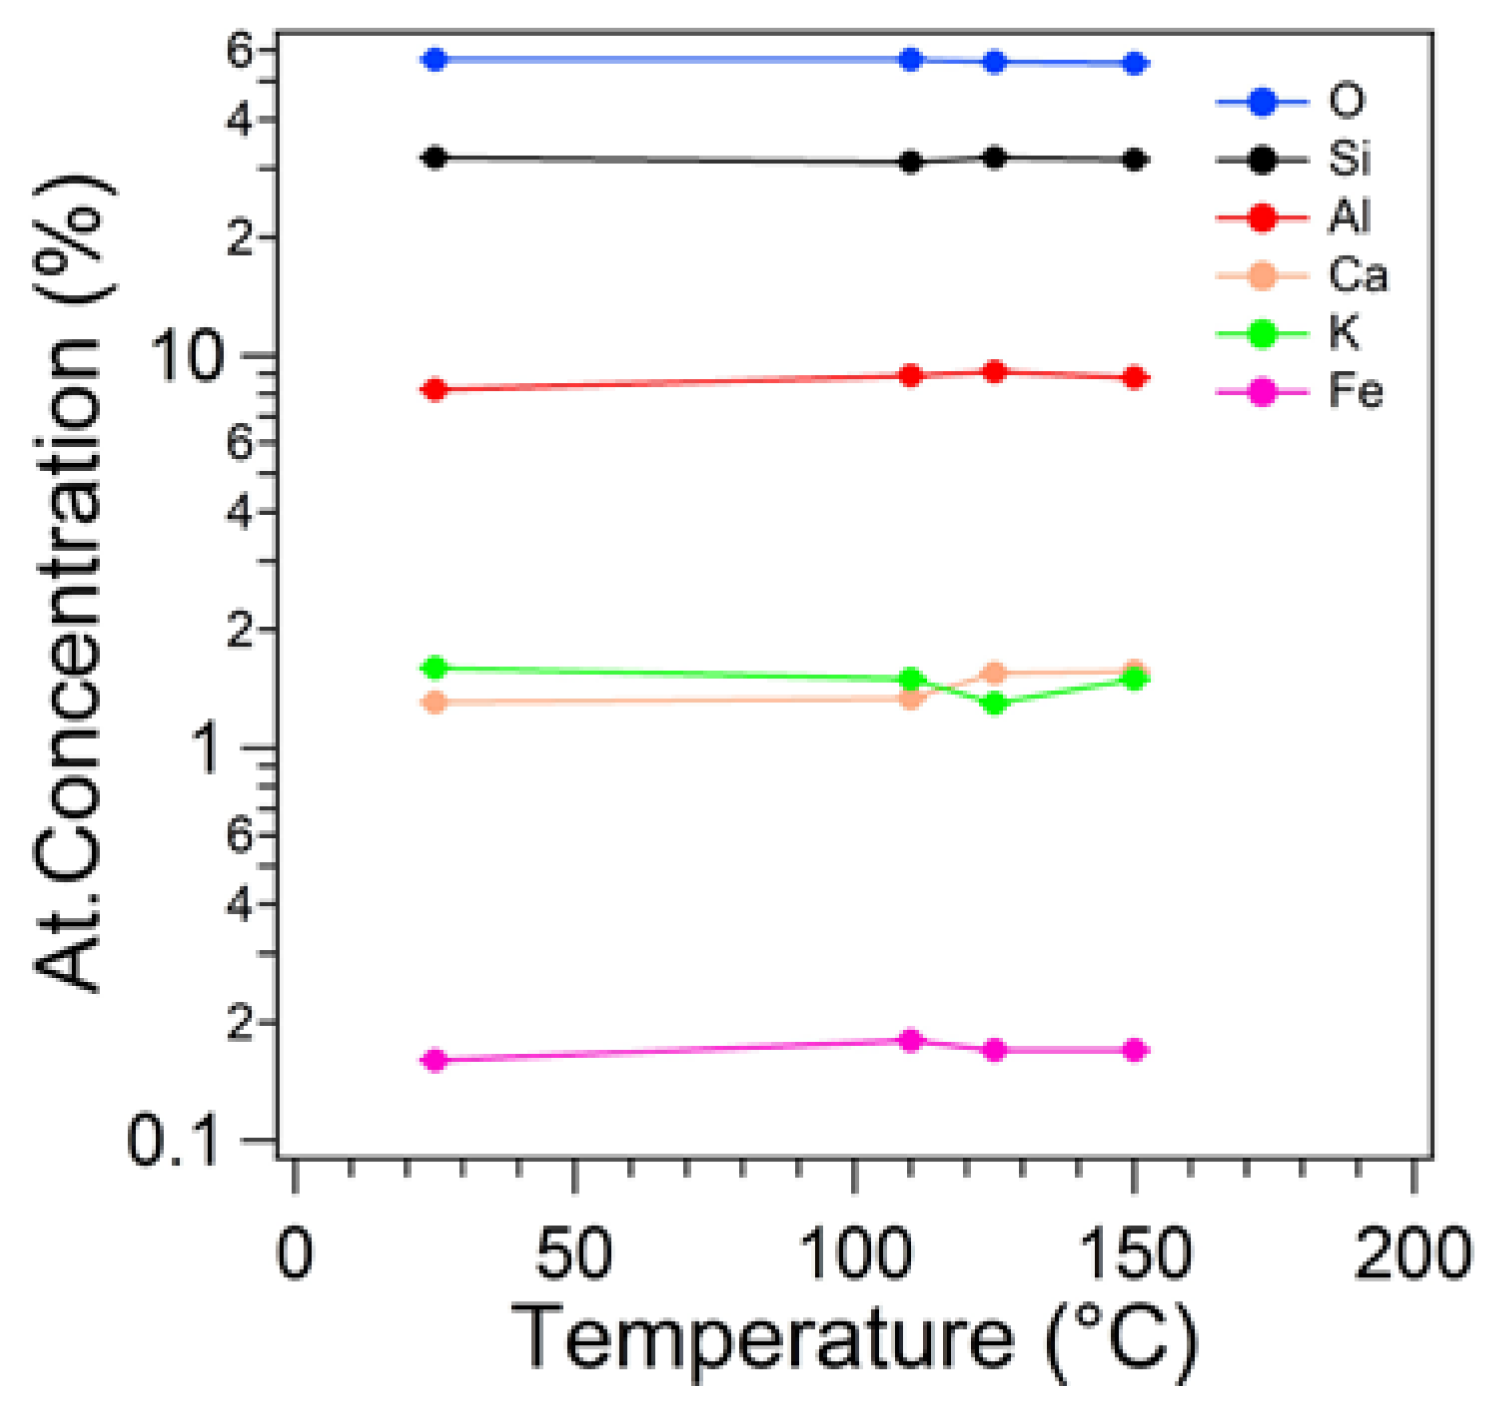
The chemical composition as obtained by XPS vs. sample temperature is shown in
Figure 7. As visible, the chemical composition is mostly unchanged with the increasing of the temperature up to 150°C. Therefore, according to the XRD and XPS results, this natural ceramic sample can be considered as high thermally stable in the temperature range adopted for the electrical characterization.
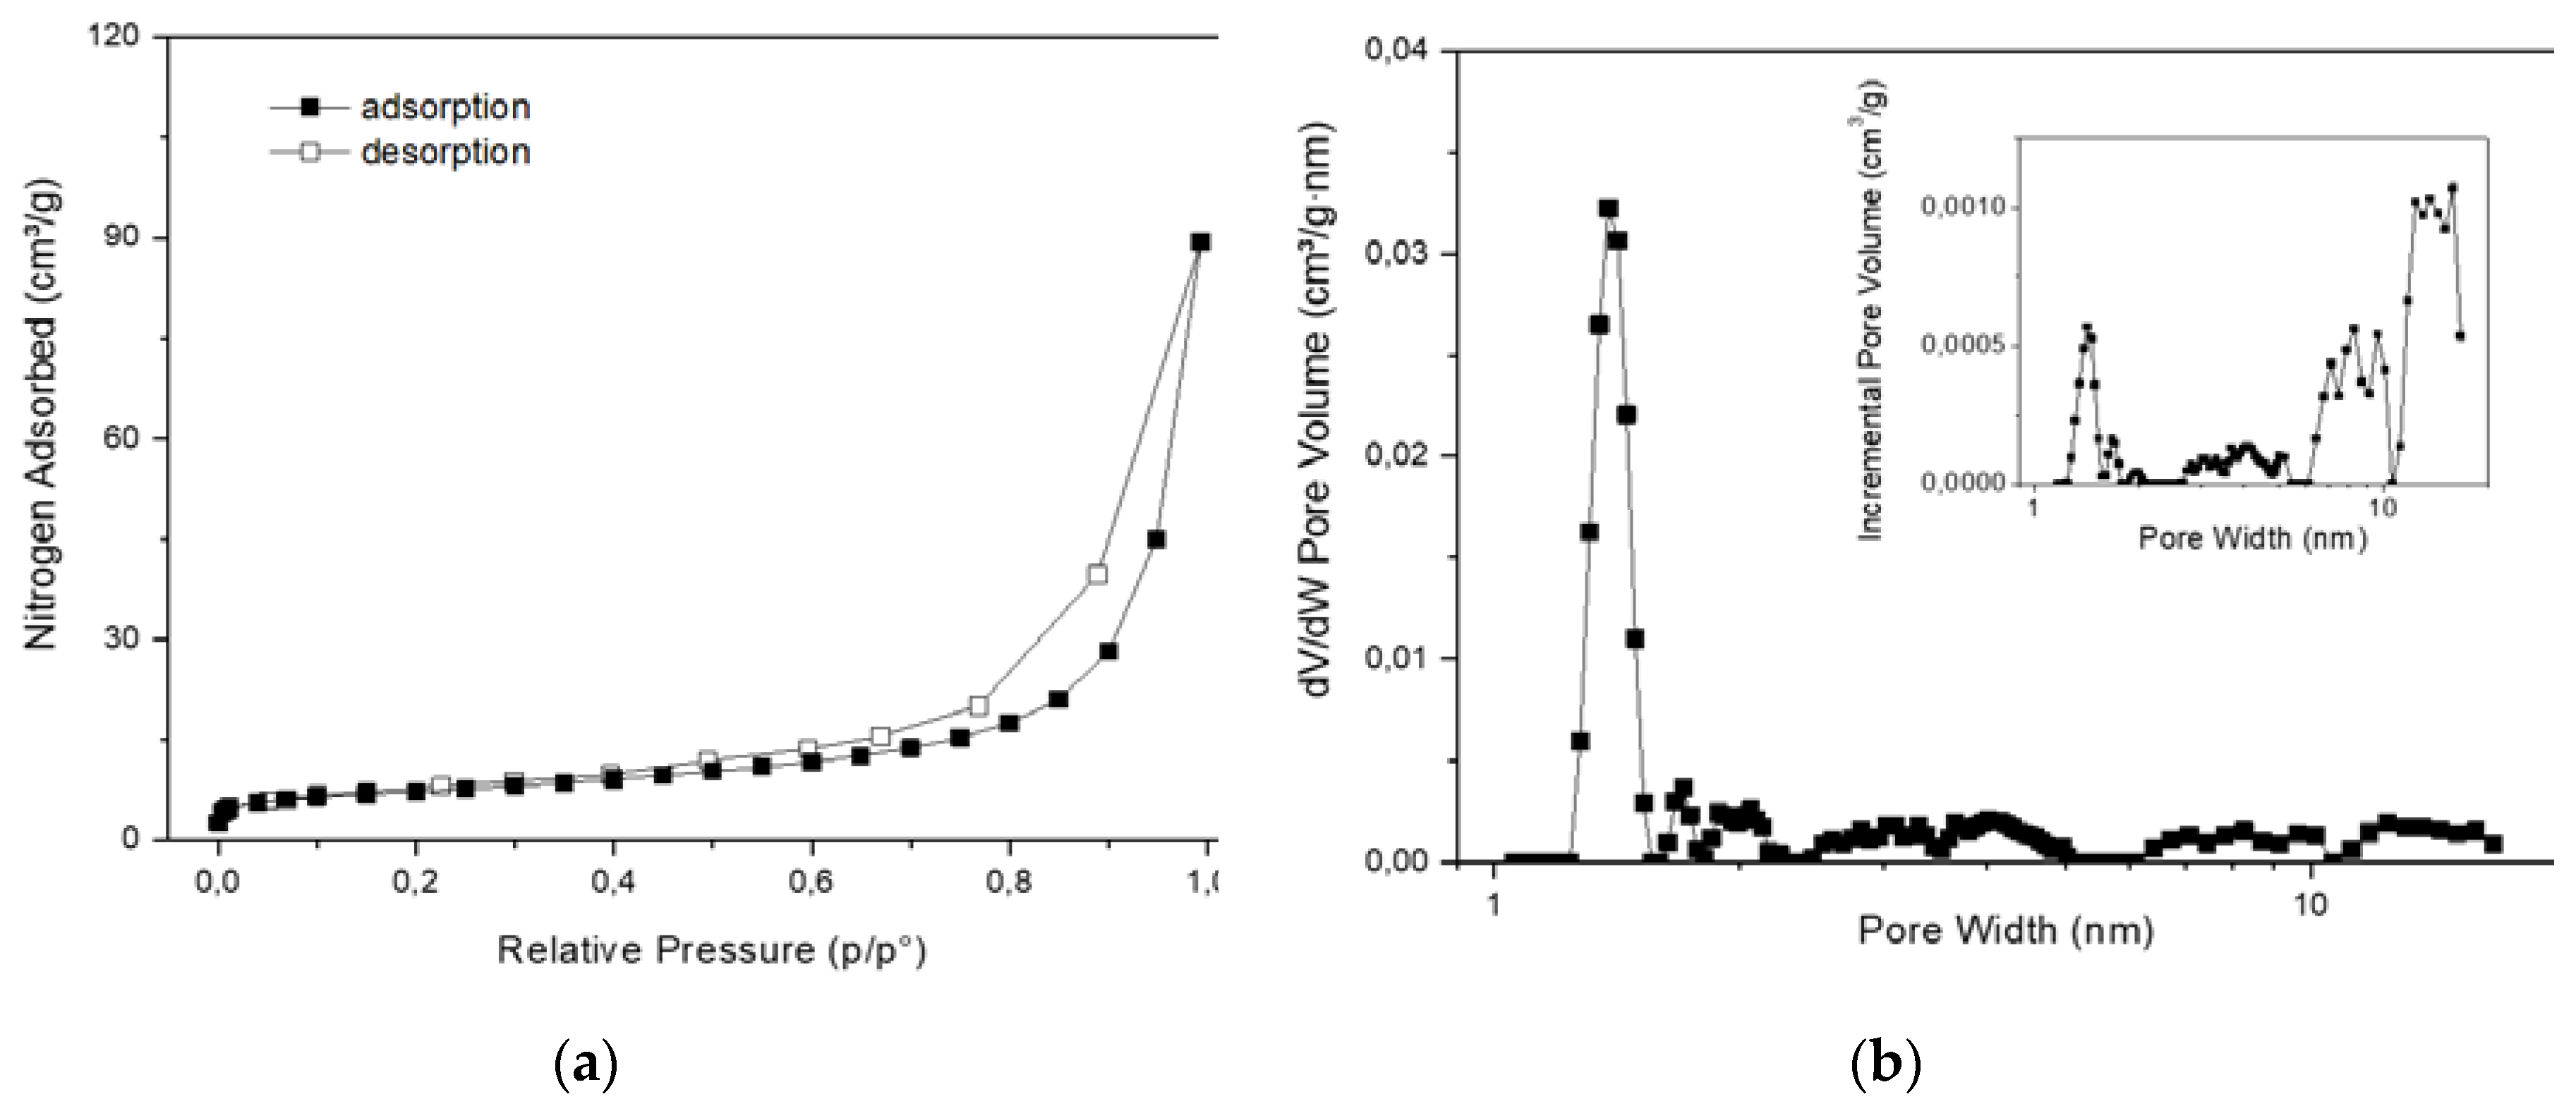
Nitrogen adsorption/desorption analysis (see
Figure 8) showed that the clinoptilolite powder has a BET specific surface area of 25±0.1 m²/g and a total pore volume of 0.032 cm³/g. NLDFT pore distribution analysis showed the presence of both microporous and mesoporous fractions in the specimen. In particular, a significant portion of porosity (about 16%) is narrowly centered at 1.4 nm, being compatible with zeolite crystalline microporosity; the remaining (meso)porosity extends mainly from 3 nm to 20 nm and it is ascribable to the interlamellar space. These results are in line with those reported in literature for several specimens of natural clinoptilolite of different origins that have not undergone acid or high-temperature calcination treatments [
32,
33,
34,
35].
The effect of a rapid increase of temperature on the mobility of the extra-framework cations (actually, K+ is the only charge carrier present in the system) has been investigated by monitoring, under a constant sinusoidal voltage value, the variation of the effective current intensity flowing in the specimen, during the heating process.
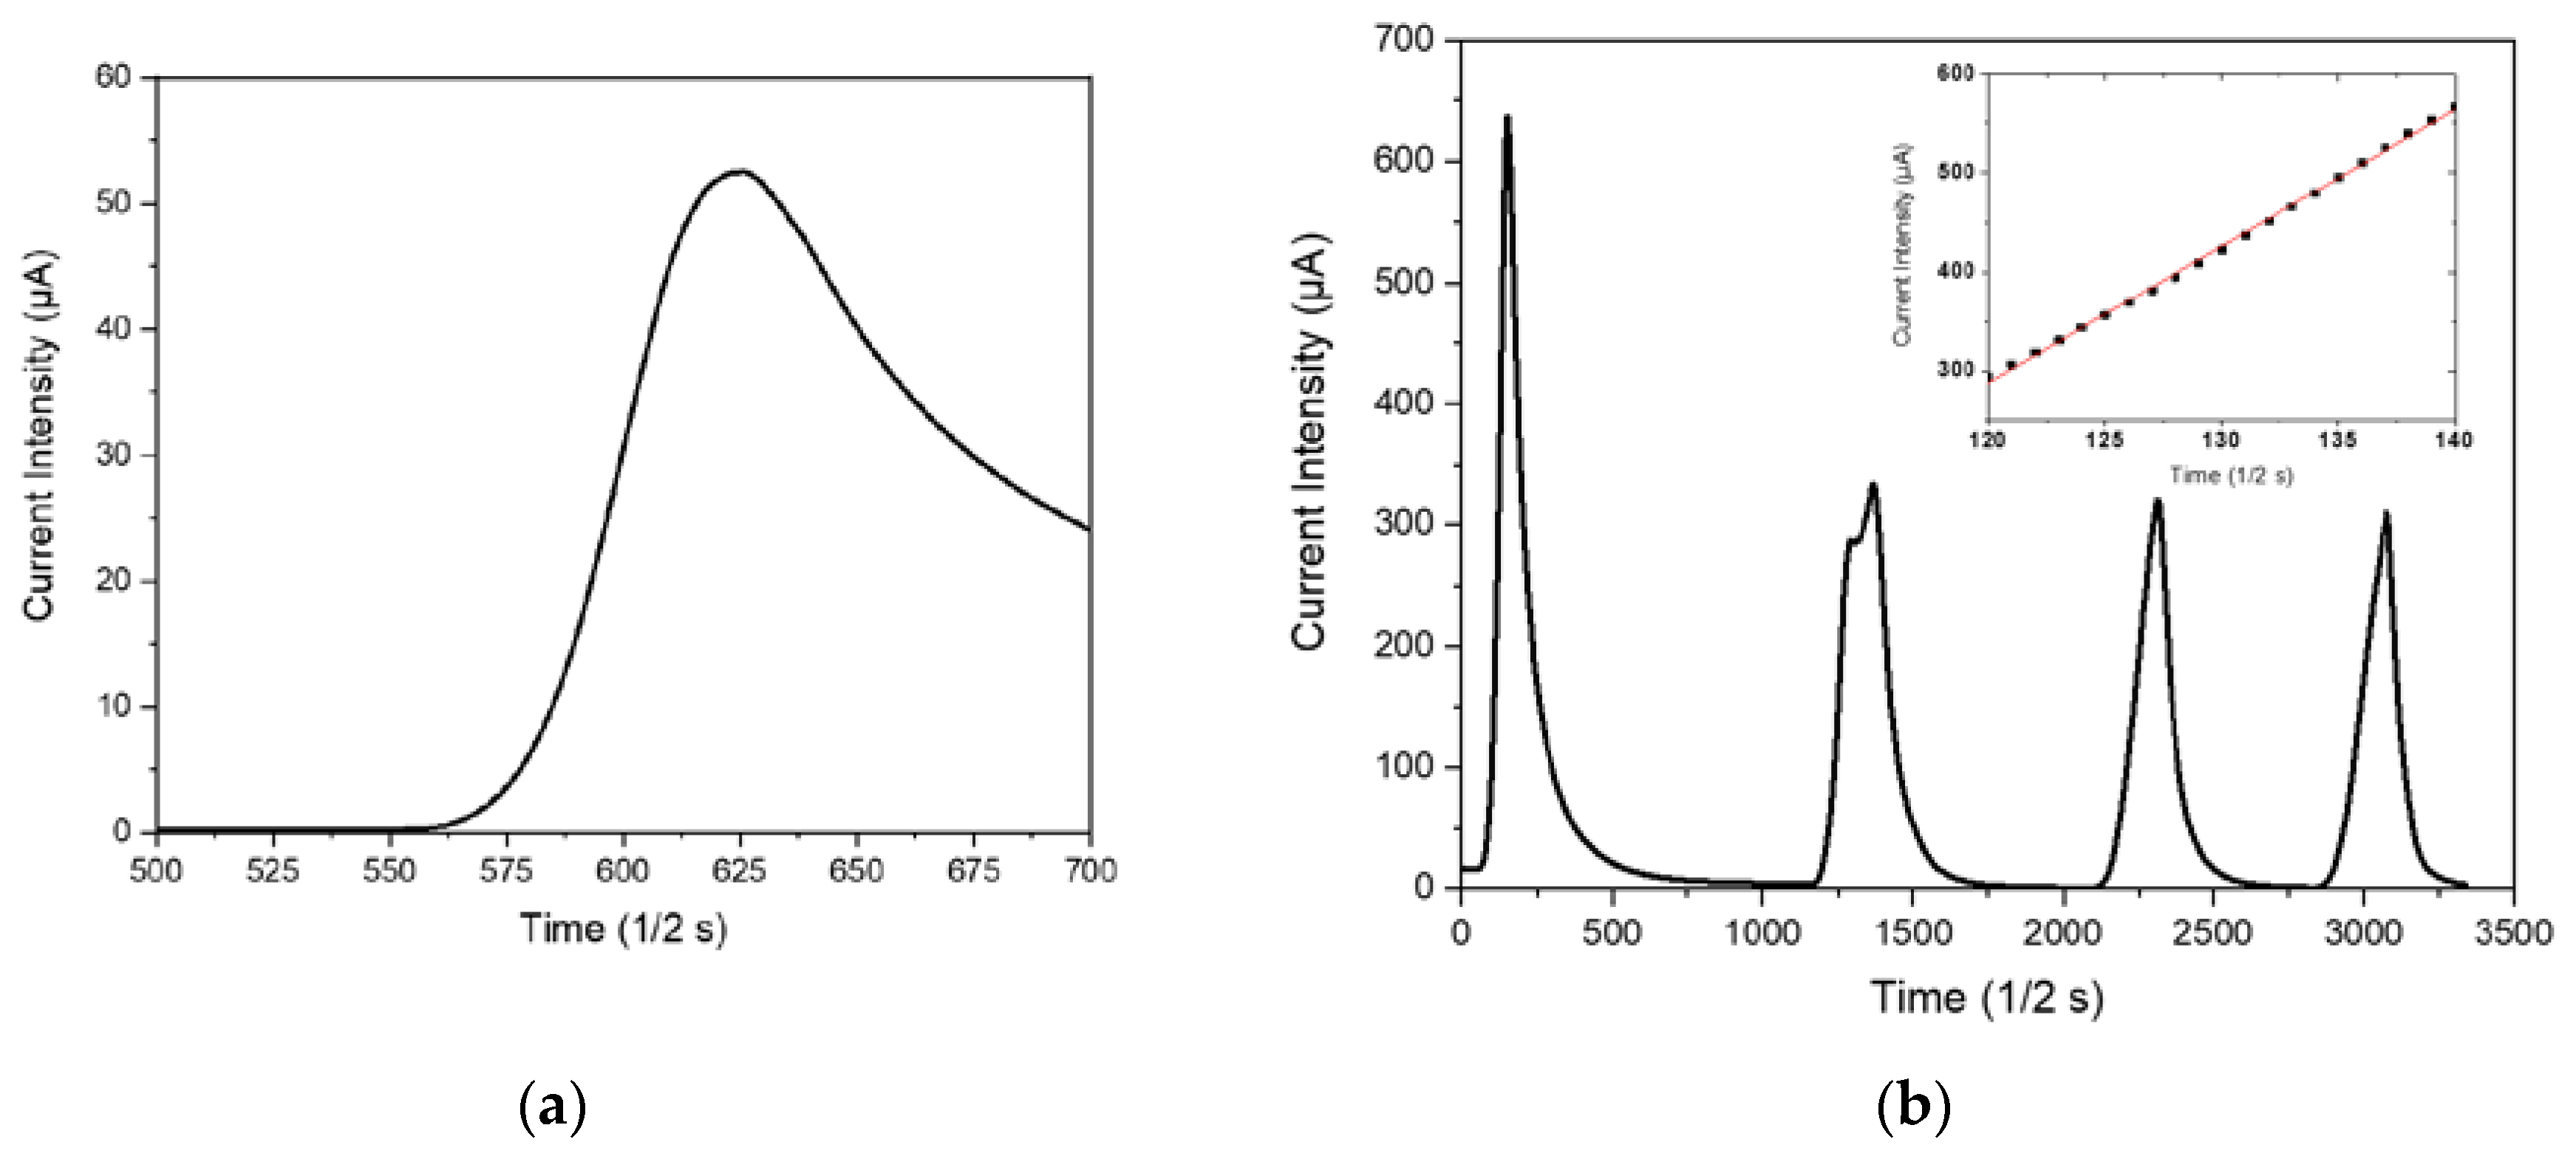
As visible in
Figure 9 a, the application of a thermal pulse to the clinoptilolite monolith promptly generates an electrical micro-current in the ceramic sample. Such micro-current grew up very quickly with increasing of time after the turning on of the lamp. During the successive cooling step in air (i.e., the turning off of the incandescent lamp), the micro-current intensity readily decreased until to reach its starting negligible value. The resulting current intensity peak had a quite asymmetric profile because the process of sample cooling in air resulted slower than the previous heating process. In particular, the heating step followed a linear behavior (see inset in
Figure 9, b) with a slope of (13.8±0.1) µA/s, while the cooling step followed a hyperbole law.
Figure 9, b shows the sample behavior under repeated heating/cooling cycles; as visible, four repeated cycles were unable to modify the electric behavior of such NTC materials. The higher value of the current intensity that is usually recorded during the first heating step (see
Figure 9, b) probably represents a hysteresis in the electrical behavior of the dehydrated clinoptilolite sample. Indeed, before electrical characterization, ceramic samples were only mildly dehydrated by using well-activated silica gel (activation conditions: 5h at 150°C under vacuum) and some water molecules (i.e., loosely-bound water [
36]) were still present inside the clinoptilolite channels. According to the Vučelić model of the ‘free ionic conduction zone’ [
12], these residual water molecules adsorbed on the surface of channel walls promote the electrical transport in the material. Differently, water molecules are mostly removed from the sample during the first heating step, that takes place at quite high temperatures, and therefore the sample electrical conductivity results reduced in all successive heating cycles of the electrical test, as it can be observed in
Figure 9, b.
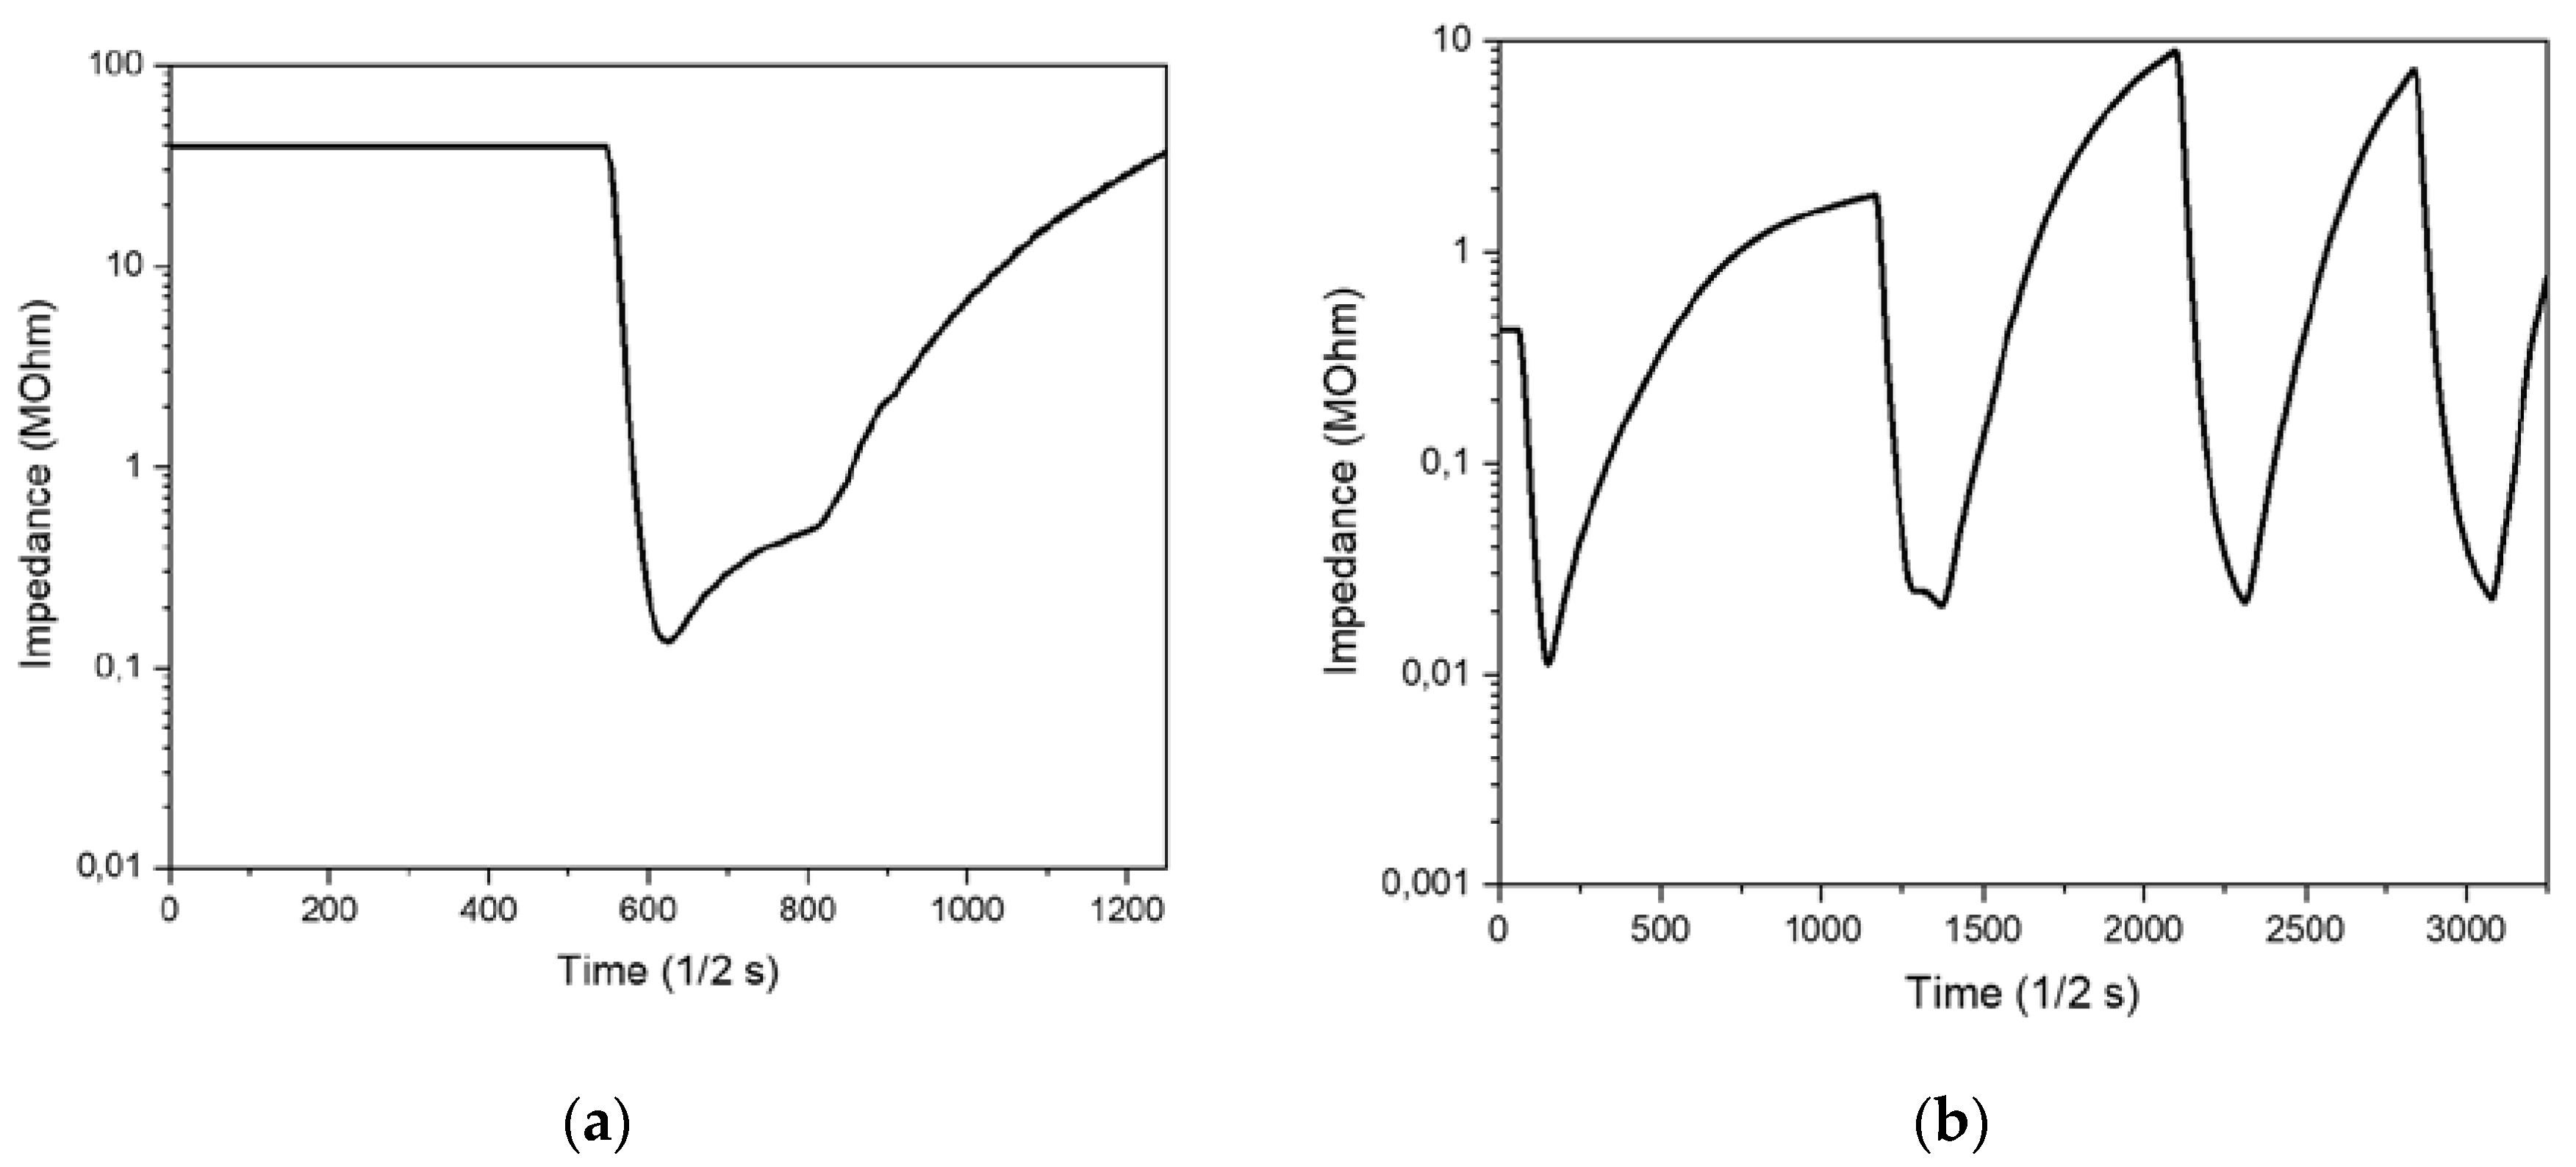
Since during the electrical tests the sinusoidal generator provides a constant voltage value of 20V
pp, the sample impedance (Z) can be calculated by using the measured current intensity values. The temporal evolution of the calculated Z value is shown in
Figure 10, a. As visible, the heating process produces a significant decrease of Z, that can be conveniently represented by using a logarithmic scale; indeed, the Z value changes of 2-3 magnitude orders during the heating/cooling process. In particular, like for the current intensity, Z varies quite linearly during the heating stage, while it decreases non-linearly during the sample cooling back at room temperature. According to the slope of the linear temporal behavior of Z, this quantity changes very quickly with increasing of time and the switching process results mostly reversible. A hysteresis in the Z value is associated only with the first heating/cooling cycle of the electrical test, as shown in
Figure 10, b.
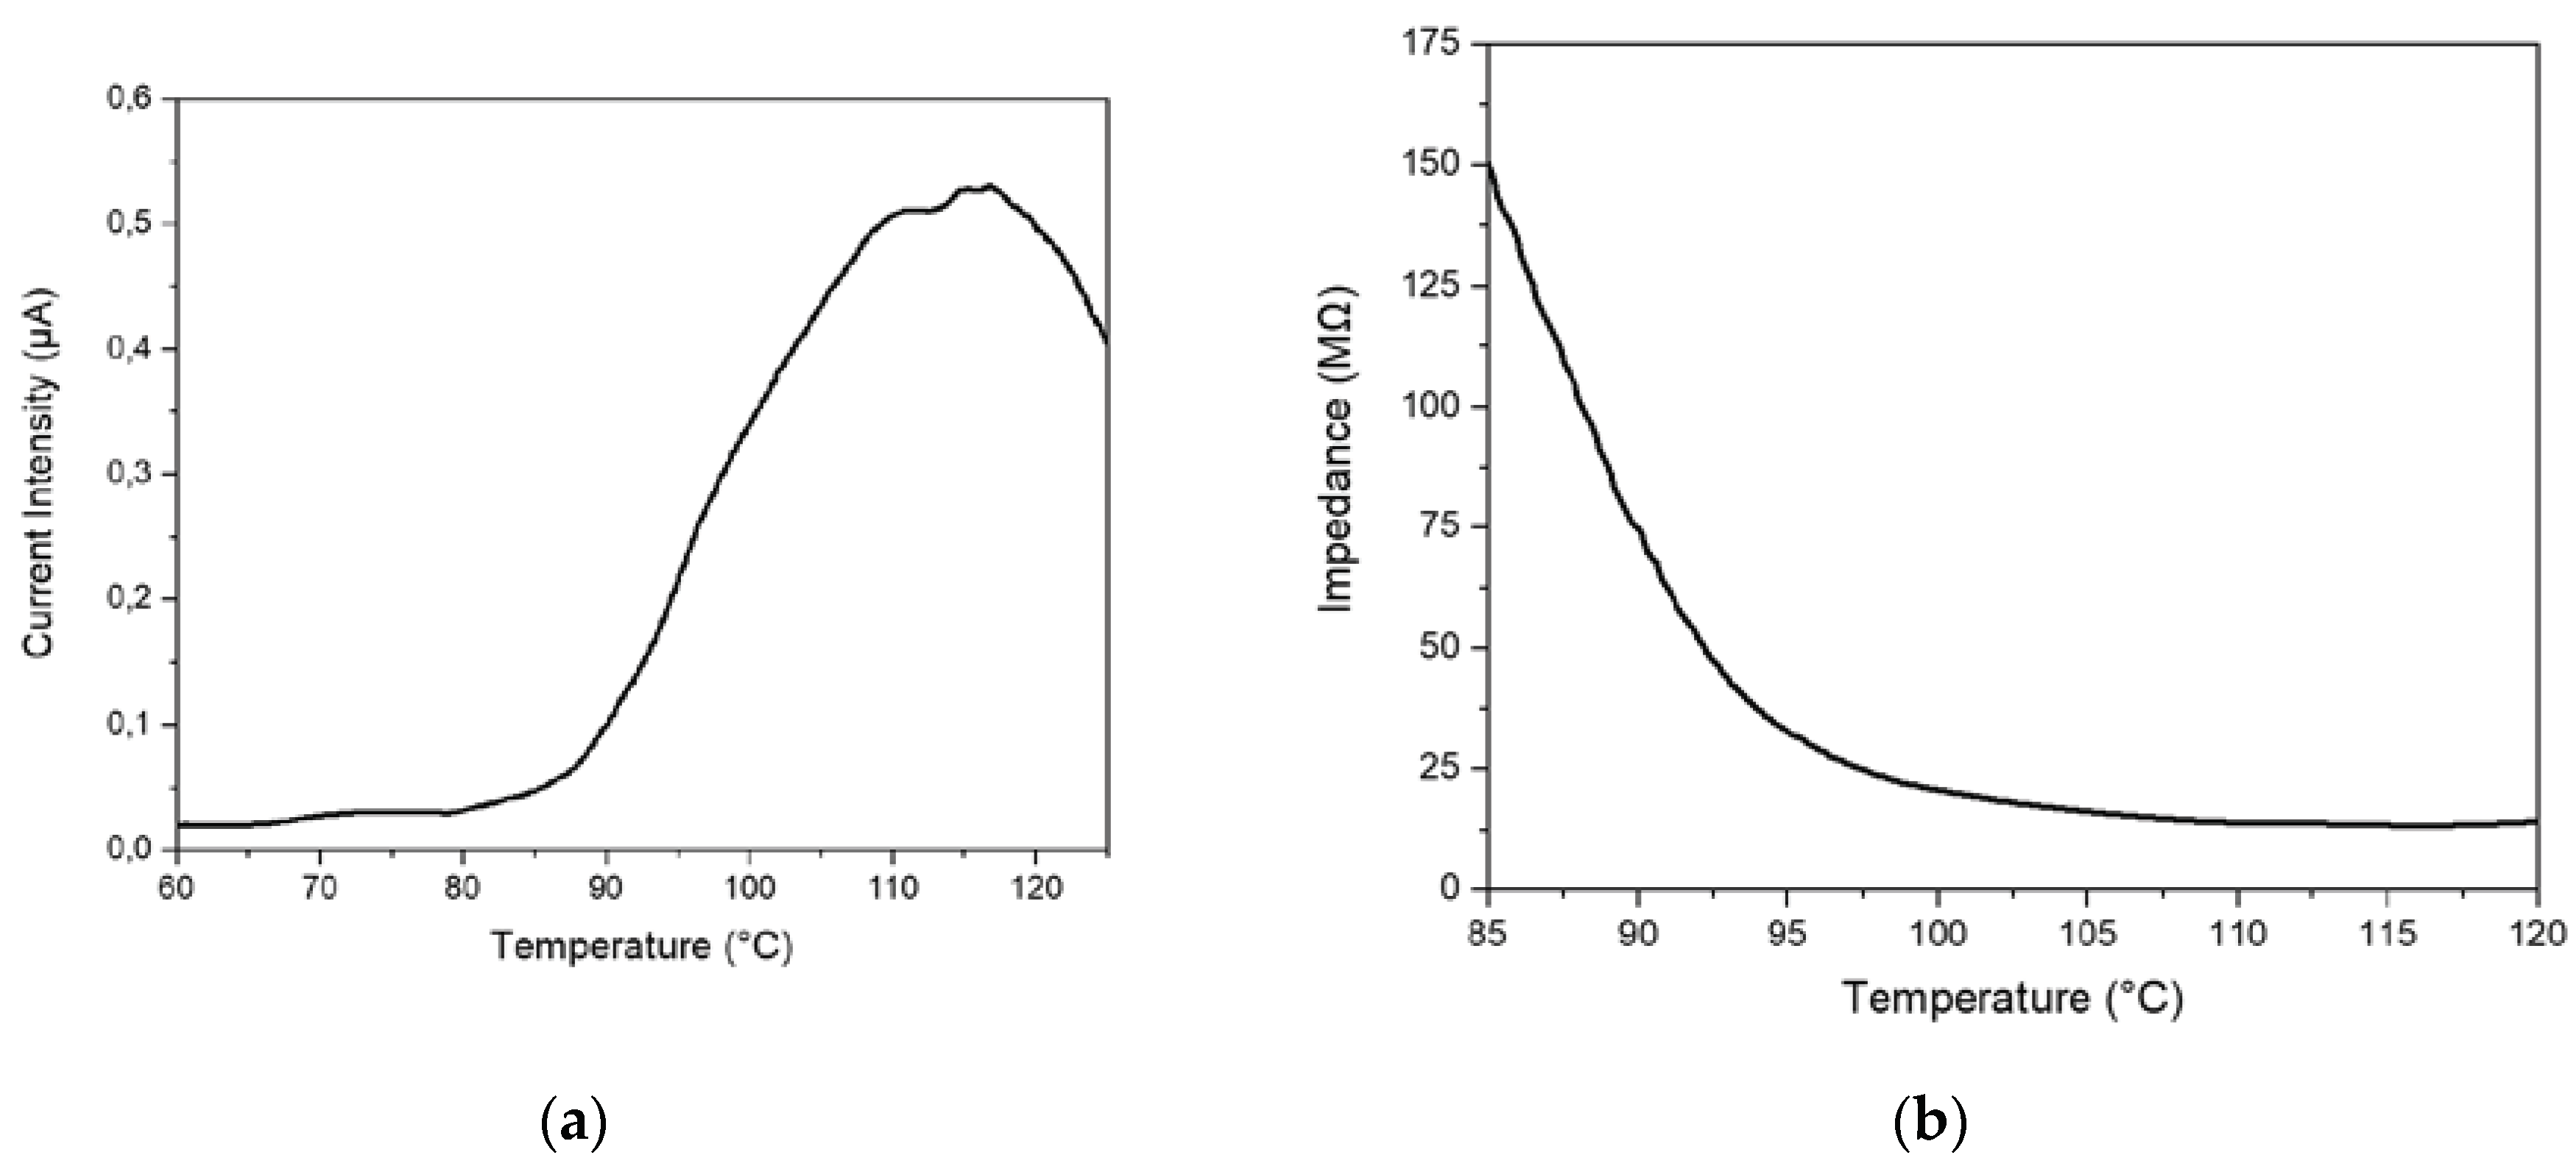
Heating tests at known temperature values were also performed by using a similar approach based on time-resolved effective current intensity measurements (see
Figure 11). In this case, both current intensity and calculated impedance curves are given as a function of the temperature, that was also measured during the time. As visible in
Figure 11, a slow/controlled heating process was capable to give a quite asymmetric I
eff-T peak, just like in the case of a thermal pulse.
4. Discussion
Zeolites are low-density crystalline aluminosilicates with unique physical properties resulting from their unusual chemical structure. This special class of compounds has a covalent crystalline structure with extra-framework positive charges (namely charge balancing cations) placed on the walls of the crystal cavities, close to the aluminum negative charges. Vučelić defined this extraordinary crystalline structure as a ‘reverse’ metallic lattice [
11]. According to the electrical conduction model proposed by Vučelić in the 1977 [
12,
13], only those extra-framework charges capable to move in the ‘free ionic conduction zones’, i.e., the free cationic conduction bands located exactly in the middle of crystal channels, can promote electrical transport trough the ceramic material. Indeed, ions at the centers of cavities are effective carrier of current since they move through the zeolite crystal with only minimum activation energy. This interesting model proposed by Vučelić constitutes an analogous depiction of the behavior of electrons in a fixed cationic electromagnetic field and their electrical conduction mechanism. Therefore, Vučelić has conformed to zeolites the commonly adopted representation of electrical transport in metallic crystal structures.
The electrical properties of zeolites are mainly depending on the contained monovalent metal ions, because they are less strongly held by the negatively charged lattice and can easily migrate between two neighboring negative sites trough the free ionic conduction zones. In more detail, the clinoptilolite electrical conductivity, σ(T), depends only on the following three factors: (i) charge of the electrical carriers: Ze
-, where e
- is the elementary charge (e
- =1.602∙10
-19 C), (ii) concentration of the electrical carriers: [Me
Z+], and (iii) mobility of the electrical carriers: μ, according to the following physical law: σ(T)= Σ
i[Z
i∙e
-∙[Me
z+]
i∙μ
i], where the sum is formally extended to all extra-framework cations present in the substance. However, since the tested sample is clinoptilolite-K,Ca, potassium ions located in the super-cages are almost exclusively involved in the migration under the applied sinusoidal field (5kHz, 20V
pp). Indeed, the contribution of Ca
2+ cations is negligible because they have an electrical charge larger than K
+ and are present in the clinoptilolite sample at a lower concentration. Iron does not participate to the electrical transport mechanism because it is mostly located in the framework (isomorphous substitution), just like in the case of aluminum atoms, while its ionic form (Fe
3+) has a very large electrical charge and stably adhere to the crystal framework. Finally, it is possible to approximately write:
where [K
+]* is the molar concentration of the excited K
+ cations present in the system at T temperature. Each K
+ ions is located in a potential well (the ‘nucleophilic area’), whose walls are represented by the four negatively charged oxygen atoms located close to the aluminum atom [
10]. The concentration of excited K
+ present at zeolite cage/channel center is a temperature-dependent quantity; indeed, [K
+]* increases with raising up of the temperature, thus determining an increase in the zeolite electrical conductivity.
Clinoptilolite is a unique ionic conductor, whose physical, chemical, mechanical and electrical properties have been deeply investigated. Since different useful characteristics are combined together in clinoptilolite and other zeolites, these multifunctional inorganic materials have great potentialities for industrial applications. For example, mechanically robust and thermally stable impedimetric sensors based on zeolite have been described in the literature [
37,
38,
39,
40,
41,
42]. However, such ionic conductors could have further technological potentialities also in other important areas of electronics (e.g., radiofrequency filters, dielectrics for electrolytic capacitors, electrolytic pastes, etc.). Although clinoptilolite has many useful electrical properties, literature articles describing the fabrication/characterization of electrical devices based on clinoptilolite are still very limited. The aim of this manuscript is to introduce the possibility to develop a new concept of thermistor and other NTC devices for AC applications by exploiting the strict temperature-dependence of clinoptilolite ionic conductivity. For example, NTC materials are widely used in control-electronics industry for the protection of electronic circuits.
The reason natural clinoptilolite has been selected among the different zeolites is mainly related to: (i) the very good mechanical properties, (ii) the high thermal resistance of the porous crystalline structure and (iii) the significant electrical conductivity changes with rising of temperature. Such unique property combination makes zeolite as an interesting technological solution; indeed, other ionic conductors are not highly thermally stable or do not have the linear dependence of electrical conductivity on temperature as observed for clinoptilolite. In addition, natural clinoptilolite is a widely available mineral with a good zeolitic content and a very low cost. Depending on the extraction mine, this mineral can have slightly different chemical compositions (i.e., Si/Al atomic ratio and type/percentage of extra-framework cations); however, it always can be used for electrical applications even on a large-scale (e.g., grounding enhancement materials [
43] and gas discharge electronic devices [
44,
45]). The NTC behaviour of clinoptilolite can be advantageously exploited for developing new types of thermistors that are adequate for application in AC circuits. Indeed, zeolites are ionic conductors with single-charge carrier and therefore they require AC conditions for electrical transport. Such type of devices is different from those already available based on ceramic semiconductor, whose use is limited to DC circuits.
Here, the thermistors have been fabricated by using the unmodified geomorphic material, just shaped in form of squared plates. However, such zeolite-based devices can undergo a number of technical improvements like as the fabrication of high thermally-stable electrodes; device encapsulation or surface treatment to prevent moisture adsorption in the microporous structure; electrical conductivity control (increase/decrease) by changing the type of charge carriers; development of devices based on zeolite coatings on plastic/ceramic substrates, etc. Such points will be investigated in our future research work.
5. Conclusions
Clinoptilolite is an electrically conductive material (single charge-carrier ionic conductor), that has shown a strict dependence of its impedance value on temperature. In particular, the clinoptilolite surface impedance changes readily, substantially, linearly and reversibly with heating in the temperature range of 25-120°C and above. Such electrical performance allows suggesting the use of NTC devices based on this zeolite type for AC electronic circuits applications as an alternative to traditional semiconductor-based devices. According to morphological investigations made by SEM, the sample consists of 40nm thick single lamellar crystals closely compacted together. Such a microstructure allows to achieve good mechanical performance and extended percolative paths in the sample, that are essential for a uniform electrical conductivity. Since the electrical transport phenomenon takes place in the clinoptilolite channels, the specific surface area and the porosity have been determined by BET analysis. In particular, it has been found that the raw material is characterized by a surface area of 25±0.1 m²/g and pores with an average size ranging from 1.4 to 20 nm. The sample crystalline composition has been determined by XRD, founding the clinoptilolite phase as the main mineral component (65% by weight); in addition, its thermal stability up to 150°C has been verified too. The chemical analysis of sample surface has been performed by XPS. In particular, XPS provided an atomic Si/Al ratio of 4.6 and K+ and Ca2+ as extra-framework cations present on the sample surface. Therefore, the monovalent K+ cation is the charge-carrier responsible for the system AC electrical transport. The XPS surface analysis has also provided information on the nature of the contained iron, which is present both in the mineral framework and extra-framework regions.
Author Contributions
Conceptualization, G.C.; methodology, G.C.; validation, G.C., L.S., L.A., R.V., R.C., G.G.; formal analysis, G.C., L.S., L.A., R.V., R.C., G.G.; investigation, G.C., L.S., L.A., R.V., R.C., G.G.; resources, G.C. and L.S.; data curation, G.C., L.S., L.A., R.V., R.C., G.G..; writing—original draft preparation, G.C., L.S., L.A., R.V., R.C., G.G.; writing—review and editing, G.C., L.S., L.A., R.V., R.C., G.G. All authors have read and agreed to the published version of the manuscript.”.
Funding
This research received no external founding.
Institutional Review Board Statement
Not applicable.
Informed Consent Statement
Not applicable.
Data Availability Statement
The data presented in this study are available on request from the corresponding author.
Acknowledgments
The authors are grateful to Maria Cristina Del Barone of LAMEST laboratory (IPCB-CNR) for SEM analysis, to Maria Rosaria Marcedula and to Docimo Fabio of IPCB-CNR for technical support in the square monolith realization and useful discussion.
Conflicts of Interest
The authors declare no conflict of interest.
References
- P. Misaelides. Application of natural zeolites in environmental remediation: A short review. Microporous Mesoporous Mater. 2011, 144, 15–18. [CrossRef]
- Jha, B.; Singh, D. N. Basics of Zeolites. In: Fly Ash Zeolite: Innovations, Applications, and Directions. Part of the book series: Advanced Structured Materials; Springer Verlag, Singapore, 2016, 78, 5–13. [Google Scholar] [CrossRef]
- Auerbach, S. M.; Carrado, K. A.; Dutta, P. K. Handbook of Zeolite Science and Technology. 1st Ed.; Boca Raton; CRC Press; 2003; p. 1204. [CrossRef]
- Koohsaryan, E.; Anbia, M. Nanosized and Hierarchical Zeolites: A Short Review. Chinese J. Catal. 2016, 4, 447–467. [Google Scholar] [CrossRef]
- Wang, C.; Leng, S.; Guo, H.; Yu, J.; Li, W.; Cao, L.; Huang, J. Quantitative Arrangement of Si/Al Ratio of Natural Zeolite Using Acid Treatment. Appl. Surf. Sci. 2019, 498, 143874. [Google Scholar] [CrossRef]
- Aiello, R.; Nagy, J. B.; Giordano, G.; Katovic, A.; Testa, F. Isomorphous Substitution in Zeolites. C. R. Chim. 2005, 8, 321–329. [Google Scholar] [CrossRef]
- Uzunova, E. L.; Mikosch, H. Cation Site Preference in Zeolite Clinoptilolite: A Density Functional Study. Microporous Mesoporous Mater. 2013, 177, 113–119. [Google Scholar] [CrossRef]
- Ohgushi, T.; Ishimaru, K.; Adachi, Y. Movements and Hydration of Potassium Ion in K-a Zeolite. J. Phys. Chem. C. 2009, 113, 6, 2468–2474. [Google Scholar] [CrossRef]
- Schäf, O.; Ghobarkar, H.; Adolf, F.; Knauth, P. Influence of Ions and Molecules on Single Crystal Zeolite Conductivity under in Situ Conditions. Solid State Ion. 2001, 143, 433–444. [Google Scholar] [CrossRef]
- Kelemen, G.; Schön, G. Ionic Conductivity in Dehydrated Zeolites. J Mater. Sci. 1992, 27, 6036–6040. [Google Scholar] [CrossRef]
- Vuc̆elić, D. , Juranič, N.; Macura, S.; Šušič, M. (1975). Electrical conductivity of dehydrated zeolites. J. Inorg, Nucl. Chem. 1975, 37, 1277–1281. [Google Scholar] [CrossRef]
- Vuc̆elić, D. Ionic Conduction Bands at Zeolite Interfaces. J. Chem. Phys. 1977, 66, 43–47. [Google Scholar] [CrossRef]
- Vučelić, D.; Juranić, N. The effect of sorption on the ionic conductivity of zeolites. J. Radioanal. Nucl. Chem. 1976, 38, 2091–2095. [Google Scholar] [CrossRef]
- Jack, K. E. , Etu, I. A., Nwangwu, E. O., & Osuagwu, E. U. A simple thermistor design for industrial temperature measurement. IOSR J. Electr. Electron. Eng. 2016, 11, 57–66. [Google Scholar] [CrossRef]
- Becker, J. A.; Green, C. B.; Pearson, G. L. Properties and Uses of Thermistors—Thermally Sensitive Resistors. Bell Syst. Tech. J. 1947, 26. no.1, 170-212. [Google Scholar] [CrossRef]
- Kamat, R. K.; Naik, G. M. Thermistors - In Search of New Applications, Manufacturers Cultivate Advanced NTC Techniques. Sens. Rev. 2002, 22(4). 334 – 340. [Google Scholar] [CrossRef]
- Wang, T.; Chu, Y.; Li, X.; Liu, Y.; Luo, H.; Zhou, D.; Deng, F.; Song, X.; Lu, G.; Yu, J. (2023). Zeolites as a Class of Semiconductors for High-Performance Electrically Transduced Sensing. J. Am. Chem. Soc. 2023, 145, 9. 5342–5352. [Google Scholar] [CrossRef]
- Mohammadzadeh Kakhki, R.; Zirjanizadeh, S.; Mohammadpoor, M. A review of clinoptilolite, its photocatalytic, chemical activity, structure and properties: in time of artificial intelligence. J. Mater. Sci. 2023, 58, 10555–10575. [Google Scholar] [CrossRef]
- Simon, U.; Franke, M.E. Ionic Conductivity of Zeolites: From Fundamentals to Applications, Host-Guest-Systems Based on Nanonporous Crystals; Laeri, F., Schüth, F., Simon, U., Wark, M., Eds.; Wiley-VCH Verlag GmbH & Co. KGaA: Weinheim, Germany, 2003; pp. 364–378, https://onlinelibrary.wiley.com/doi/pdf/10.1002/3527602674#page=384. [Google Scholar]
- Qiu, P.; Huang, Y.; Secco, R.A.; Balog, P.S. Effect of multi-stage dehydration on electrical conductivity of zeolite A. Solid State Ion. 1999, 118, 281–285. [Google Scholar] [CrossRef]
- Freeman, D.C.; Stamires, D.N. Electrical conductivity of synthetic zeolites. J. Chem. Phys. 1961, 35, 799–806. [Google Scholar] [CrossRef]
- Ghobarkar, H.; Schäf, O.; Guth, U. Zeolites—From kitchen to space. Prog. Solid St. Chem. 1999, 27, 29–73. [Google Scholar] [CrossRef]
- Hernández, M. Á.; Hernández, G. I.; Portillo, R. I.; Velasco, M. de los Á.; Santamaría-Juárez, J. D.; Rubio, E.; Petranovskii, V. Influence of Chemical Pretreatment on the Adsorption of N2 and O2 in Ca-Clinoptilolite. Sep. 2023, 10 (2), 130. [Google Scholar] [CrossRef]
- Mastinu, A.; Kumar, A.; Maccarinelli, G.; Bonini, S. A.; Premoli, M.; Aria, F.; Gianoncelli, A.; Memo, M. Zeolite Clinoptilolite: Therapeutic Virtues of an Ancient Mineral. Mol. 2019, 24, 1517. [Google Scholar] [CrossRef]
- Kowalczyk, P.; Sprynskyy, M.; Terzyk, A. P.; Lebedynets, M.; Namieśnik, J.; Buszewski, B. Porous Structure of Natural and Modified Clinoptilolites. J Colloid Interface Sci. 2006, 297 (1), 77–85. [Google Scholar] [CrossRef]
- Lin, H. , Liu, Q., Dong, Y., Chen, Y., Huo, H., & Liu, S. Study on Channel Features and Mechanism of Clinoptilolite Modified by LaCl3. J. Mater. Sci. Research. 2013, 2 (4), 37. https://pdfs.semanticscholar.org/e6d9/b21c22f70922b3b4ef7eda46c9897c858009.pdf. [Google Scholar]
- Schiavo, L. , Cammarano A., Carotenuto G., Longo A., Palomba M., Nicolais L., An overview of the advanced nanomaterials science. Inorganica Chim. Acta. 2024, 559, 121802. [Google Scholar] [CrossRef]
- Jiao, D. , Liu Z.Q., Qu R.T., Zhang Z.F. Anisotropic mechanical behaviors and their structural dependences of crossed-lamellar structure in a bivalve shell. Mater. Sci. Eng. 2016, 59, 828–837. [Google Scholar] [CrossRef]
- Grüenert, W.; Muhler, M.; Schröder, K. P.; Sauer, J.; Schlögl, R. Investigations of Zeolites by Photoelectron and Ion Scattering Spectroscopy. 2. A New Interpretation of XPS Binding Energy Shifts in Zeolites. J. Phys. Chem. 1994, 98 (42), 10920–10929. [Google Scholar] [CrossRef]
- Schiavo, L. , Boccia V., Aversa L., Verucchi R., Carotenuto G., Valente T. Natural Clinoptilolite Nanoplatelets Production by a Friction-Based Technology. Mater. Proc. 2023, Proceedings of IOCN 2023, MDPI, Conference Online, 5–19 May 2023. [CrossRef]
- Avval, T. G.; Carver, V.; Chapman, S. C.; Bahr, S.; Dietrich, P.; Meyer, M.; Thißen, A.; Linford, M. R. Clinoptilolite, a type of zeolite, by near ambient pressure-XPS. Surf. Sci. Spectra 2020, 27 (1), 014007. [Google Scholar] [CrossRef]
- Garcia-Basabe, Y. , Rodriguez-Iznaga, I., de Menorval, L. C., Llewellyn, P., Maurin, G., Lewis, D. W., Binions R., Autie M.,Ruiz-Salvador, A. R. Step-wise dealumination of natural clinoptilolite: Structural and physicochemical characterization. Microporous Mesoporous Mater. 2010, 135 (1-3), 187–196. [Google Scholar] [CrossRef]
- Favvas, E.P. , Tsanaktsidis C.G., Sapalidis A.A., Tzilantonis G.T., Papageorgiou S.K., Mitropoulos AC, Clinoptilolite, a natural zeolite material: Structural characterization and performance evaluation on its dehydration properties of hydrocarbon-based fuels. Microporous Mesoporous Mater. 2016, 225, 385–391. [Google Scholar] [CrossRef]
- Korkuna, O. , Leboda R., Skubiszewska-Ziȩba J., Vrublevs’ka T., Gun’ko V.M., Ryczkowski J. Structural and physicochemical properties of natural zeolites: Clinoptilolite and mordenite. Microporous Mesoporous Mater. 2006, 87 (3), 243–254. [Google Scholar] [CrossRef]
- Wahono, S.K.; Prasetyo, D.J.; Jatmiko, T.H.; Suwanto, A.; Pratiwi, D. ; Hernawan; Vasilev, K. Transformation of Mordenite-Clinoptilolite Natural Zeolite at Different Calcination Temperatures. In Proceedings of the IOP Conference Series: Earth and Environmental Science, Tangerang, Indonesia, 1–2
November 2018; Volume 251, p. 012009. [CrossRef]
- Knowlton, G.D.; White, T.R.; McKague, H.L. Thermal study of types of water associated with clinoptilolite. Clays Clay Miner. 1981, 29, 403–411. [Google Scholar] [CrossRef]
- Carotenuto, G. Sensing Device for Breath Rate Monitoring Fabricated by using Geomorphic Natural Clinoptilolite. J. Adv. Biotechnol. Bioeng. 2020, 8, 3–10. [Google Scholar] [CrossRef]
- Carotenuto, G.; Camerlingo, C. Zeolite-Based Fast-Responding Sensors for Respiratory Rate Monitoring, In Proceedings 2019, 42, 9. [CrossRef]
- Schäf, O.; Wernert, V.; Ghobarkar, H.; Knauth, P. Microporous Stilbite single crystals for alcohol sensing. J. Electroceramics 2006, 16, 93–98, https://link.springer.com/article/10.1007/s10832-006-1461-1. [Google Scholar] [CrossRef]
- Urbiztondo, M.; Irusta, S.; Mallada, R.; Pina, M. P.; Santamaría, J. (2006). Evaluation of optical and dielectrical properties of the zeolites. Desalin. 2006, 200 (1-3), 601–603. [Google Scholar] [CrossRef]
- Kurzweil, P.; Maunz, W.; Plog, C. Impedance of zeolite-based gas sensors. Sens. Actuators B: Chem. 1995, 25 (1-3),, 653–656. [Google Scholar] [CrossRef]
- Reiß, S.; Hagen, G.; Moos, R. Zeolite-based impedimetric gas sensor device in low-cost technology for hydrocarbon gas detection. Sens. 2008, 8 (12), 7904–7916. [Google Scholar] [CrossRef] [PubMed]
- Sitorus, H.B.H.; Permata, D.; Wicaksono, A. A study on the use of powder zeolite as backfill material for single rod grounding system. IOP Conf. Ser.: Mater. Sci. Eng. 2021, 1125, 012075. [Google Scholar] [CrossRef]
- Orbukh, V.I.; Lebedeva, N.N.; Ozturk, S.; Ugur, S.; Salamov, B.G. Gas discharge electronic device based on the porous zeolite. Optoelectronics Adv. Mat. 2012, 6(11-12), 947–952. [Google Scholar]
- Koseoglu, K.; Ozer, M.; Salamov, B.G. Electrical properties of microdischarge in porous zeolites. Plasma Process. Polym. 2014, 11, 1018–1027. [Google Scholar] [CrossRef]
|
Disclaimer/Publisher’s Note: The statements, opinions and data contained in all publications are solely those of the individual author(s) and contributor(s) and not of MDPI and/or the editor(s). MDPI and/or the editor(s) disclaim responsibility for any injury to people or property resulting from any ideas, methods, instructions or products referred to in the content. |
© 2024 by the authors. Licensee MDPI, Basel, Switzerland. This article is an open access article distributed under the terms and conditions of the Creative Commons Attribution (CC BY) license (http://creativecommons.org/licenses/by/4.0/).
